Embed Size (px)
Citation preview

No 2012 – 16 July
DO
CU
ME
NT
DE
TR
AV
AI
L
Assessing the price-raising effect of non-tariff measures in Africa
Olivier Cadot
Julien Gourdon

CEPII, WP No 2012-16 Assessing the price-raising effect of non-tariff measures in Africa
2
TABLE OF CONTENTS
Non-technical summary ........................................................................................................... 3
Abstract .................................................................................................................................... 4
Résumé non technique ............................................................................................................. 5
Résumé court ............................................................................................................................ 6
1. Introduction ..................................................................................................................... 7
2. Data and stylized facts .................................................................................................. 11
2.1. Conceptual issues .......................................................................................................... 11
2.2. Quantifying NTMs: The MAST nomenclature ............................................................ 12
2.3. NTMs in Africa ............................................................................................................. 14
2.4. Prices: The ICP data ..................................................................................................... 17
3. Estimation and results ................................................................................................... 19
3.1. Estimation issues ........................................................................................................... 19
3.2. Results ........................................................................................................................... 22
3.3. Impact on household expenditures: An illustrative calculation for Kenya ................... 28
3.3.1. Consumption patterns and NTM incidence .................................................................. 29
3.3.2. Consumption-weighted AVEs ...................................................................................... 31
4. Concluding remarks ...................................................................................................... 31
References .............................................................................................................................. 33
Appendix ................................................................................................................................ 36
List of working papers released by CEPII ............................................................................. 39

CEPII, WP No 2012-16 Assessing the price-raising effect of non-tariff measures in Africa
3
ASSESSING THE PRICE-RAISING EFFECT OF NON-TARIFF MEASURES IN AFRICA
Olivier Cadot
Julien Gourdon
NON-TECHNICAL SUMMARY
In spite of widespread tariff reductions, intra-African borders remain ―thick‖, with many
hurdles standing in the way of regional trade (see e.g. the essays collected in Brenton and Isik,
2012). Inadequate transportation infrastructure is not the only obstacle. Ample anecdotal
evidence summarized in, inter alia, Gillson (2011) and Charalamides and Gillson (2011)
suggests that non-tariff measures (henceforth NTMs), whether deliberately protectionist or
not, raise trade costs and inhibit regional trade in Africa. However, beyond the anecdotal
evidence, little is known about the magnitude of the price-raising effects involved. Beyond
old-style quantitative restrictions (QRs) and bans, even measures that could be potentially
justified by market failures like sanitary and phytosanitary (SPS) measures or product
standards are often ill-suited to both consumer protection needs and Government monitoring
capabilities, generating unnecessary hurdles. The picture in the specific case of African
markets suggested by the literature so far is somewhat ambiguous. Anecdotal evidence on the
ground suggests that many regulatory measures unnecessarily raise trade costs in SSA.
Border-effect estimates, however, suggest that staple food markets are, by and large, fairly
well integrated at least in East Africa where data exists.
In this paper, we follow the price-based strand of the literature and estimate the price-raising
effect of NTMs by combining the World Bank’s International Comparison Project (ICP) price
database with the new TRAINS NTM database. Combining the two datasets, we construct a
(country × product) panel of 1’260 observations and run within-product regressions with
country effects. Consistent with earlier estimates and with the anecdotal evidence, we find
that, on average, SPS measures raise the domestic prices of foodstuffs by about 13% in sub-
Saharan Africa. SSA is no outlier in this, with similar price-raising effects observed in other
regions, but interaction terms with income suggest that the effect is heavier in low-income
countries, possibly reflecting poor or restrictive administration of the regulations. We then use
Kenya’s household survey to show that, looking only at the effect of NTMs on prices (i.e.
ignoring their non-trade objectives) they act like a regressive tax, a reflection of the

CEPII, WP No 2012-16 Assessing the price-raising effect of non-tariff measures in Africa
4
prominence of SPS measures in the estimated price effects and the large share of food in poor
households’ budgets.
ABSTRACT
In spite of widespread tariff reductions, intra-African borders remain ―thick‖. Regional trade
is inhibited by inadequate transportation infrastructure, but also by various government-
imposed measures. This paper combines price data from the World Bank’s International
Comparison Project (ICP) with the new TRAINS database on non-tariff measures (NTMs) to
estimate their effect on consumer prices for selected consumption products. Results based on
panel regressions on 1260 country-product pairs suggest that, after controlling for tariffs,
systematic cross-country cost-of-living differences, and product-specific unobservables, SPS
measures contribute to raise the price of African foodstuffs by 14%. At the product level, rice
and other cereals, some types of meat (e.g. poultry), and edible oils tend to fetch high AVEs.
Combining our estimates with data on household expenditure patterns from Kenya’s
household survey, we show that the effect is regressive, raising the cost of living by 9% for
poor households.
JEL Classification: F10, F11, F13, O55
Key Words: Ad-valorem equivalent/ Price-raising impact of non tariff measures, Africa

CEPII, WP No 2012-16 Assessing the price-raising effect of non-tariff measures in Africa
5
ÉVALUER L’AUGMENTATION DES PRIX LIEE AUX MESURES NON-TARIFAIRES EN AFRIQUE
Olivier Cadot
Julien Gourdon
RESUME NON TECHNIQUE
En Afrique, en dépit de réductions tarifaires conséquentes, les barrières au commerce régional
restent importantes comme l’ont notamment montré les études de cas rassemblées dans le
rapport de Brenton et Isik (2012). Le faible niveau des infrastructures de transport n’est pas
l’unique obstacle. De nombreux exemples résumés dans Gillson (2011) et Charamildes et
Gillson (2011) indiquent que les mesures non tarifaires (les MNT), qu’elles soient
délibérément protectionnistes ou non, augmentent les coûts et contraignent le commerce
régional africain. A côté des mesures usuelles de restriction quantitative et de prohibition,
d’autres MNT sont apparues, justifiées par des imperfections de marchés, telles que les
mesures sanitaires et phytosanitaires (SPS) ou les normes sur les produits. Mais ces mesures,
souvent inadaptées aux besoins de protection des consommateurs comme aux capacités de
mise en place par les administrations, génèrent des coûts inutiles.
Au-delà des observations de terrain, on manque de mesures de l’impact des MNT sur les
coûts et les conclusions de la littérature portant sur les marchés africains reste ambigüe. Les
observations de terrain suggèrent que de nombreuses réglementations non essentielles
augmentent les coûts de commerce. Cependant les estimations d’effets frontières indiquent
que les marchés des biens alimentaires seraient généralement bien intégrés, du moins en
Afrique de l’Est où les données ont permis de le vérifier.
Dans cette étude, nous estimons l’augmentation de prix induite par la présence de MNT en
combinant les données prix du International Comparison Project (ICP) de la Banque
Mondiale avec la nouvelle base TRAINS sur les mesures non-tarifaires. Nous construisons un
panel (pays x produit) de 1 260 observations pour des estimations intra-produits avec des
effets pays.
Confirmant les estimations précédentes et les observations sur le terrain, nous trouvons que
les mesures SPS augmentent les prix domestiques des biens alimentaires ; ce surcoût est
d’environ 13% en moyenne en Afrique subsaharienne. Cet impact sur les prix n’est pas
particulier à cette région, mais l’interaction de la présence des mesures SPS avec le niveau de

CEPII, WP No 2012-16 Assessing the price-raising effect of non-tariff measures in Africa
6
revenu suggère que l’effet est plus important dans les pays à faible revenu. Ceci pourrait
provenir de leur faible capacité de gestion de ces réglementations.
L’enquête ménage réalisée au Kenya nous permet de constater que l’impact des SPS sur les
prix agit de manière régressive : il touche particulièrement les ménages à plus faibles revenus
qui consomment davantage de biens couverts par différentes SPS. Ainsi ces ménages
subissent un surcoût de 9% sur leur panier de biens de consommation.
RESUME COURT
En dépit de réductions tarifaires conséquentes, les barrières aux échanges intra-africains
restent importantes. Le commerce régional est contraint par l’insuffisance des infrastructures
de transport mais également par diverses mesures de protection non-tarifaire. Cette étude
combine les données prix du International Comparison Project (ICP) de la Banque Mondiale
avec la nouvelle base TRAINS sur les mesures non-tarifaires pour estimer leur effet (mesuré
en équivalent ad valorem : EAV) sur les prix à la consommation d’un certain nombre de
produits. Les résultats, sur la base d’une estimation en panel sur 1260 observations produit-
pays, suggèrent, après avoir contrôlé pour les tarifs, des différences de coût de la vie entre
pays et des effets produits inobservables, que les mesures SPS contribuent à augmenter le prix
des biens alimentaires en Afrique de 13%. Au niveau produit, le riz et autres céréales,
certaines viandes (volaille) et les huiles de cuisine présentent de très fortes EAV. En
combinant nos estimations avec des données sur les dépenses des ménages au Kenya, nous
montrons que l’effet est régressif, augmentant de 9% le coût de la vie des ménages les plus
pauvres.
Classification JEL : F10, F11, F13, O55
Mots-clefs : Equivalent ad-valorem/ Impact sur les prix des mesures non-tarifaires, Afrique

CEPII, WP No 2012-16 Assessing the price-raising effect of non-tariff measures in Africa
7
ASSESSING THE PRICE-RAISING EFFECT OF NON-TARIFF MEASURES IN AFRICA1
Olivier Cadot*
Julien Gourdon†
1. INTRODUCTION
In spite of widespread tariff reductions, intra-African borders remain ―thick‖, with many
hurdles standing in the way of regional trade (see e.g. the essays collected in Brenton and Isik,
2012). Inadequate transportation infrastructure is not the only obstacle. Ample anecdotal
evidence summarized in, inter alia, Gillson (2011) and Charalamides and Gillson (2011)
suggests that non-tariff measures (henceforth NTMs), whether deliberately protectionist or
not, raise trade costs and inhibit regional trade in Africa. However, beyond the anecdotal
evidence, little is known about the magnitude of the price-raising effects involved.
Beyond old-style quantitative restrictions (QRs) and bans, even measures that could be
potentially justified by market failures like sanitary and phytosanitary (SPS) measures or
product standards are often ill-suited to both consumer protection needs and Government
monitoring capabilities, generating unnecessary hurdles. For instance, in Kenya each
shipment of imported fertilizer must carry a quality certificate from the exporting country’s
bureau of standards and is further subjected to pre-shipment inspection (Keyser 2012). In
Zambia, traders must submit fertilizer samples to the Bureau of Standards ninety days prior to
shipment arrival even though quality certificates are never actually issued. Yet, in most
countries in sub-Saharan Africa, in spite of the controls counterfeit fertilizers circulate widely,
in large part because the adulteration takes place on the domestic market whereas controls are
at the border (Gitonga 2004). In some cases, testing requirements are not even remotely
related to any plausible concern. For instance, in Tanzania all imports and exports of food
products must undergo mandatory testing for radiation contamination by the Tanzania Atomic
Energy Commission, which has the capacity to test only 10 to 15 samples a day (Keyser
2012). The result of this proliferation of unnecessary non-tariff measures is, potentially,
higher prices hurting low-income households.
Beyond the anecdotal evidence, what do we know about the effect of non-tariff measures
(NTMs)? The literature, going back to the work of Baldwin (1975), Feenstra (1984),
Deardorff and Stern (1985), Deardorff (1987), Baldwin (1989), Leamer (1990), or Anderson
and Neary (1994), to name a few, can be classified into two broad families: quantity-based
approaches and price-based ones.
1
Without implicating them, the authors express their gratitude to Paul Brenton, Ian Gillson, Mariem Malouche and
especially Lionel Fontagné for useful comments and suggestions. *
University of Lausanne, CEPR and CEPREMAP and FERDI
†CEPII, [email protected]

CEPII, WP No 2012-16 Assessing the price-raising effect of non-tariff measures in Africa
8
Prominent in the former category is Kee et al. (2009) who ran import equations at the product
level (but aggregated over all origins) on factor endowments, tariffs, and NTMs. Algebraic
manipulation of the estimates yielded ad-valorem equivalents (AVEs) for the NTMs included
as explanatory variables. Because of the limited number of degrees of freedom, only a few
explanatory variables could be included on the right-hand side, so NTMs were aggregated
into a broad ―core NTMs‖ category.
Price-based approaches consist of estimating AVEs by comparing directly NTM-ridden
product prices with the prices of similar products on markets where those products are free of
distortions, and can be applied by simple comparison of averages on a case-by-case basis
after correction for transport costs and other observables (see Ferrantino 2006 for examples),
or econometrically, as in Andriamanjara et al. (2004).
There are several well-known issues with the price-gap approach, discussed in Ferrantino
(2006). For instance, many factors including imperfect substitutability or market structure
affect prices beyond NTMs, and not all of them can be controlled properly in a regression
analysis. In terms of data availability, the key issue for the price-gap approach is the
availability and comparability of price data.
Whether estimated through quantity-based or price-based approaches, AVE estimates in the
literature vary, with peaks typically higher than tariff peaks. Kee et al. (2009) find averages
of 9.2% (simple) and 7.8% (trade-weighted) across 4,545 product-specific regressions. If
products with no NTMs are eliminated, AVEs climb to 39.8% and 22.7% respectively. These
estimates are somewhat lower than those of Bradford (2003) who finds average AVEs
ranging between 7.8% (Canada), 28% (UK) and 52% (Japan). These higher orders of
magnitude are comparable to those obtained using price-based methodologies by
Andriamananjara et al., although individual estimates vary substantially (for instance,
Andriamananjara et al. find a 73% average AVE for apparel). Kee et al. also observe that,
unlike tariffs, NTM AVEs tend to rise with income levels, reflecting stiff agricultural NTMs
in rich countries.
In the specific case of African markets, the effect of NTMs has recently been estimated by
applying so-called ―border-effect‖ approaches inferring the extent of market fragmentation
induced by the existence of national borders from untapped price-arbitrage opportunities. For
instance, Ihle, Cramon-Traubadel and Zorya (2010) put together a panel of close to 2’000
regional maize prices in East Africa over 2000-2008, combining data from the Eastern Africa
Grain Council and from Michigan State University. Using a two-step procedure, they found
East African maize markets to be well integrated except for Tanzania, a ―rather isolated and
internally fragmented island within the customs union of the East Africa Community‖ (p. 24).
Their results are consistent with anecdotal evidence on the prevalence of restrictive and
idiosyncratic trade measures in Tanzania (see supra).
Versailles (2012) assembled out of CPI data from national statistical offices a very large
database of monthly prices for 24 goods and 39 cities in five East Africa Community (EAC)
countries over 2004-2008, resulting in a total of close to one million observations at the (city-

CEPII, WP No 2012-16 Assessing the price-raising effect of non-tariff measures in Africa
9
pair × good × month) level. Let i and j be two cities, k a product and the exchange rate
between the currencies used in cities i and j (one if they are in the same country). Versailles
uses the ―implicit exchange rate‖ , which deviates from one when the law of one price (LOP)
does not apply, as his dependent variable and regresses the absolute value of on distance,
country-pair dummies (which may correspond to borders, like for Kenya-Uganda, or to
multiple border crossings, like for Kenya-Burundi), nominal exchange rates (to test for
incomplete pass-through), and a proxy for non-tariff barriers taken from the World Bank’s
Doing Business index. Results are very telling. A distance of 100 km between two cities
creates a 13% wedge from the LOP. The Burundi-Rwanda border moves prices away from
the LOP by 11%, the Kenya-Uganda, by 17%, the Rwanda-Uganda, by 18%. As for the NTB
variable, it is highly significant—as are most of the regressors, a reflection of the large sample
size—but contributes very little quantitatively to border effects. Interestingly, Versailles uses
the fact that his sample period straddles the transformation of the EAC into a customs union
to test if that had any impact on departures from the LOP. Only for the Kenya-Uganda border
did the customs union reduce departures, i.e. integrate markets. In terms of products, by and
large staple foods recorded the smallest departures, suggesting that these markets are the most
integrated in East Africa.
Thus, the picture suggested by the literature so far is somewhat ambiguous. Anecdotal
evidence on the ground suggests that many regulatory measures unnecessarily raise trade
costs in SSA. Border-effect estimates, however, suggest that staple food markets are, by and
large, fairly well integrated at least in East Africa where data exists.
Beyond this ambiguity, the estimation of the trade-inhibiting effect of NTMs is constrained by
data, which has for a long time been limited largely to three main sources. First, the Geneva-
based ITC and a number of researchers (see e.g. Hoekman and Zarrouk 2009 for the North
Africa-Middle East region) have collected survey data on exporter perceptions of trade
barriers in export countries. Conducted in two waves over July-September 2008 and May
2009 respectively in a set of 11 countries in total, ITC questionnaires were sent to over 7’000
companies in the first wave and 4’400 in the second, with 24% and 39% response rates.
Surveys results suggested that sanitary and phytosanitary (SPS) measures on foodstuffs and
technical regulations on a wide range of products dominated the concerns of exporters (as
opposed to traditional command-and-control measures like QRs and prohibitions). In a recent
firm-level survey carried out in five SADC countries cited by Gillson and Charalambides
(forthcoming), ―roughly 80 percent of the respondents indicated that they faced some form of
trade barrier within the region […]. Over half of the respondents indicated that the cost of
these was equivalent to 5 percent of the CIF value of the imports/exports. A further 24 percent
of respondents indicated a 5-15 percent attribution to trade barriers; and, 23 percent faced
increased trade costs of over 15 percent‖ (p. 4). We will see later on in this paper that the
econometric estimation of ad-valorem equivalents (AVEs) of NTMs yields estimates in that
range.
Second, the WTO records NTM notifications by member states and is currently developing a
portal to access the resulting data. The main limitation of the notifications database is that

CEPII, WP No 2012-16 Assessing the price-raising effect of non-tariff measures in Africa
10
notification is voluntary, resulting in partial and potentially biased coverage, as measures that
risk running afoul of WTO rules or raising objections from trade partners are likely to be
under-reported.
Finally, official government data collected by UNCTAD is available in the TRAINS database
through the World Bank’s WITS portal. As described by Carrère and de Melo (2011), the
TRAINS database suffers from several limitations. First and foremost, for most countries it
was a one-shot exercise. Second, coverage in terms of countries was incomplete, with only
100 countries reporting any data. Third, coverage in terms of measures was centered on
―core‖ measures (QRs, tariffs and price controls), with less complete coverage of new-type
measures like SPS and TBT—precisely those flagged as important in private-sector surveys.
Over the last two years, however, a major effort has been undertaken to replenish the
TRAINS database through a collaboration between the World Bank, UNCTAD and the
African Development Bank (AfDB). The effort, which has led to the collection of data in 30
countries with broader coverage of measures than in TRAINS under a common, consistent
nomenclature, is underway, with some of the data already published on WITS and some still
under verification, at the time of writing, by UNCTAD’s statistical division. The data is based
on double-entry coding of regulatory measures, by type of measure (following a new, detailed
nomenclature) and by product (following the HS code at six digits). Thus, at the finest degree
of disaggregation, for each country there are notionally 121 possible measures, each of which
can be applied to any of 5’959 products. However, there is only one year of data collection (as
the new data is not directly comparable to old TRAINS data), so there is no variation in the
time dimension as required by border-effect approaches. The present paper is the first attempt
to use this data.
As for prices, apart from the new, ―specialized‖ datasets used by Ihle et al. (2010) and
Versailles (2012), several partial databases are available. Anderson et al. (2008) compiled a
comprehensive database of agricultural prices for a large panel of countries and products. For
consumer products, the World Bank’s International Price Comparison Project provides price
data for 63 tradable product categories (in addition to 42 services) in 146 countries, but for
only one year (2005). The Economist Intelligence Unit also collects prices at the city (sub-
national) level as a tool to set expatriate compensation. In both cases, only consumer goods
are included, and comparability slants the basket toward products that are typically middle-
class consumables.
In this paper, we follow the price-based strand of the literature and estimate the price-raising
effect of NTMs by combining the World Bank’s International Comparison Project (ICP) price
database with the new NTM database. Combining the two datasets, we construct a (country ×
product) panel of 1’260 observations and run within-product regressions with country effects.
Consistent with earlier estimates and with the anecdotal evidence, we find that, on average,
SPS measures raise the domestic prices of foodstuffs by about 13% in sub-Saharan Africa.
SSA is no outlier in this, with similar price-raising effects observed in other regions, but
interaction terms with income suggest that the effect is heavier in low-income countries,

CEPII, WP No 2012-16 Assessing the price-raising effect of non-tariff measures in Africa
11
possibly reflecting poor or restrictive administration of the regulations. We then use Kenya’s
household survey to show that, looking only at the effect of NTMs on prices (i.e. ignoring
their non-trade objectives) they act like a regressive tax, a reflection of the prominence of SPS
measures in the estimated price effects and the large share of food in poor households’
budgets.
The paper is organized as follows. Section 2 describes the data and some stylized facts.
Section 3 discusses estimation issues and results. Section 4 concludes.
2. DATA AND STYLIZED FACTS
2.1. Conceptual issues
Non-tariff measures (NTMs henceforth) are regulatory measures other than tariffs that affect
imports or exports. As a prelude to the estimation of how they affect prices, this section
discusses logical issues involved in their definition, as the term NTMs covers a wide set of
regulatory measures whose form and purposes differ.
Conceptually, several points should be kept in mind when defining NTMs. First, contrary to
tariffs, depending on their type, NTMs may apply either to imported goods only, or to both
imported and domestically-produced goods. For instance, whereas a quantitative restriction
(QR) will apply only to imported goods, a technical regulation will typically apply to both
imported and locally-produced goods, since otherwise it would run afoul of GATT Article III
(national treatment). This is in principle. In practice, enforcement tends to be concentrated at
the border in SSA, so even measures that are nondiscriminatory de jure may affect imports
disproportionately.
Second, NTMs apply to products. That is, an environmental regulation that prohibits domestic
producers from dumping toxic effluents in a river as part of the production process is not an
NTM, even though it may affect trade flows indirectly by raising the domestic producers’
production costs and thus their ability to export and compete with imports. The reason for
this exclusion is that including all domestic regulations on production in the list of NTMs
would extend its scope to the point where everything should be there, at which point it would
become unmanageable. Thus, regulations may be trade-relevant but nevertheless not included
in NTM inventories.
A third issue is whether, from a normative point of view, NTMs are good or bad for welfare.
If the domestic market is competitive, a QR is equivalent to a tariff at a rate inducing the same
level of imports. However, it has long been known that, in the presence of market power on
the domestic market, the equivalence breaks down, and a QR induces higher deadweight
losses (Bhagwati 1968). Worse, the higher prices obtained on the domestic market are not
compensated by increased employment, as the domestic monopoly (or oligopoly) holds back
employment and output in order to maintain high prices. Thus, unlike a tariff, a prohibition or

CEPII, WP No 2012-16 Assessing the price-raising effect of non-tariff measures in Africa
12
QR hands back to domestic producers the market power that international trade would
destroy.
Moreover, under a QR the market power extends to the holders of import licenses, who
typically align their prices on the monopoly producer’s. This type of situation is highly
relevant in sub-Saharan Africa where market power is prevalent as small markets can
accommodate only a few producers. In some cases, the import licenses themselves are given
to the local producer, aggravating the monopolization and creating even stronger vested
interests for the maintenance of QRs.
The case of technical regulations and SPS measures is different, as those measures are
designed, at least in principle, to address externalities and other market failures. For instance,
Rwanda bans the importation of plastic bags for environmental reasons. The reduction in
consumer surplus induced by the measure must then be balanced against the reduced
externality. In order to assess the welfare effect of such measures, a full cost-benefit analysis
should be conducted. In practice, much of the difficulty in applying cost-benefit analysis lies
in the evaluation of the monetary equivalent of the externality, which depends on unobserved
societal preferences. Those preferences are likely to vary with a host of factors, including
income levels. At low income levels, externalities might be less of a priority than at high
levels, although very little direct (experimental) evidence is available on this.
In sub-Saharan Africa, casual observation and evidence gathered in Gillson (2011) and
Charalamides and Gillson (2011) suggests that technical regulations are frequently designed
with little regard to the actual concerns of consumers in terms of externalities and even more
importantly to the testing and monitoring capabilities of governments, resulting in
unnecessary paperwork and procedures that serve little purpose.
2.2. Quantifying NTMs: The MAST nomenclature
As mentioned in the introduction, data on NTMs is available through a recent data collection
effort undertaken jointly by the World Bank, UNCTAD and the African Development Bank.
The data consists of tables with HS6 products in rows and NTMs, coded according to the
2009 MAST nomenclature, in columns. It also contains references to the relevant legal texts
as well as indications on the issuing and/or enforcing agency. The data has been collected
either by national governments under the coordination of regional secretariats, as in Latin
America, or by local consultants hired by the World Bank or the African Development Bank
in SSA. In the latter case, it has been endorsed by governments through validation workshops
held at the end of the data collection process. All of the data that was collected by the World
Bank and the AfDB has been forwarded to UNCTAD for posting on WITS, the World Bank’s
portal for trade data, and is freely accessible. Some of it was, at the time of writing, still under
verification by UNCTAD trade specialists.
Given the complexities involved in the definition of NTMs, in order to ensure consistency in
data collection across countries, UNCTAD’s Group of Eminent Persons adopted in July 2009
CEPII, WP No 2012-16 Assessing the price-raising effect of non-tariff measures in Africa
13
an exhaustive list known as the Multi-Agency Support Team (MAST) nomenclature. This
nomenclature was revised in January 2012 by the WTO’s legal department in order to make it
suitable for the notification of measures by member states. The logical structure of the
nomenclature, at its highest degree of aggregation, is shown in Figure 1.
Figure 1: The MAST nomenclature of NTM
Source: MAST 2009.
Note: NTM data are collected only for categories A–I. The shaded categories J–P are used only to collect
information from the private sector through surveys and web portals.
Categories A and B (SPS and TBT measures) are often referred to as ―technical‖ ones.
Categories C to O are non-technical ones and cover a mixture of command-and-control types
of measures (price controls, quantitative restrictions and prohibitions) and a disparate set of
measures. Some, like pre-shipment inspection (category C), are easy to track and affect all
products. Some, like taxes and para-tariff measures (category F) are more difficult to track as
they are sometimes administered in an untransparent way, serving, in some countries like the
Democratic Republic of Congo, to finance low-productivity border-management
administrations.
As for measures G to O (in italics), some of them are important and relatively straightforward
to identify, like anti-competitive measures, forced channels (category H) and distribution
restrictions (J). Some others are very difficult to code at the product level, like TRIMS2
(I) or
2
Trade-Related Investment Measures
A SPS measuresB Technical regulations
C Pre-shipment inspectionD Price-control measuresE Licenses, quotas, prohibitions and QRsF Charges, taxes & para-tariff measuresG Finance measuresH Anti-competitive measuresI TRIMsJ Distribution restrictionsK Restrictions on post-sales servicesL Subsidies (excluding export subsitiesM Government producrement restrictionsN Intellectual propertyO Rules of origin
P Export measures (including export subsidies)
NON-TECHNICAL
MEASURES
TECHNICAL
MEASURES
IMPORT
MEASURES

CEPII, WP No 2012-16 Assessing the price-raising effect of non-tariff measures in Africa
14
intellectual property (N). Subsidies (L) are a particularly difficult case because of the loose
definition given by the MAST:
―Financial contribution by a government or government body to a production structure, being
a particular industry or company, such as direct or potential transfer of funds (e.g. grants,
loans, equity infusions), payments to a funding mechanism and income or price support.
Note: this category is to be further sub-divided after further study on the subject.
Example: Price of imported wheat is much lower than local wheat because of subsidy given in
the exporting country”
Subsidies are often to certain companies and not to other depending on their location,
ownership status (ethnic minorities, special groups and so on), or type (SMEs). It is difficult
to track all subsidies granted under the myriad of schemes typically in place to serve various
societal purposes, and even more difficult to decide when they are sufficiently prevalent to be
ascribed to a particular product.
Rules of origin are in a category of their own, as they apply to certain origins rather than
certain products. Thus, when a country has a preferential arrangement—and practically all
countries do—rules of origin apply to all imported products. Thus, including them in the
MAST nomenclature gives an appearance of exhaustivity but are difficult to operationalize
for quantitative work.
Lastly, export measures (category P) are of growing importance, especially for foodstuffs in
times of rising food prices. Gillson (2011) argues that export restrictions in times of high
prices contribute to reduce incentives to expand production, and thus make shortages worse
both over time (because supply does not react) and across space (as producers in surplus
regions are banned from arbitraging price differences, so price spikes in deficit regions are not
dampened by increased imports). Thus, export restrictions exert negative regional
externalities and increase consumer price volatility.3
2.3. NTMs in Africa
This section provides descriptive statistics on number and types of NTMs related to import
flows, using frequency and coverage ratios. The frequency ratio is the proportion of HS6
3
However, it should be kept in mind that—at least in principle—they reduce producer-price volatility, as local prices
co-variate negatively with volumes in autarky, whereas they don’t under integrated markets with a given international
price.

CEPII, WP No 2012-16 Assessing the price-raising effect of non-tariff measures in Africa
15
products4
covered by at least one type of NTM at the MAST 1-digit (A, B,…) level. The
coverage ratio is the proportion of imports (in dollars) covered by at least one type of NTM.5
By and large, the proportion of imported goods subject to NTMs is large, as shown in Figure
2, where the LHS shows the proportion of product lines covered by NTMs (the frequency
ratio) and the RHS shows the share of imports (the coverage ratio). East African countries
have fairly high coverage ratios, with the exception of Tanzania and Madagascar. The E.U.
has very high frequency and coverage ratios, as public demand for traceability and product
safety is high. One would expect that low-income countries with low monitoring and testing
capabilities would be able to handle fewer measures and therefore put fewer on the books.
This is not the case, suggesting, as argued by Gillson (2011), that there is some overkill even
in ―modern-type‖ measures like SPS and technical regulations. Yet, the data in Figure 2
should be interpreted cautiously, as Tanzania appears as a low-frequency NTM user even
though evidence on the ground suggests that it administers NTMs in a restrictive way and
border-effect estimates suggest that its markets are insulated from regional ones.
Figure 2: Proportion of HS6 product categories and imports covered by one or more
NTM
Source: Authors ‘calculations based on TRAINS database
In addition, some countries, like Kenya and Burundi, are characterized by the simultaneous
application of many measures (up to five) to the same product, as shown in Figure 3. This
4
The non tariff measures can affect different tariff lines in the same HS6 product category 5
These two measures are affected by well-known biases (the frequency ratio ―weighs‖ equally small and large items,
whereas the coverage ratio underestimates the restrictiveness of measures because stricter measures on a product
reduce its imports and hence its implicit weight, pretty much like in a weighted average tariff).
Burundi
Uganda
Kenya
Namibia
Mauritius
South Africa
Madagascar
Senegal
Tanzania
LAC
MENA
Asia
EU
100 80 60 40 20 0 20 40 60 80 100
Share of Product Lines Share of Imports

CEPII, WP No 2012-16 Assessing the price-raising effect of non-tariff measures in Africa
16
may well translate into either overly complicated compliance verification processes for
traders, or non-enforcement due to an imbalance between the mandate given to enforcement
agencies and the resources put at their disposal, a common syndrome in SSA. Again, the data
should be interpreted carefully as evidence on the ground suggests that regulatory
enforcement is nonexistent in Burundi given the administration’s very limited capabilities
(see Cadot 2012).
Figure 3: Frequency ratios by number of NTMs applied simultaneously to the same
product category
Source: Authors ‘calculations based on TRAINS database
Patterns of coverage by type of foodstuff product seem to vary more systematically by
country than by product, as shown in Table 1. Madagascar and Senegal have relatively few
measures on fats & oils, vegetable products and prepared foods compared to other countries.
The case of live animals is special given that a large part of the trade in live animal across
African borders is informal and escapes controls, so that measures applied to this category of
product are largely notional.
Table 1: Frequency ratios by type of product and country, foodstuffs
Source: Authors ‘calculations based on TRAINS database
0.0
10.0
20.0
30.0
40.0
50.0
60.0
70.0
80.0
90.0
100.0
5 and more
4 types of NTMs
3 types of NTMs
2 types of NTMs
1 type of NTMs
Burundi Kenya Madagascar Mauritius Namibia Senegal South Africa Tanzania Uganda
Live Animal 99 78 35 94 91 99 100 33 19
Vegetables 88 73 61 81 95 6 89 24 76
Fats & Oil 82 56 5 75 89 9 80 27 84
Prepared Food 93 79 81 89 94 26 89 15 93

CEPII, WP No 2012-16 Assessing the price-raising effect of non-tariff measures in Africa
17
Table 2: Coverage of foodstuffs by type of measure
Source: Authors ‘calculations based on TRAINS database
One of the few robust observations coming out of the data is that old-style command-and-
control measures (QRs and price controls) have largely receded on the continent, something
that is confirmed on the ground (with the possible exception of Namibia). However, Gillson
and Charalambides (2012) note that up to one third of intra-SADC trade is still affected by
non-tariff barriers notified under the SADC monitoring mechanism, some having to do with
transport and logistics, including roadblocks, weighbridges, toll stations, customs and
immigration procedures, and transiting (see e.g. Karugia et al. 2009). Gillson (2011) also
notes numerous instances of temporary bans, especially on exports, in response to food crises.
Thus, the picture should be nuanced in view of the data’s incompleteness for a category of
measures that is, judging by anecdotal evidence, on the rise.
All in all, the picture that emerges is one where SPS measures and technical regulations have
spread while QRs and prohibitions have receded, but this overall picture masks two important
stylized facts: (i) Many SPS measures seem to be ill-designed given local monitoring and
testing capabilities; (ii) many temporary QRs, on the import and the export side, still disrupt
the functioning of regional food markets.
2.4. Prices: The ICP data
The price data used in this paper is from the World Bank’s International Comparison Project.
Prices are available in local currency units together with 2005 nominal exchange rates for
conversion into U.S. dollars. The International Comparison Program (ICP) is a worldwide
statistical operation involving some 180 countries. It produces internationally comparable
price and volume measures for gross domestic product and its component expenditures. The
measures are based on purchasing power parities (PPPs). The complete list of products is
given in Appendix 1, Table A1. These price data is at a higher degree of aggregation than the
NTM data, so we aggregated NTM dummies (presence) up to ICP product categories
generating hence frequency ratios by ICP products. It can be seen that it covers a wide range
of goods and services, but at a high degree of disaggregation, and one that is not especially
well suited to the analysis of household expenditure in developing countries, as it rather
reflects the typical consumption basket of expatriates, like many other price databases for
Burundi Kenya Madagascar Mauritius Namibia Senegal South Africa Tanzania Uganda
A: SPS 92 75 55 86 63 30 92 16 59
B: TBT 50 61 10 77 32 30 24 56
C: Inspection 34 73 1 3 89 4 25 56
D: Price control 4 18 4 9
E: QRs 2 21 95 3 2

CEPII, WP No 2012-16 Assessing the price-raising effect of non-tariff measures in Africa
18
developing countries.6
Out of all the prices given in Table A1, we kept all items from
1101111 (Rice) to 1103121 (Garments), as well as 1103121 (Garments), 110520 (Household
textiles), 110531 (Major household appliances whether electric or not), 110532 (Small
electric household appliances), 110540 (Glassware, tableware and household utensils),
110551 (Major tools and equipment), and (110552 Small tools and miscellaneous
accessories).
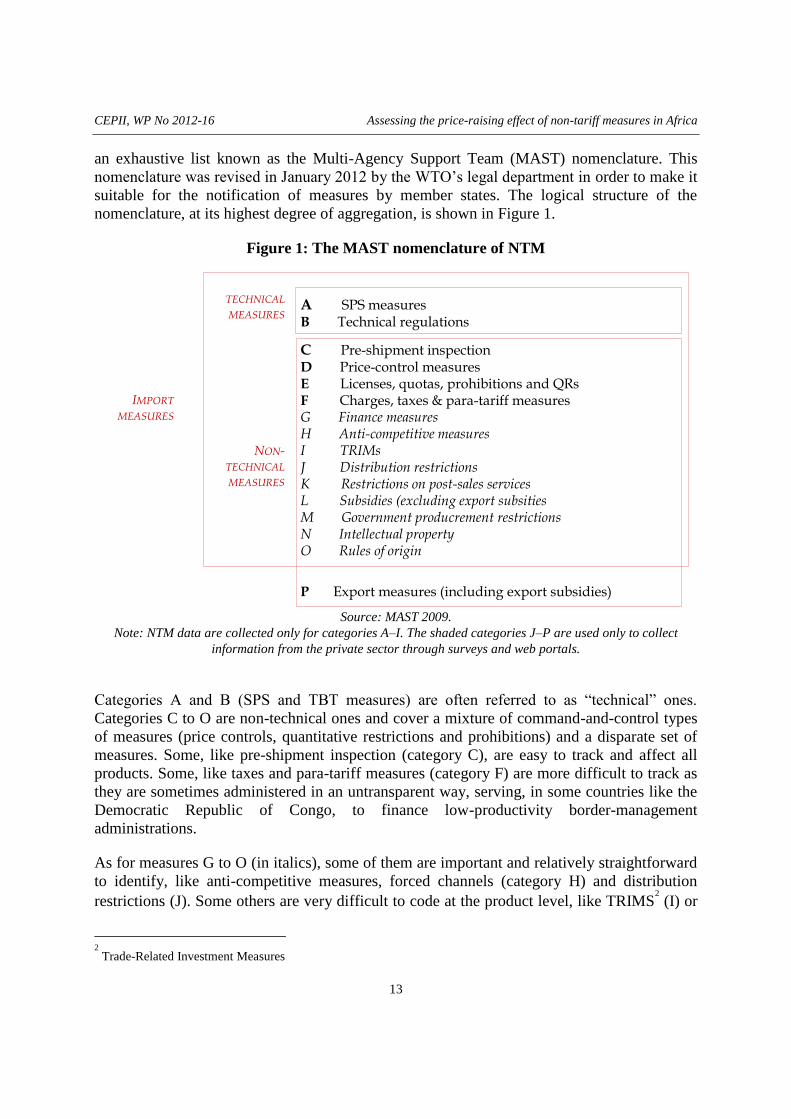
Figure 4: Prices and log of income level
Rice Other cereals
Lamb meat Beer
Source: Authors ‘calculations based on ICP database
6
Similar data is available at a high price from the Economist Intelligence Unit.
0.5
11
.52
2.5
4 6 8 10 12Log income pc, USD
Rice price, USD Fitted values
01
23
4
4 6 8 10 12Log income pc, USD
Other cereal price, USD Fitted values
0.5
11
.52
4 6 8 10 12Log income pc, USD
Lamb meat price, USD Fitted values
0.5
11
.52
2.5
4 6 8 10 12Log income pc, USD
Beer price, USD Fitted values
CEPII, WP No 2012-16 Assessing the price-raising effect of non-tariff measures in Africa
19
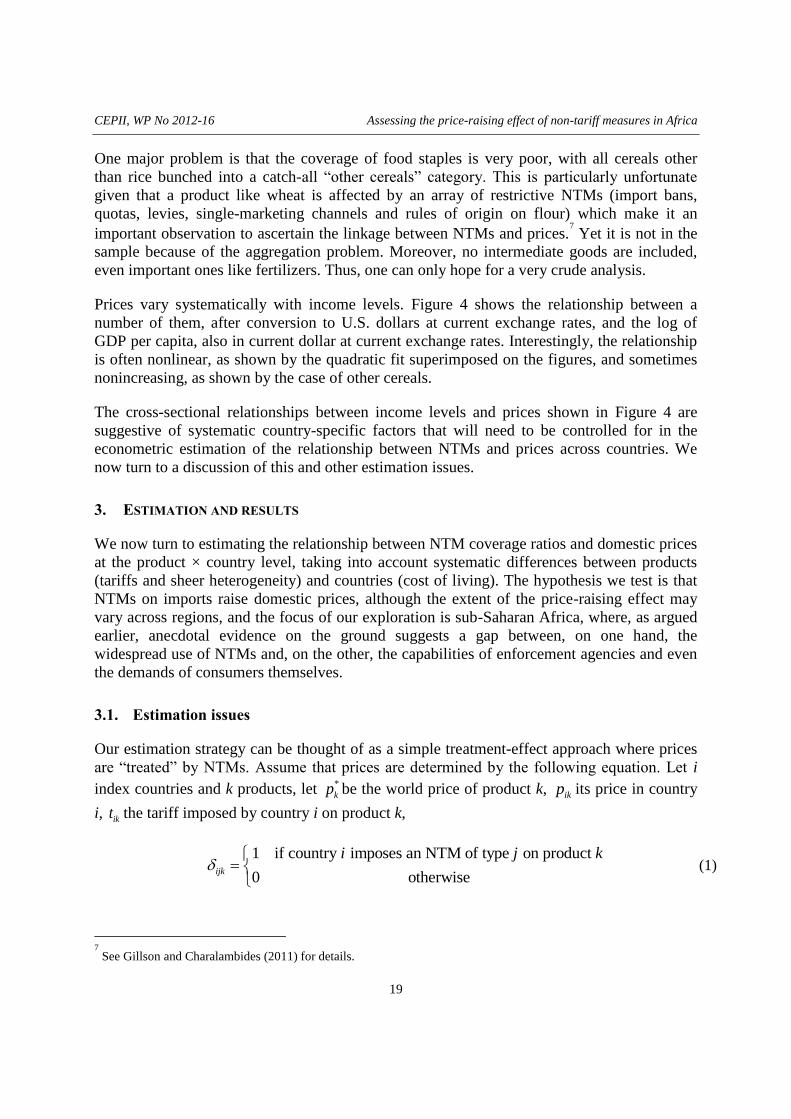
One major problem is that the coverage of food staples is very poor, with all cereals other
than rice bunched into a catch-all ―other cereals‖ category. This is particularly unfortunate
given that a product like wheat is affected by an array of restrictive NTMs (import bans,
quotas, levies, single-marketing channels and rules of origin on flour) which make it an
important observation to ascertain the linkage between NTMs and prices.7
Yet it is not in the
sample because of the aggregation problem. Moreover, no intermediate goods are included,
even important ones like fertilizers. Thus, one can only hope for a very crude analysis.
Prices vary systematically with income levels. Figure 4 shows the relationship between a
number of them, after conversion to U.S. dollars at current exchange rates, and the log of
GDP per capita, also in current dollar at current exchange rates. Interestingly, the relationship
is often nonlinear, as shown by the quadratic fit superimposed on the figures, and sometimes
nonincreasing, as shown by the case of other cereals.
The cross-sectional relationships between income levels and prices shown in Figure 4 are
suggestive of systematic country-specific factors that will need to be controlled for in the
econometric estimation of the relationship between NTMs and prices across countries. We
now turn to a discussion of this and other estimation issues.
3. ESTIMATION AND RESULTS
We now turn to estimating the relationship between NTM coverage ratios and domestic prices
at the product × country level, taking into account systematic differences between products
(tariffs and sheer heterogeneity) and countries (cost of living). The hypothesis we test is that
NTMs on imports raise domestic prices, although the extent of the price-raising effect may
vary across regions, and the focus of our exploration is sub-Saharan Africa, where, as argued
earlier, anecdotal evidence on the ground suggests a gap between, on one hand, the
widespread use of NTMs and, on the other, the capabilities of enforcement agencies and even
the demands of consumers themselves.
3.1. Estimation issues
Our estimation strategy can be thought of as a simple treatment-effect approach where prices
are ―treated‖ by NTMs. Assume that prices are determined by the following equation. Let i
index countries and k products, let *
kp be the world price of product k, ikp its price in country
i, ikt the tariff imposed by country i on product k,
1 if country imposes an NTM of type on product
0 otherwiseijk
i j k
(1)
7
See Gillson and Charalambides (2011) for details.

CEPII, WP No 2012-16 Assessing the price-raising effect of non-tariff measures in Africa
20
and i a cost-of-living adjustment factor for country i depending on its level of income and a host
of other characteristics such as size of the country, landlockedness, remoteness, the quality of the
infrastructure, or the regulatory environment.
Let ja be the cost of complying with NTM type j and let us assume, for now, that it is the same
everywhere and for all products (we will relax this assumption progressively later on). With
full pass-through of tariffs and NTM compliance costs to domestic prices, the basic price-
determination equation is8
* 1 1 1ik k i ik j ijkjp p t a (2)
Putting (2) in logs, we have
*ln ln ln 1 ln 1 ln 1ik k i ik j ijkjp p t a (3)
Let *lnk kp , ln 1i i , and iku be an error term. Note that
ln 1 if = 1
ln 10 if = 0
j ijk
j ijk
ijk
aa
(4)
so ln 1 ln 1j ijk ijk ja a . Using this, our basic estimation equation is
ln ln 1ik k i ik j ijk ikjp t u (5)
where k and i are product and country fixed effects and ln 1j ja . The algebraic
interpretation of estimated coefficients ˆj is
ˆ ˆln 1j ja
or ˆ
ˆ 1j
ja e
(6)
where ˆja is the estimated ad-valorem equivalent (AVE) of NTM type j.
In (5), is a pass-through parameter for tariffs: if ˆ 0.2 , a tariff at 10% translates, on
average, into a 2% rise in the domestic price of the affected product. By contrast, the pass-
through parameter for NTMs cannot be identified because, unlike tariffs, we do not observe
compliance costs. Thus, the estimated AVE for NTMs, ˆja , is the compliance cost’s fraction
8
We also explored an alternative formulation in which effects are not cumulative for QRs (when a QR is binding,
other instruments have no effect). Results were similar to those reported in Section 3.2.

CEPII, WP No 2012-16 Assessing the price-raising effect of non-tariff measures in Africa
21
that is ―passed-through‖; if ˆ 0.2ja an NTM imposed on product k translates, on average,
into a 20% rise in its domestic price across products and countries in the sample.
We also run a variant of (5) using frequency ratios instead of dummy variables to mark the
presence of NTMs of each type,9
the estimating equation becoming
ln ln 1ik k i ik j ijk ikjp t c u (7)
where ijkc is the frequency ratio of type-j NTMs (the proportion of HS6 lines within ICP
product k that are covered by one or more NTMs of type j).
We also run a constrained form of (5) where 1 (i.e. assuming full tariff pass-through) by
redefining our dependent variable as
ln ln ln 1ik ik ikp p t (8)
The equation then becomes
ln ik k i j ijk ikjp u (9)
with dummy variables and a similar expression with ijk replaced by ijkc when using
frequency ratios.
In order to account for heterogeneity and to highlight issues that may be peculiar to, inter alia,
sub-Saharan Africa, we differentiate the treatment effect by region of the world. Our regions
are East Asia and the Pacific (EAP), Latin America and the Caribbean (LAC), Middle East
and North Africa (MNA), South Asia (SAS), and Sub-Saharan Africa (SSA).10
The new
equation is then
ln ln 1ik k i ik jr ijkr ikr jp t u (10)
Given the panel structure of our sample (with products as the panel’s ―individuals‖) our base
estimator is a within-product estimator with country ( i ) effects to control for systematic
cost-of-living differences across countries. We also cluster standard errors by product so as to
allow for any arbitrary pattern of spatial correlation of product prices across countries.11
9
Recall that our price data is at a higher degree of aggregation than the NTM data, so we aggregated NTM dummies
up to ICP product categories using frequency ratios. 10
Regional and country coverage is uneven and non-exhaustive (for instance, Central Asian countries are not
included) because of the NTM database’s incompleteness. 11
The justification for doing this can be understood by analogy with conventional treatment-effects estimation. Think
of products as ―individuals‖ and countries as ―time‖. Bertrand, Duflo and Mulainathan (2004) show that because of the
correlation of the binary treatment variable over time, (zero until the start of the treatment, one thereafter), difference-

CEPII, WP No 2012-16 Assessing the price-raising effect of non-tariff measures in Africa
22
3.2. Results
Baseline regression results are shown in Table 3. The first three columns report unconstrained
estimates, using either dummy variables as in (5) (column 1), or frequency ratios as in (7)
(columns 2 and 3). The last two report constrained estimates as in (9), using either dummy
variables (column 4) or frequency ratios (column 5). In specifications (1)-(2) and (4)-(5), we
add interaction terms with GDP per capita (in 2005 PPP dollars), using data from the World
Bank’s World Development Indicators (WDI). In specification (3), we add interaction terms
with the proportion of firms having ISO certification, also from the WDI.
The constraint of full pass-through ( 1 ) is rejected at any level of significance; in fact,
there does not seem to be any pass-through of tariffs at all in domestic prices as measured by
the ICP. Therefore, from now on, we disregard the constrained version of our price-
determination equation.
As for NTMs, there seems to be a significant pass-through of compliance costs for SPS
measures, with AVEs of 15% in the first two columns (unconstrained version) using the
formula in (6), both significant at 1%. Applying the same formula to frequency ratios (second
column), TBT measures have an AVE of 12.5%, significant at 5%.
Interaction terms with income are negative and significant, implying that, across the sample,
the level (or pass-through) of compliance costs decreases with income. For instance, using the
point estimates in column (1) and recalling that GDP per capita is measured in units of ten
thousand dollars, at PPP$1’000 per-capita GDP (the income level of Madagascar), the AVE
of type-A measures is
0.141 0.0151
1'000ˆ 1 0.134
ya e
or 13.4%. At PPP$10’000 (South Africa), the AVE is just zero.
We also find that the proportion of firms with ISO certification interacts negatively with the
compliance cost of SPS measures, suggesting that firm adaptability reduces compliance costs,
although this effect is quantitatively small and estimated imprecisely.12
in-differences regressions will tend to over-reject the null hypothesis, i.e. to be over-optimistic on the existence of
treatment effects. In order to correct for this bias, they recommend clustering standard errors by individual so as to
allow for any arbitrary pattern of correlation of errors across time. Here, when putting the treatment variable (the
presence of NTMs) in binary form, we also create correlation, but now across countries. In order to avoid introducing a
bias, we then allow for the correlation of errors across countries for a given NTM. 12
Interaction terms with a variety of domestic governance measures including various components of the World
Bank’s CPIA and Doing Business indicators yielded unstable and insignificant estimates, with strongly reduced
sample sizes.

CEPII, WP No 2012-16 Assessing the price-raising effect of non-tariff measures in Africa
23
Table 3: Baseline regression results
a/ GDP per capita measured in $10’000 for readability of coefficients.
Robust t-statistics clustered by product in parenthesis. * significant at 10%; ** significant at 5%; *** significant at 1%
So far, our formulation allows for price heterogeneity across products and countries (through
fixed effects) but not for heterogeneity of treatment effects across products or countries. That
is, the coefficients on NTMs are not allowed to vary across products or countries. In order to
explore heterogeneity of effects across regions, Table 4 reports estimates from a regression
run using NTM dummies interacted with five region dummies. In order to obtain unbiased
estimates, NTM types were also included linearly in the regression and country fixed effects
were included (as well as product fixed effects).
(1) (2) (3) (4) (5)
ln (tariff) 0.006 0.004 0.017
(0.33) (0.25) (0.92)
NTM type
NTM A (SPS) 0.141 0.143 0.158 -0.037 -0.002
(3.10)*** (3.03)*** (2.54)** (0.52) (0.03)
NTM B (TBT) 0.005 0.118 0.077 -0.025 0.104
(0.14) (2.35)** (1.08) (0.32) (0.91)
NTM C (PSI & formalities) 0.062 0.088 0.113 0.076 0.050
(0.88) (1.11) (1.22) (0.68) (0.36)
NTM D (price measures) 0.035 -0.046 -0.076 -0.027 0.100
(1.09) (0.71) (0.69) (0.22) (0.44)
NTM E (QRs) -0.085 -0.083 -0.082 -0.034 0.145
(2.19)** (1.14) (0.86) (0.31) (0.70)
Interaction terms:With iso
certif. b/
NTM A (SPS) -0.151 -0.189 -0.008 0.112 0.090
(2.27)** (2.55)** (1.77)* (0.86) (0.58)
NTM B (TBT) 0.010 -0.157 -0.006 0.149 0.010
(0.20) (2.39)** (1.35) (1.13) (0.06)
NTM C (PSI & formalities) -0.023 -0.082 -0.001 -0.128 -0.141
(0.30) (1.09) (0.34) (0.93) (0.82)
NTM D (price measures) -0.046 0.013 0.001 -0.235 -0.330
(1.03) (0.13) (0.14) (1.53) (1.27)
NTM E (QRs) 0.121 0.122 0.005 0.007 -0.041
(2.02)** (1.47) (0.92) (0.04) (0.17)
Constant -0.518 -0.347 -0.030 -3.421 -2.955
(6.73)*** (4.34)*** (0.30) (26.42)***(15.33)***
Observations 1260 1260 1218 1260 1260
Number of groups (products) 42 42 42 42 42
Fixed effects
Product yes yes yes yes yes
Country yes yes yes yes yes
R-squared (within) 0.34 0.34 0.35 0.46 0.46
ln (tariff-corrected
price)
with GDP/capita a/ with GDP/capita a/
ln (price)

CEPII, WP No 2012-16 Assessing the price-raising effect of non-tariff measures in Africa
24
In order to save space, Table 4 includes only the coefficients of interest. For robustness, a
similar regression was run using frequency ratios and yielded similar point estimates.13
Estimates vary substantially across regions, with SPS measures have a significant price-
raising effect only for East Asia & the Pacific (EAP) and sub-Saharan Africa (SSA), with a
stronger effect in EAP (22% applying formula (6) to the coefficient in ) than in SSA (14%).
PSI is found to have a 14% AVE, significant at 10%, in South Asia. The estimated effect of
NTMs D and E is sometimes negative, but the number of observations on these measures is
small, as these measures have largely been phased out (see Section 2), and estimated effects
on them should be interpreted cautiously.
The significant price effect of SPS measures in SSA confirms the factual analysis of
Charalambides and Gillson (2011) who argue that SPS measures in sub-Saharan Africa tend
to be ―nuisance regulations‖ affecting the cost of living, and estimated AVEs are in a
plausible range.
Table 4: Parameter estimates, effect of NTMs by region
a/ East Asia & the Pacific; b/ Latin America and the Caribbeans; c/ Middle East & North Africa; d/ South Asia; e/ Sub-
Saharan Africa. All estimates from single fixed-effects regression; country and product FE included, standard errors
clustered at product level. Robust t-statistics clustered by product in parenthesis. * significant at 10%; ** significant at
5%; *** significant at 1%
In Table 5, we extend the analysis to the count of NTMs applied at the product level, by type
(using the finer, 2-digit disaggregation of the MAST nomenclature). The results are weak,
suggesting that several measures of a given type do not add up to a larger burden on traders,
presumably because as long as they are of the same type they are likely to be enforced by the
same or similar government agencies and to involve similar type of paperwork and proof of
compliance.
13
Results from this alternative regression are not reported for the sake of space. They are available from the authors
upon demand.
NTM dummies EAP a/ LAC b/ MNA c/ SAS d/ SSA e/
NTM A (SPS) 0.201 -0.015 0.006 -0.044 0.129
(3.39)*** (0.42) (0.11) (0.49) (3.02)***
NTM B (TBT) 0.030 -0.021 0.089 0.087 -0.033
(0.51) (0.67) (1.13) (0.87) (0.87)
NTM C (PSI & formalities) 0.009 0.062 -0.045 0.131 0.096
(0.13) (1.61) (0.68) (1.92)* (1.40)
NTM D (price measures) -0.137 -0.015 0.119 -0.278 0.024
(2.11)** (0.34) (1.39) (2.09)** (0.54)
NTM E (QRs) -0.126 0.046 0.024 -0.153 0.045
(2.34)** (1.11) (0.32) (2.07)** (0.46)

CEPII, WP No 2012-16 Assessing the price-raising effect of non-tariff measures in Africa
25
In order to get a rough idea of what AVEs would look like if we were to differentiate them by
product and country, here we generate AVEs at the level of (country × product) pairs in two
steps. First, we include in the regression a full vector of interaction terms between NTM types
and country dummies; in order to save on degrees of freedom, we include only NTMs of type
A (SPS) for which the previous round of estimation gave significant estimates. Thus, our
estimating equation becomes
ln iAk i iAk i j k ika I u (11)
where ikc now designates the frequency ratio of SPS measures only on product k in country i.
The increase in the log of the price of product k in country i attributable to SPS measures is
0
ˆˆ ˆln lnik
ik ik ikc c ca a c
(12)
which gives AVEs given in Table 6. It can be seen that some of them are quite substantial in
Kenya, e.g. on rice, poultry, beer, cereals and flours other than wheat and rice, sugar, and
various types of meat. In Uganda, rice and cereals other than wheat and rice also stand out for
their high AVEs.
All in all, it is fair to say that AVEs generated by SPS measures stand out as the most
precisely estimated and that, while not prohibitive, they are substantial, in particular in view
of how important is food in the cost of living for many households in the lower tail of the
income distribution in SSA.

CEPII, WP No 2012-16 Assessing the price-raising effect of non-tariff measures in Africa
26
Table 5: AVE estimation results using number of NTMs per product
Robust t-statistics clustered by product in parenthesis. * significant at 10%; ** significant at 5%; *** significant at 1%
ln (price)
(1) (2)
ln (tariff) 0.009
(0.50)
NTM type
NTM A (SPS) 0.019 -0.002
(2.44)** (0.03)
NTM B (TBT) 0.097 0.104
(3.18)*** (0.91)
NTM C (PSI & formalities) -0.044 0.050
(0.66) (0.36)
NTM D (price measures) -0.002 0.100
(0.02) (0.44)
NTM E (QRs) 0.001 0.145
(0.03) (0.70)
Interaction terms (GDP/capita)
NTM A (SPS) -0.034 0.090
(1.86)* (0.58)
NTM B (TBT) -0.134 0.010
(3.22)*** (0.06)
NTM C (PSI & formalities) 0.055 -0.141
(0.74) (0.82)
NTM D (price measures) -0.004 -0.330
(0.04) (1.27)
NTM E (QRs) 0.022 -0.041
(0.47) (0.17)
Constant -0.810 -2.955
(7.24)*** (15.33)***
Observations 1260 1260
Number of groups (products) 42 42
Fixed effects
Product yes yes
Country yes yes
R-squared (within) 0.34 0.46
ln (tariff-corrected
price)

CEPII, WP No 2012-16 Assessing the price-raising effect of non-tariff measures in Africa
27
Table 6: Country × product price effects, Kenya and Namibia
Kenya SPS (A) Namibia QR (E)
Rice 42.10 Coffee 41.16
Bread 42.10 Mineral waters 41.16
Other bakery products 42.10 Tobacco 41.16
Poultry 42.10 Rice 41.16
Fresh milk 42.10 Other cereals and flour 41.16
Cheese 42.10 Bread 41.16
Spirits 42.10 Other bakery products 41.16
Beer 42.10 Pasta products 41.16
Other cereals and flour 38.73 Beef and veal 41.16
Frozen 37.89 Pork 41.16
Lamb 37.46 Lamb 41.16
Coffee 36.62 Poultry 41.16
Sugar 36.20 Other meats and preparations 41.16
Other meats and preparations 35.78 Fresh or frozen fish and seafood 41.16
Fresh or chilled fruit 34.94 Fresh milk 41.16
Confectionery 34.52 Cheese 41.16
Beef and veal 34.10 Eggs and egg-based products 41.16
Pasta products 33.68 Butter and margarine 41.16
Fresh or chilled vegetables 33.26 Other edible oils and fats 41.16
Frozen or preserved vegetables 33.26 Frozen 41.16
Tobacco 32.83 Fresh or chilled vegetables 41.16
Preserved fish and seafood 32.83 Fresh or chilled potatoes 41.16
Preserved milk and milk products 32.83 Frozen or preserved vegetables 41.16
Other edible oils and fats 29.47 Sugar 41.16
Fresh or frozen fish and seafood 28.20 Jams 41.16
Butter and margarine 28.20 Confectionery 41.16
Jams 28.20 Spirits 41.16
Wine 28.20 Wine 41.16
Mineral waters 27.36 Beer 41.16
Eggs and egg-based products 25.26 Fresh or chilled fruit 40.33
Fresh or chilled potatoes 21.05 Preserved fish and seafood 39.51
Pork 18.10 Preserved milk and milk products 36.63
Clothing materials and accessories 21.40
Household textiles 20.58
Footwear 18.93
Major tools and equipment 15.64
Garments 13.17
Glassware 10.70
Small electric household appliances 5.76
Small tools and miscellaneous accessories 5.76

CEPII, WP No 2012-16 Assessing the price-raising effect of non-tariff measures in Africa
28
Table 6 (continued): Country × product price effects, Uganda and South Africa
3.3. Impact on household expenditures: An illustrative calculation for Kenya
We now explore the implications of our results for the cost of living across the distribution of
income in one particular country, Kenya. To do this, we will combine our AVEs with
household expenditure data from Kenya’s household survey (HHS) and calculate the increase
in the cost of living induced by SPS measures across the income distribution.14
The principle
behind our calculation is this. For urban households, price-raising NTMs increase the cost of
goods purchased, so they act as a tax, which is supposed to be balanced by the reduction of
some externality. Absent experimental evidence on the willingness to pay for the reduction of
negative externalities, we can only look at the tax side. Needless to say, a proper cost-benefit
analysis of NTMs should also quantify the externality reduction, although it lies outside the
scope of this paper.
For rural households, we assume that production methods for auto-consumption or for
domestic sales are not affected by SPS measures which, as discussed in the introduction, are
essentially enforced at the border; or if they are, the rise in the price of the product just
compensates for the compliance cost, so there is no net change in profits or income on the
14
We obtained Kenya’s HHS from the World Bank. It is particularly well suited to the type of calculation we perform
as it clearly distinguishes between food purchases and auto-consumption.
Uganda SPS (A) South Africa QR (E)
Tobacco 29.90 Fresh or chilled potatoes 64.35
Rice 29.90 Other edible oils and fats 2.57
Other cereals and flour 29.90
Bread 29.90
Other bakery products 29.90
Pasta products 29.90
Sugar 29.90
Jams 29.90
Confectionery 29.90
Spirits 29.90
Wine 29.90
Beer 29.90
Other edible oils and fats 29.30
Fresh or chilled fruit 29.30
Fresh or chilled vegetables 29.00
Frozen 28.40
Frozen or preserved vegetables 28.10
Mineral waters 26.91
Preserved fish and seafood 16.74
Other meats and preparations 16.44
Coffee 11.96

CEPII, WP No 2012-16 Assessing the price-raising effect of non-tariff measures in Africa
29
production side. The only channel that is left is the consumption channel for net buyers, for
which the effect is the same as for urban households. Thus, we calculate only a consumption
effect and we calculate it on net (market) purchases excluding self-consumption.
Let i denote a Kenyan household, a product defined according to the HHS nomenclature,
which is typically more aggregated than HS6 (the trade nomenclature at the level of which
trade flows and NTMs are defined), and k a product at HS6. Let ˆ /kka a n be the simple
average of the estimated AVEs of NTMs imposed on all HS6 products k belonging to HHS
category , and i the weight of product in household i’s consumption basket. We defined
a consumption-weighted AVE of SPS measures imposed on household i’s consumption
basket as
i ia a (13)
Our approach consists in calculating averages of this magnitude at each centile of the income
distribution.
3.3.1. Consumption patterns and NTM incidence
Table 7 shows differences in household expenditure patterns across quintiles of the income
distribution, from the 20% poorest (Q1) to the 20% richest (Q5). Unsurprisingly, the share of
food and even more the share of food auto-consumption decreases with income.
Table 7: Distribution of household expenditure shares, by income quintile (%)
Source: Authors ‘calculations based on Kenya Household Survey
Note: Q1 is the bottom quintile, Q5 is the top. Numbers are percentage expenditure shares; lines add up to 100%.
Appendix A2 Table A2a shows detailed expenditure patterns. In particular, Tables A2b and
A2c show, for each item, the number and frequency of NTMs by type: SPS (A); TBT (B);
Inspection (C); Price Control (D) and Quantity Control (E).
Let n and c be the respectively the average number and frequency ratio of NTMs imposed
on HHS product category . Following the logic of equation(13), we define consumption-
weighted NTM numbers and frequency ratios as
GroupFood Auto-
Cons
Food
purchased
Non food
itemServices
Good
purchased
Q1 32.9 40.7 13.0 13.3 53.7
Q2 27.0 40.6 15.6 16.8 56.2
Q3 22.2 40.1 18.2 19.5 58.3
Q4 18.1 37.3 20.4 24.2 57.7
Q5 9.1 22.2 22.8 45.9 45.0

CEPII, WP No 2012-16 Assessing the price-raising effect of non-tariff measures in Africa
30
i in n (14)
and i ic c (15)
respectively. Figure 5 and Figure 6 plot quintile averages of these two numbers across the
distribution of income. Figure 5 shows that the number of measures goes down with income,
essentially because of the weight of SPS measures in the total.
Figure 5: Average number of NTMs faced, by income group
Source: Authors ‘calculations based on Kenya Household Survey
Figure 6 shows a more complex picture in terms of frequency ratios. Whereas SPS frequency
ratios go down with income (because the weight of food goes down), frequency ratios for
TBT measures (product standards other than for sanitary reasons) and QRs go up.
Figure 6: Frequency index of NTMs faced by income group
Source: Authors ‘calculations based on Kenya Household Survey
0
2
4
6
8
10
12
14
16
18
20
Q1 Q2 Q3 Q4 Q5
AV
ER
AG
EN
UM
BE
RO
FN
TM
S
INCOME QUINTILES
E: QUANTITY CONTROLS D: PRICE CONTROL
C: INSPECTION B: TBTA: SPS
0
10
20
30
40
50
60
70
80
90
Q1 Q2 Q3 Q4 Q5
Fre
quen
cy i
nd
ex o
f N
TM
s
Income quintiles
A: SPS B: TBT
C: Inspection D: Price Controls
E: Quantity Controls

CEPII, WP No 2012-16 Assessing the price-raising effect of non-tariff measures in Africa
31
3.3.2. Consumption-weighted AVEs
Here we merge the price gap exercise from the previous part with the household consumption
by applying (13) on parameter estimates from Figure 7 These all concern foodstuffs, as
coefficients on SPS measures were the only ones significantly different from zero. The result
is plotted using a smoother regression15
of the average value of ai for each centile of the
income distribution against the log of that centile’s average income in panel (a), and on that
centile’s number (from 1 to 100) in panel (b).
Figure 7: Price-raising effect of SPS faced by Kenyan households
(a) on log income (b) on centiles of the income distribution
Both panels show that the incidence of SPS measures is regressive in Kenya, with
consumption-weighted average AVEs going down from about 9% for the 5th
centile to 7% for
the 95th
centile. This is a direct consequence of the decreasing weight of foodstuffs in
household expenditure patterns. Again, it is worth stressing that this calculation is only half
the story, as SPS measures are supposed to protect consumers from externalities (health
hazards), and there is no particular reason to assume that benefits go up with income.
However, if SPS measures are enforced arbitrarily with little relation with real issues on the
ground, as suggested by the anecdotal evidence, they are regressive.
4. CONCLUDING REMARKS
Our results are very preliminary and should be interpreted with many caveats, the first and
foremost being that the degree of disaggregation of the product nomenclature on which we
base our AVE calculations (which construct the dependent variable) is much too coarse to
15
A ―smoother regression‖ is a set of linear regressions estimated observation by observation over moving windows.
The advantage of this procedure is that it allows for highly nonlinear patterns, as it imposes no a priori functional form.
46
810
SP
S A
VE
%
8 9 10 11 12 13Log of per capita expenditure
bandwidth = .8
Kenya
46
810
SP
S A
VE
%
0 20 40 60 80 100Per capita expenditure: Centile distribution
bandwidth = .25
Kenya

CEPII, WP No 2012-16 Assessing the price-raising effect of non-tariff measures in Africa
32
match the degree of disaggregation of the NTM database. This is an area where further,
systematic data collection is urgently needed.
Notwithstanding the data limitations, results corroborate the factual analysis of Gillson (2011)
and Charalambides and Gillson (forthcoming). Whereas SPS measures are generally those
with the strongest rationale in terms of addressing potential market failures, in Sub-Saharan
Africa they seem to be designed and implemented in a way that makes them cumbersome and
costly. In Kenya, our estimation suggests that they raise the cost of living by about 9% for
poor households, a non-trivial effect.
This of course does not mean that SPS measures should be abolished, as the observed effects
should be sized against non-trade or non-economic objectives. Rather, our results suggest that
SPS measures deserve policy attention in terms of improving design and implementation. In
view of the evidence on the ground, the direction of improvement is clear: Systematic
inspections should be replaced by risk profiling (on this, see e.g. Grigoriou 2012); paperwork
should be simplified and consolidated into single forms made available online, and when
testing is strictly necessary, it should as much as possible be outsourced to licensed private
labs, as government-run standards bureaus rarely have the resources and capabilities to fulfill
useful technical/testing functions in sub-Saharan Africa.

CEPII, WP No 2012-16 Assessing the price-raising effect of non-tariff measures in Africa
33
REFERENCES
Anderson, J. & P. Neary (1994), "Measuring the Restrictiveness of Trade Policy," World
Bank Economic Review 8:151-169.
Andriamananjara, S., J. Dean, R. Feinberg, M. Ferrantino, R. Ludema, & M. Tsigas (2004),
―The Effects of Non-Tariff Measures on Prices, Trade, and Welfare: CGE Implementation of
Policy-Based Price Comparisons‖; USITC Office of Economics Working Paper 2004-04-A.
Beghin, J., A.-C. Disdier, S. Marette, & F. van Tongeren (2011), ―Measuring Costs and
Benefits of Non-Tariff Measures in Agri-Food Trade‖; Iowa State University working paper
11001.
Bertrand, M., E. Duflo & S. Mullainathan (2004), ―How Much Should We Trust Differences-
in-Differences Estimates?‖; Quarterly Journal of Economics 119, 249-275.
Bhagwati, J. (1968), ―More on the Equivalence of Tariffs and Quotas‖; American Economic
Review 58(1): 142-146.
Baldwin, R. (1970), Non-Tariff Distortions in International Trade; Washington, DC:
Brookings Institution.
Baldwin, R. (1975), Foreign Trade Regimes and Economic Development: The Philippines.
New York: Columbia University Press.
Baldwin, R. (1989), "Measuring Nontariff Trade Policies," National Bureau of Economic
Research, Working Paper No. 2978.
Bradford, S. (2003), ―Paying the price: final goods protection in OECD countries‖; Review of
Economic and Statistics 85, 24–37.
Brenton, P., & G. Isik, eds. (2012), Defragmenting Africa: Deepening regional trade
integration in goods and services; Washington, D.C.: The World Bank.
Cadot, O. (2012), Non-tariff measures in Burundi: The way forward; Washington, D.C.: The
World Bank, mimeo (background report to the DTIS update).
Carrère, C., & J. de Melo (2011), ―Non-Tariff Measures : What Do We Know, What Should
Be Done ?”; Journal of Economic Integration 26, 169-196.
Deardorff, Al., & R. Stern (1997), ―Measurement of non-Tariff Barriers‖; Economics
Department Working Paper 179, OECD.

CEPII, WP No 2012-16 Assessing the price-raising effect of non-tariff measures in Africa
34
Disdier, A.-C.; L. Fontagné, & M. Mimouni (2008), ―The Impact of Regulations on
Agricultural Trade : Evidence from the SPS and TBT Agreements‖; American Journal of
Agricultural Economics 90, 336-350.
Engel, C., & J. Rogers (1996), ―How Wide is the Border?‖ American Economic Review 86(5),
1112-1125.
Feenstra, R. C. 1984. "Voluntary Export Restraints in U.S. Autos, 1980-81: Quality,
Employment, and Welfare Effects," in Robert E. Baldwin and Anne O. Krueger (eds.), The
Structure and Evolution of Recent U.S. Trade Policy. Chicago: University of Chicago Press.
Ferrantino, M. (2006), Quantifying the Trade and Economic Effects of non-Tariff Measures;
OECD Trade Policy Working Paper 28.
Gillson, I. (2011), Non-Tariff Barriers to Sub-Saharan African Trade in Food Staples:
Opening Regional Markets to Promote Food Security and Price Stabilization; Washington:
The World Bank, 2011.
Gillson, I. & N. Charalambides (2012), ―Addressing Non-Tariff Barriers on Regional Trade in
Southern Africa‖; in O. Cadot and M. Malouche, eds., Non-tariff measures: A fresh look at
trade policy’s new frontier; Washington, DC/London: The World Bank/CEPR.
Gitonga, K. (2004), Study on the rationalization and harmonization of policies, regulations,
procedures, grades and standards in the fertilizer sub-sector in Eastern Africa; Entebbe:
Eastern and Central Africa Programme for Agricultural Policy Analysis.
Grigoriou, C. (2012), ―More Safety for Less Hassle: Appying Risk-Profiling Techniques to
the Enforcement of SPS Measures at the Border‖; in in O. Cadot and M. Malouche, eds.,
Non-tariff measures: A fresh look at trade policy’s new frontier; Washington, DC/London:
The World Bank/CEPR.
Hoekman, B., & J.l Zarrouk (2009), ―Changes in Cross-Border Trade Costs in the Pan-Arab
Free Trade Area, 2001-2008‖; World Bank Policy Research Working Paper 5031.
Ihle, R.; S. von Cramon-Traubadel, & S. Zorya (2010), ―Country and Border Effects in the
Transmission of Maize Prices in Eastern Africa: Evidence from a Semi-Parametric
Regression Model‖; Paper prepared to the Joint Conference of the African Association of
Agricultural Economists and the Agricultural Economists Association of South Africa, Cape
Town.
Imani Development (2009), Non-tariff barrier impact study for COMESA region; mimeo.
ITC (2010), South Africa: A potential market for agri-food products from Africa; Geneva:
United Nations publications.

CEPII, WP No 2012-16 Assessing the price-raising effect of non-tariff measures in Africa
35
Karugia, J.; J. Wanjiku, J. Nzuma, S. Gbegbelegbe, E. Macharia, S. Massawe, A. Freeman,
M. Waithaka, & S. Kaitibie (2009), ―The Impact of Non-tariff Barriers on Maize and Beef
Trade in East Africa‖; ReSAKSS working paper #29.
Kee, H.L., A. Nicita, & M. Olarreaga (2009), Estimating Trade Restrictiveness Indices;
Economic Journal 119, 172-199.
Keyser, J. (2012), ―Africa can feed Africa: Removing Barriers to Regional Trade in Food
Staples‖; Washington, D.C.: The World Bank, mimeo.
Leamer, E. (1990), "The Structure and Effects of Tariffs and Nontariff Barriers in 1983," in
Ronald W. Jones and Anne O. Krueger (eds.), The Political Economy of International Trade.
Cambridge, MA: Basil Blackwell, Inc.
Mahboub Morsheb, A.K.M. (2003), ―What Can We Learn from a Large Border Effect in
Developing Countries?‖; Journal of Development Economics 72: 353-369.
McCallum, J. (1995), ―National Borders Matter‖; American Economic Review 85: 615-623.
Nogués, J., A. Olechowski & L. A. Winters (1986), ―Extent of Non-Tariff Barriers to
Industrial Country Imports‖; World Bank Economic Review 1, 181-199.
Versailles, B. (2012), ―Market Integration and Border Effects in Eastern Africa‖; Center for
the Study of African Economies working paper 2012-01.
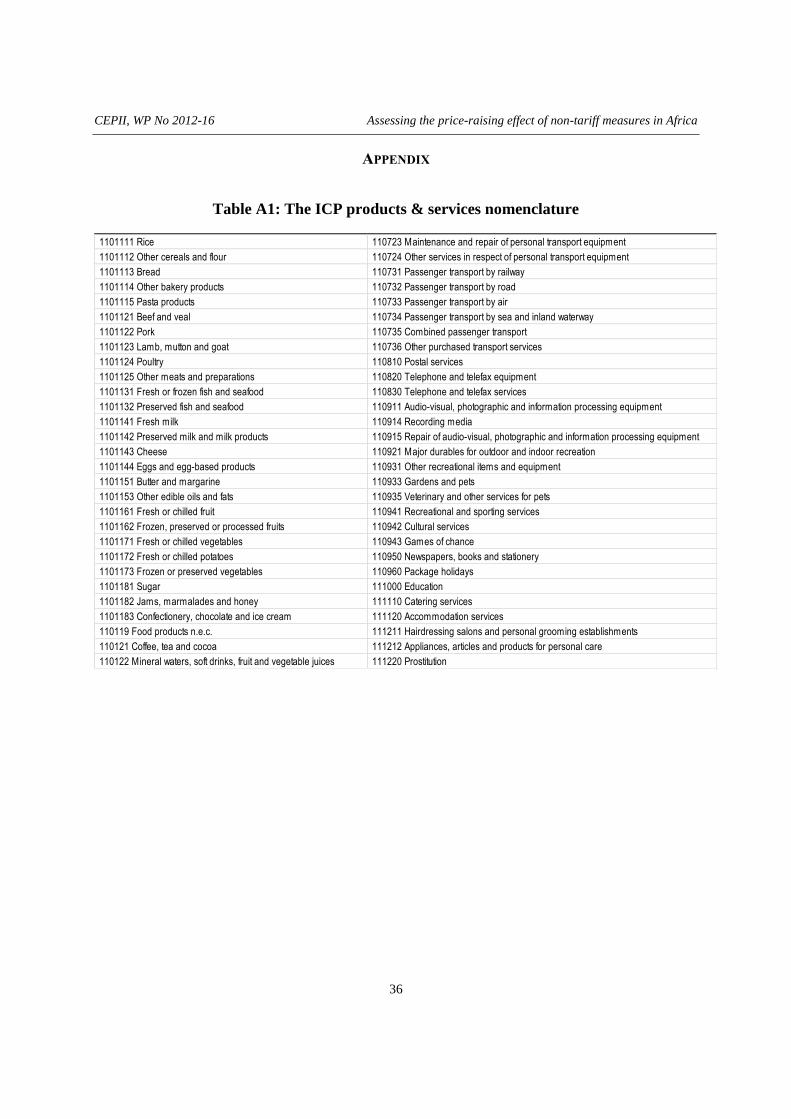
CEPII, WP No 2012-16 Assessing the price-raising effect of non-tariff measures in Africa
36
APPENDIX
Table A1: The ICP products & services nomenclature
1101111 Rice 110723 Maintenance and repair of personal transport equipment
1101112 Other cereals and flour 110724 Other services in respect of personal transport equipment
1101113 Bread 110731 Passenger transport by railway
1101114 Other bakery products 110732 Passenger transport by road
1101115 Pasta products 110733 Passenger transport by air
1101121 Beef and veal 110734 Passenger transport by sea and inland waterway
1101122 Pork 110735 Combined passenger transport
1101123 Lamb, mutton and goat 110736 Other purchased transport services
1101124 Poultry 110810 Postal services
1101125 Other meats and preparations 110820 Telephone and telefax equipment
1101131 Fresh or frozen fish and seafood 110830 Telephone and telefax services
1101132 Preserved fish and seafood 110911 Audio-visual, photographic and information processing equipment
1101141 Fresh milk 110914 Recording media
1101142 Preserved milk and milk products 110915 Repair of audio-visual, photographic and information processing equipment
1101143 Cheese 110921 Major durables for outdoor and indoor recreation
1101144 Eggs and egg-based products 110931 Other recreational items and equipment
1101151 Butter and margarine 110933 Gardens and pets
1101153 Other edible oils and fats 110935 Veterinary and other services for pets
1101161 Fresh or chilled fruit 110941 Recreational and sporting services
1101162 Frozen, preserved or processed fruits 110942 Cultural services
1101171 Fresh or chilled vegetables 110943 Games of chance
1101172 Fresh or chilled potatoes 110950 Newspapers, books and stationery
1101173 Frozen or preserved vegetables 110960 Package holidays
1101181 Sugar 111000 Education
1101182 Jams, marmalades and honey 111110 Catering services
1101183 Confectionery, chocolate and ice cream 111120 Accommodation services
110119 Food products n.e.c. 111211 Hairdressing salons and personal grooming establishments
110121 Coffee, tea and cocoa 111212 Appliances, articles and products for personal care
110122 Mineral waters, soft drinks, fruit and vegetable juices 111220 Prostitution

CEPII, WP No 2012-16 Assessing the price-raising effect of non-tariff measures in Africa
37
Table A1 (continued)
1102111 Spirits 111231 Jewellery, clocks and watches
1102121 Wine 111232 Other personal effects
1102131 Beer 111240 Social protection
110220 Tobacco 111250 Insurance
1103111 Clothing materials and accessories 111261 FISIM
1103121 Garments 111262 Other financial services n.e.c
1103141 Cleaning and repair of clothing 111270 Other services n.e.c.
1103211 Footwear 111300 Net purchases abroad
1103221 Repair and hire of footwear 130221 Compensation of employees
110410 Actual and imputed rentals for housing 130222 Intermediate consumption
110430 Maintenance and repair of the dwelling 130223 Gross operating surplus
110440 Water supply and miscellaneous services relating to the dwelling130224 Net taxes on production
110442 Miscellaneous services relating to the dwelling 130225 Receipts from sales
110451 Electricity 130421 Compensation of employees
110452 Gas 130422 Intermediate consumption
110453 Other fuels 130423 Gross operating surplus
110511 Furniture and furnishings 130424 Net taxes on production
110512 Carpets and other floor coverings 130425 Receipts from sales
110513 Repair of furniture, furnishings and floor coverings 140111 Compensation of employees
110520 Household textiles 140112 Intermediate consumption
110531 Major household appliances whether electric or not 140113 Gross operating surplus
110532 Small electric household appliances 140114 Net taxes on production
110533 Repair of household appliances 140115 Receipts from sales
110540 Glassware, tableware and household utensils 150110 Metal products and equipment
110551 Major tools and equipment 150120 Transport equipment
110552 Small tools and miscellaneous accessories 150210 Residential buildings
110561 Non-durable household goods 150220 Non-residential buildings
1105621 Domestic services 150230 Civil engineering works
1105622 Household services 150300 Other products
110611 Pharmaceutical products 160000 Change in inventories and valuables
110612 Other medical products 180000 Balance of exports and imports
110613 Therapeutical appliances and equipment
110621 Medical Services
110622 Dental services
110623 Paramedical services
110630 Hospital services
110711 Motor cars
110712 Motor cycles
110713 Bicycles
110722 Fuels and lubricants for personal transport equipment
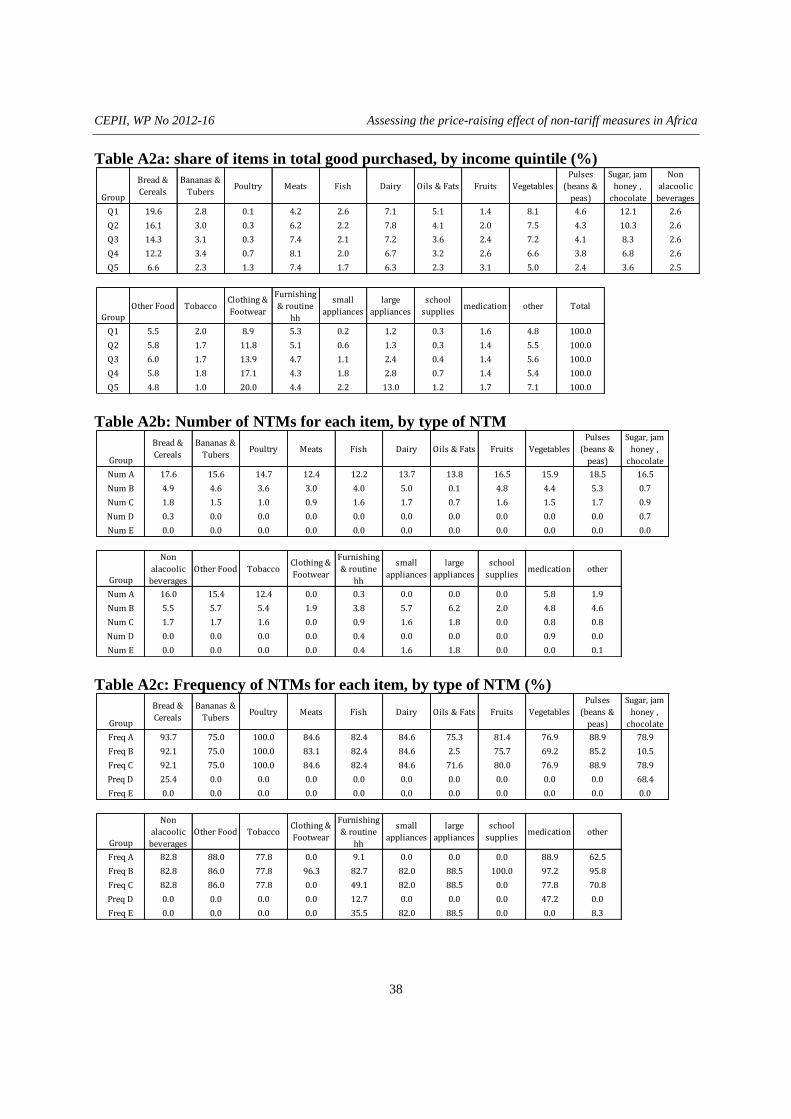
CEPII, WP No 2012-16 Assessing the price-raising effect of non-tariff measures in Africa
38
Table A2a: share of items in total good purchased, by income quintile (%)
Table A2b: Number of NTMs for each item, by type of NTM
Table A2c: Frequency of NTMs for each item, by type of NTM (%)
Group
Bread &
Cereals
Bananas &
TubersPoultry Meats Fish Dairy Oils & Fats Fruits Vegetables
Pulses
(beans &
peas)
Sugar, jam
honey ,
chocolate
Non
alacoolic
beverages
Q1 19.6 2.8 0.1 4.2 2.6 7.1 5.1 1.4 8.1 4.6 12.1 2.6
Q2 16.1 3.0 0.3 6.2 2.2 7.8 4.1 2.0 7.5 4.3 10.3 2.6
Q3 14.3 3.1 0.3 7.4 2.1 7.2 3.6 2.4 7.2 4.1 8.3 2.6
Q4 12.2 3.4 0.7 8.1 2.0 6.7 3.2 2.6 6.6 3.8 6.8 2.6
Q5 6.6 2.3 1.3 7.4 1.7 6.3 2.3 3.1 5.0 2.4 3.6 2.5
GroupOther Food Tobacco
Clothing &
Footwear
Furnishing
& routine
hh
small
appliances
large
appliances
school
suppliesmedication other Total
Q1 5.5 2.0 8.9 5.3 0.2 1.2 0.3 1.6 4.8 100.0
Q2 5.8 1.7 11.8 5.1 0.6 1.3 0.3 1.4 5.5 100.0
Q3 6.0 1.7 13.9 4.7 1.1 2.4 0.4 1.4 5.6 100.0
Q4 5.8 1.8 17.1 4.3 1.8 2.8 0.7 1.4 5.4 100.0
Q5 4.8 1.0 20.0 4.4 2.2 13.0 1.2 1.7 7.1 100.0
Group
Bread &
Cereals
Bananas &
TubersPoultry Meats Fish Dairy Oils & Fats Fruits Vegetables
Pulses
(beans &
peas)
Sugar, jam
honey ,
chocolate
Num A 17.6 15.6 14.7 12.4 12.2 13.7 13.8 16.5 15.9 18.5 16.5
Num B 4.9 4.6 3.6 3.0 4.0 5.0 0.1 4.8 4.4 5.3 0.7
Num C 1.8 1.5 1.0 0.9 1.6 1.7 0.7 1.6 1.5 1.7 0.9
Num D 0.3 0.0 0.0 0.0 0.0 0.0 0.0 0.0 0.0 0.0 0.7
Num E 0.0 0.0 0.0 0.0 0.0 0.0 0.0 0.0 0.0 0.0 0.0
Group
Non
alacoolic
beverages
Other Food TobaccoClothing &
Footwear
Furnishing
& routine
hh
small
appliances
large
appliances
school
suppliesmedication other
Num A 16.0 15.4 12.4 0.0 0.3 0.0 0.0 0.0 5.8 1.9
Num B 5.5 5.7 5.4 1.9 3.8 5.7 6.2 2.0 4.8 4.6
Num C 1.7 1.7 1.6 0.0 0.9 1.6 1.8 0.0 0.8 0.8
Num D 0.0 0.0 0.0 0.0 0.4 0.0 0.0 0.0 0.9 0.0
Num E 0.0 0.0 0.0 0.0 0.4 1.6 1.8 0.0 0.0 0.1
Group
Bread &
Cereals
Bananas &
TubersPoultry Meats Fish Dairy Oils & Fats Fruits Vegetables
Pulses
(beans &
peas)
Sugar, jam
honey ,
chocolate
Freq A 93.7 75.0 100.0 84.6 82.4 84.6 75.3 81.4 76.9 88.9 78.9
Freq B 92.1 75.0 100.0 83.1 82.4 84.6 2.5 75.7 69.2 85.2 10.5
Freq C 92.1 75.0 100.0 84.6 82.4 84.6 71.6 80.0 76.9 88.9 78.9
Preq D 25.4 0.0 0.0 0.0 0.0 0.0 0.0 0.0 0.0 0.0 68.4
Freq E 0.0 0.0 0.0 0.0 0.0 0.0 0.0 0.0 0.0 0.0 0.0
Group
Non
alacoolic
beverages
Other Food TobaccoClothing &
Footwear
Furnishing
& routine
hh
small
appliances
large
appliances
school
suppliesmedication other
Freq A 82.8 88.0 77.8 0.0 9.1 0.0 0.0 0.0 88.9 62.5
Freq B 82.8 86.0 77.8 96.3 82.7 82.0 88.5 100.0 97.2 95.8
Freq C 82.8 86.0 77.8 0.0 49.1 82.0 88.5 0.0 77.8 70.8
Preq D 0.0 0.0 0.0 0.0 12.7 0.0 0.0 0.0 47.2 0.0
Freq E 0.0 0.0 0.0 0.0 35.5 82.0 88.5 0.0 0.0 8.3

CEPII, WP No 2012-16 Assessing the price-raising effect of non-tariff measures in Africa
39
LIST OF WORKING PAPERS RELEASED BY CEPII
An Exhaustive list is available on the website: \\www.cepii.fr.
No Tittle Authors
2012-15 International Migration and Trade Agreements: the
New Role of PTAs
G. Orefice
2012-14 Scanning the Ups and Downs of China’s Trade
Imbalances
F. Lemoine & D. Ünal
2012-13 Revisiting the Theory of Optimum Currency Areas: Is
the CFA Franc Zone Sustainable?
C. Couharde,
I. Coulibaly, D. Guerreiro
& V. Mignon
2012-12 Macroeconomic Transmission of Eurozone Shocks to
Emerging Economies
B. Erten
2012-11 The Fiscal Impact of Immigration in France: a
Generational Accounting Approach
X. Chojnicki
2012-10 MAcMap-HS6 2007, an Exhaustive and Consistent
Measure of Applied Protection in 2007
H. Guimbard, S. Jean,
M. Mimouni & X. Pichot
2012-09 Regional Integration and Natural Resources: Who
Benefits? Evidence from MENA
C. Carrère, J. Gourdon
& M. Olarreaga
2012-08 A Foreign Direct Investment Database for Global
CGE Models
C. Gouël, H. Guimbard
& D. Laborde
2012-07 On Currency Misalignments within the Euro Area V. Coudert, C. Couharde
& V. Mignon
2012-06 How Frequently Firms export? Evidence from France G. Békés, L. Fontagné,
B. Muraközy & V. Vicard
2012-05 Fiscal Sustainability in the Presence of Systemic
Banks: the Case of EU Countries
A. Bénassy-Quéré
& G. Roussellet

CEPII, WP No 2012-16 Assessing the price-raising effect of non-tariff measures in Africa
40
No Tittle Authors
2012-04 Low-Wage Countries’ Competition, Reallocation
Across Firms and the Quality Content of Exports
J. Martin & I. Méjean
2012-03 The Great Shift: Macroeconomic Projections for the
World Economy at the 2050 Horizon
J. Fouré,
A. Bénassy-Quéré
& L. Fontagné
2012-02 The Discriminatory E_ect of Domestic Regulations
on International Services Trade: Evidence from Firm-
Level Data
M. Crozet, E. Milet
& D. Mirza
2012-01 Optimal food price stabilization in a small open
developing country
C. Gouël & S. Jean
2011-33 Export Dynamics and Sales at Home N. Berman, A. Berthou
& J. Héricourt
2011-32 Entry on Difficult Export Markets by Chinese
Domestic Firms: The Role of Foreign Export
Spillovers
F. Mayneris & S. Poncet
2011-31 French Firms at the Conquest of Asian Markets: The
Role of Export Spillovers
F. Mayneris & S. Poncet
2011-30 Environmental Policy and Trade Performance:
Evidence from China
L. Hering & S. Poncet
2011-29 Immigration, Unemployment and GDP in the Host
Country: Bootstrap Panel Granger Causality Analysis
on OECD Countries
E. Boubtane
D. Coulibaly & C. Rault
2011-28 Index Trading and Agricultural Commodity Prices:
A Panel Granger Causality Analysis
G. Capelle-Blancard
& D. Coulibaly
2011-27 Estimations of Tariff Equivalents for the Services
Sectors
L. Fontagné, A. Guillin
& C. Mitaritonna
2011-26 Isolating the Network Effect of Immigrants on Trade M. Aleksynska
& G. Peri
2011-25 Notes on CEPII’s Distances Measures: The GeoDist
Database
T. Mayer & S. Zignago

CEPII, WP No 2012-16 Assessing the price-raising effect of non-tariff measures in Africa
41
No Tittle Authors
2011-24 Estimations of Tariff Equivalents for the Services
Sectors
L. Fontagné, A Guillin
& C. Mitaritonna
2011-23 Economic Impact of Potential Outcome of the DDA Y. Decreux
& L. Fontagné
2011-22 More Bankers, more Growth? Evidence from OECD
Countries
G. Capelle-Blancard
& C. Labonne
2011-21 EMU, EU, Market Integration and Consumption
Smoothing
A. Christev & J. Mélitz
2011-20 Real Time Data and Fiscal Policy Analysis J. Cimadomo
2011-19 On the inclusion of the Chinese renminbi in the SDR
basket
A. Bénassy-Quéré
& D. Capelle
2011-18 Unilateral trade reform, Market Access and Foreign
Competition: the Patterns of Multi-Product Exporters
M. Bas & P. Bombarda
2011-17 The ― Forward Premium Puzzle‖ and the Sovereign
Default Risk
V. Coudert & V. Mignon
2011-16 Occupation-Education Mismatch of Immigrant
Workers in Europe: Context and Policies
M. Aleksynska
& A. Tritah
2011-15 Does Importing More Inputs Raise Exports? Firm
Level Evidence from France
M. Bas
& V. Strauss-Kahn
2011-14 Joint Estimates of Automatic and Discretionary Fiscal
Policy: the OECD 1981-2003
J. Darby & J. Mélitz
2011-13 Immigration, vieillissement démographique et
financement de la protection sociale : une évaluation
par l’équilibre général calculable appliqué à la France
X. Chojnicki & L. Ragot
2011-12 The Performance of Socially Responsible Funds:
Does the Screening Process Matter?
G. Capelle-Blancard
& S. Monjon
2011-11 Market Size, Competition, and the Product Mix of
Exporters
T. Mayer, M. Melitz
& G. Ottaviano

CEPII, WP No 2012-16 Assessing the price-raising effect of non-tariff measures in Africa
42
No Tittle Authors
2011-10 The Trade Unit Values Database A. Berthou
& C. Emlinger
2011-09 Carbon Price Drivers: Phase I versus Phase II
Equilibrium
A. Creti, P.-A. Jouvet
& V. Mignon
2011-08 Rebalancing Growth in China: An International
Perspective
A. Bénassy-Quéré,
B. Carton & L. Gauvin
2011-07 Economic Integration in the EuroMed: Current Status
and Review of Studies
J. Jarreau
2011-06 The Decision to Import Capital Goods in India: Firms'
Financial Factors Matter
A. Berthou & M. Bas
2011-05 FDI from the South: the Role of Institutional Distance
and Natural Resources
M. Aleksynska
& O. Havrylchyk
2011-04b What International Monetary System for a fast-
changing World Economy?
A. Bénassy-Quéré
& J. Pisani-Ferry
2011-04a Quel système monétaire international pour une
économie mondiale en mutation rapide ?
A. Bénassy-Quéré
& J. Pisani-Ferry
2011-03 China’s Foreign Trade in the Perspective of a more
Balanced Economic Growth
G. Gaulier, F. Lemoine
& D. Ünal
2011-02 The Interactions between the Credit Default Swap and
the Bond Markets in Financial Turmoil
V. Coudert & M. Gex
2011-01 Comparative Advantage and Within-Industry Firms
Performance
M. Crozet & F. Trionfetti

Organisme public d’étude et de recherche
en économie internationale, le CEPII est
placé auprès du Centre d’Analyse
Stratégique. Son programme de travail est
fixé par un conseil composé de
responsables de l’administration et de
personnalités issues des entreprises, des
organisations syndicales et de
l’Université.
Les documents de travail du CEPII
mettent à disposition du public
professionnel des travaux effectués au
CEPII, dans leur phase d’élaboration et de
discussion avant publication définitive.
Les documents de travail sont publiés
sous la responsabilité de la direction du
CEPII et n’engagent ni le conseil du
Centre, ni le Centre d’Analyse
Stratégique. Les opinions qui y sont
exprimées sont celles des auteurs.
Les documents de travail du CEPII sont
disponibles sur le site : http//www.cepii.fr