Embed Size (px)
Citation preview
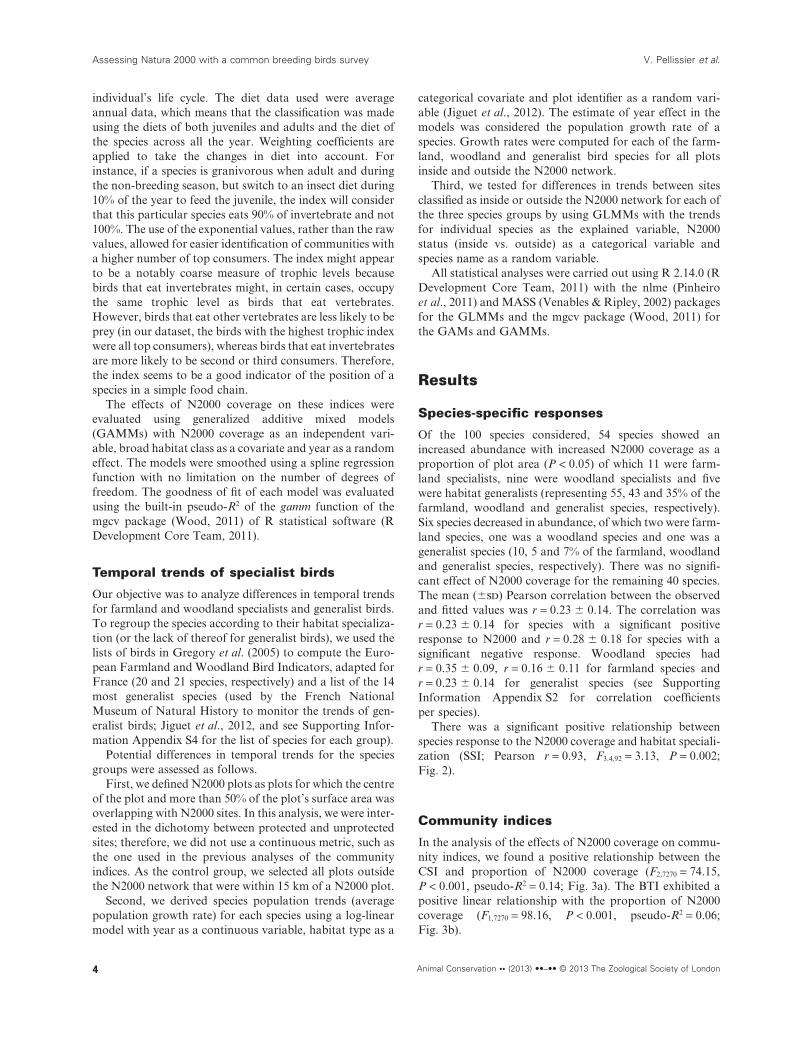
Assessing the Natura 2000 network with a commonbreeding birds surveyV. Pellissier1,2, J. Touroult2, R. Julliard1, J. P. Siblet2 & F. Jiguet1
1 UMR 7204 MNHN-CNRS-UPMC, CERSP, Muséum National d’Histoire Naturelle, Paris, France2 SPN, Muséum National d’Histoire Naturelle, Paris, France
Keywords
Natura 2000; common species abundances;breeding bird survey; habitat specialization;temporal trends.
Correspondence
Vincent Pellissier, UMR 7204MNHN-CNRS-UPMC, CERSP,Muséum National d’Histoire Naturelle,55 rue Buffon, 75005 Paris, France.Tel: +33 (0)1 40 79 57 63Email: [email protected]
Editor: Darren EvansAssociate Editor: Karl Evans
Received 5 June 2012; accepted 14 January2013
doi:10.1111/acv.12030
AbstractNatura 2000 (N2000) is a network of European sites focused on the conservationof specific species and habitats. Despite the known importance of common bio-diversity in ecosystem functioning, common species are currently not explicitlytargeted by conservation initiatives in France. In this study, we investigatedwhether the N2000 network contributes to the protection of common breedingbird species. In particular, we focused on species abundance and species speciali-zation, community specialization and community trophic levels. We also deter-mined the effects of N2000 on temporal trends of specialist and generalist birdgroups. We studied 100 species in 1461 plots monitored by the French BreedingBird Survey (BBS) between 2001 and 2010. We found that species abundanceincreased for 54 species with the proportion of the plot covered by N2000 areas inthe plot. The bird species with the abundances that were most influenced byproportion of the plot covered by N2000 areas were predominantly habitat spe-cialists. Bird communities inside N2000 sites were more specialized and exhibitedhigher trophic indices than communities outside N2000 sites. We found no differ-ences in the temporal trends of farmland and woodland birds inside and outsideN2000 sites, but the temporal trend of generalist species was positive outsideN2000 sites and stable inside. We concluded that N2000 sites showed greaterabundance of a majority of common bird species but that the network wasestablished too recently to assess its influence on population trends. The FrenchBBS has proved to be an efficient tool in assessing protected area networks.
Introduction
The establishment and management of statutory protectedareas are widely regarded as key strategies for ensuring thelong-term preservation of biodiversity (Jackson, Evans &Gaston, 2009). This classic protection approach is based onthe principle of setting aside areas to protect habitat, speciesand/or populations that are threatened elsewhere (Gastonet al., 2008).
In addition to the establishment of the National NatureReserves, National Parks and Local Nature Reserves, whichare established by member states, the European Unionhas coordinated the implementation of the Natura 2000(N2000) network. The N2000 network is based on the BirdsDirective of the European Union (79/409/EEC, amended2009: 2009/147/EC) and the Habitats Directive of the Euro-pean Union (92/43/EEC, consolidated 2007). This network,which is the most important European conservation effortin terms of spatial coverage, is targeted at maintainingthreatened habitats and species listed in the annexes of theDirectives (Annex I of the Birds Directive and Annexes Iand II of the Habitats Directive) as having ‘favourable con-
servation status’ (European Commission, 2000). Since 1986,1753 areas have been designated as part of the N2000network in France, representing c. 12.5% of France’s conti-nental territory (see Supporting Information Appendix S1for a more detailed description of the network in France). InFrance, the designation phase has ended for terrestrial sites,meaning that all terrestrial areas in the network have beenidentified based on the presence of species or habitats listedin the Directive annexes. France chooses to manage itsN2000 sites through contracts (called Natura 2000 con-tracts) between the land owner and the state. Farmlandcontracts are agro-environment schemes, while owners ofnon-agricultural lands receive incentives from the state toimplement measures that favour biodiversity, as defined inindividual contracts. Additionally, land owners receive taxexemptions if they sign a formal agreement to implementingbest management practices on the land. However, only halfof all the sites have management plans to date (Debain,2011), and management only began to be implemented in2005. Therefore, the N2000 project provides an opportunityto assess the status of biodiversity within a network of pro-tected areas at the time of establishment of the project. As
bs_bs_banner
Animal Conservation. Print ISSN 1367-9430
Animal Conservation •• (2013) ••–•• © 2013 The Zoological Society of London 1

Kleijn & van Zuijlen (2004) noted, observed differences inbiodiversity between protected and non-protected areasmay result either from the initial status of biodiversity orfrom protection efficiency per se. Thus, assessing the initialstatus of biodiversity in N2000 areas has important impli-cations for future evaluation of the network.
Declines in common species could have important evolu-tionary and ecological consequences because they maydisrupt food webs and other ecosystem structures andmodify macro-ecological patterns or ecosystem functions(Gaston, 2011). Nevertheless, such measures as high naturevalue farming or agro-environmental schemes may effec-tively favour common species (Doxa et al., 2010, 2012).Devictor et al. (2007) also showed that common bird speciesbenefited from protection measures focused on other targetspecies but did not address the importance of site designa-tion for biodiversity protection.
In addition, the N2000 network was designed to protectspecific target species, despite the fact that the Birds Direc-tive requests member states to protect all wild bird specieslegally, including common bird species, occurring in theirnational territories and to evaluate the effectiveness of thenetwork for conserving all of these species. Therefore,there is interest in knowing whether the N2000 networkhas the potential to fulfil the requirements of the EuropeanCommission. If common non-target species are moreabundant inside the network than outside, that findingwould indicate that the network could protect commonspecies.
In France, common woodland and farmland birds aredeclining, while the populations of common generalist birdspecies are increasing (Jiguet et al., 2012). Therefore, toevaluate the initial status of biodiversity in the N2000network, it is important to know if common species groups(farmland, woodland and generalist birds) have differenttrends within the designated network areas compared toareas not selected for inclusion in the network. Additionally,indices at the community level (specifically the CommunitySpecialization and Bird Trophic Indices) are good indica-tors of the functionality of ecosystems (Jiguet et al., 2012;Mouysset, Doyen & Jiguet, 2012). Given that bird commu-nities are becoming less specialized throughout Europe (LeViol et al., 2012), it is important to compare these indicesinside and outside of N2000 areas.
In this paper, we used data for the most common birdspecies in France to evaluate (1) whether the designation ofN2000, that is, the identification of areas for the protectionof bird target species, also favours common breeding birdsat both the population (abundance) and community levelsand (2) whether the population trends of groups of wood-land, farmland and generalist bird species differ inside andoutside of the N2000 network (urban specialist birds werenot included in the study because of the near absence ofurban areas within the N2000 network). We first measuredthe response of each species and community to the coverageof N2000 areas in the sampling plots. Next, we assessed thetemporal trends of a subset of these species inside andoutside the N2000 network.
Materials and methods
Data collection
The bird data used in this study came from the FrenchBreeding Bird Survey (BBS) based on a standardized moni-toring methodology (Jiguet et al., 2012). Censuses of breed-ing birds were carried out each spring by skilled observers atrandomly selected sites in continental France (Fig. 1). Atotal of 1574 sites (2 ¥ 2-km plots) were surveyed at leasttwice between 2001 and 2010 (Table 1). At 10 samplingpoints that were evenly distributed throughout each plot,every individual seen or heard was recorded for exactly5 min. There were two sampling periods in the spring,occurring before and after 8 May to record both early andlate breeders, with a 4–6-week gap between the two surveys.
Figure 1 Spatial distribution of the French Breeding Survey plots.Each dot represents a 2 ¥ 2-km plot monitored at least once between2001 and 2010. Plots are indicated as being inside Natura 2000 if theproportion of N2000 coverage exceeds 50% of the plot.
Table 1 Contingency table of the total number of surveys per plot
Number of survey per square Number of squares surveyed
1 3412 2743 3204 1755 1748 1827 1388 1459 128
10 28
Assessing Natura 2000 with a common breeding birds survey V. Pellissier et al.
2 Animal Conservation •• (2013) ••–•• © 2013 The Zoological Society of London

For each monitoring plot, the relative abundance of eachbreeding bird species was calculated as follows. First, themaximum number of individuals recorded at each of the 10points during the first or the second survey was retained foreach species and each year. These maximum values were ameasure of the relative abundance of each species at eachpoint. The sum of the maximum values for all points in theplot represented the yearly local relative abundance for thatplot.
After excluding water birds because their preferred habi-tats did not have sufficient survey coverage by the FrenchBBS (Devictor et al., 2008), we retained data for the mostabundant species, that is, species that occurred at least 100times during the 10 years of survey. We retained 100 speciesin our dataset (approximately one-third of the species thatregularly breed in France), which represented 98% of theindividual birds present in France during the breedingseason (in 2004, 110 species represented 99% of the individu-als; Devictor et al., 2008).
For each species included in the study, plots where thespecies was never recorded in the survey were removed fromthe study to avoid the interpretation of the data from theseplots as false absences of the species (i.e. data recording theabsence of a species where the species was actually present),which could create problems in the interpretation of theresults (see Supporting Information Appendix S2 for thedata retained for each species).
The data used in this study were uncorrected raw counts.Issues were raised regarding potential biases introduced bythe high heterogeneity in detectability that can occur withraw count data. Devictor & Robert (2009) argued that rawvalues are suitable for computing community indices andArchaux, Henry & Gimenez (2012) suggested that increas-ing the number of sub-replicates per replicate (such as in ourcase, with 10 count points per plot) could compensate forthe lack of a distance sampling approach. Thus, we con-cluded that when using monitoring data, uncorrected rawvalues are valuable for identifying any ‘designation effect’.
Because other protection measures might influence birdabundances in the study area (Devictor et al., 2007;Maiorano et al., 2007), we selected only the BBS plots thatdid not have any other protection status (i.e. NatureReserve, National Park, Biosphere Reserve, Local Protec-tion Measures or Integral Biological Reserve status) toavoid confounding effects. We removed from our datasetthe 34 plots containing sites with additional protectionstatus as described above, regardless of the presence orabsence of N2000 sites in the plots.
A broad habitat type for each plot was defined based onthe Corine Land Cover 2006 habitat type (urban, farmland,woodland, wetland or open water) that covered more than50% of the plot. Because we wanted to avoid landscapeswith mixed land use (which could make it difficult toaccount for habitat type in the analyses), we removed all 79plots in which the most abundant habitat type covered lessthan 50% of the plot.
The analyses were performed on a dataset containing atotal of 1461 plots.
Species-specific variations of abundance
We tested whether areas belonging to the N2000 networkhad a greater abundance of each of the most commonspecies (i.e. a ‘designation effect’). We used generalizedlinear mixed models (GLMMs) with the abundance of eachspecies as the dependent variable, the proportion of N2000coverage in each BBS plot as an independent quantitativevariable and habitat type of the BBS plot as a covariate.These models assumed a negative-binomial response and alog link. Survey year was added as a random effect tocorrect for potential temporal variation in the speciespopulations. To account for spatial autocorrelation, weadded a distance-weighted auto-covariate term (Augustin,Mugglestone & Buckland, 1996). To check whether thisterm properly accounted for autocorrelation at differentspatial scales, as recommended by Lichstein et al. (2002), wecompared the Moran’s Index of the residuals to a null dis-tribution to assess the probability of observing greatervalues of I. (see Supporting Information Appendix S3 formore details on the methods and results).
To test the relationship between the response of birdspecies to N2000 coverage and their habitat specialization,we used a generalized additive model (GAM) with the esti-mate relationship between the N2000 coverage and speciesabundance as the dependent variable and the Species Spe-cialization Index (SSI; Julliard et al., 2006) as an independ-ent variable. The SSI was estimated by Julliard et al. (2006),for each species, as the coefficient of variation of the abun-dance across 18 habitat categories. To account for variationin the precision of the estimate of the species response toN2000 among the different bird species, we weighted eachestimate with the inverse of its variance.
To estimate the explanatory power of the models, wecomputed a Pearson’s correlation between the observed andfitted values for each of the two model types.
Bird community indices
We computed, for each year and each plot, two local com-munity indices that were independent of species richness:(1) The Community Specialization Index (CSI, SupportingInformation Appendix S2; Julliard et al., 2006), a measureof the average degree of habitat specialization of a localbird community, defined as the mean of the SSI of thecensused species weighted by the abundances. The CSIallows for discrimination between generalist and specializedcommunities.(2) The Bird Trophic Index (BTI, Supporting InformationAppendix S2), a measure of the average trophic level of alocal bird community (Mouysset et al., 2012). To computethis index, we estimated the proportion of plant, inverte-brate and vertebrate items in each bird species’ diet as avail-able from BWPi (2006). The species trophic index wasdefined as the exponential of the weighted mean of the dietitem proportion values using weight values of 1, 2 and 3 forplant, invertebrate and vertebrate items, respectively. Theavian diet changes throughout the year and throughout an
V. Pellissier et al. Assessing Natura 2000 with a common breeding birds survey
Animal Conservation •• (2013) ••–•• © 2013 The Zoological Society of London 3
individual’s life cycle. The diet data used were averageannual data, which means that the classification was madeusing the diets of both juveniles and adults and the diet ofthe species across all the year. Weighting coefficients areapplied to take the changes in diet into account. Forinstance, if a species is granivorous when adult and duringthe non-breeding season, but switch to an insect diet during10% of the year to feed the juvenile, the index will considerthat this particular species eats 90% of invertebrate and not100%. The use of the exponential values, rather than the rawvalues, allowed for easier identification of communities witha higher number of top consumers. The index might appearto be a notably coarse measure of trophic levels becausebirds that eat invertebrates might, in certain cases, occupythe same trophic level as birds that eat vertebrates.However, birds that eat other vertebrates are less likely to beprey (in our dataset, the birds with the highest trophic indexwere all top consumers), whereas birds that eat invertebratesare more likely to be second or third consumers. Therefore,the index seems to be a good indicator of the position of aspecies in a simple food chain.
The effects of N2000 coverage on these indices wereevaluated using generalized additive mixed models(GAMMs) with N2000 coverage as an independent vari-able, broad habitat class as a covariate and year as a randomeffect. The models were smoothed using a spline regressionfunction with no limitation on the number of degrees offreedom. The goodness of fit of each model was evaluatedusing the built-in pseudo-R2 of the gamm function of themgcv package (Wood, 2011) of R statistical software (RDevelopment Core Team, 2011).
Temporal trends of specialist birds
Our objective was to analyze differences in temporal trendsfor farmland and woodland specialists and generalist birds.To regroup the species according to their habitat specializa-tion (or the lack of thereof for generalist birds), we used thelists of birds in Gregory et al. (2005) to compute the Euro-pean Farmland and Woodland Bird Indicators, adapted forFrance (20 and 21 species, respectively) and a list of the 14most generalist species (used by the French NationalMuseum of Natural History to monitor the trends of gen-eralist birds; Jiguet et al., 2012, and see Supporting Infor-mation Appendix S4 for the list of species for each group).
Potential differences in temporal trends for the speciesgroups were assessed as follows.
First, we defined N2000 plots as plots for which the centreof the plot and more than 50% of the plot’s surface area wasoverlapping with N2000 sites. In this analysis, we were inter-ested in the dichotomy between protected and unprotectedsites; therefore, we did not use a continuous metric, such asthe one used in the previous analyses of the communityindices. As the control group, we selected all plots outsidethe N2000 network that were within 15 km of a N2000 plot.
Second, we derived species population trends (averagepopulation growth rate) for each species using a log-linearmodel with year as a continuous variable, habitat type as a
categorical covariate and plot identifier as a random vari-able (Jiguet et al., 2012). The estimate of year effect in themodels was considered the population growth rate of aspecies. Growth rates were computed for each of the farm-land, woodland and generalist bird species for all plotsinside and outside the N2000 network.
Third, we tested for differences in trends between sitesclassified as inside or outside the N2000 network for each ofthe three species groups by using GLMMs with the trendsfor individual species as the explained variable, N2000status (inside vs. outside) as a categorical variable andspecies name as a random variable.
All statistical analyses were carried out using R 2.14.0 (RDevelopment Core Team, 2011) with the nlme (Pinheiroet al., 2011) and MASS (Venables & Ripley, 2002) packagesfor the GLMMs and the mgcv package (Wood, 2011) forthe GAMs and GAMMs.
Results
Species-specific responses
Of the 100 species considered, 54 species showed anincreased abundance with increased N2000 coverage as aproportion of plot area (P < 0.05) of which 11 were farm-land specialists, nine were woodland specialists and fivewere habitat generalists (representing 55, 43 and 35% of thefarmland, woodland and generalist species, respectively).Six species decreased in abundance, of which two were farm-land species, one was a woodland species and one was ageneralist species (10, 5 and 7% of the farmland, woodlandand generalist species, respectively). There was no signifi-cant effect of N2000 coverage for the remaining 40 species.The mean (�sd) Pearson correlation between the observedand fitted values was r = 0.23 � 0.14. The correlation wasr = 0.23 � 0.14 for species with a significant positiveresponse to N2000 and r = 0.28 � 0.18 for species with asignificant negative response. Woodland species hadr = 0.35 � 0.09, r = 0.16 � 0.11 for farmland species andr = 0.23 � 0.14 for generalist species (see SupportingInformation Appendix S2 for correlation coefficientsper species).
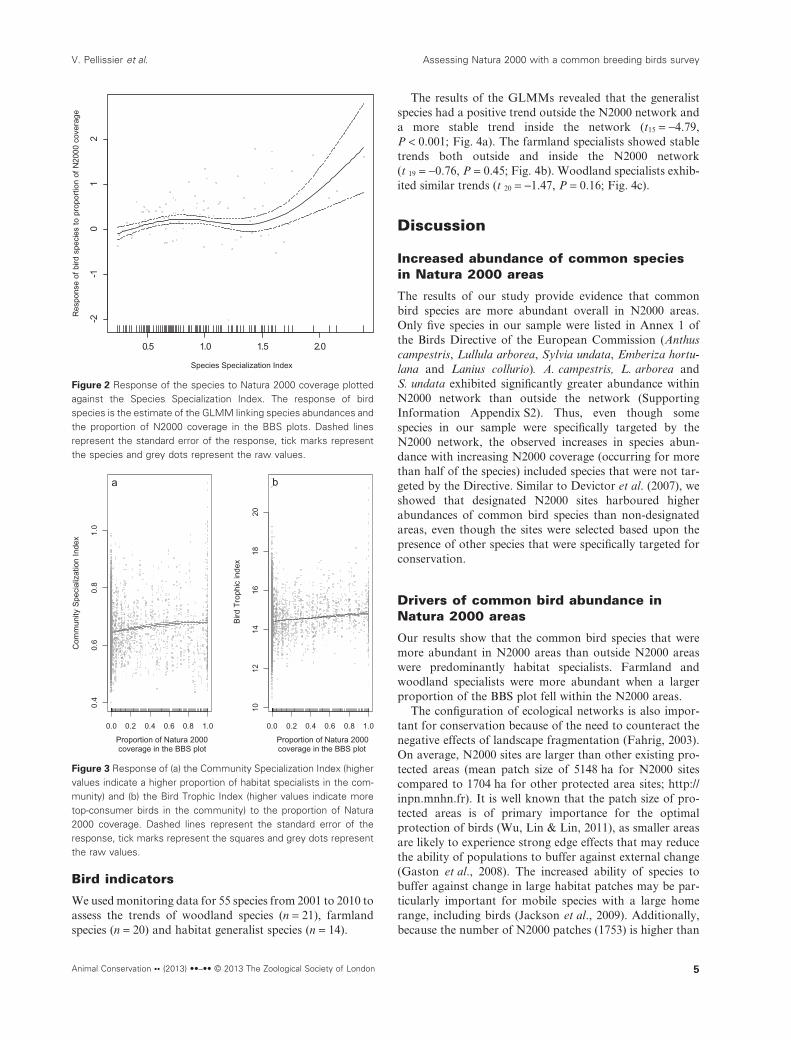
There was a significant positive relationship betweenspecies response to the N2000 coverage and habitat speciali-zation (SSI; Pearson r = 0.93, F3.4,92 = 3.13, P = 0.002;Fig. 2).
Community indices
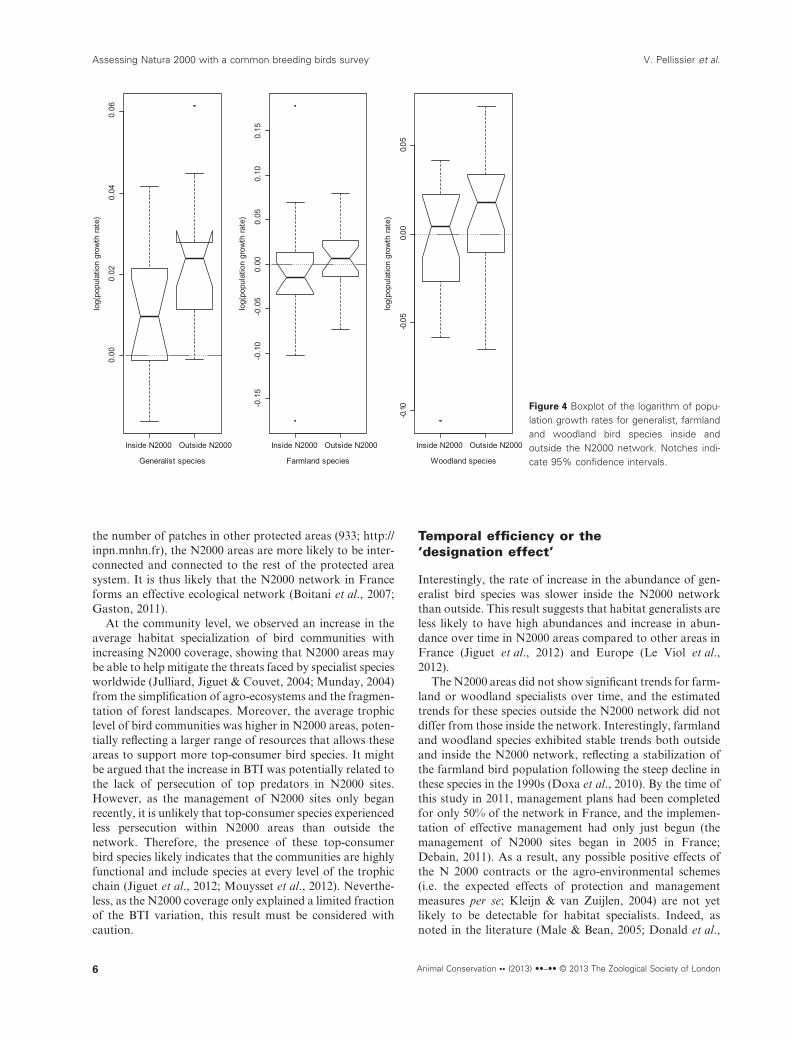
In the analysis of the effects of N2000 coverage on commu-nity indices, we found a positive relationship between theCSI and proportion of N2000 coverage (F2,7270 = 74.15,P < 0.001, pseudo-R2 = 0.14; Fig. 3a). The BTI exhibited apositive linear relationship with the proportion of N2000coverage (F1,7270 = 98.16, P < 0.001, pseudo-R2 = 0.06;Fig. 3b).
Assessing Natura 2000 with a common breeding birds survey V. Pellissier et al.
4 Animal Conservation •• (2013) ••–•• © 2013 The Zoological Society of London
Bird indicators
We used monitoring data for 55 species from 2001 to 2010 toassess the trends of woodland species (n = 21), farmlandspecies (n = 20) and habitat generalist species (n = 14).
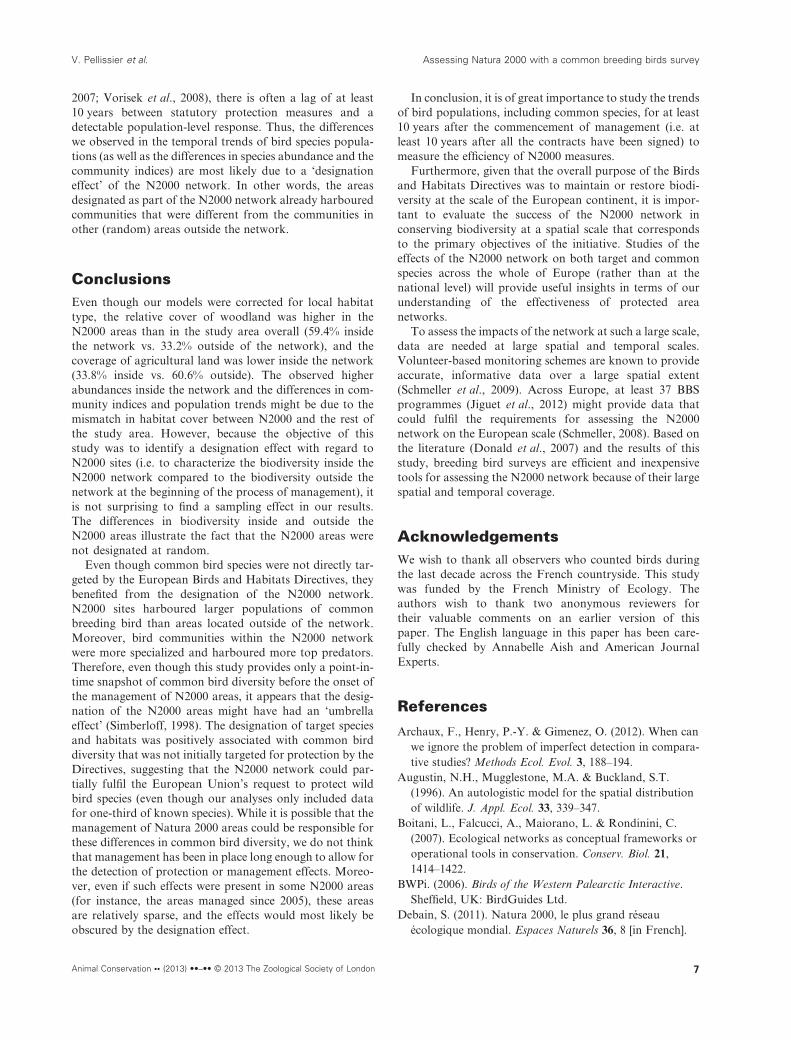
The results of the GLMMs revealed that the generalistspecies had a positive trend outside the N2000 network anda more stable trend inside the network (t15 = -4.79,P < 0.001; Fig. 4a). The farmland specialists showed stabletrends both outside and inside the N2000 network(t 19 = -0.76, P = 0.45; Fig. 4b). Woodland specialists exhib-ited similar trends (t 20 = -1.47, P = 0.16; Fig. 4c).
Discussion
Increased abundance of common speciesin Natura 2000 areas
The results of our study provide evidence that commonbird species are more abundant overall in N2000 areas.Only five species in our sample were listed in Annex 1 ofthe Birds Directive of the European Commission (Anthuscampestris, Lullula arborea, Sylvia undata, Emberiza hortu-lana and Lanius collurio). A. campestris, L. arborea andS. undata exhibited significantly greater abundance withinN2000 network than outside the network (SupportingInformation Appendix S2). Thus, even though somespecies in our sample were specifically targeted by theN2000 network, the observed increases in species abun-dance with increasing N2000 coverage (occurring for morethan half of the species) included species that were not tar-geted by the Directive. Similar to Devictor et al. (2007), weshowed that designated N2000 sites harboured higherabundances of common bird species than non-designatedareas, even though the sites were selected based upon thepresence of other species that were specifically targeted forconservation.
Drivers of common bird abundance inNatura 2000 areas
Our results show that the common bird species that weremore abundant in N2000 areas than outside N2000 areaswere predominantly habitat specialists. Farmland andwoodland specialists were more abundant when a largerproportion of the BBS plot fell within the N2000 areas.
The configuration of ecological networks is also impor-tant for conservation because of the need to counteract thenegative effects of landscape fragmentation (Fahrig, 2003).On average, N2000 sites are larger than other existing pro-tected areas (mean patch size of 5148 ha for N2000 sitescompared to 1704 ha for other protected area sites; http://inpn.mnhn.fr). It is well known that the patch size of pro-tected areas is of primary importance for the optimalprotection of birds (Wu, Lin & Lin, 2011), as smaller areasare likely to experience strong edge effects that may reducethe ability of populations to buffer against external change(Gaston et al., 2008). The increased ability of species tobuffer against change in large habitat patches may be par-ticularly important for mobile species with a large homerange, including birds (Jackson et al., 2009). Additionally,because the number of N2000 patches (1753) is higher than
0.5 1.0 1.5 2.0
-2-1
01
2
Species Specialization Index
Response o
f bird s
pecie
s t
o p
roport
ion o
f N
2000 c
overa
ge
Figure 2 Response of the species to Natura 2000 coverage plottedagainst the Species Specialization Index. The response of birdspecies is the estimate of the GLMM linking species abundances andthe proportion of N2000 coverage in the BBS plots. Dashed linesrepresent the standard error of the response, tick marks representthe species and grey dots represent the raw values.
0.0 0.2 0.4 0.6 0.8 1.0
0.4
0.6
0.8
1.0
Com
munity S
pecia
lization I
ndex
Proportion of Natura 2000
coverage in the BBS plot
a
0.0 0.2 0.4 0.6 0.8 1.0
10
12
14
16
18
20
Bird T
rophic
index
Proportion of Natura 2000
coverage in the BBS plot
b
Figure 3 Response of (a) the Community Specialization Index (highervalues indicate a higher proportion of habitat specialists in the com-munity) and (b) the Bird Trophic Index (higher values indicate moretop-consumer birds in the community) to the proportion of Natura2000 coverage. Dashed lines represent the standard error of theresponse, tick marks represent the squares and grey dots representthe raw values.
V. Pellissier et al. Assessing Natura 2000 with a common breeding birds survey
Animal Conservation •• (2013) ••–•• © 2013 The Zoological Society of London 5
the number of patches in other protected areas (933; http://inpn.mnhn.fr), the N2000 areas are more likely to be inter-connected and connected to the rest of the protected areasystem. It is thus likely that the N2000 network in Franceforms an effective ecological network (Boitani et al., 2007;Gaston, 2011).
At the community level, we observed an increase in theaverage habitat specialization of bird communities withincreasing N2000 coverage, showing that N2000 areas maybe able to help mitigate the threats faced by specialist speciesworldwide (Julliard, Jiguet & Couvet, 2004; Munday, 2004)from the simplification of agro-ecosystems and the fragmen-tation of forest landscapes. Moreover, the average trophiclevel of bird communities was higher in N2000 areas, poten-tially reflecting a larger range of resources that allows theseareas to support more top-consumer bird species. It mightbe argued that the increase in BTI was potentially related tothe lack of persecution of top predators in N2000 sites.However, as the management of N2000 sites only beganrecently, it is unlikely that top-consumer species experiencedless persecution within N2000 areas than outside thenetwork. Therefore, the presence of these top-consumerbird species likely indicates that the communities are highlyfunctional and include species at every level of the trophicchain (Jiguet et al., 2012; Mouysset et al., 2012). Neverthe-less, as the N2000 coverage only explained a limited fractionof the BTI variation, this result must be considered withcaution.
Temporal efficiency or the‘designation effect’
Interestingly, the rate of increase in the abundance of gen-eralist bird species was slower inside the N2000 networkthan outside. This result suggests that habitat generalists areless likely to have high abundances and increase in abun-dance over time in N2000 areas compared to other areas inFrance (Jiguet et al., 2012) and Europe (Le Viol et al.,2012).
The N2000 areas did not show significant trends for farm-land or woodland specialists over time, and the estimatedtrends for these species outside the N2000 network did notdiffer from those inside the network. Interestingly, farmlandand woodland species exhibited stable trends both outsideand inside the N2000 network, reflecting a stabilization ofthe farmland bird population following the steep decline inthese species in the 1990s (Doxa et al., 2010). By the time ofthis study in 2011, management plans had been completedfor only 50% of the network in France, and the implemen-tation of effective management had only just begun (themanagement of N2000 sites began in 2005 in France;Debain, 2011). As a result, any possible positive effects ofthe N 2000 contracts or the agro-environmental schemes(i.e. the expected effects of protection and managementmeasures per se; Kleijn & van Zuijlen, 2004) are not yetlikely to be detectable for habitat specialists. Indeed, asnoted in the literature (Male & Bean, 2005; Donald et al.,
Inside N2000 Outside N2000
0.0
60.0
40.0
20.0
0
Generalist species
log(p
opula
tion g
row
th r
ate
)
Inside N2000 Outside N2000
-0.1
5-0
.10
-0.0
50.0
00.0
50.1
00.1
5
Farmland species
log(p
opula
tion g
row
th r
ate
)
Inside N2000 Outside N2000
50.0
00.0
50 .0-
01 .0-
Woodland species
log(p
opula
tion g
row
th r
ate
)
Figure 4 Boxplot of the logarithm of popu-lation growth rates for generalist, farmlandand woodland bird species inside andoutside the N2000 network. Notches indi-cate 95% confidence intervals.
Assessing Natura 2000 with a common breeding birds survey V. Pellissier et al.
6 Animal Conservation •• (2013) ••–•• © 2013 The Zoological Society of London
2007; Vorisek et al., 2008), there is often a lag of at least10 years between statutory protection measures and adetectable population-level response. Thus, the differenceswe observed in the temporal trends of bird species popula-tions (as well as the differences in species abundance and thecommunity indices) are most likely due to a ‘designationeffect’ of the N2000 network. In other words, the areasdesignated as part of the N2000 network already harbouredcommunities that were different from the communities inother (random) areas outside the network.
ConclusionsEven though our models were corrected for local habitattype, the relative cover of woodland was higher in theN2000 areas than in the study area overall (59.4% insidethe network vs. 33.2% outside of the network), and thecoverage of agricultural land was lower inside the network(33.8% inside vs. 60.6% outside). The observed higherabundances inside the network and the differences in com-munity indices and population trends might be due to themismatch in habitat cover between N2000 and the rest ofthe study area. However, because the objective of thisstudy was to identify a designation effect with regard toN2000 sites (i.e. to characterize the biodiversity inside theN2000 network compared to the biodiversity outside thenetwork at the beginning of the process of management), itis not surprising to find a sampling effect in our results.The differences in biodiversity inside and outside theN2000 areas illustrate the fact that the N2000 areas werenot designated at random.
Even though common bird species were not directly tar-geted by the European Birds and Habitats Directives, theybenefited from the designation of the N2000 network.N2000 sites harboured larger populations of commonbreeding bird than areas located outside of the network.Moreover, bird communities within the N2000 networkwere more specialized and harboured more top predators.Therefore, even though this study provides only a point-in-time snapshot of common bird diversity before the onset ofthe management of N2000 areas, it appears that the desig-nation of the N2000 areas might have had an ‘umbrellaeffect’ (Simberloff, 1998). The designation of target speciesand habitats was positively associated with common birddiversity that was not initially targeted for protection by theDirectives, suggesting that the N2000 network could par-tially fulfil the European Union’s request to protect wildbird species (even though our analyses only included datafor one-third of known species). While it is possible that themanagement of Natura 2000 areas could be responsible forthese differences in common bird diversity, we do not thinkthat management has been in place long enough to allow forthe detection of protection or management effects. Moreo-ver, even if such effects were present in some N2000 areas(for instance, the areas managed since 2005), these areasare relatively sparse, and the effects would most likely beobscured by the designation effect.
In conclusion, it is of great importance to study the trendsof bird populations, including common species, for at least10 years after the commencement of management (i.e. atleast 10 years after all the contracts have been signed) tomeasure the efficiency of N2000 measures.
Furthermore, given that the overall purpose of the Birdsand Habitats Directives was to maintain or restore biodi-versity at the scale of the European continent, it is impor-tant to evaluate the success of the N2000 network inconserving biodiversity at a spatial scale that correspondsto the primary objectives of the initiative. Studies of theeffects of the N2000 network on both target and commonspecies across the whole of Europe (rather than at thenational level) will provide useful insights in terms of ourunderstanding of the effectiveness of protected areanetworks.
To assess the impacts of the network at such a large scale,data are needed at large spatial and temporal scales.Volunteer-based monitoring schemes are known to provideaccurate, informative data over a large spatial extent(Schmeller et al., 2009). Across Europe, at least 37 BBSprogrammes (Jiguet et al., 2012) might provide data thatcould fulfil the requirements for assessing the N2000network on the European scale (Schmeller, 2008). Based onthe literature (Donald et al., 2007) and the results of thisstudy, breeding bird surveys are efficient and inexpensivetools for assessing the N2000 network because of their largespatial and temporal coverage.
AcknowledgementsWe wish to thank all observers who counted birds duringthe last decade across the French countryside. This studywas funded by the French Ministry of Ecology. Theauthors wish to thank two anonymous reviewers fortheir valuable comments on an earlier version of thispaper. The English language in this paper has been care-fully checked by Annabelle Aish and American JournalExperts.
References
Archaux, F., Henry, P.-Y. & Gimenez, O. (2012). When canwe ignore the problem of imperfect detection in compara-tive studies? Methods Ecol. Evol. 3, 188–194.
Augustin, N.H., Mugglestone, M.A. & Buckland, S.T.(1996). An autologistic model for the spatial distributionof wildlife. J. Appl. Ecol. 33, 339–347.
Boitani, L., Falcucci, A., Maiorano, L. & Rondinini, C.(2007). Ecological networks as conceptual frameworks oroperational tools in conservation. Conserv. Biol. 21,1414–1422.
BWPi. (2006). Birds of the Western Palearctic Interactive.Sheffield, UK: BirdGuides Ltd.
Debain, S. (2011). Natura 2000, le plus grand réseauécologique mondial. Espaces Naturels 36, 8 [in French].
V. Pellissier et al. Assessing Natura 2000 with a common breeding birds survey
Animal Conservation •• (2013) ••–•• © 2013 The Zoological Society of London 7
Devictor, V., Godet, L., Julliard, R., Couvet, D. & Jiguet,F. (2007). Can common species benefit from protectedareas? Biol. Conserv. 139, 29–36.
Devictor, V., Julliard, J., Clavel, J., Jiguet, F., Lee, A. &Couvet, D. (2008). Functional biotic homogenization ofbird communities in disturbed landscapes. Glob. Ecol.Biogeogr. 17, 252–261.
Devictor, V. & Robert, A. (2009). Measuring communityresponses to large-scale disturbance in conservation bio-geography. Divers. Disrib. 15, 122–130.
Donald, P.F., Sanderson, F.J., Burfield, I.J., Bierman, S.M.,Gregory, R.D. & Waliczky, Z. (2007). International con-servation policy delivers benefits for birds in Europe.Science 317, 810–813.
Doxa, A., Bas, Y., Paracchini, M.L., Pointereau, P., Terres,J.-M. & Jiguet, F. (2010). Low-intensity agricultureincreases farmland bird abundances in France. J. Appl.Ecol. 47, 1348–1356.
Doxa, A., Paracchini, M.L., Pointereau, P., Devictor, V. &Jiguet, F. (2012). Preventing biotic homogenizationof farmland bird communities: the role of HighNature Value farmland. Agric. Ecosyst. Environ. 148,83–88.
European Commission. (2000). Managing Natura 2000 sites:The provisions of Article 6 of the ‘Habitats’ Directive92/43/EEC. Luxembourg: Office for Official Publicationsof the European Communities.
Fahrig, L. (2003). Effects of habitat fragmentation on biodi-versity. Ann. Rev. Ecol. Evol. Syst. 34, 487–515.
Gaston, K.J. (2011). Common ecology. Bioscience 61, 354–362.
Gaston, K.J., Jackson, S.E., Nagy, A., Cantu-Salazar, L. &Johnson, M. (2008). Protected areas in Europe – princi-ple and practice. Ann. N. Y. Acad. Sci. 1134, 97–119.
Gregory, R.D., van Strien, A., Vorisek, P., Meyling,A.W.G., Noble, D.G., Foppen, R.P.B. & Gibbons, D.W.(2005). Developing indicators for European birds. Philos.Trans. R. Soc. B 360, 269–288.
Jackson, S.F., Evans, K.L. & Gaston, K.J. (2009). Statutoryprotected areas and avian species richness in Britain. Bio-divers. Conserv. 18, 2143–2151.
Jiguet, F., Devictor, V., Julliard, R. & Couvet, D. (2012).French citizens monitoring ordinary birds provide toolsfor conservation and ecological sciences. Acta Oecol. 44,58–66.
Julliard, R., Jiguet, F. & Couvet, D. (2004). Common birdsfacing global changes: what makes a species at risk? Glob.Change Biol. 10, 148–154.
Julliard, R., Clavel, J., Devictor, V., Jiguet, F. & Couvet,D. (2006). Spatial segregation of specialists and general-ists in bird communities. Ecol. Lett. 9, 1237–1244.
Kleijn, D. & van Zuijlen, G.J.C. (2004). The conservationeffects of meadow bird agreements on farmland inZeeland, The Netherlands, in the period 1989–1995. Biol.Conserv. 117, 443–451.
Le Viol, I., Jiguet, F., Brotons, L., Herrando, S., Lind-ström, Å., Pearce-Higgins, J., Reif, J., Van Turnhout, C.& Devictor, V. (2012). More and more generalists: twodecades of changes in European avifauna. Biol. Lett. 8,780–782.
Lichstein, J., Simons, T.R., Shriner, S.A. & Franzreb, K.E.(2002). Spatial autocorrelation and autoregressive modelsin ecology. Ecol. Monogr. 72, 445–463.
Maiorano, L., Falcucci, A., Garton, E.O. & Boitani, L.(2007). Contribution of the Natura 2000 network to bio-diversity conservation in Italy. Conserv. Biol. 21, 1433–1444.
Male, T.D. & Bean, M.J. (2005). Measuring progress inUS endangered species conservation. Ecol. Lett. 8, 986–992.
Mouysset, L., Doyen, L. & Jiguet, F. (2012). Ecologicalresponses to economic public agricultural policies in theFrench farmlands. Ecol. Indic. 14, 209–221.
Munday, P.L. (2004). Habitat loss, resource specialization,and extinction on coral reefs. Glob. Change Biol. 10,1642–1647.
Pinheiro, J., Bates, D., DebRoy, S., Sarkar, D. & R Devel-opment Core Team. (2011). nlme: Linear and NonlinearMixed Effects Models. R package version 3.1-102.
R Development Core Team. (2011). R: A language and envi-ronment for statistical computing. Vienna: R Foundationfor Statistical Computing. ISBN 3-900051-07-0.
Schmeller, D.S. (2008). European species and habitat moni-toring: where are we now? Biodivers. Conserv. 17, 3321–3326.
Schmeller, D.S., Henry, P.Y., Julliard, R., Gruber, B.,Clobert, J., Dziock, F., Lengyel, S., Nowicki, P., Déri,E., Budrys, E., Kull, T., Tali, K., Bauch, B., Settele, J.,Van Swaay, C., Kobler, A., Babij, V., Papastergiadou, E.& Henle, K. (2009). Advantages of volunteer-based bio-diversity monitoring in Europe. Conserv. Biol. 23, 307–316.
Simberloff, D. (1998). Flagships, umbrellas, and keystones:is single-species management passe in the landscape era?Biol. Conserv. 83, 247–257.
Venables, W.N. & Ripley, B.D. (2002). Modern applied sta-tistics with S. 4th edn. New York: Springer.
Vorisek, P., Reif, J., Stastny, K. & Bejcek, V. (2008). Howeffective can be the national law in protecting birds? Acase study from the Czech Republic. Folia Zool. 57, 221–230.
Wood, S.N. (2011). Fast stable restricted maximumlikelihood and marginal likelihood estimation of semi-parametric generalized linear models. J. R. Stat. Soc. B73, 3–36.
Wu, C.-F., Lin, Y.-P. & Lin, S.-H. (2011). A hybrid schemefor comparing the effects of bird diversity conservationapproaches on landscape patterns and biodiversity in theShangan sub-watershed in Taiwan. J. Environ. Manage.92, 1809–1820.
Assessing Natura 2000 with a common breeding birds survey V. Pellissier et al.
8 Animal Conservation •• (2013) ••–•• © 2013 The Zoological Society of London

Supporting informationAdditional Supporting Information may be found in theonline version of this article at the publisher’s web-site:
Figure S1. Location of the 384 Special Protection Areas(SPA) in France.Figure S2. Location of the 1369 Sites of Community Interest(SCI) to be designated as Special Areas for Conservation bythe European Union.Table S1. Species response to the Natura 2000 ratio (meanestimate, S.E. within brackets) and associated P-values. SSIand STI represent the species specialization and the speciestrophic indices. The last two columns represent the number
of data kept in each species-specific model and the numberof occurrences in this new dataset.Table S2. Number of distance lag for which a positive, sig-nificant spatial autocorrelation is found, in the raw data andin the residuals of the models.Appendix S1. Description of the Natura 2000 network inFrance.Appendix S2. Specific responses to Natura 2000 and valuesof the SSI and the STI for each species.Appendix S3. Assessment of the remaining spatial autocor-relation (after Lichstein et al., 2002).Appendix S4. List of species being generalist, farmland andwoodland specialists.
V. Pellissier et al. Assessing Natura 2000 with a common breeding birds survey
Animal Conservation •• (2013) ••–•• © 2013 The Zoological Society of London 9