Embed Size (px)
Citation preview

sustainability
Article
Assessing the Impacts of Higher EducationInstitutions on Sustainable Development—AnAnalysis of Tools and Indicators
Florian Findler 1,*, Norma Schönherr 1, Rodrigo Lozano 2 and Barbara Stacherl 1
1 Institute for Managing Sustainability, WU Vienna University of Economics and Business, Welthandelsplatz 1,A-1020 Vienna, Austria; [email protected] (N.S.); [email protected] (B.S.)
2 Department of Industrial Development, IT and Land Management, University of Gävle, Kungsbäcksvägen47, SWE-80176 Gävle, Sweden; [email protected]
* Correspondence: [email protected]; Tel.: +43-1-31336-5133
Received: 31 October 2018; Accepted: 15 December 2018; Published: 22 December 2018
Abstract: Many higher education institutions (HEIs) have started to incorporate sustainabledevelopment (SD) into their system. A variety of sustainability assessment tools (SATs) have beendeveloped to support HEIs to systematically measure, audit, benchmark, and communicate SD efforts.In recent years, stakeholders have increasingly asked HEIs to demonstrate their impacts on SD. Theseimpacts are the direct and indirect effects an HEI has outside of its organizational boundaries onsociety, the natural environment, and the economy. This study analyzes to what extent SATs arecapable of measuring the impacts that HEIs have on SD. A mixed-method approach, using descriptivestatistics and an inductive content analysis, was used to examine 1134 indicators for sustainabilityassessment derived from 19 SATs explicitly designed for application by HEIs. The findings reveal thatSATs largely neglect the impacts HEIs have outside their organizational boundaries. SATs primarilyuse proxy indicators based on internally available data to assess impacts and thus tend to focus onthemes concerning the natural environment and the contribution to the local economy. Updatingexisting SATs and developing new ones may enable HEIs to fully realize their potential to contributeto SD.
Keywords: sustainable development; higher education; impacts; sustainability assessment;sustainability assessment tools; higher education institutions; sustainability indicators; sustainabilityreporting; education for sustainable development (ESD)
1. Introduction
Higher education institutions (HEIs) are increasingly acknowledged as a key driver for thedevelopment of sustainable societies [1]. Leveraging a unique set of skills, they act as transformativeagents by shaping the mindsets and values of future leaders in academia, business, and politics [2,3].The role of HEIs in achieving sustainable development (SD) was highlighted for the first time in the1972 Stockholm Declaration on the Human Environment [4]. Since then, HEIs and their stakeholdershave increasingly engaged in a number of global initiatives and expressed their commitment to SD in avariety of national and international declarations and charters [5]. Recent examples include the UnitedNations Higher Education Sustainability Initiative (UN HESI) and the UN Higher Education andResearch for Sustainable Development (HESD) platform. Both initiatives foster the implementation ofthe Sustainable Development Goals (SDGs), as part of a globally agreed policy agenda for SD, in highereducation [6,7].
In this context, HEIs have started to systematically assess and report their progress on theirSD commitments [8,9]. An increasing number of sustainability assessment tools (SATs) have been
Sustainability 2019, 11, 59; doi:10.3390/su11010059 www.mdpi.com/journal/sustainability
Sustainability 2019, 11, 59 2 of 19
developed to help HEIs in this endeavor [10,11]. SATs, in the broadest sense, can be understood asinstruments that provide HEIs with a systematic set of procedures and methods to measure, audit,benchmark, and communicate their SD efforts [12,13], including economic, environmental, social, andinter-linking issues in the entire HEI system.
The design of these SATs, as well as the experiences of HEIs using them, and their limitations,have been documented in the literature (e.g., References [10,14]). Previous studies show that the mostwidely adopted SATs have focused mainly on policies and activities inside the organization, such asenergy efficiency measures or measures to enhance sustainability literacy of students in educationalprograms (e.g., References [15,16]). Less emphasis has been placed on the impacts that HEIs actuallyhave on society, the natural environment, and the economy outside the organization, e.g., contributionto climate change mitigation or alumni sustainability lifestyles [17,18].
The assessment of impacts on SD is a complex endeavor because impacts materialize alongcomplex pathways, particularly in the area of research and education [19]. HEIs are often separatedin time and space from such impacts and affected stakeholder groups, and thus they rely on soundinstruments that support their assessment approaches. In addition, there is no universally agreeddefinition of “impact” in literature and practice. However, available studies agree on a numberof characteristics central to the term. Impacts on SD are generally understood to comprise directand indirect effects that an HEI has outside of its organizational boundaries on society, the naturalenvironment, and the economy [20]. They arise from the variety of activities inside the HEIs’ coreelements, notably education, research, campus operations, outreach, and campus experiences [17,21].
The last decade has seen increased attention to the impacts of SD among stakeholders, includingpublic and private funders, policy-makers, accreditation agencies, students, and faculty [22]. Whilean initial conceptual work on framing the multiple impacts of an HEI on SD has been proposed(see Reference [17]), the capability of SATs to provide systematic information on these impacts to meetaccountability expectations of stakeholders more fully is less explored.
This study analyzes the indicators for sustainability assessment of 19 SATs. More specifically,it elucidates to what extent these indicators measure SD performance (inside the organization) andimpacts on SD (outside the organization). The indicators that measure impacts on SD are furtheranalyzed to identify the specific SD impact areas and themes addressed. Finally, the extent to whichthese indicators are able to capture the complex pathways from HEIs activities to specific SD impacts,i.e., whether they are capable of capturing both direct and indirect impacts, is examined.
The remainder of this article is structured as follows: Section 2 provides an overview ofsustainability assessment and SATs in higher education and introduces the concept of impacts on SD;Section 3 describes the sample, the coding strategy, and the steps of the analysis; Section 4 presents theresults and Section 5 discusses them; and Section 6 concludes the study.
2. Literature Review
Sustainability assessment and reporting practices in HEIs have gained increasing importance [23].Consequently, a body of work dealing with sustainability assessment and reporting has developedwithin the wider literature on sustainability in higher education over the past decade [24].Sustainability assessment and reporting’s main objectives are: (1) Assessing organizations’ such asHEIs’ sustainability; (2) communicate it to its stakeholders; (3) benchmark against other organizations;(4) analyze how the organization affects and is affected by stakeholders; (5) assess and improvesustainability performance over time; and (6) plan the future direction of change towards SD inHEIs [25–28]. Despite the increasing amount of literature, in practice, sustainability assessment andreporting is still in a developmental stage [24,29].
Limitations of sustainability assessment and reporting in HEIs are the lack of a commonunderstanding of SD, insufficient assessment and reporting guidelines, and the additional resourcesand time that are required to gather and process data [9,28,30]. In addition, senior management in HEIs

Sustainability 2019, 11, 59 3 of 19
demonstrates low responsibility for SD and as a result senior managers do not sufficiently supportsustainability assessment and reporting practices [31].
2.1. Sustainability Assessment Tools in Higher Education
A number of SATs have been developed to facilitate sustainability assessment and reporting inpractice [10,11]. SATs are instruments that offer HEIs a systematic set of procedures and methods tomeasure, audit, benchmark, and communicate their SD efforts [12,13]. SATs also provide a basis fororganizational planning and strategy development [32] through operationalization and integration ofSD into all core elements [13,14].
SATs can use different assessment approaches. Dalal-Clayton and Bass [25] distinguish threemain approaches to sustainability assessment: Accounts, narrative, and indicators-based assessments.Accounts assessments draw on raw data, which is converted into a common unit (e.g., monetary, area,or energy). This high level of aggregation makes overall performance easily comparable. Narrativeassessments, in contrast, use texts, graphics, and tabular data. They are highly flexible and provide theopportunity to explore detailed and unstructured data of all kinds with the objective of developinga rich picture of SD impacts, including trade-offs and systemic interrelationships. Both kinds ofassessments have drawbacks; however, accounts assessments only cover select aspects of sustainability,and the high flexibility of narrative assessments entails limitations in transparency and consistency.Consequently, the usefulness of these approaches for monitoring, decision support, and strategydevelopment is limited [25,33]. Indicator-based assessment is considered the most useful approach toachieve measurable, transparent, and comparable results and thus serves as the foundation of mostSATs [34].
Indicators measure a specific aspect of SD (e.g., student sick days) that can be ascribed to awider attribute or characteristic of a system (e.g., student health) [35]. Indicators are formulatedin quantitative, quasi-quantitative, and qualitative terms [36]. Quantitative indicators measure, forexample, physical units; quasi-quantitative indicators are based on ratings (e.g., yes/no scores); andqualitative or descriptive indicators include text or also graphics [25]. Indicators can also be dividedinto direct and indirect (proxy) indicators based on how they measure the phenomena [36].
Available SATs range from simple compliance-oriented tools focusing on operations via contextualexplorative approaches to comprehensive approaches that allow interorganizational certification andbenchmarking [15]. Previous studies analyzed SATs in higher education based on their sets of indicatorsand supporting documents and case study applications (see Table 1). Overall, these studies concurthat SATs are still at an infant stage. The indicators that are used in these assessments focus mainly ongovernance issues and campus operations and to a large extent tend to neglect activities in research,education, and outreach (e.g., Reference [16]). In addition, the reviewed SATs have a strong focus on theenvironmental sustainability dimension neglecting social and economic issues (e.g., References [10,33]).

Sustainability 2019, 11, 59 4 of 19
Table 1. Previous studies of sustainability assessment tools in higher education.
Author(s) Tools Analyzed Methodology Main Findings
Shriberg (2002) [13]
n = 11AISHE, Campus Ecology, Environmental EMS Self-Assessment,Environmental Workbook and Report, Greening Campuses,Grey Pinstripes with Green Ties, Higher Education 21’sSustainability Indicators, Indicators Snapshot Guide,Performance Survey, SAQ, State of the Campus Environment
A content analysis with a focus on strengths andweaknesses of tools was conducted.
The tools vary greatly in their purpose,function, scope, and state of development.
Yarime & Tanaka (2012) [16]
n = 16AISHE, Campus Ecology, Campus Sustainability SelectedIndicators Snapshot, College Sustainability Report Card, CSAF,CSAF core, CSARP, EMS Self-Assessment, EnvironmentalWorkbook and Report, GASU, Good Company’s SustainablePathways Toolkit, HEPS, Penn State Indicator Report, SAQ,STARS, State of the Campus Environment
A mixed-method approach with a quantitativeand a qualitative part was applied: (1)comparative analysis of criteria and (2) contentanalysis of individual indicators.
The main focus of the tools is on campusoperations and governance issues. Education,research, and outreach are not well addressed.
Sayed et al. (2013) [37] n = 4SAQ, CSAF, CSRC, STARS
Each tool was rated based on 27 questions relatedto five areas of campus life of a specific university.
STARS was identified to be the most effectiveSAT. SAQ and CSAF have limitations inassessing SD in campus operations.
Fischer et al. (2015) [15]
n = 12AISHE, Alternative Universal Appraisal, Conference of Rectorsof Spanish Universities, CSAF, German Commission forUNESCO, Graz Model of Integrative Development, GreenPlan, Innovación y Educación Ambiental en Iberoamérica,People & Planet, Red de Ciencia, Tecnología, SAQ, STARS, UIGreenMetric
A mixed-method approach with a quantitativeand a qualitative part was applied: (1)comparative analysis of criteria and (2)introductory passages in supporting documents.
Indicators and criteria are biased towards thefield of operations.
Bullock & Wilder (2016) [10]
n = 9ACUPCC, College Sustainability Report Card, Grey Pinstripeswith Green Ties, Pacific Sustainability Index (PSI), PrincetonReview’s Green Ratings, Sierra Club’s Cool Schools, STARS,The Guardian’s Green League, UI GreenMetric
Sustainability assessment frameworks and SATsbased on the GRI-HE framework were evaluated.
The evaluated sustainability assessments andSATs are not comprehensive and lackcoverage of the economic and socialdimension of sustainability.
Alghamdi et al. (2017) [33]
n = 12Adaptable Model for Assessing Sustainability in HigherEducation, AISHE, Alternative University Appraisal, GASU,Green Plan, SAQ, STARS, Sustainable Campus AssessmentSystem, Sustainable University Model, UI GreenMetric,Unit-based Sustainability Assessment Tool, UniversityEnvironmental Management System
A desk study approach with quantitative andqualitative elements was applied including areview of research articles, academic books,network platforms, graduate theses, and websites.
The tools share similar characteristics in termsof their criteria and indicators, which can begrouped into: management, academia,environment, engagement, and innovation.Environmental indicators have the highestshare among the tools.
Berzosa et al. (2017) [14] n = 4AISHE, SAQ, Sustain Tool, USAT
A descriptive analysis of SATs based on singlecase studies was performed.
The SATs positively influence creating specificplans in education, research, outreach, andcampus operations. They have a strong focuson the environmental dimension anddelivered similar outcomes.

Sustainability 2019, 11, 59 5 of 19
2.2. Impacts of Higher Education Institutions on Sustainable Development
The studies examining SATs, as illustrated in Table 1, have focused on HEIs’ policies and activitiesfor SD occurring inside the organization (e.g., measures to enhance energy efficiency or sustainabilityliteracy of students in educational programs [15,16]). However, external stakeholders such as publicand private funders, policy-makers, and accreditation agencies have increasingly asked HEIs to moreadequately assess and report about their impacts on SD as well—in other words, external stakeholdersare increasingly interested to know what HEIs achieve through these activities and policies for widersociety and the natural environment [22]. For example, the European Research Framework ProgramH2020 examines impacts as one of its three evaluation criteria [38], the Research Excellence Framework(REF) in the UK allocates public funding based on the presentation of research impacts by HEIs [39],and the Business School Impact System (BSIS) by the Management Development Network (EFMD)includes impacts into its accreditation evaluations [40]. This has led to an increasing need of HEIsto assess and report about their impacts. In this context, this paper seeks to examine to what extentexisting SATs are capable of accounting for impacts that HEIs have on SD (e.g., climate changemitigation, social inclusiveness, and strengthening of the local economy).
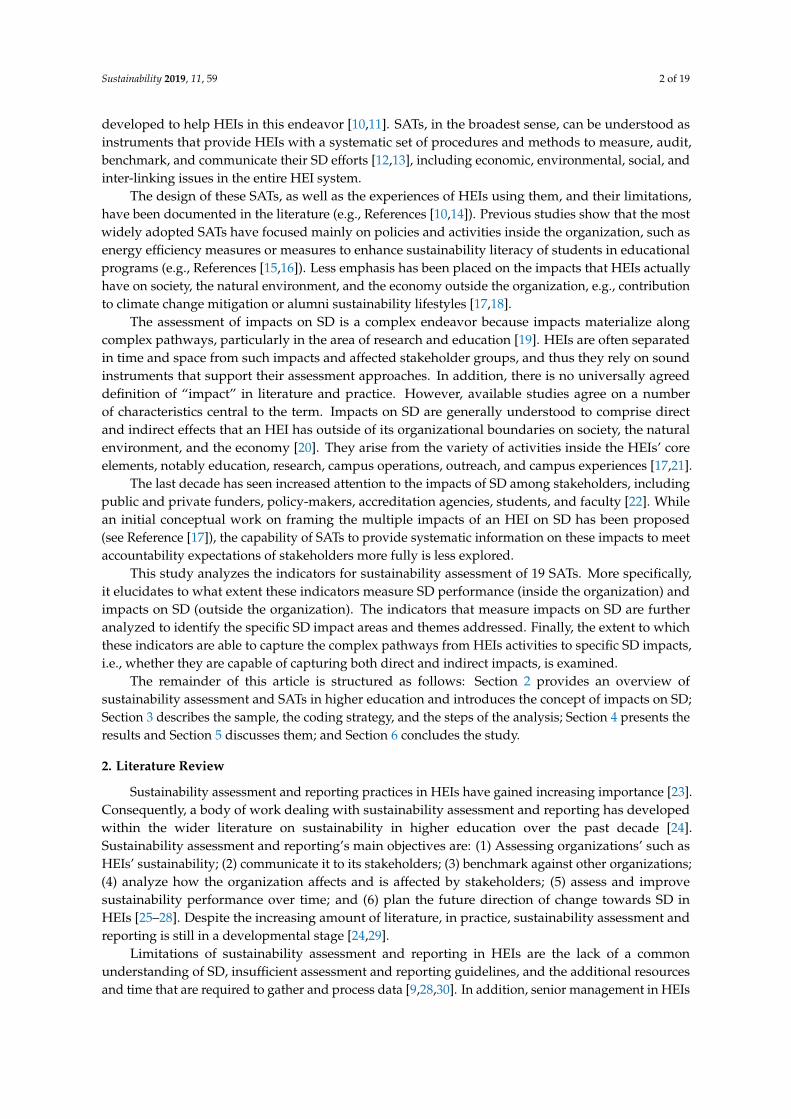
Impacts refer to the effects that any organization, such as an HEI, has outside of its organizationalor academic boundaries—on its stakeholders, the natural environment, the economy, and society ingeneral [17,41]. Impacts are caused by the HEI as an organization and by its different organizationaland individual level activities that take place in the core elements education, research, outreach,campus operations, and campus experiences [21,42]. Impacts may materialize in a variety of differentSD impact areas, including the economy, societal challenges, the natural environment, policy making,culture, and demographics. Impacts can be directly (short-term effects, e.g., student sustainabilityliteracy) or indirectly (long-term effects, e.g., sustainable lifestyles of graduates) attributed to the HEIor the activities that take place in its core elements (see Figure 1, [17]).
Sustainability 2018, 10, x FOR PEER REVIEW 5 of 19
a variety of different SD impact areas, including the economy, societal challenges, the natural environment, policy making, culture, and demographics. Impacts can be directly (short-term effects, e.g., student sustainability literacy) or indirectly (long-term effects, e.g., sustainable lifestyles of graduates) attributed to the HEI or the activities that take place in its core elements (see Figure 1, [17]).
Figure 1. The SD impact framework of HEIs [17].
HEIs have to follow a whole institution approach that takes the impacts of all core elements into account to successfully manage their impacts (strengthening positive and reducing negative ones) [43]. This highlights the importance of broad-scale policies (institutional framework) to facilitate impact orientation in all core elements and the need of SATs to systematically assess and manage impacts [17].
Impact assessment is a challenging process because impacts may materialize along complex pathways [19]. On the one hand, HEIs generate impacts on SD through organizational activities within the core elements of the HEI (e.g., online learning contributes to climate change mitigation and the reduction of greenhouse gas [GHG] emissions, see Reference [44]) or through their sheer existence as an organization in a specific locality (e.g., an HEI attracts national and international students, which causes in-migration, demographic change, and cultural dialogue, see References [45,46]). On the other hand, impacts are caused by individual activities or behaviors (e.g., students with entrepreneurial attitudes may contribute to business creation and thus strengthen local economies). While HEIs may assess and analyze impacts on the organizational level via, for example, internal proxy data, impact assessment at the individual level is much more challenging because it requires additional data collection (e.g., alumni or student surveys).
3. Sample and Method
This research analyzes SATs in higher education by a applying a mixed-method approach based on quantitative and qualitative elements (as used by [47]). The research aims to provide new insights regarding the ability of currently existing SATs to assess impacts of HEIs on SD.
Figure 1. The SD impact framework of HEIs [17].

Sustainability 2019, 11, 59 6 of 19
HEIs have to follow a whole institution approach that takes the impacts of all core elements intoaccount to successfully manage their impacts (strengthening positive and reducing negative ones) [43].This highlights the importance of broad-scale policies (institutional framework) to facilitate impactorientation in all core elements and the need of SATs to systematically assess and manage impacts [17].
Impact assessment is a challenging process because impacts may materialize along complexpathways [19]. On the one hand, HEIs generate impacts on SD through organizational activities withinthe core elements of the HEI (e.g., online learning contributes to climate change mitigation and thereduction of greenhouse gas [GHG] emissions, see Reference [44]) or through their sheer existence asan organization in a specific locality (e.g., an HEI attracts national and international students, whichcauses in-migration, demographic change, and cultural dialogue, see References [45,46]). On the otherhand, impacts are caused by individual activities or behaviors (e.g., students with entrepreneurialattitudes may contribute to business creation and thus strengthen local economies). While HEIsmay assess and analyze impacts on the organizational level via, for example, internal proxy data,impact assessment at the individual level is much more challenging because it requires additional datacollection (e.g., alumni or student surveys).
3. Sample and Method
This research analyzes SATs in higher education by a applying a mixed-method approach basedon quantitative and qualitative elements (as used by [47]). The research aims to provide new insightsregarding the ability of currently existing SATs to assess impacts of HEIs on SD.
3.1. Sampling Strategy and Description
SATs to be included in the sample were identified based on a review of existing studies of SATs inhigher education (e.g., References [14,33]), as well as online research that aimed to identify recentlydeveloped tools. The purposive sampling strategy resulted in a final sample composed of SATs that:(a) Follow an indicator-based approach and (b) are applied in practice. The selection aimed to generatea maximum variety of tools to foster a rich comparative assessment (see Reference [48]). A briefdescription of the included SATs’ purpose and content is provided below (in alphabetical order):
1. The Auditing Instrument for Sustainability in Higher Education (AISHE) was developed in2001 in the Netherlands by the Dutch Foundation for Sustainable Higher Education and aims atmeasuring sustainable education [49]. The latest version “AISHE 2.0” has 30 indicators across thefive modules Identity, Education, Research, Operations, and Societal Outreach, and it offers afive-stage description for each criterion for benchmarking;
2. The Adaptable Model for Assessing Sustainability in Higher Education (AMAS) was developedby Gomez et al. [50] in 2015 at the Pontificia Universidad Católica de Chile. The tool has25 indicators that are subordinated to a goal, a criterion, and a subcriterion. It aims at enablingHEIs to assess sustainability along different implementation stages;
3. The Business School Impact System (BSIS) is designed to determine the extent of a school’s impactupon its regional environment. It was launched in France in 2014 by EFMD Global Network andhas 126 indicators across seven categories. Business schools can apply to enter the BSIS processand are then reviewed by an expert team [51];
4. The CSA framework resulted from the Campus Sustainability Assessment Review Project in 2002at the Western Michigan University (US). The CSA framework includes 43 best practice indicatorsacross 15 dimensions compiled from an analysis of various CSA reports [52]. A benchmarkingpossibility is provided in the form of a “potential end goal”;
5. The Campus Sustainability Assessment Framework (CSAF) has 169 indicators across 10 categoriesand offers opportunities to benchmark HEIs against predefined scores. It was developed byLindsay Cole in 2003 to assist Canadian campuses with their sustainability objectives [53,54];

Sustainability 2019, 11, 59 7 of 19
6. Waheed, Khan, and Veitch [55] developed a quantitative sustainability assessment toolusing a driving force-pressure-state-exposure-effect-action (DPSEEA) framework to achievea causality-based impact assessment. The Canadian model is called DPSEEA-Sustainability indexModel (D-SiM). The D-SiM includes 56 indicators across five categories;
7. The German Commission for UNESCO (Deutsche UNESCO Kommission [DUK]) developed asustainability self-assessment concept for HEIs in 2011 containing 10 fields of action/indicators.Each of the fields of action offers five stages of implementation to which HEIs can assignthemselves [56];
8. The Graphical Assessment of Sustainability in Universities (GASU) has 174 indicators that buildon a modification of the Global Reporting Initiative (GRI) Sustainability Guidelines. It wasdeveloped in 2006 by Rodrigo Lozano at Cardiff University (UK) and last updated in 2011. GASUaims to enable analysis and comparison of universities’ sustainability efforts [9];
9. The Graz Model of Integrative Development (GMID) evaluates the transformative potentials ofsustainability processes within Regional Centers of Expertise (RCE) on Education for SustainableDevelopment (ESD), and thus focuses on the interrelations between an HEI and regionalstakeholders. It includes 15 indicators across the basic principles of Leadership, Social Networks,Participation, Education and Learning, and Research Integration, and it was developed byClemens Mader in Graz (Austria) [57];
10. People and Planet’s University League (P&P) ranks UK universities by environmental and ethicalperformance using 51 indicators across 13 categories. The university sustainability ranking wasfirst conducted in 2007 and has been updated each year [58];
11. The Penn State Indicators Report (PENN) evaluated the sustainability performance atPennsylvania State University (US) in 2000. It covers 33 indicators across 10 categories.These indicators were subsequently used by other HEIs for sustainability assessment [59];
12. The Association of University Leaders for a Sustainable Future (ULSF) [60] created theSustainability Assessment Questionnaire (SAQ) for colleges and universities. It was developed inthe US and is designed to assess how sustainable a university’s teaching, research, operations,and outreach are with 41 indicators;
13. The National Wildlife Federation’s [61] State of the Campus Environment (SCE) is a national (US)report card on Environmental Performance and Sustainability in Higher Education. It covers69 indicators across 12 categories;
14. Good Company’s Sustainable Pathways Toolkit (SPT) developed in 2002 in the US evaluatesthe social and environmental impacts of HEIs using 29 indicators (20 core indicators and ninesupplementary indicators). Along with each indicator goes a benchmark suggesting a desirableperformance for the respective area of application [62];
15. The Sustainability Tracking, Assessment and Rating System (STARS) version 2.1 was developedby the Association for the Advancement of Sustainability in Higher Education (AASHE) [63]in North America. It includes 68 indicators with benchmarks that determine possible scoringacross the categories Academics, Engagement, Operations, Planning and Administration, andInnovation and Leadership. HEIs that submit a self-assessment using STARS may achieve a gold,silver, or bronze rating;
16. The Sustainability Tool for Auditing for University Curricula in Higher-Education (STAUNCH®),developed by Rodrigo Lozano in 2009 in the UK, enables HEIs to assess their curricula’scontribution to sustainable development by using 36 indicators that are subdivided intoenvironmental, economic, social, and cross-cutting themes [64];
17. Lukman, Krajnc, and Glavic [65] created the Three-dimensional University Ranking (TUR)in 2010 at the University of Maribor (SI). The model offers 15 indicators to evaluate HEIsalong their research, educational and environmental performance in a way that enablesinter-organizational comparison;

Sustainability 2019, 11, 59 8 of 19
18. The UI GreenMetric World University Ranking (UIGM) is an initiative of Universitas Indonesia(ID), launched in 2010. It ranks universities’ performance in the categories of Setting andInfrastructure, Energy and Climate Change, Waste, Water, Transportation, and Education using69 indicators [66]; and,
19. In 2009, the United Nations Environment Programme (UNEP) designed the Unit-basedSustainability Assessment Tool (USAT) to determine to what degree HEIs have integratedsustainability concerns. USAT employs 75 indicators across the dimensions teaching, operationsand management, student involvement, and policy and written statements [67].
Some of the included SATs have not been examined before (i.e., BSIS, D-SiM, STAUNCH®, TUR).While nine of the SATs included in the sample were developed by HEIs, external stakeholders such aspublic and private funding agencies, accreditation agencies, international organizations, and charitableorganizations are also found among the developers of SATs.
3.2. Coding Strategy
In total, 1134 indicators were extracted from the sampled SATs. Based on Yarime and Tanaka [16]and Fischer et al. [15], the coding strategy consisted of a deductive and an inductive part.
The deductive part of the analysis aimed to classify the indicators to link them to a particularconcept [68]. Each SAT indicator was reviewed and coded based on categories derived from the SDimpact framework of HEIs (see Figure 1): Core element, assessment target, SD impact area, and impacttype. The framework serves as a valid construct for this analysis (see Reference [69]). In addition,the indicators were coded regarding their type (quantitative, quasi-quantitative, and qualitative) andtheir level of analysis (individual or organizational). The coding for all variables in these categorieswas binary (1 = it applies; 0 = it does not apply).
First, each indicator was exclusively assigned to one of the five core elements in whichactivities of SD take place—namely education, research, outreach, campus operations, and campusexperiences. Indicators concerning administrative structure and broad-scale policies were assigned tothe institutional framework, while indicators addressing assessment and reporting processes werecategorized into the “assessment and reporting” category. In addition, indicators addressing the HEIon an institutional level were related to the category “higher education institution”. The category“not applicable” includes indicators that do not fit in any of the other categories. Examples for theindicators in these categories are illustrated in Table 2.
Table 2. Examples of indicators classified into (core) elements.
(Core) Element Examples
Institutional framework
On broad-scale policies and the administrative structure of the HEIs, including, e.g.,governance body structure, vision and mission statements, policies for staff and facultyhiring, budget issues, student associations, and development programs for staff andfaculty
Education Teaching, curriculum, and all other activities aiming for the education of students
Research Research-related activities of the HEIs, e.g., allocation of research funds,transdisciplinary research programs
Outreach HEI’s collaboration efforts with external stakeholders on regional, national, andinternational level
Campus operations HEI’s environmental management, procurement policies and practices, infrastructure,and workspace-related issues such as safety regulations
Campus experiences On-campus experiences for students and staff (e.g., student crime) and individualbehaviors not related to studying or working (e.g., alcohol consumption)
Assessment and reportingHEI’s assessment and reporting processes that are geared towards the engagement withexternal stakeholders (e.g., external assurance, reporting cycles, stakeholderidentification processes)
Higher education institutionActivities or impacts on the institutional level that cannot be influenced by measures inone of the core elements, e.g., demographic effects on the region through studentin-migration
Sustainability 2019, 11, 59 9 of 19
Second, each indicator was reviewed and exclusively categorized regarding its assessment targetas a performance, proxy, or impact indicator. Performance indicators are concerned with policies andactivities inside the organization (e.g., number of courses with SD content). Proxies are indicators thatare able to measure impacts indirectly based on internal data (e.g., GHG emissions for contribution toclimate change mitigation) (see Reference [36]), while impact indicators directly measure the impactson SD outside organizational boundaries.
Third, each proxy and impact indicator was classified into one SD impact area. Indicators thatcould not be classified were coded as NA. These impact areas include, for example, indicators thataddress the following topics:
• Economy: Local food purchasing, alumni in the job market;• Societal challenges: Research ethics, student fees;• Natural environment: Noise pollution, resource consumption, GHG emissions;• Policy making: Contribution to public policy development;• Culture: Cultural dialog, cultural diversity; and• Demographics: Composition and change of local population, including student and
alumni population.
Fourth, the proxy and impact indicators were distinguished regarding the types of impact theymeasure. Direct impact indicators focus on immediate or short-term effects (e.g., alumni entering theregional job market), while indirect ones focus on intermediate or long-term effects (e.g., changes inenvironmental conditions).
Finally, the subsample of proxy and impact indicators was classified by type into quantitative(e.g., GHG emissions by weight), quasi-quantitative (e.g., self-rating of outreach efforts), and qualitative(e.g., open questions about contribution to policy making) (see Reference [36]) and also regardingtheir level of analysis. Indicators on the individual level of analysis address impacts that can beattributed to individual activities or behavior (e.g., alcohol consumption and related impacts onstudent health), while indicators on the organizational level assess impacts caused by organizationalactivities (e.g., water consumption and impacts on groundwater) or the HEI itself (e.g., in-migration ofstudents and social problems).
To ensure intercoder reliability, all steps of the coding were executed by two coders (seeReference [70]). The Kappa value of the intercoder reliability was high with 0.91 (see Reference [71]).Differences among the coders were resolved by discussion until consensus was reached.
For the inductive part of the analysis, the authors independently reviewed the descriptions ofproxy and impact indicators in each category of the SD impact areas. This process aimed to identifythemes for the proxy and impact indicators (based on References [68,72]).
3.3. Analysis of the Coding Matrix
The descriptive statistical analyses were carried out with SPSS [73]. First, the relative frequenciesof the indicator distribution among the categories’ core elements and assessment target were calculatedto comparatively examine the SATs. Second, the sub-sample of proxy and impact indicators was furtheranalyzed by cross-tabulations regarding the categories SD impact area, impact type, and indicator type.Cross-tabulation is a joint frequency distribution that summarizes the categorical data of one group todemonstrate how many cases are present in another [74]. This allows for an analysis of relationshipsbetween the different categories in order to identify patterns and trends. All cross-tabulations weretested with the Chi-square test of independence to test the hypothesis that the categorical variables incolumns and rows are related. All chi-square values were high and p-values were highly significant(Chi-square values > 32.213 and p-values < 0.001), indicating a highly significant statistical relationshipbetween the variables in the cross-tabulations [75]. The identification of themes of the inductiveanalysis was supported by the MAXQDA 12 qualitative analysis software [76]. The descriptive part ofthe analysis is presented in Section 4.1 and the inductive part in Section 4.2.

Sustainability 2019, 11, 59 10 of 19
3.4. Limitations
The research design has limitations inherent to the interpretative nature of qualitative research interms of reliability and generalizability. To strengthen the validity of the interpretative analysis,the trustworthiness of data and results was assessed in terms of credibility, transferability, andconfirmability [77,78]. First, credibility refers to the extent to which the results appear to be acceptablerepresentations of the data. The deductive coding strategy and the inductive generation of themeshave yielded consistent results. All deductive coding criteria found representations in the data, thussuggesting that the coding strategy resulted in credible results.
Second, transferability designates the degree to which findings from one study context will applyto other contexts. Transferability was ensured by the purposive sampling approach, aiming to generatea maximum variety of tools to foster a rich comparative assessment [48]. The sample includes not onlyrecently developed tools such as BSIS, but also mature and established tools, such as STAUNCH®. As itis likely that the design of SATs and the understanding of the SD concept vary depending upon specificsociocultural and political contexts, the sample explicitly included SATs from a variety of geographicalorigins, such as the German self-assessment tool DUK or the Indonesian university ranking UIGM.The findings should thus be applicable to a wide variety of contexts.
Third, enhancing confirmability engenders the active search for potential biases in interpretationof the data. The findings appear consistent with previous studies of SATs in higher education(e.g., References [15,16]). In addition, two coders independently coded the data. Testing for intercoderreliability further strengthened the confirmability of results.
Finally, the nature of the data, i.e., indicators derived from SATs, imposes limitations in terms ofthe conclusions that can be drawn. While the examination of indicators enables a rich comparativeassessment of SATs, it does not allow inferences as to the systemic interrelationships between indicators,and thus also not about the potential of the SATs to drive SD in the HEI context at this level. Whilesound sustainability assessment is a prerequisite and necessary condition for the improvement ofHEIs’ impacts on SD, it is not sufficient to judge the extent to which actual improvements materialize.This requires additional analyses that are beyond the scope of this study.
4. Results
The 19 SATs under examination comprised 1134 indicators representing all the tools’ capabilityto assess impacts on SD. The analysis consists of a descriptive part and an inductive examination ofmajor themes.
4.1. Descriptive Analysis
The overall distribution of indicators across the core elements shows a strong focus on the coreelements of campus operations (34.48%), and institutional framework (20.90%). The dominance ofcampus operations can be due to 10 out of the 19 SATs having their largest share of indicators in thiscore element. Indicators relating to education (16.04%) are also relatively high. All other core elementsare covered only by a limited number of indicators and are relatively weakly represented whencompared against campus operations, the institutional framework, and education (see Table 3). Morethan half of the analyzed SATs do not have any indicators on the core elements campus experiencesand assessment and reporting, and two SATs do not cover the campus operations and institutionalframework elements. The core element of education is addressed by all analyzed SATs. Some of theSATs are specialized, e.g., CSA and PENN have about 70% of their indicators in campus operationsand STAUNCH® focuses only on education. It should be noted that the element HEI refers to activitieson the institutional level or impacts that are caused by the HEI as institution. This category is onlyaddressed by a few indicators (5.03%).

Sustainability 2019, 11, 59 11 of 19
Table 3. (Core) Elements (in %).
AssessmentTool
InstitutionalFramework Education Research Outreach Campus
OperationsCampus
ExperiencesAssessment &
Reporting HEI NA ∑∑∑
AISHE 23.33 20.00 20.00 20.00 6.67 0.00 10.00 0.00 0.00 100.00AMAS 44.00 4.00 4.00 8.00 24.00 0.00 12.00 4.00 0.00 100.00
BSIS 7.14 26.19 19.05 18.25 0.79 0.00 0.00 23.02 5.56 100.00CSA 4.65 6.98 6.98 2.33 72.08 6.98 0.00 0.00 0.00 100.00
CSAF 31.95 5.33 3.54 1.78 48.52 5.92 0.00 1.18 1.78 100.00D-SiM 8.93 10.71 5.36 1.79 46.43 0.00 0.00 14.29 12.49 100.00DUK 20.00 30.00 20.00 0.00 20.00 0.00 10.00 0.00 0.00 100.00
GASU 28.16 10.92 6.90 1.72 21.84 1.72 11.49 4.61 12.64 100.00GMID 20.00 20.00 20.00 40.00 0.00 0.00 0.00 0.00 0.00 100.00P&P 33.33 11.76 0.00 0.00 50.99 1.96 1.96 0.00 0.00 100.00
PENN 6.06 3.03 9.09 0.00 69.70 12.12 0.00 0.00 0.00 100.00SAQ 21.94 12.20 9.76 4.88 29.26 9.76 0.00 12.20 0.00 100.00SCE 23.19 18.84 2.90 0.00 55.07 0.00 0.00 0.00 0.00 100.00SPT 24.14 6.89 0.00 0.00 68.97 0.00 0.00 0.00 0.00 100.00
STARS 26.48 16.18 4.41 8.82 33.82 0.00 2.94 2.94 4.41 100.00STAUNCH® 0.00 100.00 0.00 0.00 0.00 0.00 0.00 0.00 0.00 100.00
TUR 20.00 40.00 33.33 0.00 6.67 0.00 0.00 0.00 0.00 100.00UIGM 0.00 4.35 7.25 0.00 63.77 1.45 4.35 1.45 17.38 100.00USAT 30.67 21.33 9.34 8.00 21.33 4.00 0.00 1.33 4.00 100.00
Overallaverage 20.90 16.04 7.85 5.20 34.48 2.56 2.91 5.03 5.03 100.00

Sustainability 2019, 11, 59 12 of 19
The majority of indicators in the examined SATs assess an HEI’s internal activities rather thanimpacts on SD. Table 4 illustrates the strong focus on performance indicators (69.84%). Some SATssolely assess SD performance, namely DUK, GMID, SAQ, STAUNCH®, TUR, and USAT. Only BSISand PENN show a distinct focus on addressing impacts outside the organizational boundaries with81.75% and 60.61% of criteria being either proxy or impact indicators, respectively. Twelve of thereviewed tools make use of proxy indicators (20.55% of the overall sample). Eight SATs offer impactindicators, which comprise only 4.14% of the total indicator sample.
Table 4. Assessment Target (in %).
Assessment Tool Performance Indicator Proxy Indicator Impact Indicator NA ∑∑∑
AISHE 83.33 0.00 16.67 0.00 100.00AMAS 84.00 16.00 0.00 0.00 100.00
BSIS 18.25 70.64 11.11 0.00 100.00CSA 67.44 25.58 6.98 0.00 100.00
CSAF 81.66 16.57 1.18 0.59 100.00D-SiM 28.56 17.86 14.29 39.29 100.00DUK 100.00 0.00 0.00 0.00 100.00
GASU 59.77 19.54 4.02 16.67 100.00GMID 100.00 0.00 0.00 0.00 100.00P&P 82.35 17.65 0.00 0.00 100.00
PENN 39.39 51.52 9.09 0.00 100.00SAQ 100.00 0.00 0.00 0.00 100.00SCE 86.96 13.04 0.00 0.00 100.00SPT 65.52 17.24 17.24 0.00 100.00
STARS 88.24 7.35 0.00 4.41 100.00STAUNCH® 100.00 0.00 0.00 0.00 100.00
TUR 100.00 0.00 0.00 0.00 100.00UIGM 72.47 17.39 0.00 10.14 100.00USAT 100.00 0.00 0.00 0.00 100.00
Overall average 69.84 20.55 4.14 5.47 100.00
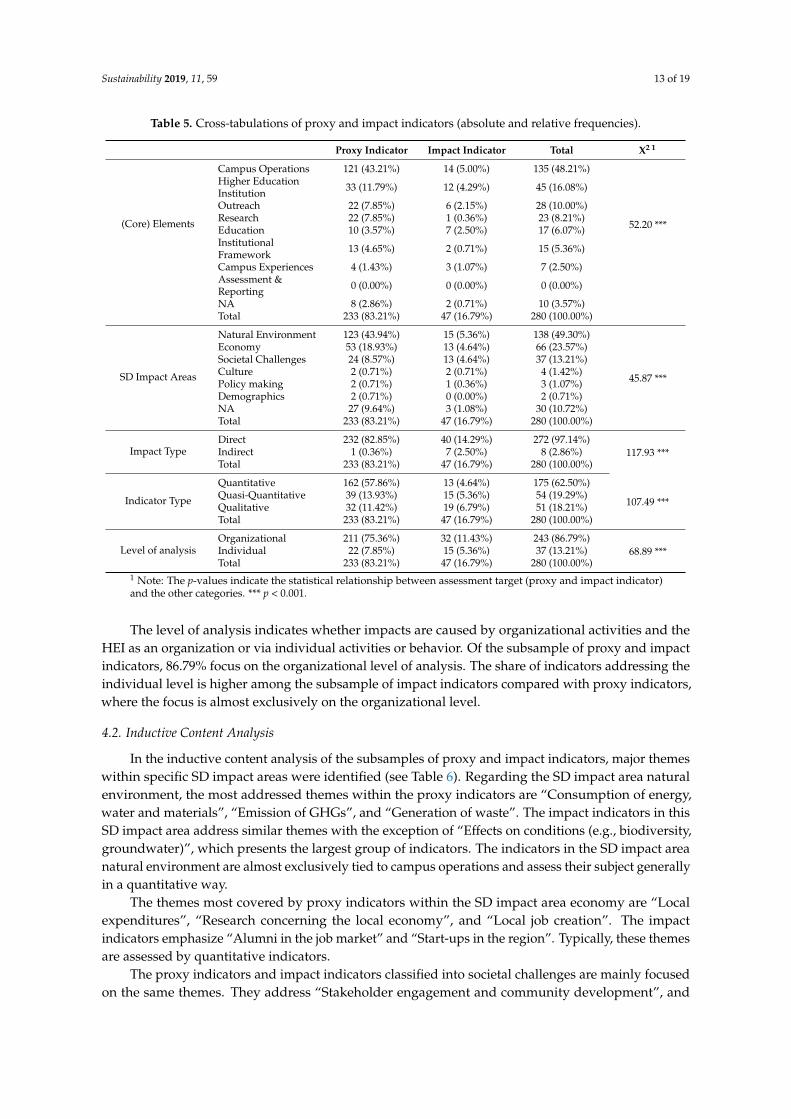
Table 5 shows the characteristics of the indicators that focus on assessing HEIs’ impacts on SD.There is a strong focus on proxy indicators that measure impacts in an indirect way, which comprise83.21% of the indicators that address impacts.
For proxy and impact indicators, the core element most represented is campus operations;48.21% of the proxy and impact indicators focus on this core element, of which most are proxyindicators. Many of these proxy indicators emphasize assessing GHG emissions and waste generation.Of the indicators, 16.08% address impacts that are caused by the HEI as an organization. The coreelement assessment and reporting was not addressed because this core element reflects the assessmentprocesses in an HEI rather than the actual impacts.
The proxy and impact indicators address mainly the SD impact areas economy, societal challenges,and natural environment, while policy making, culture, and demographics are seldom considered.Natural environment is the SD impact area with the highest coverage, with 49.30% of proxy andimpact indicators assessing impacts in that category. The SD impact areas economy and societalchallenges follow with 23.57% and 13.21% of the indicators, respectively. The bulk of the economyproxy indicators stem from the tool BSIS. It is true for any SD impact area that proxy indicatorscomprise the larger share.
Direct impacts are addressed by almost all proxy and impact indicators (97.14%) and only eightaim at capturing indirect impacts. The indicators assessing indirect impacts are almost exclusivelyimpact indicators.
Considering the indicator type, quantitative indicators are the most prevalent (62.50%), followedby quasi-quantitative indicators (19.29%) and qualitative indicators (18.21%). The latter are especiallyutilized in the subsample of impact indicators.
Sustainability 2019, 11, 59 13 of 19
Table 5. Cross-tabulations of proxy and impact indicators (absolute and relative frequencies).
Proxy Indicator Impact Indicator Total X2 1
(Core) Elements
Campus Operations 121 (43.21%) 14 (5.00%) 135 (48.21%)
52.20 ***
Higher EducationInstitution 33 (11.79%) 12 (4.29%) 45 (16.08%)
Outreach 22 (7.85%) 6 (2.15%) 28 (10.00%)Research 22 (7.85%) 1 (0.36%) 23 (8.21%)Education 10 (3.57%) 7 (2.50%) 17 (6.07%)InstitutionalFramework 13 (4.65%) 2 (0.71%) 15 (5.36%)
Campus Experiences 4 (1.43%) 3 (1.07%) 7 (2.50%)Assessment &Reporting 0 (0.00%) 0 (0.00%) 0 (0.00%)
NA 8 (2.86%) 2 (0.71%) 10 (3.57%)Total 233 (83.21%) 47 (16.79%) 280 (100.00%)
SD Impact Areas
Natural Environment 123 (43.94%) 15 (5.36%) 138 (49.30%)
45.87 ***
Economy 53 (18.93%) 13 (4.64%) 66 (23.57%)Societal Challenges 24 (8.57%) 13 (4.64%) 37 (13.21%)Culture 2 (0.71%) 2 (0.71%) 4 (1.42%)Policy making 2 (0.71%) 1 (0.36%) 3 (1.07%)Demographics 2 (0.71%) 0 (0.00%) 2 (0.71%)NA 27 (9.64%) 3 (1.08%) 30 (10.72%)Total 233 (83.21%) 47 (16.79%) 280 (100.00%)
Impact TypeDirect 232 (82.85%) 40 (14.29%) 272 (97.14%)
117.93 ***Indirect 1 (0.36%) 7 (2.50%) 8 (2.86%)Total 233 (83.21%) 47 (16.79%) 280 (100.00%)
Indicator Type
Quantitative 162 (57.86%) 13 (4.64%) 175 (62.50%)
107.49 ***Quasi-Quantitative 39 (13.93%) 15 (5.36%) 54 (19.29%)Qualitative 32 (11.42%) 19 (6.79%) 51 (18.21%)Total 233 (83.21%) 47 (16.79%) 280 (100.00%)
Level of analysisOrganizational 211 (75.36%) 32 (11.43%) 243 (86.79%)
68.89 ***Individual 22 (7.85%) 15 (5.36%) 37 (13.21%)Total 233 (83.21%) 47 (16.79%) 280 (100.00%)
1 Note: The p-values indicate the statistical relationship between assessment target (proxy and impact indicator)and the other categories. *** p < 0.001.
The level of analysis indicates whether impacts are caused by organizational activities and theHEI as an organization or via individual activities or behavior. Of the subsample of proxy and impactindicators, 86.79% focus on the organizational level of analysis. The share of indicators addressing theindividual level is higher among the subsample of impact indicators compared with proxy indicators,where the focus is almost exclusively on the organizational level.
4.2. Inductive Content Analysis
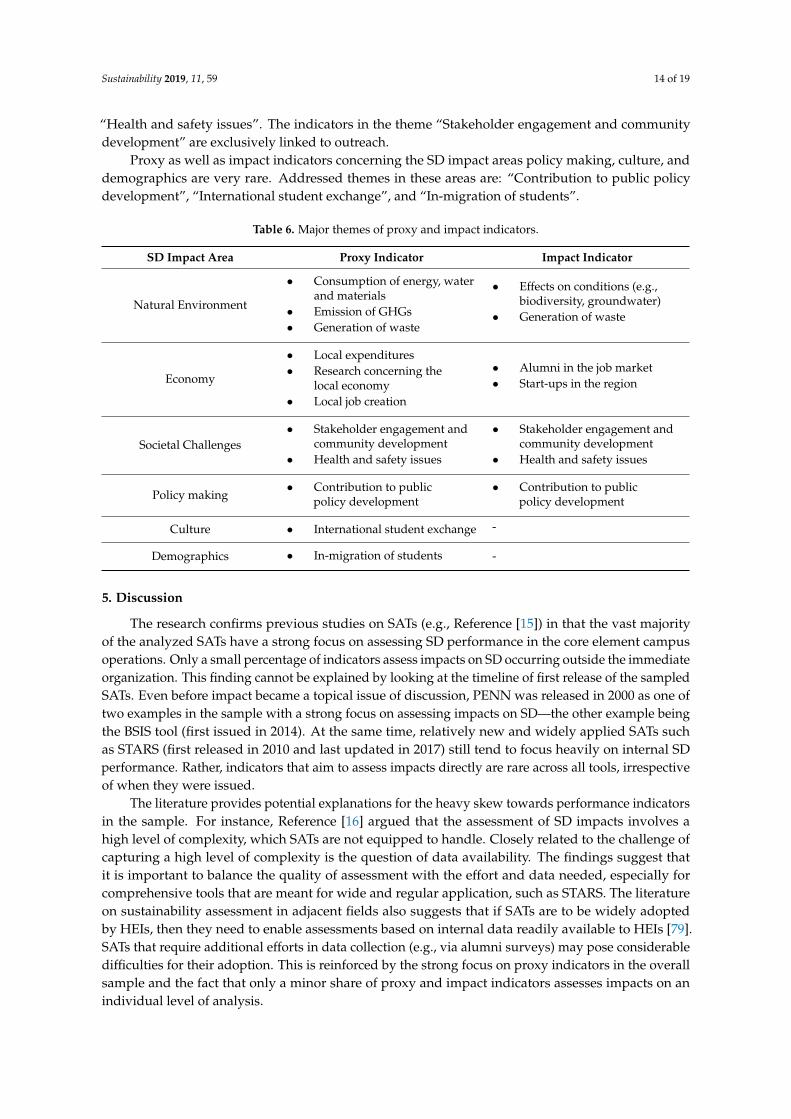
In the inductive content analysis of the subsamples of proxy and impact indicators, major themeswithin specific SD impact areas were identified (see Table 6). Regarding the SD impact area naturalenvironment, the most addressed themes within the proxy indicators are “Consumption of energy,water and materials”, “Emission of GHGs”, and “Generation of waste”. The impact indicators in thisSD impact area address similar themes with the exception of “Effects on conditions (e.g., biodiversity,groundwater)”, which presents the largest group of indicators. The indicators in the SD impact areanatural environment are almost exclusively tied to campus operations and assess their subject generallyin a quantitative way.
The themes most covered by proxy indicators within the SD impact area economy are “Localexpenditures”, “Research concerning the local economy”, and “Local job creation”. The impactindicators emphasize “Alumni in the job market” and “Start-ups in the region”. Typically, these themesare assessed by quantitative indicators.
The proxy indicators and impact indicators classified into societal challenges are mainly focusedon the same themes. They address “Stakeholder engagement and community development”, and
Sustainability 2019, 11, 59 14 of 19
“Health and safety issues”. The indicators in the theme “Stakeholder engagement and communitydevelopment” are exclusively linked to outreach.
Proxy as well as impact indicators concerning the SD impact areas policy making, culture, anddemographics are very rare. Addressed themes in these areas are: “Contribution to public policydevelopment”, “International student exchange”, and “In-migration of students”.
Table 6. Major themes of proxy and impact indicators.
SD Impact Area Proxy Indicator Impact Indicator
Natural Environment
• Consumption of energy, waterand materials
• Emission of GHGs• Generation of waste
• Effects on conditions (e.g.,biodiversity, groundwater)
• Generation of waste
Economy
• Local expenditures• Research concerning the
local economy• Local job creation
• Alumni in the job market• Start-ups in the region
Societal Challenges• Stakeholder engagement and
community development• Health and safety issues
• Stakeholder engagement andcommunity development
• Health and safety issues
Policy making• Contribution to public
policy development• Contribution to public
policy development
Culture • International student exchange -
Demographics • In-migration of students -
5. Discussion
The research confirms previous studies on SATs (e.g., Reference [15]) in that the vast majorityof the analyzed SATs have a strong focus on assessing SD performance in the core element campusoperations. Only a small percentage of indicators assess impacts on SD occurring outside the immediateorganization. This finding cannot be explained by looking at the timeline of first release of the sampledSATs. Even before impact became a topical issue of discussion, PENN was released in 2000 as one oftwo examples in the sample with a strong focus on assessing impacts on SD—the other example beingthe BSIS tool (first issued in 2014). At the same time, relatively new and widely applied SATs suchas STARS (first released in 2010 and last updated in 2017) still tend to focus heavily on internal SDperformance. Rather, indicators that aim to assess impacts directly are rare across all tools, irrespectiveof when they were issued.
The literature provides potential explanations for the heavy skew towards performance indicatorsin the sample. For instance, Reference [16] argued that the assessment of SD impacts involves ahigh level of complexity, which SATs are not equipped to handle. Closely related to the challenge ofcapturing a high level of complexity is the question of data availability. The findings suggest thatit is important to balance the quality of assessment with the effort and data needed, especially forcomprehensive tools that are meant for wide and regular application, such as STARS. The literatureon sustainability assessment in adjacent fields also suggests that if SATs are to be widely adoptedby HEIs, then they need to enable assessments based on internal data readily available to HEIs [79].SATs that require additional efforts in data collection (e.g., via alumni surveys) may pose considerabledifficulties for their adoption. This is reinforced by the strong focus on proxy indicators in the overallsample and the fact that only a minor share of proxy and impact indicators assesses impacts on anindividual level of analysis.

Sustainability 2019, 11, 59 15 of 19
The present research highlights the concrete SD impact areas and themes currently covered bySATs. The sample contains a relatively higher proportion of proxy and impact indicators in SD impactareas, with clearly understood causal pathways from activity to impact, as well as those that can bemeasured in physical or quantifiable units based on data readily available to HEIs. This is confirmed bythe data in the sample. Even for SATs with an overwhelming focus on internal SD performance, thereare proxy indicators for impact in the area of campus operations, especially as regards environmentalimpacts (e.g., consumption of energy, water and materials, GHG emissions, and waste generation).The main focus is on the SD impact areas natural environment, economy, and societal challenges,while policy making, culture, and demographics are rarely considered. In particular, environmentalimpacts tend to lend themselves to assessment because causal links, e.g., from GHG emissions toclimate change, are well understood and easier to assess than many social issues (e.g., impacts of anHEI on local culture) (see Reference [10]).
This means that the SD impact areas addressed by SATs do not necessarily cover the mostimportant impacts of any given HEI. Rather, they focus on indicators that can be measured basedon internally available data. In this context, it is notable that only one of the SATs in the sample,namely GASU, requires a materiality assessment or prioritization of SD impact areas. Such exercisesare common in corporate SATs or in sustainability assessments (as stated by Reference [80]), which canmake it difficult for HEIs to focus their assessment efforts in those SD impact areas where they canmake the most substantive contributions to SD.
Some tools acknowledge that impacts may vary between different types of HEIs, e.g., the BSIStool with its explicit focus on business schools as distinct from universities (see Reference [51]). Otherimportant distinctions might relate to the locality and local socioeconomic importance of HEIs (e.g.,in urban or rural contexts) or simply to the size of any given HEI (e.g., in terms of student body andstaff). For instance, Hubbard [45] shows that in rural areas, in-migration of students and the resultingcultural and demographic impacts can be a major local concern. Such differences cannot currently becaptured by most SATs.
The strong focus on quantitative indicators supports the proposition that impacts, especiallyindirect ones, are neglected because quantitative assessment is frequently not feasible along complexand poorly understood causal pathways from activity to impact. For example, Hubbard [45] andYao and Bai [46] provide accounts of how HEIs affect and are affected by student in-migration andinternationalization. A capacity for assessing the impacts of internationalization through SATs wouldbe useful for the large number of HEIs that are currently promoting internationalization as part oftheir strategies [81]. Online learning (e.g., Reference [44]) is another area of high strategic relevance formany HEIs, the direct and indirect impacts of which are currently still poorly understood.
6. Conclusions
The research aims to analyze the ability of SATs to assess impacts of HEIs on SD. In so doing,the study expands upon previous examinations of SATs in higher education, which have largely focusedon what HEIs do in support of SD rather than on what they achieve for society, the economy, and thenatural environment beyond their organizational boundaries. The research examined 1134 indicatorsfor sustainability assessment derived from 19 SATs explicitly designed for application by HEIs.
While HEIs have increasingly been incorporating SD, their efforts have tended to becompartmentalized and focused on internal operations. It is becoming increasingly imperative thatHEIs take a more holistic perspective addressing their system elements and their impacts, in this way,strengthen their contribution to SD. The update of existing indicator-based SATs and the developmentof new approaches of impact assessment can support HEIs in this endeavor.
Available SATs, to a large extent, are designed to assess specific activities inside the HEI’s coreelements, and provide external stakeholders only information about the internal engagement with SD.Only a small share of indicators of the examined SATs’ aim to assess HEIs’ impacts on SD and to alarge extent indirectly via internal proxy data. SATs contribute indirectly to SD by raising awareness

Sustainability 2019, 11, 59 16 of 19
for SD; however, they tend to neglect the impacts HEIs have outside their organizational boundaries,and therefore, do not fully realize their potential to contribute to SD.
Further research should be carried out, for example on narrative assessments potential to assessimpacts of research, where there is increasing consensus that counting citations and bibliometricanalysis do not provide an accurate picture of research impacts on SD.
Author Contributions: Conceptualization, F.F.; Methodology, F.F.; Data Curation, F.F. and B.S.; Validation, F.F.and B.S.; Software, F.F. and B.S.; Writing—Original Draft Preparation, F.F. and N.S.; Writing—Review & Editing,R.L. and N.S.
Funding: This research received no external funding.
Conflicts of Interest: The authors declare no conflict of interest.
References
1. Stephens, J.; Hernandez, M.; Roman, M.; Graham, A.; Scholz, R. Higher Education as a Change Agent forSustainability in Different Cultures and Contexts. Int. J. Sustain. High. Educ. 2008, 9, 317–338. [CrossRef]
2. Cortese, A.D. The Critical Role of Higher Education in Creating a Sustainable Future. Plan. High. Educ. 2003,31, 15–22.
3. Lozano, R. Incorporation and Institutionalization of Sd into Universities: Breaking through Barriers toChange. J. Clean. Prod. 2006, 14, 787–796. [CrossRef]
4. UN (United Nations). Declaration of the United Nations Conference on the Human Environment. Availableonline: http://www.un-documents.net/unchedec.htm (accessed on 27 August 2018).
5. Lozano, R.; Lukman, R.; Lozano, F.J.; Huisingh, D.; Lambrechts, W. Declarations for Sustainability in HigherEducation: Becoming Better Leaders, through Addressing the University System. J. Clean. Prod. 2013, 48,10–19. [CrossRef]
6. UN (United Nations). Higher Education and Research for Sustainable Development (Hesd). Availableonline: https://sustainabledevelopment.un.org/partnership/?p=11748 (accessed on 27 August 2018).
7. UN (United Nations). Higher Education Sustainability Initiative (Hesi). Available online: https://sustainabledevelopment.un.org/sdinaction/hesi (accessed on 27 August 2018).
8. Gamage, P.; Sciulli, N. Sustainability Reporting by Australian Universities. Aust. J. Public Adm. 2016, 76,187–203. [CrossRef]
9. Lozano, R. A Tool for a Graphical Assessment of Sustainability in Universities (Gasu). J. Clean. Prod. 2006,14, 963–972. [CrossRef]
10. Bullock, G.; Wilder, N. The Comprehensiveness of Competing Higher Education Sustainability Assessments.Int. J. Sustain. High. Educ. 2016, 17, 282–304. [CrossRef]
11. Saadatian, O.; Dola, K.B.; Salleh, E.I.; Tahir, O.M. Identifying Strength and Weakness of Sustainable HigherEducational Assessment Approaches. Int. J. Bus. Soc. Sci. 2011, 2, 137–146.
12. Gilbert, D.U.; Rasche, A.; Waddock, S. Accountability in a Global Economy: The Emergence of InternationalAccountability Standards. Bus. Ethics 2011, 21, 23–44. [CrossRef]
13. Shriberg, M. Institutional Assessment Tools for Sustainability in Higher Education. Int. J. Sustain. High. Educ.2002, 3, 254–270. [CrossRef]
14. Berzosa, A.; Bernaldo, M.O.; Fernández-Sanchez, G. Sustainability Assessment Tools for Higher Education:An Empirical Comparative Analysis. J. Clean. Prod. 2017, 161, 812–820. [CrossRef]
15. Fischer, D.; Jenssen, S.; Tappeser, V. Getting an Empirical Hold of Thesustainable University: A ComparativeAnalysis of Evaluation Frameworks across 12 Contemporary Sustainability Assessment Tools. Assess. Eval.High. Educ. 2015, 40, 785–800. [CrossRef]
16. Yarime, M.; Tanaka, Y. The Issues and Methodologies in Sustainability Assessment Tools for Higher EducationInstitutions—A Review of Recent Trends and Future Challenges. J. Educ. Sustain. Dev. 2012, 6, 63–77.[CrossRef]
17. Findler, F.; Schönherr, N.; Lozano, R.; Reider, D.; Martinuzzi, A. Conceptualizing Sustainable DevelopmentImpacts in Higher Education—A Systematic Literature Review. Int. J. Sustain. High. Educ.. in press.
18. Vaughter, P.; Wright, T.; McKenzie, M.; Lidstone, L. Greening the Ivory Tower: A Review of EducationalResearch on Sustainability in Post-Secondary Education. Sustainability 2013, 5, 2252–2271. [CrossRef]

Sustainability 2019, 11, 59 17 of 19
19. Koehn, P.H.; Uitto, J.I. Evaluating Sustainability Education: Lessons from International DevelopmentExperience. High. Educ. 2014, 67, 621–635. [CrossRef]
20. Lebeau, Y.; Cochrane, A. Rethinking the ‘Third Mission’: Uk Universities and Regional Engagement inChallenging Times. Eur. J. High. Educ. 2015, 5, 250–263. [CrossRef]
21. Gupta, H.; Singhal, N. Framework for Embedding Sustainability in Business Schools: A Review. Vis. J. Bus.Perspect. 2017, 21, 195–203. [CrossRef]
22. Bonaccorsi, A.; Daraio, C.; Geuna, A. Universities in the New Knowledge Landscape: Tensions, Challenges,Change-an Introduction. Minerva 2010, 48, 1–4. [CrossRef]
23. Caeiro, S.; Jabbour, C.; Leal Filho, W. Sustainability Assessment Tools in Higher Education Institutions MappingTrends and Good Practices around the World; Springer: Cham, Gemany, 2013; p. 432.
24. Ceulemans, K.; Molderez, I.; Van Liedekerke, L. Sustainability Reporting in Higher Education:A Comprehensive Review of the Recent Literature and Paths for Further Research. J. Clean. Prod. 2015, 106,127–143. [CrossRef]
25. Dalal-Clayton, B.; Bass, S. Sustainable Development Strategies: A Resource Book; Earthscan Publications Ltd.:London, UK, 2002.
26. Daub, C.H. Assessing the Quality of Sustainability Reporting: An Alternative Methodological Approach.J. Clean. Prod. 2007, 15, 75–85. [CrossRef]
27. Prado-Lorenzo, J.M.; Gallego-Alvarez, I.; Garcia-Sanchez, I.M. Stakeholder Engagement and CorporateSocial Responsibility Reporting: The Ownership Structure Effect. Corp. Soc. Responsib. Environ. Manag. 2009,16, 94–107. [CrossRef]
28. Ceulemans, K.; Lozano, R.; Alonso-Almeida, M.M. Sustainability Reporting in Higher Education:Interconnecting the Reporting Process and Organisational Change Management for Sustainability.Sustainability 2015, 7, 8881–8903. [CrossRef]
29. Huber, S.; Bassen, A. Towards a Sustainability Reporting Guideline in Higher Education. Int. J. Sustain. High.Educ. 2018, 19, 218–232. [CrossRef]
30. Lozano, R.; Llobet, J.; Tideswell, G. The Process of Assessing and Reporting Sustainability at Universities:Preparing the Report of the University of Leeds. Sostenibilidad, Tecnologia y Humanismo 2013, 6, 85–112.
31. Adams, C.A. Sustainability Reporting and Performance Management in Universities—Challenges andBenefits. Sustain. Account. Manag. Policy J. 2013, 4, 384–392. [CrossRef]
32. Lambrechts, W. The Contribution of Sustainability Assessment to Policy Development in Higher Education.Assess. Eval. High. Educ. 2015, 40, 801–816. [CrossRef]
33. Alghamdi, N.; den Heijer, A.; de Jonge, H. Assessment Tools’ Indicators for Sustainability in Universities:An Analytical Overview. Int. J. Sustain. High. Educ. 2017, 18, 84–115. [CrossRef]
34. Ramos, T.B. Development of Regional Sustainability Indicators and the Role of Academia in This Process:The Portuguese Practice. J. Clean. Prod. 2009, 17, 1101–1115. [CrossRef]
35. Gallopín, G. Indicators and Their Use: Information for Decision Making. In Sustainability Indicators. Reporton the Project on Indicators of Sustainable Development; Moldan, B., Billharz, S., Eds.; John Wiley and Sons:Chichester, UK, 1997.
36. Jorgensen, A.; Le Bocq, A.; Nazarkina, L.; Hauschild, M. Methodologies for Social Life Cycle Assessment.Int. J. Life Cycle Assess. 2008, 13, 96–103. [CrossRef]
37. Sayed, A.; Asmuss, M. Benchmarking Tools for Assessing and Tracking Sustainability in Higher EducationalInstitutions. Int. J. Sustain. High. Educ. 2013, 14, 449–465. [CrossRef]
38. European Commission. Horizon 2020 Work Program 2014-2015 General Annexes H. Evaluation.Available online: http://ec.europa.eu/research/participants/data/ref/h2020/wp/2014_2015/annexes/h2020-wp1415-annex-h-esacrit_en.pdf (accessed on 20 July 2018).
39. REF (Research Excellence Framework). What Is the Ref? Available online: http://www.ref.ac.uk/about/whatref/ (accessed on 23 July 2018).
40. EFMD. Efmd Launch Business School Impact System (Bsis). Available online: https://www.efmd.org/efmd-deans-across-frontiers/view/467-efmd-launch-business-school-impact-survey (accessed on 20 July 2018).
41. Maas, K.; Liket, K. Social Impact Measurement: Classification of Methods. In Environmental ManagementAccounting and Supply Chain Management; Burritt, R.L., Schaltegger, S., Bennett, M., Pohjola, T., Csutora, M.,Eds.; Springer: Berlin, Gemany, 2011; pp. 171–202.

Sustainability 2019, 11, 59 18 of 19
42. Findler, F.; Schönherr, N.; Martinuzzi, A. Higher Education Institutions as Transformative Agents for aSustainable Society. In Chancen Und Grenzen Der Nachhaltigkeitstransformation; Luks, F., Ed.; Springer Gabler:Wiesbaden, Gemany, 2019.
43. Buckler, C.; Creech, H. Shaping the Future We Want; United Nations Educational, Scientific and CulturalOrganization: Paris, France, 2014.
44. Versteijlen, M.; Perez Salgado, F.; Janssen Groesbeek, M.; Counotte, A. Pros and Cons of Online Education asa Measure to Reduce Carbon Emissions in Higher Education in the Netherlands. Curr. Opin. Environ. Sustain.2017, 28, 80–89. [CrossRef]
45. Hubbard, P. Regulating the Social Impacts of Studentification: A Loughborough Case Study. Environ. Plan. A2008, 40, 323–341. [CrossRef]
46. Yao, L.J.; Bai, Y. The Sustainability of Economic and Cultural Impacts of International Students to RegionalAustralia. Humanomics 2008, 24, 250–262. [CrossRef]
47. Malina, M.A.; Nørreklit, H.S.O.; Selto, F.H. Lessons Learned: Advantages and Disadvantages of MixedMethod Research. Qual. Res. Account. Manag. 2011, 8, 59–71. [CrossRef]
48. Teddlie, C.; Tashakkori, A. Foundations of Mixed Methods Research Integrating Quantitative and QualitativeApproaches in the Social and Behavioral Sciences, 3rd ed.; SAGE Publications: Los Angeles, CA, USA, 2010;p. 387.
49. Roorda, N.; Rammel, C.; Waara, S.; Fra Paleo, U. Aishe 2.0 Manual: Assessment Instrument for Sustainabilityin Higher Education. Available online: http://www.eauc.org.uk/theplatform/aishe (accessed on9 August 2018).
50. Gómez, F.; Sáez-Navarrete, C.; Lioi, S.; Marzuca, V. Adaptable Model for Assessing Sustainability in HigherEducation. J. Clean. Prod. 2015, 107, 475–485. [CrossRef]
51. EFMD Global Network. Bsis Asessment Criteria Guide. Available online: http://www.efmdglobal.org/bsis(accessed on 15 September 2018).
52. Nixon, A. Improving the Campus Sustainability Assessment Process. Bachelor Thesis, Western MichiganUniversity, Kalamazoo, MI, USA, 2002.
53. Cole, L. Assessing Sustainability on Canadian University Campuses: Development of a CampusSustainability Assessment Framework. Available online: http://neumann.hec.ca/humaniterre/campus_durable/campus_memoire.pdf (accessed on 13 September 2018).
54. Legacy, C. Campus Sustainability: Sustainability Assessment Framework at the University ofWaterloo. Available online: http://environment.uwaterloo.ca/research/watgreen/projects/library/w04sustframework.pdf (accessed on 3 September 2018).
55. Waheed, B.; Khan, F.I.; Veitch, B. Developing a Quantitative Tool for Sustainability Assessment of Heis.Int. J. Sustain. High. Educ. 2011, 12, 355–368. [CrossRef]
56. Deutsche UNESCO-Kommission e.V. Hochschulen Für Eine Nachhaltige Entwicklung: Nachhaltigkeit inForschung, Lehre Und Betrieb. Available online: https://www.hrk.de/uploads/media/Hochschulen_fuer_eine_nachhaltige_Entwicklung_Feb2012.pdf (accessed on 12 September 2018).
57. Mader, C. Sustainability Process Assessment on Transformative Potentials: The Graz Model for IntegrativeDevelopment. J. Clean. Prod. 2013, 49, 54–63. [CrossRef]
58. People & Planet. People & Planet University League. How Sustainable Is Your University? Available online:https://peopleandplanet.org/university-league (accessed on 22 October 2018).
59. Penn State Green Destiny Council. Penn State Indicators Report. Steps toward a Sustainable University.Available online: http://www.willamette.edu/~nboyce/assessment/PennState.pdf (accessed on 15October 2018).
60. ULSF (University Leaders for a Sustainable Future). Sustainability Assessment Questionnaire (Saq)for Colleges and Universities. Available online: http://ulsf.org/wp-content/uploads/2015/06/SAQforHigherEd09.pdf (accessed on 12 July 2018).
61. National Wildlife Federation. State of the Campus Environment. Available online: https://www.nwf.org/en/EcoLeaders/Campus-Ecology-Resource-Center/Reports/State-of-the-Campus-Environment (accessedon 14 September 2018).
62. Good Company. Sustainability Assessment of the University of Oregon Based on Good Company’sSustainable Pathways Toolkit. Available online: https://cpfm.uoregon.edu/sites/cpfm2.uoregon.edu/files/sust_assessment_-_sust_pathways_toolkit_0.pdf (accessed on 12 September 2018).

Sustainability 2019, 11, 59 19 of 19
63. AASHE (The Association for the Advancement of Sustainability in Higher Education). Stars TechnicalManual. Version 2.1. Available online: https://stars.aashe.org/pages/about/technical-manual.html(accessed on 30 August 2018).
64. Lozano, R. Developing a Tool to Audit Curricula Contributions to Sustainable Development. In Sustainabilityat Universities—Opportunities, Challenges and Trends; Peattie, K., Ed.; Peter Lang Publishing Group: Frankfurtam Main, Germany, 2009; pp. 179–194.
65. Lukman, R.; Krajnc, D.; Glavic, P. University Ranking Using Research, Educational and EnvironmentalIndicators. J. Clean. Prod. 2010, 18, 619–628. [CrossRef]
66. Greenmetric UI. Ui Greenmetric. Criteria & Indicators. Available online: http://greenmetric.ui.ac.id/criterian-indicator/ (accessed on 22 August 2018).
67. Togo, M.; Lotz-Sisitka, H. Unit Based Sustainability Assessment Tool. A Resource Book to Complement the UnepMainstreaming Environment and Sustainability in African Universities Partnership; Share-Net: Howick, ZA,South Africa, 2009.
68. De Wet, J.; Erasmus, Z. Towards Rigour in Qualitative Analysis. Qual. Res. J. 2005, 5, 27–40. [CrossRef]69. Patton, M.Q. Qualitative Research & Evaluation Methods Integrating Theory and Practice, 4th ed.; Sage
Publications: New York, NY, USA, 2015; p. 806.70. Seuring, S.; Müller, M. From a Literature Review to a Conceptual Framework for Sustainable Supply Chain
Management. J. Clean. Prod. 2008, 16, 1699–1710. [CrossRef]71. Tinsley, H.E.A.; Weiss, D.J. Interrater Reliability and Agreement. In Handbook of Applied Multivariate Statistics
and Mathematical Modeling; Tinsley, H.E.A., Brown, S.D., Eds.; Academic Press: San Diego, CA, USA, 2000;pp. 95–124.
72. Sinkovics, N. Pattern Matching in Qualitative Analysis. In The Sage Handbook of Qualitative Businessand Management Research Methods; Cassell, C., Cunliffe, A., Grandy, G., Eds.; Sage Publications, Inc.:Thousand Oaks, CA, USA, 2018; pp. 468–485.
73. IBM. Ibm Spss Statistics. Available online: https://www.ibm.com/products/spss-statistics (accessed on17 October 2018).
74. Singh, K. Quantitative Social Research Methods, 1st ed.; SAGE Publications: New Delhi, India, 2007; p. 431.75. Field, A. Discovering Statistics Using Ibm Spss Statistics and Sex and Drugs and Rock’n’roll, 4th ed.; SAGE:
Los Angeles, CA, USA, 2013; p. 915.76. VERBI. Maxdqa—The Art of Data Analysis. Available online: http://www.maxqda.com/ (accessed on
7 October 2018).77. Flint, D.J.; Woodruff, R.B.; Fisher Gardial, S. Exploring the Phenomenon of Customers’ Desired Value Change
in a Business-to-Business Context. J. Mark. 2002, 66, 102–117. [CrossRef]78. Wallendorf, M.; Belk, R.W. Assessing Trustworthiness in Naturalistic Consumer Research. Interpret. Consum.
Res. 1989, 69–84.79. Gaviglio, A.; Bertocchi, M.; Demartini, E. A Tool for the Sustainability Assessment of Farms: Selection,
Adaptation and Use of Indicators for an Italian Case Study. Resources 2017, 6, 60. [CrossRef]80. Schönherr, N.; Findler, F.; Martinuzzi, A. Exploring the Interface of Csr and the Sustainable Development
Goals. Trans. Corp. 2017, 24, 33–47. [CrossRef]81. Bedenlier, S.; Kondakci, Y.; Zawacki-Richter, O. Two Decades of Research into the Internationalization of
Higher Education: Major Themes in the Journal of Studies in International Education (1997–2016). J. Stud.Int. Educ. 2017, 22, 108–135. [CrossRef]
© 2018 by the authors. Licensee MDPI, Basel, Switzerland. This article is an open accessarticle distributed under the terms and conditions of the Creative Commons Attribution(CC BY) license (http://creativecommons.org/licenses/by/4.0/).