Embed Size (px)
Citation preview

Assessing the Impacts of Climate Change on Energy Projects: The “Chacabuquito” Experience
An effort to understand how climate change may impact the productivity of existing
and future energy production systems
Contreras-Lisperguer, R. Energy and Climate Change Division
Department of Sustainable Development Organization of American States
2010 ABSTRACT Energy and Atmosphere Dynamics processes are interlinked in three primary ways. First, fossil fuel–based energy generation contributes directly to air pollution and climate change (Source). Second, water, atmospheric winds and solar radiation are major sources of renewable energy. And, third, Climate Change will affect the availability to get access to Renewables. Atmospheric problems can be mitigated best by increasing the efficiency with which energy is used and by reducing energy consumption1. It is crucial to optimize the use of natural energy resources and understand the atmospheric effects on energy technologies, bearing in mind that Energy and Atmosphere are naturally interlinked. This paper discusses some of the concerns surrounding the effects of climate change on the performance of current and future energy production systems in Latin American and the Caribbean. Particular emphasis is given to the impact of climate change on Renewable Energy (RE) projects appraisal and development. To do this, the ‘Chacabuquito Hydropower Project’ was analyzed to explore the impacts of Climate Change in the Hydro energy sector. ‘Chacabuquito’ was selected because it was the first verified greenhouse gas (GHG) emissions reduction project in the developing world; launched under the market-based mechanism known as the Clean Development Mechanism (CDM) under the Kyoto Protocol, the 1997 international agreement to limit global climate altering greenhouse gas emissions. The results show clearly the significant value of including Climate Change as a critical factor to take better decisions or make future projections about any particular Energy project.
1 less amounts of fossil fuels are required, that emit Co2 to the atmosphere
BACKGROUND During the next decades the world will face a unique and challenging situation, i.e. the need of moving from a ‘Fossil Fuel Era’ to a ‘Sustainable Renewable Energy Era’. We as a civilization have only one chance to resolve a century of unsustainable or excessive use of dirty2 primary energy sources (oil, coal and gas). World primary energy consumption today is nearly 16 terawatts (TW) (Source), or approximately 2.4 kilowatts (kW) per person (world population is close to 7 billion today and by 2040 we will be more than 9 billion (source)). Nowadays, fossil fuel provides almost 40% of the world’s total energy needs and as much as 90% of energy required for transportation fuels (SOURCE). Moreover, fossil fuels have a critical role in agriculture (in the form of e.g. fertilizers), which provides food to the world’s population. The “fossil fuel machines” (internal combustion engines) have transformed the world in a single century (to be specific the 20th Century) by generating, creating, expanding and fueling a cheap, and affordable transport system that opened the world to international trade and allowed for and facilitated the extensive manufacturing of consumer goods. In addition, the use of fossil fuels for electricity generation brought light and heat to households around the world, allowed for improved electronic telecommunications and triggered the development of the modern materialistic or consumer oriented human society. It is generally accepted or agreed upon that all hydrocarbons will be depleted between 2050 and 2060 if we maintain our current rate of consumption. Theseare making us face the natural decline of this primary commodity. In other words, the abusive and unsustainable use of fossil fuels that has characterized this century is making us face the natural decline of this primary commodity. For these reasons, it is necessary to understand, repeat and clarify, that fossil fuel is a finite commodity; this means that it is predestined to depletion. Unfortunately, this is not the end of the story. The Intergovernmental Panel on Climate Change (IPCC) in their Fourth Assessment Report, Climate Change 2007(SOURCE), has emphasized that Climate Change is expected to have great environmental and socio-economic consequences particularly for the Latin American and Caribbean countries. Changes in temperature, precipitation patterns, in the intensity and the frequency of extreme weather events are already being observed. Some of these effects have tangible and increasing implications to energy production and use, becoming an important risk factor for the region’s energy security. Currently there is a clear consensus that fossil fuel based energy production systems are among the main contributors to climate change. Ongoing discussions in the scientific community (IPCC 2001 and 2007) are focused on how to drive the energy sector towards the use of cleaner or renewable energy production. However, little reference has been made about the potential effects that climate change can have on existing and/or future conventional and non-conventional energy production systems. Furthermore, on how these potential effects can trigger new energy issues.
2 Fossil fuels are highly pollutant emitting a wide variety of poison gases into the air.

The estimation of future impacts due to climate change on the energy sector is difficult. Climate models and scenarios have a wide range of variations among themselves. Where comparisons of the results from different models and sources show many discrepancies. However, the impacts of climate change are important to consider because many functions of society depend strongly on the availability of energy. In addition, the energy sector is extremely capital intensive and changes only slowly or gradually. Investments are significant and their repayment period can take a long time -20-50 years-. This is the reason why climate change impact on the energy sector should be thoroughly examined, so that the right decisions and investments can be done based on quantitative data and on a sensitivity analysis of Climatic impacts. In an effort to understand the potential negative effects of Climate Change (CC) on Energy production we explore as an example the aspects related with Hydropower. Such is, because it was one of the first Renewable Energy (RE) source used massively in the world and also the availability of key data is abundant. This exercise attempts to demonstrate the potential effects and communicate the need to investigate the effects of CC in the complete energy sector. In addition, consider its harmful effects which are tampering at the same time the achievement of the Millennium Development Goals (MDGs). LINKS BETWEEN CLIMATE CHANGE AND HYDROPOWER Hydroelectric power plants capture the energy released by water falling through a vertical drop, and transform this energy into useful electricity. Basically, falling water is channeled through a turbine which converts the water's kinetic energy into mechanical power. The rotation of the water turbines is transferred to a generator which produces electricity. Hydroelectric power potential depends on stream flow, which depends directly on precipitation, temperature levels and potential evapotranspiration among others. In Latin America and the Caribbean (LAC), according to the Latin American Organization of Energy (OLADE) the potential Regional hydroelectricity in 2005 was 582,033 MW. From this potential, only 139,688 MW (about 24%) is being exploited with a gross output of 3,153,804 GWh/year.3 Hydropower provides more than 50% of electricity generated in 10 countries on the continent; were 93% of the electricity in Brazil comes from dams, 73% in Venezuela, 68% in Ecuador, 74% in Peru, 100% in Paraguay, 57% in Chile and 68% in Colombia. Governments’ response to climate change around the world may promote the development of Renewable Energies, but the effects of climate change are still of not much interest in this sector. Precipitation patterns or trends directly impacts runoff levels and stream flows which then determine the amount of water available for hydroelectric generation. Higher temperatures result in decreased snowpack accumulation, earlier snowpack melt, and increased water evaporation, all of which can reduce water availability for hydroelectric power plants. Changes in precipitation cycles due to climate change can alter river flow
3 Ríos Roca A, 2006. Perspectiva Energética de la Región: Hidro y Termoelectricidad en la Región. Organización Latinoamericana de Energía (OLADE). Retrieved in March 2009 at: http://www.olade.org/documentos2/articulos/2006-12-16-articulo%20ARR.pdf

patterns, resulting in longer periods of drought that decrease rivers’ minimum water levels and hence hydroelectric generation capacity. Another potential consequence of altered river flow patterns is the increased incidence of elevated flow rates and floodings that exceed the safety margins of existing hydroelectric plants. On the other hand, increased flow rates, if timed correctly, might result in increased hydropower generation. For example, a shift in higher stream flow rates from spring to winter (due, e.g., to less snow and more rain, or earlier snow melt) may increase hydropower generation in the winter and be reduced in the spring and summer. However, there remain doubts as to whether existing hydropower plants are able to take full advantage of increased winter flows, and whether storage systems are adequate to deal with these flows. Hydropower plants are generally designed to operate within specific river flow parameters, plus or minus a margin of safety. Climate change leading to river flow changes outside the margin of safety can have negative impacts on hydropower generation, regardless of whether the flow rate increases or decreases. The potential of a given hydro power installation to generate electricity is restrained by its storage and turbine capacity; putting limits to the amount of carry-over storage that allows generation during dry spells, and in addition the degree to which advantage can be derived from high flow levels. The precipitation and temperature trends (see Figures 1a and 1b) are useful to get a regional overview of water resources. For example, areas where precipitation tends to decrease and temperature to increase, the flow of rivers is expected to decrease. Therefore, the accumulation of water in the dams will be lower and eventually lead to a diminished ability of energy production. On the other hand, the reverse situation may augment the potential hydro-energy production and an increase of precipitation and higher temperature will lead to higher evapotranspiration levels. All assumptions made above give us an idea of the magnitude of the problem. Unfortunately, to support investors and policy makers the above assumptions are poor or weak when trying to make political, economical and design decisions.

Figure 1. (a) Precipitation (P) trends in the last century (1900-2000) (mm/day); (b) Temperature (T)
trends in the last century (1899-2007) (C/day) 4
The areas of the LAC region that are experiencing severe and long-term droughts will have a power-limiting effect on regional generation capacity and plant operation. Effects of prolonged drought on the electricity sector in LAC regions reveal the vulnerability not only of hydropower producers, but also of industries dependent on low-cost hydropower (Cases like in Costa Rica in 2007 and Venezuela in 2010). Evaporation of water from the surface of reservoirs is another important part of the water cycle that may be or will be affected by climate change and can lead to reduced water availability for hydropower. However, the effect of climate change on evaporation rates is not simple to quantify. Competition for available water resources (e.g. for cooling of thermal plants, for drinking water provision, etc) is another potantial impacts of climate change on hydropower. These impacts can have far-reaching consequences through the energy and economic sectors. The response of adaptation to potential climate variability has both near-term and long-term benefits in stabilizing water supplies and energy production. Nonetheless, water management institutions are generally slow to take action on such opportunities. The implications of climate change on hydropower resources depend on both the hydrologic pattern and design characteristics of the location of the hydro plant in question. While there appear to be no detailed studies that explore the cumulative impacts of climate change on hydroelectric generating capacity in the LAC Region, the IPCC infers that generating capacity will decrease at most major hydropower production sites in the world,5 resulting in an overall increase in the need for electric generation. This, in turn, would have primarily negative implications both for future carbon emissions mitigation efforts and for the stability of price of electricity and fossil fuels.
4 Data from: NASA Goddard Institute for Space Studies, http://data.giss.nasa.gov/. Data processing with Panoply, http://www.giss.nasa.gov/tools/panoply/. 5 IPCC. “Third Assessment Report- Impacts, Adaptation and Vulnerability.” 2001-2007. http://www.grida.no/climate/ipcc_tar/wg2/368.htm. Accessed 10/02/08.
(a) (b)
To understand the potential implications and quantify the financial impact of climate change in the energy sector, the following study was conducted as a first attempt to describe the ‘Potential Impacts of Climate Change on the Energy Sector in the Latin America and the Caribbean’. The goal of this case study is to create enough awareness of this real ongoing or emerging issue and demonstrate the needs to create an initiative for the Americas in order to improve and make more efficient use of the current funds invested in the Renewable and Non-renewable Energy Sector. The magnitude of capital investment required for energy plants installations, together with the increasing penetration of private capital in the industry makes it imperative that project analysis take into account the potential climatic effects and potential effects of climate change. It can be said that most hydropower plants have low operational costs, but high initial capital investment costs. For this reason, the debt repayment period for a hydro scheme is notably longer than for fossil fuel plants. In the last 30 years many large and mini hydropower plants have been built in LAC countries with the orientation and intention of stimulating economic development of the region. Habitually, many Hydropower plants in the LAC region are internationally financed 6 7 8 and repaid in hard currency. Reductions in project revenues may make it difficult to repay the accumulated debt, severely stressing weak economies; while the shortfall in electricity availability will hamper LAC governments in their future attempts to development new hydropower projects. In order to explore the potential changes in hydropower production as a result of climate change in LAC that is threatening the financial viability of current and future hydro schemes, it is necessary to use a strong appraisal methodology. The diverse nature of Hydropower installations and climatic conditions in LAC9 precludes any form of accurate regional or global analysis at this stage, for which a study on a case by case basis is necessary and more adequate.10 Unfortunately, the process to link water resources with climate change, using the current results from the General Circulation Model (GCM) to obtain future climatic scenarios and related with a specific performance of Hydropower plants in LAC, is very difficult. Another issue to resolve is that the GCM tends to predict not the same values due to uncertainty in the initial conditions. Further, an alternative way to resolve this is by making sensitivity analysis to a future changes on climate, in the course of the application of uniform or homogeneous evolution (changes) of climate in precipitation and temperature. Furthermore, the process of translating GCM future scenarios into a suitable form for hydrological studies is extremely complex and time consuming. Therefore, an effort of such magnitude, i.e. to study all major hydrologic
6 Inter American Development Bank; www.iadb.org/japan/eng/documents/K_E_pamphlet.pdf 7 Inter American Development Bank; www.upadi.org.br/Atlanta2006/Papers/UPADI_Conference_Bernardo%20Frydman.pdf 8 International Finance Corporation (World Bank group); http://www.ifc.org/ifcext/LAC.nsf/Content/SelectedPR?OpenDocument&UNID=7E4CF1D9C8C6F868852570B6004AD0C0 9 Latin America and Caribbean are characterized by very different climatic patterns, topographic and demographic conditions vary widely among countries. 10 Dr.Gareth P. Harrison and Prof. H.W. Whittinton; Department of Electronics & Electrical Engineering, University of Edinburgh;”Vulnerability of Hydropower Projects to Climate Change”,2001

basins in the LAC region (Figure 11), is considered beyond the scope of this preliminary research. To address these limitations we only considered a single location for this study which is sited near to the Colorado basins in Chile. The project selected was “Chacabuquito Hydroelectric Power”, first, because this plant is located in a relevant basin of Latin America; and second, because this project is putting Chile into the history books being the first ever verified greenhouse gas emission (GHG) reductions in the developing world, intended for the Clean Development Mechanism (CDM) of the Kyoto Protocol.11
Figure 11
Modeling the Problem
To asses Climate change potential impacts on Hydropower productions it is necessary to develop an analytical tool. Tools and methods in hydrologic science have been long-established. The necessary elements to be considered and the steps that must be taken to carry out an assessment about the climate change impact on hydropower are: 12 1- Select a river basin and their climatologic time data series to related rainfall-runoff processes and calibrate the model. 2- Use future climate data from GCM or arbitrary climate scenarios. 3- River runoff values are converted into estimates of hydroelectric power production.
11 http://econ.worldbank.org/WBSITE/EXTERNAL/EXTDEC/EXTRESEARCH/EXTPROGRAMS/EXTTRADERESEARCH/0,,contentMDK:20116014~isCURL:Y~menuPK:215762~pagePK:210083~piPK:152538~theSitePK:544849,00.html 12 Reibsame, W.E., Strzepek, K.M., Wescoat Jr., J.L., Perritt, R., Gaile, G.L., Jacobs, J., Leichenko, R., Magadza, C., Phien, H., Urbiztondo, B.J.,Restrepo, P., Rose, W.R., Saleh, M., Ti, L.H.,Tucci, C. & Yates, D.: Complex River Basins. In Strzepek, K.M. & Smith, J.B. (Eds.), As Climate Changes : International Impacts and Implications, Cambridge University Press, pp. 57-91, 1995.

For the first step, wherefore a variety of models techniques exist,13 it is possible to use 3 basic approaches: Empirical, Conceptual and Deterministic. Due to the complexity of the process this study necessitates a software tool. For this reason, the analysis was strictly based on the methodology introduced by Harrison 199814 and the scheme software developed by Harrison and Whittington in 2002.15 The scheme consists of several serially-connected components that allow for the projection of river flows and energy production. The originality of this model lies in the inclusion of the financial performance, based on climate change scenarios (Figure 12). The key aspects of the software are briefly described below with more detail available in Harrison and Whittington (2002). 16 Brief description of the model
Hydrological Model
The hydrological model converts climatic inputs into runoff or other hydrological outputs used for water resource design, operation and forecasting. A wide variety of examples exist with varying requirements for temporal and spatial data. For this application, a simple water balance model was adopted and incorporated into the software to provide a basic accounting procedure for water flows. The concept was originally developed by Kaczmarek and Krasuski.17
Snowmelt and Accumulation Model
This model is a module within the Hydrological Model; it solves the energy and the mass balance jointly and deals accurately with the effects of topography on the interactions among radiation physics, energy balance and hydrological cycle. Soil properties are not considered because this is a run-of-river hydro project. The snowpack is schematized as a single snow layer where a limited number of physical processes are described. The module can be seen essentially as a parameter-free model. 18 19 20 21
13 Fleming, G.: Computer Simulation Techniques in Hydrology, Elselvier Publishing, pp. 18-53, 1975. 14 Harrison, G.P., Whittington, H.W. & Gundry, S.W. 1998. Climate change impacts on hydroelectric power, Proc. 33rd Universities Power Engineering Conference (UPEC ‘98),Edinburgh, 8-10 September 1998: 391-394. 15 G. P. Harrison and H.W. Whittington, Vulnerability of hydropower projects to climate change, IEE Proc. Generation, Transmission & Distribution, 149 (3), May 2002, 249-255. 16 G. P. Harrison and H.W. Whittington, Vulnerability of hydropower projects to climate change, IEE Proc. Generation, Transmission & Distribution, 149 (3), May 2002, 249-255. 17 KACZMAREK, Z. and KRASUSKI, D.: 'Sensitivity of water balance to climate change and variability', Working Paper 91-47, International Institute for Applied Systems Analysis, Luxemburg, Austria, 1997 18 Blöschl G, Kirnbauer R, Gutknecht D. 1990. Modelling snowmelt in a mountainous river basin on a event basis. Journal of Hydrology 113: 207–229. 19 Jin J, Gao X, Yang Z L, Bales RC, Sorooshian S, Dickinson RE, Sun SF, Wu GX. 1999. Comparative analyses of physically based snowmelt models for climate simulations. Journal of Climate 12: 2643–2657. 20 Jordan R. 1991. A one-dimensional temperature model for a snowcover: Technical documentation for SNTHERM 89, Spec. Rep. 657, User’s guide. U.S. Army Cold Reg. Res. and Eng. Lab.: Hanover (NH, USA). 21 Marks D, Domingo J, Susong D, Link T, Garen D. 1999. A spatially distributed energy balance snowmelt model for application in mountain basins. Hydrological Processes 13: 1935–1959.

Electricity Model (EM) and Financial Model (FM)
Both models follow the rules and estimations used by Harrison and Whittington ,22 the EM uses the estimated energy production from the rainfall-runoff availability in order to determine the revenue in each period. The EM, in this case, is designed to allow a simulation of the Chilean conditions. A possible limitation on the model’s validity is the simplifying assumption that the electricity network absorbs all energy produced, but it is possible to consider this as a minor impediment for a preliminary investigation, as is the case with this study. The FM determines the financial performance of the project based on the revenue earned. It is practically standard and allows the user to enter assumptions regarding project costs, future rates of inflation and interest and financing structure. The discount rate (DR) used in this study was 10%, because this is the DR used in the “Chacabuquito Project Appraisal”(SOURCE) in order to compare the net present value (NPV) of the original project estimation (under current climatic conditions) against NPV considering the ‘future’ climate. The key aspects of the NPV calculation are briefly described below with more detail.
“Chacabuquito Hydroelectric”
Case Study and Analysis of the Results
The plant is located on the Aconcagua River, 10 km upstream of Los Andes (Region of Valparaiso). Los Andes is located 100 km north from Santiago (capital of Chile). The hydro power plant is located in a small valley surrounded by mountains (Aconcagua Valley). The Chacabuquito plant is downstream to (cascade) two existing upstream hydropower plants (Aconcagua of 81 MW and Los Quilos of 39 MW). The location of the plant is illustrated in Figure 13.
Figure 13. Location of Chacabuquito Hydropower Plant
22 G. P. Harrison and H.W. Whittington, Vulnerability of hydropower projects to climate change, IEE Proc. Generation, Transmission & Distribution, 149 (3), May 2002, 249-255.

The scheme modeled is for the Chacabuquito Hydroelectric Project. The Chacabuquito plant is a passing plant that uses available hydraulic resources downstream of the Los Quilos plant on the Aconcagua River (Figure 14)23. The installed capacity is 25 MW using a design flow of 24 m3/s and a total head of about 137 m.24
Figure 14
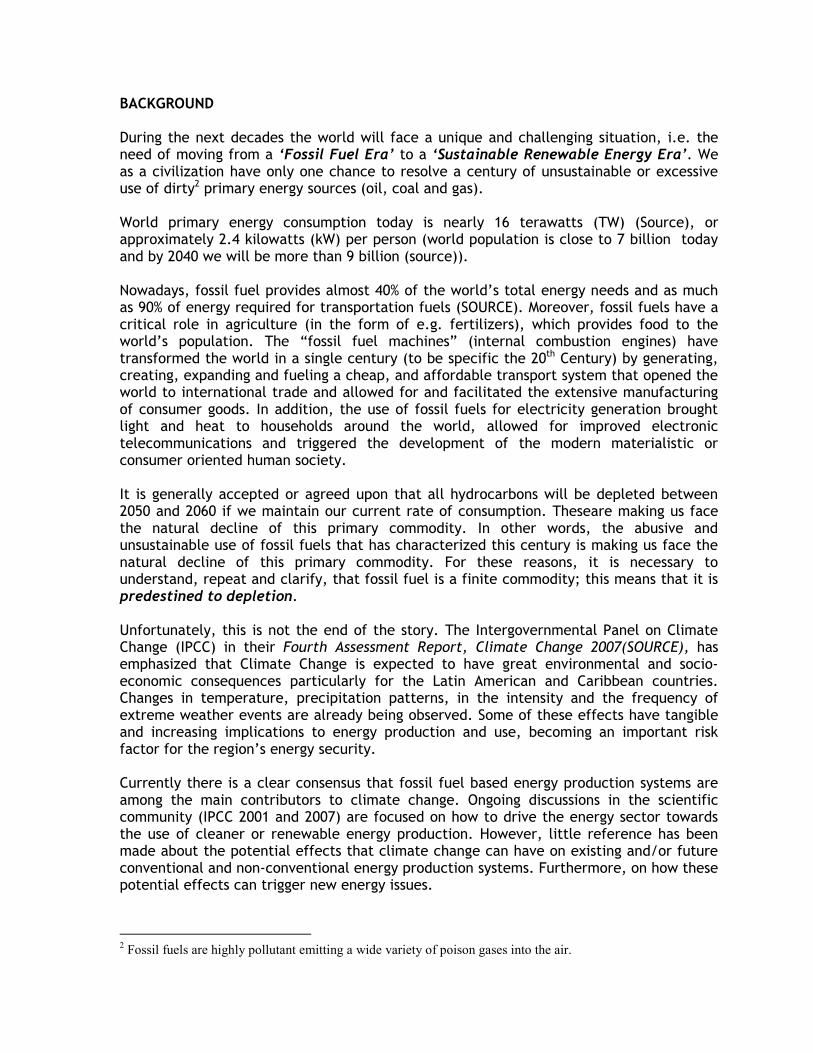
The 2001 project appraisal document,25 proposes a run-of-the-river power plant with an installed capacity of 25 MW that utilizes the waters of the Aconcagua River and will produce an average annual generation of 160 GWh (net). This scheme is modeled in a spreadsheet version of the software already described and has been modified to use with a transition plant and a simple run-of-river hydro scheme. Additionally, a simple snowmelt/accumulation model was used. A simple approach is used for the hydro scheme model with total head, cross-flow turbine efficiencies, river flows and hence production to be constant over each period. Turbine maximum and minimum flow limits are applied along with the requirement to provide a compensation flow. The model uses a monthly time step with climatic data covering 1961 to 199026. So, the model was driven by a thirty year time series of climatic data to simulate and convert climate time-series to estimate river flows. To compare the accuracy of the estimation made by the model, monthly flow rates were calculated (see Figure 15) for the
23 Chacabuquito Hydroelectric Power Project Location. Satellite Panoramic View 24 Executive Summary: Chile, Chacabuquito Hydroelectric Project, Environmental Assessment, E573 Vol.1 April 2002; downloaded 03 February, 2008; from World Bank Web site: www-wds.worldbank.org/.../WDSP/IB/2002/05/14/000094946_02042604134531/Rendered/PDF/multi0page.pdf 25 Project appraisal document on a proposed purchase of emissions reductions by the prototype carbon fund (PCF) in the amount of us$3.5 million from the hidroelectrica guardia vieja, s.a (Republic of Chile) for the Chacabuquito hydrolectric power project, December 5, 2001; downloaded 05 February, 2008 ; from World Bank Web Site: ,http://carbonfinance.org/Router.cfm?Page=Projport&ProjID=9604 26 Data generously given by the Dirección Meteorológica de Chile and Dirección General de Aguas, VILCUYA (32° 52' S, 70° 28' W, 1100 m.s.n.m)
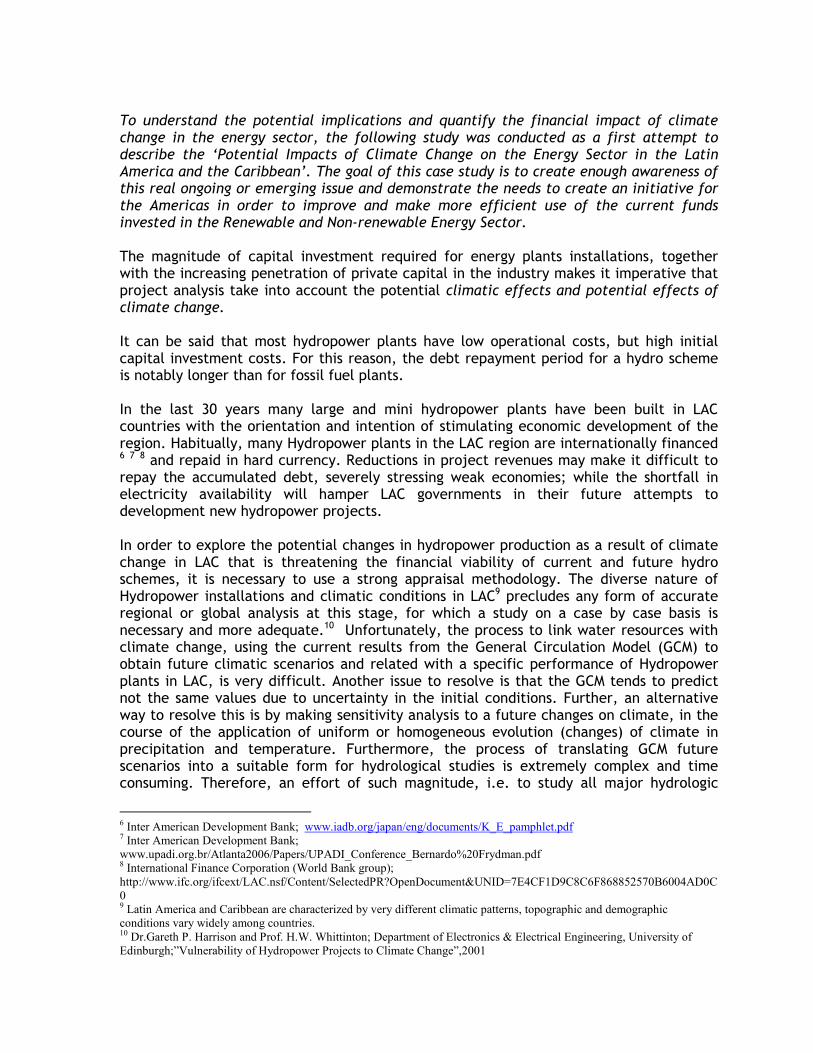
“Aconcagua-Chacabuquito” fluvial-metric station covering the years 1950-199027, located28 in the Aconcagua River, about 8 km upstream from the city of Los Andes, at 1030 m.a.s.l.29 This simulation is important because it is representative of the flow of the river in the area of the plant and as well, it represents the flow at the entrance of the Central Valley. The hydrological model was calibrated using historic river flow data measured at the Aconcagua-Chacabuquito River. The application was successful, because the
calibration resulted in a high correlation coefficient (R )81.02≅ and an excellent
representation of the dry season low flows. The resulting monthly flows from the simulation are shown together with the historic data in Figure 16.
0102030405060708090100110120130140150160
Jan Feb Mar Apr May Jun Jul Ago Sep Oct Nov Dec
Months
Average of monthly flow
5%
50%
95%
Figure 15, Monthly flows to different exceedance probabilities to Aconcagua-
Chacabuquito River
5
15
25
35
45
55
65
Jan Feb Mar Apr May Jun Jul Ago Sep Oct Nov Dec
Months
Average of monthly flow
Model
Average monthly flow
Figure 16, Comparison of average monthly observed and average simulated river flows
27 Data acquired from: Centro de Información de Recursos Hídricos (CIRH) de la Dirección General de Aguas, Chile. http://www.dga.cl/index.php?option=content&task=category§ionid=16&id=43&Itemid=169 28 Latitude 32,51 ; Longitude 70,31 29 m.a.s.l = meters above sea level

The project cost was approximately US$37.0 million including contingencies but excluding financing charges. The financial projection of the cash flow for the Chacabuquito hydro power project was obtained from the website of the World Bank.30 31 This presentation summarizes the power/energy revenues and financial factors underlying the project: (a) revenues from sales of energy and capacity payments; (b) investment; (c) operation, maintenance and administrative expenses of the hydro plant; and (d) an estimate of an accelerated depreciation based on the Chilean income tax law, by which the project will not be levied with such tax during the first six years of operation. The project expects to contract out 85GWh/year at the node price of approximately US$26.6 per MWh, and receive an installed capacity payment of US$58.31/kW/year. These estimates are consistent with both official and market forecasts. The company owns the plant and hopes to sell the remaining generation (around 75 GWh per year) at the spot market. The spot price used for the financial projections is US$14.8 per GWh which has been the historical average of the October-March period (of which years), when favorable hydrological conditions allow for higher power generation. It is expected that this price will remain relatively stable in the future. In an effort to understand the effects of Climate Change on the perceived actual financial performance of this hydro plant we calculated the NPV and internal rate of return (IRR) according to the actual climate. Further ahead, we conducted a sensitivity study based on the energy production and financial indicators with the current climate versus future climate conditions up to 2050 (the estimated lifetime of the project is up to 2050).
NPV Calculation
The NPV approach is widely used for inter-temporal project appraisal.32 It enables one to restate a future net cash flow equivalent to a current one,33 34 allowing several projects to be compared and evaluated on the present value basis. The NPV is calculated in four steps: first by deciding an appropriate time horizon for project, in this case the NPV is calculated for 51 years (project life)); secondly by calculating net cash flow in each year during the determined time horizon; thirdly by discounting future net cash flow in each year and restating them in present terms; fourthly by aggregating the discounted net cash flows. This requires data on project-related-periods, cost and revenue, and discount rate. The data employed for this analysis was described above. Within the four steps, especially discounting the future value, “time value of money” is the central concept in calculating the NPV.35 It is done by a discount factor which weighs the future cash flow.
30 http://web.worldbank.org/external/projects/main?Projectid=P074619&Type=Overview&theSitePK=40941&pagePK=64283627&menuPK=64282134&piPK=64290415 31 http://carbonfinance.org/Router.cfm?Page=PCF&FID=9707&ItemID=9707&ft=Projects&ProjID=9604 32 Lumby, Steve; Jones, Chris (1999) Investment Appraisal & Financial Decisions, Sixth Edition, ISBN 1-86152-257-6, London, UK: Thomson 33 Kolstad, Charles D. (2000) Environmental Economics ISBN 0-19-511954-1 New York: Oxford University Press, Inc. 34 Tietenberg, Tom (2003) Environmental and Natural Resource Economics Sixth Edition ISBN 0-321-18536-6 USA: Pearson Education, Inc.

Although it is not the only determinant, the NPV is one of the decision making tools commonly used to adjudicate whether an investment on a specific project is made. An investor may compare between two projects to determine which one should be invested in. The key project performance parameters are provided in the Table 5 and the Excel sheets of the Chile Hydro project (Table 6) may help the readers in understanding how the NPV was calculated for the current climate. Additionally for this case the Internal rate of Return (IRR) was calculated.
Table 5. Project parameter
35 Lumby, Steve; Jones, Chris (1999) Investment Appraisal & Financial Decisions, Sixth Edition, ISBN 1-86152-257-6, London, UK: Thomson
Project Parameter Value
Mean annual rainfall (1961-1990) 290 mm Mean flow (1961 to 1990) 28,1 m 3 /s Mean monthly production 13,3 GWh Payback period 21 years Internal Rate of Return (IRR)/Net present Value
9,8%/-0.75
Water fall / drop (Height) 137 m Life of project 51 years

Table 6. Financial indicators for the Chacabuquito Hydropower Plan for the current,
considering climate change and low climate change scenarios

Climate Sensitivity analysis
Sensitivity analysis is a technique employed when one or more factors are subject to uncertainty. This analysis attempts to assess what is the behavior of relevant economic or financial indicators (e.g. NPV and IRR) when an individual factor changes. For instance, the NPV has been calculated with a discount rate of 10%, where 8% and 12% have been also considered to portray the sensitivity of altering this factor. Further, the effects of future climate (Climate Change) are delineated through a sensitivity analysis. The GCM offers information on climatic variables in the future; nonetheless, each GCM does not predict the same change in the future (2050). For such reason an alternative to examine river flow sensitivity to changing climate is pursued through the application of uniform changes in precipitation and temperature. On a global scale, values estimated from GCM36,37, expect a temperature ascend between +1.0 and +4.0 Celsius degrees and precipitation variation between -12 and +10 %. In a regional scale, by 2050, it is expected that in this area of Chile temperatures will increase
approximately +1.5 C 0 to +2.5 C 0 (average is +2.0 C 0 ), while annual precipitation may decrease by approximately 25% and 35% (average -30%).38 These values are used because they represent the average amount of expected change in temperature and precipitation that allows us to develop the sensitivity analysis. Under these statistics, the Chacabuquito’s climate sensitivity was assessed by altering historic precipitation and temperature levels by similar amounts to those indicated by the PRECIS39 Regional Model used by the Geophysics Department of the University of Chile.40 Changes in precipitation in this sensitivity analysis ranged from 0% to -30% and a temperature increase by 0.0 to +4.0 Celsius Degrees was incorporated. These changes are applied uniformly to all months throughout each year in the analysis. The most extreme conditions considered in this research are the temperature and precipitation variations mentioned above. All other project parameters remained unaltered (except where indicated differently). The assumed future climate scenarios are compared with the calculated current climate scenario, the variation of river flows, energy production and financial indicators are presented in the following sections.
36 http://www.grida.no/climate/ipcc/regional/307.htm 37 http://www.ipcc.ch/ipccreports/ar4-wg2.htm : Latin America 38 Values calculated using a linear correlation from: http://www.dgf.uchile.cl/PRECIS ; Estudio de Variabilidad Climática en Chile para el Siglo XXI Cambios Climáticos Regionales para fines del siglo XXI obtenido mediante el modelo PRECIS; Realizado por el Departamento de Geofísica de la Universidad de Chile 39 PRECIS: 40 CONANA and Department of Geophysics, Universidad de Chile, http://mirasol.dgf.uchile.cl/#Resultados_del_proyecto

Hydrologic Sensitivity Analysis
The climate scenario foreseen for 2050 will cause a strong reduction in river-flow levels near to 65%41, interestingly the resultant change is greater than the predicted precipitation change. This situation reflects the amplifying effect on hydrology due to a precipitation change, see figure 17.
0%-10%-20%-30%-40%-50%-60%-70%
0
2
4
-30 -20 -10 0 10
Precipitation Change (%)
Temperature Rise(C)
0%
-10%
-20%
-30%
-40%
-50%
-60%
-70%
Figure 17, Variation of Annual River flows with uniform changes in precipitation and
temperature Figure 17 depicts the percentage predicted change of mean monthly river flow (diagonal lines) due to considered changes in temperature and precipitation. As was said above, the runoff tends to be greater than the precipitation change that is causing them, in affinity with other studies in different basins.42 43 Further, we can see how the runoff is more sensible to precipitation than temperature changes. In addition, runoff is relatively more sensitive to precipitation decrease than to its increase (this is indicated by the closer proximity of the contours in the left of Figure 17). Overall, the results of this simulation indicate that river flows are sensitive to changes in climate and in a particular to precipitation change, in this particular case with several negative effects for electricity generation.
41 See Figure 17, Value obtained raising in +2 Celsius degrees and +30% of precipitation. 42 N. Arnell, Global Warming, River Flows and Water Resources (Wiley, Chichester, UK, 1996). 43 REIBSAME, W.E., STRZEPEK, K.M., WESCOAT JR., J.L., PERRITT, R., GAILE, G.L., JACOBS, J., LEICHENKO, R., MAGADZA, C., PHIEN, H., URBIZTONDO, B.J., RESTREPO, P., ROSE, W.R., SALEH, M., TI, L.H., TUCCI, C. and YATES, D.: 'Complex River Basins'. In: Strzepek, K.M. and Smith, J.B. (Eds.), As Climate Changes: International Impacts and Implications (Cambridge University Press, Cambridge, 1995, pp. 57-91)

Energy Production Sensitivity Analysis
The aforementioned changes in rivers have an impact on energy production being caused by changes in precipitation and temperature44, depicted in Figure 18. The reduction of the river-flow creates a declining production of energy that has a direct and negative impact on the financial revenue stream. Further, turbine capacity restricts the plant’s facility to get benefit of increased flows, this result in a spilling or wasting of significant portions of the potential power output due to increased flows –manifesting an inadequate planning of plant capacity-. With a limited or naught capability to store water, production is more sensitive to reduced flows as a response to precipitation changes, especially snow accumulation and temperature rises; this is indicated by closer proximity of contours projected in the left end of Figure 18.
0%10%15%20%25%30%35%
40%
5%
0
2
4
-30 -20 -10 0 10
Precipitation Change (%)
Temperature Rise (C)
0%
5%
10%
15%
20%
25%
30%
35%
40%
Figure 18, Variation of annual energy production with uniform changes in
precipitation and temperature Temperature changes appear to be much less important (however temperature is relevant in demand of energy particularly in middle latitudes), altering output only by 1% per Celsius change, while average changes in climate produce a 37% decrease in electricity generation. In the case of this area and project, under future climate scenarios the annual production will decrease from 160 GWh (net) to 100.8 GWh (net). To understand the deep impact in the energy generation, we compared the monthly variation in production levels between the current climate and the future climate conditions (Figure 19); it is possible to appreciate the significant decrease in generation. Overall, energy production was found to be sensitive mostly to changes in precipitation and production variability correlated in the same proportion to the precipitation and snow accumulation levels in the mountains (Cordillera).
44 In addition, energy production is limited too by the capacity of the turbines along with the available river run-flow.

0
2
4
6
8
10
12
14
16
18
Jan Feb Mar Apr May Jun Jul Aug Sep Oct Nov Dic
Month
Average Monthly Generation (GWh)
Current Climate (Average
Condicitions)
dp=+30% ; dt=2 oC
Figure 19, Seasonal variation comparison in energy production levels between Current
Climate and Future Climate
Revenue and Financial Sensitivity Analysis
Reductions in the electricity sales of these magnitudes have a tremendous impact on the financial viability of the scheme. In this case, changes in income directly follow the pattern of production and the changes affect financial performance similarly. The impact in the NPV is significant and there is a greater vulnerability due to reduced precipitation. It has been rendered how the NPV is sensitive to changes in rainfall. A similar situation occurs with IRR, which falls to 5.9 % (at 10% discount rate). Under the rules of investment appraisal, a project should only be accepted if it returns a positive NPV at the discount rate used (in this case 10%). In this research the NPV is used as an analytical and useful tool to identify the severity of climate change required to render if the project is or not economically viable, in this case the NPV (US$ Million) falls from -0.75 to -13.17. If we compare the NPV and IRR with a very slow change climate, as an example with a rate of increase in the income of 9.25% every 10 years until complete 37% in 2050, the values are still negative As a final conclusion and based on the methodology applied the “Chacabuquito Hydro-Power Plant” is economically non-viable.
Implications of the analysis and some conclusions
This study proves that the production and financial performance are significantly different than that from historic climate conditions. This sensitivity analysis proves that the output and financial performance of the Chacabuquito Project are at risk firstly because of reductions in the level of precipitation in winter, which are reducing the amount of accumulated snow in the ‘Cordillera‘, and secondly due to rising temperatures which increase evapotranspiration. Further, this analysis is useful to identify the degree to which this project can tolerate climate change before it becomes financially non-viable.

Also, the data provided by the Climatic Numerical Simulations (CNS) model or institute? can be used in a different way and not only with the purpose to describe the future state of the atmospheric climate. CNS data is the raw material to begin with this kind of research to improve the Energy Risk Management in Energy Projects addressing Climate Change effects with a robust methodology, saving at the end millions of dollars in insufficiently assessed RE projects. The results are supposed to be taken seriously, and the author encourage project developers to consider the use of this kind of approach in the LAC region, and not only in hydropower, but as well as in the area of Wind, Solar, Tidal, OTEC and Bio-energy project developments. This study shows that the issues of mitigation and adaptation to climate change are a common theme across many vulnerable sectors. In the context of renewable energy this is a key factor for a successful implementation of new policies and projects. The research provided proves that changes in climate will directly affect the exploitation of renewable energy. It is possible to argue that many LAC countries will have hydroelectricity production vulnerabilities to climate change. As a result of the vulnerabilities and potential impacts identified in this study, it is imperative that LAC countries prioritize the identification of proactive and integrated climate change adaptation measures for the water resource sector. The region’s industry, which is heavily dependent on low-cost hydropower, is being forced to significantly limit production in the face of higher electricity prices. Of course, adaptive response is necessary for the significant cost to the regional economy in terms of lost production and revenue. Over the past decade, natural gas fired generation has almost tripled in the region. Increased dependence on natural gas in some countries, i.e. Peru, Bolivia, Chile, Argentina, and to some extent to other sources such as coal and diesel-based thermal generation have been the viable options for meeting increased demand. Still, this is an expensive option given the likelihood of a continuation in the trend towards higher natural gas and oil prices in the LAC region. Finally, gas and oil depletion will generate new future issues that till now are unresolved. In addition, availability of water to cool thermal plants can further become an issue too. The final point to make is that solutions to these above mentioned challenges are available and renewable energy technologies (RETs) are critical, but we need to know how to use RETs in a very smart way, and avoid leaving loose ends that have occurred in the past. Finally, the hydropower project assessed in this study is currently experiencing severe periods of droughts.45 If in the original project design and appraisal phase the climate change impacts would have been considered as a standard component of the analysis, the current issues due to unanticipated drought could have been resolved or at least allowed for some preventive measures to guarantee the viable technical and financial operations. In some cases this may have even led to consider the selection of a more suitable/better place to build a hydropower energy project.
45 Information retrieve in March 2009, from: http://ipsnews.net/news.asp?idnews=41223


![I Overview of the System and the Basic Statistics [1] General … · 2018-06-02 · 6 2010 2030 2055 2060 2010 2030 2055 2060 2010 2030 2055 2060 2010 2030 2055 2060 127.18 million!](https://img.pdfslide.us/doc/110x75/5f7bc0b24d489855d56d059e/i-overview-of-the-system-and-the-basic-statistics-1-general-2018-06-02-6-2010.jpg)