Embed Size (px)
Citation preview

Assessing the impact of trade facilitation on
SADC’s intra-trade potential
African Economic Conference (AEC)
Johannesburg, South Africa
1
Dr. Albert Makochekanwa
Lecturer
Department of Economics
University of Zimbabwe
Harare, Zimbabwe
Email:[email protected]
28th – 30th Oct 2013 Dr. A. Makochekannwa

Presentation Outline
Introduction
Objectives
Methodology
Findings
Recommendations
2Dr. A. Makochekannwa

Introduction
Increases in trade volumes and complexity have
significantly changed the operating environment
for trading community (OECD, 2005).
Import tariff rates have fallen, but NTMs or
NTBs have taken centre stage in being some of
the policy tools used by countries to shape their
trade policy in one way or the other
3Dr. A. Makochekannwa

Introduction Change in trade environment has also highlighted the negative
impact of inefficient border procedures on governments,
businesses and ultimately on the customer and the economy as
a whole.
In some instances, governments may face smuggling, fraud
and national security problems, which drain the public coffers,
while businesses pay the price of slow and unpredictable
goods delivery, costly customs procedures, and even lost
business opportunities.
In some cases, these “hidden” costs of trade are so high, as
much as 15% of the value of the goods traded in some cases
4Dr. A. Makochekannwa

Introduction and Objective
In SADC, although tariff rates have declined
due to FTA, NTBs have increased
Objective
The main objective of the study is to estimate
or assess the impact of trade facilitation.
5Dr. A. Makochekannwa
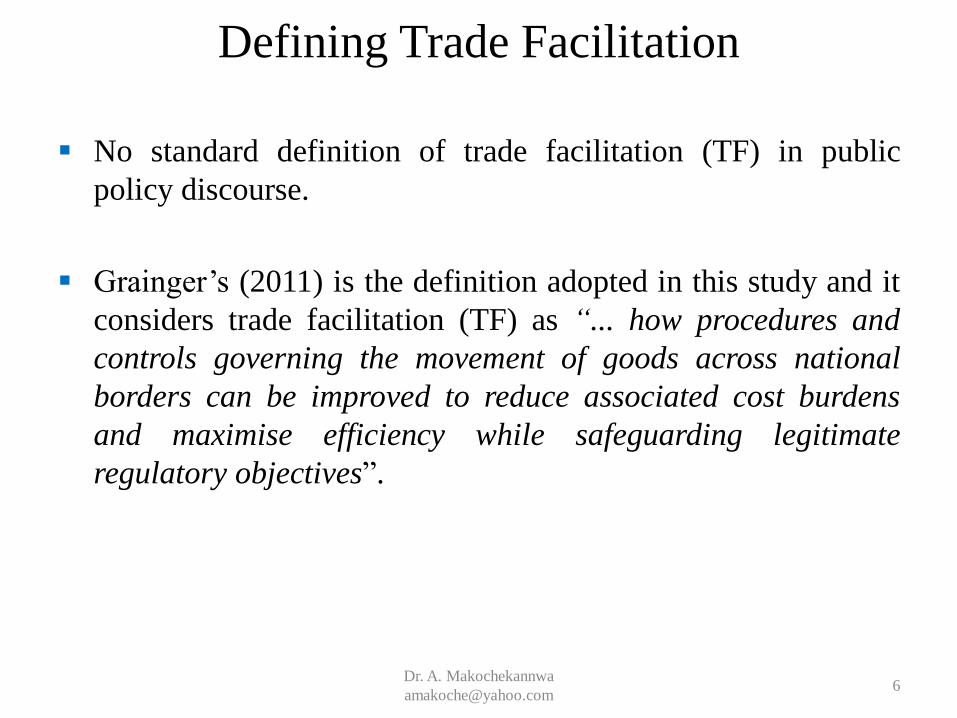
Defining Trade Facilitation
No standard definition of trade facilitation (TF) in public
policy discourse.
Grainger’s (2011) is the definition adopted in this study and it
considers trade facilitation (TF) as “... how procedures and
controls governing the movement of goods across national
borders can be improved to reduce associated cost burdens
and maximise efficiency while safeguarding legitimate
regulatory objectives”.
6Dr. A. Makochekannwa
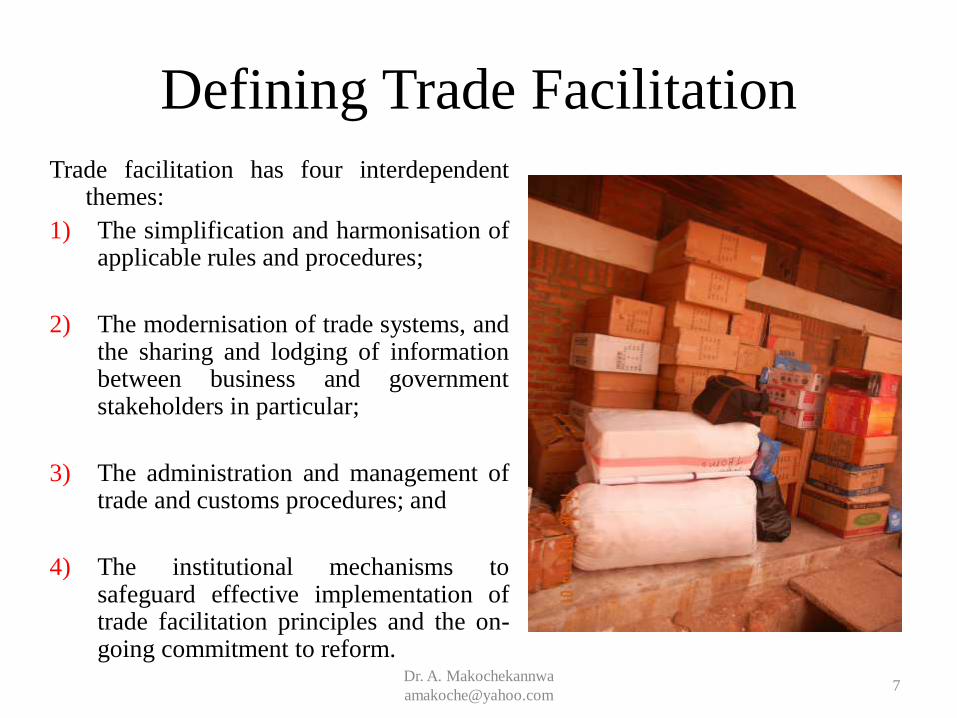
Defining Trade Facilitation
Trade facilitation has four interdependentthemes:
1) The simplification and harmonisation ofapplicable rules and procedures;
2) The modernisation of trade systems, andthe sharing and lodging of informationbetween business and governmentstakeholders in particular;
3) The administration and management oftrade and customs procedures; and
4) The institutional mechanisms tosafeguard effective implementation oftrade facilitation principles and the on-going commitment to reform.
7Dr. A. Makochekannwa
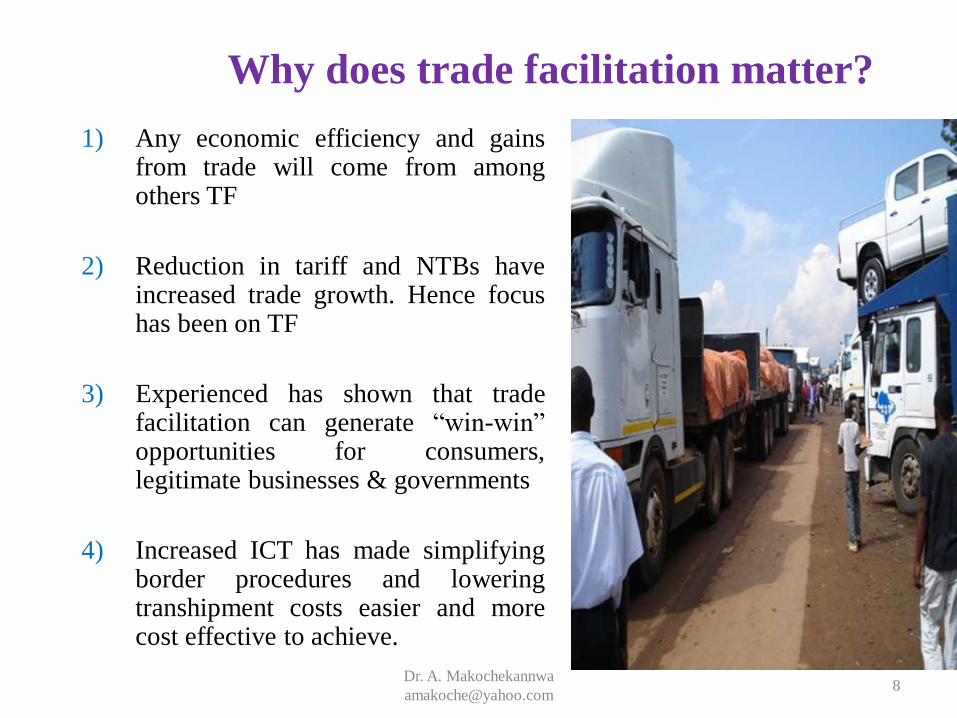
Why does trade facilitation matter?
1) Any economic efficiency and gainsfrom trade will come from amongothers TF
2) Reduction in tariff and NTBs haveincreased trade growth. Hence focushas been on TF
3) Experienced has shown that tradefacilitation can generate “win-win”opportunities for consumers,legitimate businesses & governments
4) Increased ICT has made simplifyingborder procedures and loweringtranshipment costs easier and morecost effective to achieve.
8Dr. A. Makochekannwa

SADC’s trade transaction costs Figure 1: Easy of doing Business – trading across borders (Rank)
9Dr. A. Makochekannwa
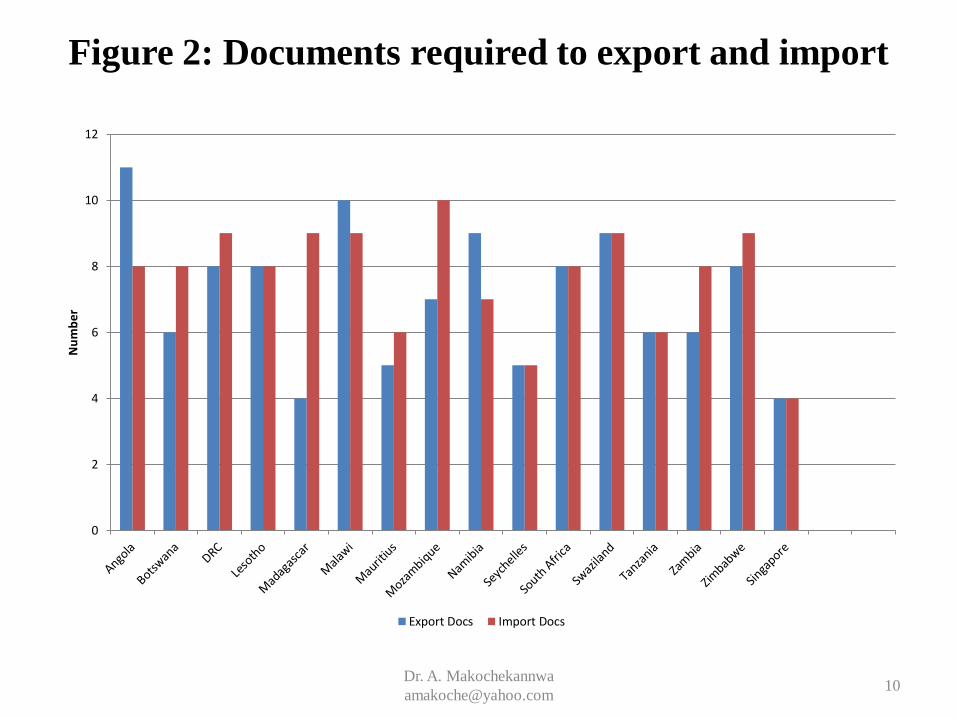
Figure 2: Documents required to export and import
0
2
4
6
8
10
12
Number
Export Docs Import Docs
10Dr. A. Makochekannwa
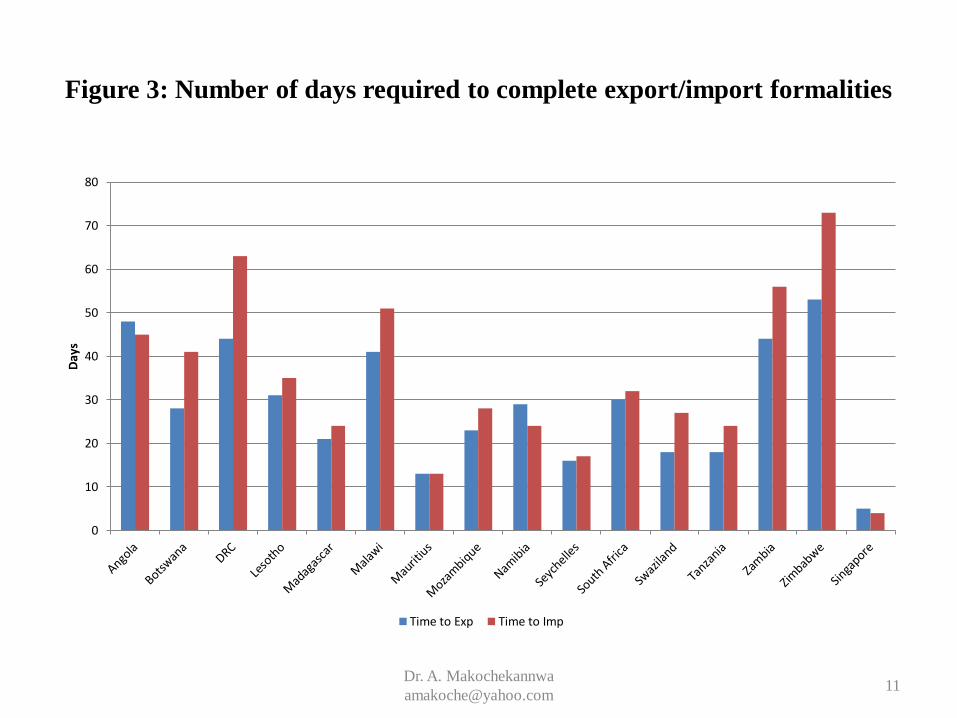
Figure 3: Number of days required to complete export/import formalities
0
10
20
30
40
50
60
70
80
Days
Time to Exp Time to Imp
11Dr. A. Makochekannwa
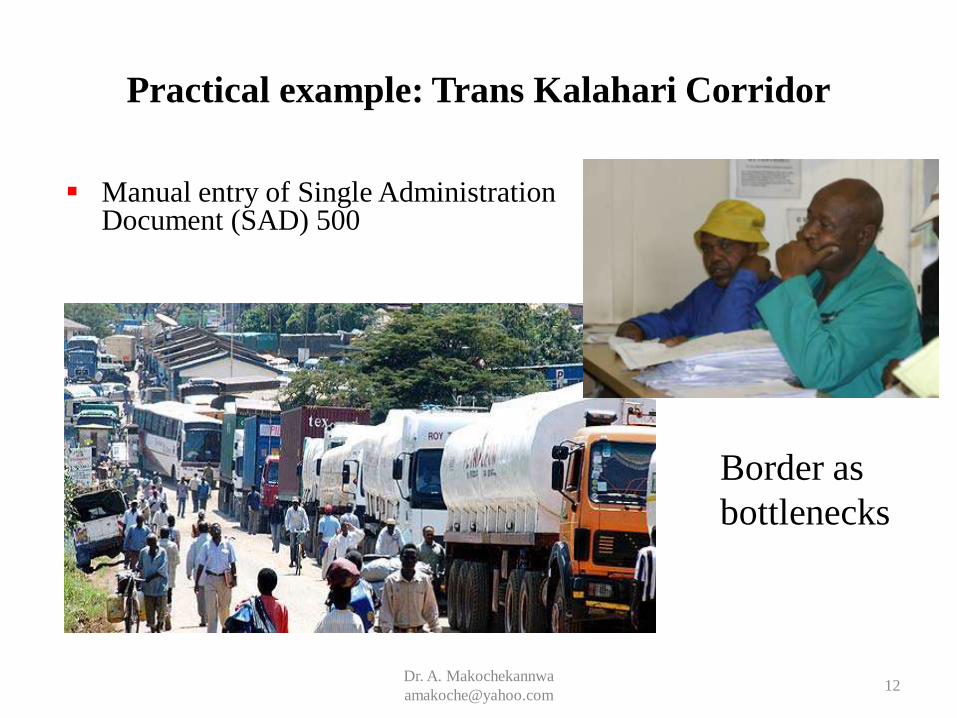
Practical example: Trans Kalahari Corridor
Manual entry of Single Administration Document (SAD) 500
12
Border as
bottlenecks
Dr. A. Makochekannwa

Literature review
13Dr. A. Makochekannwa
A 2000 study by Australian Department of Foreign Affairs and Trade and ChineseMinistry of Foreign Trade and Economic Cooperation found that moving toelectronic documentation for trade would yield a cost savings of some “1.5 to 15percent of the landed cost of an imported item.”
Freund and Weinhold (2000) employed a gravity model to estimate the role of e-commerce in promoting bilateral trade. The study found that a 10 percent increasein the relative number of web hosts in one country would have increased by onepercent trade flows in 1998 and 1999.
The analysis which was conducted by Fink, Mattoo and Neagu (mimeo) applied agravity model to estimate the effect of the communication costs on bilateral trade.They found that a 10 percent decrease in the bilateral calling price was associatedwith an 8 percent increase in bilateral trade.
Otsuki, Wilson and Sewadeh (2001a, 2001b) employed a gravity model to the caseof food safety standards, and found that African export of cereals, nuts and driedfruits were likely to fall by 4.3% on cereals, and 11% on nuts and dried fruitsfollowing a 10% tighter of EU standard on aflatoxin contamination levels of theseproducts.

Literature review
14Dr. A. Makochekannwa
The study by Simwaka (2011) investigated what the SADC countries could gain byway of increases in intra-regional trade if all trade barriers were to be removed. Thepaper found that observed intra-regional trade was lower than its potential, thussuggesting existence of trade potential in the sub-region.
The paper by Cassim (2001) employed a cross section econometric gravity toinvestigate the potential for trade among SADC countries. The research foundexistence of unrealized potential trade mostly between South African andZimbabwean.
The Chauvin et al. (2002) study investigated the benefits expected from the SADCFTA given the economic structure disparities existing among its participatingmembers. The research found that trade was nearly exhausted with limited space forfurther trade potential increase.
Elbadawi (1997) which was done before SADC free trade area (FTA) became intoexistence found that the region had no significant effect on trade among itsmembers, although the performance of the bloc slightly improved when controllingfor exchange rate policy effects.

Methodology – Gravity model
Where I and J = exporter and importer respectively
Expij= value of exports from country I to J
tariffij = denotes applied tariff rate in the percent
PEI, CEI,and EBI = importing country J’s indicators of port efficiency,
customs environment, and e-business usage.
GDP = gross domestic product
DISTIJ = distance between economic centres of I and J
LANG language dummies include English, French and Portuguese.
CBji = adjacency dummy or common border
ijIJIJ
t
J
t
I
III
t
IJ
t
tIJ
CBijLANGDSTGDPGDP
EBCEPEtariffExp
98765
43210
lnlnln
lnlnln100lnln
15Dr. A. Makochekannwa

Table 2: Gravity model explanatory variables
Variable Expecte
d sign
Theoretical intuition
Port Efficiency (PE) + As port efficiency improve at destination J, XIJ increases.
Customs Environment
(CE)
+ As economy J implements simple customs procedures, XIJ
increases.
E-business Usage + As economy J increases business use of Internet, XIJ
increases.
Exporter GDP + Measures production capacity, more production means more
exports
Importer GDP + Measures absorption capacity, higher GDP, means higher
import demand
Distance - Imposes trade costs, greater distance means more costs,
hence less trade
Language + Sharing same language reduces costs, and increase trade
Adjacent (border) + Countries closer to each other tend to trade more
16Dr. A. Makochekannwa

Methodology – Trade potentials This section will rely on the gravity model results from Equation (4). The ratio of
export trade potential (P) as simulated/predicted by the gravity model and actual
export trade (A), i.e., (P/A), will be used to analyze the future direction of export
trade for each of the countries.
In terms of interpretation, in a case where the value of the ratio (P/A) exceeds 1, that
will indicate existence and evidence of unrealised (or untapped) trade potential
between each SADC member countries’ trade with other regional member countries.
For instance, if the value of (P/A) is greater than 1 for a given country, say Malawi’s
export trade with Tanzania, it will imply that Malawi will be having untapped or
unrealized trade potential with Tanzania.
In this instance, and following Batra (2004) and the International Trade Centre
(ITC) (2005, 2003), evidence of unrealized export trade in turn implies the potential
for Malawi to expand its exports to Tanzania.
17Dr. A. Makochekannwa

Methodology – Trade potentials On the other hand, if the value of (P/A) is less than 1 for a given
country, say Botswana’s export trade with Mozambique, it indicates that
Botswana has exceeded its trade potential with Mozambique.
Exhaustation of trade potentials is an indication of a successful
partnership among trading countries (International Trade Centre (ITC)
(2005, 2003).
Exhaustation of trade potential does not imply that these countries
should not trade, but only implies that it may be difficult to increase the
levels of trade between such trading partners.
As such, the best that can be done especially by the reporter partners is
to ensure they try to maintain that level of trade.
18Dr. A. Makochekannwa

Data and data sources - Trade facilitation measures
The study include three indicators of trade facilitation that measure three
different categories of trade facilitation effort and these are: (Wilson et al
2003, 2005),
1) Port efficiency (PE) is designed to measure the quality of infrastructure of
maritime and air ports.
2) Customs Environment (CE) is designed to measure direct customs costs
as well as administrative transparency of customs and border crossings and
3) E-business usage (EB) is designed to measure the extent to which an
economy has the necessary domestic infrastructure (such as
telecommunications, financial intermediaries, and logistics firms) and is
using networked information to improve efficiency and to transform
activities to enhance economic activity..
19Dr. A. Makochekannwa
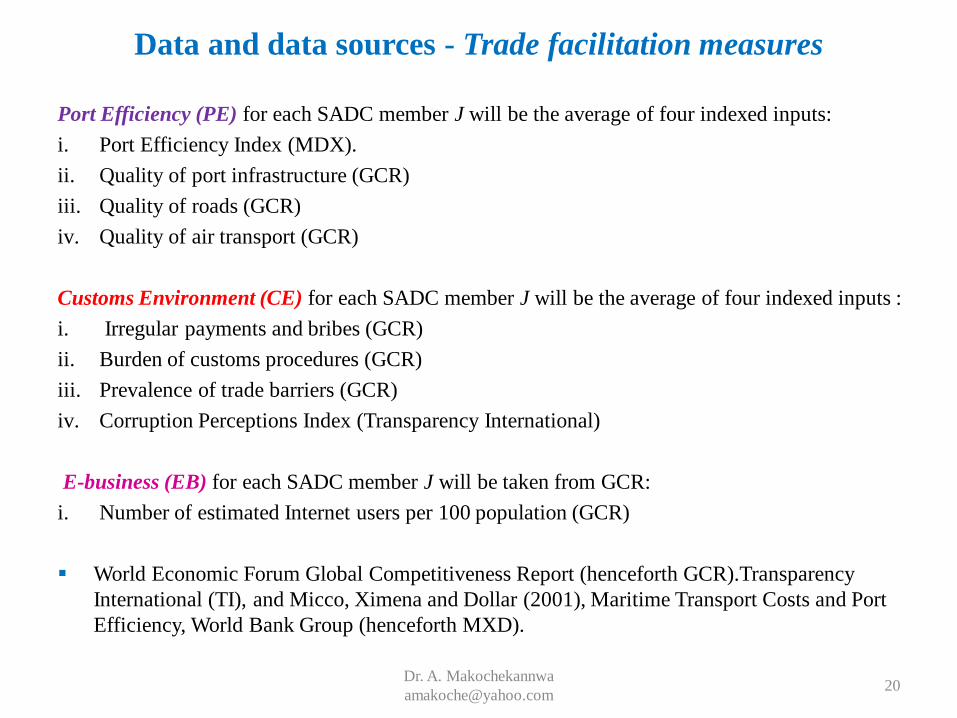
Data and data sources - Trade facilitation measures
Port Efficiency (PE) for each SADC member J will be the average of four indexed inputs:
i. Port Efficiency Index (MDX).
ii. Quality of port infrastructure (GCR)
iii. Quality of roads (GCR)
iv. Quality of air transport (GCR)
Customs Environment (CE) for each SADC member J will be the average of four indexed inputs :
i. Irregular payments and bribes (GCR)
ii. Burden of customs procedures (GCR)
iii. Prevalence of trade barriers (GCR)
iv. Corruption Perceptions Index (Transparency International)
E-business (EB) for each SADC member J will be taken from GCR:
i. Number of estimated Internet users per 100 population (GCR)
World Economic Forum Global Competitiveness Report (henceforth GCR).Transparency
International (TI), and Micco, Ximena and Dollar (2001), Maritime Transport Costs and Port
Efficiency, World Bank Group (henceforth MXD).
20Dr. A. Makochekannwa

Discussion of Results
Overall, the study’s analysis
indicates the fact that trade
facilitation involves more
than reducing the commonly
cited problem in SADC
trade, which is cost of
transportation, although this
factor is also quite important
21Dr. A. Makochekannwa

Table 4: Regression results
Variable Coefficient Std. Error t-Statistic Prob.
Constant 5.32 12.84 0.41 0.6789
Tariff 4.21 2.73 1.54 0.1235
Port Efficiency (Importer) 0.71 0.55 1.28 0.2009
Port Efficiency (Exporter) 1.34 0.59 2.27 0.0239
Customs Environment (Importer) -2.03 1.09 -1.85 0.0645
E-business Usage (Importer) 0.43 0.13 3.31 0.0010
E-business Usage (Exporter) 0.31 0.12 2.70 0.0072
Exporter GDP 1.50 0.09 16.02 0.0000
Importer GDP 1.19 0.07 16.58 0.0000
Distance -3.32 0.24 -14.07 0.0000
Language 1.52 0.21 7.26 0.0000
Common border 1.11 0.24 4.57 0.0000
Number of observations 580
Adjusted R2 0.671
F-Test 108
22Dr. A. Makochekannwa
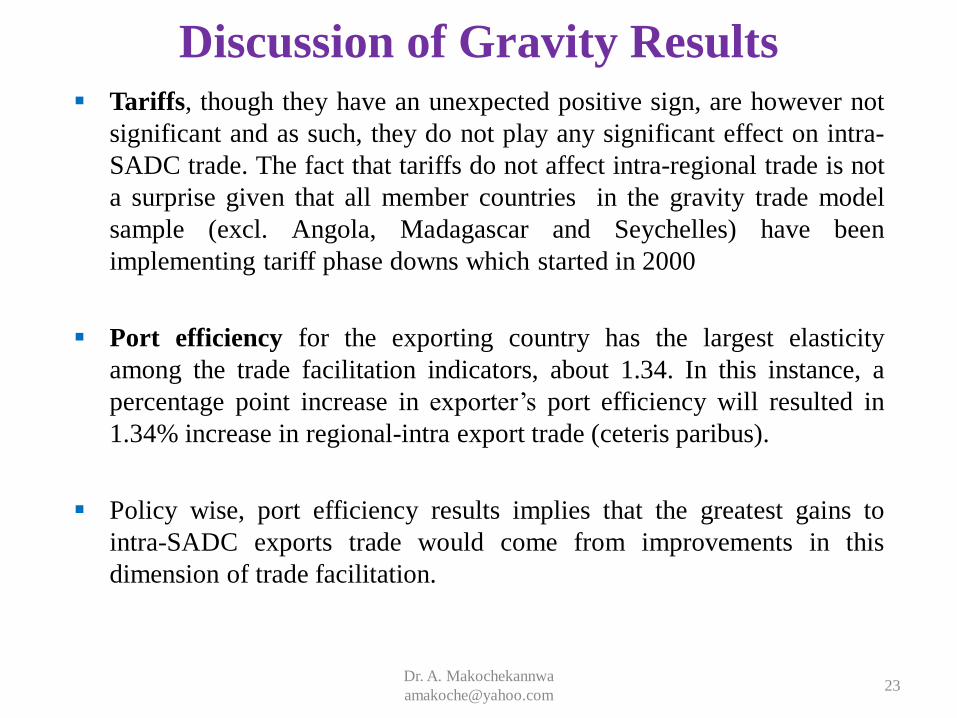
Discussion of Gravity Results Tariffs, though they have an unexpected positive sign, are however not
significant and as such, they do not play any significant effect on intra-
SADC trade. The fact that tariffs do not affect intra-regional trade is not
a surprise given that all member countries in the gravity trade model
sample (excl. Angola, Madagascar and Seychelles) have been
implementing tariff phase downs which started in 2000
Port efficiency for the exporting country has the largest elasticity
among the trade facilitation indicators, about 1.34. In this instance, a
percentage point increase in exporter’s port efficiency will resulted in
1.34% increase in regional-intra export trade (ceteris paribus).
Policy wise, port efficiency results implies that the greatest gains to
intra-SADC exports trade would come from improvements in this
dimension of trade facilitation.
23Dr. A. Makochekannwa
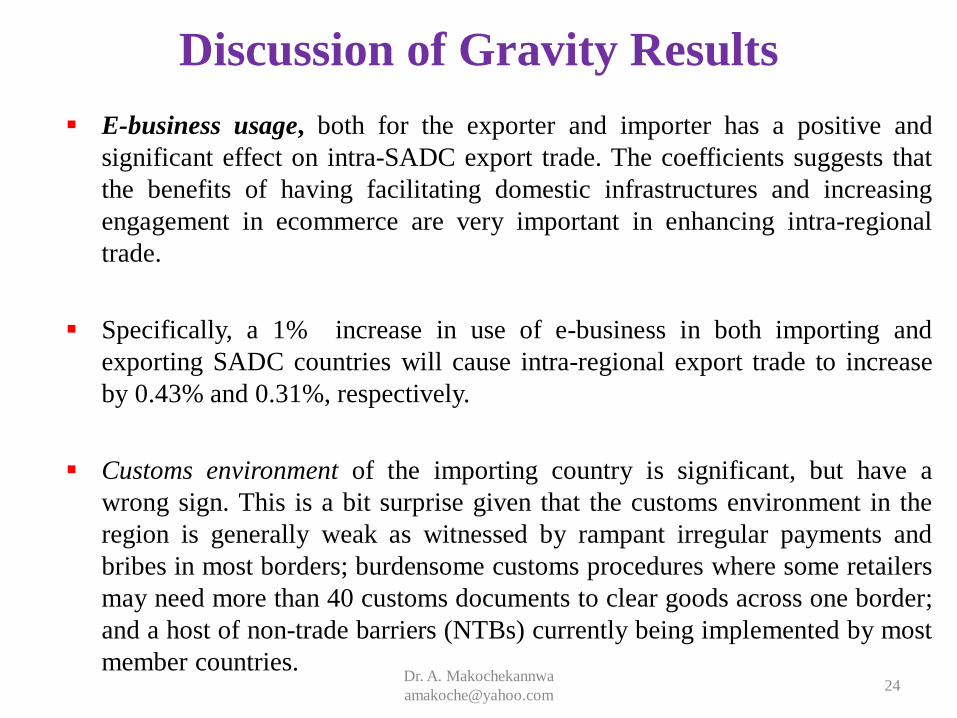
Discussion of Gravity Results
E-business usage, both for the exporter and importer has a positive and
significant effect on intra-SADC export trade. The coefficients suggests that
the benefits of having facilitating domestic infrastructures and increasing
engagement in ecommerce are very important in enhancing intra-regional
trade.
Specifically, a 1% increase in use of e-business in both importing and
exporting SADC countries will cause intra-regional export trade to increase
by 0.43% and 0.31%, respectively.
Customs environment of the importing country is significant, but have a
wrong sign. This is a bit surprise given that the customs environment in the
region is generally weak as witnessed by rampant irregular payments and
bribes in most borders; burdensome customs procedures where some retailers
may need more than 40 customs documents to clear goods across one border;
and a host of non-trade barriers (NTBs) currently being implemented by most
member countries.24
Dr. A. Makochekannwa

Discussion of Gravity Results Considering the traditional gravity trade model variables, a 1% increase in
gross domestic product (GDP)of both the exporter and importer countrieswill increase intra-SADC export trade by 1.5% and 1.19%, respectively.This positive relationship is, as pointed earlier, according to theoreticalexpectations.
The negative coefficient on distance is according to theoretical expectation,whereby an increase in distance will increase such things as transaction andtransportation costs, among other expenses, thus resulting in a reduction inexports of meat and meat products. According to Table 4, a 1% increase indistance reduces intra-SADC export trade by 3.3%.
The coefficient of common border is positive and statistically significant at1% level of significance. This, as said before, this is according totheoretical expectations which assumes that countries which shares acommon border are more likely to trade with each other than countrieswhich do not share a common border.
25Dr. A. Makochekannwa
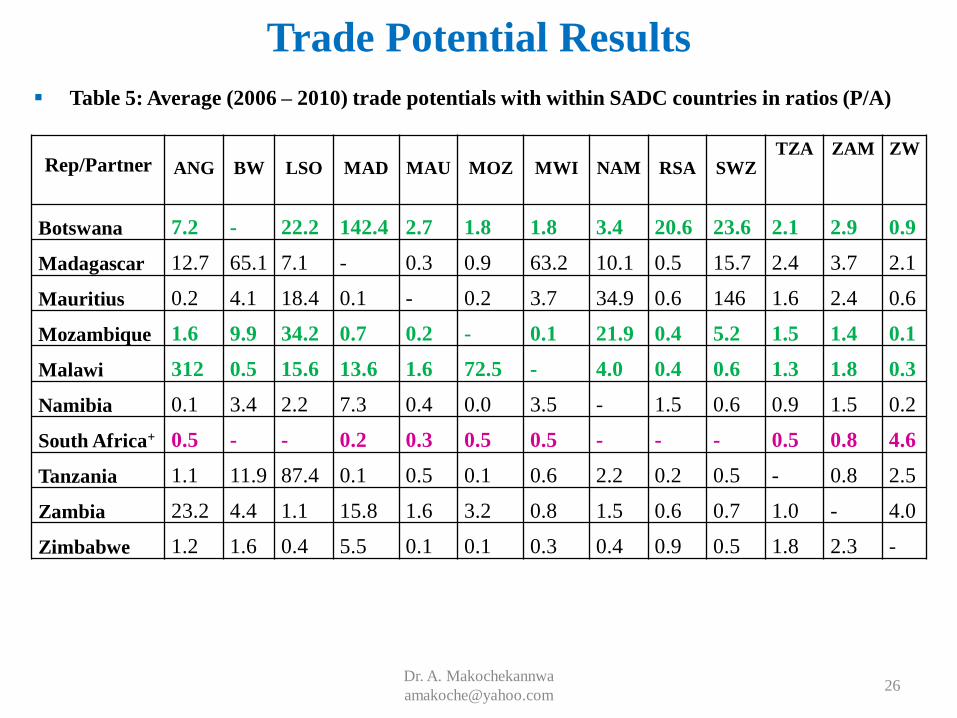
Trade Potential Results
Table 5: Average (2006 – 2010) trade potentials with within SADC countries in ratios (P/A)
26Dr. A. Makochekannwa
Rep/Partner ANG BW LSO MAD MAU MOZ MWI NAM RSA SWZTZA ZAM ZW
Botswana 7.2 - 22.2 142.4 2.7 1.8 1.8 3.4 20.6 23.6 2.1 2.9 0.9
Madagascar 12.7 65.1 7.1 - 0.3 0.9 63.2 10.1 0.5 15.7 2.4 3.7 2.1
Mauritius 0.2 4.1 18.4 0.1 - 0.2 3.7 34.9 0.6 146 1.6 2.4 0.6
Mozambique 1.6 9.9 34.2 0.7 0.2 - 0.1 21.9 0.4 5.2 1.5 1.4 0.1
Malawi 312 0.5 15.6 13.6 1.6 72.5 - 4.0 0.4 0.6 1.3 1.8 0.3
Namibia 0.1 3.4 2.2 7.3 0.4 0.0 3.5 - 1.5 0.6 0.9 1.5 0.2
South Africa+ 0.5 - - 0.2 0.3 0.5 0.5 - - - 0.5 0.8 4.6
Tanzania 1.1 11.9 87.4 0.1 0.5 0.1 0.6 2.2 0.2 0.5 - 0.8 2.5
Zambia 23.2 4.4 1.1 15.8 1.6 3.2 0.8 1.5 0.6 0.7 1.0 - 4.0
Zimbabwe 1.2 1.6 0.4 5.5 0.1 0.1 0.3 0.4 0.9 0.5 1.8 2.3 -

Trade Potential Results (UP)
For a country like Botswana, the country has ratio values of greater than one
with 11 out of the 12 SADC trading partners (except Zimbabwe), with the
highest unrealized trading potential suggested with Madagascar.
In this case, Botswana tabulated information shows that Botswana and its 11
SADC trading partners are trading much less than what the gravity model
predicts and this implies that Botswana has untapped trade with countries.
This scenario suggests that it will be to the advantage of Botswana if the country
continues to make all efforts to improve trade facilitation efforts.
The benefits of trade facilitation will be further enhanced if, on the other hand,
the 11 SADC member countries with which Botswana has untapped trade
potential also implement regulations to improve trade facilitation from their
respective trade regimes.
27Dr. A. Makochekannwa
Trade Potential Results (EP)
Table 6 indicates that countries such as South Africa and Zimbabwe,
among others, have exhausted their respective trade potentials with
regional trading partners.
Exhaustation of trade potentials is an indication of a successful
partnership among trading countries (International Trade Centre (ITC)
(2005, 2003).
Exhaustation of trade potential does not imply that these countries
should not trade, but only implies that it may be difficult to increase
the levels of trade between such trading partners.
As such, the best that can be done especially by the reporter partners
is to ensure they try to maintain that level of trade.
28Dr. A. Makochekannwa
Conclusion This study, unlike most previous studies which used costs of transport as a
measure of trade facilitation in the gravity model, sets itself apart by thefact that it includes a variety of indicators of trade facilitation.
The set of indicators includes country-specific trade facilitation indicatorsfor port efficiency, customs environment and e-commerce use by business.
Findings 1: The research found that improvements in port efficiency andincreased use of e-business are some of the factors which boost intra-SADC trade in exports.
Thus, SADC policy makers should implement strategies which improvesport efficiency and also encourage use of e-business.
Findings 2: Overall, the potential trade simulations shows mixed results,with some reporting countries seems to have exhausted their tradepotentials, while other still indicated as having untapped trade potentialswith their respective regional trading partners.
29Dr. A. Makochekannwa