Embed Size (px)
Citation preview

Assessing the impact of mobile consolidation on innovation and qualityAn evaluation of the Hutchison/Orange merger in Austria
ANNEX

ASSESSING THE IMPACT OF MOBILE CONSOLIDATION ON INNOVATION AND QUALITY
The GSMA represents the interests of mobile operators worldwide, uniting nearly 800 operators with more than 300 companies in the broader mobile ecosystem, including handset and device makers, software companies, equipment providers and internet companies, as well as organisations in adjacent industry sectors. The GSMA also produces industry-leading events such as Mobile World Congress, Mobile World Congress Shanghai, Mobile World Congress Americas and the Mobile 360 Series of conferences.
For more information, please visit the GSMA corporate website at www.gsma.com. Follow the GSMA on Twitter: @GSMA and @GSMAPolicy
GSMA Intelligence is the definitive source of global mobile operator data, analysis and forecasts, and publisher of authoritative industry reports and research. Our data covers every operator group, network and MVNO in every country worldwide – from Afghanistan to Zimbabwe. It is the most accurate and complete set of industry metrics available, comprising tens of millions of individual data points, updated daily. GSMA Intelligence is relied on by leading operators, vendors, regulators, financial institutions and third-party industry players, to support strategic decision-making and long-term investment planning. The data is used as an industry reference point and is frequently cited by the media and by the industry itself. Our team of analysts and experts produce regular thought-leading research reports across a range of industry topics.
Authors Xavier Pedrós, EconomistKalvin Bahia, Principal EconomistPau Castells, Director of Economic AnalysisSerafino Abate, Director of Competition Economics

ASSESSING THE IMPACT OF MOBILE CONSOLIDATION ON INNOVATION AND QUALITY
3
A1. Methodology 5
A1.1 General counterfactual considerations 5
A1.2 Difference-in-Difference 5
A1.2.1 Base model 5
A1.2.2 Trend model 7
A1.2.3 Robustness checks 8
A1.3 Synthetic control 9
A1.3.1 Framework 9
A1.3.2 Robustness checks 10
A2. Data 11
A2.1 Data sources 11
A2.2 List of operators included in study 12
A2.3. Network quality test statistics 13
A3. Results 14
A3.1 4G coverage 14
A.3.1.1 Merger effects on Hutchison 14
A.3.1.2 Market-wide effects 18
A3.2 4G network quality 21
A.3.2.1 Merger effects on Hutchison 21
A.3.2.2 Market-wide merger effects 22
A3.3 3G Network quality 25
A.3.3.1 Merger effects on Hutchison 25
A.3.3.2 Market-wide merger effects 30
A4. References 34
Annex

4
ASSESSING THE IMPACT OF MOBILE CONSOLIDATION ON INNOVATION AND QUALITY

5
ASSESSING THE IMPACT OF MOBILE CONSOLIDATION ON INNOVATION AND QUALITY
When assessing the effects of the Hutchison/Orange merger in Austria, the European Commission (EC) used the pre-merger status quo as the counterfactual scenario. As expressed by the EC, “the relevant comparison for evaluating the effects of the merger is constituted by the competitive conditions existing at the time of the merger as set out in paragraph 9 of the Horizontal Guidelines, namely that Orange would remain a comparably relevant competitor in the Austrian market for mobile telecommunications services to end customers as it has been to date”1.
Being consistent with the above, the counterfactual scenario in this study is based on
a market that consists of four separate mobile networks in Austria after 2012 (as was the case before the merger). In its assessment, the EC suggested that a network sharing agreement could achieve some of the efficiencies claimed by Hutchison. However, there is no certainty about whether this would have happened absent of the merger; for example Hutchison argued that a network sharing agreement was not realistic due to different strategies around network design, concerns about losing a competitive edge over a competitor and confidentiality issues. It is beyond the scope of this study to consider a wide range of counterfactual scenarios (of which network sharing is only one).
A1.2.1 Base model
In our Base model (Equation 1 below), we implement the DD approach using an OLS fixed-effects regression. In this basic DD framework the counterfactual evolution of the outcomes for treated units is the post-merger evolution in the control set
of operators. This Base model controls for all time invariant factors at the country level and time-specific events. The model is estimated at the operator level, in a multi-period setting, and allows for the identification of dynamic merger effects.
where yi,j,t is one of the outcomes for operator i in country j at time t. The outcomes we look at are 4G
coverage, download speeds (3G and 4G) and upload speeds (3G and 4G).
A1. MethodologyA1.1 General counterfactual considerations
A1.2 Difference-in-Difference
1. See paragraph 401 of the EC decision on the Hutchison/Orange merger.
yi,j,t = α+δDi+ΣλtTt+ ρY 1(Di * T Y 1)+ρY 2(Di * TY 2)+ρY 3+(Di * TY 3+)+
+ ΣγjCj+ Σ μkXi,j,t,k+ εi,j,t
i,t i,t i,tt
j
K
k=1
(1)

6
ASSESSING THE IMPACT OF MOBILE CONSOLIDATION ON INNOVATION AND QUALITY
The DD has three main variables:
Di is a treatment dummy, taking value 1 if operator i is in the treatment group. In the merged entity analysis, Hutchison is the only operator being treated, while in the market-wide effects A1 Telekom and T-Mobile are included in the treatment group as well. This variable captures fixed unobserved factors of the treated operator(s) that can be relevant for the outcome (i.e., business strategy, resources, firm structure and management).
Tt are quarterly time dummies2, which account for time-specific events common to all operators that may impact some of the outcomes. Examples include the launch of handsets that are compatible with 4G spectrum bands, which could drive 4G take-up (and is therefore likely to impact 4G rollout and the measures of quality).
ρY 1, ρY 2 and ρY 3+ are the merger effects. These result from the inclusion of interaction terms between the treatment dummy Di and three post-treatment period dummies (T Y 1, TY 2 and TY
3+). The latter identify three time periods: first year (2013), second year (2014) and more than two years after the merger (2015 and 2016). This approach to capturing merger effects is consistent with DG Competition (2015) and RTR (2016).
Besides the main variables above, we add a number of controls. Cj are country dummies to account for time invariant characteristics of a country that will affect 4G coverage and network quality (geography, climate, regulation3, etc.) We also include a set of controls X with K variables (Σ Xi,j,t,k.) likely to shape coverage and network quality, which vary within each country over time.
The mobile-specific controls we include are as follows:
4Gspectrumi,j,t and 3Gspectrumi,j,t are the amount of 4G or 3G-relevant spectrum held by operator i in country j at time t. We consider 800, 18004 and 2600 MHz bands to be 4G-dedicated, and 2100 and 900 MHz to be for 3G technologies. Spectrum holdings have been aggregated into ‘4G’ and ‘3G’ bands to increase variability of the data.5 The inclusion of spectrum controls for biases that would arise from differences in coverage that that are attributed to
variation in spectrum holdings in both treated and control operators (i.e. via auctions or trading).
4Gspectrumi,j,t are three spectrum dummies that represent the number of quarters that spectrum for 4G networks has been available for operator i in country j at time t. We include three dummies, taking value 1 if time t is 1-2 years, 2-4 years or 4-6 years since the first assignment of 4G spectrum to the operator.6 The rationale of their inclusion is that the more time an operator has had spectrum available, the more coverage and network quality it should have rolled out.
Only for 4G coverage models, we include the following:
coverage3Gi,j,t is the 3G coverage of operator i in country j at time t. This is potentially relevant to 4G coverage because an operator with a large 3G network is likely to incur lower 4G rollout costs than another operator with a small 3G network (all else being equal) as they already have some of the key network elements in place (backhaul and core, cell sites etc).
downloadspeeds3Gi,j,t is the average download speed of operator i's 3G network in country j at time t. We include this because if an operator has made significant investments in upgrading its 3G network, it may wait some time before rolling out a large 4G network, partly to earn a return on the 3G investment and also because its customers may be less willing – or have less need – to upgrade to 4G.
Aside from the above, there are five mobile-specific factors that we have not included in our model, which may stand out at first glance.
First, spectrum holdings would ideally be estimated in separate frequency bands since they have different propagation and capacity properties that may have a bearing on the resulting coverage and network performance. While this approach should improve the precision of estimates, separating spectrum holdings substantially decreases variability in the dataset. We carried out a sensitivity check based on such an approach which showed that the overall results of the analysis in regards to the merger effects remain unchanged. However, the lack of variability across and within operators means that the
i,t i,t i,t
K
k=1
T0<t<T1
2. Each time period in the data has its own dummy variable. For example in the case of 2012q1, there is a dummy variable that takes the value 1 where the observation is for 2012q1 and 0 otherwise.
3. The country fixed effect will control for country-specific regulatory frameworks but it will not control for changes in regulation over time. The time fixed effect dummy will control for new regulations that impact all countries in the analysis (for example, those that are made at the European level, such as on roaming). However, with the exception of spectrum as-signments, in-country changes in regulation over time are not included in the model. We are not aware of any specific regulatory policy in Austria in this period that could potentially bias our estimate of the merger effects.
4. 1800 MHz spectrum is included after it has been refarmed for 4G or made technology-neutral by the national regulatory authority.5. Given the different properties of the spectrum bands, in particular the fact that 800 MHz is better suited for achieving wide coverage, and spectrum above 1 GHz is better suited to
high capacity rates, it would be preferable to have separate spectrum variables by band. However, as our base model is a fixed effects regression, it is driven by variation within each country. Spectrum holdings do not exhibit significant variation at this level – once it is assigned, it does not change unless there is a merger or spectrum is re-auctioned or re-assigned (neither of which is relevant for the vast majority of operators in our dataset). We therefore aggregate spectrum holdings into ‘4G’ and ‘3G’ bands to increase the variability of the data.
6. The baseline (or omitted variable) is the first year after 4G spectrum is assigned to the operator. The coefficients can therefore be interpreted as the impact of having spectrum for these three time periods compared to the first year in which it was assigned to operators.

7
ASSESSING THE IMPACT OF MOBILE CONSOLIDATION ON INNOVATION AND QUALITY
estimated parameters for spectrum variables with separate frequency bands do not appear to be strong predictors of 4G coverage or network performance.Second, in the case of network performance models, there could be differences in quality across operators driven by network congestion effects. This could be controlled by including the number of connections in a 3G or 4G network (more users on a network will mean higher network congestion). However, we do not include these in our main results as it might introduce endogeneity problems.7 As a sensitivity check, we have run the models including the connections variables and our findings for network quality do not change.
Third, due to lack of data, we are not able to account for network sharing agreements, which we would expect to positively affect 4G coverage and network performance. In the period of study there were no network sharing agreements between operators in the Austrian market. However, some operators from other countries in the control group did share networks. Since some control operators and markets have this enhancing factor that we do not account for, the merger effect is likely to be underestimated via this mechanism.
Lastly, we do not model the MVNO remedy associated with the Hutchison/Orange merger because its impact on quality and innovation is unlikely to be material. MVNOs entered late in our period of study8 and with a limited impact in terms of market share9 – their impact on competition was likely to be limited in the period of our analysis. Furthermore, MVNOs are unlikely to directly exert competition in terms of network quality and coverage, since they rely on the infrastructure of the host MNO. In fact, the impact of MVNOs might be negative on host MNO investment, since they can create investment hold-up problems (Foros et al., 2002; Dwenter & Haucap, 2006).10 Consequently, the absence of the MVNO remedy in our simulations is likely to underestimate the merger effects on Hutchison.
We also add a number of non-mobile-specific factors that could affect the outcomes of interest, though we note that these do not exhibit as much variation within countries during our time period:
log (popdensej,t) is the population density in country j at time t. More densely populated countries should have lower costs of 4G rollout, meaning that any given network investment should more easily increase coverage. For the same reason, we would expect higher population density to impact network quality in the same direction.
ruralpopj,t is the proportion of population in country j at time t that live in rural areas. Over time, a fall in the proportion of population living in rural areas should mean that investment becomes more efficient in achieving coverage and network quality. Consequently, rural population should have a negative effect on both outcomes.
log(GDPcapitaj,t) is the GDP per capita in country j at time t. This is used as a proxy for income, which could capture willingness to take up 4G services (which may drive rollout, i.e. as a demand factor).
A1.2.2 Trend model
After including the set of observed controls presented above, the unbiasedness of the merger effect estimate in the Base model relies on Austria and the group of control countries being subject to the same unobservable effects. The latter is not testable but it is likely to hold if the treatment and control group have similar pre-merger trends. Besides graphically inspecting these, we assess the Parallel Trends assumption statistically with two approaches. It is important to assess this assumption statistically because graphical inspection does not take into account the fact that the Base model has a set of factors that controls for some of the key determinants of 4G coverage and network quality.
We apply a formal test of the Parallel Trends assumption based on the approach proposed in Angrist & Pischke (2008), which in turn is based on the Granger causality test and which was also implemented in DG Competition (2015). The test substitutes the merger dummy in Equation 1 with one dummy variable per quarter for the treated operator (Hutchison). If the pre-merger slope of these linear dummies is statistically different from zero, then this suggests that the Parallel Trends assumption does not hold between the treatment and control.11
Additionally, we estimate the Base model with a ‘lead’ dummy. The ‘lead’ dummy takes value 1 in the four quarters prior to the merger if the operator is Hutchison or, where we test for market-wide effects, if the operator is Austrian. If the coefficient of the ‘lead’ is insignificant, this gives us reassurance that the post-merger dummies are likely capturing merger effects and are not being confounded by other unobservable factors. For each model where we report results, ‘lead’ dummies are included in separate regressions (with outputs table reporting the result of the test – i.e. a ‘Pass’ or ‘Fail’ at the 5% level of confidence).
7. There may be simultaneity between connections and network quality in that, while connections may drive network quality through network congestion, an increase in connections on a given technology may also be due to better network quality.
8. The first MVNO agreement Hutchison finalised based on the reference offer was with UPC in December 2014. Another was signed in May 2015 and two more in May 2016. 9. See Figure 3 in main report 10 MNOs’ investment efforts may not be fully internalised, especially when access prices do not accurately reflect these. In this context, host MNOs may lose the incentives to differentiate
in terms of network quality and coverage, since their efforts also spill downstream (Foros et al., 2002; Dwenter & Haucap, 2006). 11 Similar tests to the Parallel Trends assumptions have been applied in related literature about market structure in the mobile market, such as Houngbonon (2015) and HSBC (2015).

8
ASSESSING THE IMPACT OF MOBILE CONSOLIDATION ON INNOVATION AND QUALITY
Where the Parallel Trends assumption is not passed (i.e. 4G coverage and network quality is affected by unobserved factors that we cannot fully control for),
we modify the DD framework suggested in Equation 1 and introduce a different linear trend for the treatment country. This is presented in Equation 2 below.12
In this equation θj represents a country-specific linear trend coefficient. The trend is constructed by interacting the country fixed effect dummy with the time variable T. For control units, this means that the coefficient θj picks up a linear trend based on the entire period. For the treated units, the coefficient θct is a country-specific linear trend based on pre-merger outcomes only. This is because we introduce an interaction between the treatment dummy Di and multiple time dummies Tt for each of the post-treatment periods.
The identification of merger effects in Equation 2 relies on the assumption that without the merger, the outcome (be it 4G coverage or network quality) would have followed the same trend that existed before the merger (after controlling for the other explanatory variables). As explained in Angrist & Pischke (2008) “DD estimation with state-specific trends is likely to be more robust and convincing when the pre-treatment data establish a clear trend that can be extrapolated into the post-treatment period”.
In the case of 4G coverage, the linear trend assumption may not be reasonable as the rollout of new technologies often follows a logistical function or ‘S-curve’. As discussed below, we also run two non-linear models as sensitivity tests. Furthermore, we do not rely solely on a trend model to make a robust finding.
A1.2.3 Robustness checks
Robustness checks of merger effects on Hutchison
We implement a set of robustness checks detailed below. For results to be regarded as robust, merger effects have to be significant in the majority of relevant checks (i.e. those where the underlying assumption of the model is validated – for the Base DD model, we look at specifications where there are common trends).
Robustness checks are carried out on models where the underlying assumptions hold (i.e. in the case of Base DD, pre-merger parallel trends). We also take into account the specification that incorporates explanatory variables that turn out significant.
a. Restrictions to the control group
In order to avoid biased estimates, our full sample only includes European countries that experienced no significant entry, exit or merger in the period of the study. The countries in the control group are Belgium, Croatia, Czech Republic, Denmark, Greece, Hungary, Italy, Latvia, Malta, Poland, Portugal, Romania, Slovenia, Spain, Sweden, Switzerland and the UK.13 However, this may not be enough to avoid having biased estimates. In order to further control for unobserved factors, we implement our models on three additional sub-samples:
i. Markets with four players, which may provide a more direct comparison between a market that went from four to three operators with those that have four players only. These are Denmark, Italy, Latvia, Poland, Romania, Spain, Sweden and the UK.
ii. Third and fourth operators in the sample, as given by their market shares for connections. These may represent better comparators for Hutchison and will determine whether there is a merger effect relative to other smaller operators (though at the expense of reducing data and variation).
iii. Close markets to Austria, in terms of an index we construct based on Mahalanobis distance.14 This index summarises closeness in terms of GDP per capita, subscribers, population density, rural population and country elevation. Based on these calculations, the closest countries to Austria just before the merger were Romania, Italy, Poland, Denmark, Czech Republic, Sweden, Portugal and Spain.
t>tM
12. This approach was proposed in Angrist (2008) and implemented in DG Comp (2015).13. We exclude markets with significant market structure changes (e.g. Germany and Ireland) because this would violate the assumption behind the Base model – i.e. we would not be
able to say that the trends in the control group reflect the outcomes that would have occurred in Austria (as they will be affected by changes to market structure).14. Mahalanobis distance is calculated as D2 = (x-m)T C-1(x-m) where D2 is Mahalanobis distance, x is a vector of data (e.g. GDP per capita, population density etc), m is a vector of mean
values of independent variables, C-1 is the inverse covariance matrix of independent variables and T indicates that the vector should be transposed.
yi,j,t = α+δDi+ΣλtTt+ Σ ρit(Di* Tt )+ Σθj(Cj * T)
+ ΣγjCj+ Σ μkXi,j,t,k+ εi,j,t
t>tMt>tM
jt
j
K
k=1
T(2)

9
ASSESSING THE IMPACT OF MOBILE CONSOLIDATION ON INNOVATION AND QUALITY
15. It is important to note however that due to the inclusion of time fixed effects and controls for the amount of time that spectrum has been assigned to the operator, the OLS model does not assume a linear trend in 4G coverage over time.
16. Implemented in Stata using the command ‘fracreg‘.
b. MNO fixed effects
As an additional sensitivity check, we estimate the Base and Trend models with MNO fixed effects. We do so because there may be unobservable factors that need to be controlled with regards to operators within each country. For instance, it may be the case that operators differ in business strategies, resources, firm structure, size and management. These factors may have some effect on the degree of innovation and/or quality of each operator.
c. Non-linear functional forms (4G coverage only)
There are two outstanding issues in the OLS framework behind the Base and Trend models when modelling 4G coverage. First, OLS assumes a linear relationship between the variables, but this may not be correct in variables that follow diffusion or S-type curves such as 4G coverage.15 OLS estimates may particularly fail in predicting the bottom and top ‘tails’. Secondly, coverage values are bounded between 0 and 1 (as the dependent variable is a proportion of total population), but standard OLS results can give predictions outside this range.
To address the issue of the linearity in OLS, the Base and Trend models described previously are only applied to the period of actual 4G rollout by each operator. This means that repeated observations of 0% or 100% were dropped. Additionally, we carry out two non-linear models as robustness checks: a log-linear model, where the dependent variable is
expressed in logarithms; and fractional regression16, which performs a logistic transformation of the dependent variable (keeping all predictions within the 0–1 range and assuming a non-linear relationship).
d. Normalised time (4G coverage only) To address the issue around S-curves discussed
above, we also estimate 4G coverage models by synchronising the timelines of operators in the sample. We do so by setting time 0 as the year and quarter where the operator had spectrum that could be used for the rollout of 4G. Once this transformation of the time variable has been implemented, we estimate models with both OLS and the non-linear models presented above.
Robustness checks of market-wide effects
In addition to the checks above, in the analysis for market-wide effects (i.e. where all Austrian operators are considered as treated) we also run the models with a country-level dataset (i.e., the units are countries rather than operators) where Austria itself is considered as a treated unit.
Standard errors and inference
In order to account for the existence of heteroskedasticity and serial correlation in our models, we use a cluster-robust estimator with clustering at the country level. We also carried out sensitivity checks using clustering at the operator level and found all the results still held.
A1.3.1 Framework
In order to provide reassurance that the results from Base and Trend models are valid we also apply the synthetic control method. The synthetic control approach constructs a counterfactual for Hutchison by assigning weights to each operator in the control group, based on how they resemble the treated unit on a set of predictors. It has some advantages with respect to the Base and Trend DD models:
i. It is robust to having a limited pool of control units with characteristics that do not fully match. In
other words, the synthetic control can work when there is no control unit that individually resembles the treated unit – i.e. when the Parallel Trends assumption is not accomplished.
ii. Whereas the DD method assumes that unobserved effects affecting the outcome are constant in time (controlled for using the fixed effect), the synthetic control allows the effects of confounding unobserved characteristics to vary with time (Abadie, 2010).
iii. By giving different unequal weights to control
A1.3 Synthetic control

10
ASSESSING THE IMPACT OF MOBILE CONSOLIDATION ON INNOVATION AND QUALITY
observations, the synthetic control can better deal with biases arising from comparisons based on average observed characteristics and their statistical distribution. This is in contrast with the DD approach, where all units have equal weights in a standard OLS framework.
The synthetic control requires three sets of inputs: a vector of ‘predictor’ variables used to estimate the outcome of interest; a matrix of ‘predictor weights’ to reflect the importance of each predictor with respect to the outcome; and a vector of ‘operator weights’ to reflect the importance given to each control group operator (or country) in the synthetic Hutchison (or Austria). This basic framework is complemented with cross-validation procedures geared at the selection of the set of predictors and at the application of placebo tests to assert the robustness of results (Abadie, Diamond & Hainmueller, 2003 and 2010).
We follow the original framework of Abadie & Gardeazabal (2003) where operator and predictor weights are assigned to minimise prediction errors of the outcome in the pre-intervention period.17 This is because if the synthetic control closely matches the development of the outcome in the treated country before the intervention, then post-treatment it may follow a trend similar to what would have happened in the treated country had there not been an intervention.
In this study, the variables used as predictors are chosen based on which group provides the lowest RMSPE for the outcome in the pre-intervention period. To provide further reassurance, we also look at the difference-in-Difference results (i.e. the variables that consistently appear to be relevant). We test the following as potential predictor variables for 4G coverage and network quality in our approach to the synthetic control:
• average of outcome (4G coverage or network quality measures) in the pre-merger period
• value of the outcome at the start of the period
• value of the outcome just before the merger (2012q4)
• time that 800 MHz, 1800 MHz and 2600 MHz had been available just before the merger
• average 3G/4G spectrum holdings before the merger
• average population in the pre-merger period
• average rural population in the pre-merger period
• 3G coverage just before the merger (where the outcome is 4G coverage)
• average proportion of 3G and 4G connections in the pre-merger period (where outcomes are network quality).
Having derived weights for predictors and operators, the outcome for the synthetic control can be estimated – the trend in the post-merger period represents the counterfactual of what would have happened to the outcome in the treated country absent the merger.
A1.3.2 Robustness checks
Statistical significance
To assess the statistical significance of the merger effect18, we implement the “placebo approach” proposed by Abadie et al. (2010 and 2015). This applies the synthetic control method to every country in the control group (as if they experienced a merger at the same time as Austria). We then compute the post-merger RMSPE to the pre-merger RMSPE19 ratio for each country. A higher ratio indicates a larger merger effect; if it is higher in Austria than other countries, then it is likely that the impact was driven by the merger and not by random effects. The rank of the treated country can be translated into the probability of finding a RMSPE ratio which is not below the RMSPE ratio observed in the treated country (the smaller the probability of finding a RMSPE ratio which is larger than the RSMPE ratio of the treated country, the more likely that there was an effect of the merger).
However, given the relatively small number of observations in the control group, we follow the approach in DG Competition (2015) whereby if the RSMPE ratio is higher than the placebos, then the effect of the merger is assumed to be significant.
The pool of placebo studies we use for statistical inference is restricted to the synthetic operators or countries where the pre-merger MSPE is less than five times that of Hutchison or Austria. This is consistent with the approach taken in Abadie et al. (2010).
17. More recently, Abadie et al. (2015) applied a different approach by dividing the pre-intervention period into a ‘training period’ and a ‘validation period’. Predictor weights are comput-ed based on the former and chosen to minimise prediction errors in the latter. This approach is well-suited if the pre-intervention period sample is large, allowing it to be divided into two groups. However, our study does not have sufficient data for this. We also note Klossner et al. (2016) found that the cross-validation approach used in Abadie et al. (2015) did not have a unique solution to defining predictor weights, resulting in ambiguity in the results. They instead recommended the standard synthetic control method.
18. Large sample inferential techniques (of the kind used in regression analysis) are not well suited to comparative case studies when the number of units in the comparison group is small. See Abadie et al. (2010).
19. This is the magnitude of the gap in the outcome variable between each country and its synthetic control. It is calculated as the root of the average squared difference between out-comes in the treated country and the synthetic control.

11
ASSESSING THE IMPACT OF MOBILE CONSOLIDATION ON INNOVATION AND QUALITY
20. Four-player markets include Denmark, Italy, Latvia, Poland, Romania, Spain, Sweden and the UK.21. The closest countries are Romania, Italy, Poland, Denmark, Czech Republic, Sweden, Portugal and Spain. 22. The original data is annual. We have used linear interpolation to obtain quarterly estimates.23. The original data is annual. We have used linear interpolation to obtain quarterly estimates.
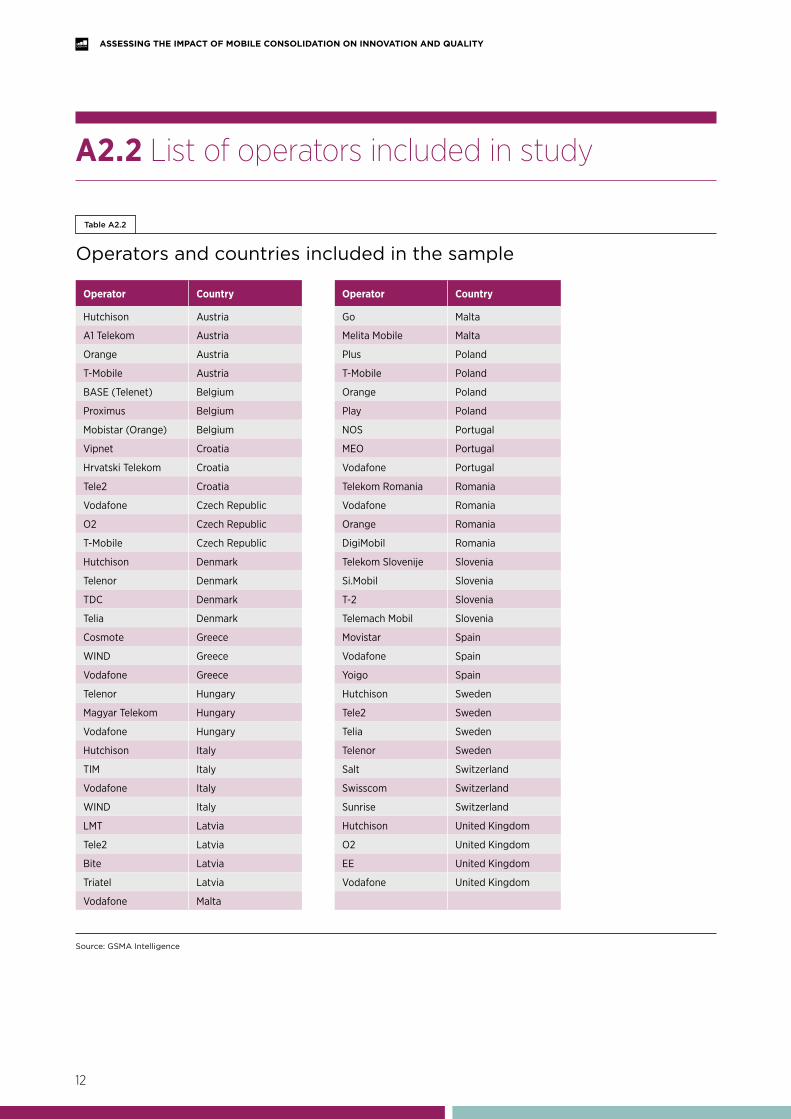
A2. DataOur complete panel dataset covers 63 operators and 18 European countries: Austria, Belgium, Croatia, Czech Republic, Denmark, Greece, Hungary, Italy, Latvia, Malta, Poland, Portugal, Romania, Slovenia, Spain, Sweden, Switzerland and the UK (see Annex A1). Some of the robustness checks we carry out include restrictions to this sample (markets with four players20, close markets21 and third and fourth operators before the merger).
The datasets for the 4G coverage analysis run from 2009q4 to 2016q3, while in the case of quality the time series covers 2011q2 to 2016q3. Both the DD and Synthetic control are implemented using the same panel datasets.
A2.1 Data sources
Source: GSMA Intelligence
Additional data
Table A2.1
Model notation Variable name Description Source Scope
4GSpectrumi,j,t 4G spectrum Amount of spectrum holdings in 800, 1800 and 2600 MHz bands. GSMA Intelligence Quarterly (2010–2016)
4GSpectrumi,j,t4G spectrum X-Y Years
Dummy variable indicating whether 4G spectrum has been available between X and Y years.
GSMA Intelligence Quarterly (2010–2016)
connections4Gi,j,t 4G connections Number of connections based on 4G technologies GSMA Intelligence Quarterly (2010–2016)
conn_pen4Gi,j,t4G connections penetration
Share of connections based on 4G technologies among all types of connections
GSMA Intelligence Quarterly (2010–2016)
3Gspectrumi,j,t 3G spectrum Amount of spectrum holdings in 900 and 2100 MHz bands. GSMA Intelligence Quarterly (2010–2016)
connections3Gi,j,t 3G connections Number of connections based on 3G technologies GSMA Intelligence Quarterly (2010–2016)
conn_pen3Gi,j,t3G connections penetration
Share of connections based on 3G technologies among all types of connections
GSMA Intelligence Quarterly (2010–2016)
coverage3Gi,j,t 3G coverage 3G coverage (based on proportion of population covered) GSMA Intelligence Quarterly (2010–2016)
GDPcapitaj,t GDP per capita GDP per capita in 2010 euros Eurostat Quarterly (2010–2016)
ruralpopj,t Rural population Percentage of population living in rural areas World Bank and UN Quarterly22 (2010–2016)
popdensej,t Population density Population per square km of land World Bank and UN Quarterly23 (2010–2016)
T0<t<T1
12
ASSESSING THE IMPACT OF MOBILE CONSOLIDATION ON INNOVATION AND QUALITY
A2.2 List of operators included in study
Source: GSMA Intelligence
Operators and countries included in the sample
Table A2.2
Operator Country Operator Country
Hutchison Austria Go Malta
A1 Telekom Austria Melita Mobile Malta
Orange Austria Plus Poland
T-Mobile Austria T-Mobile Poland
BASE (Telenet) Belgium Orange Poland
Proximus Belgium Play Poland
Mobistar (Orange) Belgium NOS Portugal
Vipnet Croatia MEO Portugal
Hrvatski Telekom Croatia Vodafone Portugal
Tele2 Croatia Telekom Romania Romania
Vodafone Czech Republic Vodafone Romania
O2 Czech Republic Orange Romania
T-Mobile Czech Republic DigiMobil Romania
Hutchison Denmark Telekom Slovenije Slovenia
Telenor Denmark Si.Mobil Slovenia
TDC Denmark T-2 Slovenia
Telia Denmark Telemach Mobil Slovenia
Cosmote Greece Movistar Spain
WIND Greece Vodafone Spain
Vodafone Greece Yoigo Spain
Telenor Hungary Hutchison Sweden
Magyar Telekom Hungary Tele2 Sweden
Vodafone Hungary Telia Sweden
Hutchison Italy Telenor Sweden
TIM Italy Salt Switzerland
Vodafone Italy Swisscom Switzerland
WIND Italy Sunrise Switzerland
LMT Latvia Hutchison United Kingdom
Tele2 Latvia O2 United Kingdom
Bite Latvia EE United Kingdom
Triatel Latvia Vodafone United Kingdom
Vodafone Malta

13
ASSESSING THE IMPACT OF MOBILE CONSOLIDATION ON INNOVATION AND QUALITY
A2.3 Network quality test statistics
Number of speed tests at the country level
Table A2.3
TimeAll tests 3G 4G
Mean Min Max Mean Min Max Mean Min Max
2011q2 41,263 497 215,340 36,709 473 193,600 - - -
2012q2 99,290 3,647 497,764 89,525 3,533 469,980 1,904 173 8,925
2013q2 129,983 1,301 620,765 99,428 1,195 523,651 19,928 107 91,636
2014q2 209,030 2,237 1,417,000 107,276 1,289 622,394 94,617 879 768,363
2015q2 356,293 4,490 1,835,329 169,044 2,786 1,018,824 183,426 1,627 929,013
2016q2 413,055 5,296 2,500,959 149,987 2,044 1,065,400 260,050 3,215 1,422,100
Source: Ookla
Number of speed tests at the operator level
Table A2.4
TimeAll tests 3G 4G
Mean Min Max Mean Min Max Mean Min Max
2011q2 12,379 155 75,945 11,013 140 67,526 - - -
2012q2 29,787 1,417 231,697 26,857 493 231,696 1,178 111 7,439
2013q2 38,995 549 256,662 30,333 215 256,623 8,458 107 85,625
2014q2 63,456 596 600,196 32,621 571 285,783 32,518 147 314,412
2015q2 106,856 1,506 651,135 50,704 1,154 353,819 55,937 324 321,309
2016q2 123,887 2,415 760,765 44,990 911 324,523 77,992 1,488 505,416
Source: Ookla
14
ASSESSING THE IMPACT OF MOBILE CONSOLIDATION ON INNOVATION AND QUALITY
(1) 4G cov.
(2)4G cov.
(3)4G cov.
(4)4G cov.
(5)4G cov.
(6)4G cov.
(7)4G cov.
Effect in 1st year -0.032 -0.0199 -0.0503 -0.053 -0.067 -0.069 -0.082
Effect in 2nd year 0.048 0.0274 0.0357 0.026 0.012 0.016 -0.033
Effect after 2 years 0.277*** 0.258*** 0.241*** 0.220*** 0.208*** 0.207*** 0.214***
Treated unit dummy -0.084*** -0.080*** -0.063*** -0.055** -0.048** -0.045** -0.070*
4G spectrum holdings 0.001*** 0.001*** 0.001*** 0.001*** 0.001*** 0.001***
4G spectrum 1–2 years 0.0423 0.0470 0.049 0.060 0.051
4G spectrum 2–4 years 0.0965* 0.101* 0.107* 0.117** 0.102*
4G spectrum 4–6 years 0.157*** 0.160*** 0.165*** 0.176*** 0.161**
GDP per capita (log) -0.480
Rural population 0.074** 0.0268
Population density (log) 2.259* 2.832***
3G coverage 0.438**
3G download speeds -0.031***
Observations 948 948 948 948 948 948 923
Adjusted R-squared 0.74 0.75 0.76 0.76 0.76 0.76 0.77
Lead Effect test Fail Pass Pass Pass Pass Pass Pass
Parallel Trends test Fail Fail Fail Fail Fail Fail Pass
Country and time FE Yes Yes Yes Yes Yes Yes Yes
Robust SE Yes Yes Yes Yes Yes Yes Yes
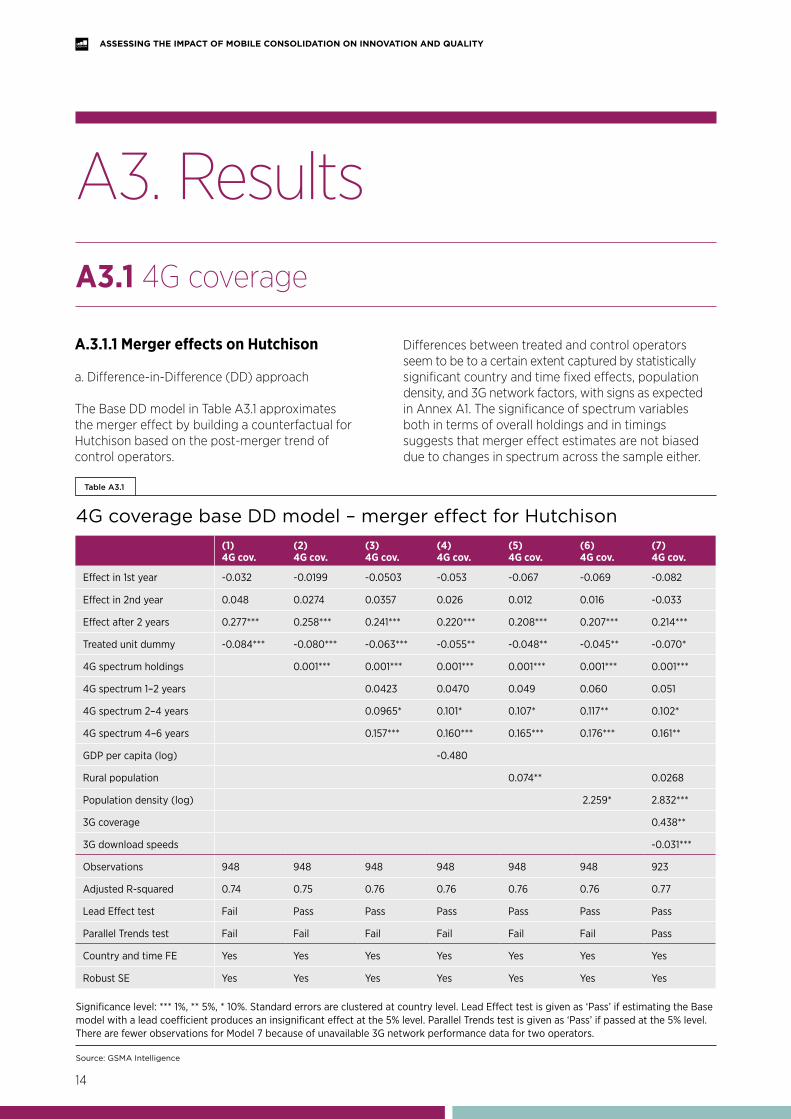
A.3.1.1 Merger effects on Hutchison
a. Difference-in-Difference (DD) approach
The Base DD model in Table A3.1 approximates the merger effect by building a counterfactual for Hutchison based on the post-merger trend of control operators.
Differences between treated and control operators seem to be to a certain extent captured by statistically significant country and time fixed effects, population density, and 3G network factors, with signs as expected in Annex A1. The significance of spectrum variables both in terms of overall holdings and in timings suggests that merger effect estimates are not biased due to changes in spectrum across the sample either.
A3. ResultsA3.1 4G coverage
Source: GSMA Intelligence
4G coverage base DD model – merger effect for Hutchison
Table A3.1
Significance level: *** 1%, ** 5%, * 10%. Standard errors are clustered at country level. Lead Effect test is given as ‘Pass’ if estimating the Base model with a lead coefficient produces an insignificant effect at the 5% level. Parallel Trends test is given as ‘Pass’ if passed at the 5% level. There are fewer observations for Model 7 because of unavailable 3G network performance data for two operators.

15
ASSESSING THE IMPACT OF MOBILE CONSOLIDATION ON INNOVATION AND QUALITY
The tests we carry out to inspect if the Base DD satisfies the condition of pre-merger trends pass in Model 7. This specification proves to pass the common trends tests specifically due to the inclusion of 3G coverage and 3G download speeds (with the former enhancing 4G rollout via cost savings in existing infrastructure, and the latter having a negative impact due to operators investing in 3G upgrades and technology substitutability). Altogether, the model specification Model 7 suggests that post-merger changes observed in the control group of operators can be used to approximate Hutchison’s counterfactual without incurring biases.
The long-term merger effects found in the Base DD in an OLS framework are confirmed in the sensitivities with restrictions to the sample (Table A3.2).24 Only the OLS simulations with normalised time and with MNO fixed effects identify a negative effect in the first year, but none of these results pass the two tests for pre-merger common trends required for unbiased DD results. Separately, taking into account the S-diffusion type of curve, as discussed in Annex A1, special weight should be given to non-linear functional forms and normalised time results. Effects after two years are confirmed by the non-linear functions.
We note that Model 7 of Table A3.1 passes the tests for pre-merger common trends. While we already consider this – together with the checks described above – the basis of a robust result, we have run Trend DD models for completion.
Looking at the results of the Trend DD model (Figure A3.1) merger effects are still significant two years after the merger. These results have also proven to hold in the same set of checks as in Table A3.2.
24. Robustness checks are carried out with Model 7 of Table A3.1 as this passes the underlying assumption of Base DD.
Significance level: *** 1%, ** 5%, *10%. Fractional regression coefficients represent marginal effects. Robustness checks carried out with the model specification as defined in Model 7 of Table A3.1. Lead Effect test is given as ‘Pass’ if estimating the Base model with a lead coefficient produces an insignificant effect at the 5% level. Parallel Trends test is given as ‘Pass’ if passed at the 5% level.
4G coverage robustness checks on Base DD model – merger effect for Hutchison
Table A3.2
(7) 4G coverage
Model OLS Log-Lin Fracreg OLS Log-Lin Fracreg OLS Log-Lin Fracreg
Check All sample Four-players sample Close markets sample
Effect in 1st year -0.082 0.295* 0.010 -0.064 0.449** 0.032 -0.118 0.209 0.014
Effect in 2nd year -0.033 0.639*** 0.011 0.017 0.795** 0.065 -0.054 0.367 0.025
Effect after 2 years 0.214*** 1.037*** 0.288*** 0.254*** 1.182*** 0.347*** 0.200*** 0.747** 0.305***
Lead Effect test Pass Pass Pass Pass Pass Pass Pass Pass Pass
Parallel Trends test Pass Fail N/A Pass Fail N/A Pass Pass N/A
Model OLS Log-Lin Fracreg OLS Log-Lin Fracreg OLS Log-Lin Fracreg
Check MNO fixed effects Third and fourth MNOs sample Normalised time
Effect in 1st year -0.103*** 0.303*** -0.015 -0.093 0.452** 0.055 -0.146*** 0.270** -0.027
Effect in 2nd year -0.035 0.739*** -0.004 0.013 1.014*** 0.064 -0.089** 0.808*** -0.007
Effect after 2 years 0.171*** 1.111*** 0.217*** 0.220*** 1.397*** 0.285*** 0.135** 1.154*** 0.201***
Lead Effect test Fail Pass Pass Fail Pass Pass Fail Fail Pass
Parallel Trends test Pass Pass N/A Pass Pass N/A Pass Fail N/A
Source: GSMA Intelligence

16
ASSESSING THE IMPACT OF MOBILE CONSOLIDATION ON INNOVATION AND QUALITY
We note that the Trend DD may raise issues around whether the pre-merger rollout observed on Hutchison is a useful basis for the post-merger counterfactual. Particularly, the pre-merger rollout for Hutchison is in the left tail of the S curve, so the extent to which this trend can be a used as counterfactual could be questioned. As discussed in Annex A1, we have addressed this issue by estimating merger effects from Trend DD models with non-linear functional forms, with the positive impact after two years confirmed.25
b. Synthetic control approach
Given the synthetic control requires pre-merger data in coverage and in the set of predictors, we have restricted the sample to operators that had launched 4G networks at least four quarters before the merger (in our full sample, this leads to 13 “donor” operators). The variables used to predict 4G coverage are the ones that provide the lowest RSMPE pre-merger, and are also consistent with the DD results. The weights given to each predictor shown in Table A3.3 are broadly consistent with the results derived from the inclusion of additional variables (e.g. rural population, elevation).
25. A second aspect to take into account is that one difference between the pre- and post-merger period in the Austrian market is the 800 MHz spectrum auction, which took place in the post-merger period. While we control for spectrum holdings, Hutchison in any case did not obtain 800 MHz spectrum, so this cannot bias the merger effect.
Source: GSMA Intelligence
4G coverage trend DD model – merger effect for Hutchison
Figure A3.1
Merger effect coefficients (as given by each post-merger time dummies for Hutchison) and 95% confidence intervals. Estimates based on Model 7 of Table A3.1.
2
6
0
2013Q1 2013Q2 2013Q3 2013Q4 2014Q1 2014Q2 2014Q3 2014Q4 2015Q1 2015Q2 2015Q3 2015Q4 2016Q1 2016Q2 2016Q3
4
Mer
ger
eff
ects
on
Line
ar P
red
icti
on
Time
FIRST YEAR SECOND YEAR MORE THAN TWO YEARS
-2

17
ASSESSING THE IMPACT OF MOBILE CONSOLIDATION ON INNOVATION AND QUALITY
MERGER
The resulting synthetic operator (Table A3.3) appears to be reasonably well balanced, with predictor values being very close to Hutchison in terms of 4G coverage, though the 4G count and 4G spectrum holdings are not as balanced. The overall post-/pre-merger MSPE ratio ranking in the placebo analysis is 4/14 while the ranking after two years is 3/14.
With only 14 placebo studies (Chart B in Figure A3.2) the synthetic control provides little evidence as a standalone exercise, though it gives some reassurance of the results found in the DD framework as there is a noticeable difference between the actual and synthetic result around two years following the merger (in 2015).
26. Predictor weights may not sum to 1 due to rounding.
4G coverage synthetic control operator key parameters
Table A3.3
4G coverage synthetic control operator
Figure A3.2
Operator Weight PredictorPredictor balance Predictor
weight26Hutchison Synthetic
Hrvatski Telekom (Croatia) 0.952 4G coverage (pre-merger mean) 0.066 0.061 0.6720
Vipnet (Croatia) 0.048 4G coverage (2011q4) 0 0 0.1002
4G coverage (2012q4) 0.08 0.130 0.2244
4G count (2012q4) 9 3 0.0027
4G spectrum (pre-merger mean) 65 22 0.0006
Source: GSMA Intelligence
Source: GSMA Intelligence
The pool of donor operators is restricted to operators that had active 4G networks (i.e., 4G coverage values above 0) at least four quarters before the merger and that receive a positive weight in the synthetic Hutchison.
Placebo studies in Chart B show operators that had active 4G networks before the Austrian merger and where the pre-merger MSPE is less than five times that of Hutchison.
4
6
8
2
1
0
2011Q1 2012Q1 2013Q1
Year and Quarter
2014Q1 2015Q1 2016Q1
Hutchison
Synthetic Hutchison
A. HUTCHISON AND SYNTHETIC HUTCHISON B. PLACEBO STUDIES
Trea
tmen
t eff
ect
-2
0
-4
2
4
2011Q1 2012Q1 2013Q1
Year and Quarter
x5 cutoff
2014Q1 2015Q1 2016Q1
MERGER

18
ASSESSING THE IMPACT OF MOBILE CONSOLIDATION ON INNOVATION AND QUALITY
A.3.1.2 Market-wide effects
a. Difference-in-Difference (DD) approach
If we assign all Austrian operators to the treatment group, we find no conclusive effects. Base and Trend DD give contradictory results, with the former not passing tests for pre-merger common trends and the latter reporting estimates that are not robust across alternative models.
The Base DD specifications in Table A3.4 find negative effects in the first two years after the
merger and, in some models, a positive effect after two years. While the Parallel Trends test is passed in each model, the fact that the lead effect is significant when included in the separate regressions makes it unclear whether it was the merger that caused a reduction in 4G coverage or something else. One possible candidate behind the significance of the lead effect (and potentially the negative effect in the first year after the merger, i.e. 2013) could be the delay in the 800 MHz auction in Austria.27 In any case, the significant lead effects suggest that control operators may not offer a good counterfactual for all Austrian operators due to some factors remaining unobserved.
(1) 4G cov.
(2)4G cov.
(3)4G cov.
(4)4G cov.
(5)4G cov.
(6)4G cov.
(7)4G cov.
Effect in 1st year -0.094** -0.085** -0.099* -0.100* -0.119** -0.102** -0.082*
Effect in 2nd year -0.058* -0.089** 0.079* -0.089* -0.107** -0.093** -0.085**
Effect after 2 years 0.089*** 0.051* 0.074** 0.052 0.036 0.046 0.091**
4G spectrum holdings 0.001*** 0.001*** 0.001*** 0.001*** 0.001*** 0.001***
4G spectrum 0–2 years 0.043 0.046 0.048 0.059 0.0529
4G spectrum 2–4 years 0.105* 0.107* 0.113** 0.122** 0.111**
4G spectrum 4–6 years 0.166*** 0.167*** 0.172*** 0.184*** 0.172***
GDP per capita (log) -0.475
Rural population 0.079** 0.027
Population density (log) 2.294* 2.803***
3G coverage 0.431**
3G download speeds -0.031***
Observations 948 948 948 948 948 948 923
Adjusted R-squared 0.74 0.75 0.74 0.74 0.75 0.75 0.76
Lead Effect test Fail Fail Fail Fail Fail Fail Fail
Parallel Trends test Pass Pass Pass Pass Pass Pass Pass
Country and time FE Yes Yes Yes Yes Yes Yes Yes
Robust SE Yes Yes Yes Yes Yes Yes Yes
Source: GSMA Intelligence
4G coverage base DD model – merger effect for Hutchison
Table A3.4
Significance level: *** 1%, ** 5%, *10%. Standard errors are clustered at country level. The ‘Treated unit dummy’ is not reported in market-level analyses because it is, in effect, a country fixed effect. Lead Effect test is given as ‘Pass’ if estimating the Base model with a lead coefficient produces an insignificant effect at the 5% level. Parallel Trends test is given as ‘Pass’ if passed at the 5% level.
27. The 800 MHz auction in Austria was planned to take place in 2012 but was delayed until after the merger decision. It is possible that because operators would have been uncertain as to how much 800 MHz spectrum that would obtain, they delayed rollout of their 4G networks in the first year following the merger.

19
ASSESSING THE IMPACT OF MOBILE CONSOLIDATION ON INNOVATION AND QUALITY
We have estimated the same models with the usual set of alternative specifications, using Model 7.28 Table A3.5 below shows that the Log-Lin model is the only specification appropriate when applied to four-player countries, in the close markets and in the MNO fixed effects framework, as well as the OLS model with normalised time. The other models do not fully pass pre-merger trends tests. Even though most of the valid models point towards a positive impact of the merger, these results alone do not provide sufficient evidence considering the opposite impact that the OLS with normalised time suggests. With regards to the negative effects in the latter model, as discussed
above it is possible that the delay in the 800 MHz auction could also be a factor in slowing down rollout in the first year or two after the merger, making it difficult to isolate the impact of the merger.
28. Robustness checks are carried out with Model 7 of Table A3.4 because it incorporates the additional explanatory factors of 3G coverage and 3G download speeds, which prove to be significant drivers of 4G rollout.
Significance level: *** 1%, ** 5%, *10%. Fractional regression coefficients represent marginal effects. Robustness checks carried out with the model specification as defined in Model 7 of Table A3.4. Lead Effect test is given as ‘Pass’ if estimating the Base model with a lead coefficient produces an insignificant effect at the 5% level. Parallel Trends test is given as ‘Pass’ if passed at the 5% level.
4G coverage robustness checks on Base DD model – market-wide effects
Table A3.5
(7) 4G coverage
Model OLS Log-Lin Fracreg OLS Log-Lin Fracreg OLS Log-Lin Fracreg
Control All sample Four-players markets Close markets
Effect in 1st year -0.082* 0.339** -0.043 -0.072 0.492** -0.020 -0.109 0.310 -0.003
Effect in 2nd year -0.085** 0.626*** -0.112* -0.046 0.804*** -0.067 -0.074 0.488 -0.039
Effect after 2 years 0.091** 0.941*** -0.020 0.126* 1.131*** 0.019 0.111** 0.740** 0.032
Lead Effect test Fail Fail Pass Fail Pass Pass Fail Pass Pass
Parallel Trends test Pass Pass N/A Pass Pass N/A Pass Pass N/A
Model OLS Log-Lin Fracreg OLS Log-Lin Fracreg OLS Log-Lin Fracreg
Control MNO fixed effects Normalised time Country-level
Effect in 1st year -0.129*** 0.272* -0.098** -0.095** 0.339** -0.098*** -0.169*** -0.121 -0.173***
Effect in 2nd year -0.121** 0.643* -0.163** -0.126*** 0.626*** -0.195*** -0.223*** -0.161 -0.275***
Effect after 2 years 0.0117 0.916** -0.148 -0.002 0.941*** -0.148* -0.0835 0.242 -0.155**
Lead Effect test Fail Pass Fail Pass Fail Pass Pass Fail Fail
Parallel Trends test Pass Pass N/A Pass Pass N/A Fail Pass N/A
Source: GSMA Intelligence

20
ASSESSING THE IMPACT OF MOBILE CONSOLIDATION ON INNOVATION AND QUALITY
With the underlying assumption in Base DD not being accomplished across the majority of simulations, we also present the result of the Trend DD model. This suggests insignificant impacts
(Figure A3.3). Running alternative Trend DD models results in mixed findings (some positive and some negative) – hence, we cannot conclude if there was a merger effect at the market level in Austria.
b. Synthetic control approach
Aside from Austria, in our sample there are only seven other countries with 4G networks in place for more than one year before the merger. The synthetic control is, consequently, of limited use – the pool of ‘donor’ countries is reduced and, moreover, the number of
placebo studies to determine the significance of the results makes it difficult to draw any conclusions from the analysis. Hence, we conclude that based on the data available to us, it is not possible to say what impact the merger had (if any) at the market level.
4G coverage trend DD model – market-wide merger effects
Figure A3.3
Source: GSMA Intelligence
Merger effect coefficients (as given by each post-merger time dummies for Austrian operators) and 95% confidence intervals. Estimates based on the Trend DD application following the Base DD set-up in Model 7 of Table A3.4.
8
6
2
4
0
1
2013Q1 2013Q2 2013Q3 2013Q4 2014Q1 2014Q2 2014Q3 2014Q4 2015Q1 2015Q2 2015Q3 2015Q4 2016Q1 2016Q2 2016Q3
Mer
ger
eff
ects
on
Line
ar P
red
icti
on
Time
FIRST YEAR SECOND YEAR MORE THAN TWO YEARS
-2

21
ASSESSING THE IMPACT OF MOBILE CONSOLIDATION ON INNOVATION AND QUALITY
A3.2 4G network quality
A.3.2.1 Merger effects on Hutchison
a. Regression-based approach
Due to the lack of pre-merger data on 4G performance for Hutchison, the only model that we can estimate is the Base specification, for which the Parallel Trends assumption cannot be directly inspected. In this case, the DD framework cannot be estimated using the standard approach, since the double difference cannot be calculated.
The estimates in Table A3.6 point to a significant positive merger effect across all years after the merger for download speeds, while the second year effect is not significant in upload speeds. These merger coefficients represent, in effect, an operator fixed effect for Hutchison. These capture whether the merged entity had better or worse network performance than would have been expected by assessing other operators’ network performance and controlling for other distinctive factors between the treatment and the control. In this case, the factors that turn out significant are the country and time fixed effects.
Source: GSMA Intelligence
4G network quality Base model – merger effects for Hutchison
Table A3.6
4G download speeds 4G upload speeds
(1) (2) (3) (1) (2) (3)
Effect in 1st year 3.686** 3.381* 3.687** 3.792*** 3.667*** 3.793***
Effect in 2nd year 2.705*** 2.769*** 2.727*** -0.0630 -0.0370 -0.0552
Effect after two years 7.635*** 8.398*** 7.673*** 3.732*** 4.045*** 3.745***
4G spectrum holdings 0.0337 0.0353 0.0331 0.00441 0.00507 0.00422
Rural population -4.632 -1.903
Population density (log) -0.177 -0.0643
Observations 904 904 904 904 904 904
Adjusted R-squared 0.35 0.36 0.35 0.31 0.32 0.31
Country and time FE Yes Yes Yes Yes Yes Yes
Robust SE Yes Yes Yes Yes Yes Yes
Significance level: *** 1%, ** 5%, * 10%. Standard errors are clustered at country level. Lead Effect test and Parallel Trends tests cannot be applied due to lack of pre-merger data.

22
ASSESSING THE IMPACT OF MOBILE CONSOLIDATION ON INNOVATION AND QUALITY
Considering the limitations above, the alternative specifications we can carry out provide some useful insights (we use Model 1 of Table A3.6 as Models 2 and 3 add explanatory factors without significance).
By limiting the sample to operators and markets with closer characteristics to Hutchison, these estimates should limit the sources for unobserved factors that could confound the merger effect. Separately, the MNO fixed effects model should be able to control for unobserved structural differences across operators that could be biasing merger effects.
In terms of download speeds, the models reported in Table A3.7 appear to confirm both the effect after two years (which remains significant on all checks) and the effect in the second year (which only dilutes in the third/fourth operator sample) – with both effects intensified when controlling for operator fixed effects. Considering upload speeds, most alternative models suggest coefficients similar in significance and magnitude for the first year after the merger and two years after. We treat the former with caution given it seems to dilute in the second year after the merger, suggesting that it could be driven by something other than the merger.
This analysis cannot be complemented with estimates from Trend models given the lack of pre-merger data.
b. Synthetic control approach
The synthetic control approach cannot be applied in this case either, since there is no 4G network quality pre-merger data on which we can generate optimal weights.
A.3.2.2 Market-wide merger effects
a. Difference-in-Difference (DD) approach
When assigning all Austrian operators to the treatment group, the only treated operator with pre-merger data on 4G network quality is A1 Telekom and this only exists for four quarters prior to the merger. Therefore, although we have pre-merger data on which to carry out a Parallel Trends test, this should be treated with some caution.
Source: GSMA Intelligence
4G network quality Base model robustness checks – merger effect for Hutchison
Table A3.7
4G download speeds 4G upload speeds
(1) (2) (3) (4) (1) (2) (3) (4)
Effect in 1st year 11.68*** 4.076 1.959 5.390* 3.518*** 4.529*** 1.739 5.304***
Effect in 2nd year 11.13*** 2.523** 1.583 1.858* 0.053 -0.277 -2.124 -0.709*
Effect after two years 15.80*** 7.209*** 8.094** 7.328*** 3.787*** 3.508*** 1.623 3.373***
Check MNO FEFour-player sample
Third/fourth operator sample
Close markets sample
MNO FEFour-player sample
Third/fourth operator sample
Close markets sample
Significance level: *** 1%, ** 5%, *10%. Robustness checks carried out with the model specification as defined in Model 1 in Table A3.6. Lead Effect test and Parallel Trends test cannot be applied due to lack of pre-merger data.

23
ASSESSING THE IMPACT OF MOBILE CONSOLIDATION ON INNOVATION AND QUALITY
Due to the limited amount of pre-merger data, the alternative models that can be carried out are particularly important, especially the checks done with the market-level dataset – where Austria as a whole is the relevant unit of treatment and where we have pre-merger data. Using the specification of Model 1 in Table A3.829, Table A3.9 shows that the country-level model passes the two tests of pre-merger trends, and the size and significance of the merger effects are along the lines of that found in Table A3.8 across the three post-merger periods.
The other alternative models (restrictions to sample and MNO fixed effects) provide results in the same general direction. In almost all specifications, the effects in the first two years after the merger are statistically significant. However, in some of the simulations the significance of the merger effect two years after the merger is diluted. Due to the limited length of pre-merger data, we prefer to have a statistically significant result in the majority of alternative models in order to be confident of a finding. Given this is not the case for the effect after two years, we conclude that the results found after two years are inconclusive.
Source: GSMA Intelligence
4G network quality base DD model – market-wide merger effects
Table A3.8
4G download speeds 4G upload speeds
(1) (2) (3) (4) (5) (6)
Effect in 1st year 13.93*** 15.88*** 14.08*** 5.075*** 5.853*** 5.127***
Effect in 2nd year 13.09*** 15.57*** 13.28*** 4.171*** 5.161*** 4.240***
Effect after two years 8.322** 11.57*** 8.536** 2.587** 3.880*** 2.662**
4G spectrum holdings 0.0342 0.0354 0.0336 0.00461 0.005 0.004
Rural population -4.936 -1.969
Population density (log) -0.187 -0.066
Observations 827 827 827 827 827 827
Adjusted R-squared 0.46 0.46 0.46 0.42 0.42 0.42
Parallel Trends test Pass Pass Pass Pass Pass Pass
Country and time FE Yes Yes Yes Yes Yes Yes
Robust SE Yes Yes Yes Yes Yes Yes
Significance level: *** 1%, ** 5%, * 10%. Standard errors are clustered at country level. Lead Effect test cannot be applied due to lack of pre-merger data. Parallel Trends test results are presented but should be treated with some caution as there is only data for four quarters pre-merger and this is primarily based on the network performance of A1 Telekom. The ‘Treated unit dummy’ is not reported in market-level analyses because it is, in effect, a country fixed effect.
29. Checks are carried out using Model 1 in Table A3.8 because the inclusion of variables in the other simulations does not seem to add substantial explanatory power.

24
ASSESSING THE IMPACT OF MOBILE CONSOLIDATION ON INNOVATION AND QUALITY
Source: GSMA Intelligence
4G network quality Base DD robustness checks – market-wide merger effects
Table A3.9
4G download speeds 4G upload speeds
(1) (2) (3) (4) (1) (2) (3) (4)
Effect in 1st year 15.31*** 12.45*** 14.89*** 15.42*** 5.255*** 5.025*** 5.531*** 5.709***
Effect in 2nd year 15.30*** 10.97** 10.82** 15.19*** 4.783*** 3.144* 2.038 4.996***
Effect after two years 10.35** 5.465 5.861 8.756** 3.211** 1.267 0.268 2.343**
Parallel Trends test Fail Fail Pass Pass Fail Fail Fail Pass
Check MNO FEFour-player sample
Close markets sample
Market-level dataset
MNO FEFour-player sample
Close markets sample
Market-level dataset
Significance level: *** 1%, ** 5%, *10%. Robustness checks carried out with the model specification as defined in Model 1 in Table A3.8. Lead Effect test cannot be applied due to limited pre-merger data.
b. Synthetic control approach
The synthetic control approach cannot be applied in this case, since there is not enough 4G network
quality pre-merger data on which we can generate optimal weights.

25
ASSESSING THE IMPACT OF MOBILE CONSOLIDATION ON INNOVATION AND QUALITY
A3.3 3G Network quality
A.3.3.1 Merger effects on Hutchison
a. Difference-in-Difference (DD) approach
With respect to 3G download speeds, the Base DD model reported in Table A3.10 suggests that the
merger had a negative impact in the first two years after the merger, disappearing thereafter. The Base DD comfortably passes the Parallel Trends test and the Lead Effect test in Model 2, meaning that this is an appropriate specification to use.
Nevertheless, the sensitivity tests on Model 2 for 3G download speeds do not fully support negative impacts in the first two years after the merger30 (see Table A3.11). While the ‘close markets’ sample does report negative merger effects in the first and second year as well, the two other sample restrictions report
insignificant estimates. Additionally, the MNO fixed effects model produces inconsistent estimates, with a negative effect in the second year and a positive effect after two years. With these inconsistencies, we cannot determine with confidence that there was an impact on this metric.
Source: GSMA Intelligence
3G network quality Base DD – merger effect for Hutchison
Table A3.10
3G download speeds 3G upload speeds
(1) (2) (3) (1) (2) (3)
Effect in 1st year -0.730** -0.713** -0.704** -0.184* -0.194* -0.185*
Effect in 2nd year -1.388*** -1.360** -1.356*** -0.313** -0.328** -0.313**
Effect after two years 0.513 0.554 0.544 -0.301 -0.325 -0.302
Treated unit dummy 0.244 0.223 0.221 0.641** 0.653** 0.642**
3G spectrum holdings 0.024 0.024 0.024 0.008 0.008 0.008
Rural population -0.092 0.053
Population density (log) 0.088*** -0.001
Observations 1,320 1,320 1,320 1,320 1,320 1,320
Adjusted R-squared 0.81 0.81 0.82 0.68 0.68 0.68
Lead Effect test Fail Pass Fail Fail Fail Fail
Parallel Trends test Pass Pass Pass Fail Fail Fail
Country and time FE Yes Yes Yes Yes Yes Yes
Robust SE Yes Yes Yes Yes Yes Yes
Significance level: *** 1%, ** 5%, * 10%. Standard errors are clustered at country level. Lead Effect test is given as ‘Pass’ if estimating the Base model with a lead coefficient produces an insignificant effect at the 5% level. Parallel Trends test is given as ‘Pass’ if passed at the 5% level.
30. Sensitivities are carried out with Model 2 because this specification is robust to common pre-merger trends. Model 3 includes population density, which proves to be significant, but this leads to the specification not passing both tests on pre-merger trends.

26
ASSESSING THE IMPACT OF MOBILE CONSOLIDATION ON INNOVATION AND QUALITY
Source: GSMA Intelligence
3G network quality Base DD robustness checks – merger effect for Hutchison
Table A3.11
3G download speeds
(1) (2) (3) (4)
Effect in 1st year -0.394 -0.799 -0.382 -1.564**
Effect in 2nd year -0.937* -1.248 -0.782 -2.548***
Effect after two years 1.070* 0.628 1.288 -0.890
Lead Effect test Pass Pass Pass Pass
Parallel Trends test Pass Pass Pass Pass
Check MNO FE Four-player sample
Third/fourth operator sample
Close markets sample
Significance level: *** 1%, ** 5%, *10%. Robustness checks carried out with the model specification as defined in Model 2 of Table A3.10 for download speeds. Lead Effect test is given as ‘Pass’ if estimating the Base model with a lead coefficient produces an insignificant effect at the 5% level. Parallel Trends test is given as ‘Pass’ if passed at the 5% level.
Regarding 3G upload speeds, Table A3.10 shows some negative merger effects in the first and second year, but these models do not pass any of the tests for common trends. Given Base DD estimates are not appropriate, we run Trend DD simulations.
Figure A3.4 reports the merger coefficients that result from the Trend DD version of the Base DD application in Model 1 of Table A3.10.31 This suggests the merger effect was insignificant for the entire post-merger period.
31. We carry the Trend DD application of Model 1 because the additional explanatory variables in Models 2 and 3 lack significance.

27
ASSESSING THE IMPACT OF MOBILE CONSOLIDATION ON INNOVATION AND QUALITY
b. Synthetic control approach
The synthetic part of the analysis for 3G download and upload speeds does not appear to provide a good framework to determine whether the merger induced significant effects at the merged entity level. We find that the combination of data across operators in the dataset does not generate a synthetic control that can be feasibly compared against Hutchison.
The predictors that we have included (pre-merger mean of the outcomes, as well as the values in 2011q2 and 2012q4, 3G spectrum and connections penetration) give the lowest pre-merger MSPE and generally prove to be relevant in the DD models. The synthetic Hutchison takes values from operators in the full sample, with the results shown in Table A3.12. For both upload and download speeds, the predictor balance indicates that Hutchison and its synthetic counterpart are close in terms of observed characteristics (with the exception of 3G connections penetration in upload speeds).
3G upload speeds trend DD model – merger effect for Hutchison
Figure A3.4
Source: GSMA Intelligence
Merger effect coefficients (as given by each post-merger time dummy for Hutchison) and 95% confidence intervals. Estimates based on the Trend DD application following the Base DD set-up in Model 1 of Table A3.10.
-4
-6
2
0
-2
2013Q1 2013Q2 2013Q3 2013Q4 2014Q1 2014Q2 2014Q3 2014Q4 2015Q1 2015Q2 2015Q3 2015Q4 2016Q1 2016Q2 2016Q3
Mer
ger
eff
ects
on
Line
ar P
red
icti
on
Time
FIRST YEAR SECOND YEAR MORE THAN TWO YEARS
-8
4
6
8
1

28
ASSESSING THE IMPACT OF MOBILE CONSOLIDATION ON INNOVATION AND QUALITY
3G Network quality synthetic control operator key parameters
Table A3.12
Source: GSMA Intelligence
The pool of donor operators includes all operators in the sample. Only those operators with positive weights are listed in the operator weights vector.
Operator Weight PredictorPredictor balance Predictor
weight32Hutchison Synthetic
Hutchison (Denmark) 0.817 3G download speed (pre-merger mean) 3.20 3.20 0.7192
Hutchison (Sweden) 0.023 3G download speed (2011q2) 2.50 2.48 0.0942
Tele2 (Croatia) 0.161 3G download speed (2012q4) 3.74 3.73 0.1858
3G spectrum (pre-merger mean) 36.20 45.20 0.0004
3G connections penetration (pre-merger mean) 0.98 0.88 0.0001
Operator Weight PredictorPredictor balance Predictor
weight33Hutchison Synthetic
Vodafone (Czech Republic) 0.855 3G upload speeds (pre-merger mean) 1.65 1.63 0.7391
Vodafone (Malta) 0.145 3G upload speeds (2011q2) 1.23 1.20 0.1160
3G upload speeds (2012q4) 1.88 1.67 0.1446
3G spectrum (pre-merger mean) 36.20 66.05 0.0001
3G connections penetration (pre-merger mean) 0.98 0.33 0.0002
DOWNLOAD SPEEDS
UPLOAD SPEEDS
Charts A and B in Figure A3.5, however, indicate that the resulting predictions of download and upload speeds do not match Hutchison’s values during the pre-merger period. Hence, the resulting synthetic control does not prove to be useful. This could indicate that the variables chosen to predict
download and upload speeds do not work well because of their static nature (i.e. average and snapshot values do not capture the dynamics on a time series); and/or that the operator dataset simply does not provide an efficient combination of firms in terms of synthetic control.
32. Predictor weights may not sum to 1 due to rounding.33. Predictor weights may not sum to 1 due to rounding.

29
ASSESSING THE IMPACT OF MOBILE CONSOLIDATION ON INNOVATION AND QUALITY
3G network quality synthetic control operator
Figure A3.5
Source: GSMA Intelligence
Placebo studies in Charts B show synthetic operators whose pre-merger MSPE is less than five times that of Hutchison.
Year and Quarter
Hutchison
Synthetic Hutchison
A. HUTCHISON AND SYNTHETIC HUTCHISON (DOWNLOAD SPEEDS)
4
8
6
10
12
2011Q1 2012Q1 2013Q1 2014Q1 2015Q1 2016Q1
2
Year and Quarter
B, PLACEBO STUDIES (DOWNLOAD SPEEDS)
2011Q1 2012Q1 2013Q1 2014Q1 2015Q1 2016Q1
-4
0
-2
2
4
-6
x5 cutoff
Trea
tmen
t eff
ect
Trea
tmen
t eff
ect
Year and Quarter
Hutchison
Synthetic Hutchison
A. HUTCHISON AND SYNTHETIC HUTCHISON (UPLOAD SPEEDS)
1.5
2
2.5
3
2011Q1 2012Q1 2013Q1 2014Q1 2015Q1 2016Q1
1
2016Q1
-1
0
1
-2
Year and Quarter
B, PLACEBO STUDIES (UPLOAD SPEEDS)
2011Q1 2012Q1 2013Q1 2014Q1 2015Q1
x5 cutoff
MERGER MERGER
MERGERMERGER

30
ASSESSING THE IMPACT OF MOBILE CONSOLIDATION ON INNOVATION AND QUALITY
A.3.3.2 Market-wide merger effects
a. Difference-in-Difference (DD) approach
For both 3G download and upload speeds we rely on the results from the Base DD model. Model 2 of Table A3.13 passes the tests for common pre-
merger trends, reporting significant merger effects in the second year and after two years (positive for download and negative for upload speeds). The other models do not pass both tests for common trends.
Source: GSMA Intelligence
3G network quality Base DD model – merger effects across all Austrian operators
Table A3.13
3G download speeds 3G upload speeds
(1) (2) (3) (1) (2) (3)
Effect in 1st year 0.144 0.176 0.170 -0.046 -0.0583 -0.047
Effect in 2nd year 0.527* 0.579* 0.559** -0.189*** -0.209** -0.189***
Effect after two years 1.434*** 1.512*** 1.465*** -0.228*** -0.258** -0.229***
3G spectrum holdings 0.023 0.023 0.0234 0.006 0.006 0.006
Rural population -0.165 0.063
Population density (log) 0.0887*** -0.001
Observations 1320 1320 1320 1320 1320 1320
Adjusted R-squared 0.81 0.81 0.82 0.68 0.68 0.68
Lead Effect test Pass Pass Pass Pass Pass Pass
Parallel Trends test Fail Pass Fail Fail Pass Fail
Country and time FE Yes Yes Yes Yes Yes Yes
Robust SE Yes Yes Yes Yes Yes Yes
Significance level: *** 1%, ** 5%, * 10%. Standard errors are clustered at country level. Lead Effect test is given as ‘Pass’ if estimating the Base model with a lead coefficient produces an insignificant effect at the 5% level. Parallel Trends test is given as ‘Pass’ if passed at the 5% level. The ‘Treated unit dummy’ is not reported in market-level analyses because it is, in effect, a country fixed effect.
The effect on download speeds after two years from Model 2 in Table A3.13 holds to MNO fixed effects, the four-player sample and the exercises with the market-level dataset where we test the treatment for Austria as a whole. Meanwhile, the checks on the negative effects on upload speeds indicate that the impact appears in both the second year and after two years in the majority of alternative models, including
the market-level dataset. In both metrics we have only one of the robustness checks where estimates are insignificant, so we are confident overall about the key findings (i.e., a significant effect on download speeds two years after the merger and a negative effect on upload speeds in the second year and thereafter).

31
ASSESSING THE IMPACT OF MOBILE CONSOLIDATION ON INNOVATION AND QUALITY
b. Synthetic control approach
As with the synthetic control at the operator level, the analysis for 3G download and upload speeds does not appear to provide a good framework to determine whether the merger induced significant effects at the market level. We find that the combination of data across countries in the dataset does not generate a synthetic control that can be feasibly compared against Austria.
The predictors that we have included (pre-merger mean of the outcomes, as well as the values in 2011q2 and 2012q4, 3G spectrum and connections penetration) give the lowest pre-merger MSPE. The synthetic Austria takes values from countries in the full sample, with the results reported in Table A3.15. For both upload and download speeds, the predictor balance indicates that Hutchison and its synthetic counterpart are close in terms of observed characteristics (with the exception of 3G connections penetration in upload speeds).
Source: GSMA Intelligence
3G network quality Base DD robustness checks, market-wide merger effects
Table A3.14
3G download speeds 3G upload speeds
(1) (2) (3) (4) (1) (2) (3) (4)
Effect in 1st year 0.284 0.241 -0.0698 -0.140 0.007 -0.0634 -0.138* -0.127**
Effect in 2nd year 0.721 0.936** 0.222 0.053 -0.123 -0.203** -0.364*** -0.276***
Effect after two years 1.658** 1.901*** 1.130 1.355** -0.170 -0.270** -0.446** -0.317***
Lead Effect test Pass Pass Pass Pass Pass Pass Pass Pass
Parallel Trends test Pass Pass Pass Pass Pass Pass Pass Pass
Check MNO FEFour-player sample
Close markets sample
Market-level dataset
MNO FEFour-player sample
Close markets sample
Market-level dataset
Significance level: *** 1%, ** 5%, *10%. Robustness checks carried out with the model specification as defined in Model 2 of Table A3.13.

32
ASSESSING THE IMPACT OF MOBILE CONSOLIDATION ON INNOVATION AND QUALITY
3G Network quality synthetic market key parameters
Table A3.15
Source: GSMA Intelligence
Country Weight PredictorPredictor balance Predictor
weight34Hutchison Synthetic
Croatia 0.112 3G downloads (pre-merger mean) 3.20 3.22 0.7233
Slovenia 0.087 3G downloads (2011q4) 2.57 2.44 0.0754
Sweden 0.801 3G downloads (2012q4) 3.63 3.61 0.1998
3G spectrum (pre-merger mean) 216.45 201.42 0.0002
3G connections penetration (pre-merger mean) 0.63 0.68 0.0013
Country Weight PredictorPredictor balance Predictor
weight33Hutchison Synthetic
Sweden 1 3G uploads (pre-merger mean) 1.59 1.34 0.7454
3G uploads (2011q4) 1.28 1.07 0.1056
3G uploads (2012q4) 1.75 1.47 0.1472
3G spectrum (pre-merger mean) 216.45 203.8 0.0003
3G connections penetration (pre-merger mean) 0.63 0.76 0.0015
DOWNLOAD SPEEDS
UPLOAD SPEEDS
34. Predictor weights may not sum to 1 due to rounding.35. Predictor weights may not sum to 1 due to rounding.

MERGER
MERGERMERGER
33
ASSESSING THE IMPACT OF MOBILE CONSOLIDATION ON INNOVATION AND QUALITY
Charts A and B in Figure A3.6, however, indicate that the resulting predictions of download and upload speeds do not match Austria’s values
during the pre-merger period, meaning that the synthetic control is not useful to confirm or verify the findings of the DD analysis.
3G network quality synthetic control market
Figure A3.6
Source: GSMA Intelligence
Year and Quarter
Austria
Synthetic Austria
A. HUTCHISON AND SYNTHETIC AUSTRIA (UPLOAD SPEEDS)
1.5
2
2.5
2011Q1 2012Q1 2013Q1 2014Q1 2015Q1 2016Q1
1
Year and Quarter
Austria
synthetic Austria
A. HUTCHISON AND SYNTHETIC AUSTRIA (DOWNLOAD SPEEDS)
4
8
6
10
12
2011Q1 2012Q1 2013Q1 2014Q1 2015Q1 2016Q1
2
-2
0
2
4
-4
Year and Quarter
B. PLACEBO STUDIES (DOWNLOAD SPEEDS)
2011Q1 2012Q1 2013Q1 2014Q1 2015Q1 2016Q1
x5 cutoff
Trea
tmen
t eff
ect
-.5
0
1
-1
.5
Trea
tmen
t eff
ect
Year and Quarter
B. PLACEBO STUDIES (UPLOAD SPEEDS)
2011Q1 2012Q1 2013Q1 2014Q1 2015Q1 2016Q1
x5 cutoff
MERGER

34
ASSESSING THE IMPACT OF MOBILE CONSOLIDATION ON INNOVATION AND QUALITY
Abadie, A. & Gardeazabal, J. (2003). “The Economic Costs of Conflict: A Case Study of the Basque Country”, The American Economic Review, 93(1). Available at <https://www.aeaweb.org/articles?id=10.1257/000282803321455188>
Angrist, J. & Pischke, J-S. (2008). “Mostly Harmless Econometrics: An Empiricist’s Comparison”. Princeton: Princeton University Press.
Athey, S. & Schmutzler, S. (2001). “Investment and market dominance”, RAND Journal of Economics, 32 (1). Available at <http://econpapers.repec.org/article/rjerandje/v_3a32_3ay_3a2001_3ai_3a1_3ap_3a1-26.htm>
Bauer, S. et al (2010). “Understanding Broadband Speed Measurements”, Massachusetts Institute of Technology. Available at <http://mitas.csail.mit.edu/papers/Bauer_Clark_Lehr_Broadband_Speed_Measurements.pdf>
BWB (2016). “An Ex-post Evaluation of the Mergers H3G/Orange and TA/Yesss!”. Available at <https://www.en.bwb.gv.at/News/Seiten/BWB-und-RTR-present-reports-on-the-telecom-sector-enquiry.aspx>
CERRE (2015). “Evaluating market consolidation in mobile communications”. Study prepared for CERRE, authored by Genakos C., Valletti T. & Verboven F. Available at <http://cerre.eu/sites/cerre/files/150915_CERRE_Mobile_Consolidation_Report_Final.pdf>
DG Competition (2015). “Ex-post analysis of two mergers: T-Mobile/tele.ring in Austria and T-Mobile/Orange in the Netherlands”. Authored by Aguzzoni L., et al. Available at <http://ec.europa.eu/competition/publications/reports/kd0215836enn.pdf>
DG Competition (2017). “Economic impact of competition policy enforcement on the functioning of telecoms markets in the EU”. Reported prepared by Lear, DIW Berlin and Analysis Mason. Available at <http://ec.europa.eu/competition/publications/reports/kd0417233enn.pdf>
Evans, D. & Padilla, J. (2003). “Demand-Side Efficiencies in Merger Control”. SSR Electronic Journal. Available at <http://dx.doi.org/10.2139/ssrn.390500%20>
Frontier (2015). “Assessing the case for in-country mobile consolidation”. Study prepared for GSMA. Available at <http://www.gsma.com/publicpolicy/wp-content/uploads/2015/02/Assessing-the-case-for-in-contry-mobile-consolidation-report.pdf>
Houngbonon G.V. & Jeanjean, F. (2016-b). “Optimal market structure in the wireless industry”. Information Economics and Policy, 38, 12-22. Available at <http://econpapers.repec.org/article/eeeiepoli/v_3a38_3ay_3a2017_3ai_3ac_3ap_3a12-22.htm>
Houngbonon, G.V. & Jeanjean, F. (2016-a). “What level of competition intensity maximises investment in the wireless industry?”, Telecommunications Policy, 40(8), 774-790. Available at <http://dl.acm.org/citation.cfm?id=2983042>
HSBC (2015). “Supersonic: European telecoms mergers will boost capex, driving prices lower and speeds higher”. Available at <http://www.orange.com/fr/content/download/33263/1086075/version/2/file/Supersonic+13.04.15.pdf>
Nitsche, R. & Wiethaus, L. (2016). “Efficiency defence in telecom mergers and other investment intensive industries”, European Competition Law Review, 7(13).
OECD (2014). “Access network speed tests”, OECD Digital Economy Papers, No. 237, OECD Publishing. Available at <http://dx.doi.org/10.1787/5jz2m5mr66f5-en>
RTR (2016). “Ex-post analysis of the merger between H3G Austria and Orange Austria”. Available at <https://www.rtr.at/en/inf/Analysis_merger_H3G_Orange/Ex_post_analysis_merger_H3G_Orange_RTR.pdf>
WIK (2015). “Competition & Investment: An analysis of the drivers of investment and consumer welfare in mobile communications”. Study prepared for Ofcom, authored by Elixmann D., et al,. Available at <http://stakeholders.ofcom.org.uk/binaries/consultations/dcr_discussion/annexes/Competition_and_investment_mobile.pdf>
A4. References

35
ASSESSING THE IMPACT OF MOBILE CONSOLIDATION ON INNOVATION AND QUALITY

GSMA HEAD OFFICEFloor 2The Walbrook Building25 WalbrookLondon, EC4N 8AF, United KingdomTel: +44 (0)20 7356 0600Fax: +44 (0)20 7356 0601