Embed Size (px)
DESCRIPTION
Assessing the impact of different migrations in different locations. The background to recent Eastern European begins with the EU Schengen Agreement in 1985. This abolished border controls between EU / European countries who signed up (the UK did not sign) . - PowerPoint PPT Presentation
Citation preview

Assessing the impact of different migrations in different locations
Background to recent EU migration trends
• The background to recent Eastern European begins with the EU Schengen Agreement in 1985.
• This abolished border controls between EU / European countries who signed up (the UK did not sign).
• Schengen enshrines the principle that people are citizens of the Europe and can move freely within it.
•

EU enlargement
Enlargement occurred in 2004 when a large number of countries joined:• Malta• CyprusAnd the ‘Accession 8’ (A8 countries) former eastern bloc countries:• Estonia• Latvia• Lithuania• Poland• Slovenia• Czech Republic • Slovakia• HungaryThese 10 were joined by 2 more former eastern bloc countries in 2007 (A2
countries): Bulgaria and Romania• Romania • Bulgaria
Most countries already within the EU chose not to allow free movement of the new EU citizens, into their countries. The exceptions to this
were the UK, Ireland and Sweden. As non-Schnegen signatories it should, in theory, be easier for
the UK and Ireland to control immigration. Sweden decided migration would
be economically beneficial.

EU membership timeline1957 1973 1981 1986 1995 2004 2007
France Denmark Greece Portugal Austria Cyprus Bulgaria
West Germany Ireland Spain Finland Czech Republic Romania
Netherlands United Kingdom. Sweden Estonia
Belgium Hungary
Luxemburg
Latvia
Italy Lithuania
Malta
Poland
Slovakia
Slovenia

The compulsory case study for migration to the UK
Remember that the UK did not sign the Schengen agreement preferring to control their own borders but allowed migration from the A8 countries who joined the EU in 2004.Only the UK, Ireland and Sweden allowed this so had a massive influx of migration – but this will change as the other EU members have opened their borders and UK may start losing migrants)
Over 1 million migrants from eastern Europe have arrived in the UK since 2004 but the largest group have come from Poland 57% of the total

Explain where the most migrants came from and why they are attracted to the UK
People come to the UK as it is seen as a tolerant place for migrants, it has many job opportunities, there is a lot of low skilled jobs that need filling (such as vegetable picking) and wages are higher than many in the home country. There are better amenities and services. (A better quality of life, with improved health care and education). There are many established ethnic groups which provide a home from home community.

A8 economic migrants
Highest proportion of applicants were Polish (57% of the total), followed by Lithuanian (15%) and Slovak (11%) applicants.

The type of jobs they come over to do
Why?• Unemployment is high in Poland (at 20-
35%. 40% of the unemployment is youths - hence why it is younger generations coming to the UK
• Low wages – around 40% of the European average (they take mainly low paid jobs in the UK but that is still more than the wages they would get at home)
1. Admin & business36% 2. Hospitality & catering 20% 3. Agriculture
11% 4. Manufacturing 7% 5. Food processing 5%
Increase in admin/businessDecrease in catering roles


Polish economic migrants
Specific Pull factors
• The lifting of restrictions in the UK with the A8 countries joining the EU in May 2004
• A8 nationals coming to the United Kingdom are legally allowed to work, if registered with the Government's Worker Registration Scheme
• Polish newspapers full of recruitment adverts from agencies • Higher wages eg nurses can earn 4 times the amount than back home • Free health care – NHS spent £350 million on maternity services for
foreign-born mothers• Free education • Cheap accommodation – the housing in the UK is cheaper and of better
quality• Ease of migration – Only UK, Ireland & Sweden decided to allow unlimited
migration from the new member countries in 2004• Good Exchange rate – migrants send remittances (money) home to their
families

Polish economic migrants
Specific Push factors• Increased insecurity and lower living standards in Poland• Unemployment: 20 – 35%• 40% youth unemployment rate. • Low income levels per capita - around 40% of the European
average• Cuts in the public sector have meant that workers have faced
falling real wages and an intensification of work. • A reduction in farm subsidies is on the horizon in the form of the
Hausner Plan. • Low availability of housing – in 2004 there were 300 dwellings
for every 1000 people

The economic push and pull
Its clear from this graph why people from the A8 countries are wanting to move to the UK, and in the future to other countries, when their average GDP is so much lower than the original EU15

The geographical pattern of Eastern European migrants in the UK
• City of London• Boston• Westminster• Northampton• South Holland• Peterborough• Fenland • East Cambridgeshire• Herefordshire• Dungannon
Within the UK the A8 migrants are spread out in a totally new pattern but many are concentrated in rural areas as well as cities – which brings problems to those areas as services may be strained.
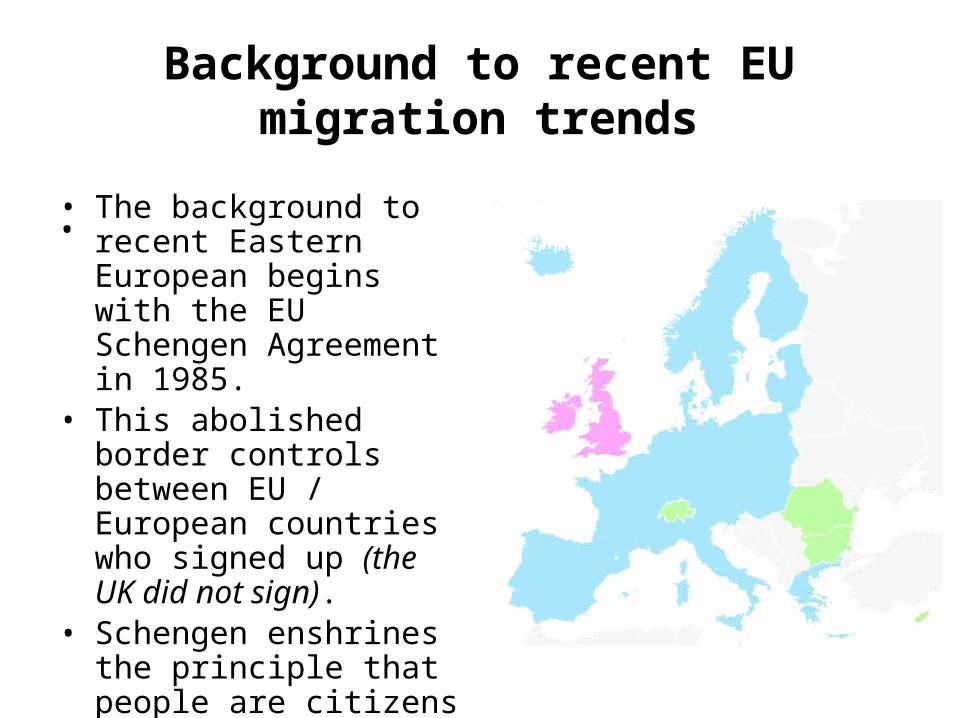
They settle all over the UK but there is certain areas that they are found in abundance.
Hotspot areas include:65000 in the east (vegetable picking), 59000 in London, 51000 in the Midlands and 32000 in Scotland. (fishing industry)
Top areas include:City of LondonBoston (east)WestminsterNorthamptonPeterboroughFenlandsEast CambridgeScotland

Impact on population – a crowded island?
• 60% of immigrants concentrated in SE and London
• London set to regain ‘mega-city’ status.
• Ghettoisation an issue• So too is volume of
housing needed• Some areas, such as
Scotland will soon see falling populations
Concentrations of people born outside the UK

Source Benefits Source Negatives Host Benefits Host NegativesEconomic Polish
economy grows because money is sent back to Poland
Shortage of labourers as most migrants are working age = economy doesn’t grow as muchMigrants who plan to settle only send around 8% remittances home
Fills skills gaps – many are highly skilledEconomic turn aroundAdd 4-5% to regional output (West Midlands)Workers will work for less than British workers
Money earned by the polish workers isn’t all spent in the UK but send home to PolandDrives wages for jobs down Exploitation from agency ‘masters’
Social Skills learnt can be taken back to PolandUnemployed reduced
Poland’s population has fallenBirth rate decreased as people of reproductive age are leavingGrowing worker exploitation of polish Significant amounts of ‘brain drain’Ageing population developsFamily break up as generally young men migrate leaving families behindA culture of emigration and a sense that leaving is a good thing - societies undervalue themselves
Migration of working age has helped the problems caused by the UKs ageing populationYoung migrants pay taxes which support older retired peopleIncreased culture as Polish products have opened up areasNumbers attending Catholic church has increased
Increased strain on services e.g. education/ health careSocial/cultural tensionsPerception and prejudiceIncreased crimesOvercrowdingDemand for resources such as housing leads to shortages, rising prices etcLanguage support needed
Environmental
Less pressure on resources such as land
Increased immigration from Poland has meant more air travel = global warmingIncreased congestion, urban air pollution and urban sprawl

Summary of some key points about migration of Poles to UK:
– migrants around 30 years old with vocational training or secondary education and some work experience
– young migrants, just finished vocational training or secondary education: 80% of all A8 migrants to the UK are 18–34 years old; 18–24-year-olds form the largest age group (43% of total migrants)
– young and unmarried migrants with a tertiary education keen to brush up their language skills and attain some working experience abroad
– highly-educated specialists with work experience
Eastern European migrants who have moved to the UK have done so mainly for work. They include:

– The vast majority of the 800,000 to 1 million migrants who have come to the UK since 2004 are from Poland.
– There are also significant numbers from Latvia, Lithuania and Slovakia.
– These migrants represent 4–5% of the labour force of their source countries (2007).
– In the past, immigration has tended to concentrate in urban areas.
– The distribution of A8 migrants is highly unusual.
– Many have settled in rural areas and work on farms and in food processing.
– The UK’s A8 rural hotspots are: Boston, Peterborough, Fenland, Herefordshire and Dungannon.
– In 2007 10% of the people living in some rural areas were immigrants.

⁻ Temporary immigrants send about 25% of their earnings home as remittances.⁻ Immigrants who plan to settle in the UK send only about 8% home. ⁻ For Poland, this income amounted to around €6.4 billion in 2006, or 2.5% of
Polish gross national income (GNI).⁻ Average earnings in the UK for the Poles are only about £6 per hour.⁻ There is also a growing problem with worker exploitation as unscrupulous
gangs prey on A8 workers. ⁻ A significant brain drain is also occurring from Poland. ⁻ For some A8 countries, the loss of its more able workforce is significant.

Update• A large number of the 1.4 million eastern European migrants previously
living in the UK left and returned home in 2008, 2009 and 2010. • Almost half of the A8 migrants have returned home, leaving 700,000 in
the UK. • The reasons relate to the global economic downturn and social reasons:
when it joined the EU in 2004, Poland’s unemployment was at 20%, whereas the British economy was strong and there were plenty of jobs.
• The Polish currency (the zloty) has since strengthened against the pound making work in Britain less rewarding for migrants.
• But now the UK economy is struggling while Poland’s is actually growing healthily (in fact it is the world’s 20th largest!).
• Warsaw has an unemployment rate below that of London and some Polish firms are flourishing and can put together attractive financial offers to entice people back home.
• Many young, well-educated Poles have been doing demeaning work in Britain for which they are overqualified.
• They are glad to return home for more rewarding employment, closer to their families.

Reading – compulsory case study Poles to UK
• Pearson (better) p 106-109• Philip Allan – p138-140

Migration compulsory case study:UK to Spain (the Costa del Sol)


Migration to the Costas
• The Spanish Costas have long been a popular destination for Northern Europeans
• 1.8 million properties are foreign owned, with 600,000 of them being British
• A lot of them are holiday owned, but a large number are permanent residents
• 60% of migrants are over 45, with a large part of this being a retired population, business owners and property speculators
What has lead to people migrating – push and pull factors
• Spanish Climate - 10°C warmer than Britain and has less rainfall, with leads to improved health
• Lower property prices in Spain and value of properties in UK have increased meaning when these are sold there is a lump sum of money to support them through their retirement
• Lower tax rates• 50 – 60% lower utility bills – reduced cost of living• Life style – Laid back, slower pace of life• Lower crime rate and absence of ‘youth’ culture• Family/friends – many have holidayed there or already have family
living there• A reduction in ‘distance’ and improved accessibility:
– Rise of low cost air lines have made the cost of travelling a lot cheaper so people can afford to fly back to the UK regularly
– Long term road building programme in Spain– Increased internet use

Problems of moving to the Costa’sNegatives
Housing
Although housing is cheaper many areas have no access to mains water so have to use deposit tanks which isn’t safe to drink50000 illegal homes built in Spain and many Britain’s have brought theseValencia law – allows developers to build on part of your land if it will improve the area for other peopleOften purpose build accommodation is isolated•Coastal development has lead to destruction of natural landscape•Inflation of property prices
Services
Postal system is not very organisedHealth system struggles to cope with increased demandHealth care bills very expensive (no National Health Service and they are away from their families often)Isolated retirement communities and designed for people in good health, not for people who are frail
Social Language barrier – people struggle to communicate and integrate with locals = conflicts

Reading and tasks
• Pearson (better) p 110- 112 • Philip Allan p 140-141

Managing MigrationPolicy Advantages Disadvantages
Border Controls Physical borders, policing, passports and visas all gov’s to count people in and out
Cost of installing systems – UK’s border control runs at £2 billion. May put of potential highly skilled migrants
Work Permits Allows temporary workers to be controlled and matched to skills shortages
Can be abused, with some not leaving when their time is up and becoming illegal immigrants
Refugees and asylum seekers Prestige gained by accepting vulnerable groups and respecting human rights
Public may perceive refugees and asylum seekers as a cost with few benefits attached. Asylum system is costly.
Integration Citizenship tests such as in the UK and USA might help integration by expecting a basic level of language and understanding of cultural norms
Critics argue passing a test does not prevent social tensions and racism

UK policy on immigrationThe policy tries to balance the costs of migration with the benefits and only allows certain migrants: genuine applications, favouring those with skills and education, and the Worker Registration scheme (WRS) allows those who will fill low-skill, low wage gaps. In 2005/2006 2.75 million applied for a visa to the UK, which is 57% more than in 2001/2002, and around 20% were refused due to forged documents. In 2008 the UK introduced the 5 Tier points based system from non-EU immigrants:Tier One: Highly skilled - This tier includes entrepreneurs, top scientists and business people. No job offer will be required. Tier two: Skilled with job offer - People with qualifications / work-related experience; job offer in a "shortage area" such as nursing. Tier three: Low skilled - Workers from the expanded European Union, who do not need prior permission to arrive.Tier four: Students - Those paying for tuition in the UK. Tier five: Temporary workers, Youth mobility - Professional sports people or professional musicians, who want to work in the UK for an event such as the Olympics or a football match, or a concert. The youth mobility aspect is intended to cover cultural exchanges or working holidays by young people.

Update!• The new (2010)David Cameron coalition government announced it would
be “tough” on migration by cutting net migration to below 100,000 from 300,000 per year.
• But it ran into trouble when business leaders announced that a cap on visas for skilled workers – set at 24,100 – was not enough.
• Business bosses think that this will threaten the UK’s role as a global hub – and Indian, Chinese and Brazilian TNCs will be unimpressed that they cannot transfer more staff to the UK.
• It is becoming harder for government to look tough on migration because fewer Brits are leaving due to the weak pound and fewer opportunities overseas due to the global recession. This means that net migration figure may rise even if fewer immigrants arrive!

• Foreigners with a student visa are the largest group of migrants that enter the UK each year.
• Universities rely heavily on the high fees paid by foreign students.
• Higher tuition fees for UK home students may reduce this dependency in future years.
• The government has been looking into possible inappropriate use of student visas eg London Metropolitan University


• Total net migration for the UK is still positive.• 512,000 people arrived in the UK during 2008 while 395,000 left. The net
balance was an in-flow of 117,000. • So although the rate of net migration is slower, it is still positive. • Campaign group MigrationWatch UK therefore believes the population of
the UK will still grow to exceed 70 million within 25 years, even with reduced levels of net immigration.
• With fewer Britons leaving to go to Spain (due to the poor exchange rate and greater financial uncertainty) there is less out-migration to offset in-migration
• so expect net migration to stay positive for the foreseeable future!

Answering examination questions on migration
May 2010
This is a good Section A response that would score full marks: it uses precise examples and answers
directly using clear language

Answering examination questionsJan
2010
Now try to attempt part (a) for
homework using Figure 10 and some
of the information contained in this
presentation

P 142-143 Philip Allan
• Read!
• Then p 113 Pearson Exam practice Qs!