Embed Size (px)
Citation preview

0
Copyright © 2021 by Arifin Rosid & Romadhaniah
This article should not be reported as representing the views of the Directorate General of Taxation
(DGT). The views expressed in this chapter are those of the authors and do not necessarily reflect the
official positions or the policy of the institution where the authors serve.
ASSESSING THE EFFECTIVENESS OF
LAW ENFORCEMENT IN IMPROVING
TAX COMPLIANCE IN INDONESIA:
AN EMPIRICAL INVESTIGATION
Arifin Rosid Directorate General of Taxation
Romadhaniah Directorate General of Taxation
Working Paper 21-05

0
Assessing the Effectiveness of Law Enforcement in Improving Tax Compliance in Indonesia: An Empirical Investigation
Arifin Rosid Directorate General of Taxation
Romadhaniah Directorate General of Taxation
Copyright © 2021 by Arifin Rosid and Romadhaniah
Working papers are in draft form. This working paper is distributed for purposes of comment and discussion only. It may not be reproduced without permission of the copyright holder. Copies of working papers are available from the author. Funding for this research was provided Directorate of Law Enforcement, DGT.

0
ASSESSING THE EFFECTIVENESS OF LAW ENFORCEMENT IN IMPROVING TAX COMPLIANCE IN INDONESIA: AN EMPIRICAL INVESTIGATION*1
Arifin Rosid & Romadhaniah
Directorate General of Taxation, Ministry of Finance of the Republic of Indonesia
The effectiveness of tax administrations’ strategy is crucial for domestic revenue
mobilization. While there are various studies on the relationship between law
enforcement and tax compliance, a study that empirically examines the relationship
between them within an actual tax administration’s strategy map is lacking in the
literature. In response, we set out to examine an identified knowledge gap about
whether, and precisely how effective, law enforcement may impact on taxpayers’
compliance in Indonesia. Investigating micro administrative Key Performance
Indicators (KPIs) data from all 352 tax offices across Indonesia, we reveal two principal
findings from this study. First, law enforcement seems to have positive impact upon
tax compliance. Second, the findings suggest that, while Audit Coverage Ratio (ACR)
has played a vital role in improving tax compliance, criminal investigation appears to
be an influential factor in determining the effectiveness of law enforcement. The
findings support the notion that law enforcement is an important aspect of tax
administration and better law enforcement would help Indonesian tax authority in
both improving tax compliance and raising revenue.
Keywords: tax compliance, law enforcement, performance management, tax
administration
JEL classification: D04, H20, H26, K42
1* This paper has been presented at the 8th TARC Conference, University of Exeter Business School, 15-17 December 2020. This study was part of a research project funded by Directorate of Law Enforcement, Directorate General of Taxation (DGT), Ministry of Finance of the Republic of Indonesia (MoF). The funder had no role in study design, data collection and analysis, or decision to publish. This paper should not be reported as representing the views of the DGT. The views expressed in this paper are those of the authors and do not necessarily reflect the official position or the policy of the institution where the authors serve.

1
INTRODUCTION
No matter how good a tax policy is, it would be futile if it cannot be implemented
effectively (Bird 2008). Therefore, tax policy formulation must consider the
institutional dimension of the tax system (Bird 2004). This is because tax policy and
tax administration interact at three separate levels: (i) policy formulation and
legislation; (ii) the administrative and institutional procedures required to implement
these laws and regulations; and (iii) the actual implementation of the tax system (Bird
2004).
Furthermore, tax authorities must operate effectively and efficiently to maintain an
equitable and economically viable tax regime (Klun 2004). This is because, while tax
policy and legislation will increase the opportunity for additional tax revenue
collection, the actual amount of tax receipts that can be collected is largely dependent
on the effectiveness and efficiency of the tax administration (Gill 2003).
Unfortunately, managing tax administration is challenging (Bird 2003). Good tax
administration is not only highly dependent on the internal capabilities of the
organization, the actions (and reactions) of individuals and the public, but also
intertwined with the complex interactions between various environmental factors
(OECD 2014; Rosid et al. 2016; Umar and Tusubira 2017)—OECD (2004) calls it
'operating context'.
For this reason, the first step policy makers need to consider in undertaking tax
administration reform is to diagnose its existing problems and then develop

2
appropriate strategies for improvement (Silvani and Baer 1997). Otherwise, without
appropriate strategy and execution, tax authorities are at risk of underperforming
(Gill 2000, 2003; McKerchar and Evans 2009).
In this sense, in managing its performance, the Indonesian tax authority—i.e.,
Directorate General of Taxation (DGT)—has implemented a strategic planning
framework and strategy execution using Balanced Score Card (BSC) approach since
2010. It is a strategy map that visually describes a high-level strategy, through several
Strategic Objectives (SO) that are integrated in a structural causal relationship.
Within the BSC framework, the organisation’s SOs are grouped into four perspectives:
(i) stakeholders, (ii) customers, (iii) internal processes, and (iv) learning and growth.2
On the DGT’s strategy map, the stakeholder perspective has an objective of 'optimal
tax revenue collection', which generated from a 'high level of taxpayer compliance' in
the customer's perspective. The strategic objective in the customers' perspective is
influenced by how well SOs in the internal process perspective perform.
Consecutively, the performance of several SOs from the internal process perspective
depends on the performance of several SOs in learning.3
Furthermore, SOs in the perspective of internal processes is divided into three major
groups: (i) services and public relations, (ii) monitoring and supervision, and (iii) law
2 BSC was developed by Robert S. Kaplan and David P. Norton in 1992. In 1996, their book entitled The Balanced Scorecards was published. BSC is a tool for executing and monitoring organizational strategy using financial and non-financial measures. See, https://balancedscorecard.org/bsc-basics-overview/, accessed 15 November 2020.
3 Visually depicted in Figure 1 and will be elaborated later.

3
enforcement. Modern tax administration generally carries out relatively the same
types of activities or business processes (Baurer 2005). Unfortunately, at least
empirically, there is no consensus on the causal relationship between business
process performance and increased tax compliance. Studies related to the
performance of tax administration business processes tend to focus only on the aspect
of performance measurement rather than the performance management itself (see
for example, Klun 2004; Serra 2005; von Soest 2006; Tennant and Tennant 2007).
Tax authorities, in general, engage in three main activities: service and public relation,
monitoring and supervision, and law enforcement (OECD 2014). In terms of law
enforcement, traditionally, the relationship between law enforcement and tax
compliance has often emphasized the likelihood impact of audits, the probability of
detection and the severity of sanctions (see for example, Allingham and Sandmo 1972;
Sandmo 2005; Cowell 1985; Franzoni 1998; Beck and Jung 1989; Dubin et al. al. 1990;
Kirchler et al. 2010; Kirchler et al. 2014). Unfortunately, the standard formulation of
deterrence in this conventional deterrence model often does not perform well in
practice, in part because practical constraints often severely restrict the potential to
do so (Osofsky, 2014).
This gap has led many studies related to tax compliance to depart from the solely
original concept of 'economic deterrence models' (see, for example, Brink and
Porcano 2016; Congdon et al. 2009; Cummings et al. 2009; Frey and Torgler 2007;
Halla 2012; Kornhauser 2007; MacGregor and Wilkinson 2012; McKerchar et al. 2013;
Yucedogru and Hasseldine 2016). This suggests the challenge of increasing tax
4
revenue, particularly in developing countries, cannot be overcome by the tax
administration alone and understanding the effectiveness of law enforcement is
critical (Umar and Tusubira 2017). Thus, given that to date there is no single 'magical
medicine' or fiscal 'silver bullet' suitable for use in overcoming the complicated
phenomenon of tax compliance (Bird 2013), understanding how effective law
enforcement in increasing tax compliance is an important avenue for tax research
(Walsh 2012).
According to the DGT’s Strategic Plan 2020-2024, one strategic initiative relevant to
the current tax administration reform to improve tax compliance is introducing
proper risk-based oversight and law enforcement. One question arises is that to what
extent law enforcement activities are capable of increasing tax compliance in
Indonesia? In response to this, we empirically investigate in more depth this strategic
issue through the lens of Indonesia's tax authority strategy map. Using micro
administrative data, we find that law enforcement seems to have positive impact upon
tax compliance. Our results indicate while Audit Coverage Ratio (ACR) has played a
vital role in improving tax compliance, criminal investigation appears to be an
influential factor in determining the effectiveness of law enforcement.
We contribute to the extant literature in the following ways. First, our paper adds to
the literature that empirically examines the impact of law enforcement upon tax
compliance, particularly from an emerging economy perspective. Second, we add to
the literature by providing a detailed analysis of the effectiveness of law enforcement
in increasing tax compliance. Unlike the extant literature, we demonstrate the results

5
specifically from the lens of tax authority. Third, to the best of authors’ knowledge,
no empirical study in tax literature has yet been conducted examining the
effectiveness of law enforcement in improving tax compliance using actual strategy
map and administrative data. In response, this study provides the first comprehensive
assessment of a tax authority’ s strategy map. Finally, as many tax administrations
operate under many uncertainties (Wenzel and Taylor 2003), this paper offers
evidence-based findings that may be beneficial in reducing some of those ex-ante
uncertainties, especially for the Indonesian tax authority.
The remainder of the paper is structured as follows. The next section presents the
contextual background. Section 3 presents a description of the data and empirical
strategy. Section 4 presents results and discussion. Section 5 concludes.
LITERATURE AND CONCEPTUAL FRAMEWORK
Tax compliance and law enforcement
The conceptual model of tax compliance is necessary to initially understand the
importance of law enforcement in improving tax compliance. According to OECD
(2013), one of tax compliance models that is currently widely used by tax authorities
in various parts of the world is the cooperative compliance model (CCM). From the
perspective of tax authority, compliance strategies range from full-service oriented at
the bottom of the pyramid model to full legal prosecution at the top. In other words,
if the taxpayer wants to comply, the authority needs to respond in various ways and
means that facilitate compliance.

6
Conversely, if taxpayers are known or suspected of tax evasion or deliberately evading
taxes, they may face full enforcement. Law enforcement aspects in the CCM concept
are two compliance strategies that exist at the top of the pyramid: (i) use the full force
of the law and (ii) deter by detection. Both activities are undertaken in the forms of
'audit, investigation and other verification' and 'debt collection' (OECD 2017). The
ability of tax authorities to provide optimal services for taxpayers who want to comply
and prevent or detect non-compliance of taxpayers can be called administrative
effectiveness (Langham et al. 2012). Regarding this, according to Lewis (1982) and
Cullis and Jones (1992), tax-enforcement structures can affect perceived enforcement
and opportunity for tax evasion. So far, however, no previous study has investigated
this area using administrative data.
In Indonesian context, the effectiveness of law enforcement needs increasingly urgent
attention at least for two main reasons. First, its tax-to-GDP ratio is relatively low
compared to other developing countries (Araki and Claus 2014), and to increase it has
been proven to be difficult (OECD 2018). Indonesia's average tax ratio is still below
12% (OECD 2018) and this figure according to the IMF (2011) is lower than the average
tax ratio in poor countries (low-income countries). Indonesia's tax ratio is very low by
international standards and has even tended to decline over the past five years.4 Poor
4 It should be noted that tax ratios can be defined and calculated in several ways. In Indonesian context, the calculation of the tax ratio that is commonly used is in a narrow sense, that is, it does not include elements of local taxes and social security contributions. A more detailed discussion of the various methods of calculating the tax ratio can be seen in the OECD (2001).

7
law enforcement appears to contribute to low tax ratios (OECD 2015) and one of the
efforts to improve it is by strengthening the tax administration (OECD 2018).
Second, although the self-assessment system has been implemented for almost 37
years, the issue of tax compliance is still a major unresolved problem in Indonesia
(Ikhsan et al. 2005; Francis 2012; Basri et al. 2019). As a result, although DGT has made
substantial changes through the tax administration reform program since 2002, the
tax revenues that have been collected are still relatively low (Arnold 2012). Issues
related to tax compliance are indeed not easy issues to resolve (Mikesell and Birskyte
2007). Referring to the 2015-2019 DGT Strategic Plan, the main concerns currently
faced by the DGT in relation to its low tax ratios are low taxpayer compliance and
ineffective supervision and law enforcement.5
Because it can be defined from various perspectives, tax compliance has various
meanings. Its definition tends to be very broad and includes various aspects.
Consequently, there is still no widespread consensus about what is meant by tax
compliance (see, for example, Devos 2014; McKerchar 2003; Weber et al. 2014).
However, the approach commonly used to define it can be divided into two categories
(Rosid et al. 2016): conceptual (see, for example, James and Alley 2004; Kirchler 2007;
and Weber et al. 2014) and operational (see, for example, Jackson and Milliron 1986;
Alm 1991; Alm and Mckee 2006; IRS 2009; and OECD 2014).
5 See, Director General of Taxation Decree Number KEP-95/PJ/2015 regarding the DGT Strategic Plan for 2015 - 2019, pp. 10 - 11

8
While the conceptual approach tends to emphasize the willingness of taxpayers to
comply with tax provisions when law enforcement activities are absent, the
operational approach tends to focus more on certain aspects of fulfilling
administrative aspect of tax liabilities. For this reason, given its more practical use,
the operational approach seems to offer more advantages (Rosid et al. 2016). Under
this approach, the level of taxpayer compliance can be easily measured by simply
evaluating whether certain operational technical aspects of the tax requirements have
been met. Relating to this, somewhat comparable to the OECD (2014) definition, tax
compliance in Indonesia is divided into two main categories: 'formal compliance,'
which primarily refers to the filing of tax returns, and 'material compliance,' which
narrowly refers to the proper reporting and payment component.6
It is worth adding that both compliance and non-compliance can be intentional or
unintentional (Cooper 1994; Erard 1997; Lederman 2003; OECD 2014). In other words,
differences in the level of taxpayer intentions and the effectiveness of the
administration of tax authorities can lead to four types of compliance behaviour: (i)
deliberately compliant; (ii) accidentally non-compliant; (iii) accidentally compliant;
and (iv) non-compliant or evasive (Langham et al. 2012; OECD 2014).
Referring to the ex-post definition of tax compliance, indeed, to find out what the
typology of most taxpayers or how far the extent of their (non)compliance is a
daunting task. However, there are several indicators that can be used to indicate this.
6 According to OECD (2014, p. 60) tax compliance has four pillars: "(i) to register for tax purposes; (ii) to file tax returns on time; (iii) to correctly report tax liabilities; and (iv) to pay taxes on time."

9
From a practical perspective, based on the criteria adopted in the DGT’s strategy map,
formal compliance measures the comparison between the number of taxpayers who
lodge their tax return with the number of taxpayers who obliged to do so. Material
compliance is defined as the ratio between the number of taxpayers who made
payments and the number of taxpayers who are obliged to submit tax returns.
Those who are obliged to submit tax returns are generally subject to audits. This is
one common form of law enforcement. One term specifically relates to this is Audit
Coverage Ratio (ACR). ACR is a measure to determine the likelihood of getting
audited at national level (DGT 2019). As in other countries, largely due to its limited
resources, Indonesia has low ACR. Based on the 2018 DGT Performance Report, the
ACR targets for the corporate income taxpayers for 2016, 2017, and 2018 were 1.68%,
2.32%, and 2.32% respectively; while for the individual taxpayers were 0.23%, 0.39%,
and 0.39%.
It should be noted that in calculating the ACR, the current formula includes the
number of routine audits. From a taxpayer’s perspective, routine audit can be
considered as an anticipated audit.7 The reason is because, it applies for all taxpayers
who lodged overpaid annual tax returns. As we can see in Table 1, on average, 70% of
audits is routine audits. This implies that, only 30% of audits are random audits. This
type of audit is risk-based audit, carried out based on risk assessment of non-
7 See, Director General of Taxes Circular Number 10/PJ.04/2008 concerning Tax Audit Policy to Assess Level of Compliance. On the other hand, developed countries emphasize risk-based audit approach in assessing the level of compliance (IMF 2015).

10
compliance behaviour. Accordingly, if ACR is narrowly measured based on the
number of random audits, the actual audit rate is much lower.8
Table 1: Number of audits and Audit Coverage Ratio for FY 2016 - 2018
2016 2017 2018
a Number of registered self-employed individual & corporate taxpayers
8,184,559 9,145,154 9,870,044
b Number of registered self-employed individual & corporate taxpayers obliged to submit annual tax return
3,348,632 3,152,819 3,904,165
c Number of routine audits performed 66,077 103,418 101,968
d Number of random audits performed 30,878 44,331 43,854
e Total (c + d) 96,955 147,749 145,822
ACR—routine & special audits) (e:b) 2.9% 4.69% 3.74%
ACR—special audits only (d:b) 0.92% 1.41% 1.12%
Source: Authors
Indonesia’s tax administration strategy map
Strategy is an integrated set of choices of an organization, aiming at obtaining the
expected results in the long run (Rivkin 2004). As mentioned earlier, DGT adopts a
BSC approach as a strategic management tool that translates the vision, mission, goals,
and strategies (DGT 2019). The DGT’s strategy map is a visual description of the
strategy, through several Strategic Goals (SG), linked conceptually in causal
relationships. SGs are statements about what the organization should have,
implement, produce, or achieve. The DGT strategy map has four perspectives: (i)
8 It should be noted, in calculating ACR, the DGT employs the number of taxpayers who are obliged to lodge annual tax return as the denominator. Several countries use a different approach. For example, the number of denominators that is commonly used is the number of active taxpayers (see for example, OECD 2017). The implication is that the Indonesian ACR is likely to be overstated compared to those of other countries.

11
stakeholders, (ii) customers, (iii) internal processes, and (iv) learning and growth. A
visual description of the strategy adopted by DGT in 2018 is illustrated in Figure 1.
Figure 1: DGT’s strategy map
Source: DGT’s strategy map (DGT 2019)
We utilise the hypothetical structural causal relationships among the SGs deployed
in the four perspectives of the strategy map as a conceptual framework of this study.9
The performance of SG is measured by the realized scores of its corresponding Key
Performance Indicators (KPIs) (Marr 2008). In this study, we use these values as
empirical referents in measuring its effectiveness. According to OECD (2008),
effectiveness is a measure to evaluate how far ‘results’ or ‘impacts’ can be achieved.
9 To date, the design of strategy map and performance management in the DGT is referring to the Minister of Finance Decree Number 467/KMK.01/2014 concerning Performance Management.

12
Law enforcement policy can be considered effective if the impact generated is in
accordance with the desired outcome—i.e., improved compliance. That is, the extent
to which compliance level could be increased is an indication of the effectiveness of
law enforcement activities. Although several studies have recognized the importance
of enforcement in improving tax compliance (see, for example, Gemmel and Ratto
2012; Slemrod 2019), research has yet to systematically investigate the effect of law
enforcement using actual administrative data is lacking in the literature.
Utilising KPIs realized values as parameters, we examine whether the program or
activities attributed to law enforcement in the strategy map can improve taxpayer
compliance. As depicted in Figure 1, 'optimal tax revenue collection' is a strategic goal
within stakeholder perspective, which resulted from strategic goal of 'high taxpayer
compliance' in the customer's perspective. Conceptually, strategic goals in the
customer perspective are influenced by how well strategic objectives in the internal
process perspective perform. Consecutively, the performance of strategic goals in
internal process perspective depends on the performance of strategic goals in the
learning and growth perspective. It is worth noting that strategic goals in internal
process perspective is divided into three major groups: (i) services and public
relations, (ii) supervision, and (iii) law enforcement. A detailed explanation of the
strategic goals prescribed in the DGT strategy map can be found in Appendix 1.
Program logic of tax compliance
Effectiveness is a measure to evaluate the extent to which 'results' or 'impacts' has
been achieved (OECD 2008). In improving tax compliance, tax authority requires

13
resources (inputs) (such as human resources and budgets). These resources are used
to carry out various activities, such as education to taxpayers, administrative services,
audits, billing, and other administrative activities. These activities produce outputs.
This output can be in the form of number of services performed or number of audits
completed. This output is then expected to have an impact (i.e., outcome). In general,
the overall impact that the tax authorities want to achieve in relation to their
operation is improved taxpayer compliance (OECD 2008). In this sense, effectiveness
occurs when the impact of the activity or program is as expected.
For this reason, we consider law enforcement is effective when the actual impact is in
accordance with its desired outcome—i.e., it increased taxpayer compliance. Thus,
the extent to which compliance behaviour can be improved is a strong indication of
the effectiveness of a program. Referring to the previous explanation, using the KPI
performance value as a parameter, we explore whether the existing activities in the
aspect of law enforcement in the strategy map can increase taxpayer compliance, as
conceptually expected in the strategic goals.
Research problem and propositions
The performance of tax authorities can be broadly measured at three levels: strategic,
operational, and individual (Crandall 2010). In this study, we seek to examine whether
law enforcement is effective in improving tax compliance in Indonesia at strategic
level. To elaborate upon this research endeavour, based on the theoretical framework
and extant literature, we consider the following research propositions. To clearly

14
comprehend the scope of the study, we present the research propositions as a set of
alternative and null (H0) hypotheses in Table 2 as follows.
Table 2: Hypotheses under study
No Prediction
1 H1a Audit coverage ratio positively improve the level of formal compliance
H10 Audit coverage ratio do not improve the level of formal compliance
2 H2a Non-disputed tax assessments positively improve the level of formal compliance
H20 Non-disputed tax assessments do not improve the level of formal compliance
3 H3a Imprisonment proposal for unpaid tax arrears positively improve the level of formal compliance
H30 Imprisonment proposal for unpaid tax arrears imprisonment do not improve the level of formal compliance
4 H4a Information reporting upon indication of tax crime positively improve the level of formal compliance
H40 Information reporting upon indication of tax crime do not improve the level of formal compliance
5 H5a Audit coverage ratio positively improve the level of material compliance
H50 Audit coverage ratio do not improve the level of material compliance
6 H6a Non-disputed tax assessments positively improve the level of material compliance
H60 Non-disputed tax assessments do not improve the level of material compliance
7 H7a Imprisonment proposal for unpaid tax arrears positively improve the level of material compliance
H70 Imprisonment proposal for unpaid tax arrears do not improve the level of material compliance

15
8 H8a Information reporting upon indication of tax crime positively improve the level of material compliance
H80 Information reporting upon indication of tax crime do not improve the level of material compliance
DATA AND EMPIRICAL STRATEGY
Data
The main objective of this study is to better understand the effectiveness of law
enforcement in improving tax compliance in Indonesia, particularly from a tax
authority’s perspective. In doing so, to optimize the level of generalizability of the
findings, we employ a census approach for data collection. Thus, we collect and
analyse quantitative data (i.e., the scores of KPIs) from all 352 tax offices across
Indonesia. The number and the distribution of tax offices are described in Table 3.
Apparently, the number of tax offices vary for each main islands. Java has the largest
number of tax offices (57% or 202 out of 352 tax offices) correlates with 58% of
Indonesia’s GDP is generated from this region (BPS 2013). In terms of type, vast
majority of tax offices is categorised as small tax offices (91% or 319 out of 352 tax
offices).
Table 3: Number of tax offices under study
No Regions
Type of tax offices Total
Large Special Medium Small
1 Java 4 9 13 176 202
2 Sumatra - - 4 67 71
3 Sulawesi - - 1 25 26
4 Kalimantan - - 1 26 27
5 Bali, Nusra, Papua, & Maluku - - 1 25 26
Total 4 9 20 319 352

16
In addition, we are also capable of obtaining a confidential list of 480 taxpayers that
have been investigated in relation to indication of committing tax crime in 2018.10
Using this list, we then generate two additional data sets. The first data set consists
of 185 tax offices where these 480 criminally investigated taxpayers were administered,
while the second data set is the rest (i.e., 167 tax offices without taxpayers being
criminally investigated). To simplify, we named the former ‘group A’ and the latter
‘group B’.
Empirical Strategy
As previously indicated, we use the intuitive conceptual model of DGT's strategy map
to test the effectiveness of law enforcement in improving tax compliance. To
empirically examine the effectiveness of law enforcement in increasing tax
compliance, we adopt a 'conceptual testing' approach to evaluate whether law
enforcement activities affect tax compliance. The conceptual framework being tested
here is a strategy map.
In this regard, we consider Structural Equation Modelling (SEM)—defined as a
statistical technique for determining, estimating, and evaluating the linear
relationship model among a set of observed variables (Shah and Goldstein 2006)—is
an appropriate approach to adopt. The reason is that SEM is a tool for 'confirmatory'
rather than a tool for 'exploratory' (Gefen et al. 2000; Kline 2005, 2011). As an a priori
technique for determining the pattern of linear relationships between a set of
10 Based on Preliminary Criminal Investigation Reports for fiscal year 2018, we are aware that it generally took 1,5 years to 2 years to conclude the investigation.

17
variables simultaneously, rather than for 'finding' an appropriate model (Shah and
Goldstein 2006), SEM is considered as an appropriate statistical tool and powerful for
testing theories or concepts (Steenkamp and Baumgartner 2000; Hair et al. 2010;
Blunch 2013).
Figure 2: The Conceptual Framework Examined Using SEM
Note: The rectangles indicate the observed variables under study (i.e., KPIs; 19 in total). SP represents KPI from stakeholder perspective (i.e., two KPIs), CP represents KPI from customer perspective (i.e., two KPIs), IP represents KPI from internal process perspective (i.e., 12 KPIs), LG represents KPI from learning & growth perspective (i.e., three KPIs). In this intuitive conceptual model, 64 causal relationships were analysed simultaneously.
SEM method emphasizes the importance of understanding the pattern of correlations
between a set of variables and describing as much of their variance as possible with

18
the model being tested (Kline 2005, 2011). The conceptual framework of path analysis
in which SEM is applied to test simultaneously all causal relationships among
observed variables in the strategy map is shown in Figure 2.
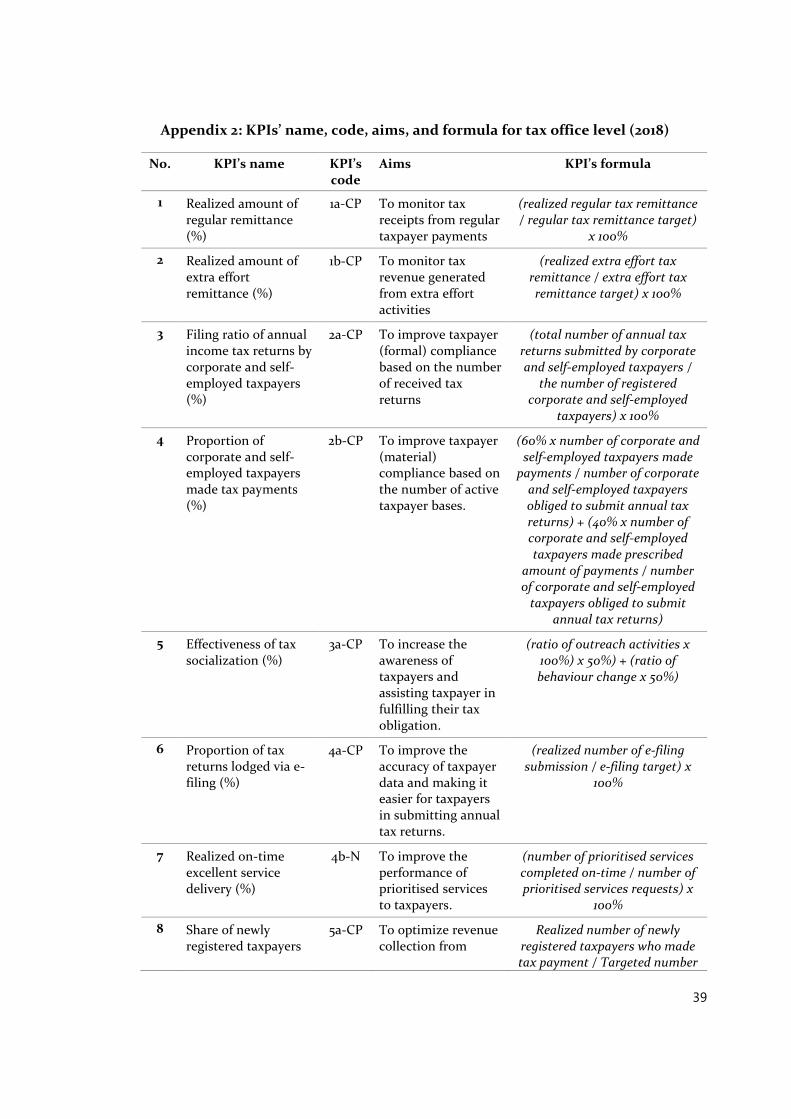
To examine the hypotheses, we treat KPIs scores as empirical referents. There are in
total 19 KPIs data in the DGT 2018’s strategy map. It serves as quantitative reflective
indicators for how well strategic goals have been achieved.11 By way of illustration, the
empirical referent for the Audit Coverage Ratio (ACR) is the KPI score for the ACR,
while the empirical reference for level of tax compliance is the score of KPI for the tax
compliance. By doing this, the variables that were previously in a theoretical level
can be operationalized into an empirical level for further statistical analysis. It is
worth noting that the scale of all empirical referents in this study are ratio (i.e.,
percentage). We provide detailed information relating to these KPIs, including their
codes, aims, and formulas in Appendix 2.
RESULTS
Descriptive Statistics
We report the descriptive statistics (mean, standard deviation, minimum, and
maximum) of 19 KPIs scores from 352 tax offices across Indonesia for 2018 in Table 4.
The values presented in Table 4 reveal that the realized scores for KPIs vary, with the
11 In SEM, a hypothesized causal structure can be represented in two ways: as a system of equations or as a graph. We prefer the latter because diagrammatic structural models have more communicative capacity in describing the relationships between latent and observable variables (Blunch 2013).

19
mean for routine tax revenue was the lowest (87%) and the mean for data feeding for
tax potential was the highest (451%).
Table 4: KPIs scores for 2018, N = 352 tax offices (%)
Perspect. No KPI’s name Min. Max. Mean SD
Stake holders
1 Realized amount of regular tax remittance
0 171.0 86.8 13.4
2 Realized amount of extra effort tax remittance
30.1 247.6 108.6 32.5
Customer 3 Filing ratio of annual income tax returns by corporate and self-employed taxpayers
49.7 229.4 106.5 25.8
4 Proportion of corporate and self-employed taxpayers made tax payments
41.3 286.2 106.5 29.7
Internal business process
5 Effectiveness of tax socialization 87.7 510.0 155.9 50.2
6 Proportion of tax returns lodged via e-filing
75.6 145.1 105.4 10.7
7 Realized on-time excellent service delivery
86.6 128.4 100.0 1.9
8 Share of newly registered taxpayers making payments
38.1 315.6 119.2 27.6
9 Share of successful tax inquiries 13.0 390.0 112.6 44.5
10 Approved random audit proposals 0 637.5 161.3 99.7
11 Audit coverage ratio 54.8 294.9 143.8 41.3
12 Proportion of non-disputed tax assessment
90.2 118.1 112.5 3.6
13 Completed imprisonment proposal for unpaid tax arrears
0 600.0 143.3 76.5
14 Realized information reporting upon indication of tax crime
0 766.7 129.9 69.3
15 Data feeding for tax potential 12.5 6,245.0 451.0 656.8
16 On-time data archiving and documentation
19.8 110.6 102.1 9.5
Learning & growth
17 Share of employees met standard training hours
95.6 142.9 128.3 11.5
18 Realized organizational performance dialogue and action plan monitoring
94.1 142.9 116.6 3.3
19 Budget execution quality 78.6 118.8 102.6 5.2
Note: In total, there are 12 KPIs in the internal business process perspective. Three KPIs are representing service and public relation activities (i.e., no 5, 6, and 7), three KPIs are
20
representing monitoring and supervision activities (i.e., no 8, 9, and 10), and four KPIs belongs to law enforcement activities (i.e., no 11, 12, 13, and 14). Two other KPIs are supporting activities.
Inferential Statistics
As depicted in the conceptual model (Figure 2), in total there are 64 causal
relationships that were tested simultaneously using SEM. The details of these
relationships are as follows: 36 causal relationships resulted from three KPIs in the
learning & growth perspective and 12 KPIs in the internal process perspective, 24
relationships resulted KPIs in the internal process perspective and 2 KPIs in the
customer perspective, and four relationships generated from KPIs in the customer
perspective and two KPIs in the stakeholder perspective.
Based on these SEM outputs, we then classify these causal relationships based on the
direction of the relationship and the level of its statistical significance. We mainly use
confidence level of 95 percent in this analysis (i.e., < 0.05). As such, there are four
categories of the nature of relationships: (i) positive—significant; (ii) positive—
insignificant; (iii) negative—significant; and (iv) negative—insignificant.12
At strategy map level, we find that majority (63%) of causal relationships were positive
(i.e., 43 out of 64). We report the statistical outputs in Appendix 3 and summarise
these results in Table 5.
12 A positive causal relationship between, for instance, A→B is considered to occur if an increase in the value of variable A is followed by an increase in the value of variable B, vice versa. Conversely, a negative causal relationship between, for instance, C→D is considered to occur if an increase in the value of variable C is followed by a decrease in the value of variable B, vice versa.
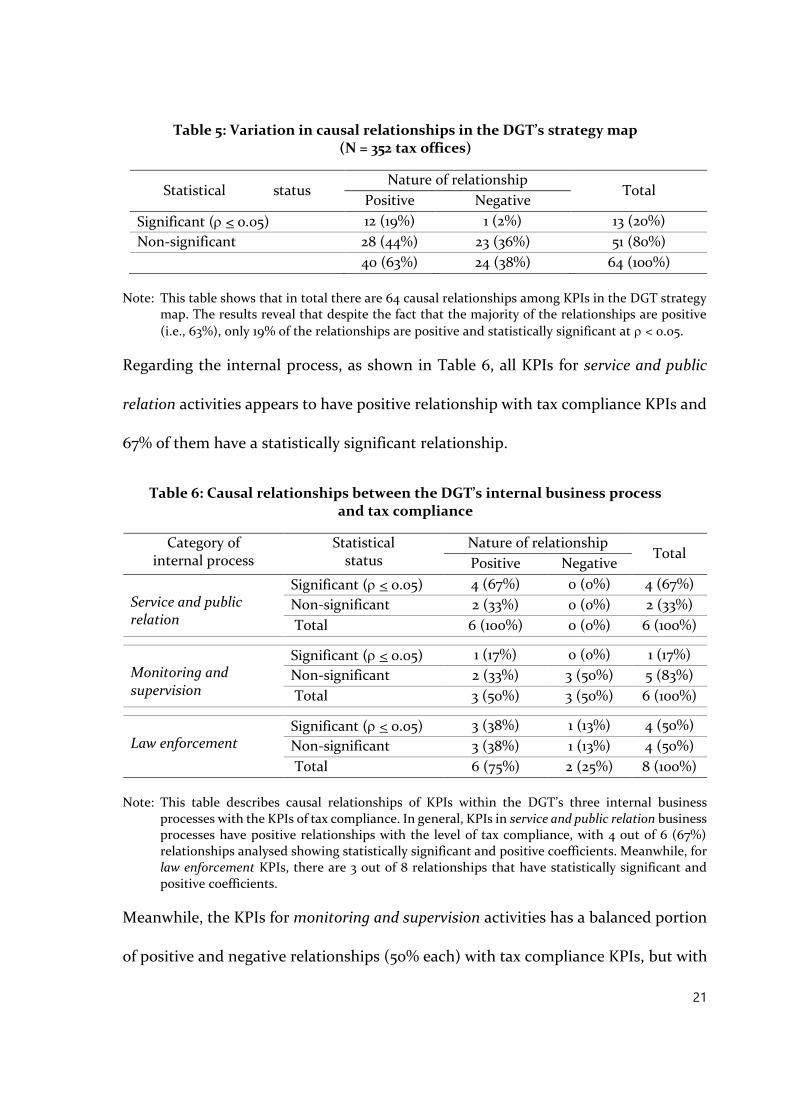
21
Table 5: Variation in causal relationships in the DGT’s strategy map (N = 352 tax offices)
Statistical status Nature of relationship
Total Positive Negative
Significant ( < 0.05) 12 (19%) 1 (2%) 13 (20%)
Non-significant 28 (44%) 23 (36%) 51 (80%)
40 (63%) 24 (38%) 64 (100%)
Note: This table shows that in total there are 64 causal relationships among KPIs in the DGT strategy map. The results reveal that despite the fact that the majority of the relationships are positive
(i.e., 63%), only 19% of the relationships are positive and statistically significant at < 0.05.
Regarding the internal process, as shown in Table 6, all KPIs for service and public
relation activities appears to have positive relationship with tax compliance KPIs and
67% of them have a statistically significant relationship.
Table 6: Causal relationships between the DGT’s internal business process and tax compliance
Category of internal process
Statistical status
Nature of relationship Total
Positive Negative
Service and public relation
Significant ( < 0.05) 4 (67%) 0 (0%) 4 (67%)
Non-significant 2 (33%) 0 (0%) 2 (33%)
Total 6 (100%) 0 (0%) 6 (100%)
Monitoring and supervision
Significant ( < 0.05) 1 (17%) 0 (0%) 1 (17%)
Non-significant 2 (33%) 3 (50%) 5 (83%)
Total 3 (50%) 3 (50%) 6 (100%)
Law enforcement
Significant ( < 0.05) 3 (38%) 1 (13%) 4 (50%)
Non-significant 3 (38%) 1 (13%) 4 (50%)
Total 6 (75%) 2 (25%) 8 (100%)
Note: This table describes causal relationships of KPIs within the DGT’s three internal business processes with the KPIs of tax compliance. In general, KPIs in service and public relation business processes have positive relationships with the level of tax compliance, with 4 out of 6 (67%) relationships analysed showing statistically significant and positive coefficients. Meanwhile, for law enforcement KPIs, there are 3 out of 8 relationships that have statistically significant and positive coefficients.
Meanwhile, the KPIs for monitoring and supervision activities has a balanced portion
of positive and negative relationships (50% each) with tax compliance KPIs, but with
22
only one statistically significant positive relationship (17%). Further, 75% of causal
relationships between law enforcement and tax compliance appears to have positive
relationships with 38% of the total are statistically significant.
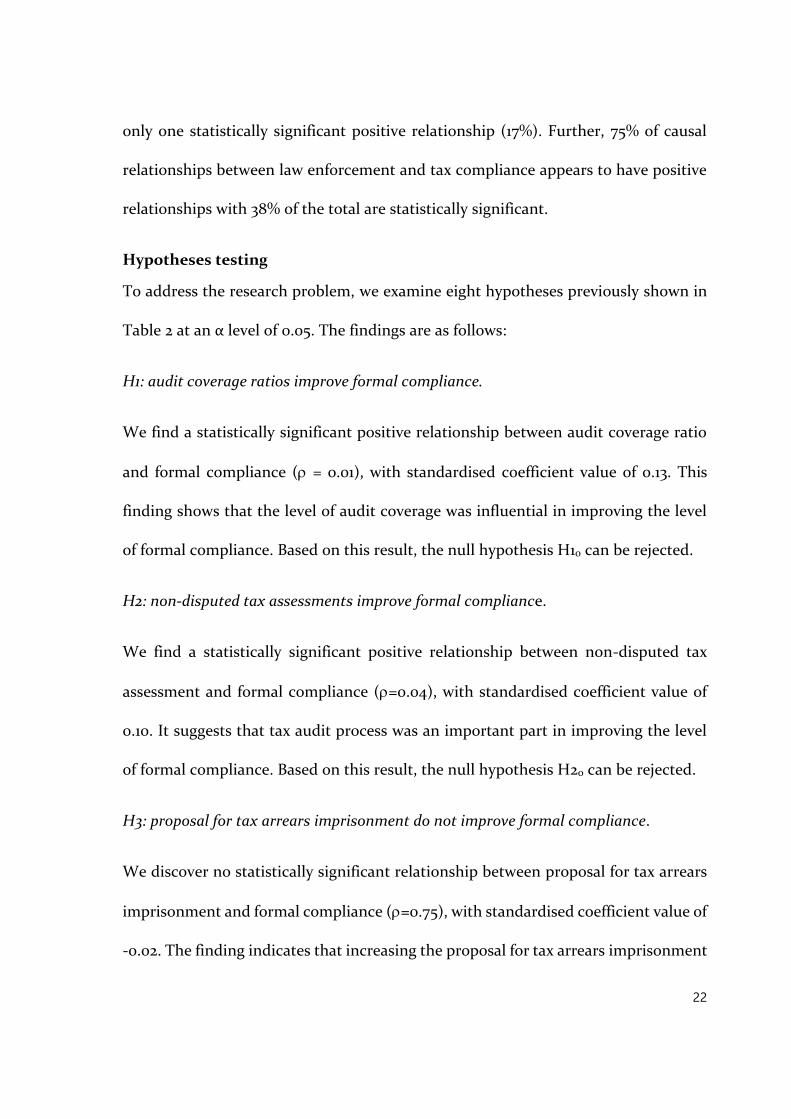
Hypotheses testing
To address the research problem, we examine eight hypotheses previously shown in
Table 2 at an α level of 0.05. The findings are as follows:
H1: audit coverage ratios improve formal compliance.
We find a statistically significant positive relationship between audit coverage ratio
and formal compliance ( = 0.01), with standardised coefficient value of 0.13. This
finding shows that the level of audit coverage was influential in improving the level
of formal compliance. Based on this result, the null hypothesis H10 can be rejected.
H2: non-disputed tax assessments improve formal compliance.
We find a statistically significant positive relationship between non-disputed tax
assessment and formal compliance (=0.04), with standardised coefficient value of
0.10. It suggests that tax audit process was an important part in improving the level
of formal compliance. Based on this result, the null hypothesis H20 can be rejected.
H3: proposal for tax arrears imprisonment do not improve formal compliance.
We discover no statistically significant relationship between proposal for tax arrears
imprisonment and formal compliance (=0.75), with standardised coefficient value of
-0.02. The finding indicates that increasing the proposal for tax arrears imprisonment

23
has no effect upon the level of formal compliance. Based on this result, the null
hypothesis H30 can be accepted.
H4: information reporting upon indication of tax crimes improves formal compliance.
We find a statistically significant positive relationship between information reporting
upon indication of tax crime and formal compliance (=0.10), with standardised
coefficient value of 0.08. This means that, although seems miniscule, information
reporting upon indication of tax crime has increased the level of formal compliance.
Based on this result, the null hypothesis H40 can be rejected.
H5: audit coverage ratios improve material compliance.
We detect a statistically significant positive relationship between audit coverage ratio
and material compliance ( = 0.003), with standardised coefficient value of 0.15. This
finding shows that the level of audit coverage was influential in improving the level
of material compliance. Based on this result, the null hypothesis H10 can be rejected.
H6: non-disputed tax assessments decrease material compliance.
We observe a statistically significant negative causal relationship between non-
disputed tax assessment and material compliance (=0.02), with standardised
coefficient value of -0.12. It suggests that tax audit process was an important part of
taxpayers’ material compliance. Based on this result, the null hypothesis H20 can be
rejected.
H7: proposal for tax arrears imprisonment do not improve material compliance.

24
We find no statistically significant relationship between proposal for tax arrears
imprisonment and material compliance (=0.55), with standardised coefficient value
of 0.03. It demonstrates that increasing the proposal for tax arrears imprisonment has
no effect upon the level of material compliance. Based on this result, the null
hypothesis H30 can be accepted.
H8: information reporting upon indication of tax crime do not improve material
compliance.
We discover no statistically significant relationship between information reporting
upon indication of tax crime and material compliance (=0.68), with standardised
coefficient value of 0.02. It demonstrates that increasing the information reporting
upon indication of tax crime has no effect upon the level of material compliance.
Based on this result, the null hypothesis H30 can be accepted. To provide an easier
comparison, we summarise the results for H1-H8 and present it in Table 7.
Table 7: Summary of standardised direct effects between law enforcement activities and the level of tax compliance arising from hypotheses H1-H8
No Types of law enforcement activities (N=352 tax offices)
Types of compliance
Formal Material
1 Audit coverage ratio 0.134*** 0.147***
2 Non-disputed tax assessment 0.104** -0.121**
3 Proposal for imprisonment of tax arrears -0.016 0.030
4 Information reporting upon indication of tax crime 0.083* 0.021
Note: *** = ≤ 0.01; ** = ≤ 0.05; * = ≤ 0.10

25
Robustness tests
As a robustness check, we conduct two additional analysis. First, we differentiate the
level of analysis based on the five major island groups in Indonesia: (i) Java, (ii)
Sumatra; (iii) Sulawesi; (iv) Kalimantan; and (v) Bali, Nusa Tenggara, Papua, and
Maluku. Table 8 presents the results of the analysis for these five regions. As shown
in this table, in general ACR remains has a positive effect both for formal and material
compliance in Java, where most tax offices were located (i.e., 202 tax offices). As for
areas outside Java, there is a tendency to have varying effects. For example, the
proposal for imprisonment of tax arrears seems to be more influential in the regions
of Kalimantan, Bali, Nusa Tenggara, Papua, Maluku.
Table 8: Summary of standardised direct effects between law enforcement activities and the level of tax compliance by group of five main islands
Panel A: Formal compliance
No Types of law enforcement activities
Regions (i.e., group of islands)
(1) (2) (3) (4) (5)
1 Audit coverage ratio 0,193*** 0,165 0,352** 0,173 0,076
2 Non-disputed tax assessment 0,107* 0,208** 0,111 0,166 0,091
3 Proposal for imprisonment of tax arrears 0,025 -0,147 0,176 -0,037 0,236***
4 Information reporting upon indication of tax crime 0,053 0,236** 0,02 -0,03 0,362***
Panel B: Material Compliance
No Types of law enforcement activities
Regions (i.e., group of islands)
(1) (2) (3) (4) (5)
1 Audit coverage ratio 0,251*** 0,027 -0,093 0,06 -0,201
2 Non-disputed tax assessment -0,104* 0,073 0,291** -0,071 -0,218
3 Proposal for imprisonment of tax arrears 0,061 0,046 0,113 -0,332** 0,313***

26
4 Information reporting upon indication of tax crime -0,007 0,13 0,257** 0,132 0,058
Note: (1) Java; 202 tax offices; (2) Sumatra; 71 tax offices; (3) Sulawesi; 26 tax offices; (4) Kalimantan; 27 tax offices; (5) Bali, Nusa Tenggara, Papua, Maluku; 26 tax offices
*** = ≤ 0.01; ** = ≤ 0.05; * = ≤ 0.10
Second, as indicated earlier, we employ an additional data and then split the data sets.
The first data set consists of 185 tax offices where 480 criminally investigated
taxpayers were administered, while the second data set is the rest (i.e., 167 tax offices
not having taxpayers being criminally prosecuted). Likewise, we utilise SEM approach
to examine each of these data sets. We report the statistical results in Appendix 4 for
the former, and in Appendix 5 for the latter. Then we summarise and present these
findings in Table 9 as follows.
Table 9: Comparison of standardised direct effects between law enforcement activities and the level of tax compliance between two groups of tax offices
Types of law enforcement activities
Group A: (N=185 tax offices)
Group B: (N=167 tax offices)
Types of compliance
Types of compliance
Formal Material Formal Material
1 Audit coverage ratio 0.206*** 0.189*** 0.075 0.086
2 Non-disputed tax assessment 0.128 -0.170** 0.094 -0.032
3 Proposal for imprisonment of tax arrears
-0.025 0.063 0.041 0.022
4 Information reporting upon indication of tax crime
0.061 0.021 0.066 0.007
Note: *** = ≤ 0.01; ** = ≤ 0.05; * = ≤ 0.10; Group A represents a group of tax offices having taxpayers being criminally investigated; Group B represents a group of tax offices not having taxpayers being criminally investigated
Based on these results, we reveal statistically significant positive relationships have
emerged between audit coverage ratio and both formal and normal compliance only
for the group A. Surprisingly, we find no statistically significant relationships for

27
group B. Thus, it indicates that the level of audit coverage was influential in improving
the level of both formal and material compliance only for tax offices that
administering criminally investigated taxpayers, as indicated not only by its statistical
significance but also by the value of the standardised coefficients.
DISCUSSIONS
Adopting conceptual testing approach, we empirically examine the causal
relationships between various observed variables under study as prescribed in the
DGT’s strategy map. In general, the nature of relationships between three internal
business process and level of tax compliance appears to be somewhat as expected. For
instance, within service and public relation, all four causal relationships show positive
values (100%), while for law enforcement activities six out of eight relationships are
positive (75%). The lowest portion was monitoring and supervision which only has 50%
of positive relationship.
In relation to this study, law enforcement activities in particular gives somewhat the
expected effect. This can be seen not only from the major proportion of positive
causality (i.e., 75%) but also from the fact that half of these positive relationships were
statistically significant. At national level (i.e., 352 tax offices), the results show that
audit coverage ratio (ACR) was influential in improving both types of tax
compliance.13
13 It should be noted that, in relation to ACR, Indonesian tax authority appears to focus on corporate
taxpayers rather than individual taxpayers. By way of illustration, based on the 2018 DGT

28
Nevertheless, from the robustness test, we reveal that the ACR has different effect on
two different data groups. As Graph 1 compares, only in the group of tax offices where
taxpayers are criminally investigated ACR has a stronger and statistically significant
effect. In contrast, in the other group where there was no criminal investigation, we
find no statistically significant results.
Graph 1: Comparison of standardised direct effects of ACR upon level of compliance between two groups of tax offices
Note: *** = ≤ 0.01; Group A represents a group of tax offices having taxpayers being criminally investigated; Group B represents a group of tax offices not having taxpayers being criminally investigated.
In part, these findings support the importance of traditional views of economic
deterrent models which emphasized the probability effect of audits and the
probability of detection (see for example, Allingham and Sandmo 1972; Sandmo 2005;
Cowell 1985; Beck and Jung 1989; Dubin et al. al. 1990; Kirchler et al. 2014). While it is
Performance Report, the targeted ACR for corporate taxpayers in 2016, 2017, and 2018 were 1.68%,
2.32%, and 2.32% respectively; while for the individual taxpayers were only 0.23%, 0.39%, and 0.39%.
0,206***
0,075
0,189***
0,086
0,025
0,065
0,105
0,145
0,185
0,225
Group A Group B Group A Group B
Material compliance Formal compliance
Stan
dar
dis
ed d
irec
t ef
fect

29
acknowledged that dissatisfaction with the traditional economic approach in
understanding taxpayers’ compliance behaviour motivates the development of
research related to behavioural insights into tax compliance strategies (Reeson and
Dunstall 2009; Alm 2011; OECD 2013; Ritsatos 2014), it is worth noting that non-
deterrence approaches have not supplanted, but only complemented, the critical role
of deterrence as an essential measure of ensuring tax compliance (Hofmann et al.
2008; Kirchler et al. 2008; Osofsky 2014).
In practice, the purely traditional economic deterrence model is considered
unrealistic. This is because: (i) in reality the ACR value is relatively, if not extremely,
small, (ii) the decision to undertake tax non-compliance is not influenced by
economic rationality consideration (maximizing strategies) but also by something
that is common (i.e., rules of thumb or heuristics) (Cullis and Jones 1992; Ritsatos
2014).14
Regarding this, in support of the so-called 'spill-over effect' phenomenon (see for
example, Alm 2011; Lederman 2010), the findings of this study demonstrate that
14 The magnitude of ACR in influencing tax non-compliance behavior can be described traditionally in the following illustration. Assuming the taxable income is Y and the tax rate is t, then a person who reports taxes honestly will pay all taxes owed and enjoy an income of (1-t) Y. However, if the individual decides not to comply, then it can be assumed that there will be a possibility of his action being discovered by the tax authorities of p, and the penalty to be paid is F. The expected value (EV) of this action is: E (v) = p ( Y-F) + (1-p) Y. If the value of this EV is greater than (1-t) Y, then based on this model, it is assumed that the individual will commit tax evasion. For example, if Y = IDR 12 million, p = 0.5, t = 0.33 and F = IDR 5 million, then the comparison is as follows: (1-t) Y = 0.66 x IDR 12 million = IDR 8 million, compared to: p (Y-F) + (1-p) Y = 0.5 (IDR 12 million-IDR 5 million) +0.5 (IDR 12 million) = IDR 9.5 million. If the p value in this example is changed to 0.25, the comparison value changes to Rp. 11 million. The assumption for a p-value of 0.5 or 0.25 is arguably unrealistic. That is, saying that the possibility of a taxpayer being audited by 50% or 25% in the real world is almost impossible. In fact, as described earlier, the probability of getting audited for individual taxpayers in Indonesia is less than 0.4%.

30
‘actual’ law enforcement—i.e., in the form of criminal investigation—appears to have
a real effect in determining the effectiveness of tax authorities’ capabilities in
improving tax compliance. One possible explanation for this finding is, from
taxpayers’ perspective, a cognitive bias that suggests taxpayers tend to rely more
heavily on information that is readily accessible to evaluate the frequency or
likelihood of getting audited or investigated—a phenomenon termed availability bias
(Sunstein 2002; Gemmel and Ratto 2012).15 This finding also support
CONCLUSIONS
This study seeks to measure the extent to which the effectiveness of law enforcement
activities carried out by Indonesian tax authority in increasing tax compliance. A
comprehensive analysis in this topic clearly requires, inter alia, an examination at
both the taxpayers and administrative levels. However, from institutional perspective,
we argue that tax authority’s perspective is the more relevant. This is the side of the
equation that this study seeks to answer empirically. This effort requires
measurement and assessment at the strategic level. On this ground, this study
employs DGT’s strategy map as its working perspective.
Strategy map is a visual description of the strategy, through several strategic goals
that are integrated in structural causal relationships. It can be conceptually used as
an underlying parameter to quantitatively measure the effectiveness of law
15 That is, for instance, “the impact of seeing a house burning on the subjective probability of such accidents is probably greater than the impact of reading about a fire in the local paper” (Tversky & Kahneman 1974, p. 1127).

31
enforcement in improving tax compliance. In this notion, an activity or program is
effective if it has an impact as expected. The effectiveness of law enforcement
activities is measured and empirically examined by looking at their impact on
improving compliance levels. In assessing the effectiveness of law enforcement in
improving tax compliance, this study analyses 19 KPIs data from all 352 tax offices
across Indonesia for fiscal year 2018.
Our findings can be summarized as follows. First, we find that the causal relationship
of strategic goals in the DGT strategy map is dominated by positive values (63%) and
law enforcement activities, particularly in the form of audit coverage ratio, appear to
be effective in improving both formal and material compliance. Second, in this
context, the existence of criminal investigation seems to be a defining factor. That is,
the level of audit coverage was influential in improving the level of both formal and
material compliance in group of tax offices where criminal investigation took place.
These findings are of particular importance given the relative lack of empirical data
related to the relationship between law enforcement and tax compliance. Further
research is needed to better understand this complex relationship.
Eventually, it is also worth noting these results provide evidence on the impact of law
enforcement on tax compliance at tax authority’s strategy map level, but do not
provide a direct link to the impact on taxpayers’ level, nor to the actual behaviour of
taxpayer as this requires different empirical data and strategy.

32
Relating to this, future research could scrutinize several further questions. How do
the results we document here vary across year? Do institutional characteristics shape
how taxpayers react to various types of law enforcement activities? How do taxpayers
respond in the presence of routine audits and random audits? Answering these
follow-up questions are likely to generate useful insights.
33
REFERENCES
Allingham, MG, and A. Sandmo. 1972. Income tax evasion: A theoretical analysis. Journal of Public Economics I: 323-338.
Alm, J. 1991. A perspective on the experimental analysis of taxpayer reporting. The Accounting Review 66 (3): 577.
———. 2011. Measuring, explaining, and controlling tax evasion: Lessons from theory, experiments, and field studies. International Tax and Public Finance 19 (1): 54-77.
Alm, J., and M. McKee. 2006. Audit Certainty, Audit Productivity, and Taxpayer Compliance. In Research Paper Series: Andrew Young School of Policy Studies.
Araki, S., and I. Claus. 2014. A comparative analysis of tax administration in Asia and the Pacific.Mandaluyong City, Philippines: Asian Development Bank.
Arnold, J. 2012. Improving the Tax System in Indonesia. OECD Economics Department Working Papers, No 998.
Basri, MC, M. Felix, R. Hanna, and BA Olken. 2019. Tax Administration vs. Tax Rates: Evidence from Corporate Taxation In Indonesia. NBER Working Paper No. 26150.
Baurer, LI 2005. Tax Administration and Small and Medium Enterprises (SMEs) in Developing Countries <http://rru.worldbank.org/Documents/Toolkits/ SME_Taxation_Toolkit.pdf>.
Beck, PJ, and W.-O. Jung. 1989. Taxpayer compliance under uncertainty. Journal of Accounting and Public Policy 8 (1): 1-27.
Bird, RM 2003. Managing the reform process. ———. 2004. Administrative Dimension of Tax Reform. Asia-Pacific Tax Bulletin
10 (3): 134-150. ———. 2008. Tax Challenges Facing Developing Countries. Institute for
International Business Working Paper No. 9. Available at SSRN: http://dx.doi.org/10.2139/ssrn.1114084.
———. 2013. Taxation and development: What have we learned from fifty years of research? Public Finance and Management 13 (4): 266-288.
———. 2015. Improving tax administration in developing countries. Journal of Tax Administration 1 (1): 23-45.
Blunch, N. 2013. Second edition - Introduction to structural equation modeling using SPSS Statistics and AMOS. London: Sage Publication Ltd.
BPS. 2013. Trends of selected socio-economic indicators of Indonesia: August 2013. Accessed 4 March 2014 <http://www.bps.go.id/eng/download_file/booklet_leaflet/Boklet_Agustus_2013.pdf>.
Brink, WD, and TM Porcano. 2016. The Impact of Culture and Economic Structure on Tax Morale and Tax Evasion: A Country-Level Analysis Using SEM. Advances in Taxation 23: 87-123.
Congdon, WJ, JR Kling, and S. Mullainathan. 2009. Behavioral Economics and Tax Policy. National Tax Journal LXIl (3): 375-386.
Cooper, GS 1994. Analyzing corporate tax evasion. Tax Law Review 50: 33-152.

34
Cowell, FA 1985. The economic analysis of tax evasion. Bulletin of Economic Research 37 (3): 163-193.
Crandall, W. 2010. Revenue Administration: Performance Measurement in Tax Administration: International Monetary Fund.
Cullis, J., and P. Jones. 1992. Public Finance and Public Choice. London: McGraw-Hill Book Company.
Cummings, RG, J. Martinez-Vazquez, M. McKee, and B. Torgler. 2009. Tax morale affects tax compliance: Evidence from surveys and an artefactual field experiment. Journal of Economic Behavior & Organization 70 (3): 447-457.
Devos, K. 2014. Factors influencing individual taxpayer compliance behavior: Springer.
DGT. 2019. Performance Report of the Directorate General of Taxes 2018. Dubin, JA, MJ Graetz, and LL Wilde. 1990. The effect of audit rates on the federal
individual income tax, 1977-1986. National Tax Journal 43 (4): 395-409. Erard, B. 1997. Self-selection with measurement errors A microeconometric
analysis of the decision to seek tax assistance and its implications for tax compliance. Journal of Econometrics 81 (2): 319-356.
Francis, S. 2012. Fiscal policy evolution and distributional implications: The Indonesian experience. The Ideas Working Paper Series 01/2012: 1-42, accessed 31 August 2013, <http://www.networkideas.org/working/may2012/2001_2012.pdf>
Franzoni, LA 1998. Tax evasion and tax compliance. In Encyclopedia of law and economics (Vol. IV) edited by B. Bouckaert and GD Geest. Cheltenham: Edward Elgar, p. 51-94.
Frey, BS, and B. Torgler. 2007. Tax morale and conditional cooperation. Journal of Comparative Economics 35 (1): 136-159.
Gefen, D., DW Straub, and M. Boudreau. 2000. Structural equation modeling and regression: Guidelines for research practice. Communications of the association for information systems 4 (1): 7.
Gemmell, N. and M. Ratto. (2012). Behavioral Responses to Taxpayer Audits: Evidence from Random Taxpayer Inquiries. National Tax Journal. Vol. 65 (1), 33-58
Gill, JBS 2000. A diagnostic framework for revenue administration. World Bank Technical Paper No 472.
———. 2003. The Nuts and Bolts of Revenue Administration Reform. <http://www1.worldbank.org/publicsector/pe/tax/NutsBolts.pdf> ,.
Hair, JF, WC Black, BJ Babin, and RE Anderson. 2010. Multivariate data analysis (7th ed.). New Jersey: Pearson Prentice Hall.
Halla, M. 2012. Tax morale and compliance behavior: First evidence on a causal link. The BE Journal of Economic Analysis & Policy 12 (1): 1935-1682.
Hofmann, E., E. Hoelzl, and E. Kirchler. 2008. Preconditions of Voluntary Tax Compliance: Knowledge and Evaluation of Taxation, Norms, Fairness, and Motivation to Cooperate. Z Psychol 216 (4): 209-217.
Ikhsan, M., L. Trialdi, and S. Syahrial. 2005. Indonesia's new tax reform: Potential and direction. Journal of Asian Economics 16 (6): 1029-1046.

35
IMF. 2011. Revenue mobilization in developing countries. International Monetary Fund. Date accessed 10 June 2014 <http://www.imf.org/external/np/pp/eng/2011/030811.pdf>.
———. 2015. Understanding Revenue Administration - An Initial Data Analysis Using the Revenue Administration Fiscal Information Tool. In Fiscal Affairs Department.
IRS. 2009. Update on Reducing the Federal Tax Gap and Improving Voluntary Compliance.Accessed 26 September 2013, <http://www.irs.gov/pub/newsroom/tax_gap_report_-final_version.pdf>.
Jackson, BR, and VC Milliron. 1986. Tax compliance research: Findings, problems and prospects. Journal of Accounting Literature 5: 125-165.
James, S., and C. Alley. 2004. Tax compliance, self assessment, and tax administration. Journal of Finance and Management in Public Services. 2: 27-42.
Kirchler, E. 2007. The Economic Psychology of Tax Behavior. Cambridge: Cambridge University Press.
Kirchler, E., E. Hoelzl, and I. Wahl. 2008. Enforced versus voluntary tax compliance: The “slippery slope” framework. Journal of Economic Psychology 29 (2): 210-225.
Kirchler, E., C. Kogler, and S. Muehlbacher. 2014. Cooperative Tax Compliance: From Deterrence to Deference. Current Directions in Psychological Science 23 (2): 87-92.
Kirchler, E., S. Muehlbacher, B. Kastlunger, and I. Wahl. 2010. Why pay taxes: A review on tax compliance decisions. In Developing alternative frameworks for explaining tax compliance, edited by J. Alm, J. Martinez-Vazquez and B. Torgler. London, England: Routledge, pp. 15-32.
Kline, RB 2005. Principles and practice of structural equation modeling. 2nd ed .. ed. New York: New York: Guilford Press.
———. 2011. Principles and practice of structural equation modeling 3rd edition. New York: The Guilford Press.
Klun, M. 2004. Performance Measurement for Tax Administrations: The Case of Slovenia. International Review of Administrative Sciences 70 (3): 567–574.
Kornhauser, ME 2007. A tax morale approach to compliance: Recommendation for the IRS. Florida Tax Review 8: 601-640.
Langham, JA, N. Paulsen, and CEJ Hartel. 2012. Improving tax compliance strategies: Can the theory of planned behavior predict business compliance? eJournal of Tax Research 10 (2): 364-402.
Lederman, L. 2003. The interplay between norms and enforcement in tax compliance. Ohio State Law Journal 64: 1453-1514.
———. 2010. Reducing information gaps to reduce the tax gap: When is information reporting warranted? Fordham Law Review 78: 1733-1758.
Lewis, A. 1982. The psychology of taxation. Oxford: Robertson. MacGregor, J., and B. Wilkinson. 2012. The effect of economic patriotism on tax
morale and attitudes toward tax compliance. Advances in Taxation 20: 159-180.

36
Marr, B. 2008. Managing and Delivering Performance. Burlington, MA 01803, USA: Elsevier Ltd.
McKerchar, M. 2003. The impact of complexity upon tax compliance: A study of Australian personal taxpayers. Australian Tax Research Foundation. Research Study No 39; 1-223.
———. 2010. Design and Conduct of Research in Tax, Law and Accounting. Sydney: Thomson Reuters.
McKerchar, M., K. Bloomquist, and J. Pope. 2013. Indicators of tax morale: An exploratory study. eJournal of Tax Research 11 (1): 5-22.
McKerchar, M., and C. Evans. 2009. Sustaining growth in developing economies through improved taxpayer compliance: Challenges for policy makers and revenue authorities. eJournal of Tax Research 7: 171-201.
Mikesell, JL, and L. Birskyte. 2007. The tax Compliance Puzzle: Evidence from Theory and Practice. International Journal of Public Administration 30 (10): 1045-1081.
OECD. 2001. Tax Ratios: A critical survey. In OECD Tax Policy Studies. Paris: OECD.
———. 2004. Compliance risk management: Managing and improving tax compliance. Center for Tax Policy and Administration: Accessed 12 September 2013 <http://www.oecd.org/tax/administration/33818656.pdf>.
———. 2008. Taxpayers' Compliance Monitoring: A Practical Guide Based on Revenue Body Experience.
———. 2010. Understanding and influencing taxpayers' compliance behavior. France, Paris: OECD Forum on Tax Administration.
———. 2013. Co-operative Compliance: A Framework: From Enhanced Relationship to Co-operative Compliance: OECD Publishing.
———. 2014. Measures of tax compliance outcomes: A practical guide: OECD Publishing, http://dx.doi.org/10.1787/9789264223233-en.
———. 2015. OECD Economic survey: Indonesia 2015: OECD Publishing, Paris. http://dx.doi.org/10.1787/eco_surveys-idn-2015-en.
———. 2017. Comparative Information on OECD and Other Advanced and Emerging Economies 2017. Paris OECD Publishing, http://dx.doi.org/10.1787/tax_admin-2017-en.
———. 2018. OECD Economic Surveys: Indonesia 2018. OECD Publishing, Paris. https://doi.org/10.1787/eco_surveys-idn-2018-en.
Osofsky, L. 2014. Concentrated enforcement. Florida Tax Review 16 (6): 325-391. Reeson, A., and S. Dunstall. 2009. Behavioral economics and complex decision-
making: Implication for the Australian tax and transfer system. In CMIS Report No. 09/11, Commonwealth Scientific and Industrial Research Organization. Australia.
Ritsatos, T. 2014. Tax evasion and compliance; from the neo classical paradigm to behavioral economics, a review. Journal of Accounting & Organizational Change 10 (2): 244-262.
Rivkin, JW 2004. Where Do Great Strategies Come From? Boston: Harvard Business School Publishing Class Lecture. Electronic. (Faculty Lecture: HBSP Product Number 9-754-4C.

37
Rosid, A., C. Evans, and B. Tran-Nam. 2016. Do perceptions of corruption influence personal income taxpayer reporting behavior? Evidence from Indonesia. eJournal of Tax Research 14 (2): 387-425.
Sandmo, A. 2005. The Theory of Tax Evasion: A Retrospective View. National Tax Journal 58 (4): 643-663.
Serra, P. 2005. Performance Measures in Tax Administration: Chile as a Case Study. Public Administration and Development 25: 111-124.
Shah, R., and SM Goldstein. 2006. Use of structural equation modeling in operations management research: Looking back and forward. Journal of Operations Management 24 (2): 148-169.
Silvani, C., and K. Baer. 1997. Designing a Tax Administration Reform Strategy: Experiences and Guidelines. IMF Working Paper, 97/30, 1997.
Slemrod, J. 2019. Tax Compliance and Enforcement. Journal of Economic Literature 57(4): 904-954.
Steenkamp, J.-BEM, and H. Baumgartner. 2000. On the use of structural equation models for marketing modeling. International Journal of Research in Marketing 17 (2–3): 195-202.
Sunstein, CR. 2002. Probability neglect: Emotions, worst cases, and law’, The Yale Law Journal, vol. 112, pp. 61–107.
Tennant, S., and D. Tennant. 2007. The Efficiency of Tax Administration in Jamaica: An Introspective Assessment. Social and Economic Studies 56 (3): 71-100.
Tversky, A. & Kahneman, D. 1974, ‘Judgment under uncertainty: Heuristics and biases’, Science, vol. 185, pp. 1124-1131.
Umar, MA, and NF Tusubira. 2017. Challenges of Tax administration in Developing Countries - Insights from the 5th Annual Tax Administration Research Center Workshop, 2017. Journal of Tax Administration 3 (2): 108-123.
von Soest, C. 2006. Measuring the Capability to Raise Revenues Process and Output Dimension and their Application to the Zambia Revenue Authority. GIGA Working Papers, No. 35, GIGA-WP-35/2006.
Walsh, K. 2012. Understanding taxpayer behavior - new opportunities for tax administration. Economic and Social Review 43 (3): 451-475.
Weber, TO, J. Fooken, and B. Herrmann. 2014. Behavioral economics and taxation. Taxation Papers Working Paper N.41 - 2014.
Wenzel, M. & Taylor, N. 2003. Towards evidence-based tax administration’,
Australian Journal of Social Issues 38: 409−430. Yucedogru, R., and J. Hasseldine. 2016. Understanding tax morale of SMEs: A
qualitative study. eJournal of Tax Research 14 (3): 531-566.

38
APPENDIX
Appendix 1: Perspectives, Strategic Goals (SGs), and SGs’ description in the DGT 2018’s Strategy Map
No. Perspective Strategic Goals (SG)
SG description
1 Stakeholders Optimum revenue collection
Optimization of revenue mobilization for state budget targets.
2 Customer High taxpayer compliance
Improving taxpayers’ compliance in registration, filing, reporting, and payments.
3 Internal Process
Effective socialization and dissemination
Increased socialization and dissemination on taxpayers’ rights and obligations as well as tax-related information to foster compliance.
4 Internal Process
Optimum tax services
Providing services in accordance with prescribed procedures that meet the need of taxpayers
5 Internal Process
Optimum tax base expansion
Increasing the effectiveness of tax base expansion by increasing the number of registered taxpayers by increasing the compliance of new taxpayers.
6 Internal Process
Effective taxpayer monitoring and supervision
Monitoring and supervision of tax obligations to improve taxpayer compliance.
7 Internal Process
Effective tax audit Increasing the deterrent effect of tax audit activities to increase taxpayer compliance.
8 Internal Process
Effective debt recovery
Increasing the effectiveness of unpaid tax collection as well as increasing the deterrent effect of law enforcement activities on taxpayers to increase taxpayer compliance.
9 Internal Process
Effective criminal investigation
Effective investigation activities to generate a deterrent effect and increase taxpayer compliance.
10 Internal Process
Optimum data feeding
Optimization of tax data to produce accurate, complete, and consistent tax information to support tax intensification and extensification activities.
11 Learning & Growth
Competitive human resources (HR)
Ensuring tax officers to have and improve the competencies needed for organizational goals.
12 Learning & Growth
Purpose-fit organization
Facilitating the agility of organization to meet the needs and the dynamic of the Ministry of Finance’s institutional transformation.
13 Learning & Growth
Budget management quality
Ensuring the budget is managed based of a predetermined plan efficiently and effectively.
Source: DGT (2019)
39
Appendix 2: KPIs’ name, code, aims, and formula for tax office level (2018)
No. KPI’s name KPI’s code
Aims KPI’s formula
1 Realized amount of regular remittance (%)
1a-CP To monitor tax receipts from regular taxpayer payments
(realized regular tax remittance / regular tax remittance target)
x 100%
2 Realized amount of extra effort remittance (%)
1b-CP To monitor tax revenue generated from extra effort activities
(realized extra effort tax remittance / extra effort tax remittance target) x 100%
3 Filing ratio of annual income tax returns by corporate and self-employed taxpayers (%)
2a-CP To improve taxpayer (formal) compliance based on the number of received tax returns
(total number of annual tax returns submitted by corporate and self-employed taxpayers /
the number of registered corporate and self-employed
taxpayers) x 100%
4 Proportion of corporate and self-employed taxpayers made tax payments (%)
2b-CP To improve taxpayer (material) compliance based on the number of active taxpayer bases.
(60% x number of corporate and self-employed taxpayers made
payments / number of corporate and self-employed taxpayers obliged to submit annual tax returns) + (40% x number of corporate and self-employed taxpayers made prescribed
amount of payments / number of corporate and self-employed
taxpayers obliged to submit annual tax returns)
5 Effectiveness of tax socialization (%)
3a-CP To increase the awareness of taxpayers and assisting taxpayer in fulfilling their tax obligation.
(ratio of outreach activities x 100%) x 50%) + (ratio of behaviour change x 50%)
6 Proportion of tax returns lodged via e-filing (%)
4a-CP To improve the accuracy of taxpayer data and making it easier for taxpayers in submitting annual tax returns.
(realized number of e-filing submission / e-filing target) x
100%
7 Realized on-time excellent service delivery (%)
4b-N To improve the performance of prioritised services to taxpayers.
(number of prioritised services completed on-time / number of prioritised services requests) x
100%
8 Share of newly registered taxpayers
5a-CP To optimize revenue collection from
Realized number of newly registered taxpayers who made tax payment / Targeted number

40
making payments (%)
newly registered taxpayers.
of taxpayers who should make payments) x 100%
9 Share of successful tax inquiries (%)
6a-CP To increase the quality of data matching process upon tax returns to optimize revenue collection.
(Percentage of data inquiries for annual tax returns x 50%) +
(Percentage of data inquiries for monthly tax returns x 50%)
10 Approved random audit proposals (%)
6b-N To increasing the number of targeted taxpayers for random audits.
(approved proposal for random audits / target for random audits proposals) x 100%
11 Audit coverage ratio (%)
7a-CP To increase stakeholder trust and taxpayer compliance through increased coverage of tax audits.
(((Σ audited corporate taxpayers / Σ corporate
taxpayers obliged to submit annual tax returns)/x) x 50%) +
(((Σ audited self-employed taxpayers / Σ self-employed taxpayers obliged to submit
annual tax returns)/y) x 50%)16
12 Proportion of non-disputed tax assessment (%)
7b-CP To improve the quality of tax audits in revenue collection through effective audit process.
(number of agreed tax assessments, i.e., not filed for
objection by taxpayers / number of tax assessment issued) x
100%
13 Completed imprisonment proposal for unpaid tax arrears (%)
8a-N To ensure the quality and the legal aspects of imprisonment proposal for unpaid tax arrears.
(approved proposals for imprisonment / the number of
received proposals for imprisonment) x 100%
14 Realized information reporting upon indication of tax crime (%)
9a-N To increase tax offices’ role in supporting law enforcement activities carried out by the regional tax offices.
(realized indication of tax crime reported to regional tax office / target for information reporting upon indication of tax crime) x
100%
15 Data feeding for tax potential
10a-N To provide accurate and complete administrative data as well as cooperative collaboration among tax offices.
(Actual amount of data provided / amount of data
planned to be provided) x 100%
16 x= targeted ACR for corporate taxpayers; y=targeted ACR for self-employed taxpayers. Both figures are determined by Head Office of DGT.

41
16 On-time data archiving and documentation
10b-N To ensure tax returns data is well-documented for data integration and data warehouse.
(number of annual tax returns documented on time / number of annual tax returns should be
documented on time) x 100%
17 Share of employees met standard training hours
11a-N To improve the competencies and performance of employees through capacity building.
(Percentage of employees met face-to-face hourly learning
standards x 70%) + (Percentage of employees met hourly e-learning standards x 30%)
18 Realized organizational performance dialogue and action plan monitoring
12a-N To improve the effectiveness of organization in managing performance and its identified risks.
(realized scores for organizational performance
dialogue and action plan monitoring / maximum scores for organizational performance
dialogue and action plan monitoring) x 100%
19 Budget execution quality
13a-N To ensure budget management is well-implemented.
Scores based on budget absorption, level of efficiency, quality of output, and budget
consistency
Source: DGT (2019)

42
Appendix 3: Structural causal models for national level (N=352 tax offices)
Note: 1a-CP = Realized amount of regular remittance (%); 1b-CP = Realized amount of extra effort
remittance (%); 2a-CP = Filing ratio of annual income tax returns by corporate and self-employed
taxpayers (%); 2b-CP = Proportion of corporate and self-employed taxpayers made tax payments (%);
3a-CP = Effectiveness of tax socialization (%); 4a-CP = Proportion of tax returns lodged via e-filing
(%); 4b-N = Realized on-time excellent service delivery (%); 5a-CP = Share of newly registered
taxpayers making payments (%); 6a-CP = Share of successful tax inquiries (%); 6b-N = Approved
random audit proposals (%); 7a-CP = Audit coverage ratio (%); 7b-CP = Proportion of non-disputed
tax assessment (%); 8a-N = Completed imprisonment proposal for unpaid tax arrears (%); 9a-N =
Realized information reporting upon indication of tax crime (%); 10a-N = Data feeding for tax
potential; 10b-N = On-time data archiving and documentation; 11a-N = Share of employees met
standard training hours; 12a-N = Realized organizational performance dialogue and action plan
monitoring; 13a-N = Budget execution quality

43
Standardised total effects arising from structural causal models for national level
(N=352 tax offices)
Part 1 of 2 LG13a_N LG12a_N LG11a_N IP10b_N IP5a_CP IP7a_CP IP7b_CP IP8a_N IP9a_N
IP10b_N 0,109** -0,053 0,012 0,000 0,000 0,000 0,000 0,000 0,000
IP5a_CP 0,031 -0,021 0,180** 0,000 0,000 0,000 0,000 0,000 0,000
IP7a_CP 0,085 -0,048 0,032 0,000 0,000 0,000 0,000 0,000 0,000
IP7b_CP 0,022 0,022 -0,047 0,000 0,000 0,000 0,000 0,000 0,000
IP8a_N 0,012 -0,040 0,036 0,000 0,000 0,000 0,000 0,000 0,000
IP9a_N -0,042 -0,050 0,007 0,000 0,000 0,000 0,000 0,000 0,000
IP10a_N -0,035 0,064 -0,062 0,000 0,000 0,000 0,000 0,000 0,000
IP6b_N 0,115** -0,025 0,015 0,000 0,000 0,000 0,000 0,000 0,000
IP6a_CP -0,020 -0,025 0,067 0,000 0,000 0,000 0,000 0,000 0,000
IP4b_N 0,095 0,050 -0,040 0,000 0,000 0,000 0,000 0,000 0,000
IP4a_CP 0,007 -0,013 -0,009 0,000 0,000 0,000 0,000 0,000 0,000
IP3a_CP 0,082 0,017 0,041 0,000 0,000 0,000 0,000 0,000 0,000
C2b_CP 0,036** -0,014 0,041 0,087 0,166 0,147 -0,121 0,030 0,021
C2a_CP 0,044** -0,018 0,013 0,148** 0,063 0,134** 0,104** -0,016 0,083**
S1b_CP -0,005 0,002 -0,004 -0,013 -0,016 -0,017** 0,005 -0,002 -0,005
S1a_CP 0,001 0,000 -0,001 0,003 -0,002 0,001 0,007 -0,001 0,002
Note: ** = ≤ 0.05; * = ≤ 0.10; shaded area indicates positive values
Part 2 of 2 IP10a_N IP6b_N IP6a_CP IP4b_N IP4a_CP IP3a_CP C2b_CP C2a_CP
IP10b_N 0,000 0,000 0,000 0,000 0,000 0,000 0,000 0,000
IP5a_CP 0,000 0,000 0,000 0,000 0,000 0,000 0,000 0,000
IP7a_CP 0,000 0,000 0,000 0,000 0,000 0,000 0,000 0,000
IP7b_CP 0,000 0,000 0,000 0,000 0,000 0,000 0,000 0,000
IP8a_N 0,000 0,000 0,000 0,000 0,000 0,000 0,000 0,000
IP9a_N 0,000 0,000 0,000 0,000 0,000 0,000 0,000 0,000
IP10a_N 0,000 0,000 0,000 0,000 0,000 0,000 0,000 0,000
IP6b_N 0,000 0,000 0,000 0,000 0,000 0,000 0,000 0,000
IP6a_CP 0,000 0,000 0,000 0,000 0,000 0,000 0,000 0,000
IP4b_N 0,000 0,000 0,000 0,000 0,000 0,000 0,000 0,000
IP4a_CP 0,000 0,000 0,000 0,000 0,000 0,000 0,000 0,000
IP3a_CP 0,000 0,000 0,000 0,000 0,000 0,000 0,000 0,000
C2b_CP 0,037 -0,024 -0,041 0,020 0,138 0,152 0,000 0,000
C2a_CP -0,035 0,010 -0,049 0,028 0,220** 0,106 0,000 0,000
S1b_CP -0,002 0,002 0,005 -0,003 -0,020 -0,017 -0,081 -0,042
S1a_CP -0,002 0,001 -0,001 0,001 0,005 0,000 -0,024 0,036
Note: ** = ≤ 0.05; * = ≤ 0.10; shaded area indicates positive values
This table uses 6.688 observations of KPIs data from all 352 tax offices across Indonesia. The endogenous and exogenous variables under examination are as indicated in the structural model.

44
Appendix 4: Structural causal models for group A (N=185 tax offices)
Note: 1a-CP = Realized amount of regular remittance (%); 1b-CP = Realized amount of extra effort
remittance (%); 2a-CP = Filing ratio of annual income tax returns by corporate and self-employed
taxpayers (%); 2b-CP = Proportion of corporate and self-employed taxpayers made tax payments (%);
3a-CP = Effectiveness of tax socialization (%); 4a-CP = Proportion of tax returns lodged via e-filing
(%); 4b-N = Realized on-time excellent service delivery (%); 5a-CP = Share of newly registered
taxpayers making payments (%); 6a-CP = Share of successful tax inquiries (%); 6b-N = Approved
random audit proposals (%); 7a-CP = Audit coverage ratio (%); 7b-CP = Proportion of non-disputed
tax assessment (%); 8a-N = Completed imprisonment proposal for unpaid tax arrears (%); 9a-N =
Realized information reporting upon indication of tax crime (%); 10a-N = Data feeding for tax
potential; 10b-N = On-time data archiving and documentation; 11a-N = Share of employees met
standard training hours; 12a-N = Realized organizational performance dialogue and action plan
monitoring; 13a-N = Budget execution quality

45
Standardised total effects arising from structural causal models for group A
(N=185 tax offices)
Part 1 of 2
LG13a_N LG12a_N LG11a_N IP10b_N IP5a_CP IP7a_CP IP7b_CP IP8a_N IP9a_N
IP10b_N -0,154** -0,047 -0,058 0,000 0,000 0,000 0,000 0,000 0,000
IP5a_CP 0,035 -0,022 0,151** 0,000 0,000 0,000 0,000 0,000 0,000
IP7a_CP 0,024 -0,024 0,048 0,000 0,000 0,000 0,000 0,000 0,000
IP7b_CP 0,007 0,033 -0,095 0,000 0,000 0,000 0,000 0,000 0,000
IP8a_N 0,071 -0,015 0,072 0,000 0,000 0,000 0,000 0,000 0,000
IP9a_N -0,033 -0,083 0,024 0,000 0,000 0,000 0,000 0,000 0,000
IP10a_N 0,067 0,103 -0,010 0,000 0,000 0,000 0,000 0,000 0,000
IP6b_N 0,192** -0,044 0,014 0,000 0,000 0,000 0,000 0,000 0,000
IP6a_CP -0,095 -0,055 0,108 0,000 0,000 0,000 0,000 0,000 0,000
IP4b_N 0,178** 0,069 0,043 0,000 0,000 0,000 0,000 0,000 0,000
IP4a_CP 0,098 -0,091 -0,057 0,000 0,000 0,000 0,000 0,000 0,000
IP3a_CP 0,155** 0,025 0,069 0,000 0,000 0,000 0,000 0,000 0,000
C2b_CP 0,047 -0,004 0,039 0,021 0,092 0,189** -0,170** 0,063 0,021
C2a_CP 0,040 -0,028 -0,014 0,094 0,054 0,206** 0,128 -0,025 0,061
S1b_CP -0,009 0,003 -0,004 -0,010 -0,016 -0,039 0,011 -0,006 -0,007
S1a_CP -0,003 -0,001 -0,005 0,003 -0,007 -0,009 0,026 -0,008 0,001
Note: ** = ≤ 0.05; * = ≤ 0.10; shaded area indicates positive values
Part 2 of 2
IP10a_N IP6b_N IP6a_CP IP4b_N IP4a_CP IP3a_CP C2b_CP C2a_CP
IP10b_N 0,000 0,000 0,000 0,000 0,000 0,000 0,000 0,000
IP5a_CP 0,000 0,000 0,000 0,000 0,000 0,000 0,000 0,000
IP7a_CP 0,000 0,000 0,000 0,000 0,000 0,000 0,000 0,000
IP7b_CP 0,000 0,000 0,000 0,000 0,000 0,000 0,000 0,000
IP8a_N 0,000 0,000 0,000 0,000 0,000 0,000 0,000 0,000 IP9a_N 0,000 0,000 0,000 0,000 0,000 0,000 0,000 0,000
IP10a_N 0,000 0,000 0,000 0,000 0,000 0,000 0,000 0,000
IP6b_N 0,000 0,000 0,000 0,000 0,000 0,000 0,000 0,000 IP6a_CP 0,000 0,000 0,000 0,000 0,000 0,000 0,000 0,000
IP4b_N 0,000 0,000 0,000 0,000 0,000 0,000 0,000 0,000
IP4a_CP 0,000 0,000 0,000 0,000 0,000 0,000 0,000 0,000
IP3a_CP 0,000 0,000 0,000 0,000 0,000 0,000 0,000 0,000
C2b_CP 0,117 -0,059 -0,084 -0,045 0,106 0,215** 0,000 0,000
C2a_CP 0,026 0,019 -0,087 -0,087 0,245** 0,182** 0,000 0,000
S1b_CP -0,017 0,006 0,017 0,012 -0,032 -0,041 -0,124 -0,076
S1a_CP -0,012 0,008 0,005 0,000 0,002 -0,014 -0,111 0,055
Note: ** = ≤ 0.05; * = ≤ 0.10; shaded area indicates positive values
This table uses 3.515 observations of KPIs data from 185 tax offices having taxpayers being criminally investigated. The endogenous and exogenous variables under examination are as indicated in the structural model.

46
Appendix 5: Structural causal models for group B (N=167 tax offices)
Note: 1a-CP = Realized amount of regular remittance (%); 1b-CP = Realized amount of extra effort
remittance (%); 2a-CP = Filing ratio of annual income tax returns by corporate and self-employed
taxpayers (%); 2b-CP = Proportion of corporate and self-employed taxpayers made tax payments (%);
3a-CP = Effectiveness of tax socialization (%); 4a-CP = Proportion of tax returns lodged via e-filing
(%); 4b-N = Realized on-time excellent service delivery (%); 5a-CP = Share of newly registered
taxpayers making payments (%); 6a-CP = Share of successful tax inquiries (%); 6b-N = Approved
random audit proposals (%); 7a-CP = Audit coverage ratio (%); 7b-CP = Proportion of non-disputed
tax assessment (%); 8a-N = Completed imprisonment proposal for unpaid tax arrears (%); 9a-N =
Realized information reporting upon indication of tax crime (%); 10a-N = Data feeding for tax
potential; 10b-N = On-time data archiving and documentation; 11a-N = Share of employees met
standard training hours; 12a-N = Realized organizational performance dialogue and action plan
monitoring; 13a-N = Budget execution quality

47
Standardised total effects arising from structural causal models for group B
(N=167 tax offices)
Part 1 of 2
LG13a_N LG12a_N LG11a_N IP10b_N IP5a_CP IP7a_CP IP7b_CP IP8a_N IP9a_N
IP10b_N 0,316** -0,021 0,051 0,000 0,000 0,000 0,000 0,000 0,000
IP5a_CP 0,005 -0,039 0,220** 0,000 0,000 0,000 0,000 0,000 0,000
IP7a_CP 0,139 -0,085 0,021 0,000 0,000 0,000 0,000 0,000 0,000
IP7b_CP 0,013 -0,016 0,021 0,000 0,000 0,000 0,000 0,000 0,000
IP8a_N -0,047 -0,099 -0,021 0,000 0,000 0,000 0,000 0,000 0,000
IP9a_N 0,017 0,098 -0,062 0,000 0,000 0,000 0,000 0,000 0,000
IP10a_N -0,130 -0,007 -0,105 0,000 0,000 0,000 0,000 0,000 0,000
IP6b_N 0,052 0,026 -0,005 0,000 0,000 0,000 0,000 0,000 0,000
IP6a_CP 0,098 0,073 0,005 0,000 0,000 0,000 0,000 0,000 0,000
IP4b_N 0,107 0,089 -0,075 0,000 0,000 0,000 0,000 0,000 0,000
IP4a_CP -0,040 0,091 0,013 0,000 0,000 0,000 0,000 0,000 0,000
IP3a_CP -0,006 -0,008 -0,040 0,000 0,000 0,000 0,000 0,000 0,000
C2b_CP 0,063 -0,001 0,081 0,150** 0,302** 0,086 -0,032 0,022 0,007
C2a_CP 0,080 0,013 0,045 0,197** 0,112 0,075 0,094 0,041 0,066
S1b_CP -0,002 0,000 -0,003 -0,006 -0,011 -0,003 0,001 -0,001 0,000
S1a_CP 0,003 0,000 0,004 0,007 0,013 0,004 -0,001 0,001 0,000
Note: ** = ≤ 0.05; * = ≤ 0.10; shaded area indicates positive values
Part 2 of 2
IP10a_N IP6b_N IP6a_CP IP4b_N IP4a_CP IP3a_CP C2b_CP C2a_CP
IP10b_N 0,000 0,000 0,000 0,000 0,000 0,000 0,000 0,000
IP5a_CP 0,000 0,000 0,000 0,000 0,000 0,000 0,000 0,000 IP7a_CP 0,000 0,000 0,000 0,000 0,000 0,000 0,000 0,000
IP7b_CP 0,000 0,000 0,000 0,000 0,000 0,000 0,000 0,000
IP8a_N 0,000 0,000 0,000 0,000 0,000 0,000 0,000 0,000
IP9a_N 0,000 0,000 0,000 0,000 0,000 0,000 0,000 0,000
IP10a_N 0,000 0,000 0,000 0,000 0,000 0,000 0,000 0,000
IP6b_N 0,000 0,000 0,000 0,000 0,000 0,000 0,000 0,000
IP6a_CP 0,000 0,000 0,000 0,000 0,000 0,000 0,000 0,000
IP4b_N 0,000 0,000 0,000 0,000 0,000 0,000 0,000 0,000
IP4a_CP 0,000 0,000 0,000 0,000 0,000 0,000 0,000 0,000
IP3a_CP 0,000 0,000 0,000 0,000 0,000 0,000 0,000 0,000
C2b_CP -0,051 0,025 0,003 0,029 0,197** -0,029 0,000 0,000
C2a_CP -0,102 -0,029 -0,029 0,067 0,242** -0,082 0,000 0,000
S1b_CP 0,002 -0,001 0,000 -0,001 -0,008 0,001 -0,037 -0,002 S1a_CP -0,003 0,001 0,000 0,001 0,009 -0,001 0,043 0,003
Note: ** = ≤ 0.05; * = ≤ 0.10; shaded area indicates positive values
This table uses 3.173 observations of KPIs data from 167 tax offices not having taxpayers being
criminally investigated. The endogenous and exogenous variables under examination are as indicated
in the structural model.

48
Appendix 6: Structural causal models for Java islands (N=202 tax offices)
Note: 1a-CP = Realized amount of regular remittance (%); 1b-CP = Realized amount of extra effort
remittance (%); 2a-CP = Filing ratio of annual income tax returns by corporate and self-employed
taxpayers (%); 2b-CP = Proportion of corporate and self-employed taxpayers made tax payments (%);
3a-CP = Effectiveness of tax socialization (%); 4a-CP = Proportion of tax returns lodged via e-filing
(%); 4b-N = Realized on-time excellent service delivery (%); 5a-CP = Share of newly registered
taxpayers making payments (%); 6a-CP = Share of successful tax inquiries (%); 6b-N = Approved
random audit proposals (%); 7a-CP = Audit coverage ratio (%); 7b-CP = Proportion of non-disputed
tax assessment (%); 8a-N = Completed imprisonment proposal for unpaid tax arrears (%); 9a-N =
Realized information reporting upon indication of tax crime (%); 10a-N = Data feeding for tax
potential; 10b-N = On-time data archiving and documentation; 11a-N = Share of employees met
standard training hours; 12a-N = Realized organizational performance dialogue and action plan
monitoring; 13a-N = Budget execution quality

49
Standardised total effects arising from structural causal models for Java islands
(N=202 tax offices)
Part 1 of 2 LG13a_N LG12a_N LG11a_N IP10b_N IP5a_CP IP7a_CP IP7b_CP IP8a_N IP9a_N
IP10b_N 0,147** -0,048 -0,018 0,000 0,000 0,000 0,000 0,000 0,000
IP5a_CP 0,080 -0,047 0,156** 0,000 0,000 0,000 0,000 0,000 0,000
IP7a_CP 0,176** -0,059 0,063 0,000 0,000 0,000 0,000 0,000 0,000
IP7b_CP 0,029 -0,018 -0,019 0,000 0,000 0,000 0,000 0,000 0,000
IP8a_N 0,013 -0,030 0,091 0,000 0,000 0,000 0,000 0,000 0,000
IP9a_N -0,080 -0,037 0,006 0,000 0,000 0,000 0,000 0,000 0,000
IP10a_N -0,076 0,076 -0,119 0,000 0,000 0,000 0,000 0,000 0,000
IP6b_N 0,223** -0,076 -0,032 0,000 0,000 0,000 0,000 0,000 0,000
IP6a_CP -0,069 -0,032 0,058 0,000 0,000 0,000 0,000 0,000 0,000
IP4b_N 0,063 -0,008 -0,035 0,000 0,000 0,000 0,000 0,000 0,000
IP4a_CP -0,017 -0,042 -0,043 0,000 0,000 0,000 0,000 0,000 0,000
IP3a_CP 0,108 0,022 0,050 0,000 0,000 0,000 0,000 0,000 0,000
C2b_CP 0,076 -0,014 0,030 0,095 0,077 0,251** -0,104* 0,061 -0,007
C2a_CP 0,076 -0,030 0,012 0,132** 0,020 0,193** 0,107* 0,025 0,053
S1b_CP -0,020 0,006 -0,005 -0,031 -0,011 -0,056 -0,007 -0,010 -0,008
S1a_CP -0,003 -0,001 -0,004 0,001 -0,011 -0,019 0,032 -0,007 0,008
Note: ** = ≤ 0.05; * = ≤ 0.10; shaded area indicates positive values
Part 2 of 2 IP10a_N IP6b_N IP6a_CP IP4b_N IP4a_CP IP3a_CP C2b_CP C2a_CP
IP10b_N 0,000 0,000 0,000 0,000 0,000 0,000 0,000 0,000
IP5a_CP 0,000 0,000 0,000 0,000 0,000 0,000 0,000 0,000
IP7a_CP 0,000 0,000 0,000 0,000 0,000 0,000 0,000 0,000
IP7b_CP 0,000 0,000 0,000 0,000 0,000 0,000 0,000 0,000
IP8a_N 0,000 0,000 0,000 0,000 0,000 0,000 0,000 0,000
IP9a_N 0,000 0,000 0,000 0,000 0,000 0,000 0,000 0,000
IP10a_N 0,000 0,000 0,000 0,000 0,000 0,000 0,000 0,000
IP6b_N 0,000 0,000 0,000 0,000 0,000 0,000 0,000 0,000
IP6a_CP 0,000 0,000 0,000 0,000 0,000 0,000 0,000 0,000
IP4b_N 0,000 0,000 0,000 0,000 0,000 0,000 0,000 0,000
IP4a_CP 0,000 0,000 0,000 0,000 0,000 0,000 0,000 0,000
IP3a_CP 0,000 0,000 0,000 0,000 0,000 0,000 0,000 0,000
C2b_CP 0,059 -0,062 -0,055 0,019 0,199** 0,276** 0,000 0,000
C2a_CP -0,028 -0,017 -0,028 0,063 0,270** 0,208** 0,000 0,000
S1b_CP -0,001 0,009 0,010 -0,012 -0,064 -0,061 -0,101 -0,161**
S1a_CP -0,014 0,009 0,006 0,005 0,000 -0,021 -0,175** 0,130
Note: ** = ≤ 0.05; * = ≤ 0.10; shaded area indicates positive values
This table uses 3.838 observations of KPIs data from 202 tax offices in Java region. The endogenous
and exogenous variables under examination are as indicated in the structural model.

50
Appendix 7: Structural causal models for Sumatra islands (N=71 tax offices)
Note: 1a-CP = Realized amount of regular remittance (%); 1b-CP = Realized amount of extra effort
remittance (%); 2a-CP = Filing ratio of annual income tax returns by corporate and self-employed
taxpayers (%); 2b-CP = Proportion of corporate and self-employed taxpayers made tax payments (%);
3a-CP = Effectiveness of tax socialization (%); 4a-CP = Proportion of tax returns lodged via e-filing
(%); 4b-N = Realized on-time excellent service delivery (%); 5a-CP = Share of newly registered
taxpayers making payments (%); 6a-CP = Share of successful tax inquiries (%); 6b-N = Approved
random audit proposals (%); 7a-CP = Audit coverage ratio (%); 7b-CP = Proportion of non-disputed
tax assessment (%); 8a-N = Completed imprisonment proposal for unpaid tax arrears (%); 9a-N =
Realized information reporting upon indication of tax crime (%); 10a-N = Data feeding for tax
potential; 10b-N = On-time data archiving and documentation; 11a-N = Share of employees met
standard training hours; 12a-N = Realized organizational performance dialogue and action plan
monitoring; 13a-N = Budget execution quality

51
Standardised total effects arising from structural causal models for Sumatra islands
(N=71 tax offices)
Part 1 of 2 LG13a_N LG12a_N LG11a_N IP10b_N IP5a_CP IP7a_CP IP7b_CP IP8a_N IP9a_N
IP10b_N -0,073 -0,018 -0,236** 0,000 0,000 0,000 0,000 0,000 0,000
IP5a_CP -0,133 0,029 0,207 0,000 0,000 0,000 0,000 0,000 0,000
IP7a_CP -0,011 -0,079 -0,191 0,000 0,000 0,000 0,000 0,000 0,000
IP7b_CP -0,031 -0,050 -0,140 0,000 0,000 0,000 0,000 0,000 0,000
IP8a_N -0,035 -0,187 -0,195 0,000 0,000 0,000 0,000 0,000 0,000
IP9a_N 0,028 -0,194 0,078 0,000 0,000 0,000 0,000 0,000 0,000
IP10a_N 0,136 0,098 0,245** 0,000 0,000 0,000 0,000 0,000 0,000
IP6b_N 0,135 0,099 -0,015 0,000 0,000 0,000 0,000 0,000 0,000
IP6a_CP 0,093 -0,145 -0,017 0,000 0,000 0,000 0,000 0,000 0,000
IP4b_N -0,101 -0,106 -0,192 0,000 0,000 0,000 0,000 0,000 0,000
IP4a_CP 0,123 0,022 0,061 0,000 0,000 0,000 0,000 0,000 0,000
IP3a_CP -0,090 -0,102 -0,107 0,000 0,000 0,000 0,000 0,000 0,000
C2b_CP -0,112 -0,029 0,041 0,151 0,530 0,027 0,073 0,046 0,130
C2a_CP -0,057 -0,038 -0,001 0,050 0,108 0,165 0,208** -0,147 0,236**
S1b_CP 0,016 0,007 -0,003 -0,019 -0,058 -0,022 -0,031 0,013 -0,039
S1a_CP -0,019 -0,005 0,006 0,024 0,083 0,009 0,017 0,002 0,027
Note: ** = ≤ 0.05; * = ≤ 0.10; shaded area indicates positive values
Part 2 of 2
IP10a_N IP6b_N IP6a_CP IP4b_N IP4a_CP IP3a_CP C2b_CP C2a_CP
IP10b_N 0,000 0,000 0,000 0,000 0,000 0,000 0,000 0,000
IP5a_CP 0,000 0,000 0,000 0,000 0,000 0,000 0,000 0,000
IP7a_CP 0,000 0,000 0,000 0,000 0,000 0,000 0,000 0,000
IP7b_CP 0,000 0,000 0,000 0,000 0,000 0,000 0,000 0,000
IP8a_N 0,000 0,000 0,000 0,000 0,000 0,000 0,000 0,000
IP9a_N 0,000 0,000 0,000 0,000 0,000 0,000 0,000 0,000
IP10a_N 0,000 0,000 0,000 0,000 0,000 0,000 0,000 0,000
IP6b_N 0,000 0,000 0,000 0,000 0,000 0,000 0,000 0,000
IP6a_CP 0,000 0,000 0,000 0,000 0,000 0,000 0,000 0,000
IP4b_N 0,000 0,000 0,000 0,000 0,000 0,000 0,000 0,000
IP4a_CP 0,000 0,000 0,000 0,000 0,000 0,000 0,000 0,000
IP3a_CP 0,000 0,000 0,000 0,000 0,000 0,000 0,000 0,000
C2b_CP -0,065 -0,037 -0,086 -0,007 -0,043 0,040 0,000 0,000
C2a_CP -0,048 -0,234** -0,164 -0,006 0,057 -0,034 0,000 0,000
S1b_CP 0,011 0,031 0,027 0,001 -0,003 0,001 -0,085 -0,118
S1a_CP -0,011 -0,013 -0,018 -0,001 -0,005 0,005 0,151 0,030
Note: ** = ≤ 0.05; * = ≤ 0.10; shaded area indicates positive values
This table uses 1.349 observations of KPIs data from 71 tax offices in Sumatra region. The endogenous and exogenous variables under examination are as indicated in the structural model.

52
Appendix 8: Structural causal models for Sulawesi islands (N=26 tax offices)
Note: 1a-CP = Realized amount of regular remittance (%); 1b-CP = Realized amount of extra effort
remittance (%); 2a-CP = Filing ratio of annual income tax returns by corporate and self-employed
taxpayers (%); 2b-CP = Proportion of corporate and self-employed taxpayers made tax payments (%);
3a-CP = Effectiveness of tax socialization (%); 4a-CP = Proportion of tax returns lodged via e-filing
(%); 4b-N = Realized on-time excellent service delivery (%); 5a-CP = Share of newly registered
taxpayers making payments (%); 6a-CP = Share of successful tax inquiries (%); 6b-N = Approved
random audit proposals (%); 7a-CP = Audit coverage ratio (%); 7b-CP = Proportion of non-disputed
tax assessment (%); 8a-N = Completed imprisonment proposal for unpaid tax arrears (%); 9a-N =
Realized information reporting upon indication of tax crime (%); 10a-N = Data feeding for tax
potential; 10b-N = On-time data archiving and documentation; 11a-N = Share of employees met
standard training hours; 12a-N = Realized organizational performance dialogue and action plan
monitoring; 13a-N = Budget execution quality

53
Standardised total effects arising from structural causal models for Sulawesi island
(N=26 tax offices)
Part 1 of 2 LG13a_N LG12a_N LG11a_N IP10b_N IP5a_CP IP7a_CP IP7b_CP IP8a_N IP9a_N
IP10b_N -0,212 -0,123 0,146 0,000 0,000 0,000 0,000 0,000 0,000
IP5a_CP 0,385 -0,005 -0,056 0,000 0,000 0,000 0,000 0,000 0,000
IP7a_CP 0,347 0,140 -0,214 0,000 0,000 0,000 0,000 0,000 0,000
IP7b_CP -0,094 -0,386 0,166 0,000 0,000 0,000 0,000 0,000 0,000
IP8a_N -0,007 -0,672* 0,229 0,000 0,000 0,000 0,000 0,000 0,000
IP9a_N 0,058 0,524** -0,180 0,000 0,000 0,000 0,000 0,000 0,000
IP10a_N 0,235 0,018 0,058 0,000 0,000 0,000 0,000 0,000 0,000
IP6b_N -0,212 0,221 0,188 0,000 0,000 0,000 0,000 0,000 0,000
IP6a_CP -0,098 -0,011 0,136 0,000 0,000 0,000 0,000 0,000 0,000
IP4b_N 0,624* 0,063 -0,047 0,000 0,000 0,000 0,000 0,000 0,000
IP4a_CP -0,046 0,314 -0,079 0,000 0,000 0,000 0,000 0,000 0,000
IP3a_CP 0,123 -0,186 0,045 0,000 0,000 0,000 0,000 0,000 0,000
C2b_CP 0,282 -0,028 -0,058 -0,068 0,645** -0,093 0,291** 0,113 0,257**
C2a_CP 0,057 0,070 0,036 -0,127 0,234 0,352** 0,111 0,176 0,020
S1b_CP 0,065 0,004 -0,006 -0,032 0,164 0,033 0,075 0,048 0,054
S1a_CP -0,060 0,000 0,008 0,024 -0,147 -0,012 -0,067 -0,037 -0,052
Note: ** = ≤ 0.05; * = ≤ 0.10; shaded area indicates positive values
Part 2 of 2 IP10a_N IP6b_N IP6a_CP IP4b_N IP4a_CP IP3a_CP C2b_CP C2a_CP
IP10b_N 0,000 0,000 0,000 0,000 0,000 0,000 0,000 0,000
IP5a_CP 0,000 0,000 0,000 0,000 0,000 0,000 0,000 0,000
IP7a_CP 0,000 0,000 0,000 0,000 0,000 0,000 0,000 0,000
IP7b_CP 0,000 0,000 0,000 0,000 0,000 0,000 0,000 0,000
IP8a_N 0,000 0,000 0,000 0,000 0,000 0,000 0,000 0,000
IP9a_N 0,000 0,000 0,000 0,000 0,000 0,000 0,000 0,000
IP10a_N 0,000 0,000 0,000 0,000 0,000 0,000 0,000 0,000
IP6b_N 0,000 0,000 0,000 0,000 0,000 0,000 0,000 0,000
IP6a_CP 0,000 0,000 0,000 0,000 0,000 0,000 0,000 0,000
IP4b_N 0,000 0,000 0,000 0,000 0,000 0,000 0,000 0,000
IP4a_CP 0,000 0,000 0,000 0,000 0,000 0,000 0,000 0,000
IP3a_CP 0,000 0,000 0,000 0,000 0,000 0,000 0,000 0,000
C2b_CP -0,075 -0,207 0,049 0,105 0,167 -0,116 0,000 0,000
C2a_CP 0,019 0,495** 0,022 -0,074 0,074 -0,153 0,000 0,000
S1b_CP -0,012 0,031 0,013 0,010 0,044 -0,046 0,200 0,146
S1a_CP 0,013 -0,001 -0,012 -0,014 -0,039 0,036 -0,197 -0,085
Note: ** = ≤ 0.05; * = ≤ 0.10; shaded area indicates positive values
This table uses 494 observations of KPIs data from 26 tax offices in Sulawesi region. The endogenous and exogenous variables under examination are as indicated in the structural model.

54
Appendix 9: Structural causal models for Kalimantan islands (N=27 tax offices)
Note: 1a-CP = Realized amount of regular remittance (%); 1b-CP = Realized amount of extra effort
remittance (%); 2a-CP = Filing ratio of annual income tax returns by corporate and self-employed
taxpayers (%); 2b-CP = Proportion of corporate and self-employed taxpayers made tax payments (%);
3a-CP = Effectiveness of tax socialization (%); 4a-CP = Proportion of tax returns lodged via e-filing
(%); 4b-N = Realized on-time excellent service delivery (%); 5a-CP = Share of newly registered
taxpayers making payments (%); 6a-CP = Share of successful tax inquiries (%); 6b-N = Approved
random audit proposals (%); 7a-CP = Audit coverage ratio (%); 7b-CP = Proportion of non-disputed
tax assessment (%); 8a-N = Completed imprisonment proposal for unpaid tax arrears (%); 9a-N =
Realized information reporting upon indication of tax crime (%); 10a-N = Data feeding for tax
potential; 10b-N = On-time data archiving and documentation; 11a-N = Share of employees met
standard training hours; 12a-N = Realized organizational performance dialogue and action plan
monitoring; 13a-N = Budget execution quality
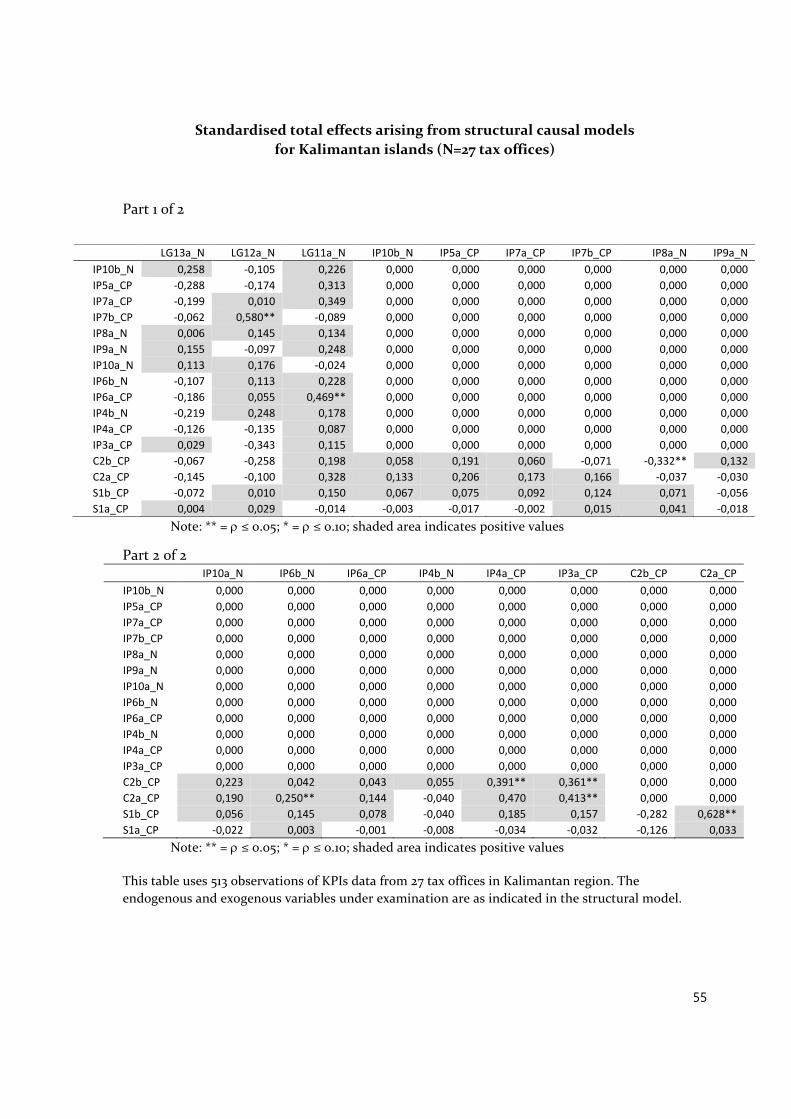
55
Standardised total effects arising from structural causal models
for Kalimantan islands (N=27 tax offices)
Part 1 of 2
Note: ** = ≤ 0.05; * = ≤ 0.10; shaded area indicates positive values
Part 2 of 2 IP10a_N IP6b_N IP6a_CP IP4b_N IP4a_CP IP3a_CP C2b_CP C2a_CP
IP10b_N 0,000 0,000 0,000 0,000 0,000 0,000 0,000 0,000
IP5a_CP 0,000 0,000 0,000 0,000 0,000 0,000 0,000 0,000
IP7a_CP 0,000 0,000 0,000 0,000 0,000 0,000 0,000 0,000
IP7b_CP 0,000 0,000 0,000 0,000 0,000 0,000 0,000 0,000
IP8a_N 0,000 0,000 0,000 0,000 0,000 0,000 0,000 0,000
IP9a_N 0,000 0,000 0,000 0,000 0,000 0,000 0,000 0,000
IP10a_N 0,000 0,000 0,000 0,000 0,000 0,000 0,000 0,000
IP6b_N 0,000 0,000 0,000 0,000 0,000 0,000 0,000 0,000
IP6a_CP 0,000 0,000 0,000 0,000 0,000 0,000 0,000 0,000
IP4b_N 0,000 0,000 0,000 0,000 0,000 0,000 0,000 0,000
IP4a_CP 0,000 0,000 0,000 0,000 0,000 0,000 0,000 0,000
IP3a_CP 0,000 0,000 0,000 0,000 0,000 0,000 0,000 0,000
C2b_CP 0,223 0,042 0,043 0,055 0,391** 0,361** 0,000 0,000
C2a_CP 0,190 0,250** 0,144 -0,040 0,470 0,413** 0,000 0,000
S1b_CP 0,056 0,145 0,078 -0,040 0,185 0,157 -0,282 0,628**
S1a_CP -0,022 0,003 -0,001 -0,008 -0,034 -0,032 -0,126 0,033
Note: ** = ≤ 0.05; * = ≤ 0.10; shaded area indicates positive values
This table uses 513 observations of KPIs data from 27 tax offices in Kalimantan region. The
endogenous and exogenous variables under examination are as indicated in the structural model.
LG13a_N LG12a_N LG11a_N IP10b_N IP5a_CP IP7a_CP IP7b_CP IP8a_N IP9a_N
IP10b_N 0,258 -0,105 0,226 0,000 0,000 0,000 0,000 0,000 0,000
IP5a_CP -0,288 -0,174 0,313 0,000 0,000 0,000 0,000 0,000 0,000
IP7a_CP -0,199 0,010 0,349 0,000 0,000 0,000 0,000 0,000 0,000
IP7b_CP -0,062 0,580** -0,089 0,000 0,000 0,000 0,000 0,000 0,000
IP8a_N 0,006 0,145 0,134 0,000 0,000 0,000 0,000 0,000 0,000
IP9a_N 0,155 -0,097 0,248 0,000 0,000 0,000 0,000 0,000 0,000
IP10a_N 0,113 0,176 -0,024 0,000 0,000 0,000 0,000 0,000 0,000
IP6b_N -0,107 0,113 0,228 0,000 0,000 0,000 0,000 0,000 0,000
IP6a_CP -0,186 0,055 0,469** 0,000 0,000 0,000 0,000 0,000 0,000
IP4b_N -0,219 0,248 0,178 0,000 0,000 0,000 0,000 0,000 0,000
IP4a_CP -0,126 -0,135 0,087 0,000 0,000 0,000 0,000 0,000 0,000
IP3a_CP 0,029 -0,343 0,115 0,000 0,000 0,000 0,000 0,000 0,000
C2b_CP -0,067 -0,258 0,198 0,058 0,191 0,060 -0,071 -0,332** 0,132
C2a_CP -0,145 -0,100 0,328 0,133 0,206 0,173 0,166 -0,037 -0,030
S1b_CP -0,072 0,010 0,150 0,067 0,075 0,092 0,124 0,071 -0,056
S1a_CP 0,004 0,029 -0,014 -0,003 -0,017 -0,002 0,015 0,041 -0,018

56
Appendix 10: Structural causal models for Bali, Nusa Tenggara, Papua, and Maluku islands (N=27 tax offices)
Note: 1a-CP = Realized amount of regular remittance (%); 1b-CP = Realized amount of extra effort
remittance (%); 2a-CP = Filing ratio of annual income tax returns by corporate and self-employed
taxpayers (%); 2b-CP = Proportion of corporate and self-employed taxpayers made tax payments (%);
3a-CP = Effectiveness of tax socialization (%); 4a-CP = Proportion of tax returns lodged via e-filing
(%); 4b-N = Realized on-time excellent service delivery (%); 5a-CP = Share of newly registered
taxpayers making payments (%); 6a-CP = Share of successful tax inquiries (%); 6b-N = Approved
random audit proposals (%); 7a-CP = Audit coverage ratio (%); 7b-CP = Proportion of non-disputed
tax assessment (%); 8a-N = Completed imprisonment proposal for unpaid tax arrears (%); 9a-N =
Realized information reporting upon indication of tax crime (%); 10a-N = Data feeding for tax
potential; 10b-N = On-time data archiving and documentation; 11a-N = Share of employees met
standard training hours; 12a-N = Realized organizational performance dialogue and action plan
monitoring; 13a-N = Budget execution quality

57
Standardised total effects arising from structural causal models
for Bali, Nusa Tenggara, Papua, and Maluku islands (N=26 tax offices)
Part 1 of 2 LG13a_N LG12a_N LG11a_N IP10b_N IP5a_CP IP7a_CP IP7b_CP IP8a_N IP9a_N
IP10b_N -0,203 -0,218 0,268 0,000 0,000 0,000 0,000 0,000 0,000
IP5a_CP -0,122 0,279 0,446** 0,000 0,000 0,000 0,000 0,000 0,000
IP7a_CP -0,196 -0,114 0,075 0,000 0,000 0,000 0,000 0,000 0,000
IP7b_CP -0,167 -0,008 -0,088 0,000 0,000 0,000 0,000 0,000 0,000
IP8a_N -0,267 0,098 0,330 0,000 0,000 0,000 0,000 0,000 0,000
IP9a_N 0,288 0,036 -0,583** 0,000 0,000 0,000 0,000 0,000 0,000
IP10a_N 0,237 0,224 -0,196 0,000 0,000 0,000 0,000 0,000 0,000
IP6b_N -0,030 0,110 0,256 0,000 0,000 0,000 0,000 0,000 0,000
IP6a_CP 0,050 0,381** -0,050 0,000 0,000 0,000 0,000 0,000 0,000
IP4b_N 0,091 0,526** 0,121 0,000 0,000 0,000 0,000 0,000 0,000
IP4a_CP 0,305 0,089 -0,085 0,000 0,000 0,000 0,000 0,000 0,000
IP3a_CP -0,023 0,158 0,130 0,000 0,000 0,000 0,000 0,000 0,000
C2b_CP 0,038 0,200 0,156 -0,316** 0,348** -0,201 -0,218 0,313** 0,058
C2a_CP 0,001 -0,017 0,090 0,306** 0,360** 0,076 0,091 0,236** 0,362**
S1b_CP 0,001 -0,004 0,030 0,096 0,119 0,023 0,028 0,079 0,117
S1a_CP 0,010 0,055 0,032 -0,114 0,056 -0,061 -0,067 0,059 -0,021
Note: ** = ≤ 0.05; * = ≤ 0.10; shaded area indicates positive values
Part 1 of 2 IP10a_N IP6b_N IP6a_CP IP4b_N IP4a_CP IP3a_CP C2b_CP C2a_CP
IP10b_N 0,000 0,000 0,000 0,000 0,000 0,000 0,000 0,000
IP5a_CP 0,000 0,000 0,000 0,000 0,000 0,000 0,000 0,000
IP7a_CP 0,000 0,000 0,000 0,000 0,000 0,000 0,000 0,000
IP7b_CP 0,000 0,000 0,000 0,000 0,000 0,000 0,000 0,000
IP8a_N 0,000 0,000 0,000 0,000 0,000 0,000 0,000 0,000
IP9a_N 0,000 0,000 0,000 0,000 0,000 0,000 0,000 0,000
IP10a_N 0,000 0,000 0,000 0,000 0,000 0,000 0,000 0,000
IP6b_N 0,000 0,000 0,000 0,000 0,000 0,000 0,000 0,000
IP6a_CP 0,000 0,000 0,000 0,000 0,000 0,000 0,000 0,000
IP4b_N 0,000 0,000 0,000 0,000 0,000 0,000 0,000 0,000
IP4a_CP 0,000 0,000 0,000 0,000 0,000 0,000 0,000 0,000
IP3a_CP 0,000 0,000 0,000 0,000 0,000 0,000 0,000 0,000
C2b_CP -0,263** 0,128 0,191 -0,032 0,194 -0,328** 0,000 0,000
C2a_CP -0,396 -0,030 0,082 -0,093 0,623** -0,152** 0,000 0,000
S1b_CP -0,130 -0,009 0,028 -0,030 0,203 -0,052 0,008 0,323
S1a_CP -0,029 0,037 0,042 0,001 -0,011 -0,071 0,264 -0,100
Note: ** = ≤ 0.05; * = ≤ 0.10; shaded area indicates positive values
This table uses 494 observations of KPIs data from 26 tax offices in Bali, Nusa Tenggara, Papua, and Maluku regions. The endogenous and exogenous variables under examination are as indicated in the structural model.