Embed Size (px)
Citation preview

TE
AM
SIL
VA
CO
M
Assessing The Ecosystem Service BENEFITS OF THE ALGAR LEAP PROJECT
DATE:May 31, 2014
DEVELOPED WITH: Team Silvacom (Silvacom Ltd. and Green Analytics)
COMPANY ADDRESS: 3912 - 91 Street, Edmonton AB, T6E 5K7
COMPANY PHONE NUMBER: 780-462-3238

TE
AM
SIL
VA
CO
M
Assessing the Ecosystem Service Benefits of the Algar LEAP Project
FORWARD
This project was supported by Alberta Innovates Bio-Solutions through the Ecosystem Services Roadmap.
Ecosystem services are the benefits that humans receive from nature. They support our health and wellbeing, from our basic needs like clean water and food to more intangible benefits like recreational opportunities and aesthetic value. Ecosystem services are integrated in nature. Taking an ecosystem services approach therefore requires a clear recognition of systems, and the connections and choices to be made around the environment,
economy and society.
Alberta Innovates – Bio Solutions (AI-Bio) brought together key stakeholders and experts to set out a strategic framework – The Ecosystem Services Roadmap –to catalyze innovation and competitiveness in the resource sectors, and create opportunities for Alberta to brand itself as a leader in land and environmental management. These experts have been developing the building blocks that facilitate the development and use of market based approaches and that can be used in integrated resource planning processes, demonstrating environmental
integrity and monitoring.
Figure 1: The key building blocks necessary for ecosystem services approaches.
The foundational pieces of the roadmap focus on building data and information, biophysical and ecological science (which focuses on the ES Assessment with ABMI) and socio-economics (market-based instrument design). These foundational pieces can be viewed as networks of experts that are coming together to develop and
integrate key concepts and approaches.
1

TE
AM
SIL
VA
CO
M
Assessing the Ecosystem Service Benefits of the Algar LEAP Project
The Algar Proof of Concept tests the initial concepts and results from the foundational building blocks:
The Ecosystem Services Assessment (ESA)
The ESA identifies the supply and condition of ecosystem services. It establishes metrics (stewardship units) to measure and register ecosystem services and establishes baselines for measuring future changes and estimating the quantity and quality of ecosystem services. While some ecosystem services have a clear, well-known economic value, it is difficult to calculate the value of most services. Learning to measure and value ecosystem services is essential in learning how to manage and make decisions with regards to Alberta’s landscape. The Alberta Biodiversity Monitoring Institute (ABMI) is well underway with the Ecosystem Services Assessment project, which is a system to map, measure and value ecosystem services. The Algar proof of concept tested the use of an ecosystem service assessment in phase 3 of the project. Components of the ES assessment and a cost benefit analysis were applied to the Algar area, and were used to determine how restoration work in the Algar area contributed to the quality of various ecological functions.
Managing Information and Building Data
A robust data and information management system based on collaboration, cooperation, transparency and data sharing among all stakeholders will be required to achieve efficiency, effectiveness and increased transparency in an ecosystem service approach. Credible environmental management requires long term supporting mechanisms such as research capacity and data procurement. The Bio-Resource Information Management System (BRIMS), led by the Silvacom Group, is an initiative that is intended to manage provincial ecosystem services information. This information management system will be designed to assess the resource potential on public and private lands in Alberta and works to “connect the dots” between the supply and demand of these bio resources.
2

TE
AM
SIL
VA
CO
M
Assessing the Ecosystem Service Benefits of the Algar LEAP Project
The underlying goal of the BRIMS project is to develop a world-class bio-resource information management system to guide policy, business and local decision-making related to the bio-economy. The system will enhance ecosystem services knowledge by looking at which provisioning and regulating services exist, the location of these services, the quantity, quality, costs, constraints and commitments these services have, how utilization of resources can be managed from an information and industrial perspective and what are the environmental implications of managing these resources.
Socio Economics (Market Based Approach)
Loss of some ecosystem services has occurred, in part, because the full value of natural resource and environmental assets are not accounted for in market prices. A market-based approach relies on market forces to re-allocate goods and services through full and effective pricing to correct for market failures. Building capacity for using innovative socio- economic approaches to manage for ecosystem services in Alberta is led by Alberta Innovates Technology Futures. The Algar proof of concept reviewed eight different offset programs that are either currently in place or are under consideration in a number of places around the world, identifies common key
principles and articulates the steps that are taken in order to achieve these key principles.
The purpose of the Algar project is to contribute to the Ecosystem Services Roadmap by advancing a proof of concept for using advanced data and analytical process for assessing the ecosystem services within the Algar LEAP project. The project includes an assessment of ecosystem services from reclamation activities and the
potential for generating regulated conservation offsets in Alberta.
3
TE
AM
SIL
VA
CO
M
Assessing the Ecosystem Service Benefits of the Algar LEAP Project
• Carol Bettac, Project Sponsor, Alberta Innovates Bio-Solutions
• Bob Nichol, Alpac
• Carolyne Tralnberg, Land Use Secretariat
• Gillian Kerr, Alberta Environment and Sustainable Resource Development
• Gord Whitmore, DMI
• Judy Smith, Shell Canada
• Marian Weber, Centre for Market-based Instruments
• Scott Milligan, Alberta Environment and Sustainable Resource Development
• Simon Dyer, Pembina Institute
• Tom Habib, Alberta Biodiversity Monitoring Institute
• Will Hughesman, Nexen Energy ULC
We would also like to thank Anish Neupane, Heather Von Hauff, Anthony Hamilton, and Avelyn Nicol for their valuable contributions.
This project has been funded by Alberta Innovates Bio-Solutions. The former Algar companies (now part of
COSIA) contributed in-kind the knowledge, data, processes, and intellectual property developed and utilized by
the Algar Caribou Restoration project.
PLEASE NOTE: The resolution of the data and summary results will vary depending on the ecosystem service, consistent with the existing data utilized within the Algar Caribou Restoration project. We are utilizing available data as-is, with no warranty provided. Ecosystem services were valued using market prices where available. In the absence of market prices valuation approaches were selected in consultation with the advisory committee. Silvacom Ltd. and Green Analytics hereby disclaims any liability and shall not be held liable for any damages including, without limitation, direct, indirect or consequential damages including loss of revenue, loss of profit, loss of opportunity or other loss. Any reliance placed on this material is done so strictly at your own risk. This disclaimer applies to all portions of this ecosystem service assessment and valuation analysis.
4
ACKNOWLEDGEMENTS
We would like to thank the project Advisory Committee members for their commitment and the wise council they
provided at each stage of the project:
Jeremy Reid, Nexen Energy ULC •
TE
AM
SIL
VA
CO
M
Assessing the Ecosystem Service Benefits of the Algar LEAP Project
EXECUTIVE SUMMARY As historic and current resource developments leave a footprint across much of Alberta’s landscapes, restoration and reclamation efforts help balance economic growth with enhanced environmental quality. The Canadian oil sands industry is using collaboration to drive innovation and address these challenges in oil sands development. An early innovator and leader of successful collaboration is the Canadian Oil Sands Innovation Alliance (COSIA) - COSIA is comprised of fourteen member companies1 dedicated to step-changes in environmental performance for the oil sands industry. One key focus area for COSIA is land stewardship including the reduction of land disturbance resulting from oil sands development.
A subgroup of COSIA companies developed the Landscape Ecological Assessment and Planning (LEAP) framework.2 LEAP utilizes geospatial modeling and optimization techniques to improve land reclamation and development planning. The LEAP project was initiated across 56,915 ha of boreal forest in the Algar region of Alberta, Canada, where the restoration of linear disturbances is the focus for improving late seral stage conditions
and habitat quality for multiple wildlife species.
By restoring previously disturbed areas, programs like LEAP are contributing to the provisioning of ecological functions (e.g. wildlife habitat, water quality regulation and carbon sequestration), which provide benefits to
people in the form of ecosystem services.
The primary objective of this study was to assess the change in ecosystem services (ES) resulting from the application of LEAP and to measure the costs and benefits resulting from the restoration activities that took place in the Algar area. An additional objective of the Algar case study was to link the findings of the ES assessment and
the cost-benefit analysis to the use of conservation offsets in Alberta.
Findings reveal that there are significant gains to be realized from undertaking restoration activities such as those associated with the LEAP framework. The value of ecosystem service gains resulting from restoration and conservation in Algar is sufficient to justify the cost of restoration. Should a conservation offset scheme be pursued in Alberta it is expected that interest in the assessment of ES gains resulting from frameworks such as
LEAP would increase.
The next steps that are required to bring further precision to the ES Assessment and CBA results include:
• To further refine and improve the models, we recommend that they undergo a formal peer review process.• We recommend the application of the models to other data rich study areas, especially those where
monitoring data is available. • It would be beneficial to expand the ES assessment models to incorporate additional ES, in particular those
associated with cultural values. • Further socio-economic research is required to better understand the value that Albertans place on benefits
to ecosystem services like those deployed in this study.• We recommend that to drive broader scale adoption of mitigation measures that benefit ecosystem services,
the Government of Alberta consider adopting a market-based policy option like conservation offsets.
1 ConocoPhillips Canada Inc., Nexen Energy ULC, Shell Canada, Statoil Canada, Suncor Energy Inc., Total E&P Canada Ltd, BP Canada, Canadian Natural Resources Limited, Cenovus Energy Inc., Devon Canada Corporation, Imperial Oil, Syncrude Canada Ltd., and Teck Resources Limited.
2 Former Algar project companies include Nexen Energy ULC, Shell Canada, Statoil Canada, Suncor Energy Inc., Total E&P Canada Ltd, and ConocoPhillips Canada Inc.
5
TE
AM
SIL
VA
CO
M
Assessing the Ecosystem Service Benefits of the Algar LEAP Project
TABLE OF CONTENTS Forward ............................................................................................................................................................................................. 1
Acknowledgements ........................................................................................................................................................................ 4
Executive Summary ........................................................................................................................................................................ 5
Introduction .......................................................................................................................................................................... 101.
1.1 Project Outcomes...................................................................................................................................................... 11
1.2 Project Approach ....................................................................................................................................................... 12
1.3 Phase 1: Background Research ............................................................................................................................... 13
1.4 Phase 2: Develop ES Assessment and CBA Frameworks .................................................................................. 14
1.5 Phase 3: Conduct Ecosystem Service Assessment and CBA............................................................................. 14
1.6 Phase 4: Summarize Findings and Develop Recommendations...................................................................... 15
1.7 The Algar Area............................................................................................................................................................ 15
Ecosyst em Servic e Assessments ...................................................................................................................................... 172.
2.1 What are Ecosystem Servic es ................................................................................................................................. 17
2.1.1 Why Assess Ecosystem Servic es ...................................................................................................................22
2.1.2 Approaches to Assessing Ecosystem Services ........................................................................................... 23
2.2 Algar Ecosystem Service Assessment Approach ................................................................................................24
2.2.1 Timber Supply Assessment Approach ......................................................................................................... 25
2.2.2 Carbon Storage Assessment Approach.......................................................................................................26
2.2.3 Biodiversity Intactness Assessment Approach ..........................................................................................26
2.2.4 Wat er Purification Assessment Approach .................................................................................................. 27
2.2.5 Caribou Habit at Assessment Approach.......................................................................................................28
2.3 Algar Ecosystem Service Assessment Results .....................................................................................................29
2.3.1 Timber Supply Assessment Results .............................................................................................................29
2.3.2 Carbon Storage Assessment Results ........................................................................................................... 32
2.3.3 Biodiversity Assessment Results................................................................................................................... 34
2.3.4 Wat er Purification Assessment Results....................................................................................................... 35
2.3.5 Caribou Habit at Assessment Results ........................................................................................................... 36
2.4 ES Assessment Results Summary .......................................................................................................................... 39
Cost-Benefit Analysis.......................................................................................................................................................... 413.
3.1 What is Cost-Benefit Analysis? ............................................................................................................................... 41
3.1.1 Why Conduct a Cost-Benefit Analysis? ....................................................................................................... 41
6

TE
AM
SIL
VA
CO
M
Assessing the Ecosystem Service Benefits of the Algar LEAP Project
3.1.2 Identifying Costs and Benefits....................................................................................................................... 41
3.2 Algar Cost-Benefit Analysis Approach ..................................................................................................................42
3.2.1 Estimating the Costs ....................................................................................................................................... 43
3.2.2 Estimating the Benefits ..................................................................................................................................44
3.3 Algar Cost-Benefit Analysis Results.......................................................................................................................49
3.3.1 The Value of Timber Supply...........................................................................................................................49
3.3.2 The Value of Carbon Storage......................................................................................................................... 51
3.3.3 The Value of Biodiversity................................................................................................................................ 52
3.3.4 The Value of Water Purification .................................................................................................................... 53
3.3.5 The Value of Caribou Habitat ........................................................................................................................ 54
3.4 Cost-Benefit Analysis Results Summary............................................................................................................... 56
Toward an Offset Policy for Alberta ................................................................................................................................ 58 4.
4.1 Introduction ................................................................................................................................................................ 58
4.2 Background................................................................................................................................................................. 59
4.2.1 Why a M arket-based Approach .................................................................................................................... 61
4.2.2 Why Offsets.......................................................................................................................................................62
4.2.3 Global Trend in Offsets ...................................................................................................................................64
4.3 Review of Offset Programs......................................................................................................................................66
4.3.1 Link to Ecosystem Services............................................................................................................................ 67
4.3.2 Offset Principles ............................................................................................................................................... 67
4.3.3 Offset Metric .....................................................................................................................................................68
4.4 Articulating an Offset Framework for Alberta .....................................................................................................69
4.5 Summary ..................................................................................................................................................................... 72
Conclusion ............................................................................................................................................................................. 73 5.
Lessons Learned .................................................................................................................................................................. 77 6.
Glossary ................................................................................................................................................................................. 78 7.
Appendix A. Jurisdictional Sc an of Ecosystem Services Assessments .........................................................................80
Appendix B. 2013-2014 Boreal Full Value Timber Damage Assessment Table ........................................................122
Appendix C. Review of Offset Programs .......................................................................................................................... 123
7
TE
AM
SIL
VA
CO
M
Assessing the Ecosystem Service Benefits of the Algar LEAP Project
List of Figures
Figure 1-1 Key components of the Algar project..................................................................................................................... 12 Figure 1-2 Overview of Algar project approach....................................................................................................................... 13 Figure 1-3 Algar R estoration Area .............................................................................................................................................. 15 Figure 2-1 Key components of the Algar project highlighting the ecosystem service assessment ..............................24 Figure 2-2 Ecosystem service assessment approach ............................................................................................................. 25 Figure 2-3 Water purific ation model proc ess...........................................................................................................................28 Figure 2-4 Growing stock - Algar area scale............................................................................................................................. 30 Figure 2-5 Current State Yield curves, age class distribution – Algar area sc ale .............................................................. 30 Figure 2-6 Future State Yield curves, age class distribution – Algar area scale (restoration sc enario)........................ 31 Figure 2-7 Growing stoc k – Treatment line scale .................................................................................................................... 31 Figure 2-8 Total ecosystem carbon - Algar area scale ........................................................................................................... 32 Figure 2-9 Current State Carbon curve, age class distribution – Algar area scale............................................................ 32 Figure 2-10 Future State Carbon curve, age class distribution – Algar Area Scale (restoration scenario) .................. 33 Figure 2-11 Total ecosystem carbon - Treatment line sc ale ................................................................................................. 33 Figure 2-12 Future State Total ecosystem carbon – Treatment line scale ........................................................................ 34 Figure 2-13 Total phosphorus and nitrogen loading – Algar area scale.............................................................................. 35 Figure 2-14 Total sediment loading – Algar area scale .......................................................................................................... 36 Figure 2-15 Caribou range area restored – Treatment line scale ......................................................................................... 37 Figure 2-16 Caribou range area restored - Treatment line sc ale ......................................................................................... 37 Figure 3-1 Key components of Algar project approach highlighting cost-benefit analysis............................................42 Figure 3-2 Future state timber supply benefit ($) by discount rate – Treatment line scale............................................ 51 Figure 3-3 Future stat e carbon benefit ($) by discount rate – Treatment line sc ale ........................................................ 52 Figure 3-4 Future state biodiversity benefit ($) by discount rate – Algar region scale .................................................... 53 Figure 3-5 Future st ate caribou habitat benefit s (WTP) ($) by discount rate .................................................................... 55 Figure 3-6 Future stat e caribou habitat benefits (NPV) ($) by discount rate..................................................................... 56 Figure 4-1 Offsetting process......................................................................................................................................................60 Figure 4-2 Mitigation hierarchy .................................................................................................................................................. 65
List of Tables
Table 2-1 Ecosystem Services ..................................................................................................................................................... 17 Table 2-2 Current State Biodiversit y intactness – Algar area scale..................................................................................... 34 Table 2-3 Post-restoration change in Biodiversity intactness – Algar area scale ............................................................. 35 Table 2-4 Water purification (kg/year) ...................................................................................................................................... 36 Table 2-5 Ecosyst em servic e assessment summary - Algar area sc ale............................................................................... 39 Table 2-6 Ecosystem service assessment summary - Treatment line scale ......................................................................40 Table 3-1 Algar restoration treatment costs ............................................................................................................................44 Table 3-2 Discount rates employed in the valuation of ES benefits....................................................................................44 Table 3-3 Water purific ation costs .............................................................................................................................................46 Table 3-4 Future state timber supply benefits ($) at the treatment line scale ..................................................................49 Table 3-5 Future st ate timber benefits ($) by discount rate - Treatment line scale ......................................................... 50
8

TE
AM
SIL
VA
CO
M
Assessing the Ecosystem Service Benefits of the Algar LEAP Project
Table 3-6 Estimated carbon benefit by period at the treatment line scale ....................................................................... 51 Table 3-7 Future carbon benefit by discount rat e – treatment line sc ale ........................................................................... 52 Table 3-8 Future state biodiversity benefits ($) at the Algar region scale ......................................................................... 53 Table 3-9 Future state biodiversity benefits ($) by discount rate – Algar region scale.................................................... 53 Table 3-10 Future state water purific ation benefits ($) by discount rate – Algar region sc ale....................................... 54 Table 3-11 Future state caribou habitat benefits (WTP) ($) .................................................................................................. 54 Table 3-12 Future state caribou habitat benefits (WTP) ($) by discount rat e ................................................................... 54 Table 3-13 Future state caribou habitat benefits (NPV) ($)................................................................................................... 55 Table 3-14 Future state caribou habitat benefits (NPV) ($) by discount rate .................................................................... 55 Table 3-15 Algar Restoration Treatment Costs ....................................................................................................................... 56 Table 3-16 Summary of ES Values by discount rate ............................................................................................................... 57 Table 4-1 Polic y approaches and instruments for providing ecosyst em servic es ............................................................ 61 Table 4-2 Check list of principles by offset program .............................................................................................................. 67 Table 4-3 Lessons learned from BBOP offset projects .......................................................................................................... 70 Table 5-1 Ecosyst em servic e assessment summary - Algar area sc ale ............................................................................... 73 Table 5-2 Summary of the value of increased ES at a 2% discount rat e ............................................................................ 74 Table 5-3 Algar restoration treatment costs ............................................................................................................................ 74
9

TE
AM
SIL
VA
CO
M
Assessing the Ecosystem Service Benefits of the Algar LEAP Project
INTRODUCTION 1.As historic and current resource developments leave a footprint across much of Alberta’s landscapes, restoration and reclamation efforts help balance economic growth with enhanced environmental quality. Further, as Canadian oil and gas producers seek further access to global markets more is being asked of them in meeting society’s needs for economic, social and environmental sustainability. In response to increasing local and global pressures, Canadian oil sands companies are using collaboration to drive innovation and address some of the environmental challenges related to oil sands development. An early innovator and leader of successful collaboration is the Canadian Oil Sands Innovation Alliance (COSIA) - COSIA is comprised of thirteen member companies3 dedicated to step-changes in environmental performance for the oil sands industry. One key focus area for COSIA is land stewardship, including the reduction of land disturbance resulting from oil sands
development.
A subgroup of COSIA companies (including Nexen, ConocoPhillips, Shell, Statoil, Suncor and Total) developed the Landscape Ecological Assessment and Planning framework,4 also known as LEAP. LEAP is a four part process involving:
1) The establishment of ecological objectives for the future landscape 2) Modelling and projecting ecosystem change 3) On-the-ground restoration implementation
4) Monitoring to measure changes in ecological conditions
By restoring previously disturbed areas, programs like LEAP are contributing to the provisioning of ecological functions (e.g. wildlife habitat, water quality regulation and carbon sequestration), which provide benefits to people in the form of ecosystem services. The Algar area in the Lower Athabasca Region of Alberta was chosen as
a case study upon which to apply the LEAP framework.
The primary objective of this study was to assess the change in ecosystem services (ES) resulting from the application of LEAP and to measure the costs and benefits resulting from the restoration activities that took place in the Algar area. The results of the ES assessment as well as the cost-benefit analysis (CBA) are presented in this report. An additional objective of the Algar case study was to link the findings of the ES assessment and the CBA
to the use of conservation offsets in Alberta.
As will be described in greater detail in this report, a conservation offset is a market-based instrument that provides a means to “offset” loss of ecosystem function due to human use and resource developments in one geographic area with either restoration or conservation activities in another geographic area. The goal of most conservation offset programs is to achieve no net loss of habitat and to maintain ecosystem function and services in perpetuity. To do so, however, requires: 1) a means to rigorously and consistently measure ES in both the development location and the offset location; and 2) the articulation of a set of principles that define that which
does or does not constitute an offset.
3 ConocoPhillips Canada Inc., Nexen Energy ULC, Shell Canada, Statoil Canada, Suncor Energy Inc., Total E&P Canada Ltd, BP Canada, Canadian Natural Resources Limited, Cenovus Energy Inc., Devon Canada Corporation, Imperial Oil, Syncrude Canada Ltd., and Teck Resources Limited.
4 For more information on the LEAP framework visit http://leap.silvacom.com/.
10

TE
AM
SIL
VA
CO
M
Assessing the Ecosystem Service Benefits of the Algar LEAP Project
Offset schemes are in place in a number of jurisdictions around the world. The means by which ecosystem service gains and losses are measured as well as the principles associated with each scheme vary from one offset scheme to the next. This report presents the results of a review of a number of offsets schemes currently in place or under consideration to demonstrate the range of measurements and principles that are currently employed and to help demonstrate the degree to which the Algar case study would qualify as an offset were such a policy be formally
introduced in Alberta.
This report presents the results of the ES assessment and the CBA of the application of LEAP to the Algar area and positions the findings of the analysis in the context of offset programs. This Introduction briefly describes the Algar area and the restoration activities that took place there. It also describes the project outcomes and the general approach employed in the analysis (ES assessment and CBA). Following this Introduction, you will find the
following chapters:
• An Ecosystem Service Assessment chapter that includes background/contextual information on ES and its assessment, as well as the results of the Algar ES assessment.
• A Cost-Benefit Analysis chapter that includes background information on CBA as well as the findings of the CBA of the Algar restoration.
• A Towards an Offset Policy for Alberta chapter linking the findings of the ES assessment and CBA of the Algar region to offset programs in general and the movement towards an offset program for Alberta more specifically.
• A Conclusion chapter that summarizes the findings, articulates key recommendations related to ES assessments, CBA and offset programs, and identifies next steps.
1.1 Project Outcomes
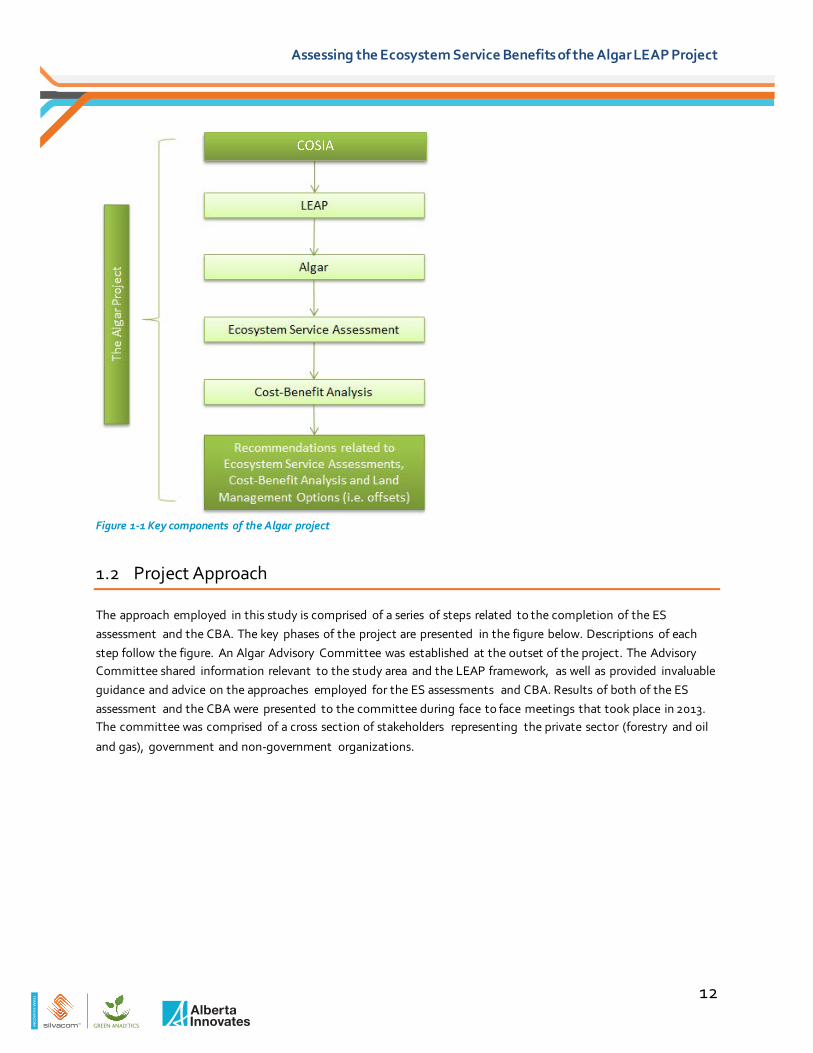
The desired outcome of this project is the development and application of a repeatable, transferable, and implementable approach to evaluating the ES benefit of restoration activities in the boreal region. The findings of the ES assessment and CBA have informed a series of recommendations related to assessing ES, conducting CBA and the development of an offset scheme for Alberta. The figure below depicts the main components of the Algar project, which as is described in the figure, culminates with the articulation of recommendations.
11
TE
AM
SIL
VA
CO
M
Assessing the Ecosystem Service Benefits of the Algar LEAP Project
Figure 1-1 Key components of the Algar project
1.2 Project Approach
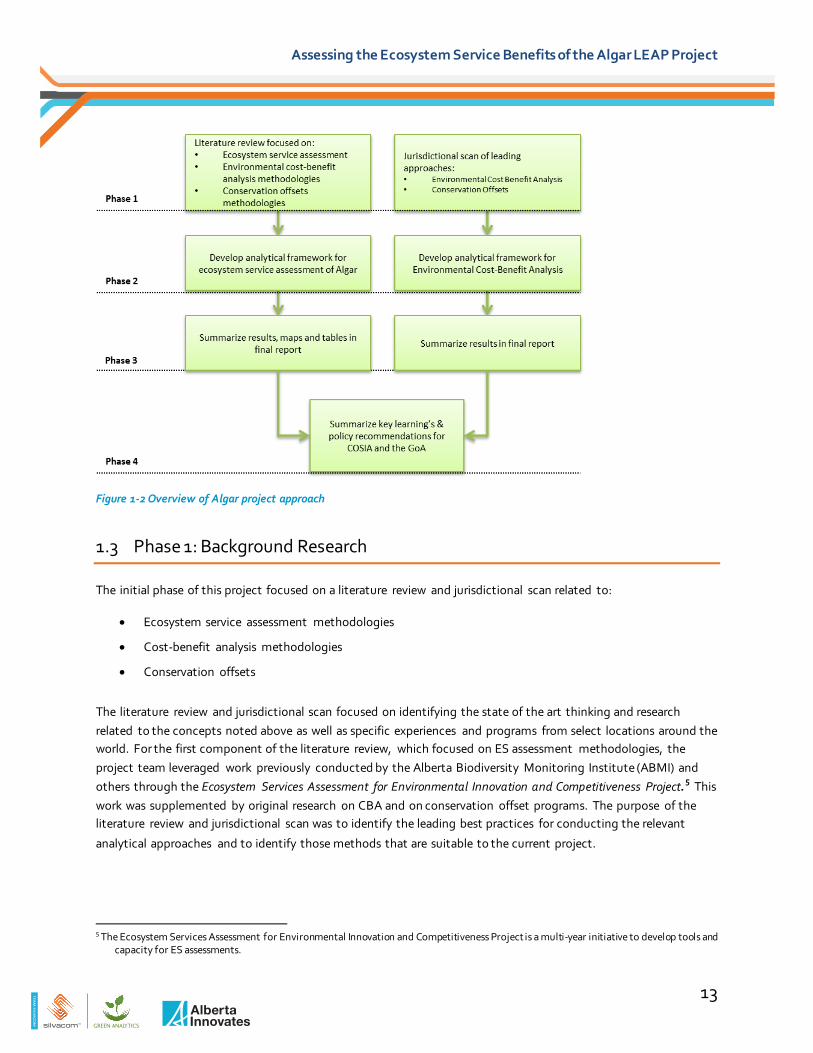
The approach employed in this study is comprised of a series of steps related to the completion of the ES assessment and the CBA. The key phases of the project are presented in the figure below. Descriptions of each step follow the figure. An Algar Advisory Committee was established at the outset of the project. The Advisory Committee shared information relevant to the study area and the LEAP framework, as well as provided invaluable guidance and advice on the approaches employed for the ES assessments and CBA. Results of both of the ES assessment and the CBA were presented to the committee during face to face meetings that took place in 2013. The committee was comprised of a cross section of stakeholders representing the private sector (forestry and oil
and gas), government and non-government organizations.
12
TE
AM
SIL
VA
CO
M
Assessing the Ecosystem Service Benefits of the Algar LEAP Project
Figure 1-2 Overview of Algar project approach
1.3 Phase 1: Background Research
The initial phase of this project focused on a literature review and jurisdictional scan related to:
• Ecosystem service assessment methodologies
• Cost-benefit analysis methodologies
• Conservation offsets
The literature review and jurisdictional scan focused on identifying the state of the art thinking and research related to the concepts noted above as well as specific experiences and programs from select locations around the world. For the first component of the literature review, which focused on ES assessment methodologies, the project team leveraged work previously conducted by the Alberta Biodiversity Monitoring Institute (ABMI) and others through the Ecosystem Services Assessment for Environmental Innovation and Competitiveness Project.5 This work was supplemented by original research on CBA and on conservation offset programs. The purpose of the literature review and jurisdictional scan was to identify the leading best practices for conducting the relevant
analytical approaches and to identify those methods that are suitable to the current project.
5 The Ecosystem Services Assessment for Environmental Innovation and Competitiveness Project is a multi-year initiative to develop tools and capacity for ES assessments.
13
TE
AM
SIL
VA
CO
M
Assessing the Ecosystem Service Benefits of the Algar LEAP Project
1.4 Phase 2: Develop ES Assessment and CBA Frameworks
The second phase of the project focused on defining and describing appropriate analytical approaches for conducting the ES assessment and CBA. Identified in consultation with the advisory committee, the ES
assessment framework includes measures for the following:
• Water regulation
• Carbon storage
• Timber supply
• Caribou habitat
• Biodiversity intactness
The ES identified above were chosen as the focus of the Algar case study for a number of reasons. First, the desire to establish an approach that could be repeatable and transferable to other regions lead to the inclusion of ES that are commonly considered in ES assessments. These include water regulation, carbon storage and timber supply. Given the prevalence of the ecosystems that provide these services across the province, including them in the case study and establishing an approach for their assessment increases the repeatability of their assessment. In other words, the assessment approaches for these services will be more applicable elsewhere in Alberta. Caribou and biodiversity were included in the analysis because of their importance to the boreal region of Alberta as well as the fact that they are topics that receive a fair bit of attention from policy and development perspectives. In essence they are “hot topics” in Alberta, given the push to protect caribou habitat and maintain biodiversity intactness in the face of resource development. In this context, establishing and testing an approach for the measurement of these services seemed both prudent and appropriate.
1.5 Phase 3: Conduct Ecosystem Service Assessment and CBA
In Phase 3 of the project, the ES assessment and CBA were applied to the Algar area. Using spatially explicit data sets, the ES assessment focused on determining how the completed and planned restoration work in the Algar area contributed to the quantity of the above mentioned ecological functions by measuring the change in the supply of ES between the baseline state (before the Algar LEAP project) and the new state (after the Algar LEAP
project).
To complete the CBA, cost data for the restoration of the Algar area was gathered and a benefits assessment of the gains in ecosystem services was completed. The benefits assessment involved the use of market and non-market valuation techniques to estimate the benefit of the additional units of ecosystem services resulting from the application of LEAP to the Algar area.
14
TE
AM
SIL
VA
CO
M
Assessing the Ecosystem Service Benefits of the Algar LEAP Project
1.6 Phase 4: Summarize Findings and Develop Recommendations
The findings and recommendations of the ES assessment and CBA are summarized in this final report. A full review of the report has been carried out by members of COSIA, the Government of Alberta, and the Advisory
Committee.
1.7 The Algar Area
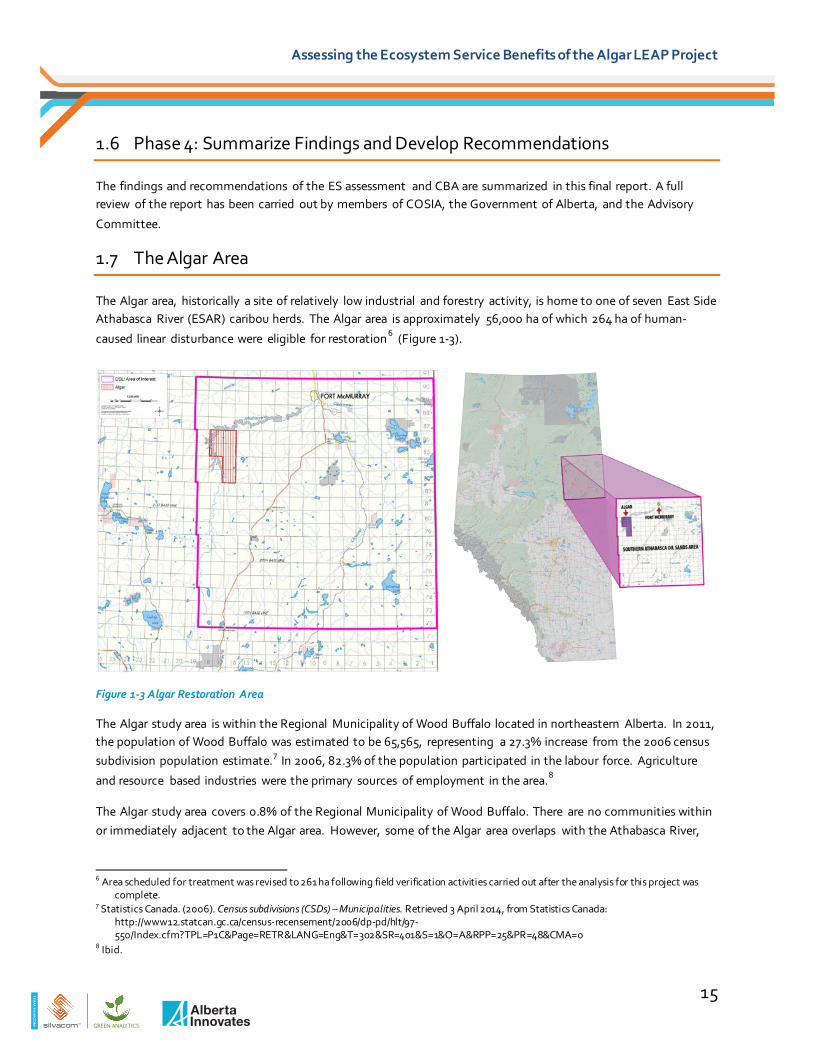
The Algar area, historically a site of relatively low industrial and forestry activity, is home to one of seven East Side Athabasca River (ESAR) caribou herds. The Algar area is approximately 56,000 ha of which 264 ha of human-
caused linear disturbance were eligible for restoration 6 (Figure 1-3).
Figure 1-3 Algar Restoration Area
The Algar study area is within the Regional Municipality of Wood Buffalo located in northeastern Alberta. In 2011, the population of Wood Buffalo was estimated to be 65,565, representing a 27.3% increase from the 2006 census subdivision population estimate.7 In 2006, 82.3% of the population participated in the labour force. Agriculture
and resource based industries were the primary sources of employment in the area.8
The Algar study area covers 0.8% of the Regional Municipality of Wood Buffalo. There are no communities within or immediately adjacent to the Algar area. However, some of the Algar area overlaps with the Athabasca River,
6 Area scheduled for treatment was revised to 261 ha following field verification activities carried out after the analysis for this project was complete.
7 Statistics Canada. (2006). Census subdivisions (CSDs) – Municipalities. Retrieved 3 April 2014, from Statistics Canada: http://www12.statcan.gc.ca/census-recensement/2006/dp-pd/hlt/97-550/Index.cfm?TPL=P1C&Page=RETR&LANG=Eng&T=302&SR=401&S=1&O=A&RPP=25&PR=48&CMA=0
8 Ibid.
15
TE
AM
SIL
VA
CO
M
Assessing the Ecosystem Service Benefits of the Algar LEAP Project
which then flows through Fort McMurray. Therefore, changes in ecosystem services (ie. water purification) may
impact downstream recipients in Fort McMurray.
Ecologically, the majority of the Algar area is comprised of boggy wetlands with scattered upland sites where relief is present. The Algar area spans six townships along the Athabasca River, southeast of Fort McMurray. Using LEAP as the tool to guide the planning, site-specific operational work was initiated during the 2011/2012 winter season. Over 200 km of seismic lines were treated during the 2011/2012, 2012/2013, and 2013/2014 winter
seasons. Treatment activities included:
• Mechanical site preparation for winter tree planting
• Accumulation of coarse woody material (improving microsites and creating access barriers)
• Identification and protection of existing natural vegetation
• Planting of over 125,000 trees
Due to rounding, numbers presented throughout this report may not add up precisely to the totals provided and
percentages may not reflect the absolute figures.
16
TE
AM
SIL
VA
CO
M
Assessing the Ecosystem Service Benefits of the Algar LEAP Project
ECOSYSTEM SERVICE ASSESSMENTS 2.This section of the report presents information on ES assessments, including: 1) a brief background on ES assessments; 2) a description of the approaches employed to assess the ES benefits resulting from the restoration
of the Algar area; and 3) the results of the Algar ES assessment.
2.1 What are Ecosystem Services
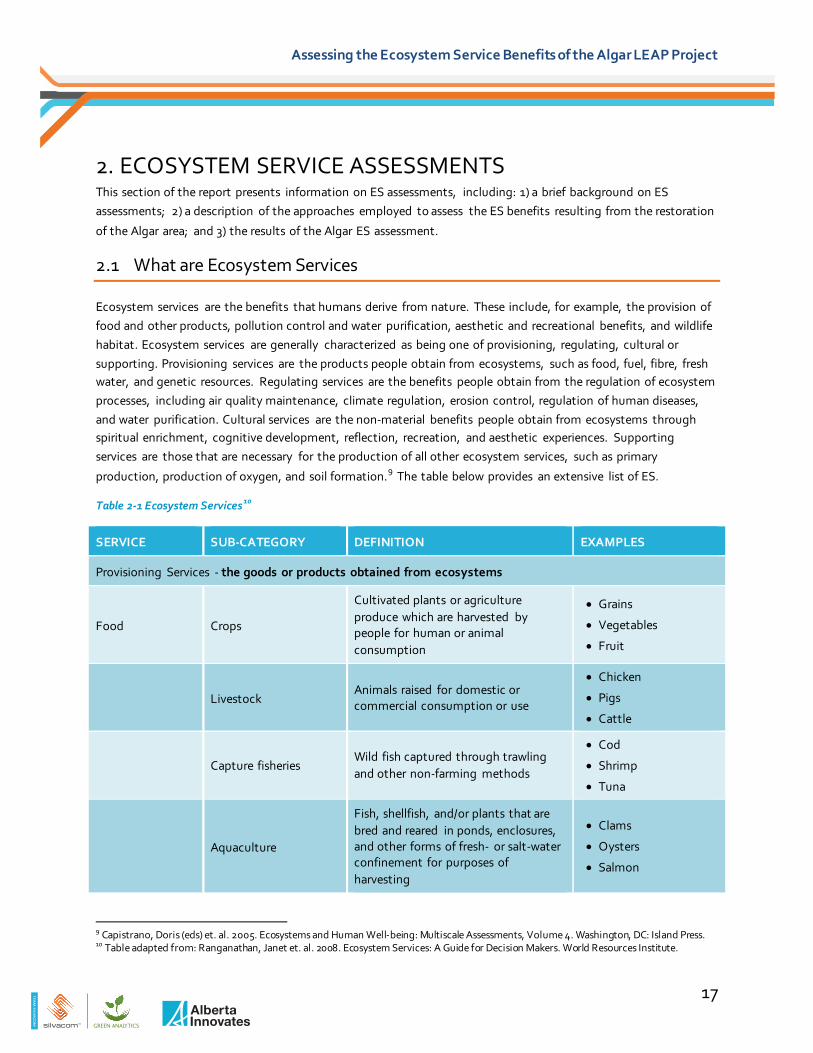
Ecosystem services are the benefits that humans derive from nature. These include, for example, the provision of food and other products, pollution control and water purification, aesthetic and recreational benefits, and wildlife habitat. Ecosystem services are generally characterized as being one of provisioning, regulating, cultural or supporting. Provisioning services are the products people obtain from ecosystems, such as food, fuel, fibre, fresh water, and genetic resources. Regulating services are the benefits people obtain from the regulation of ecosystem processes, including air quality maintenance, climate regulation, erosion control, regulation of human diseases, and water purification. Cultural services are the non-material benefits people obtain from ecosystems through spiritual enrichment, cognitive development, reflection, recreation, and aesthetic experiences. Supporting services are those that are necessary for the production of all other ecosystem services, such as primary
production, production of oxygen, and soil formation.9 The table below provides an extensive list of ES.
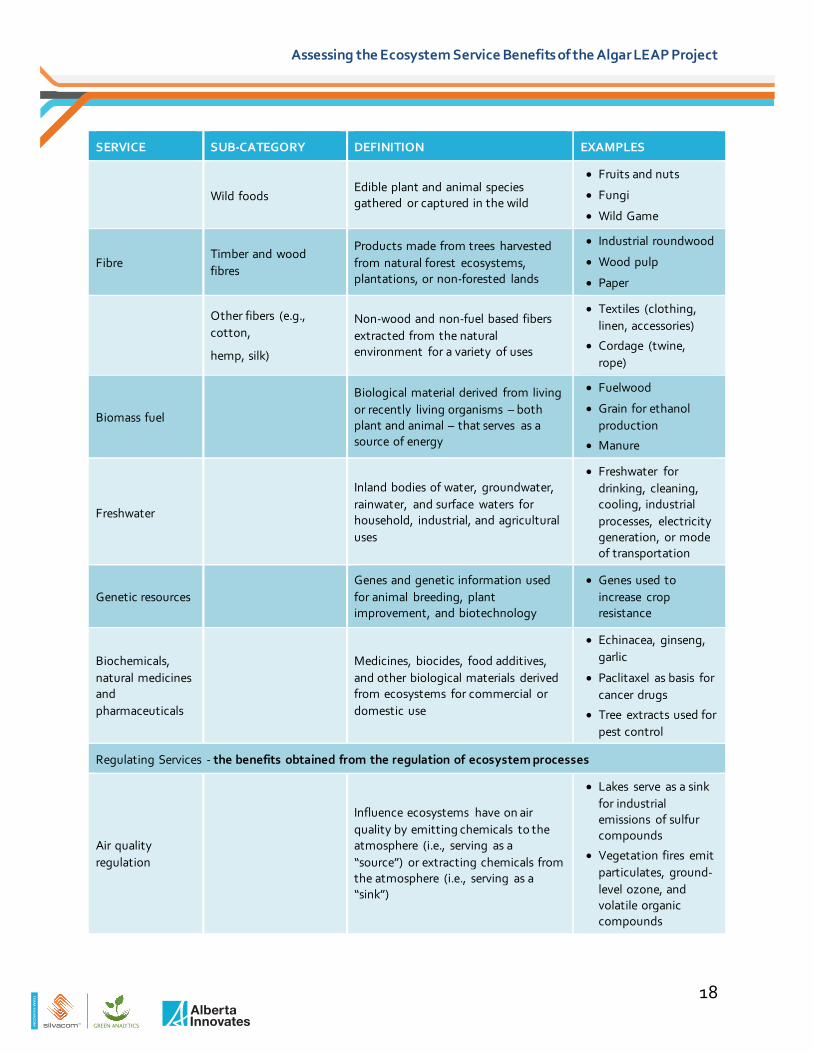
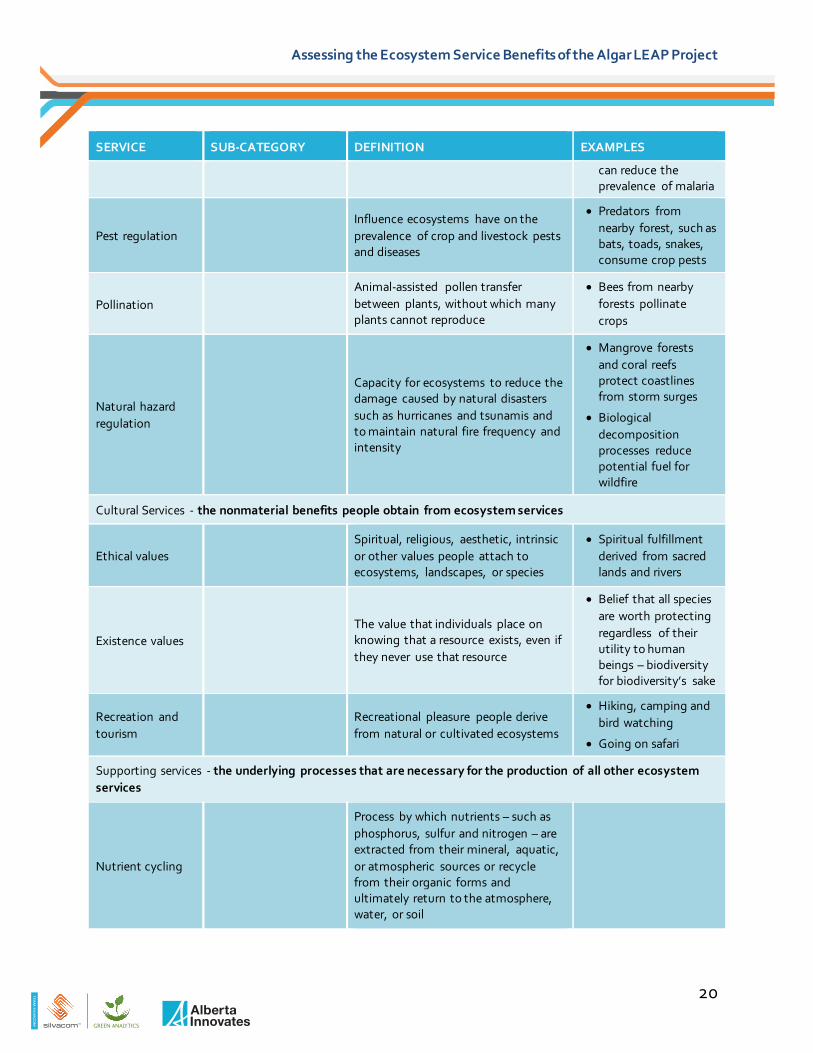
Table 2-1 Ecosystem Services10
SERVICE SUB-CATEGORY DEFINITION EXAMPLES
Provisioning Services - the goods or products obtained from ecosystems
Food Crops
Cultivated plants or agriculture produce which are harvested by people for human or animal consumption
• Grains
• Vegetables
• Fruit
Livestock Animals raised for domestic or commercial consumption or use
• Chicken
• Pigs
• Cattle
Capture fisheries Wild fish captured through trawling and other non-farming methods
• Cod
• Shrimp
• Tuna
Aquaculture
Fish, shellfish, and/or plants that are bred and reared in ponds, enclosures, and other forms of fresh- or salt-water confinement for purposes of harvesting
• Clams
• Oysters
• Salmon
9 Capistrano, Doris (eds) et. al. 2005. Ecosystems and Human Well-being: Multiscale Assessments, Volume 4. Washington, DC: Island Press. 10 Table adapted from: Ranganathan, Janet et. al. 2008. Ecosystem Services: A Guide for Decision Makers. World Resources Institute.
17
TE
AM
SIL
VA
CO
M
Assessing the Ecosystem Service Benefits of the Algar LEAP Project
SERVICE SUB-CATEGORY DEFINITION EXAMPLES
Wild foods Edible plant and animal species gathered or captured in the wild
• Fruits and nuts
• Fungi
• Wild Game
Fibre Timber and wood fibres
Products made from trees harvested from natural forest ecosystems, plantations, or non-forested lands
• Industrial roundwood
• Wood pulp
• Paper
Other fibers (e.g., cotton,
hemp, silk)
Non-wood and non-fuel based fibers extracted from the natural environment for a variety of uses
• Textiles (clothing,linen, accessories)
• Cordage (twine,rope)
Biomass fuel
Biological material derived from living or recently living organisms – both plant and animal – that serves as a source of energy
• Fuelwood
• Grain for ethanolproduction
• Manure
Freshwater
Inland bodies of water, groundwater, rainwater, and surface waters for household, industrial, and agricultural uses
• Freshwater fordrinking, cleaning, cooling, industrialprocesses, electricitygeneration, or modeof transportation
Genetic resources Genes and genetic information used for animal breeding, plant improvement, and biotechnology
• Genes used toincrease cropresistance
Biochemicals, natural medicines and pharmaceuticals
Medicines, biocides, food additives, and other biological materials derived from ecosystems for commercial or domestic use
• Echinacea, ginseng,garlic
• Paclitaxel as basis forcancer drugs
• Tree extracts used for pest control
Regulating Services - the benefits obtained from the regulation of ecosystem processes
Air quality regulation
Influence ecosystems have on air quality by emitting chemicals to the atmosphere (i.e., serving as a “source”) or extracting chemicals from the atmosphere (i.e., serving as a “sink”)
• Lakes serve as a sinkfor industrial emissions of sulfur compounds
• Vegetation fires emitparticulates, ground-level ozone, andvolatile organiccompounds
18

TE
AM
SIL
VA
CO
M
Assessing the Ecosystem Service Benefits of the Algar LEAP Project
SERVICE SUB-CATEGORY DEFINITION EXAMPLES
Climate regulation Global
Influence ecosystems have on the global climate by emitting greenhouse gases or aerosols to the atmosphere or by absorbing
greenhouse gases or aerosols from the atmosphere
• Forests capture andstore carbon dioxide
• Cattle and rice paddies emitmethane
Regional and local Influence ecosystems have on local or regional temperature, precipitation and other climatic factors
• Forests can impactregional rainfall levels
Water regulation
Influence ecosystems have on the timing and magnitude of water runoff, flooding, and aquifer recharge, particularly in terms of the water storage potential of the ecosystem or landscape
• Permeable soilfacilitates aquiferrecharge
• River floodplains andwetlands retainwater, which candecrease floodingduring runoff peaks, reducing need forengineered floodcontrol infrastructure
Erosion regulation Role vegetative cover plays in soil retention
• Vegetation such asgrass and treesprevents soil loss andsiltation of water ways due to wind andrain
• Forests on slopeshold soil in place thereby preventinglandslides
Water purification and waste treatment
Role ecosystems play in the filtration and decomposition of organic wastes and pollutants in water; assimilation and detoxification of compounds through soil and subsoil processes
• Wetlands removeharmful pollutantsfrom water bytrapping metals andorganic materials
• Soil microbesdegrade organicwaste rendering itless harmful
Disease regulation
Influence that ecosystems have on the incidence and abundance of human pathogens
• Some intact forests reduce occurrence ofstanding water, a breeding area formosquitoes, which
19
TE
AM
SIL
VA
CO
M
Assessing the Ecosystem Service Benefits of the Algar LEAP Project
SERVICE SUB-CATEGORY DEFINITION EXAMPLES
can reduce the prevalence of malaria
Pest regulation Influence ecosystems have on the prevalence of crop and livestock pests and diseases
• Predators from nearby forest, such as bats, toads, snakes, consume crop pests
Pollination Animal-assisted pollen transfer between plants, without which many plants cannot reproduce
• Bees from nearby forests pollinate crops
Natural hazard regulation
Capacity for ecosystems to reduce the damage caused by natural disasters such as hurricanes and tsunamis and to maintain natural fire frequency and intensity
• Mangrove forests and coral reefs protect coastlines from storm surges
• Biological decomposition processes reduce potential fuel for wildfire
Cultural Services - the nonmaterial benefits people obtain from ecosystem services
Ethical values Spiritual, religious, aesthetic, intrinsic or other values people attach to ecosystems, landscapes, or species
• Spiritual fulfillment derived from sacred lands and rivers
Existence values The value that individuals place on knowing that a resource exists, even if they never use that resource
• Belief that all species are worth protecting regardless of their utility to human beings – biodiversity for biodiversity’s sake
Recreation and tourism
Recreational pleasure people derive from natural or cultivated ecosystems
• Hiking, camping and bird watching
• Going on safari
Supporting services - the underlying processes that are necessary for the production of all other ecosystem services
Nutrient cycling
Process by which nutrients – such as phosphorus, sulfur and nitrogen – are extracted from their mineral, aquatic, or atmospheric sources or recycle from their organic forms and ultimately return to the atmosphere, water, or soil
20

TE
AM
SIL
VA
CO
M
Assessing the Ecosystem Service Benefits of the Algar LEAP Project
SERVICE SUB-CATEGORY DEFINITION EXAMPLES
Soil formation Process by which organic material is decomposed to form soil
Primary production
Formation of biological material through assimilation or accumulation of energy and nutrients by organisms
Photosynthesis Process by which carbon dioxide, water, and sunlight combine to form sugar and oxygen
Water cycling Flow of water through ecosystems in its solid, liquid, or gaseous forms
While markets for some ES already exist (the provision of forest products and agricultural crops, air quality through the Specified Gas Emitters Regulation for example), that is not the case for many. By creating economic and regulatory incentives (through the use of offset programs for example) for the conservation and appropriate stewardship of ES, markets can guide people’s behaviour in directions that support desired environmental and economic outcomes. Under a market approach for ES, people and businesses that are able to provide ES such as fresh water, erosion control, and wildlife habitat can be economically rewarded for doing so. By valuing ES it can also become evident to policy makers that in some cases nature-based solutions, e.g. using wetlands for water purification, flood protection or carbon storage, may be more cost-effective than technical infrastructure.11 Establishing markets for ES can also encourage people to limit their use of ecological resources and reduce their
environmental impact.
Ecosystem service markets have been implemented around the world. Australia, the United States, and Latin America all have ES markets. Ranchers in Australia can be compensated for conducting management activities that protect and restore ES such as water quality and native vegetation.12 In the United States, landowners are paid to manage their land for the benefit of endangered species.13 Farmers in Mexico receive payments in return for preserving forest cover on their property, which provides water filtration and water storage services for downstream users.14 The European Union (EU) has recognized the importance of ES. Ecosystem services are one of the pillars of the assessment of impacts in the 2012 Commission’s Blueprint to safeguard the future of European Waters by 2015. Restoring and preserving ES is also one of the six priorities identified by the rural
development pillar in the new proposal for the EU’s Common Agriculture Policy.15
11 Maes, Joachim, et. al. 2012. “Mapping ecosystem services for policy support and decision making in the European Union” in Journal of Ecosystem Services, Volume 1, Issue 1.
12 Victoria Department of Natural Resources and Environment. 2002. Victoria’s Native Vegetation Management: A Framework for Action. Department of Natural Resources and Environment, East Melbourne.
13 US Fish and Wildlife Service. 2003. Guidance for the Establishment, Use, and Operation of Conservation Banks. http://www.fws.gov/endangered/pdfs/MemosLetters/conservation-banking.pdf
14 Alix-Garcia, J., A. de Janvry, E. Sadoulet, and J.M. Torres. 2005. An Assessment of Mexico’s Payment for Environmental Services Program. Report prepared for the Comparative Studies Service Agricultural and Development Economics Division, United Nations Food and Agriculture Organization (FAO). Pp. 79.
15 Maes, Joachim, et. al. 2012. “Mapping ecosystem services for policy support and decision making in the European Union” in Journal of Ecosystem Services, Volume 1, Issue 1.
21

TE
AM
SIL
VA
CO
M
Assessing the Ecosystem Service Benefits of the Algar LEAP Project
2.1.1 Why Assess Ecosystem Services
Ecosystem service assessments characterise, quantify, measure, track and in some cases value ES across a range of geographic and temporal scales. Such assessments are increasingly used to evaluate the supply and use of ES in a region. More specifically, such assessments evaluate the flow of ES across a particular landscape from source locations to use locations (the location of beneficiaries) taking into consideration sink locations along the flow route. As is described below there are a number of benefits to conducting spatially explicit assessments of the
flow of ES across a landscape.
Understanding the flow of ES across the landscape to the beneficiaries of the services provides valuable information to policy and decision makers on several fronts. Making the link between source and use locations across the landscape demonstrates the importance of various landscapes in delivering services to beneficiaries. It shows how, by what means, and to whom a specific parcel of land delivers a specific benefit or set of benefits derived from ES. Management decisions that alter landscapes thus become much more tangible as service delivery and use can be attributed to specific pieces of land, specific landowners and particular beneficiaries.16
Spatially explicit mapping of the source, flow and use of ES allows decision makers to target interventions, such as restoration and enhancement activities and conservation initiatives, towards maximizing the benefits derived from ES and/or minimizing the loss of important services provided by ecosystems. Such assessments increase understanding of where and what services are provided by a given piece of land, landscape, region, state or continent. This allows for the stock of different types of natural capital and the flow of services from that natural capital to be monitored and managed across spatial and temporal scales. Ecosystem service flow analysis demonstrates accrued benefits to each beneficiary, as well as the amount of service benefits unable to reach beneficiaries due to the spatial mismatch in source and use locations. Thus, the knowledge gained by mapping ES flows on the landscape can be used to:17
• Increase beneficiaries’ ability to use a service that flows to them
• Change service flows to users by increasing or decreasing the effects of sinks along flow paths
• Redirect flow paths to route inaccessible or blocked services to more potential users
Ecosystem service flow assessments also result in a better understanding of the condition of and threats to ecosystems in a region, which in turn facilitate the use of finite resources where they are needed most.18 In addition, ES flow assessments are useful for highlighting critical ES flow pathways; places where multiple flows converge in high density or where single flows transmit all of the service received by a group of beneficiaries. The protection of the landscape along such critical pathways (from source to use locations) may prove particularly
beneficial.19
Spatially explicit ES assessments also improve the basis for economic valuation. This is useful for several reasons. First, such information can directly inform the development of ES markets including payments for ES, biodiversity
16 Bagstad, Kenneth, et. al. 2013. “Spatial dynamics of ecosystem service flows: A comprehensive approach to quantifying actual services” in Ecosystem Services Volume 4.
17 Bagstad, Kenneth, et. al. 2013. “Spatial dynamics of ecosystem service flows: A comprehensive approach to quantifying actual services” in Ecosystem Services Volume 4.
18 Crossman, Neville, et. al. 2013. “A blueprint for mapping and modelling ecosystem services” in Ecosystem Services, Volume 4. 19 Bagstad, Kenneth, et. al. 2013. “Spatial dynamics of ecosystem service flows: A comprehensive approach to quantifying actual services” in
Ecosystem Services Volume 4.
22

TE
AM
SIL
VA
CO
M
Assessing the Ecosystem Service Benefits of the Algar LEAP Project
and wetland banking, carbon offsets and trading, and conservation auctions. Second, it is useful when weighing the value of resource development against conservation objectives. Third, it is useful when considering the value of services provided by ecosystems in relation to constructed infrastructure capable of providing those same
services (e.g. water purification services).
2.1.2 Approaches to Assessing Ecosystem Services
As interest in ES and their assessment increases, so too does the ability to identify, map, measure, and value the ES and the benefits derived from them. Examples of cutting edge initiatives that are developing new applications for assessing ES include the Natural Capital Project 20 on valuation, the International Union for Conservation of Nature (IUCN) program on payments for ecosystem services,21 and the World Resources Institute’s work on incorporating ecosystem services in public and private sector decisions.22 The most renowned and comprehensive ES assessment initiative, from a global perspective, is arguably the Millennium Ecosystem Assessment (MA).23 Appendix A presents an overview of a number of ES assessments that have been completed for various regions around the world. It demonstrates the specific steps that have been employed to undertake such assessments, a
number of which rely on information published by MA.
Recent developments in research and analysis related to ES are focused on the quantification and mapping of ES flows, linking sources, sinks and uses across the landscape. Several approaches, of varying complexity, have been used to map ES. The simplest approach is to identify various land cover types on the landscape and to ascribe particular ES to the associated land cover types (so that forested areas are associated with carbon storage for example, and wetlands are associated with water purification). Such approaches do not take into consideration the flow of services from source to use and so may only be appropriate at large scales and/or where the dominant service or services relate directly to a dominant land type and use (e.g., crop and timber production).24
More complex assessments of ES are spatially detailed and based on evaluations of the supply of and demand for the services provided by ecosystems. The supply of ES is largely determined by ecological processes and landscape characteristics. The demand for ES is largely determined by characteristics of the human beneficiaries. Thus, ES assessments should ideally incorporate both the supply of and demand for ES. This involves a biophysical assessment of ES supply, whereas demand is determined through a socio-economic assessment of ES value. The supply of and demand for ES are by definition spatially variable, which is why recent ES assessments
are designed to consider the source, flow and use of ES across a landscape.25
Despite the importance of conducting spatially explicit assessments of ES integrating supply and demand-side analyses, doing so remains a key challenge.26 To date, only a few studies have spatially analysed both sides of an ES assessment. A consistent framework to measure and map ES flows that includes models and data describing
20 Source: http://www.naturalcapitalproject.org/InVEST.html 21 Source: http://www.iucn.org/about/work/programmes/economics/econ_ourwork/econ_currentprojects/?310/Developing-International-
Payments-for-Ecosystem-Services 22 Ranganathan, Janet et. al. 2008. Ecosystem Services: A Guide for Decision Makers. World Resources Institute. 23 Source: http://www.maweb.org/en/index.aspx 24 Maes, Joachim, et. al. 2012. “Mapping ecosystem services for policy support and decision making in the European Union” in Journal of
Ecosystem Services, Volume 1, Issue 1. 25 Shagner, Jan Philipp, et. al. 2013. “Mapping ecosystem services’ values: Current practice and future prospects” in Ecosystem Services,
Volume 4. 26 Shagner, Jan Philipp, et. al. 2013. “Mapping ecosystem services’ values: Current practice and future prospects” in Ecosystem Services,
Volume 4.
23

TE
AM
SIL
VA
CO
M
Assessing the Ecosystem Service Benefits of the Algar LEAP Project
the locations and quantities of potential ES provision (sources), human beneficiaries (users), and biophysical features that could deplete service flows (sinks) is needed.27 Towards that end, researchers recently articulated the following five step process for the quantification of ES flows:28
(1) The identification of the beneficiaries of ES. (2) The identification, for each benefit type, of a carrier, expressed in physical units or relative rankings, that
transmits the service by connecting ecosystems and people. (3) Establishing whether use of or contact with the carrier is beneficial or detrimental to human well-being. (4) Classification of the use of the carrier as rival or non-rival, and its sources, sinks, or use as biophysically
limited or unlimited. (5) Identification of the flow type used in routing the carrier from ecosystems to people – or for some services
routing people to ecosystems.
2.2 Algar Ecosystem Service Assessment Approach
This section of the report describes the assessment approach employed in the Algar Ecosystem Assessment case study. The approach employed relies on spatially explicit ES supply data, in some cases mapping the flow of the ES over the landscape (e.g. water purification). The figure below positions this stage of the project within the larger progression of the project. The ES is the first major analysis component of the overall project approach
employed.
Figure 2-1 Key components of the Algar project highlighting the ecosystem service assessment
27 Villa, Ferdinando, et. al. 2012. Towards a Comprehensive Approach to Quantifying and Mapping Ecosystem Services Flows. Basque Centre for Climate Change, BC3 Working Paper Series.
28 Villa, Ferdinando, et. al. 2012. Towards a Comprehensive Approach to Quantifying and Mapping Ecosystem Services Flows. Basque Centre for Climate Change, BC3 Working Paper Series.
24
TE
AM
SIL
VA
CO
M
Assessing the Ecosystem Service Benefits of the Algar LEAP Project
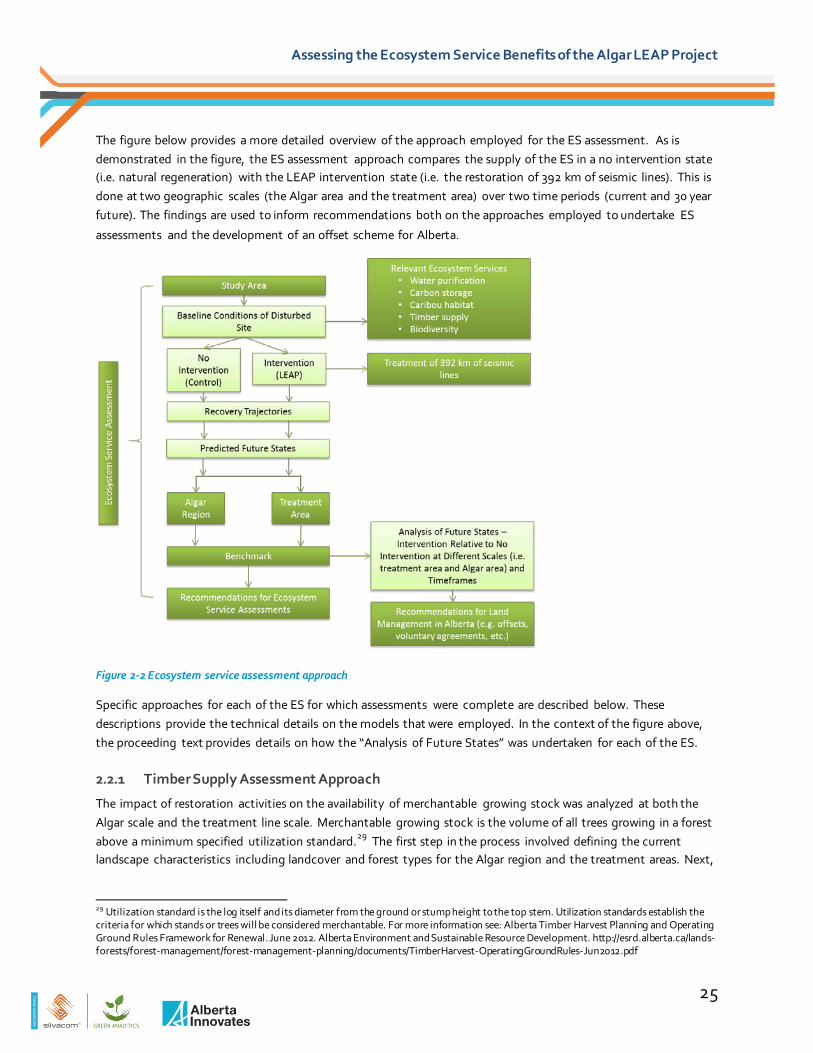
The figure below provides a more detailed overview of the approach employed for the ES assessment. As is demonstrated in the figure, the ES assessment approach compares the supply of the ES in a no intervention state (i.e. natural regeneration) with the LEAP intervention state (i.e. the restoration of 392 km of seismic lines). This is done at two geographic scales (the Algar area and the treatment area) over two time periods (current and 30 year future). The findings are used to inform recommendations both on the approaches employed to undertake ES
assessments and the development of an offset scheme for Alberta.
Figure 2-2 Ecosystem service assessment approach
Specific approaches for each of the ES for which assessments were complete are described below. These descriptions provide the technical details on the models that were employed. In the context of the figure above, the proceeding text provides details on how the “Analysis of Future States” was undertaken for each of the ES.
2.2.1 Timber Supply Assessment Approach
The impact of restoration activities on the availability of merchantable growing stock was analyzed at both the Algar scale and the treatment line scale. Merchantable growing stock is the volume of all trees growing in a forest above a minimum specified utilization standard.29 The first step in the process involved defining the current landscape characteristics including landcover and forest types for the Algar region and the treatment areas. Next,
29 Utilization standard is the log itself and its diameter from the ground or stump height to the top stem. Utilization standards establish the criteria for which stands or trees will be considered merchantable. For more information see: Alberta Timber Harvest Planning and Operating Ground Rules Framework for Renewal. June 2012. Alberta Environment and Sustainable Resource Development. http://esrd.alberta.ca/lands-forests/forest-management/forest-management-planning/documents/TimberHarvest-OperatingGroundRules-Jun2012.pdf
25

TE
AM
SIL
VA
CO
M
Assessing the Ecosystem Service Benefits of the Algar LEAP Project
forest growth projections were leveraged from the LEAP Algar Caribou Restoration Project.30 In that project, a series of forest growth metrics (yield (m3/ha) and height (m)) were developed for different forest types through a detailed literature review and modelling using GYPSY (Growth and Yield Projection System), which was developed by Alberta Environment and Sustainable Resources Development. Detailed descriptions of the methods and analysis used to prepare the growth and yield projections can be found in the Algar Caribou Habitat
Restoration Program: Strategic to Tactical Plan.31
The landscape and forest growth projections were then input into a spatial deterministic simulation model that was developed using the Woodstock modelling platform.32 The model was run over a 30-year timeframe for both scenarios (control and restoration) and at both spatial scales (Algar region and treatment areas). Changes in
growing stock inventory were tracked, measured and compared.
2.2.2 Carbon Storage Assessment Approach
The first step in the process of estimating the difference in carbon storage between the control scenario and the restoration scenario was to define the current landscape characteristics including landcover and forest types for the Algar region and the treatment areas. Next, total ecosystem carbon (TEC) stock projections by forest type were leveraged from the LEAP Algar Caribou Restoration Project. In that project, a series of carbon stock curves (tonnes/ha) were developed for different forest types through simulation modelling using the Carbon Budget Model of the Canadian Forest Sector (CBM-CFS3).33 Base forest growth and yield curves for the area of interest were obtained from the publicly available Detailed Forest Management Plan which Alberta-Pacific Forest Products Inc. submitted to Alberta Environment and Sustainable Resource Development in 2006.34 From this document, local empirical yield curves were used as a base input into the CBM-CFS3 model. Detailed descriptions of the methods and analysis employed to prepare the carbon stock projections can be found in the Algar Caribou Habitat
Restoration Program: Strategic to Tactical Plan.35
The landscape and forest growth projections were then input into the same spatial deterministic simulation model that was developed using the Woodstock modelling platform for the timber supply analysis. The model was run over a 30-year timeframe for both scenarios (control and restoration) and at both spatial scales (Algar
region and treatment areas). Changes to TEC stock inventory were tracked, measured and compared.36
2.2.3 Biodiversity Intactness Assessment Approach
The Alberta Biodiversity Monitoring Institute (ABMI) assessed the expected future increase in biodiversity
intactness in the Algar region resulting from the restoration activities.
30 For more information: COSIA. Caribou Habitat Restoration. http://www.cosia.ca/caribou-habitat-restoration 31 2011. Algar Caribou Habitat Restoration Program: Strategic to Tactical Plan. Oil Sands Leadership Initiative (OSLI). 32 Woodstock is a forest modelling system developed by Remsoft. Woodstock can be used for a wide variety of analyses including wildlife
management, simulation of forest ecosystems and forestry applications. Visit www.remsoft.com for more information on the Woodstock modelling platform.
33 Information on the CBM-CFS3 model itself including how it was developed and what it can be used for can be found on the NRCan website: Natural Resources Canada. Climate Change: Carbon Budget Model. http://www.nrcan.gc.ca/forests/climate-change/13107 34 Alberta-Pacific Forest Industries Inc. 2006. Alberta-Pacific FMA Area Forest Management Plan. Alberta-Pacific Forest Industries Inc. Boyle,
Alberta. 35 2011. Algar Caribou Habitat Restoration Program: Strategic to Tactical Plan. Oil Sands Leadership Initiative (OSLI). 36 Ibid.
26

TE
AM
SIL
VA
CO
M
Assessing the Ecosystem Service Benefits of the Algar LEAP Project
The ABMI’s Biodiversity Intactness Index predicts intactness as a percentage of what would be expected in an undisturbed habitat. An index of 100% indicates that the abundance of the species is what would be expected had there been no human footprint.37 Both decreases and increases in abundance relative to the reference condition
(in which there is no human footprint) reduce intactness.
Current biodiversity intactness (pre-restoration) was assessed using land cover data layers with information on existing vegetation, forest stand age and composition, upland or wetland type, and anthropogenic footprint features.38 Intactness was assessed for individual species and then averaged across all species to obtain an overall measure of biodiversity intactness.
To assess biodiversity intactness at the future state, seismic lines scheduled for treatment were replaced with appropriate vegetation in the land cover layer. The difference between the current state and future state
assessments represents the increase in biodiversity intactness resulting from the restoration activities.
See Habib, T. and Farr, D. for more information on the methodology used to calculate biodiversity intactness in
the 6 townships of the Algar region.39
2.2.4 Water Purification Assessment Approach
To assess water purification services, the HydroGeosim model40 was adapted to the Algar area to test its applicability to assessing restoration actions. It should be noted that HydroGeosim is still technically in the “development” stage and has not yet been formally validated. Consequently, the modelling results presented in this report should be interpreted with caution. HydroGeosim is a spatially explicit simulation model that represents hydrological processes and the interaction with topography and landscape composition. The model is executed in the software Netlogo, and is classified as a complex systems model. Specifically, it is a combined agent-based model, cellular automata, and network model. Each of these model components represents features of the hydrological cycle.41 As is the case with the biodiversity intactness model, in the water purification model it is assumed that the area scheduled for treatment will reach at least 1.2 meters in height at the future state (year
30).
HydroGeosim operates at an average annual time step and has a variable spatial scale. In keeping with current convention on conducting ES and as the figure below demonstrates, the model represents overland flow, stream flow and spatially explicit Nitrogen, Phosphorus, and Total Suspended Solids loading, routing and removal functions. In other words it accounts for the flow of the ES provided by the study area over the landscape. Key
37 Alberta Biodiversity Monitoring Institute. 2013. The status of biodiversity in the Athabasca Oil Sands Area: preliminary assessment 2013. Alberta Biodiversity Monitoring Institute. Edmonton, AB.
38 Habib, T. & Farr, D. 2013. “Current and Future Biodiversity Intactness Assessment of the OSLI LEAP Project”. ABMI: Ecosystem Services Assessment.
39 Habib, T. & Farr, D. 2013. “Current and Future Biodiversity Intactness Assessment of the OSLI LEAP Project”. ABMI: Ecosystem Services Assessment.
40 Heckbert, S. et al. (2013). HydroGeosim: Model Documentation. Alberta Biodiversity Monitoring Institute. 41 For more information on NetLogo and agent-based models see: Railsback, S.F. and V. Grimm (2012). Agent-Based and Individual-Based
Modelling: A Practical Introduction. Princeton University Press.
27

TE
AM
SIL
VA
CO
M
Assessing the Ecosystem Service Benefits of the Algar LEAP Project
pollutant loading data used by the model is based on the work of Donahue.42 For a detailed treatment of the
model processes and mathematical equation within HydroGeosim, see Heckbert et al.43
An important caveat to note at this stage of the water purification model development is that pollutant removal calculations are based on assumed removal efficiencies and should only be interpreted when aggregated to the sub-watershed or watershed level. Pixel-scale representation of removal data should not be used to understand hydrologic processes or inform decision-making. As a result, the model outputs are aggregated over the Algar
region for each of the scenarios (future conditions with restoration, and control scenario with no restoration).
Figure 2-3 Water purification model process
2.2.5 Caribou Habitat Assessment Approach
To begin the ES assessment of caribou habitat, the anthropogenic footprint in the Algar area was measured. To do this, the AESRD caribou zone boundary layer was overlaid with the Algar project area of interest to identify the industrial footprint area that falls within the East Side Athabasca Caribou Range (ESAR). Seismic lines within the caribou range that were scheduled for treatment under the Algar restoration plan were then identified, measured and summed.
As spatially identified by the Environment Canada Recovery Strategy for the Woodland Caribou 44, all 500 meter disturbance buffers were applied to the anthropogenic features in the caribou range. The area treated and the resulting buffer area restored was then summed to determine the post-restoration intact habitat area (ha) within the caribou range. The benchmarked land base, forest growth curves and management options were used as input variables into our Woodstock model in order to project the future forest state. Caribou habitat metrics were estimated at the future state under the restoration scenario and control scenario. In the model it is assumed that
the area scheduled for treatment will reach restoration height (1.2 m) at the future state.
42 Donahue, W. (2013). Determining Appropriate Nutrient and Sediment Loading Coefficients for Modeling Effects of Changes in Landuse and Landcover in Alberta Watersheds. Water Matters Society of Alberta.
43 Heckbert, S. et al. (2013). HydroGeosim: Model Documentation. Alberta Biodiversity Monitoring Institute. 44 “Recovery Strategy for the Woodland Caribou (Rangifer tarandus caribou), Boreal population, in Canada”. 2012. Environmental Canada.
Species at Risk Act: Recovery Strategy Series.
Stream flow routing
Overland flow routing
Runoff and pollutant generation
Precipitation
28
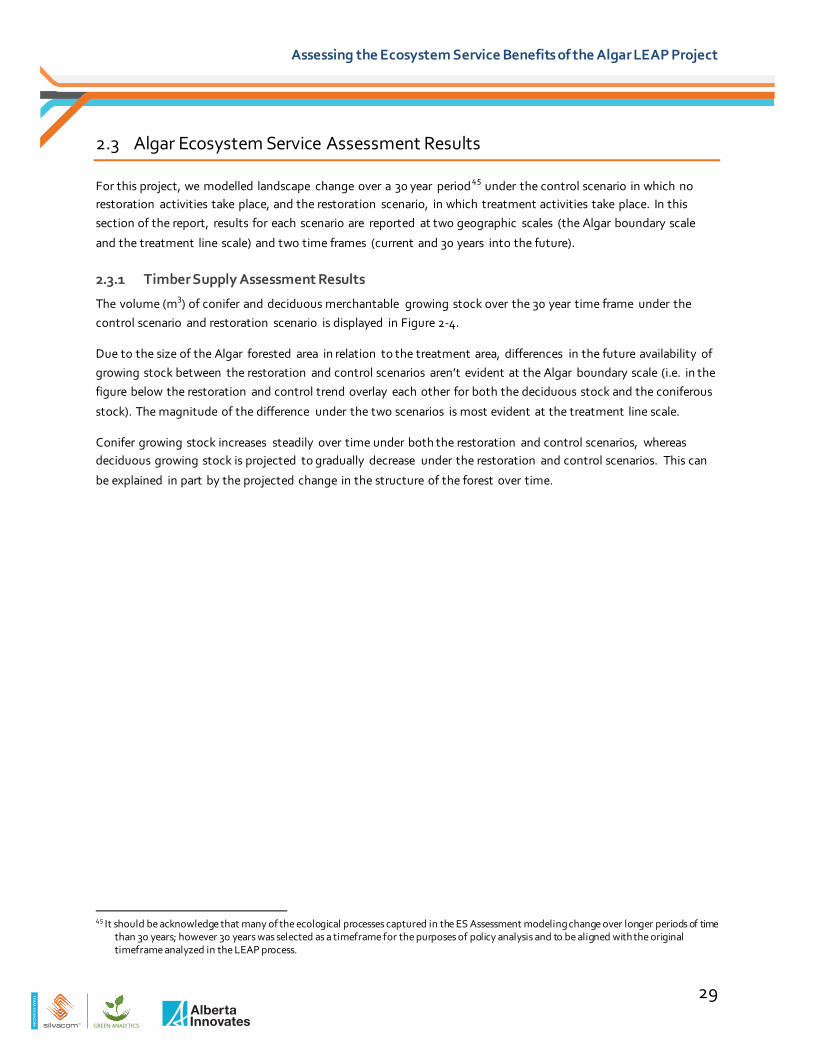
TE
AM
SIL
VA
CO
M
Assessing the Ecosystem Service Benefits of the Algar LEAP Project
2.3 Algar Ecosystem Service Assessment Results
For this project, we modelled landscape change over a 30 year period45 under the control scenario in which no restoration activities take place, and the restoration scenario, in which treatment activities take place. In this section of the report, results for each scenario are reported at two geographic scales (the Algar boundary scale
and the treatment line scale) and two time frames (current and 30 years into the future).
2.3.1 Timber Supply Assessment Results
The volume (m3) of conifer and deciduous merchantable growing stock over the 30 year time frame under the control scenario and restoration scenario is displayed in Figure 2-4.
Due to the size of the Algar forested area in relation to the treatment area, differences in the future availability of growing stock between the restoration and control scenarios aren’t evident at the Algar boundary scale (i.e. in the figure below the restoration and control trend overlay each other for both the deciduous stock and the coniferous
stock). The magnitude of the difference under the two scenarios is most evident at the treatment line scale.
Conifer growing stock increases steadily over time under both the restoration and control scenarios, whereas deciduous growing stock is projected to gradually decrease under the restoration and control scenarios. This can
be explained in part by the projected change in the structure of the forest over time.
45 It should be acknowledge that many of the ecological processes captured in the ES Assessment modeling change over longer periods of time than 30 years; however 30 years was selected as a timeframe for the purposes of policy analysis and to be aligned with the original timeframe analyzed in the LEAP process.
29
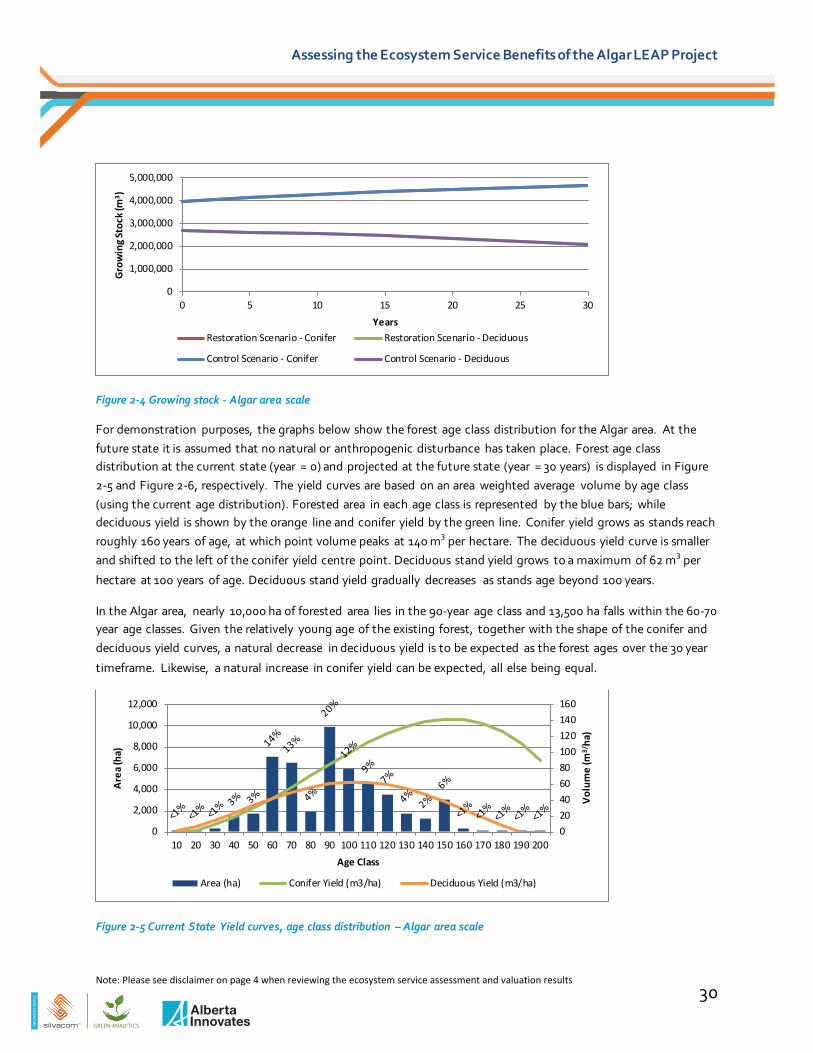
TE
AM
SIL
VA
CO
M
Assessing the Ecosystem Service Benefits of the Algar LEAP Project
Figure 2-4 Growing stock - Algar area scale
For demonstration purposes, the graphs below show the forest age class distribution for the Algar area. At the future state it is assumed that no natural or anthropogenic disturbance has taken place. Forest age class distribution at the current state (year = 0) and projected at the future state (year = 30 years) is displayed in Figure 2-5 and Figure 2-6, respectively. The yield curves are based on an area weighted average volume by age class (using the current age distribution). Forested area in each age class is represented by the blue bars; while deciduous yield is shown by the orange line and conifer yield by the green line. Conifer yield grows as stands reach roughly 160 years of age, at which point volume peaks at 140 m3 per hectare. The deciduous yield curve is smaller and shifted to the left of the conifer yield centre point. Deciduous stand yield grows to a maximum of 62 m3 per
hectare at 100 years of age. Deciduous stand yield gradually decreases as stands age beyond 100 years.
In the Algar area, nearly 10,000 ha of forested area lies in the 90-year age class and 13,500 ha falls within the 60-70 year age classes. Given the relatively young age of the existing forest, together with the shape of the conifer and deciduous yield curves, a natural decrease in deciduous yield is to be expected as the forest ages over the 30 year
timeframe. Likewise, a natural increase in conifer yield can be expected, all else being equal.
Figure 2-5 Current State Yield curves, age class distribution – Algar area scale
0
1,000,000
2,000,000
3,000,000
4,000,000
5,000,000
0 5 10 15 20 25 30
Gro
win
g St
ock
(m3 )
Years Restoration Scenario - Conifer Restoration Scenario - Deciduous
Control Scenario - Conifer Control Scenario - Deciduous
020406080100120140160
0
2,000
4,000
6,000
8,000
10,000
12,000
10 20 30 40 50 60 70 80 90 100 110 120 130 140 150 160 170 180 190 200
Vol
ume
(m3/
ha)
Are
a (h
a)
Age Class
Area (ha) Conifer Yield (m3/ha) Deciduous Yield (m3/ha)
30
Note: Please see disclaimer on page 4 when reviewing the ecosystem service assessment and valuation results
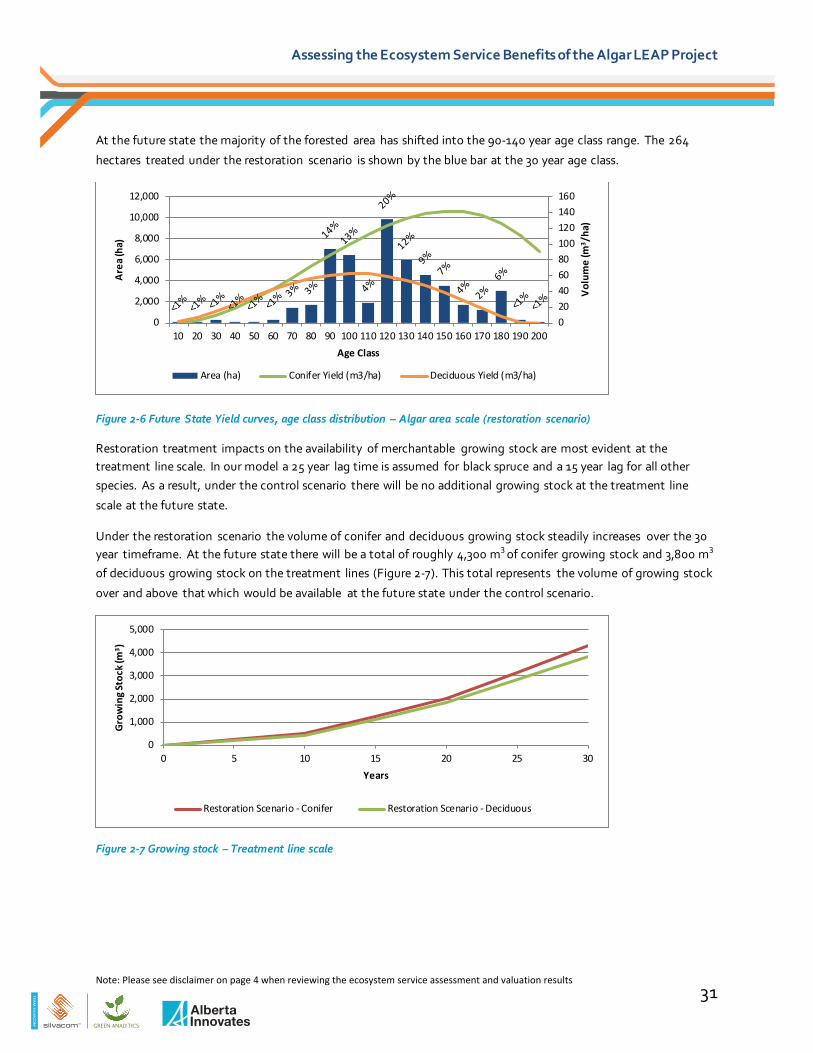
TE
AM
SIL
VA
CO
M
Assessing the Ecosystem Service Benefits of the Algar LEAP Project
At the future state the majority of the forested area has shifted into the 90-140 year age class range. The 264
hectares treated under the restoration scenario is shown by the blue bar at the 30 year age class.
Figure 2-6 Future State Yield curves, age class distribution – Algar area scale (restoration scenario)
Restoration treatment impacts on the availability of merchantable growing stock are most evident at the treatment line scale. In our model a 25 year lag time is assumed for black spruce and a 15 year lag for all other species. As a result, under the control scenario there will be no additional growing stock at the treatment line
scale at the future state.
Under the restoration scenario the volume of conifer and deciduous growing stock steadily increases over the 30 year timeframe. At the future state there will be a total of roughly 4,300 m3 of conifer growing stock and 3,800 m3
of deciduous growing stock on the treatment lines (Figure 2-7). This total represents the volume of growing stock
over and above that which would be available at the future state under the control scenario.
Figure 2-7 Growing stock – Treatment line scale
020406080100120140160
0
2,000
4,000
6,000
8,000
10,000
12,000
10 20 30 40 50 60 70 80 90 100 110 120 130 140 150 160 170 180 190 200
Vol
ume
(m3 /
ha)
Are
a (h
a)
Age Class
Area (ha) Conifer Yield (m3/ha) Deciduous Yield (m3/ha)
0
1,000
2,000
3,000
4,000
5,000
0 5 10 15 20 25 30
Gro
win
g St
ock
(m3 )
Years
Restoration Scenario - Conifer Restoration Scenario - Deciduous
31
Note: Please see disclaimer on page 4 when reviewing the ecosystem service assessment and valuation results

TE
AM
SIL
VA
CO
M
Assessing the Ecosystem Service Benefits of the Algar LEAP Project
2.3.2 Carbon Storage Assessment Results
Total ecosystem carbon curves were generated using the adjusted volume projection curves and the Carbon Budget Model from the Canadian Forest Service. Total Ecosystem Carbon decreases under both scenarios at the Algar boundary scale as a result of the changing forest age class structure over the 30 year timeframe.
Figure 2-8 Total ecosystem carbon - Algar area scale
For demonstration purposes, Figure 2-9 displays the total ecosystem carbon curve in relation to the current forest age class structure. Carbon stocks, measured in tonnes per hectare, are projected to increase as forested area approaches age 110, after which point they are expected to gradually decrease as forested area surpasses the 110 year peak. Given that the significant portion of forested area in Algar will be greater than 110 years of age at the
future state, carbon stocks within the Algar area are projected to experience a downward trend overall.
Figure 2-9 Current State Carbon curve, age class distribution – Algar area scale
At the future state, under the restoration scenario, a significant portion of forested area in Algar will be older than 110 years of age and therefore associated with a lower level of carbon stored on the ground and in the trees (Figure 2-10). At the future state it is assumed that no natural or anthropogenic disturbance has taken place. The
264 hectares treated under the restoration scenario is represented at the 30 year age class.
15,600
15,650
15,700
15,750
15,800
15,850
15,900
0 5 10 15 20 25 30
Tonn
es (1
,000
's)
Years
Restoration Scenario Control Scenario
050100150200250300350400
0
2,000
4,000
6,000
8,000
10,000
12,000
10 20 30 40 50 60 70 80 90 100 110 120 130 140 150 160 170 180 190 200
Carb
on (t
onne
s/ha
)
Are
a (h
a)
Age Class
Area (ha) Total Ecosystem Carbon (tonnes/ha)
32
Note: Please see disclaimer on page 4 when reviewing the ecosystem service assessment and valuation results
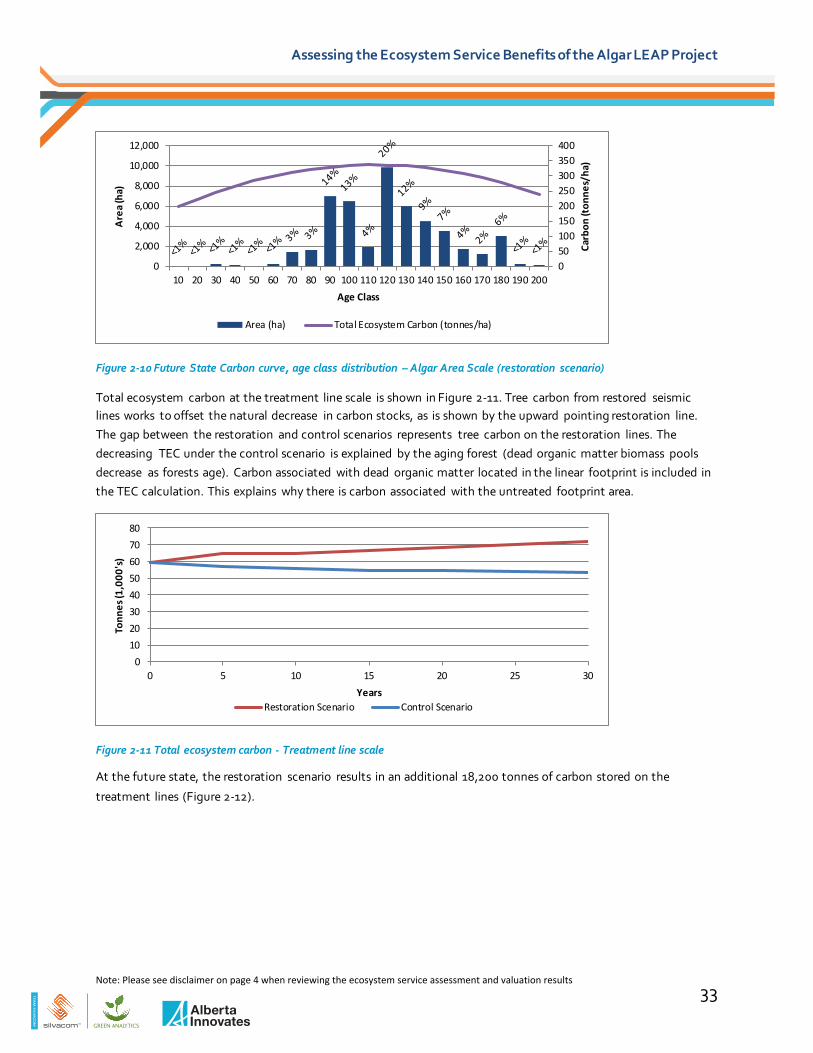
TE
AM
SIL
VA
CO
M
Assessing the Ecosystem Service Benefits of the Algar LEAP Project
Figure 2-10 Future State Carbon curve, age class distribution – Algar Area Scale (restoration scenario)
Total ecosystem carbon at the treatment line scale is shown in Figure 2-11. Tree carbon from restored seismic lines works to offset the natural decrease in carbon stocks, as is shown by the upward pointing restoration line. The gap between the restoration and control scenarios represents tree carbon on the restoration lines. The decreasing TEC under the control scenario is explained by the aging forest (dead organic matter biomass pools decrease as forests age). Carbon associated with dead organic matter located in the linear footprint is included in the TEC calculation. This explains why there is carbon associated with the untreated footprint area.
Figure 2-11 Total ecosystem carbon - Treatment line scale
At the future state, the restoration scenario results in an additional 18,200 tonnes of carbon stored on the
treatment lines (Figure 2-12).
050100150200250300350400
0
2,000
4,000
6,000
8,000
10,000
12,000
10 20 30 40 50 60 70 80 90 100 110 120 130 140 150 160 170 180 190 200
Carb
on (t
onne
s/ha
)
Are
a (h
a)
Age Class
Area (ha) Total Ecosystem Carbon (tonnes/ha)
01020304050607080
0 5 10 15 20 25 30
Tonn
es (1
,000
's)
Years Restoration Scenario Control Scenario
33
Note: Please see disclaimer on page 4 when reviewing the ecosystem service assessment and valuation results
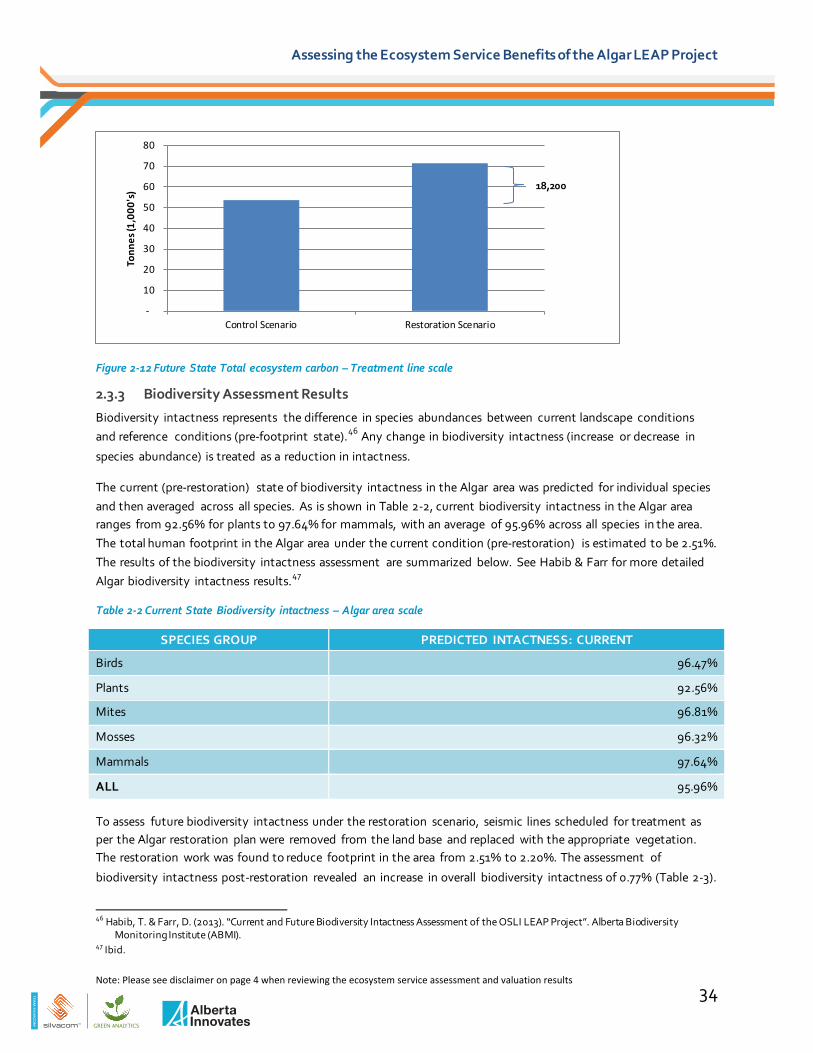
TE
AM
SIL
VA
CO
M
Assessing the Ecosystem Service Benefits of the Algar LEAP Project
Figure 2-12 Future State Total ecosystem carbon – Treatment line scale
2.3.3 Biodiversity Assessment Results
Biodiversity intactness represents the difference in species abundances between current landscape conditions and reference conditions (pre-footprint state).46 Any change in biodiversity intactness (increase or decrease in
species abundance) is treated as a reduction in intactness.
The current (pre-restoration) state of biodiversity intactness in the Algar area was predicted for individual species and then averaged across all species. As is shown in Table 2-2, current biodiversity intactness in the Algar area ranges from 92.56% for plants to 97.64% for mammals, with an average of 95.96% across all species in the area. The total human footprint in the Algar area under the current condition (pre-restoration) is estimated to be 2.51%. The results of the biodiversity intactness assessment are summarized below. See Habib & Farr for more detailed Algar biodiversity intactness results.47
Table 2-2 Current State Biodiversity intactness – Algar area scale
SPECIES GROUP PREDICTED INTACTNESS: CURRENT
Birds 96.47%
Plants 92.56%
Mites 96.81%
Mosses 96.32%
Mammals 97.64%
ALL 95.96%
To assess future biodiversity intactness under the restoration scenario, seismic lines scheduled for treatment as per the Algar restoration plan were removed from the land base and replaced with the appropriate vegetation. The restoration work was found to reduce footprint in the area from 2.51% to 2.20%. The assessment of
biodiversity intactness post-restoration revealed an increase in overall biodiversity intactness of 0.77% (Table 2-3).
46 Habib, T. & Farr, D. (2013). “Current and Future Biodiversity Intactness Assessment of the OSLI LEAP Project”. Alberta Biodiversity Monitoring Institute (ABMI).
47 Ibid.
-
10
20
30
40
50
60
70
80
Control Scenario Restoration Scenario
Tonn
es (1
,000
's) 18,200
34
Note: Please see disclaimer on page 4 when reviewing the ecosystem service assessment and valuation results

TE
AM
SIL
VA
CO
M
Assessing the Ecosystem Service Benefits of the Algar LEAP Project
Table 2-3 Post-restoration change in Biodiversity intactness – Algar area scale
SPECIES GROUP CHANGE IN PREDICTED INTACTNESS
Birds 0.87%
Plants 1.01%
Mites 0.79%
Mosses 0.80%
Mammals 0.37%
ALL 0.77%
At first glance the improvement in biodiversity intactness may appear small. However, it is important to interpret the results in conjunction with the proportion of footprint reduced in the Algar region. Given the low levels of observed footprint in the Algar region, the restoration activities only reduce the proportion of footprint in the area by 0.31%. Therefore, when interpreted in relation to the decrease in footprint area, the 0.77% increase in
biodiversity intactness resulting from the restoration activities becomes particularly noteworthy.
2.3.4 Water Purification Assessment Results
As was noted earlier, the model used to assess the change in water purification resulting from the Algar restoration accounts for overland water flow, stream water flow and spatially explicit nitrogen (N), phosphorus (P), total suspended solids (TSS) loading, routing and removal functions. Figure 2-13 and Figure 2-14 demonstrate
pollutant loading results for phosphorus, nitrogen, and total suspended sediments generated in the Algar region.
Figure 2-13 Total phosphorus and nitrogen loading – Algar area scale
0
5,000
10,000
15,000
20,000
25,000
Baseline - Pre-Restoration No Restoration - FutureState (30 years)
With Restoration - FutureState (30 years)
Load
ings
(Kg/
yea
r)
Phosphorus Loading Nitrogen Loading
35
Note: Please see disclaimer on page 4 when reviewing the ecosystem service assessment and valuation results
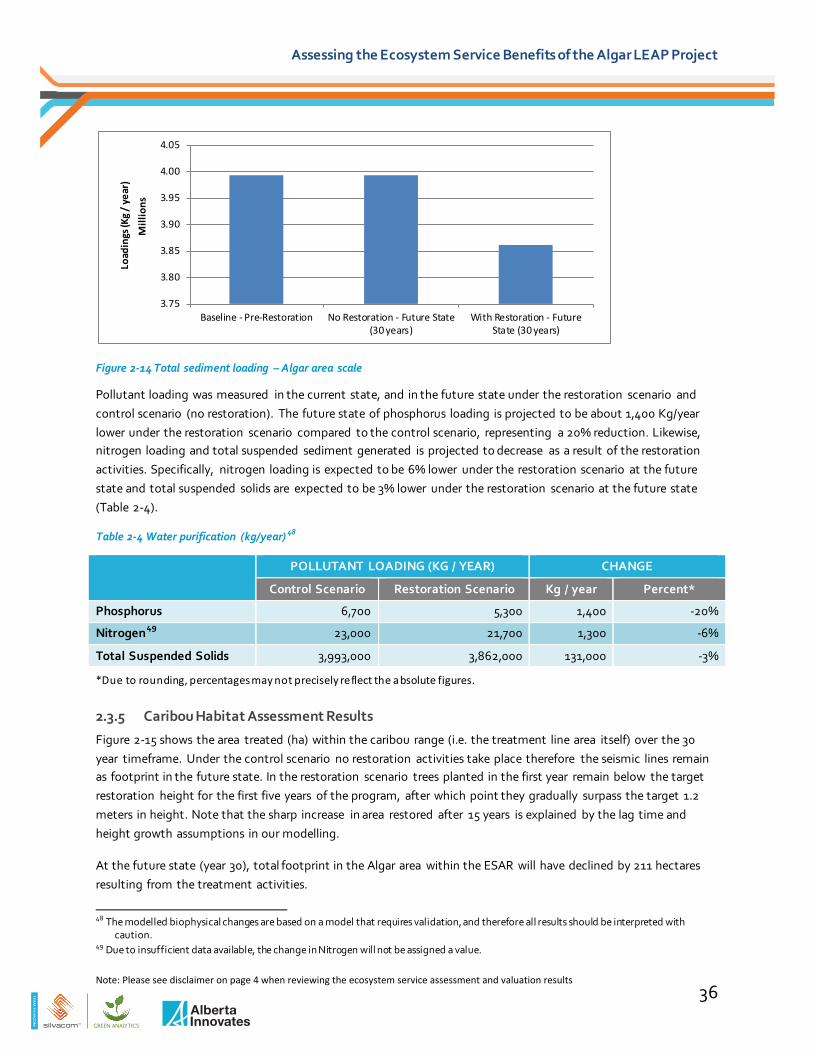
TE
AM
SIL
VA
CO
M
Assessing the Ecosystem Service Benefits of the Algar LEAP Project
Figure 2-14 Total sediment loading – Algar area scale
Pollutant loading was measured in the current state, and in the future state under the restoration scenario and control scenario (no restoration). The future state of phosphorus loading is projected to be about 1,400 Kg/year lower under the restoration scenario compared to the control scenario, representing a 20% reduction. Likewise, nitrogen loading and total suspended sediment generated is projected to decrease as a result of the restoration activities. Specifically, nitrogen loading is expected to be 6% lower under the restoration scenario at the future state and total suspended solids are expected to be 3% lower under the restoration scenario at the future state (Table 2-4).
Table 2-4 Water purification (kg/year) 48
POLLUTANT LOADING (KG / YEAR) CHANGE
Control Scenario Restoration Scenario Kg / year Percent*
Phosphorus 6,700 5,300 1,400 -20%
Nitrogen49 23,000 21,700 1,300 -6%
Total Suspended Solids 3,993,000 3,862,000 131,000 -3%
*Due to rounding, percentages may not precisely reflect the absolute figures.
2.3.5 Caribou Habitat Assessment Results
Figure 2-15 shows the area treated (ha) within the caribou range (i.e. the treatment line area itself) over the 30 year timeframe. Under the control scenario no restoration activities take place therefore the seismic lines remain as footprint in the future state. In the restoration scenario trees planted in the first year remain below the target restoration height for the first five years of the program, after which point they gradually surpass the target 1.2 meters in height. Note that the sharp increase in area restored after 15 years is explained by the lag time and height growth assumptions in our modelling.
At the future state (year 30), total footprint in the Algar area within the ESAR will have declined by 211 hectares resulting from the treatment activities.
48 The modelled biophysical changes are based on a model that requires validation, and therefore all results should be interpreted with caution.
49 Due to insufficient data available, the change in Nitrogen will not be assigned a value.
3.75
3.80
3.85
3.90
3.95
4.00
4.05
Baseline - Pre-Restoration No Restoration - Future State(30 years)
With Restoration - FutureState (30 years)
Load
ings
(Kg
/ ye
ar)
Mill
ions
36
Note: Please see disclaimer on page 4 when reviewing the ecosystem service assessment and valuation results
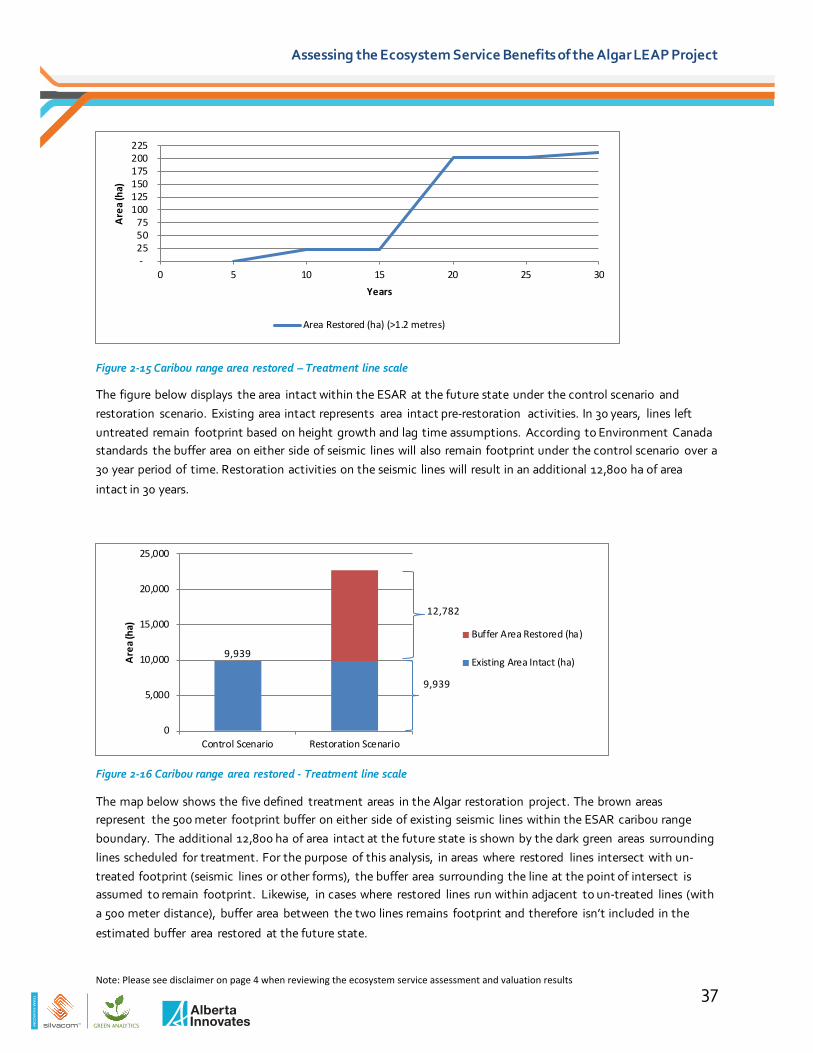
TE
AM
SIL
VA
CO
M
Assessing the Ecosystem Service Benefits of the Algar LEAP Project
Figure 2-15 Caribou range area restored – Treatment line scale
The figure below displays the area intact within the ESAR at the future state under the control scenario and restoration scenario. Existing area intact represents area intact pre-restoration activities. In 30 years, lines left untreated remain footprint based on height growth and lag time assumptions. According to Environment Canada standards the buffer area on either side of seismic lines will also remain footprint under the control scenario over a 30 year period of time. Restoration activities on the seismic lines will result in an additional 12,800 ha of area
intact in 30 years.
Figure 2-16 Caribou range area restored - Treatment line scale
The map below shows the five defined treatment areas in the Algar restoration project. The brown areas represent the 500 meter footprint buffer on either side of existing seismic lines within the ESAR caribou range boundary. The additional 12,800 ha of area intact at the future state is shown by the dark green areas surrounding lines scheduled for treatment. For the purpose of this analysis, in areas where restored lines intersect with un-treated footprint (seismic lines or other forms), the buffer area surrounding the line at the point of intersect is assumed to remain footprint. Likewise, in cases where restored lines run within adjacent to un-treated lines (with a 500 meter distance), buffer area between the two lines remains footprint and therefore isn’t included in the
estimated buffer area restored at the future state.
- 25 50 75
100 125 150 175 200 225
0 5 10 15 20 25 30
Are
a (h
a)
Years
Area Restored (ha) (>1.2 metres)
9,939
9,939
12,782
0
5,000
10,000
15,000
20,000
25,000
Control Scenario Restoration Scenario
Are
a (h
a)
Buffer Area Restored (ha)
Existing Area Intact (ha)
37
Note: Please see disclaimer on page 4 when reviewing the ecosystem service assessment and valuation results

1
5
2
4
3
AlgarLake
Twp
82
Twp
82
Twp
83
Twp
83
Twp
84
Twp
84
Twp
85
Twp
85
Twp
86
Twp
86
Twp
87
Twp
87
Rge 15
Rge 15
Rge 16
Rge 16
Rge 17
Rge 17
Rge 18
Rge 18
THIS MAP WAS DEVELOPED USING AVAILABLE INFORMATION AND MAY NOT ACCURATELY REPRESENT THE LOCATION,DEFINITION OR DISTRIBUTION OF LAND BASE FEATURES.
Map Version: 1.00Original Scale: 1:160,000Map Date: May 02, 2014Map Production: Silvacom Ltd.Silvacom Ref: S-050Map File: ..\algar\caribou_disturbance.mxd
COPYRIGHT © 2014 SILVACOM LTD. ANY USE, DUPLICATION OR DISTRIBUTION WITHOUTPERMISSION IS PROHIBITED
0 2.5 51.25
Kilometres
LEGEND
! ! ! ! ! ! ! ! ! ! ! ! ! ! ! ! ! ! ! ! ! ! ! ! ! ! ! ! ! ! ! ! ! ! ! !
Primary - PavedSecondary - PavedPrimary - GravelSecondary - GravelUnimprovedTruck TrailWinter Road
TownshipLake / RiverStream - PermanentStream - Recurring Stream - IndefiniteWildland ParkAlgar Restoration Area
DISPOSITIONLOCMSLPLA
PLANIMETRIC LEGEND
TREATMENT YEARYEAR 1YEAR 2YEAR 3YEAR 4YEAR 5
ALGAR AREA RESTORATIONCARIBOU FOOTPRINTPOST TREATMENT - YEARS 1-5
Feasible for Restoration
Treated Line
East Side Athabasca RiverAnthropogenic and 40 YearFire Disturbance Footprint
Restoration Footprint
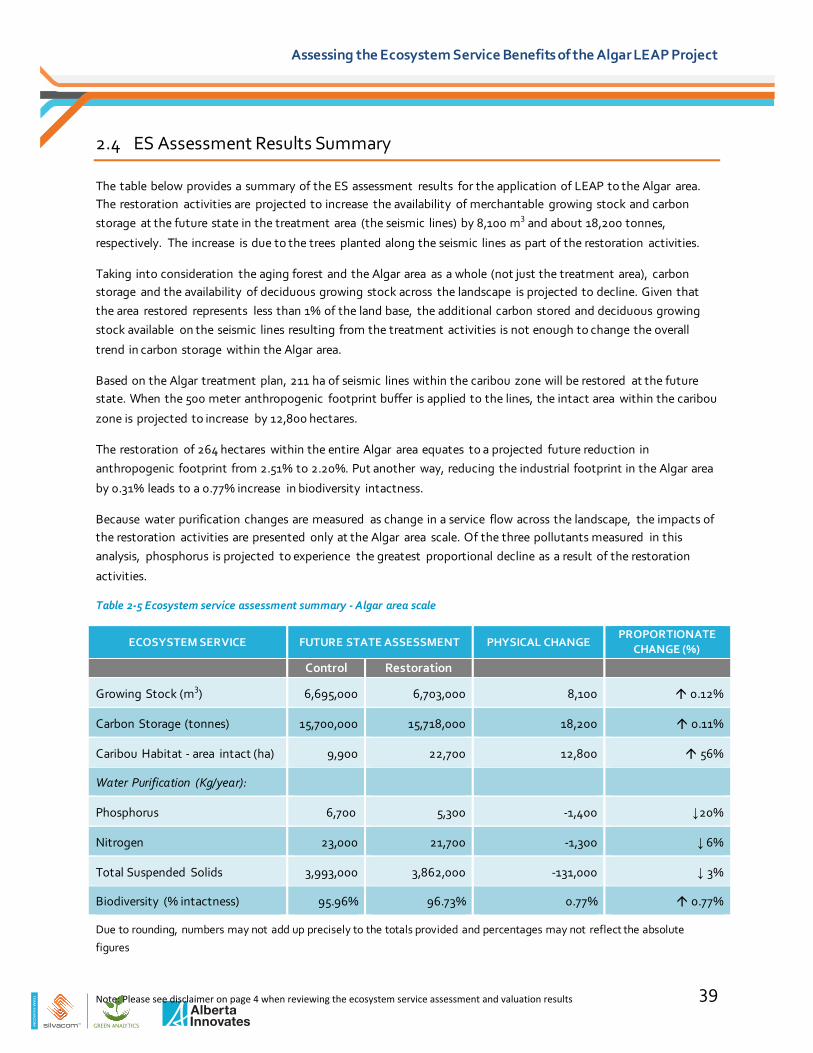
TE
AM
SIL
VA
CO
M
Assessing the Ecosystem Service Benefits of the Algar LEAP Project
2.4 ES Assessment Results Summary
The table below provides a summary of the ES assessment results for the application of LEAP to the Algar area. The restoration activities are projected to increase the availability of merchantable growing stock and carbon storage at the future state in the treatment area (the seismic lines) by 8,100 m3 and about 18,200 tonnes,
respectively. The increase is due to the trees planted along the seismic lines as part of the restoration activities.
Taking into consideration the aging forest and the Algar area as a whole (not just the treatment area), carbon storage and the availability of deciduous growing stock across the landscape is projected to decline. Given that the area restored represents less than 1% of the land base, the additional carbon stored and deciduous growing stock available on the seismic lines resulting from the treatment activities is not enough to change the overall
trend in carbon storage within the Algar area.
Based on the Algar treatment plan, 211 ha of seismic lines within the caribou zone will be restored at the future state. When the 500 meter anthropogenic footprint buffer is applied to the lines, the intact area within the caribou
zone is projected to increase by 12,800 hectares.
The restoration of 264 hectares within the entire Algar area equates to a projected future reduction in anthropogenic footprint from 2.51% to 2.20%. Put another way, reducing the industrial footprint in the Algar area
by 0.31% leads to a 0.77% increase in biodiversity intactness.
Because water purification changes are measured as change in a service flow across the landscape, the impacts of the restoration activities are presented only at the Algar area scale. Of the three pollutants measured in this analysis, phosphorus is projected to experience the greatest proportional decline as a result of the restoration
activities.
Table 2-5 Ecosystem service assessment summary - Algar area scale
ECOSYSTEM SERVICE FUTURE STATE ASSESSMENT PHYSICAL CHANGE PROPORTIONATE
CHANGE (%)
Control Restoration
Growing Stock (m3) 6,695,000 6,703,000 8,100 0.12%
Carbon Storage (tonnes) 15,700,000 15,718,000 18,200 0.11%
Caribou Habitat - area intact (ha) 9,900 22,700 12,800 56%
Water Purification (Kg/year):
Phosphorus 6,700 5,300 -1,400 ↓20%
Nitrogen 23,000 21,700 -1,300 ↓ 6%
Total Suspended Solids 3,993,000 3,862,000 -131,000 ↓ 3%
Biodiversity (% intactness) 95.96% 96.73% 0.77% 0.77%
Due to rounding, numbers may not add up precisely to the totals provided and percentages may not reflect the absolute
figures
39 Note: Please see disclaimer on page 4 when reviewing the ecosystem service assessment and valuation results
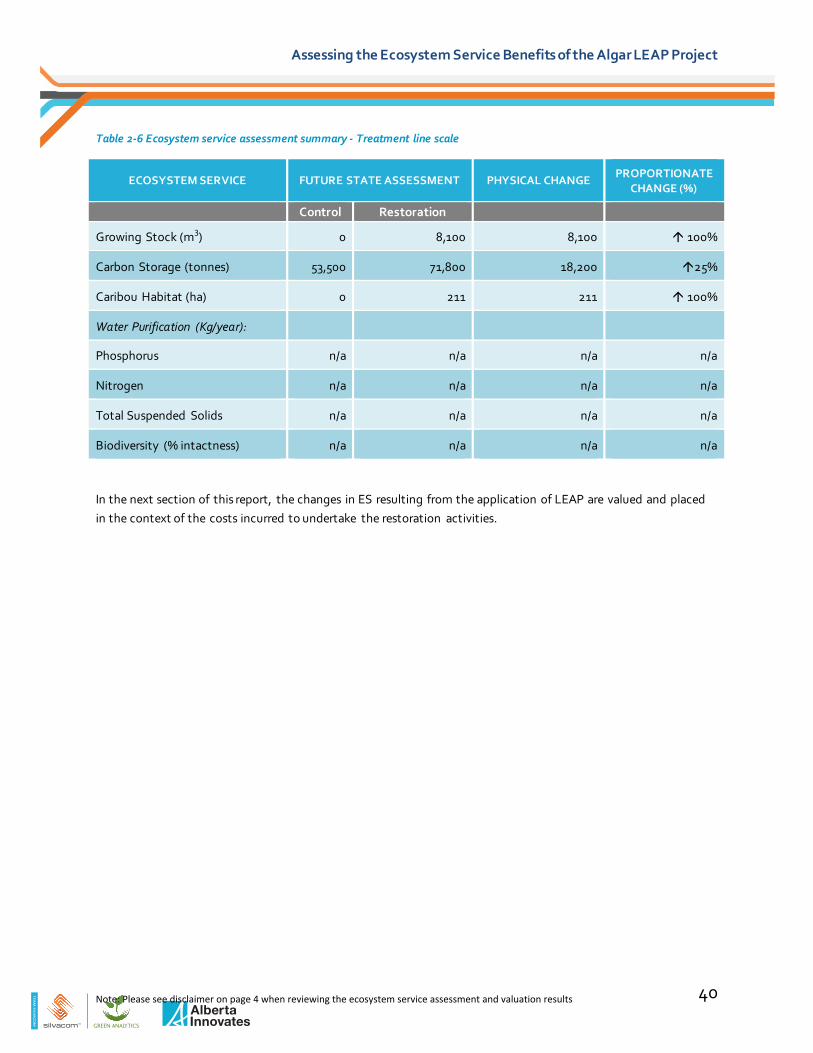
TE
AM
SIL
VA
CO
M
Assessing the Ecosystem Service Benefits of the Algar LEAP Project
Table 2-6 Ecosystem service assessment summary - Treatment line scale
ECOSYSTEM SERVICE FUTURE STATE ASSESSMENT PHYSICAL CHANGE PROPORTIONATE CHANGE (%)
Control Restoration
Growing Stock (m3) 0 8,100 8,100 100%
Carbon Storage (tonnes) 53,500 71,800 18,200 25%
Caribou Habitat (ha) 0 211 211 100%
Water Purification (Kg/year):
Phosphorus n/a n/a n/a n/a
Nitrogen n/a n/a n/a n/a
Total Suspended Solids n/a n/a n/a n/a
Biodiversity (% intactness) n/a n/a n/a n/a
In the next section of this report, the changes in ES resulting from the application of LEAP are valued and placed in the context of the costs incurred to undertake the restoration activities.
40 Note: Please see disclaimer on page 4 when reviewing the ecosystem service assessment and valuation results

TE
AM
SIL
VA
CO
M
Assessing the Ecosystem Service Benefits of the Algar LEAP Project
COST-BENEFIT ANALYSIS 3.This section of the report describes the cost-benefit analysis approach employed in the Algar study as well as the results of that assessment. We begin by providing some background information on the use of CBA.
3.1 What is Cost-Benefit Analysis?
Cost-benefit analysis is an analytical tool (or systematic process) used to calculate and compare the costs and benefits of a project over a given period of time. If the benefits of the project exceed the costs, then a positive net present value will result. Conversely, if the costs outweigh the benefits, the net present value will be negative.
Positive net present values indicate that a project may be profitable or feasible. However, in many cases the benefits associated with a project are not valued in the market. This is the case, for example, with some ecosystem services. To account for the full costs and benefits associated with a particular project thus requires measuring and valuing not just market costs (e.g. those associated with increased timber production) but non-market costs as well (e.g. the carbon storage provided by leaving a forest intact).
3.1.1 Why Conduct a Cost-Benefit Analysis?
There are numerous reasons for undertaking a CBA. Cost-benefit analysis can inform the expected feasibility or profitability of a project. It can be a useful tool for comparing the potential outcomes and trade-offs associated with alternative or competing projects. Also, given its systematic process of calculating and comparing costs and benefits, it provides a useful and convenient tool for incorporating non-market values into the decision-making
process; values that are often over looked when deciding if a project should move forward or not.
3.1.2 Identifying Costs and Benefits
To properly inform the decision making process, it is important that all costs and benefits, including opportunity costs as well as costs associated with social or environmental impacts, be captured in a CBA. In other words, one should capture the full spectrum of both private and public costs and benefits associated with the project under consideration.
Private benefits include the direct revenue that a project accrues. These benefits are generally easy to identify, measure and value. Just as important as private benefits, are the public benefits that may result from a project. Public benefits include any positive results from the project that are outside of the traditional market system, such as improvements in ES (i.e. water quality improvements). The identification, measurement and valuation of public benefits can be relatively more complex than those for private benefits. Nonetheless, there are a number of ways to estimate the monetary value of such benefits including surveys (i.e. asking the public what they are willing to pay to enjoy the public good improvement), looking at similar or surrogate markets and using values from those markets as proxies for the public benefit associated with the project of interest, or by pulling values from previously published studies and applying those estimates (making adjustments where necessary and feasible) to
the improvements realized in the project under consideration.
Private costs include what would be considered the traditional costs of a project such as those associated with setup, construction, salaries, etc. There may also be public costs associated with a project. Public costs are those that are not borne directly by project owners but instead are borne by society at large. This would include, for
41
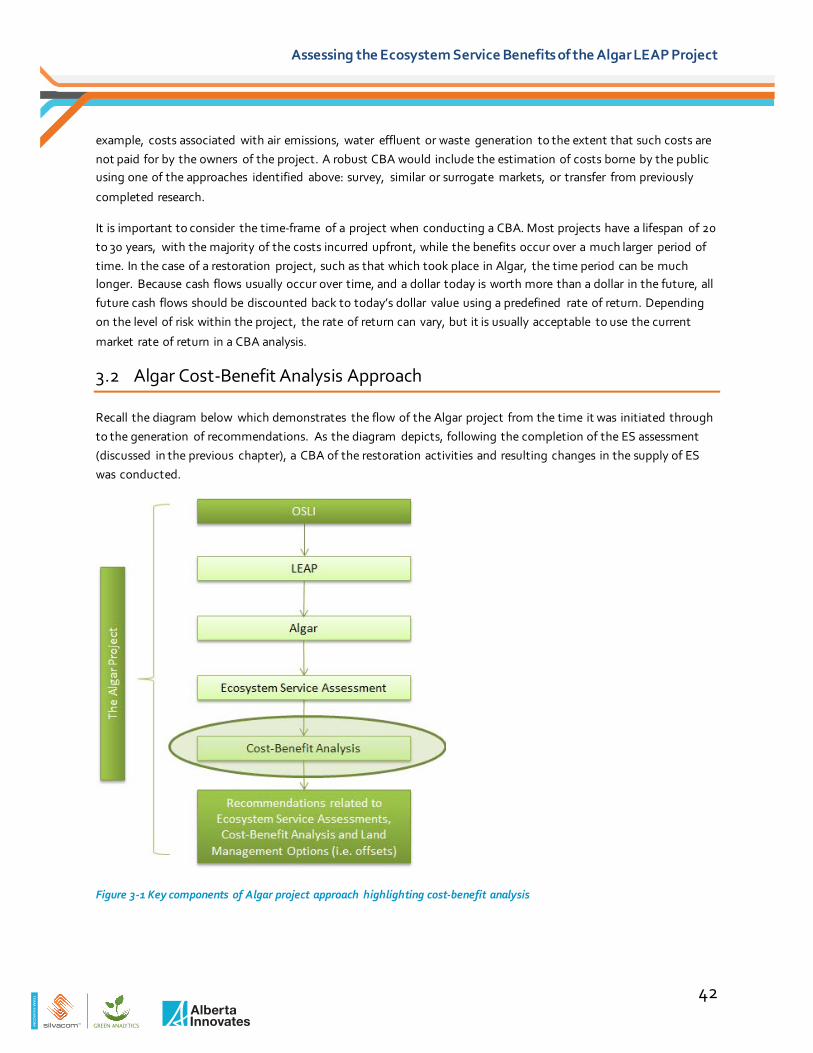
TE
AM
SIL
VA
CO
M
Assessing the Ecosystem Service Benefits of the Algar LEAP Project
example, costs associated with air emissions, water effluent or waste generation to the extent that such costs are not paid for by the owners of the project. A robust CBA would include the estimation of costs borne by the public using one of the approaches identified above: survey, similar or surrogate markets, or transfer from previously
completed research.
It is important to consider the time-frame of a project when conducting a CBA. Most projects have a lifespan of 20 to 30 years, with the majority of the costs incurred upfront, while the benefits occur over a much larger period of time. In the case of a restoration project, such as that which took place in Algar, the time period can be much longer. Because cash flows usually occur over time, and a dollar today is worth more than a dollar in the future, all future cash flows should be discounted back to today’s dollar value using a predefined rate of return. Depending on the level of risk within the project, the rate of return can vary, but it is usually acceptable to use the current
market rate of return in a CBA analysis.
3.2 Algar Cost-Benefit Analysis Approach
Recall the diagram below which demonstrates the flow of the Algar project from the time it was initiated through to the generation of recommendations. As the diagram depicts, following the completion of the ES assessment (discussed in the previous chapter), a CBA of the restoration activities and resulting changes in the supply of ES was conducted.
Figure 3-1 Key components of Algar project approach highlighting cost-benefit analysis
42

TE
AM
SIL
VA
CO
M
Assessing the Ecosystem Service Benefits of the Algar LEAP Project
The approach employed for the CBA conducted in this study followed the general steps involved with the
completion of a typical CBA, which are as follows:50
1. Problem definition 2. Identification of the physical changes resulting from the project 3. Valuation of the changes 4. Discounting of cost and benefit flows
5. Sensitivity analysis
In the context of the Algar case study, the problem definition can be summarized as follows: the impact of restoring 264 ha of anthropogenic footprint through tree planting, site preparation, and the placement of coarse woody debris and the comparison of the restored state with that of a naturally regenerated state at two
geographic scales (the Algar region and the treatment area more precisely) and two time periods.
The physical changes resulting from the natural regeneration and the rate of regeneration given the application of
LEAP were established through the ES assessment and are presented in the previous chapter.
To value the changes in the supply of ES, a combination of approaches were employed with all costs and benefits appropriately discounted over the lifespan of the project.
Sensitivity analysis involved the use of three alternative discount rates to demonstrate the importance and
implications of the choice of rate employed.
3.2.1 Estimating the Costs
Because we are ultimately interested in the value of the ES as determined by the relationship between the supply of and demand for them, the use of market prices is the preferred approach to valuation. Market prices provide the most accurate depiction of the supply of and demand for the ES in the study area as well as the cost of providing those services (i.e. the cost of the restoration). Thus, to the extent that they are available, market prices
were employed in the CBA.
Project cost estimates were obtained from industry and reflect the market cost of the intervention applied to the treatment area. The average cost is $12,250 per kilometre treated. Cost projections have been broken down into two components: field verification and restoration treatment. Field verification involves reconnaissance of each kilometer of seismic line to assign an appropriate treatment prescription to every portion of line. This work is performed to maximize effectiveness of restoration by assigning appropriate, site specific treatments. It is also performed to reduce costs by identifying sections of line that need little or no enhancement of natural regeneration process.
The restoration treatment cost is an average cost per kilometer that encompasses site preparation, planting
and/or seeding and coarse woody material placement.
It must be noted that every restoration project will have significantly varying cost/km depending on many factors
including accessibility of the area, types of treatments required, type of equipment utilized among others.
50 Kuosmanen, T. and Kortelainen, M., 2007. Valuing environmental factors in cost-benefit analysis using data envelopment analysis. Ecological Economics Vol. 62 pg. 56-65
43

TE
AM
SIL
VA
CO
M
Assessing the Ecosystem Service Benefits of the Algar LEAP Project
Table 3-1 Algar restoration treatment costs
RESTORATION TREATMENT COSTS ($/KM)
Activity Average cost ($) per km Area treated upon program completion (km)
Treatment cost (2012 $)
Field verification 2,250 392 882,000
Restoration treatment 10,000 392 3,920,000
Total 12,250 4,802,000
3.2.2 Estimating the Benefits
3.2.2.1 Discount Rates and Sensitivity Analysis
The application of CBA requires the use of a discount rate – the rate at which future costs and benefits are discounted to present day estimates. The choice of what discount rate to employ in a CBA is of the utmost importance. The longer the time period over which costs and benefits are to be measured the more important and impactful the choice of discount rate becomes. The overriding justification over which discount rate to use is rationalized by how analysts expect society to discount benefits or costs. In the context of environmental analysis, the most widely used approach to structuring a discount rate is the Ramsey model.51 In this model, the chosen discount rate for any flow of future benefits reflects: 1) financial market interest rates, 2) the utility of benefits over time, and 3) the rate of relative risk aversion. In context of this project, the discount rate applied to any particular flow of ES will vary based on the above-mentioned parameters. The table below presents the default discount rates employed in this study for each of the relevant ES.
Table 3-2 Discount rates employed in the valuation of ES benefits
ENVIRONMENTAL BENEFIT DISCOUNT RATE COMMENTS
Carbon 2% Estimate reflects the financial market interest rate, constant or increasing utility over time and low risk aversion
Water Purification 2% Estimate reflects the financial market interest rate, constant utility over time and low risk aversion
Biodiversity 8% Estimate reflects the financial market interest rates, constant or increasing utility over time and high relative risk aversion
Caribou habitat 8% Estimate reflects the financial market interest rates, constant or increasing utility over time and high relative risk aversion
Timber Supply 2% Estimate reflects the financial market interest rate, constant or increasing utility over time and low risk aversion
51 Baum, S. 2009. 2009. Description, prescription and the choice of discount rates. Ecological Economics Vol. 69: 197-205.
44
TE
AM
SIL
VA
CO
M
Assessing the Ecosystem Service Benefits of the Algar LEAP Project
To demonstrate the importance and implications of employing alternative discount rates in the context of CBAs in
general and this project more specifically, sensitivity analyses were conducted on the discount rates employed.
3.2.2.2 Ecosystem Service Valuation Approaches
The methods employed to estimate the value of increases in ES resulting from restoration activities were selected in consultation with the Algar Advisory Committee and experts in the field. To the greatest extent possible the approaches employed relied on current convention with respect to undertaking CBA. However, there are few approaches to valuing ES in which assumptions and caveats need not be defined. Thus, to limit the need for assumptions and caveats, the benefits valuation relied as much as possible on the use of market prices. As will be discussed below, this was possible for both carbon storage and timber supply. In other cases, market prices were not available and non-market valuation was necessary. Where non-market valuation was necessary, in consultation with experts and the Algar Advisory Committee, we employed approaches that were deemed the most appropriate and relevant to this study. To convey the degree of uncertainty associated with the non-market valuation, for each of the ES we present a range of value estimates in addition to demonstrating the sensitivity of the results to the use of alternative discount rates. The approaches employed for each ES are described below.
On the benefits side, market prices were applied to the services gained from timber supply and carbon storage. The market price for timber was applied to the physical amount of timber supply associated with the LEAP restoration and control scenarios. We referred to the 2013-2014 Boreal Full Value timber damage assessment (TDA) table for the price of coniferous and deciduous timber supply per hectare treated (see Appendix B). While additional timber supply available on the treated lines was measured in cubic metres for reporting purposes, our Woodstock model also reported timber supply in hectares based on stand cover type, height and density. To match our timber supply assessment results with the Boreal TDA table, we used the estimated timber supply measured in hectares.
A range of market prices for carbon were applied to the results of the ES assessment for carbon storage. The Alberta government’s Emission Reduction Regulations for large industrial emitters specifies a carbon price of $15 per tonne of CO2e. This is equal to $55 per tonne of carbon and represents the lower limit employed in this analysis.52 Environment Canada used a social cost of carbon estimate of $25 per tonne of CO2e ($92/ tonne of carbon) in its Regulatory Impact Analysis Statement on the Renewable Fuels Regulation.53 This value was used as the upper limit for the value of carbon in our analysis. These market values were applied to the amount of carbon
stored in the LEAP restoration and control scenarios.
For the remaining ES (water purification, caribou habitat and biodiversity intactness), a market price is not readily available. A replacement cost approach is often employed to estimate the value of water purification. With such an approach, the water purification services provided by the ecosystem are valued at the costs that would be
incurred to provide the same service with built infrastructure, i.e. a water filtration plant.
52 Specified Gas Emitters Regulation (SGER), under Alberta’s Emission Reduction Regulations, requires 12% reduction in emissions intensity from facilities that emit greater than 100,000 tonnes of CO2e. Compliance may be achieved through emissions performance credits, generation or purchase of offsets or contribution to the Climate Change Technology Fund at a price of $15 per tonne of carbon dioxide equivalent. http://environment.alberta.ca/02486.html Other country programs in comparison have higher prices: Finland at $89.39/t carbon (US dollars) and Sweden at $150/t carbon.
53 Government of Canada. (April 10, 2010). Renewable Fuels Regulations: Regulatory Impact Analysis Statement. http://www.gazette.gc.ca/rp-pr/p1/2010/2010-04-10/html/reg1-eng.html
45
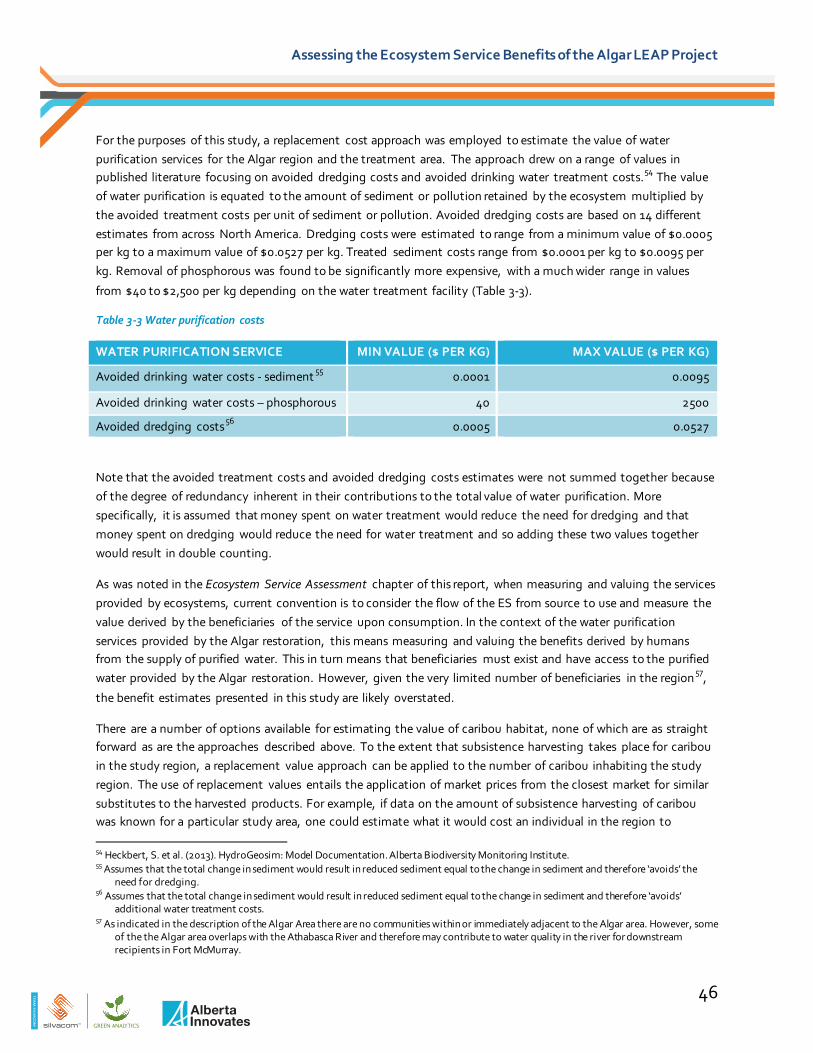
TE
AM
SIL
VA
CO
M
Assessing the Ecosystem Service Benefits of the Algar LEAP Project
For the purposes of this study, a replacement cost approach was employed to estimate the value of water purification services for the Algar region and the treatment area. The approach drew on a range of values in published literature focusing on avoided dredging costs and avoided drinking water treatment costs.54 The value of water purification is equated to the amount of sediment or pollution retained by the ecosystem multiplied by the avoided treatment costs per unit of sediment or pollution. Avoided dredging costs are based on 14 different estimates from across North America. Dredging costs were estimated to range from a minimum value of $0.0005 per kg to a maximum value of $0.0527 per kg. Treated sediment costs range from $0.0001 per kg to $0.0095 per kg. Removal of phosphorous was found to be significantly more expensive, with a much wider range in values
from $40 to $2,500 per kg depending on the water treatment facility (Table 3-3).
Table 3-3 Water purification costs
WATER PURIFICATION SERVICE MIN VALUE ($ PER KG) MAX VALUE ($ PER KG)
Avoided drinking water costs - sediment 55 0.0001 0.0095
Avoided drinking water costs – phosphorous 40 2500
Avoided dredging costs56 0.0005 0.0527
Note that the avoided treatment costs and avoided dredging costs estimates were not summed together because of the degree of redundancy inherent in their contributions to the total value of water purification. More specifically, it is assumed that money spent on water treatment would reduce the need for dredging and that money spent on dredging would reduce the need for water treatment and so adding these two values together would result in double counting.
As was noted in the Ecosystem Service Assessment chapter of this report, when measuring and valuing the services provided by ecosystems, current convention is to consider the flow of the ES from source to use and measure the value derived by the beneficiaries of the service upon consumption. In the context of the water purification services provided by the Algar restoration, this means measuring and valuing the benefits derived by humans from the supply of purified water. This in turn means that beneficiaries must exist and have access to the purified water provided by the Algar restoration. However, given the very limited number of beneficiaries in the region57,
the benefit estimates presented in this study are likely overstated.
There are a number of options available for estimating the value of caribou habitat, none of which are as straight forward as are the approaches described above. To the extent that subsistence harvesting takes place for caribou in the study region, a replacement value approach can be applied to the number of caribou inhabiting the study region. The use of replacement values entails the application of market prices from the closest market for similar substitutes to the harvested products. For example, if data on the amount of subsistence harvesting of caribou was known for a particular study area, one could estimate what it would cost an individual in the region to
54 Heckbert, S. et al. (2013). HydroGeosim: Model Documentation. Alberta Biodiversity Monitoring Institute. 55 Assumes that the total change in sediment would result in reduced sediment equal to the change in sediment and therefore ‘avoids’ the
need for dredging. 56 Assumes that the total change in sediment would result in reduced sediment equal to the change in sediment and therefore ‘avoids’
additional water treatment costs. 57 As indicated in the description of the Algar Area there are no communities within or immediately adjacent to the Algar area. However, some
of the the Algar area overlaps with the Athabasca River and therefore may contribute to water quality in the river for downstream recipients in Fort McMurray.
46
TE
AM
SIL
VA
CO
M
Assessing the Ecosystem Service Benefits of the Algar LEAP Project
purchase the same amount of meat in the market. An alternative route is to sum expenditures related to wildlife viewing or hunting as a reflection of the value associated with caribou habitat. One could also apply an estimate for willingness to pay for conservation of caribou habitat either by surveying the beneficiaries of the service or by transferring a value from a previously completed study. It is important to note that each of these approaches has their own strengths and challenges. Moreover, in many situations, such as the case with caribou habitat and
biodiversity; there is not one correct approach for estimating benefits.
Through discussions with the Algar Project Advisory Committee and a number of subject matters experts, it was decided that for this analysis two separate approaches would be employed to estimate the benefit of caribou habitat resulting from the restoration activities. A number of factors, including the availability of data, served as a
guide for selecting the most appropriate approaches.
The first approach involved the use of an aggregated estimate of household willingness to pay for caribou conservation in Alberta. A 2012 study by Harper estimated the amount, per year, survey respondents would be willing to pay for caribou conservation. According to the study, respondents were willing to pay, on average, $184.02 per household per year to move from two self-sustaining caribou herds to three self-sustaining herds.58 For the purposes of this study, Harpers estimate of WTP was aggregated for the province of Alberta by multiplying the household WTP by the number of households in Alberta.
In order to estimate the value of the area restored and the buffer area intact, a number of steps were followed. First, for the purpose of this analysis the additional self-sustaining herd associated with a household WTP of $184.02 was assumed to reside within the East Side Athabasca Caribou Range (ESAR). Next, the household WTP was pro-rated to the Algar region. This involved calculating the per-hectare household WTP across the ESAR and then multiplying it by the number of households in Alberta. With the estimated provincial WTP/year per hectare for the ESAR in hand, we were able to obtain an estimate of the value of the area restored based on the results of
Harper’s WTP study.
To approximate the value of the restoration at the treatment line scale we multiplied the estimated provincial WTP/year per hectare by the area restored – 211 hectares.59 Similarly, to approximate the value of restoration for the additional area within the caribou zone we multiplied the provincial WTP/year per hectare by the buffer area
restored – 12,800 hectares.
For the purpose of this analysis it is assumed that society values all caribou herds in the boreal equally. Another important assumption when aggregating household WTP to a provincial level is that the sample of survey respondents in Harper’s study is representative of the Alberta population. Finally, it is assumed that households in Alberta are willing to pay for non-footprint area (area restored). In other words, only once the seismic lines reach target height of restoration can the estimated benefit to caribou habitat be estimated. With that assumption in place, in this analysis the household payments would commence at year 30 (the point at which all area treated would have reached the 1.2 meter restoration height).
58 Harper, Dana. 2012. “Analyzing the Economic Benefit of Woodland Caribou Conservation in Alberta”. MSc Thesis. University of Alberta. 59 The remaining 53 hectares scheduled for treatment in the Algar area fall outside of the caribou zone boundary.
47
TE
AM
SIL
VA
CO
M
Assessing the Ecosystem Service Benefits of the Algar LEAP Project
There is considerable controversy over whether contingent valuation studies, such as the Harper study cited above, adequately measure an individual’s willingness to pay for changes in ES. Researchers argue that there is a fundamental difference in the way that people make hypothetical decisions relative to the way they make actual decisions and that the estimates such as WTP are consistently high. This and other issues related to the use of a
contingent valuation method are discussed in Carson et al.60
Despite the limitations associated with CVM, in the absence of market prices the results of Harper’s study were
deemed a reasonable estimate from which to approximate the value of restored caribou habitat in the Algar area.
The second approach employed to assess the value of caribou habitat involved estimating the opportunity cost of habitat conservation as a proxy for the benefit of restoration activities to caribou habitat. Opportunity costs can be defined as any benefit generated by alternative land use which, in the context of this case study, are foregone
due to conservation of caribou habitat (or biodiversity intactness, as described below).61
In this analysis, the net present value (NPV) of resources on the land represents the opportunity cost of conserving habitat. The logic behind this calculation is as follows. If we assume that maintaining / protecting caribou habitat comes with the opportunity cost of oil and gas development and society chooses caribou habitat over
development, then we must value caribou habitat at least as much as the value of forgone development.
To estimate the opportunity cost of conserving the restored area of the Algar region, land values that take into consideration the total value of all resources (gas, oil, bitumen and forestry) were obtained at a township level from Hauer et al.62 The NPV per township was averaged across all townships within the region boundary. Hauer et al. estimates that under a reasonable set of assumptions about available drilling and processing capacities, the value of resources would be closer to 20%-30% of the estimated NPV/township. In our analysis we therefore assumed that 25% of the NPV of the township would reflect a more realistic estimate of the value of resources on the land at a given time, and adjusted our mean NPV per township accordingly. The net present values employed
in our analysis incorporate the opportunity cost of capital on the basis of a 4% discount rate.
To begin estimating the benefit to caribou habitat (measured in hectares), the average NPV per township in the region was divided by the average township size in the regional boundary. This yielded an average NPV per hectare within the regional boundary. We then multiplied the NPV/ha by the buffer area restored and the treatment area to arrive at an estimated benefit of restoration work to caribou habitat at the Algar scale and at the treatment line scale. To reflect the market value of capital and the risk associated with the investment, results are presented using an 8% discount rate. As with caribou habitat, placing a value on the benefits derived from biodiversity intactness is a difficult task. The quantification and economic valuation of biodiversity remains a controversial topic, both in terms of the methodology and more generally surrounding the moral and philosophical aspects of assigning a value to what some may argue is priceless. Despite a lack of consensus on how best to estimate the benefit of restoration activities to biodiversity intactness, there is widespread agreement that conservation of biodiversity is important and that gains (or losses) in biodiversity warrant some form of acknowledgement.
60 Carson, Richard et al. (2000). “Contingent Valuation: Controversies and Evidence”. Department of Economics, University of California, San Diego.
61 Mburu, J. (Ed.) et. al. “Economic Valuation and Environmental Assessment”. Center for Development Research, University of Bonn. 62 Hauer, G. et. al. 2010. “A Net Present Value Model of Natural Gas Exploitation in Northern Alberta: An Analysis of Land Values in Woodland
Caribou Ranges”. Rural Economy: Project Report. University of Alberta.
48

TE
AM
SIL
VA
CO
M
Assessing the Ecosystem Service Benefits of the Algar LEAP Project
It was therefore recommended by the Algar Advisory Committee that an attempt be made to quantify the benefit to biodiversity intactness, as derived from the increase in biodiversity intactness resulting from the restoration
activities in Algar.
In the absence of a robust and straight forward method for valuing the benefit of restoration activities to biodiversity, the availability of land value data in our area of interest emerged as an option for approximating the potential value of the restoration activities to improvement in biodiversity intactness. Using this approach, an attempt was made to quantify the benefits to biodiversity intactness in the Algar region.
As with caribou habitat, the net present value of resources on the land was used to represent the opportunity cost of conservation. The logic described for this approach as well as the assumptions outlined above hold here as well. Specifically, it is assumed that the value of resources on the land represent a reasonable approximation of the value of biodiversity intactness.
In the context of the Algar case study, the average NPV per township in the region can be multiplied by the increase in biodiversity intactness (%) to arrive at an estimated benefit ($) of the restoration activities in Algar for
biodiversity.
Readers are warned that estimating the benefit of restoration activities to biodiversity through land values is an overly simplistic approach based on a strong assumption about society’s perception of potential trade-offs. The results should therefore be interpreted with caution.
3.3 Algar Cost-Benefit Analysis Results
3.3.1 The Value of Timber Supply
The value of conifer and deciduous growing stock is shown at 5 year intervals over the 30 year timeframe. At the current state (year 0), restoration activities on the seismic lines scheduled for treatment have yet to commence.
As such, there is no growing stock on the seismic lines at this time.
Under the restoration scenario at the future state there will be 4,300 m3 of conifer timber supply and 3,800 m3 of deciduous timber supply on the treated lines. The increase in conifer and deciduous timber supply is valued at
$17,300 and $4,100, respectively (Table 3-4).
Table 3-4 Future state timber supply benefits ($) at the treatment line scale
PERIOD CONIFER VALUE ($) DECIDUOUS VALUE ($) TOTAL TIMBER VALUE ($)
0 0 0 0
5 7,600 2,800 10,400
10 7,600 2,800 10,400
15 7,700 2,800 10,500
20 8,500 2,800 11,300
25 17,300 4,100 21,400
30 17,300 4,100 21,400
49
Note: Please see disclaimer on page 4 when reviewing the ecosystem service assessment and valuation results
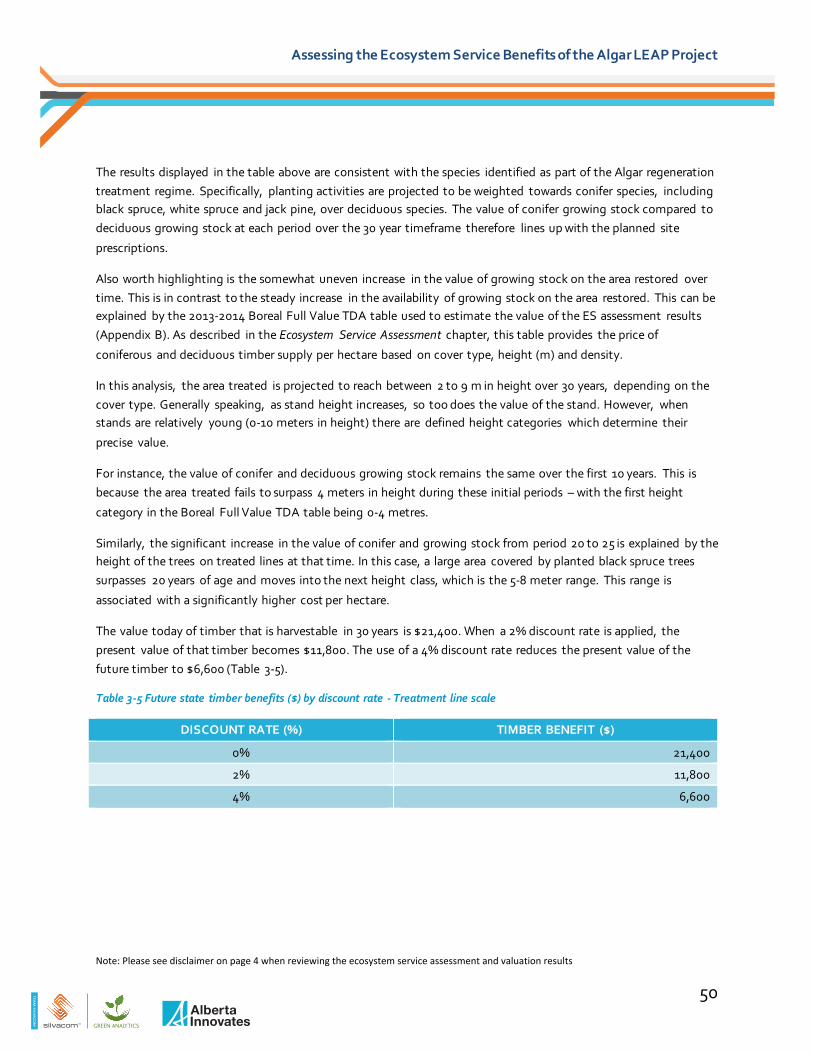
TE
AM
SIL
VA
CO
M
Assessing the Ecosystem Service Benefits of the Algar LEAP Project
The results displayed in the table above are consistent with the species identified as part of the Algar regeneration treatment regime. Specifically, planting activities are projected to be weighted towards conifer species, including black spruce, white spruce and jack pine, over deciduous species. The value of conifer growing stock compared to deciduous growing stock at each period over the 30 year timeframe therefore lines up with the planned site
prescriptions.
Also worth highlighting is the somewhat uneven increase in the value of growing stock on the area restored over time. This is in contrast to the steady increase in the availability of growing stock on the area restored. This can be explained by the 2013-2014 Boreal Full Value TDA table used to estimate the value of the ES assessment results (Appendix B). As described in the Ecosystem Service Assessment chapter, this table provides the price of
coniferous and deciduous timber supply per hectare based on cover type, height (m) and density.
In this analysis, the area treated is projected to reach between 2 to 9 m in height over 30 years, depending on the cover type. Generally speaking, as stand height increases, so too does the value of the stand. However, when stands are relatively young (0-10 meters in height) there are defined height categories which determine their
precise value.
For instance, the value of conifer and deciduous growing stock remains the same over the first 10 years. This is because the area treated fails to surpass 4 meters in height during these initial periods – with the first height
category in the Boreal Full Value TDA table being 0-4 metres.
Similarly, the significant increase in the value of conifer and growing stock from period 20 to 25 is explained by the height of the trees on treated lines at that time. In this case, a large area covered by planted black spruce trees surpasses 20 years of age and moves into the next height class, which is the 5-8 meter range. This range is
associated with a significantly higher cost per hectare.
The value today of timber that is harvestable in 30 years is $21,400. When a 2% discount rate is applied, the present value of that timber becomes $11,800. The use of a 4% discount rate reduces the present value of the future timber to $6,600 (Table 3-5).
Table 3-5 Future state timber benefits ($) by discount rate - Treatment line scale
DISCOUNT RATE (%) TIMBER BENEFIT ($)
0% 21,400
2% 11,800
4% 6,600
50
Note: Please see disclaimer on page 4 when reviewing the ecosystem service assessment and valuation results
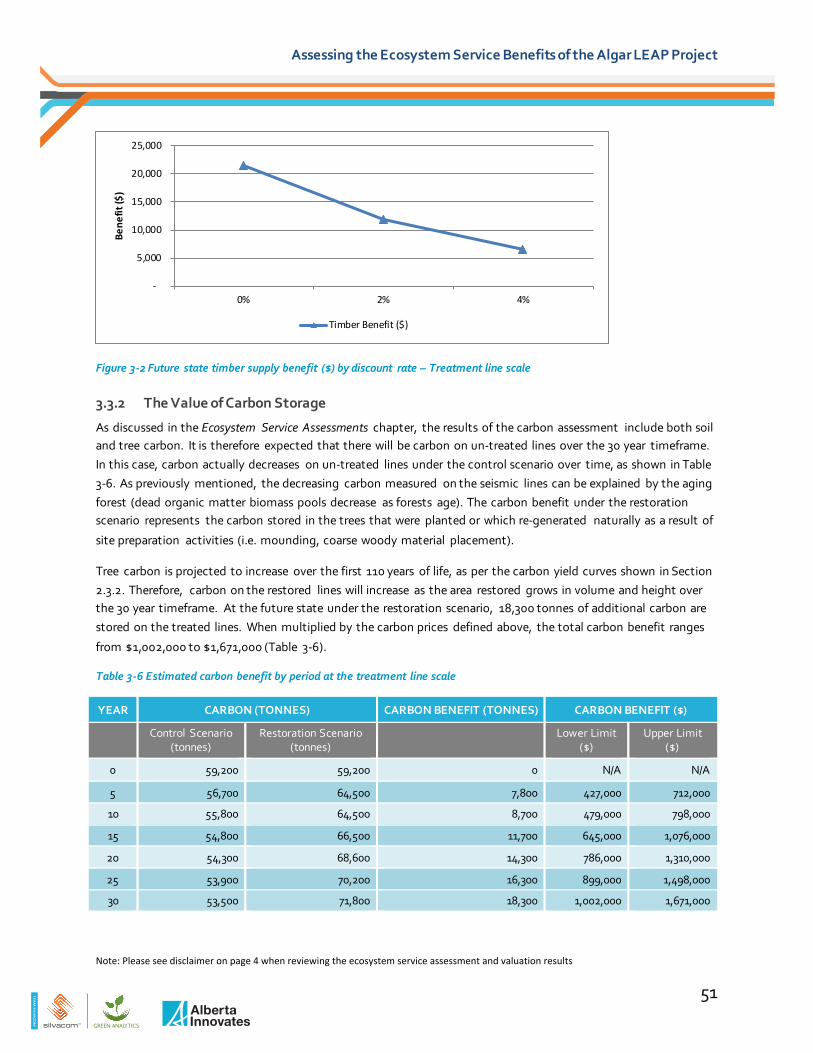
TE
AM
SIL
VA
CO
M
Assessing the Ecosystem Service Benefits of the Algar LEAP Project
Figure 3-2 Future state timber supply benefit ($) by discount rate – Treatment line scale
3.3.2 The Value of Carbon Storage
As discussed in the Ecosystem Service Assessments chapter, the results of the carbon assessment include both soil and tree carbon. It is therefore expected that there will be carbon on un-treated lines over the 30 year timeframe. In this case, carbon actually decreases on un-treated lines under the control scenario over time, as shown in Table 3-6. As previously mentioned, the decreasing carbon measured on the seismic lines can be explained by the aging forest (dead organic matter biomass pools decrease as forests age). The carbon benefit under the restoration scenario represents the carbon stored in the trees that were planted or which re-generated naturally as a result of
site preparation activities (i.e. mounding, coarse woody material placement).
Tree carbon is projected to increase over the first 110 years of life, as per the carbon yield curves shown in Section 2.3.2. Therefore, carbon on the restored lines will increase as the area restored grows in volume and height over the 30 year timeframe. At the future state under the restoration scenario, 18,300 tonnes of additional carbon are stored on the treated lines. When multiplied by the carbon prices defined above, the total carbon benefit ranges
from $1,002,000 to $1,671,000 (Table 3-6).
Table 3-6 Estimated carbon benefit by period at the treatment line scale
YEAR CARBON (TONNES) CARBON BENEFIT (TONNES) CARBON BENEFIT ($)
Control Scenario (tonnes)
Restoration Scenario (tonnes)
Lower Limit ($)
Upper Limit ($)
0 59,200 59,200 0 N/A N/A
5 56,700 64,500 7,800 427,000 712,000
10 55,800 64,500 8,700 479,000 798,000
15 54,800 66,500 11,700 645,000 1,076,000
20 54,300 68,600 14,300 786,000 1,310,000
25 53,900 70,200 16,300 899,000 1,498,000
30 53,500 71,800 18,300 1,002,000 1,671,000
-
5,000
10,000
15,000
20,000
25,000
0% 2% 4%
Bene
fit ($
)
Timber Benefit ($)
51
Note: Please see disclaimer on page 4 when reviewing the ecosystem service assessment and valuation results
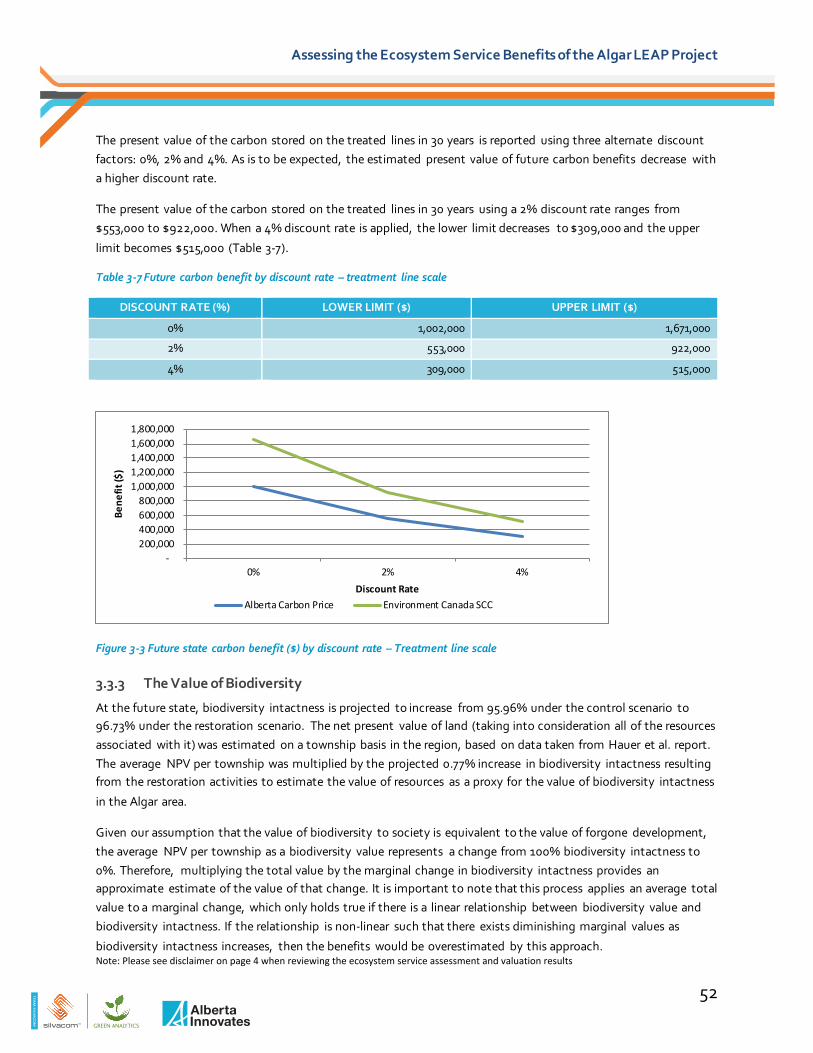
TE
AM
SIL
VA
CO
M
Assessing the Ecosystem Service Benefits of the Algar LEAP Project
The present value of the carbon stored on the treated lines in 30 years is reported using three alternate discount factors: 0%, 2% and 4%. As is to be expected, the estimated present value of future carbon benefits decrease with a higher discount rate.
The present value of the carbon stored on the treated lines in 30 years using a 2% discount rate ranges from $553,000 to $922,000. When a 4% discount rate is applied, the lower limit decreases to $309,000 and the upper
limit becomes $515,000 (Table 3-7).
Table 3-7 Future carbon benefit by discount rate – treatment line scale
DISCOUNT RATE (%) LOWER LIMIT ($) UPPER LIMIT ($)
0% 1,002,000 1,671,000
2% 553,000 922,000
4% 309,000 515,000
Figure 3-3 Future state carbon benefit ($) by discount rate – Treatment line scale
3.3.3 The Value of Biodiversity
At the future state, biodiversity intactness is projected to increase from 95.96% under the control scenario to 96.73% under the restoration scenario. The net present value of land (taking into consideration all of the resources associated with it) was estimated on a township basis in the region, based on data taken from Hauer et al. report. The average NPV per township was multiplied by the projected 0.77% increase in biodiversity intactness resulting from the restoration activities to estimate the value of resources as a proxy for the value of biodiversity intactness
in the Algar area.
Given our assumption that the value of biodiversity to society is equivalent to the value of forgone development, the average NPV per township as a biodiversity value represents a change from 100% biodiversity intactness to 0%. Therefore, multiplying the total value by the marginal change in biodiversity intactness provides an approximate estimate of the value of that change. It is important to note that this process applies an average total value to a marginal change, which only holds true if there is a linear relationship between biodiversity value and biodiversity intactness. If the relationship is non-linear such that there exists diminishing marginal values as
biodiversity intactness increases, then the benefits would be overestimated by this approach.
- 200,000 400,000 600,000 800,000
1,000,000 1,200,000 1,400,000 1,600,000 1,800,000
0% 2% 4%
Bene
fit ($
)
Discount Rate Alberta Carbon Price Environment Canada SCC
52
Note: Please see disclaimer on page 4 when reviewing the ecosystem service assessment and valuation results

TE
AM
SIL
VA
CO
M
Assessing the Ecosystem Service Benefits of the Algar LEAP Project
Table 3-8 Future state biodiversity benefits ($) at the Algar region scale
PERIOD SCENARIO ES BENEFIT (%) TOTAL BIODIVERSITY BENEFIT ($) IN ALGAR
Control Restoration
Future State (30 years) 95.96% 96.73% 0.77% 86,477,000
The impact of the choice of discount rate is demonstrated in the table and figure below with the value of biodiversity gains under the restoration scenario diminishing as the discount rate employed increases. To reflect the market value of capital and the risk associated with the investment, results are also presented using an 8%
discount rate.
Table 3-9 Future state biodiversity benefits ($) by discount rate – Algar region scale
DISCOUNT RATE (%) BIODIVERSITY BENEFIT ($)
0% 86,477,000
2% 47,742,000
4% 26,663,000
8% 8,594,000
Figure 3-4 Future state biodiversity benefit ($) by discount rate – Algar region scale
3.3.4 The Value of Water Purification
At the future state, the restoration activities in Algar are projected to reduce phosphorus loading by 20%, nitrogen loading by 6% and total suspended solids by 3%. Using a 4% discount rate, the benefits of the restoration activities associated with the avoided water treatment costs for the reduction of sediment are estimated to range from $4 to $400. The estimated treatment costs required for the reduction of phosphorus are significantly higher, ranging from a minimum of $16,800 up to $1,051,000. The avoided dredging costs range from $20 to $2,100
(Table 3-10).
Because there are no direct beneficiaries of the water purification services provided by the LEAP restoration, the benefits associated with water purification in the Algar region are likely overstated. That said, it is likely that there
-
20,000
40,000
60,000
80,000
100,000
0% 2% 4% 8%
Bene
fit ($
) (1,
000'
s)
Discount Rate
Biodiversity Benefit ($)
53
Note: Please see disclaimer on page 4 when reviewing the ecosystem service assessment and valuation results

TE
AM
SIL
VA
CO
M
Assessing the Ecosystem Service Benefits of the Algar LEAP Project
are indirect beneficiaries who would receive value from the existence of purified water or the existence of the plants and animals present in the area that depend on the purified water for their survival. Thus it is safe to assume that the value of the purified water provided by the Algar restoration is not zero. In reality it is likely
somewhere between zero and the values presented in the table below.
Table 3-10 Future state water purification benefits ($) by discount rate – Algar region scale
DISCOUNT RATE (%)
AVOIDED DRINKING WATER COSTS - SEDIMENT
AVOIDED DRINKING WATER COSTS - PHOSPHORUS
AVOIDED DREDGING COSTS
LOWER LIMIT ($) UPPER LIMIT ($)
LOWER LIMIT ($)
UPPER LIMIT ($)
LOWER LIMIT ($)
UPPER LIMIT ($)
0% 13 1,200 54,500 3,408,000 65 6,900
2% 7 700 30,100 1,881,000 36 3,800
4% 4 400 16,800 1,051,000 20 2,100
3.3.5 The Value of Caribou Habitat
Upon completion, the Algar program will have treated 211 hectares of seismic lines within the ESAR caribou range. In 30 years, the restoration activities undertaken in Algar together with the resulting buffer area restored, are projected to increase the intact area within the Algar region by 32% (12,800 ha). The estimated household willingness to pay for the self-sustainment of an additional caribou herd is $184.02 per year. When aggregated across all households in the province and pro-rated to the ESAR range, this equates to a total willingness to pay of $14,900 specifically for the area treated and $902,000 for the area treated plus the resulting buffer area restored (Table 3-11). These values represent the first annual payment (incurred at future state year 30) made by
households for the self-sustainment of an additional caribou herd in the ESAR.
Table 3-11 Future state caribou habitat benefits (WTP) ($)
TOTAL (PROVINCIAL) WTP/YEAR FOR ALGAR RESTORATION ACTIVITIES IN ESAR ($)
Area Intact (within Caribou range) 902,000
Area Restored 14,900
When a 2% discount rate is applied, the present value of the seismic line area restored within the ESAR decreases to $8,200. Discounting the future benefit of the treated area plus the buffer area restored (area intact) at 2% yields a present value of $498,000. A 4% discount rate reduces benefits associated with the restoration of seismic
lines and the intact buffer area to $4,600 and $278,000, respectively (Table 3-12).
Table 3-12 Future state caribou habitat benefits (WTP) ($) by discount rate
DISCOUNT RATE (%) AREA INTACT BENEFIT ($) AREA RESTORED BENEFIT ($)
0% 902,000 14,900
2% 498,000 8,200
4% 278,000 4,60063
63 These values represent the first annual payment (incurred at future state year 30) made by households through an increase in taxes for the self-sustainment of an additional caribou herd in the ESAR, at various discount rates.
54
Note: Please see disclaimer on page 4 when reviewing the ecosystem service assessment and valuation results

TE
AM
SIL
VA
CO
M
Assessing the Ecosystem Service Benefits of the Algar LEAP Project
Figure 3-5 Future state caribou habitat benefits (WTP) ($) by discount rate
The benefit associated with restored caribou habitat was also estimated using land use values from Hauer et al., which take into consideration the total value of resources in a given township. The average NPV per hectare of land in the region area was estimated to be $196,680. The NPV per hectare was multiplied by the area treated and the buffer area restored to arrive at an estimated benefit of restoration work to caribou habitat at the Algar scale
and at the treatment line scale.
Table 3-13 Future state caribou habitat benefits (NPV) ($)
NPV OF CARIBOU HABITAT RESTORED ($)
Area Intact (within caribou range) 2,513,963,000
Area Restored 41,499,000
At an 8% discount rate, the benefit to caribou habitat amounts to $249,831,000 at the Algar boundary scale and
$4,124,000 at the treatment scale.
Table 3-14 Future state caribou habitat benefits (NPV) ($) by discount rate
DISCOUNT RATE (%) AREA INTACT BENEFIT ($) AREA RESTORED BENEFIT ($)
0% 2,513,963,000 41,499,000
2% 1,387,886,000 22,911,000
4% 775,102,000 12,795,000
8% 249,831,000 4,124,000
- 2,000 4,000 6,000 8,000 10,000 12,000 14,000 16,000
-
200,000
400,000
600,000
800,000
1,000,000
0% 2% 4%
Are
a Re
stor
ed B
enef
it ($
)
Are
a In
tact
Ben
efit
($)
Discount Rate
Area Intact Benefit ($) Area Restored Benefit ($)
55
Note: Please see disclaimer on page 4 when reviewing the ecosystem service assessment and valuation results

TE
AM
SIL
VA
CO
M
Assessing the Ecosystem Service Benefits of the Algar LEAP Project
Figure 3-6 Future state caribou habitat benefits (NPV) ($) by discount rate
3.4 Cost-Benefit Analysis Results Summary
The costs of a project are an essential piece of a cost-benefit analysis as they provide the basis against which estimated benefits can be evaluated. In the case of the Algar project, costs relate to the restoration of seismic lines.
The average cost per kilometer for field verification and restoration treatment activities were summarized for the Algar restoration project. Using the projected area treated (km) upon program completion as per the Algar
treatment plan, the total restoration costs of the program were estimated at $4,802,000 (Table 3-15).
Table 3-15 Algar Restoration Treatment Costs
ACTIVITY TREATMENT COST (2012 $)
Field verification 882,000
Restoration treatment 3,920,000
Total 4,802,000
There are a number of approaches available for estimating the value of increased ES resulting from restoration activities. The use of market prices is the most straightforward and defensible approach to valuation and as such was the preferred approach for this analysis. Market prices were used to estimate the benefits of carbon storage
and the growing stock of timber on the treatment lines.
For the remaining ecosystem services a market price was not readily available. In the case of water purification, a replacement cost approach was employed to estimate the value of water purification services for the Algar region. In the absence of region specific water treatment costs, a range of prices were estimated based on a literature review carried out by Heckbert et al.64
64 Heckbert, S. et al. (2013). HydroGeosim: Model Documentation. Alberta Biodiversity Monitoring Institute.
05,00010,00015,00020,00025,00030,00035,00040,00045,000
0
500,000
1,000,000
1,500,000
2,000,000
2,500,000
3,000,000
0% 2% 4% 8% Are
a Re
stor
ed B
enef
it ($
) (1,
000'
s)
Are
a In
tact
Ben
efit
($) (
1,00
0's)
Discount Rate Area Intact Benefit ($) Area Restored Benefit ($)
56
Note: Please see disclaimer on page 4 when reviewing the ecosystem service assessment and valuation results

TE
AM
SIL
VA
CO
M
Assessing the Ecosystem Service Benefits of the Algar LEAP Project
Caribou habitat was valued using the results of a contingent valuation survey which estimated household willingness to pay for self-sustaining caribou herds. To give perspective to this estimate, the opportunity cost of conservation was also calculated as a proxy for the value of increased habitat. The same approach was employed
to measure the value of increased biodiversity intactness. The results of the CBA are summarized here.
The value of the increase in timber stock resulting from the application of LEAP to the Algar region ranges from
$6,600 to $21,400 depending on the discount rate employed.
The value of the increase in carbon storage in the treatment area resulting from the application of LEAP to the Algar region ranges from $1,002,000 to $1,671,000 depending on carbon price assumptions. The choice of discount rate also impacts the value of carbon storage in the treated area. When a 4% discount rate is applied the
range in the value of carbon storage decreases to $309,000 to $515,000.
At a 4% discount rate, the value of caribou habitat is estimated to range from $278,000 to $775,102,000
depending on the valuation approach employed.
Using the opportunity cost of conservation as a proxy for the value of the increase in biodiversity intactness and
an 8% discount rate, the 0.77% increase in biodiversity intactness is valued at $8,594,000.
Of the water purification benefits measured, avoided phosphorus treatment costs are the greatest. The restoration activities are projected to reduce phosphorus loading by roughly 1,400 Kg / year, resulting in a benefit
in the form of avoided treatment costs of between $16,800 and $1,051,000 (4% discount rate applied).
Table 3-16 Summary of ES Values by discount rate
DISCOUNT RATE = 0% DISCOUNT RATE = 2% DISCOUNT RATE = 4% DISCOUNT RATE = 8%
Ecosystem Service Lower Limit
Upper Limit
Lower Limit
Upper Limit
Lower Limit
Upper Limit
Lower Limit
Upper Limit
Growing Stock $21,400 $21,400 $11,800 $11,800 $6,600 $6,600 N/A N/A
Carbon Storage $1,002,000 $1,671,000 $553,000 $922,000 $309,000 $515,000 N/A N/A
Caribou Habitat (area intact)
$902,000 $2,513,963,000 $498,000 $1,387,886,000 $278,000 $775,102,000 N/A $249,831,000
Water Purification: N/A N/A
Avoided drinking water costs - sediment
$13 $1,200 $7 $700 $4 $400 N/A N/A
Avoided drinking water costs - phosphorus
$54,500 $3,408,000 $30,100 $1,881,000 $16,800 $1,051,000 N/A N/A
Avoided dredging costs $65 $6,900 $36 $3,800 $20 $2,100 N/A N/A
Biodiversity $86,477,000 $86,477,000 $47,742,000 $47,742,000 $26,663,000 $26,663,000 $8,594,000 $8,594,000
The results in the table above have yet to be validated.
57
Note: Please see disclaimer on page 4 when reviewing the ecosystem service assessment and valuation results

TE
AM
SIL
VA
CO
M
Assessing the Ecosystem Service Benefits of the Algar LEAP Project
TOWARD AN OFFSET POLICY FOR ALBERTA 4.
4.1 Introduction
As has been discussed in myriad academic and policy articles, given current population growth and rates of material and energy consumption, society has reached the limit of the Earth’s biophysical capacity. The 2005 Millennium Ecosystem Assessment revealed that 60% of the world’s ecosystem services are being used in a way that cannot be sustained.65 Over the past 50 years, humans have altered the Earth’s ecosystem services at an unprecedented rate to meet rapidly growing demands for food, fresh water, fuel, timber and fibre.66 While humans have made significant advances in the areas of material wealth and economic development through the extraction and use of renewable and non-renewable resources, such activities have resulted in the degradation of global ecosystem services. The declining capacity of ecosystem services results in diminished benefits for current and future generations, as key services are lost.67 To mitigate losses to ecosystem services, governments around the world are increasingly exploring and implementing new programs designed to balance development with conservation. Offset programs are one such example and are the focus of this section of the report. Through an offset system, environmental losses due to development are “offset” with environmental gains so that there is no net loss of environment conditions. Offset programs are currently in place in a number of countries around the world. Recent research estimated that the annual market size of all existing biodiversity-focused offset programs combined is at least $1.8 to $2.9 billion. The conservation impact of this market includes at least 86,000 hectares of land under some sort of conservation management or permanent legal protection per year.68 As interest in offset programs increases around the world, so too does it in Alberta where the need to balance development with conservation is significant. To facilitate the advancement of a conservation offsets program for Alberta, the
purpose of this section of the report is to:
• Provide an overview of offset frameworks including what an offset program is, how they work and why they are pursued.
• Compare the components and principles contained in existing offset programs to identify areas of consensus between programs.
• Draw on the experience of other jurisdictions to begin to articulate what may be considered key features of an offset framework for Alberta.
Following the Background section (below), in which relevant contextual information is presented, the results of a review of a selection of offset programs from around the world is presented; the similarities and points of consensus between the programs are identified and discussed. Lessons learned for Alberta are then identified.
The section concludes with a brief summary of the findings.
65 Forest Trends, UNEP and the Katoomba Group, Payments for Ecosystem Services, Getting Started: A Primer (2008), i. 66 Millennium Ecosystem Assessment Board, Ecosystems and Human Well-Being: A Report of the Millennium Ecosystem Assessment. (World
Resources Institute, 2005), 1. 67 Ibid. 68 Madsen, Becca; Carroll, Nathaniel; Moore Brands, Kelly; 2010. State of Biodiversity Markets Report: Offset and Compensation Programs
Worldwide.
58

TE
AM
SIL
VA
CO
M
Assessing the Ecosystem Service Benefits of the Algar LEAP Project
4.2 Background
Simply put, to “offset” is to compensate for a negative action with a positive action. From an environmental perspective, an offset compensates for environmental degradation with actions that benefit the environment, so that the negative environmental impacts are essentially cancelled out. There are generally two ways in which an offset is achieved; developers can undertake an offset project directly or they can purchase readily available offsets from a “bank” of offsets that have been previously created.
Offsets programs are in place to address negative impacts from the release of pollutants or emissions (i.e. carbon offsets to habitat), species loss (i.e. biodiversity offsets) and habitat loss or degradation (i.e. conservation offsets). A carbon offset system reduces carbon and other greenhouse gas emissions to compensate for emissions released elsewhere. A business can make purposeful emissions reductions by switching to green energy or retrofitting with energy efficient technology, which, through a standardized quantification system, can translate into carbon credits that can be sold to other businesses seeking to offset their emissions. Currently in Alberta there is a standardized, market-based system for quantifying greenhouse gas emission reductions and buying or selling carbon credits (the Carbon Offset Registry).69
Biodiversity offsets and conservation offsets are much the same because the process of offsetting negative impacts to biodiversity is very similar to the process of offsetting habitat loss and degradation. In general, the focus of conservation offsets is, however, on the ecosystem, while biodiversity offsets focus more on particular species. The US Fish and Wildlife Service (FWS), for example, has implemented a conservation banking program under the Endangered Species Act of 1973 that focuses on protecting endangered or threatened species by compensating for development actions that “take” (i.e. harass, harm, etc.) listed species by protecting, restoring or creating habitat that supports biodiversity.70 The focus of the FWS framework is at the species level, but offsets occur at the habitat level. Because of the similarities, biodiversity offsets and conservation offsets are sometimes used and referred to interchangeably.
The focus of this section of the report is on conservation offsets. Conservation offsets are used to conserve and protect natural ecosystems and the services they provide to humans. A conservation offset may consist of creating new habitat by planting trees or creating a wetland, reclaiming degraded habitat by restoring its former ecological function, or protecting existing habitat through the placement of conservation easements. While the process of undertaking an offset project varies by location and also the type of environmental issue being
addressed, in general it is characterized by the steps depicted in the figure below.
69 Government of Alberta. 2013. Alberta-based Offset Credit System. Government of Alberta. ONLINE: http://environment.alberta.ca/0923.html
70 US Fish and Wildlife Service. August 2012. Conservation Banking: Incentives for Stewardship. Washington, DC. Accessed online from http://www.fws.gov/endangered/esa-library/pdf/conservation_banking.pdf
59

TE
AM
SIL
VA
CO
M
Assessing the Ecosystem Service Benefits of the Algar LEAP Project
Figure 4-1 Offsetting process
To better understand offsets and how they relate to other policy tools that may be used to achieve the same or similar objectives, it is useful to position offsets within the context of alternative policy options. In general, policy
options are categorized as either71:
• Market-based
• Command and control
• Suasive
For each of these approaches, there are accompanying policy instruments (table below).
71 Robert Stavins, Market-Based Environmental Policy: What Can We Learn from the U.S. Experience (and Related Research (Resources for the Future, 2001). http://www.rff.org/documents/RFF-DP-03-43.pdf
Developer seeks planning permission Mitigation hierarchy
Offset needed Residual impact
Registry search No site found
Search for sites
Approvals received
Site found
Legal agreements
Credits calculated/offset
Deal brokered – credits purchased
Offset requirement calculated
Offset funding secured
Landowner implements management plan
No net loss or net gain achieved
With landowner and developer
Credit certificate issued
Environmental obligations fulfilled –
development proceeds
Monitoring and reporting
60

TE
AM
SIL
VA
CO
M
Assessing the Ecosystem Service Benefits of the Algar LEAP Project
Table 4-1 Policy approaches and instruments for providing ecosystem services
APPROACH DESCRIPTION OF POLICY APPROACH EXAMPLES OF POLICY INSTRUMENTS
Market-based Market creation (quantity-based) instruments establish a property right on a unit basis and that unit can be traded or purchased.
• Tradable permits or credits
• Tradable disturbance rights
• Compliance or voluntary offsets
Market shifting (price-based) instruments influence the market by incorporating the environmental benefit or cost of particular activities.
• Environmental taxes
• User fees
• Payment schemes
• Tax credits
Market shifting (friction) instruments remove obstacles to ecosystem service market formation or growth.
• Performance based insurance premiums
• Performance based or risk management-based interest rates
• Consumer information
Command and control
Quantity-based instruments are used to set aside designated land for particular uses.
• Land use planning • Protected areas/conservation directives
• Covenants
Performance based instruments provide flexibility in meeting clear environmental objectives.
• Management plans
• Compulsory best management practices
• Licensing
Suasive (Supporting)
Suasive instruments and voluntary approaches seek to change behaviour in support of achieving an objective by raising awareness and providing information. Suasive instruments are commonly used in combination with other approaches discussed above.
• Awareness and Information programs • Education programs
While traditionally governments have relied more heavily on the use of command and control and suasive type policy approaches, market-based approaches (MBA) are increasingly being considered and implemented around the world.
4.2.1 Why a Market-based Approach
Damage to and loss of ecosystem services has arisen, in part, because the full value of natural resource and environmental assets are not accounted for in market prices.72 In other words, the costs associated with the production, consumption and disposal of goods and services are not reflected in the market prices of those goods and services; many environmental costs are currently not the responsibility of producers and consumers and are thus borne by society at large in the form of a degraded environment. When such costs are not taken into consideration, prices for goods and services associated with high environmental costs are lower than they would be if such costs were taken into account. In such cases, more of the good or service may be produced and consumed — what economists term a “market failure.”
72 This is “lifecycle accounting” — valuing products from cradle to grave across the entire supply chain of the product.
61
TE
AM
SIL
VA
CO
M
Assessing the Ecosystem Service Benefits of the Algar LEAP Project
A market-based approach relies on market forces to re-allocate goods and services through full and effective pricing to correct for market failures. The assumption underlying this approach is that once (at least a portion of) the true cost of environmental degradation is internalized in market prices, a more optimal allocation of goods
and services will occur, prompting more efficient and sustainable levels of production and consumption.
In Alberta, a resource development and export oriented economy, a market-based approach can lead to a number
of benefits. More specifically, the use of an MBA can: 73
• Internalize and make more transparent the full-cost of resource production and land use.
• Raise funds that can be used to help achieve environmental and conservation objectives.
• Create an incentive for landowners and resource managers to maintain or improve ecosystem services asthey compete for the financial rewards associated with environmental compliance or improvements.
• Enable communities and governments to more clearly understand the compliance costs imposed onbusinesses and industries related to environmental policy.
• Eliminate the need for inclusion-exclusion rules for resource management that may be politicallypolarized through entrenched lobbying interests74 (e.g. command and control policies designate whohas access to the resource).
• Reduce incentives for free-riding75 on the degradation of ecosystem services as the marginal value ofecosystem services improvements/degradation increases.
• Be coupled with a suite of policy compliance options so that companies and individuals can choose howthey want to comply with environmental policy.76
4.2.2 Why Offsets
Alberta already has the required legislative framework in place to enable the use of MBAs in general and quantity-based MBAs such as offsets more specifically. The Alberta Land Stewardship Act (ALSA) 77 sets the framework for offsets to be used for restoration, mitigation or conservation. It provides a legal basis for the government to establish an offset program and to set rules for defining and trading offsets.78 This makes the process of implementing an offset program for Alberta more efficient than it would be if appropriate legislation needed to be
established. Other benefits of an offset program from the government’s perspective include:
73 Drew Collins and Michell Scoccimarro, “Designer Carrots: Market-Based Instruments Decision Support Tool,” Market Based Instruments Capacity Building Program, Department of Natural Resources and Water, Government of Australia. http://www.marketbasedinstruments.gov.au/PublicationsProducts/DesignerCarrotsdecisionsupporttool/tabid/134/Default.aspx
74 Pontus Cerin, “Bringing Economic Opportunity into Line with Environmental Influence: A Discussion on the Coase Theorem and Porter and van der Linde Hypothesis,” Ecological Economics 56 (2006): 212.
75 Free-riding refers to situations when individuals or firms consume more than their fair share of a public resource, or shoulder less than a fair share of the costs of its production (e.g. Agriculture producers who use in-stream flow supply for irrigation at no cost).
76 Gebhard Kirchgassner and Friederich Schneider, “On the Political Economy of Environmental Policy,” Public Choice 115 (2003): 370. 77 The content for this section is pulled directly, word for word, from Government of Alberta, “Alberta Land Stewardship Act Conservation
Tools” (April 29, 2009). http://alberta.ca/home/NewsFrame.cfm?ReleaseID=/acn/200904/25803E9093830-088F-F98A-70A7DF158F1CDF66.html
78 Davis LLP, “Alberta’s Proposed Land Stewardship Legislation: Effects on Conservation Tools” (2009). http://www.davis.ca/en/blog/Environmental-Energy-and-Resources-Law/2009/05/15/Albertas-Proposed-Land-Stewardship-Legislation-Effects-on-Conservation-Tools
62

TE
AM
SIL
VA
CO
M
Assessing the Ecosystem Service Benefits of the Algar LEAP Project
• Identification of areas of strategic importance: An offset system requires developers to offset habitatof the same ecological value as the development site (or better). This process aids governments inidentifying areas that are of special environmental importance.
• Goal oriented / measurable outcomes: Offset systems provide clear goals for developers; they mustcompensate for ecological losses with habitat of equal value. In addition, the outcomes of offsetting are measurable and transparent.
• Perpetuity: Most frameworks require that offsets be maintained in perpetuity. This ensures that the ecological functions of these areas are permanently protected and cannot be developed upon in the future.
• Flexibility: Offset programs create a market for trading, which means there is a high degree of flexibilityin how environmental compliance is achieved.
• Cost-effective: MBAs including offsets are considered cost-effective policy instruments for dealing witha large group of regulated sectors with heterogeneous compliance costs.
• Incorporate environmental costs of economic development: Offsets compel industry to consider the environmental costs of development before development even begins. This builds industry awareness for habitat protection and restoration, and it is a relatively easy way to regulate the environmental impacts of development. 79
From an industry perspective, the benefits of an offset program include:
• Access to land: Development can only occur on land where resources exist, and in many instances, thisland is located in very biologically diverse regions. Thus, the development processes that disturb landalways result in some unavoidable impacts to ecosystems. However, if resource demand is to be met, continued access to new land – and the associated potential disturbance of biodiversity – is essential. Industry interest in biodiversity offsets is linked to concerns about gaining access to land, while at thesame time maintaining ecosystem values throughout the region.
• Competitive market advantage: Participation in a voluntary offset market can lead to improvedrelations with governments and communities, giving industry the ability to anticipate and respond toenvironmental markets and new legislation.
• Time-efficiency and cost-effectiveness: It can cost more and take longer to completely rehabilitatehabitat after development has occurred than it would to restore or protect a different habitat site. It may, therefore, be more preferable to support conservation activities elsewhere than to address them on-site.
• Social license to operate: Offsets can be an additional mechanism that businesses use for protectingtheir “social license to operate” and gaining access to land and resources that might otherwise have beenunavailable.
• Access to capital: External social pressure has caused the financial sector to become increasinglyconcerned with industry’s aptitude for environmental and social management. Participation in an offset
79 Weber, M. March 2009. Conservation Offsets and Banking: Last Call for Conversation? Presentation at the Alberta Land Trust Alliance Conference on March 11-13, 2009. ONLINE: http://www.landtrusts-alberta.ca/documents/marianweber.pdf
63
TE
AM
SIL
VA
CO
M
Assessing the Ecosystem Service Benefits of the Algar LEAP Project
system demonstrates industry’s commitment to environmental and social management and can safeguard investments by the financial sector.
• Ethics and environmental stewardship: The use of offsets demonstrates an ethical commitment toenvironmental stewardship by industry.80
As will be demonstrated below, the benefits of an offset program have led numerous governments to pursue them.
4.2.3 Global Trend in Offsets
Offset programs are currently in place in a number of countries around the world. A recent report tallied and reviewed all of the biodiversity-focused offset-type programs currently in place globally and found 39 existing compensatory mitigation programs. The programs ranged from those with active mitigation banking of biodiversity credits, to programs channelling development impact fees towards conservation efforts, to policies that drive one-off offsets. The authors found another 25 programs under development or investigation. The annual market size of all existing programs combined is estimated to be at least $1.8 to $2.9 billion. The conservation impact of this market includes at least 86,000 hectares of land under some sort of conservation management or permanent legal protection per year.81
The United States has seven active biodiversity-focused offset programs and three in development. According to the review of biodiversity offset programs, annual payments associated with existing programs in the U.S. total $1.5 to $2.4 billion.82 Through all of the programs combined in the U.S. around 700,000 cumulative acres (283,280 hectares) have been restored or protected.83 The two largest offset programs in the U.S. are regulatory based and have been in place for several decades. They are considered the most developed in the world.84 The U.S. Clean Water Act (1972) and the Endangered Species Act (1973) have offset provisions related to negative impacts on habitat (wetlands) and species, respectively. Through these programs mitigation banks for wetlands and conservation banks for endangered species supply credits that can be purchased by developers needing to offset
negative impacts.85
Conservation offset programs are also fairly well developed in Australia and New Zealand. Between these two countries there are twelve biodiversity offset programs in place and five in development. As is the case in the U.S. the majority of the programs in Australia and New Zealand are regulatory-based. The review of global biodiversity-focused offset programs noted above revealed that the value of the offsets in these two countries is about $1.3 million annually, with 523 habitat hectares restored or preserved each year.86 The European Union’s
80 International Council on Mining and Metals. July 2005. Biodiversity Offsets: A Briefing Paper for the Mining Industry. ICCM, London, UK. ONLINE: https://www.icmm.com/page/1234/biodiversity-offsets-a-briefing-paper-for-the-mining-industry
81 Madsen, Becca; Carroll, Nathaniel; Moore Brands, Kelly; 2010. State of Biodiversity Markets Report: Offset and Compensation Programs Worldwide.
82 Doswald, N., Barcellos Harris, M., Jones, M., Pilla, E., and Mulder, I. (2012) Biodiversity offsets: voluntary and compliance regimes. A review of existing schemes, initiatives and guidance for financial institutions. UNEP-WCMC, Cambridge, UK. UNEP FI, Geneva, Switzerland
83 Madsen, Becca; Carroll, Nathaniel; Moore Brands, Kelly; 2010. State of Biodiversity Markets Report: Offset and Compensation Programs Worldwide.
84 Doswald, N., Barcellos Harris, M., Jones, M., Pilla, E., and Mulder, I. (2012) Biodiversity offsets: voluntary and compliance regimes. A review of existing schemes, initiatives and guidance for financial institutions. UNEP-WCMC, Cambridge, UK. UNEP FI, Geneva, Switzerland
85 Doswald, N., Barcellos Harris, M., Jones, M., Pilla, E., and Mulder, I. (2012) Biodiversity offsets: voluntary and compliance regimes. A review of existing schemes, initiatives and guidance for financial institutions. UNEP-WCMC, Cambridge, UK. UNEP FI, Geneva, Switzerland
86 Madsen, Becca; Carroll, Nathaniel; Moore Brands, Kelly; 2010. State of Biodiversity Markets Report: Offset and Compensation Programs Worldwide.
64

TE
AM
SIL
VA
CO
M
Assessing the Ecosystem Service Benefits of the Algar LEAP Project
biodiversity strategy, which establishes the goal of no net loss of ecosystem service by 2020,87 is driving
biodiversity offset developments there.
Offset schemes are characterized by a range of design features intended to respond to a number of challenges associated with ensuring the schemes are as rigorous and valid as possible. One of the challenges that is addressed in the programs is the question of when an offset is an appropriate action. Biodiversity offsets are deemed not appropriate, for example, to address impacts to ‘critical’ or ‘non-substitutable’ biodiversity; the
challenge being defining exactly what constitutes critical or non-substitutable biodiversity.88
There has been controversy surrounding the implementation of conservation offset systems on the grounds that they give developers the green light to damage the environment, provided that they offset elsewhere. This is why most offset programs employ the ‘mitigation hierarchy’ principle, which states that in order for offsets to occur, developers must first exhaust efforts that avoid environmental impacts, reduce environmental impacts, and mitigate environmental impacts, in that order. It is only the residual impacts left after the hierarchy has been applied that can be offset. The following figure illustrates the mitigation hierarchy.
Figure 4-2 Mitigation hierarchy 89
Another challenge is the question of how to measure biodiversity and conservation. As will be discussed later, different offset programs employ different metrics to measure biodiversity. The most rudimentary programs employ area based measurements often with the use of multipliers to reflect differences between locations. More
87 http://ec.europa.eu/environment/nature/biodiversity/comm2006/2020.htm 88 Doswald, N., Barcellos Harris, M., Jones, M., Pilla, E., and Mulder, I. (2012) Biodiversity offsets: voluntary and compliance regimes. A review
of existing schemes, initiatives and guidance for financial institutions. UNEP-WCMC, Cambridge, UK. UNEP FI, Geneva, Switzerland 89 Adapted from International Council on Mining and Metals. July 2005. Biodiversity Offsets: A Briefing Paper for the Mining Industry. ICCM,
London, UK. ONLINE: https://www.icmm.com/page/1234/biodiversity-offsets-a-briefing-paper-for-the-mining-industry
65

TE
AM
SIL
VA
CO
M
Assessing the Ecosystem Service Benefits of the Algar LEAP Project
complex metrics take into consideration not just area but other key biodiversity components such as the ‘condition’ of the site to be impacted or restored. These more complex metrics are designed to achieve a minimum degree of equivalency (or like-for-like) between impact and offset sites such that the biodiversity values being conserved are at least equal to those being lost.90 Measuring the equivalency of different sites can be a difficult task especially as it relates to equating ecological values between regions. In theory, to be considered equivalent, a conservation offset should contain the same biodiversity (same species of organisms, in the same relative abundance), with the same physical habitat, as is found in the disturbed area.91
A third challenge relates to the location of offsets. It is generally argued that offset sites should be located near to the impacted site so the beneficiaries of the offset are the same as those experiencing loss due to negative impacts of development. There are cases, however, where this may not be feasible, due to the lack of an appropriate offset site in close proximity to the impact site, or practical, due to the potential to realize greater conservation benefits by locating the offset site farther away from the impact site.
Finally, there is the challenge of additionality. Additionality is achieved when the conservation action undertaken to offset negative impacts would not have happened if not for the offset project. Questions remain with respect to both the definition and measurement of additionality.92 Offset programs address this challenge by articulating definitions for additionality and through the metrics that they employ or recommend.
4.3 Review of Offset Programs
To identify the ways in which the challenges identified above have been addressed in offset programs that are either in place or under consideration, eight offset programs were reviewed in detail. Details on the programs are contained in Appendix C. The findings of the review are summarized in this section of the report.
A total of eight offset programs were reviewed. The programs were chosen for one of several reasons: they are long running offset programs; they are based on best practices; they employ the latest thinking on offset metrics
and design; or they are of particular relevance to Alberta. The eight frameworks are:
1. Business and Biodiversity Offset Program’s Standard on Biodiversity Offsets (BBOP)
2. UK Department for Environment, Food and Rural Affairs Biodiversity Offsetting (DEFRA)
3. Western Australia Environmental Protection Authority’s Environmental Offsets Policy (WA)
4. New Zealand Department of Conservation’s Biodiversity Offsets Programme (NZ BOP)
5. The Environment Bank
6. Alberta Conservation Association’s Conservation Offset Framework for Alberta (ACA)
7. US Fish and Wildlife Service’s Conservation Banking Program (FWS)
8. The Willamette Partnership
90 Doswald, N., Barcellos Harris, M., Jones, M., Pilla, E., and Mulder, I. (2012) Biodiversity offsets: voluntary and compliance regimes. A review of existing schemes, initiatives and guidance for financial institutions. UNEP-WCMC, Cambridge, UK. UNEP FI, Geneva, Switzerland
91 Croft, Chad, Todd Zimmerling, Karl Zimmer, 2011, Conservation Offsets: A Working Framework for Alberta, Alberta Conservation Association.
92 Doswald, N., Barcellos Harris, M., Jones, M., Pilla, E., and Mulder, I. (2012) Biodiversity offsets: voluntary and compliance regimes. A review of existing schemes, initiatives and guidance for financial institutions. UNEP-WCMC, Cambridge, UK. UNEP FI, Geneva, Switzerland
66
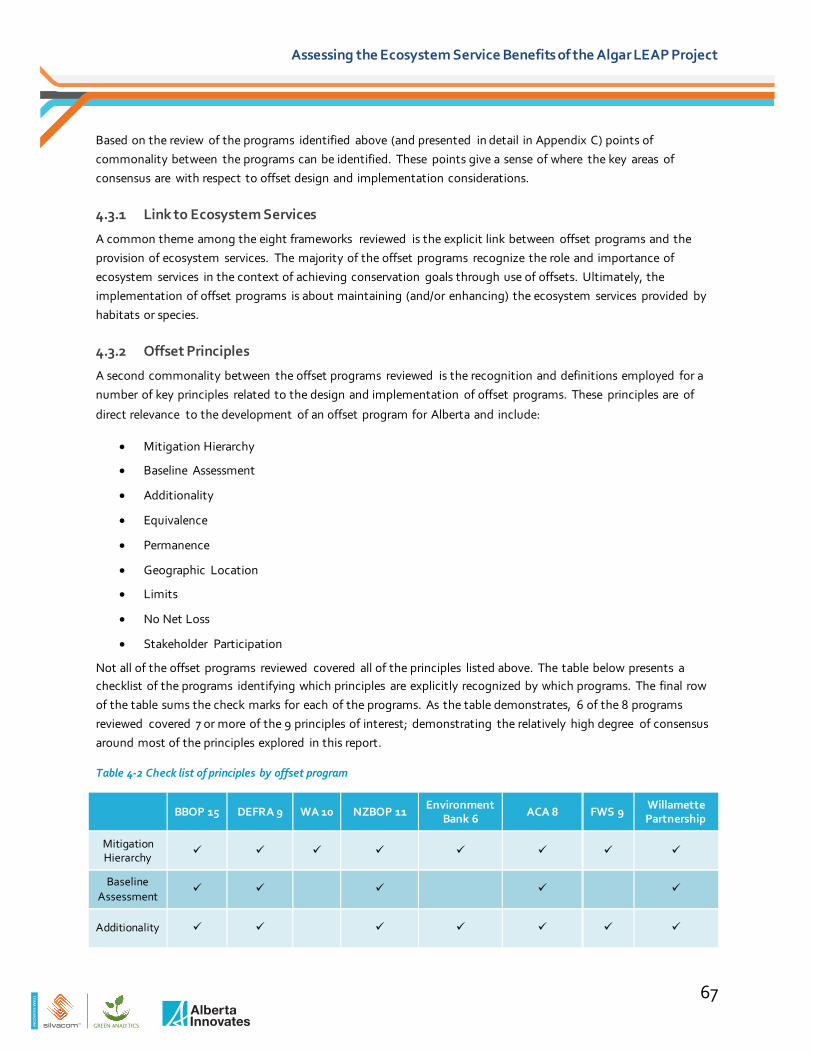
TE
AM
SIL
VA
CO
M
Assessing the Ecosystem Service Benefits of the Algar LEAP Project
Based on the review of the programs identified above (and presented in detail in Appendix C) points of commonality between the programs can be identified. These points give a sense of where the key areas of consensus are with respect to offset design and implementation considerations.
4.3.1 Link to Ecosystem Services
A common theme among the eight frameworks reviewed is the explicit link between offset programs and the provision of ecosystem services. The majority of the offset programs recognize the role and importance of ecosystem services in the context of achieving conservation goals through use of offsets. Ultimately, the implementation of offset programs is about maintaining (and/or enhancing) the ecosystem services provided by habitats or species.
4.3.2 Offset Principles
A second commonality between the offset programs reviewed is the recognition and definitions employed for a number of key principles related to the design and implementation of offset programs. These principles are of
direct relevance to the development of an offset program for Alberta and include:
• Mitigation Hierarchy
• Baseline Assessment
• Additionality
• Equivalence
• Permanence
• Geographic Location
• Limits
• No Net Loss
• Stakeholder Participation
Not all of the offset programs reviewed covered all of the principles listed above. The table below presents a checklist of the programs identifying which principles are explicitly recognized by which programs. The final row of the table sums the check marks for each of the programs. As the table demonstrates, 6 of the 8 programs reviewed covered 7 or more of the 9 principles of interest; demonstrating the relatively high degree of consensus around most of the principles explored in this report.
Table 4-2 Check list of principles by offset program
BBOP 15 DEFRA 9 WA 10 NZBOP 11 Environment Bank 6 ACA 8 FWS 9 Willamette
Partnership
Mitigation Hierarchy
Baseline Assessment
Additionality
67

TE
AM
SIL
VA
CO
M
Assessing the Ecosystem Service Benefits of the Algar LEAP Project
Equivalence
Permanence
Geographic Location
Limits
No Net Loss
Stakeholder Participation
Sum 9 7 7 9 5 8 7 4
Mitigation Hierarchy is the only principle that is common across all programs, demonstrating both its importance to offset design and implementation and the high degree of consensus around the need for offset programs to adhere to such a principle. Indeed, every program reviewed recognizes that offsets cannot be awarded unless
impact avoidance, minimization and rehabilitation are first exhausted.
A high degree of consensus also exists for additionality, equivalency and permanence. These principles were explicitly recognized in 7 out of 8 offset programs, which imply that they are important components of offset
programs; this would be the case in Alberta as well.
The next highest degree of consensus exists for geographic location and limits. Related to these principles is how various offset programs address the risk of offset failure or account for pushing limits related to uncertainty, time and location. Some of the offset programs incorporate the use of offset ratios or multipliers in their metrics to account for such risks. The ACA program, for example, requires that developers offset outside the natural sub-region in which development is taking place by at least doubling the area of habitat required for offsetting disturbance (applying an offset ratio of either 2:1 or 10:1). Other programs (DEFRA and the Environment Bank, which recommends the use of the DEFRA metric) apply multipliers to account not just for the risk of divergences in location, but also to the expected degree of difficulty associated with re-creation or restoration and the time lag
between implementing the offset and achieving equivalency.
4.3.3 Offset Metric
A number of metrics have been established to measure offset gains and losses in such a way as to achieve the desired principles of any given program. The metrics specified in the BBOP and NZ BOP (which recommends the use of the BBOP metric) programs consider the irreplaceability and vulnerability of the habitat being developed. For the purposes of these programs, more vulnerable and irreplaceable habitats are scored higher, and these scores are cross-referenced with the area and condition of the habitat, both pre- and post-development. The total score for biodiversity loss must not be larger than the total score for potential biodiversity gain. This metric is
referred to as the habitat hectares approach and is perhaps the most well-known conservation offset metric.
68

TE
AM
SIL
VA
CO
M
Assessing the Ecosystem Service Benefits of the Algar LEAP Project
The DEFRA and Environment Bank (which recommends the use of the DEFRA program) programs employ what is considered to be a “modified” habitat hectares approach. These programs are concerned with habitat distinctiveness and condition, as well as the difficulty of re-creating and restoring habitat, to determine biodiversity gains and losses. High habitat distinctiveness per hectare and high habitat condition per hectare are scored higher, and these values are cross-referenced against each other in a matrix to achieve an overall score. To account for risk, a multiplier is applied to the overall scores (the higher the difficulty, the higher the score) and an offset requirement is determined accordingly.
The ACA program suggests the use of a ratio approach that takes into account the rarity of the habitat being developed. Offset sites that are equally rare or rarer than impact sites, need to be secured at a ratio of 1:1, meaning that one hectare of offset area is required to offset one hectare of developed land. However, offset sites that are more common than a disturbed site must be secured at a ratio greater than 1:1 to 4:1, depending on the level of rarity of both sites. If the geographic location of the offset site is outside of the natural sub-region of the
impact site, the offset ratio increases.
The FWS and the Willamette Partnership frameworks are similar in that they are both conservation bank-type systems. The FWS focuses on endangered species and offsets are registered in the bank to be withdrawn by developers who must compensate for disturbing habitat of endangered species. In much the same way, conservation credits generated by creating, restoring or conserving habitat in the Willamette Partnership framework are registered in a global system and can be withdrawn by project developers that disturb the environment. The metric used by the Willamette Partnership is based on the effectiveness of habitat functions (e.g. water quality, aquatic species support). The habitat function effectiveness scores (calculated per acre of habitat) are averaged and multiplied by 0.1 times the number of acres developed/conserved to calculate the number of credits that are added to the registry or withdrawn by developers. The FWS framework metric, on the other hand, is based on the number of threatened species and the size of the habitat they need to survive and is determined on a case-by-case basis. If two threatened species are displaced by development, then habitat needs
to be created or restored that can support the same two species.
The WA framework does not use metrics at all but rather determines offset requirements on a case-by-case basis by looking at the characteristics of the environment being disturbed (e.g. food provision, nutrient cycling, etc.) and by offsetting the same characteristics.
4.4 Articulating an Offset Framework for Alberta
The experience of other jurisdictions and the comparison of offset programs presented above can help inform and advance the articulation of an offset framework for the province of Alberta. First, experience demonstrates that there are a number of policy tools that are critical to the design and implementation of an offset system. These
tools enable governments to establish set rules for quantifying and calculating offset credits and include:
• Legal framework: Legal frameworks or policies that oversee conservation and environmental stewardship in the jurisdiction of interest are essential to offset frameworks, as they provide the policy background to inspire offset design and substantiate their use. As was noted earlier, through the Alberta Land Stewardship Act, Alberta already has the legal framework required to pursue offsets.
69

TE
AM
SIL
VA
CO
M
Assessing the Ecosystem Service Benefits of the Algar LEAP Project
• Measurement protocols: Standardized protocols that define offset qualifications include detailed information on the methodology for measuring offsets. Methodologies might include specific tools such as models, metrics and the rules for using them. A protocol may also set parameters for data monitoring, reporting and verification. A protocol may also have several guidance documents that offer additional direction for offset credit accounting. This type of standardized guidance on the offset process is essential to the successful implementation of an offset system.
• Offset registry and exchange: An offset registry is a web-based mechanism that accounts for who has claims over which offsets; ideally it could also take on the roles of registering, buying and selling, creating, and retiring offsets, although these roles can be fulfilled by a separate exchange system. The accounting components is essential to an offset market because it ensures transparency and accountability in credit transactions by tracking each verified offset credit through the use of unique serialization techniques. This prevents double use of offsets by accounting for credits from creation to retirement.93 The other components that facilitate exchange are useful to reducing search and transaction costs in order to gain efficiencies from a market approach.
In addition to the policy tools identified above, a number of key lessons have emerged from experience with offset programs in place elsewhere. The BBOP is considered a global biodiversity offset standard whose methods and principles have been adopted by offset frameworks worldwide. Lessons from the experience of BBOP are
presented in the table below.
Table 4-3 Lessons learned from BBOP offset projects94
Be clear about what offsets are trying to achieve: Objectives must be explicitly defined to provide direction and measure offset success.
Know the ecosystems and the landscape context: It is important for governments, developers and verifiers to understand the implications of the proposed development on the ecosystem, its functions, and its ability to provide services to humans.
Understand communities’ needs and work with them: Communities that are dependent on natural resources are often heavily impacted by development. It is important that the offset process is sensitive to the social, economic and cultural context of the affected communities.
Choose an appropriate approach: In offset frameworks that quantify impacts and offsets on a case-by-case basis, the method for offsetting should be sensitive to the desired outcome, the budgets and timeframes, and the socio-economic and cultural context of the project site.
Collaborate and communicate openly: Effective engagement is important for securing buy-in from all stakeholders, which is critical to offset success. Frameworks should reflect stakeholder engagement as a key component of the offset process.
Be cautious: Where the success of offsets is not certain, approaches that account for this risk should be taken. This might include selecting larger areas for offsetting or undertaking additional conservation measures. Additionally, when ecological function cannot be measured with great certainty, offsetting a habitat with notably higher ecological function will account for this uncertainty. It is always better to offset too much than too little.
93 Haugen-Kozyra, K. February 2012. Conservation Offsets in Southern Alberta: Advice on Implementation. A report submitted to Alberta Agriculture and Rural Development. KHK Consulting Ltd. and the Prasino Group, Alberta. ONLINE: http://www.prasinogroup.com/pdfs/Conservation%20Offsets%20in%20Southern%20Alberta.pdf
94 Adapted from Business and Biodiversity Offsets Programme. 2009. Compensatory Conservation Case Studies. BBOP, Washington, D.C. ONLINE: http://www.forest-trends.org/documents/files/doc_3123.pdf
70
TE
AM
SIL
VA
CO
M
Assessing the Ecosystem Service Benefits of the Algar LEAP Project
Think ahead and long term: Environmental assessments should be undertaken before planning development so that areas of special ecological concern can be identified. Both development and offset approaches can be planned to account for them.
A number of conclusions can also be drawn from the review and comparison of the offset programs presented in this report. First, such a program should include explicit recognition for the principles for which there is the greatest degree of consensus, including: mitigation hierarchy, additionality, equivalence, permanence, geographic location and limits. While specific definitions for these principles vary from program to program, their importance in an offset program is firmly established. General definitions, drawn from the offset programs reviewed in this study, are presented here:
• Mitigation Hierarchy - Offsets can be undertaken for residual adverse impacts identified after avoidance, minimization and on-site mitigation and rehabilitation measures have been maximized.
• Additionality - An offset should achieve conservation outcomes above and beyond results that would have occurred if the offset had not taken place and thus not be used to deliver something that would have happened anyway.
• Equivalence – The program needs to ensure that the gains achieved through the offsets are comparable to the losses experienced at the development site from conservation, ecological and local stakeholder perspectives.
• Permanence – Offset outcomes should last at least as long as the impacts associated with developments and preferably in perpetuity.
• Geographic Location – To the greatest extent possible and feasible, the offset site should be located in the same geographic location as the development site. Exceptions may exist, for example when conservation goals can be better achieved by locating an offset elsewhere; in such cases penalties may be applied.
• Limits - Environmental offsets are not appropriate in all circumstances, such as when residual impacts cannot be fully compensated for by an offset because of the irreplaceability or vulnerability of the habitat or biodiversity affected by development.
The specific metrics and steps employed to undertake an offset project vary by program and region. The general approach employed, however, in most of the programs reviewed is largely the same. A brief summary of steps associated with undertaking an offset project is described here. Drawing from the examples reviewed in this report, the following steps serve as a starting place for discussions on an appropriate process for undertaking
offsets in Alberta.
Step 1: Apply the mitigation hierarchy at the development site to identify residual impacts for which offsets
would be required.
Step 2: Undertake a baseline assessment of the development site to identify, quantify and map relevant habitat characteristics. Characteristics of interest include size, type, condition, vulnerability, irreplaceability, and
distinctiveness.
71

TE
AM
SIL
VA
CO
M
Assessing the Ecosystem Service Benefits of the Algar LEAP Project
Step 3: Calculate residual loss by habitat type taking into consideration relevant habitat characteristics. Characteristics can be accounted for by weighting the amount of each type of habitat required by variables that reflect the characteristics of interest (for example low distinctiveness can be weighted lower than high
distinctiveness, as is done in the DEFRA program).
Step 4: Calculate potential gains from alternative offset sites taking into consideration risk factors (through use of multipliers) such as difficulty of re-creation and restoration, proximity of offset site to development site, and
the expected time lag associated with undertaking the offset projects.
Step 5: Compare potential offset options to select the most appropriate offset project matching losses at the development site with potential gains at the alternative offset sites.
Step 6: Undertake offsets as well as appropriate monitoring over time.
Within the framework of steps described above, it is necessary to employ a specific metric to calculate the losses at the development site and the potential gains at the offset site. The habitat hectares methodology employed by the BBOP is the most commonly used metric with the DEFRA metric being a modified version of it. These metrics, or some version of them, are an appropriate starting place for discussions on a metric for use in Alberta. To test their applicability in the province they will be applied to a location in the province that has undergone restoration.
4.5 Summary
In this section of the report we presented the findings of a review of eight different offset programs that are either currently in place or are under consideration in a number of places around the world. The review was used to identify key areas of commonality across programs and demonstrate the principles for which there is a high degree of consensus. This is true, for example, for the mitigation hierarchy, additionality, equivalence, permanence and geographic limits. The development and articulation of offset steps and metrics are, in general, designed to achieve, at a minimum, these key principles. The metrics employed take into consideration geographic area and location, as well factors such as irreplaceability, vulnerability, time lags and the difficulty of
successfully completing re-creation and restoration projects.
72

TE
AM
SIL
VA
CO
M
Assessing the Ecosystem Service Benefits of the Algar LEAP Project
CONCLUSION5.The absence of markets for ecosystem services such as clean air, carbon storage and water purification is an example of market failure. It is well established that the lack of economic value for environmental goods and services generally leads to over-exploitation and degradation of these resources.95 Devising a means to integrate restoration activities into public and private decision-making requires an understanding of the relative net-benefit of implementing such management practices as it relates to measurement units that can be directly related to human well-being (e.g. ecosystem services). According to Kareiva et. al.96, mainstreaming ecosystems starts with a systematic method for characterizing the value of ecosystem services and the change in value resulting from alternative policies or human activities. Within this context, this report has presented the results of a detailed study of the ES gains resulting from the application of the LEAP restoration framework to the Algar region of Alberta. The primary objective of the Algar case study was to assess the change in ecosystem services resulting from the application of LEAP and to measure the costs and benefits resulting from the associated restoration
activities.
The table below summarizes the findings of the ES assessment and demonstrates the estimated quantity of the gains in services resulting from the application of the LEAP framework to the Algar region.
Table 5-1 Ecosystem service assessment summary - Algar area scale
ECOSYSTEM SERVICE FUTURE STATE ASSESSMENT PHYSICAL CHANGE
PROPORTIONATE CHANGE (%)
Control Restoration
Growing Stock (m3) 6,695,000 6,703,000 8,000 0.12%
Carbon Storage (tonnes) 15,700,000 15,718,000 18,000 0.11%
Caribou Habitat - area intact (ha) 9,900 22,700 12,800 56%
Water Purification (Kg/year):
Phosphorus 6,700 5,300 -1,400 ↓20%
Nitrogen 23,000 21,700 -1,300 ↓ 6%
Total Suspended Solids 3,993,000 3,862,000 -131,000 ↓ 3%
Biodiversity (% intactness) 95.96% 96.73% 0.77% 0.77%
The table below presents the results of the CBA when a discount rate of 2% is employed. The table demonstrates the estimated value of the gains in ES realized as a result of the application of LEAP to the Algar region as a whole (not just the treatment area).
95 Cropper, M., Oates, W., 1992. Environmental economics: a survey. Journal of Economic Literature 30, 675–740; Bingham, G., Bishop, R., Brody, M., Bromley, D., Clark, E.T., Cooper, W., Costanza, R., Hale, T., Hayden, G., Kellert, S., 1995. Issues in ecosystem valuation: improving information for decision making. Ecological Economics 14 (2), 73–90; Costanza, R., d'Arge,R., deGroot, R., Farber, S., Grasso, M., Hannon, B., Limburg, K., Naeem,S., O'Neill, R., Paruelo, J., Raskin, R., Sutton, P., van den Belt, M., 1997. The value of the world's ecosystem services and natural capital. Nature 387 (6630), 253–260. 96 Kareiva, P. , Tallis, H., Rickets, T.H., Daily, G. and Polasky, S. 2011. “Natural Capital: Theory and Practice of Mapping Ecosystem Services. Oxford University Press, New York.
73
Note: Please see disclaimer on page 4 when reviewing the ecosystem service assessment and valuation results
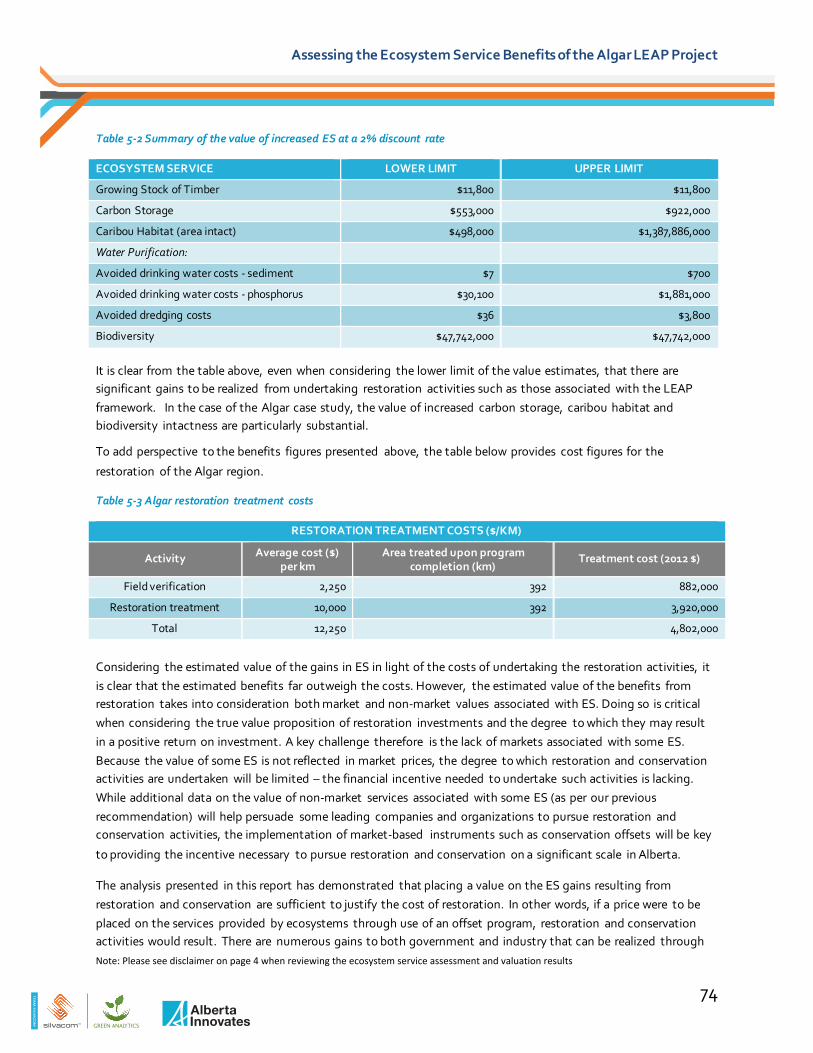
TE
AM
SIL
VA
CO
M
Assessing the Ecosystem Service Benefits of the Algar LEAP Project
Table 5-2 Summary of the value of increased ES at a 2% discount rate
ECOSYSTEM SERVICE LOWER LIMIT UPPER LIMIT
Growing Stock of Timber $11,800 $11,800
Carbon Storage $553,000 $922,000
Caribou Habitat (area intact) $498,000 $1,387,886,000
Water Purification:
Avoided drinking water costs - sediment $7 $700
Avoided drinking water costs - phosphorus $30,100 $1,881,000
Avoided dredging costs $36 $3,800
Biodiversity $47,742,000 $47,742,000
It is clear from the table above, even when considering the lower limit of the value estimates, that there are significant gains to be realized from undertaking restoration activities such as those associated with the LEAP framework. In the case of the Algar case study, the value of increased carbon storage, caribou habitat and biodiversity intactness are particularly substantial.
To add perspective to the benefits figures presented above, the table below provides cost figures for the
restoration of the Algar region.
Table 5-3 Algar restoration treatment costs
RESTORATION TREATMENT COSTS ($/KM)
Activity Average cost ($) per km
Area treated upon program completion (km)
Treatment cost (2012 $)
Field verification 2,250 392 882,000
Restoration treatment 10,000 392 3,920,000
Total 12,250 4,802,000
Considering the estimated value of the gains in ES in light of the costs of undertaking the restoration activities, it is clear that the estimated benefits far outweigh the costs. However, the estimated value of the benefits from restoration takes into consideration both market and non-market values associated with ES. Doing so is critical when considering the true value proposition of restoration investments and the degree to which they may result in a positive return on investment. A key challenge therefore is the lack of markets associated with some ES. Because the value of some ES is not reflected in market prices, the degree to which restoration and conservation activities are undertaken will be limited – the financial incentive needed to undertake such activities is lacking. While additional data on the value of non-market services associated with some ES (as per our previous recommendation) will help persuade some leading companies and organizations to pursue restoration and conservation activities, the implementation of market-based instruments such as conservation offsets will be key
to providing the incentive necessary to pursue restoration and conservation on a significant scale in Alberta.
The analysis presented in this report has demonstrated that placing a value on the ES gains resulting from restoration and conservation are sufficient to justify the cost of restoration. In other words, if a price were to be placed on the services provided by ecosystems through use of an offset program, restoration and conservation activities would result. There are numerous gains to both government and industry that can be realized through
74
Note: Please see disclaimer on page 4 when reviewing the ecosystem service assessment and valuation results

TE
AM
SIL
VA
CO
M
Assessing the Ecosystem Service Benefits of the Algar LEAP Project
the pursuit of an offset scheme (e.g. identification of areas of strategic importance, cost-effectiveness, flexibility, access to land and capital, social license to operate and more). Should such a scheme be pursued in Alberta, then interest in the assessment of ES gains resulting from frameworks such as LEAP will increase.
To provide more confidence to policy-makers and market-players, further applied research in this area is required as the results are not without their caveats. Below we outline some of the key areas that applied research and analysis in this area could be focused to advance current practice of ES Assessments, Cost-Benefit Analysis and
overall adoption of reclamation activities in Alberta.
The models employed in estimating the gains in ES presented in the table above are currently preliminary, they are in keeping with the direction such assessments are taking in other leading jurisdictions. That is to say they are spatially explicit and account, where possible and applicable, for the flow of the ES from source to use accounting
for sinks along the flow route.
This project involved the deployment of new research and tools developed through the Ecosystem Service Roadmap. As these are early days in the use of the models and ground breaking research, more work is to be done. Below are a few of the next steps that are required to bring further precision to the ES Assessment and CBA
results.
• To further refine and improve the models, we recommend that they undergo a formal peer review process.
• We recommend the application of the models to other data rich study areas, especially those where monitoring data is available. Applying the models to such areas will allow the comparison of the model outputs with primary data, thereby testing the validity of the model results.
• It would also be beneficial to expand the ES assessment models to incorporate additional ES, in particular those associated with cultural values, and to adjust the water purification model to break-out the services provided by wetlands.
• Further, socio-economic research is required to better understand the value that Albertans place on benefits to ecosystem services like those deployed in this study. Two of three of these values were estimated using non-market valuation approaches. As was discussed previously, there is a degree of uncertainty associated with the valuation of non-market services and that uncertainty is inherent in the results presented above. Until such time as a market is established for non-market services, such as caribou habitat, it will remain necessary to estimate the value of such services using alternative, non-market approaches. Thus, to minimize the uncertainty associated with such estimates, we recommend that additional data be collected on the value of specific ES to their beneficiaries and that, to the greatest extent possible, such data be Alberta specific.
• We recommend that to drive broader scale adoption of mitigation measures that benefit ecosystem services, the Government of Alberta consider adopting a market-based policy option like conservation offsets.
• There is a high degree of consensus on the principles upon which an offset scheme should be based, however there remains debate about how to translate the principles into a measurable metric for an offset (e.g. habitat hectare metric, modified habitat hectare metric, other). It is therefore recommended
75
TE
AM
SIL
VA
CO
M
Assessing the Ecosystem Service Benefits of the Algar LEAP Project
that further work be carried out to determine how best to translate principles into an appropriate metric for Alberta.
Alberta already has the required legislative framework in place to enable the use of MBAs in general and quantity-based MBAs such as offsets more specifically. The Alberta Land Stewardship Act (ALSA)97 sets the framework for offsets to be used for restoration, mitigation or conservation. It provides a legal basis for the government to establish an offset program and to set rules for defining and trading offsets.98 The time is now to establish, test, validate and refine the methods by which changes in ES will be measured.
97 The content for this section is pulled directly, word for word, from Government of Alberta, “Alberta Land Stewardship Act Conservation Tools” (April 29, 2009). http://alberta.ca/home/NewsFrame.cfm?ReleaseID=/acn/200904/25803E9093830-088F-F98A-70A7DF158F1CDF66.html
98 Davis LLP, “Alberta’s Proposed Land Stewardship Legislation: Effects on Conservation Tools” (2009). http://www.davis.ca/en/blog/Environmental-Energy-and-Resources-Law/2009/05/15/Albertas-Proposed-Land-Stewardship-Legislation-Effects-on-Conservation-Tools
76
TE
AM
SIL
VA
CO
M
Assessing the Ecosystem Service Benefits of the Algar LEAP Project
LESSONS LEARNED 6.
• The valuable contribution made by the Advisory Committee was a key factor in the success of this project. The input and feedback they provided during the project served as a guide in the selection of approaches employed. Moreover, their level of support and engagement throughout the life of the project promoted an open and transparent outlet for communicating diverse opinions from a range of perspectives
• Much remains to be understood in terms of how ecosystem services are provided and the factors influencing the provision of ecosystem services
• The topic of this study is of high interest and value to the province and further work in the area is warranted • Depending on the geographic location of ecosystem services like those reviewed in this study, there are other
examples of value that may warrant consideration (ie. recreational and cultural value) • More research is required quantifying the role of biodiversity in ecosystem function and service provision • The complexity of assessing ecosystem services and assigning value is fraught with technical challenges and
requires key assumptions to be employed • Undertaking an initiative of this nature requires the engagement of a full suite of stakeholders • Although this project was well represented by a diverse group of engaged stakeholders, gaps remain in
representation from First Nations groups. Strategies need to be identified to move towards full representation
• Through inter-agency collaboration and by building upon work already underway, a number of efficiencies were realized which contribute to the broader network of research on ecosystem services and conservation offsets
• Where available, market prices should be employed when estimating the value of ecosystem services. In the absence of market prices, the availability of data serves as a guide to selecting the most appropriate valuation method
• In cases where there is no preferred approach for valuing a given ecosystem service, it is best to employ more than one method to provide a reasonable range of benefits
• The risk of double-counting must be considered when selecting ecosystem services to include in a cost-benefit analysis
• The timeframe selected for a cost-benefit analysis has a critical effect on its results – a narrow timeframe may lower the net present value of a project by overlooking future benefits, while a lengthy timeframe may overestimate future benefits. It is therefore important to select a timeframe which encompasses all the
important benefits and costs likely to result from the activity
77

TE
AM
SIL
VA
CO
M
Assessing the Ecosystem Service Benefits of the Algar LEAP Project
GLOSSARY 7.
Anthropogenic Footprint Areas: Land that has been disrupted due to oil and gas exploration. This includes, but is
not limited to seismic lines, core holes, facilities, pipelines, wells, and roads.
Area Intact: Unbroken expanse of natural ecosystems within the forest, showing no signs of significant human activity, and large enough that all native biodiversity, including viable populations of wide-ranging species, could
be maintained.
Biodiversity: Biological diversity or biodiversity means the variability among living organisms from all sources including, inter alia, terrestrial, marine, and other aquatic ecosystems and the ecological complexes of which they
are part; this includes diversity within species, between species, and of ecosystems.
Bitumen: A type of naturally occurring petroleum deposit that exists in a semi-solid or solid state. It is black,
heavy, and thick in consistency.
Carbon Price: A charge on fossil fuels (coal, oil, natural gas) based on their carbon content. When burned, the
carbon in these fuels becomes carbon dioxide in the atmosphere.
Census subdivision: Area that is a municipality or an area that is deemed to be equivalent to a municipality for statistical reporting purposes (e.g., as an Indian reserve or an unorganized territory). Municipal status is defined by
laws in effect in each province and territory in Canada.
Coniferous tree: Cone-bearing trees with needles or scale-like leaves. Often referred to as softwood.
Contingent Valuation: Directly asks people what they are willing to pay for a benefit and/or willing to receive in compensation for tolerating a cost through a survey or questionnaire. Personal valuations for increases or decreases in the quantity of some good are obtained contingent upon a hypothetical market. The aim is to elicit valuations or bids which are close to what would be revealed if an actual market existed.
Deciduous tree: Tree and shrub species that lose their leaves annually. The wood of these trees is referred to as
hardwood.
Discount Rate: The degree to which future dollars are discounted relative to current dollars. Economic analysis generally assumes that a given unit of benefit or cost matters more if it is experienced now that if it occurs in the future. The degree to which the importance that is attached to gains and losses in the future is known as discounted. The present is more important due to impatience, uncertainty, and the productivity of capital.
Forest Management Agreement: A renewable agreement between the Alberta government and a company that grants that company the rights and obligations to manage, grow and harvest timber in a specified area on a
sustained yield basis.
Growing Stock: The sum (by number, basal area or volume) of trees in a forest or a specified part of it.
78

TE
AM
SIL
VA
CO
M
Assessing the Ecosystem Service Benefits of the Algar LEAP Project
Human Footprint: Areas affected by human-caused disturbances such as residential and commercial
development, agriculture, forestry and other industrial activities.
Intrinsic Value: Value that resides 'in' something and that is unrelated to human beings altogether.
Landscape: A landscape (or LMU) is a heterogeneous area in which the pattern of the mosaic of local ecosystems or land uses is repeated in similar form throughout kilometres wide area. Landscapes may coincide with a climatic, physiographic or ecological boundary. However, landscapes are not strictly ecologically based and
include human use and modification of the area.
Marginal: The additional or extra quantity of something.
Market: A network in which buyers and sellers interact to exchange goods and services for money.
Opportunity Cost of Conservation: Any benefit generated by alternative land use which are forgone due to
conservation of the land.
Present Value: Value today of a sum to be paid or collected in the future to buy a good or service.
Reclamation: Returning disturbed land to a vegetated state.
Restoration: An area for which reclamation has occurred and ecological function has been re-established. For the
purpose of this analysis, restoration is complete when vegetation has reached 1.2 meters in height.
Seral Stage: A particular stage (ecological community) in a sere, or pattern of succession. Applies to forest succession in the context of this study.
Social Costs: Private costs plus external costs.
Surrogate Market: In the absence of clearly defined markets, the value of environmental resources can be derived from information acquired through surrogate markets.
Total Suspended Solids: Matter suspended in water or wastewater.
Township: A land survey system that divides the land into 6 mile by 6 mile squares.
Utilization: The portion of the stand or individual tree used for manufacture of wood products, defined in terms
of piece length and diameter at each end. Minimum standards for utilization are defined in the timber disposition.
Watershed: An area of land, which may or may not be under forest cover, draining water, organic matter,
dissolved nutrients, and sediments into a lake or stream.
WTP (Willingness to Pay): Maximum amount of money one would give up to buy some good.
Yield curves: A graphical summary showing the characteristics of one or more tree species on different sites at
different ages.
79

TE
AM
SIL
VA
CO
M
Assessing the Ecosystem Service Benefits of the Algar LEAP Project
APPENDIX A. JURISDICTIONAL SCAN OF ECOSYSTEM SERVICES ASSESSMENTS The series of tables below summarize key ES assessments that have been completed in various regions around the world. The summaries were pulled from a report completed by Green Analytics for ABMI in which the methods employed for ES assessments globally were identified and summarized. They are presented here to demonstrate the range and type of assessment that have been undertaken. The assessments reviewed are as follows:
• Arctic Biodiversity Trends 2010: Selected Indicators of Change
• Assessment of Rangeland Ecosystem Conditions, Salt Creek Watershed and Dugout Ranch, Southeastern Utah
• Biodiversity of the Wetlands of the Kakadu Region, Northern Australia
• Canadian Biodiversity: Ecosystem Status and Trends 2010
• Caribbean Sea Ecosystem Assessment (CARSEA)
• Colombian Sub-global Assessment Report: Ecological Function Assessment in the Colombian Andean Coffee-growing Region
• Ecological Assessment of the Boreal Shield Ecozone
• Ecosystem Services and Western U.S. Rangelands
• Ecosystems and Human Well-being: Wetlands and Water Synthesis
• Assessing Future Ecosystem Services: a Case Study of the Northern Highlands Lake District, Wisconsin
• Norwegian Millennium Ecosystem Assessment: Pilot Study 2002
• Portugal Millennium Ecosystem Assessment: State of the Assessment Report
• Ecological Services to and from Rangelands of the United States
The assessments presented here were chosen for one of a number of reasons: they focused on an ecosystem service of particular interest to this study (forest health and production, rangeland health and production, water quality and biodiversity); they were referenced as being robust or superior in nature; or they were completed
drawing on the MA framework for ecosystem assessments.
For each study, the tables present the following information:
• Study name
• Authors
• Reference information
• Regions
• Study overview
80
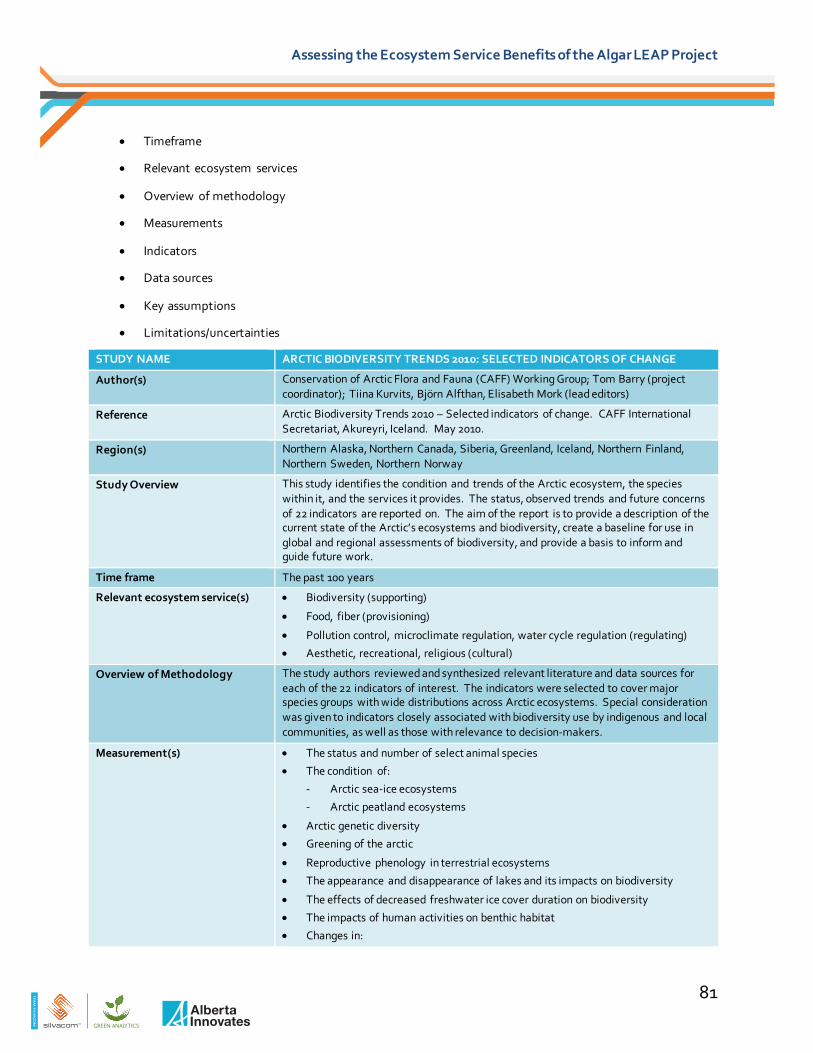
TE
AM
SIL
VA
CO
M
Assessing the Ecosystem Service Benefits of the Algar LEAP Project
• Timeframe
• Relevant ecosystem services
• Overview of methodology
• Measurements
• Indicators
• Data sources
• Key assumptions
• Limitations/uncertainties
STUDY NAME ARCTIC BIODIVERSITY TRENDS 2010: SELECTED INDICATORS OF CHANGE
Author(s) Conservation of Arctic Flora and Fauna (CAFF) Working Group; Tom Barry (project coordinator); Tiina Kurvits, Björn Alfthan, Elisabeth Mork (lead editors)
Reference Arctic Biodiversity Trends 2010 – Selected indicators of change. CAFF International Secretariat, Akureyri, Iceland. May 2010.
Region(s) Northern Alaska, Northern Canada, Siberia, Greenland, Iceland, Northern Finland, Northern Sweden, Northern Norway
Study Overview This study identifies the condition and trends of the Arctic ecosystem, the species within it, and the services it provides. The status, observed trends and future concerns of 22 indicators are reported on. The aim of the report is to provide a description of the current state of the Arctic’s ecosystems and biodiversity, create a baseline for use in global and regional assessments of biodiversity, and provide a basis to inform and guide future work.
Time frame The past 100 years
Relevant ecosystem service(s) • Biodiversity (supporting)
• Food, fiber (provisioning)
• Pollution control, microclimate regulation, water cycle regulation (regulating)
• Aesthetic, recreational, religious (cultural)
Overview of Methodology The study authors reviewed and synthesized relevant literature and data sources for each of the 22 indicators of interest. The indicators were selected to cover major species groups with wide distributions across Arctic ecosystems. Special consideration was given to indicators closely associated with biodiversity use by indigenous and local communities, as well as those with relevance to decision-makers.
Measurement(s) • The status and number of select animal species
• The condition of:
- Arctic sea-ice ecosystems
- Arctic peatland ecosystems
• Arctic genetic diversity
• Greening of the arctic
• Reproductive phenology in terrestrial ecosystems
• The appearance and disappearance of lakes and its impacts on biodiversity
• The effects of decreased freshwater ice cover duration on biodiversity
• The impacts of human activities on benthic habitat
• Changes in:
81
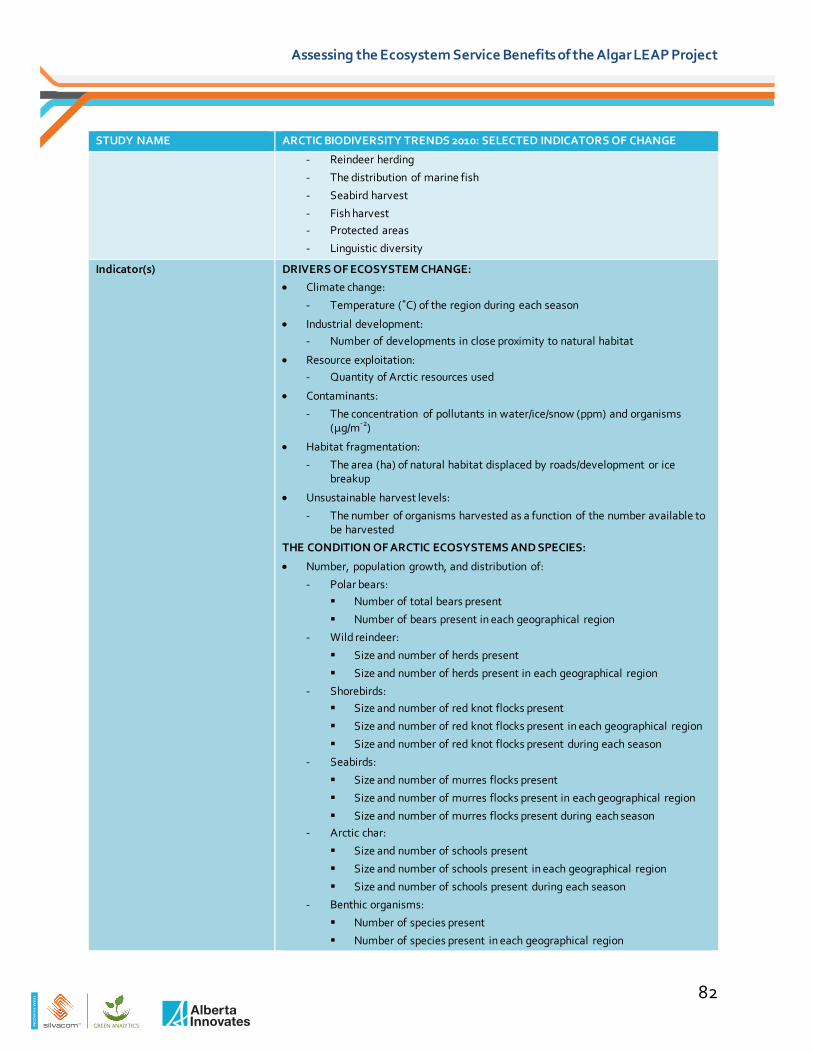
TE
AM
SIL
VA
CO
M
Assessing the Ecosystem Service Benefits of the Algar LEAP Project
STUDY NAME ARCTIC BIODIVERSITY TRENDS 2010: SELECTED INDICATORS OF CHANGE
- Reindeer herding
- The distribution of marine fish
- Seabird harvest
- Fish harvest - Protected areas
- Linguistic diversity
Indicator(s) DRIVERS OF ECOSYSTEM CHANGE:
• Climate change:
- Temperature (˚C) of the region during each season
• Industrial development: - Number of developments in close proximity to natural habitat
• Resource exploitation: - Quantity of Arctic resources used
• Contaminants:
- The concentration of pollutants in water/ice/snow (ppm) and organisms (µg/m-2)
• Habitat fragmentation:
- The area (ha) of natural habitat displaced by roads/development or ice breakup
• Unsustainable harvest levels:
- The number of organisms harvested as a function of the number available to be harvested
THE CONDITION OF ARCTIC ECOSYSTEMS AND SPECIES:
• Number, population growth, and distribution of:
- Polar bears: Number of total bears present
Number of bears present in each geographical region
- Wild reindeer:
Size and number of herds present
Size and number of herds present in each geographical region
- Shorebirds: Size and number of red knot flocks present
Size and number of red knot flocks present in each geographical region
Size and number of red knot flocks present during each season
- Seabirds:
Size and number of murres flocks present
Size and number of murres flocks present in each geographical region
Size and number of murres flocks present during each season - Arctic char:
Size and number of schools present
Size and number of schools present in each geographical region
Size and number of schools present during each season
- Benthic organisms:
Number of species present
Number of species present in each geographical region
82
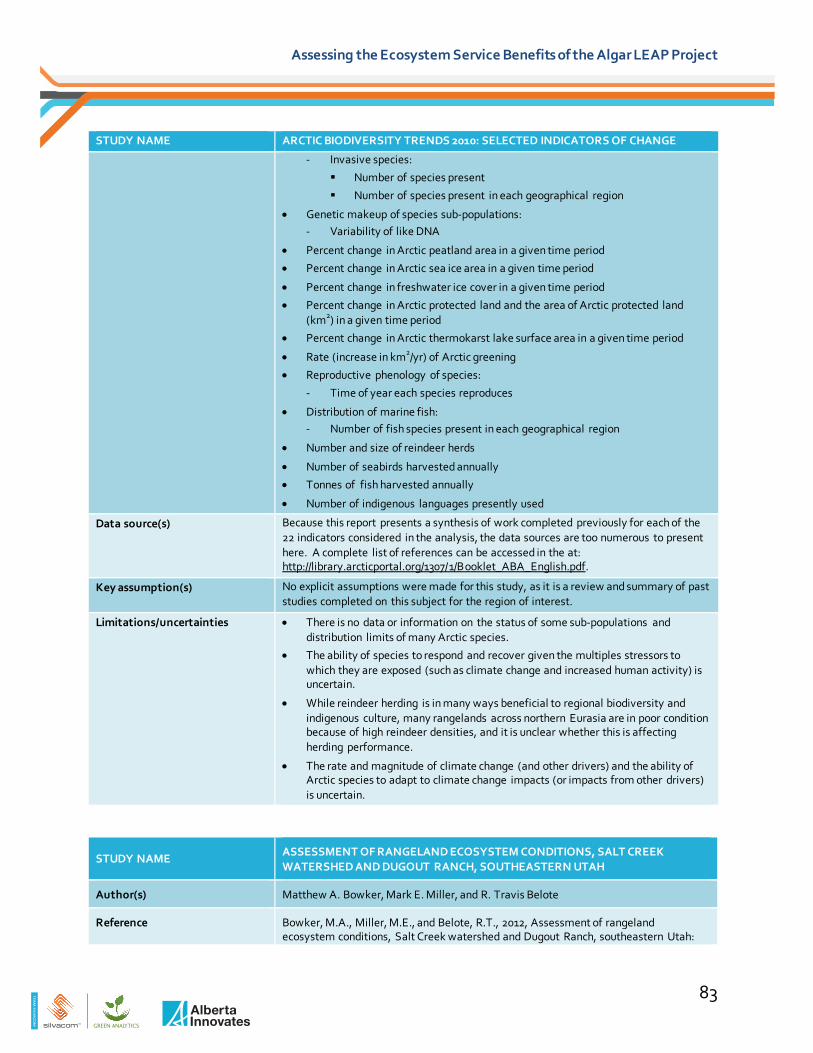
TE
AM
SIL
VA
CO
M
Assessing the Ecosystem Service Benefits of the Algar LEAP Project
STUDY NAME ARCTIC BIODIVERSITY TRENDS 2010: SELECTED INDICATORS OF CHANGE
- Invasive species:
Number of species present
Number of species present in each geographical region
• Genetic makeup of species sub-populations: - Variability of like DNA
• Percent change in Arctic peatland area in a given time period
• Percent change in Arctic sea ice area in a given time period
• Percent change in freshwater ice cover in a given time period
• Percent change in Arctic protected land and the area of Arctic protected land (km2) in a given time period
• Percent change in Arctic thermokarst lake surface area in a given time period
• Rate (increase in km2/yr) of Arctic greening
• Reproductive phenology of species:
- Time of year each species reproduces
• Distribution of marine fish: - Number of fish species present in each geographical region
• Number and size of reindeer herds
• Number of seabirds harvested annually
• Tonnes of fish harvested annually
• Number of indigenous languages presently used
Data source(s) Because this report presents a synthesis of work completed previously for each of the 22 indicators considered in the analysis, the data sources are too numerous to present here. A complete list of references can be accessed in the at: http://library.arcticportal.org/1307/1/Booklet_ABA_English.pdf.
Key assumption(s) No explicit assumptions were made for this study, as it is a review and summary of past studies completed on this subject for the region of interest.
Limitations/uncertainties • There is no data or information on the status of some sub-populations and distribution limits of many Arctic species.
• The ability of species to respond and recover given the multiples stressors to which they are exposed (such as climate change and increased human activity) is uncertain.
• While reindeer herding is in many ways beneficial to regional biodiversity and indigenous culture, many rangelands across northern Eurasia are in poor condition because of high reindeer densities, and it is unclear whether this is affecting herding performance.
• The rate and magnitude of climate change (and other drivers) and the ability of Arctic species to adapt to climate change impacts (or impacts from other drivers) is uncertain.
STUDY NAME ASSESSMENT OF RANGELAND ECOSYSTEM CONDITIONS, SALT CREEK WATERSHED AND DUGOUT RANCH, SOUTHEASTERN UTAH
Author(s) Matthew A. Bowker, Mark E. Miller, and R. Travis Belote
Reference Bowker, M.A., Miller, M.E., and Belote, R.T., 2012, Assessment of rangeland ecosystem conditions, Salt Creek watershed and Dugout Ranch, southeastern Utah:
83
TE
AM
SIL
VA
CO
M
Assessing the Ecosystem Service Benefits of the Algar LEAP Project
STUDY NAME ASSESSMENT OF RANGELAND ECOSYSTEM CONDITIONS, SALT CREEK WATERSHED AND DUGOUT RANCH, SOUTHEASTERN UTAH
U.S. Geological Survey Open-File Report 2012-1061, 56 p.
Region(s) Salt Creek Watershed and Dugout Ranch, Southeastern Utah
Study Overview This study aims to develop an analysis tool for quantitatively assessing rangelands in terms of their ability to provision multiple ecosystem services simultaneously. The objectives of this study are to:
• Characterize the variation in ecosystem structure and properties in several key ecosystem types
• Develop provisional state-and-transition models as a first step in understanding ecosystem dynamics in the region of interest
• Evaluate the functional outcome of hypothesized state changes, focusing on modeled potential wind erosion, carbon storage, forage production, and exotic species invasion
• Conduct an integrative analysis at pasture and watershed levels to evaluate the spatial distribution of various forms of degradation, and provision of multiple ecosystem services
• Make publicly available a large data resource for scientists and resource managers
Time frame 2006-2008
Relevant ecosystem service(s) • Forage production (provisioning)
• Dust retention (regulating)
• Carbon sequestration (regulating)
Overview of Methodology STUDY AREA AND SAMPLING DESIGN:
• The study authors sampled 352 plots in a 1,500 km2 area located on the central Colorado Plateau, which encompasses portions of both currently ungrazed rangeland and rangeland that supports active cattle ranching operations
FIELD METHODS:
• Sampling was conducted along three parallel 50 m transects separated by 25 m
• The study authors estimated the biotic composition of each plot:
- Live fractional cover of vascular plants, biological crust, litter, rocks and bare ground were estimated by line-point intercept sampling with 1 m sampling intervals
- As an indicator of vegetation structure in relation to wind erosion, gaps between perennial plant canopies were measured using line-intercept sampling
- As an indicator of vegetative resistance to overland water flow, gaps between perennial plant bases were measured using line-intercept sampling
- The frequency of exotic plants was measured by their presence or absence at each plot
- Vascular plant community richness was estimated on the basis of all plant species observed at each plot
• The study authors measured the soil-surface attributes of each plot:
84
TE
AM
SIL
VA
CO
M
Assessing the Ecosystem Service Benefits of the Algar LEAP Project
STUDY NAME ASSESSMENT OF RANGELAND ECOSYSTEM CONDITIONS, SALT CREEK WATERSHED AND DUGOUT RANCH, SOUTHEASTERN UTAH
- Fine-scale soil-surface roughness in plant interspaces was measured by draping a 20 cm jewelry chain with 2 mm chain links across surface micro topographic features and measuring the horizontal distance between the two ends of the chain, which was calculated on the basis of five subsample measurements made at 10 m intervals along each transect. From this, a soil
roughness index (SRI) was calculated for each plot as SRI = (1 – )*100
- As an indicator of dust and rock-derived nutrient content in soils of the plots, the magnetic susceptibility of the soil surface was measured with a MS-20 magnetic susceptibility meter with sensitivity of 10-6 SI units. For each plot, average magnetic susceptibility was calculated on the basis of five subsample measurements made at 10 m intervals along each transect
• The study authors estimated the carbon (C) and forage abundance of each plot:
- Different equations for converting percent cover data to biomass estimates, mostly based on linear or polynomial regression, were researched using available literature:
Soil surface C (organic matter) was estimated using an equation developed from data in Bowker et al. (2006) 99
Organic matter biomass was converted to C based on the presumption that about 47.5% of organic matter is C, as stated in Schlesinger (1991) 100
Litter C was estimated based on an equation found in Clark et al. (2008) 101
Litter biomass was converted to kg of C based on the presumption that about 58% of litter is C, as stated in Nelson and Sommers (1996) 102
Rhizomatous grass biomass was estimated based on an equation in Williamson et al. (1987) 103, for which the biomass of Bouteloua gracilis was related to its percent cover
Rhizomatous grass biomass was converted to C based on the presumption that about 47.5% of grass biomass is C, as stated in Schlesinger (1991)
Bunchgrass and shrub biomass was estimated based on Flombaum and Sala (2007) 104, in which equations were developed by pooling multiple species
Bunchgrass and shrub biomass was converted to C based on the presumption that about 47.5 percent of plant biomass is C, as
99 Bowker, M A; Belnap, J; and M E Miller. 2006. Spatial modeling of biological soil crusts to support rangeland assessment and monitoring. Rangeland Ecology and Management, v. 59, p. 519–529.
100 Schlesinger, W H. 1991. Biogeochemistry: An analysis of global change. Academic Press, San Diego, CA. 101 Clark, P E; Hardegree, S P; Moffet, C A; and Pierson, F B. 2008. Point sampling to stratify biomass variability in sagebrush steppe
vegetation. Rangeland Ecology and Management, v. 61, p. 614–622. 102 Nelson, D W and Sommers, L E. 1996. Total carbon, organic carbon, and organic matter in Page et al., (eds.) Methods of Soil Analysis, Part
2, 2nd eds. American Society of Agronomy, Inc. Madison, WI, p. 961 – 1010. 103 Williamson, S C; Detling, J K; Dodd, J L; and Dyer, M I. 1987. Nondestructive estimation of shortgrass aerial biomass. Journal of Range
Management, v. 40, p. 254–256. 104 Flombaum, P and Sala, O. 2007. A non-destructive and rapid method to estimate biomass and aboveground net primary production in arid
environments. Journal of Arid Environments, v. 69, p. 352–358.
85
TE
AM
SIL
VA
CO
M
Assessing the Ecosystem Service Benefits of the Algar LEAP Project
STUDY NAME ASSESSMENT OF RANGELAND ECOSYSTEM CONDITIONS, SALT CREEK WATERSHED AND DUGOUT RANCH, SOUTHEASTERN UTAH
stated in Schlesinger (1991)
Tree biomass was estimated using an equation obtained from Huang et al. (2009) 105
Tree biomass was converted to C based on the presumption that about 47.5 percent of tree biomass is C, as stated in Schlesinger (1991)
• The study authors simulated modeling of dust emissions using a model of wind erosion (WEMO) to investigate effects of measured biophysical attributes on predicted rates of wind-driven soil movement at each plot:
- WEMO was used to predict horizontal dust flux (g cm-1 d-1) on the basis of wind velocity, plant height, the size-class distribution of gaps between canopies, total plant cover, threshold shear velocity (the surface wind velocity required to initiate soil movement and thus is a measure of soil erodibility), and a suite of other variables
STATISTICAL ANALYSIS:
• The study authors performed cluster analysis and developed provisional state-and-transition models:
- Hierarchical cluster analyses were conducted in PC-ORD 4.0 (MJM Software Design) and used to detect groupings of samples within ecological sites
- Clusters were used in developing provisional state-and-transition models, which were hypothesized based on known site history (e.g., grazing status, land treatment history), field observations, and past literature
• The study authors performed integrated analysis of multiple rangeland services and properties:
- A four-step method was developed for determining the status of pastures (‘status’ here is defined as the ability of pastures to sustain key ecosystem services), the typical management unit based on a hierarchical weighted averaging procedure:
1) The appropriate upper bound of status was determined by rescaling four key attributes (total forage, C-storage score, maximal dust emissions, and nativeness) from 0 – 1 within ecological sites
2) The E-score (the value used in a weighted average based upon the proportional abundance of samples in a given ecological site within a given pasture) was calculated by multiplying the percent of each cluster represented by a sample with that cluster’s forage score, and then adding that value to the remaining [percent * forage score] values represented by the sample.
3) The P-score (a composite score for a given functional attribute (e.g., forage score) across a pasture) was calculated using the proportional abundance of ecological sites within pastures as weights.
4) Multiple P-scores were integrated by adapting the multiplicative function index (MFI) from Bowker et al. (2011) 106
105 Huang, C-Y; Asner, G P; Martin, R E; Barger, N N; and Neff, J C. 2009. Multi-scale analysis of tree cover and above ground carbon stocks for pinyon-juniper woodland. Ecological Applications, v. 19, p. 668–681.
106 Bowker, M A; Maestre, F T; and Mau, R L. 2011. What determines semi-arid ecosystem multifunctionality? Biodiversity and patch size distribution of biological crusts. Ecological Monograph, in review.
86
TE
AM
SIL
VA
CO
M
Assessing the Ecosystem Service Benefits of the Algar LEAP Project
STUDY NAME ASSESSMENT OF RANGELAND ECOSYSTEM CONDITIONS, SALT CREEK WATERSHED AND DUGOUT RANCH, SOUTHEASTERN UTAH
RESULTS:
• The study authors’ sampling spanned 15 different ecological sites, 8 different general vegetation types, and multiple land ownership boundaries. Four ecological sites represented about 70% of all samples: Semidesert Sand Loam, Upland Loam, Upland Shallow Loam, and Semidesert Sand. The authors carried out their analyses on each plot and came up with multiple datasets representing the current condition of ecosystem services from various rangeland types (forage production, dust retention and carbon sequestration)
Measurement(s) • The ecological condition of a variety of rangelands in Southeastern Utah
Indicator(s) • Per unit biotic composition of each rangeland type:
- Percent cover of vascular plants, biological crust, litter, rocks and bare ground
- Distance (m) of gaps between perennial plant canopies and bases
- Presence or absence of invasive species
• Soil-surface attributes (as measured by SRI) of each rangeland type
• Carbon storage potential (Kg of C stored) and forage abundance (biomass) per unit of each rangeland type
• Dust emissions from and soil erodibility per unit of each rangeland type:
- Horizontal dust flux (g cm-1 d-1)
• P-score indicators for each pasture sample:
- C-storage
- Dust
- Forage
- Nativeness
- Multifunctionality
Data source(s) • The different equations for converting percent cover data to biomass estimates were adapted from:
- Bowker, M A; Belnap, J; and M E Miller. 2006. Spatial modeling of biological soil crusts to support rangeland assessment and monitoring. Rangeland Ecology and Management, v. 59, p. 519–529.
- Schlesinger, W H. 1991. Biogeochemistry: An analysis of global change. Academic Press, San Diego, CA.
- Clark, P E; Hardegree, S P; Moffet, C A; and Pierson, F B. 2008. Point sampling to stratify biomass variability in sagebrush steppe vegetation. Rangeland Ecology and Management, v. 61, p. 614–622.
- Nelson, D W and Sommers, L E. 1996. Total carbon, organic carbon, and organic matter in Page et al., (eds.) Methods of Soil Analysis, Part 2, 2nd eds. American Society of Agronomy, Inc. Madison, WI, p. 961 – 1010.
- Williamson, S C; Detling, J K; Dodd, J L; and Dyer, M I. 1987. Nondestructive estimation of shortgrass aerial biomass. Journal of Range Management, v. 40, p. 254–256.
87
TE
AM
SIL
VA
CO
M
Assessing the Ecosystem Service Benefits of the Algar LEAP Project
STUDY NAME ASSESSMENT OF RANGELAND ECOSYSTEM CONDITIONS, SALT CREEK WATERSHED AND DUGOUT RANCH, SOUTHEASTERN UTAH
- Flombaum, P and Sala, O. 2007. A non-destructive and rapid method to estimate biomass and aboveground net primary production in arid environments. Journal of Arid Environments, v. 69, p. 352–358.
- Huang, C-Y; Asner, G P; Martin, R E; Barger, N N; and Neff, J C. 2009. Multi-scale analysis of tree cover and above ground carbon stocks for pinyon-juniper woodland. Ecological Applications, v. 19, p. 668–681.
• The MFI used for integrated analysis of multiple P-scores was adapted from:
- Bowker, M A; Maestre, F T; and Mau, R L. 2011. What determines semi-arid ecosystem multifunctionality? Biodiversity and patch size distribution of biological crusts. Ecological Monograph, in review.
• The remainder of the study drew from past work completed on the subject for the region of interest. These resources are too numerous to list here, but can be accessed in full at: http://pubs.usgs.gov/of/2012/1061/of2012-1061.pdf.
Key assumption(s) No explicit assumptions were made for this study, as the aim of the study was to create region-specific ecosystem information and datasets to support future land management decisions in the area.
Limitations/uncertainties • There is much uncertainty regarding present and future climates and the ability of ecosystems to adapt to and mitigate the effects of climate change
STUDY NAME BIODIVERSITY OF THE WETLANDS OF THE KAKADU REGION, NORTHERN AUSTRALIA
Author(s) C. Max Finlayson, John Lowry, Maria Grazia Bello, Suthidha Nou, Robert Pidgeon, Dave Walden, Chris Humphrey, and Gary Fox
Reference Finlayson, C M; Lowry, J; Bellio, M G; Nou, S; Pidgeon, R; Walden, D; Humphrey, C; and Fox, G. 2006. Biodiversity of the wetlands of the Kakadu Region, northern Australia. Aquatic Sciences, 68(3): p. 374-399.
Region(s) Kakadu and Alligator Rivers regions and adjacent catchments in Northern Australia
Study Overview This study summarizes the available data on species numbers and describes the general ecology of major plant and animal groups in wetlands within the Kakadu region. The aim is to consolidate all relevant data to facilitate a more holistic understanding of the ecology and biodiversity of the Kakadu region wetlands.
Time frame 1980s-2000s
Relevant ecosystem service(s)
Biodiversity (supporting)
Overview of Methodology The study authors reviewed and synthesized relevant literature and data sources on the ecology of individual species from the major plant and animal groups in the Kakadu region wetlands.
Measurement(s) The number, growth and distribution of major plant and animal groups
88
TE
AM
SIL
VA
CO
M
Assessing the Ecosystem Service Benefits of the Algar LEAP Project
STUDY NAME BIODIVERSITY OF THE WETLANDS OF THE KAKADU REGION, NORTHERN AUSTRALIA
Indicator(s) • Phytoplankton:
- Number of diatom species present
• Macrophytes:
- Number of species present
- Percent of total number of species present in different wetland types
- Duration (days) and depth (m) of inundation
- Above-ground dry weight biomass (kg/m-2) of species in different wetland types
• Aquatic invertebrates:
- Number of families, genera and species present
- Number of species present in different wetland types
• Fishes:
- Number of orders, families, genera and species present
- Size of fishes (cm)
- Number of fish species present in different wetland types
• Amphibians:
- Number of families, genera and species present
- Number of species present in different wetland types
• Reptiles:
- Number of orders, families, genera and species present
- Number of species present in different wetland types
• Waterbirds:
- Number of families, genera and species present
- Number of species present in different wetland types
- Number of species present during each season
• Mammals:
- Number of species present
- Number of species present in different wetland types
Data source(s) Because this report presents a synthesis of work completed previously for species diversity within the Kakadu region wetlands, the data sources are too numerous to present here. A complete list of references can be accessed in the References section of this study, at: http://www.maweb.org/documents_sga/Australia%20Article%20Finlayson%20et%20al%202006.%20Kakadu%20wetland%20biodiversity.pdf.
Key assumption(s) No explicit assumptions were made for this study, as it is a review and summary of past studies completed on this subject for the region of interest.
Limitations/uncertainties • The majority of the studies are more than a decade old, so their data on species diversity and ecology may be inconsistent with current observations.
• In recent decades, the floodplain vegetation has undergone considerable changes as a consequence of invasion by feral animals, weeds, changes in fire regimes and saline
89
TE
AM
SIL
VA
CO
M
Assessing the Ecosystem Service Benefits of the Algar LEAP Project
STUDY NAME BIODIVERSITY OF THE WETLANDS OF THE KAKADU REGION, NORTHERN AUSTRALIA
intrusion.
• Many of the studies were conducted before the removal of feral buffaloes in the Kakadu region, so their data on species diversity may be inconsistent with current observations.
STUDY NAME CANADIAN BIODIVERSITY: ECOSYSTEM STATUS AND TRENDS 2010
Author(s) Joan Eamer, Trish Hayes and Risa Smith
Reference Federal, Provincial and Territorial Governments of Canada. 2010. Canadian biodiversity: ecosystem status and trends 2010. Canadian Councils of Resource Ministers, Ottawa, ON, Canada.
Region(s) Canada (Pacific Maritime, Western Interior Basin, Boreal Cordillera, Taiga Cordillera, Taiga Plains, Boreal Plains, Prairies, Taiga Shield, Arctic, Hudson Plains, Boreal Shield, Mixedwood Plains, Atlantic Maritime, Newfoundland Boreal)
Study Overview This study identifies the condition and trends of biodiversity in each of the 14 ‘eco-zones’ in Canada, reporting 22 key findings. The aim of the study is to provide a description of the current state of Canada’s ecosystems and biodiversity, and to provide a basis to inform the national biodiversity agenda, complement the historical focus on species, and help set biodiversity priorities.
Time frame The past 100 years
Relevant ecosystem service(s)
• Biodiversity (supporting)
- Air quality control
- Carbon sequestration
- Genetic diversity
- Medicine
- Pollination
- Pollution control
- Water filtration/purification
• Food, fiber (provisioning)
• Pollution control, microclimate regulation, water cycle regulation (regulating)
• Aesthetic, recreational, religious (cultural)
Overview of Methodology The study authors reviewed and synthesized relevant literature and data sources from over 500 experts, and organized the 22 key recurring findings under four interrelated themes: biomes; human-ecosystem interactions; habitat, wildlife and ecosystem processes; and science-policy interface. Special consideration was given to findings that relate to ecosystems where natural processes have been compromised or where stresses are reaching critical thresholds, and to those with relevance to decision-makers. In many cases, these characteristics overlap.
Measurement(s) • The condition of ecosystems
90

TE
AM
SIL
VA
CO
M
Assessing the Ecosystem Service Benefits of the Algar LEAP Project
STUDY NAME CANADIAN BIODIVERSITY: ECOSYSTEM STATUS AND TRENDS 2010
• The effect of humans on ecosystems
• The capacity of agricultural lands to support wildlife
• Percent change in population and risk of endangerment trends for selected species groups of high economic, cultural or ecological significance
• Primary productivity of ecosystems
• The role of natural disturbance in forested ecosystems
• The relationships between predators and prey through food webs and population cycles
Indicator(s) THE CONDITION OF ECOSYSTEMS:
• Forest ecosystems:
- Percent of total area with tree cover
- Area (km2) of old forests
- Area (km2) of deforestation
• Grassland:
- Area (km2) of grassland
- Percent loss of grassland ecosystems
- Number of grassland bird species present
- Percent loss of grassland bird species
• Wetlands:
- Area (km2) of wetlands
- Percent loss of wetland ecosystems
- Surface area (km2) of standing water
• Lakes and rivers:
- Percent change in average seasonal stream and river discharge
- Depth (m) of Prairie closed-basin lakes
• Coastal ecosystems:
- Percent decline in wetland and beach and dune habitat
- Number of lot registrations within 2 km of coastlines
- Depth (m) of ocean in harbours
- Percent loss of salt marsh vegetation
- Percent loss of intertidal wetlands
- Eelgrass dry leaf biomass (g/m2)
• Marine ecosystems:
- Mean annual sea temperature (˚C)
- pH of sea water
- Percent dissolved oxygen in sea water
- Seasonal change in peak zooplankton blooms
91
TE
AM
SIL
VA
CO
M
Assessing the Ecosystem Service Benefits of the Algar LEAP Project
STUDY NAME CANADIAN BIODIVERSITY: ECOSYSTEM STATUS AND TRENDS 2010
- Average number of krill per 3 m3 of filtered seawater
- Annual catches of benthic and invertebrate species:
Shrimp (catch per unit effort)
Redfish (tonnes)
Skate (kg per tow)
Snow crab (kg per trap)
- Annual catches (in tonnes) in marine fisheries:
Herring
Atlantic cod
Atlantic salmon
Sockeye
- Fish length (cm) at age 5
- Population size of marine mammal species:
Harbor seal
Bowhead whale
Harp seal
Grey seal
Killer whale
Sea otter
Stellar sea lion
• Ice across biomes:
- Area (km2) of sea ice
- Area (km2) of glaciers
- Thickness (in m) of glaciers
- Percent change in Great Lake ice cover
- Time of year of ice break-up on large lakes
- Temperature (in ̊ C) of permafrost at various depths (in m)
- Percent change of land cover from loss of permafrost
THE EFFECT OF HUMANS ON ECOSYSTEMS:
• Protected areas:
- Area (km2) of terrestrial protected areas
- Area (km2) of freshwater protected areas
- Area (km2) of marine protected areas
- Percent of total land area that is protected
- Number of protected areas by size (km2) category
• Stewardship:
- Area (km2) of certified forest lands
92

TE
AM
SIL
VA
CO
M
Assessing the Ecosystem Service Benefits of the Algar LEAP Project
STUDY NAME CANADIAN BIODIVERSITY: ECOSYSTEM STATUS AND TRENDS 2010
- Area (km2) of land seeded to winter wheat in the Prairies
- Percent growth in land trusts
- Number of conservation easements registered annually in the Prairies
- Area (km2) of land within the Conservation Land Tax Incentive Program (CLTIP) and the Managed Forest Land Tax Incentive Program (MFLTIP) in Ontario
- Number of land parcels within the CLTIP and the MFLTIP
• Invasive species:
- Number of invasive species established in coastal, marine and Great Lakes ecosystems
- Distribution (area of land in km2) of birds have testing positive for West Nile virus
- Number of invasive plants established in Canada
• Contaminants:
- Ppm of contaminants (PCB, DDE and DDT, PBDE, mercury) in:
Thick-billed murre eggs
Beluga blubber
Double-crested cormorant eggs
Lake trout
Herring gull eggs
Burbot
Killer whales
• Nutrient loading and algal blooms:
- Percentage of sites with increasing, decreasing and stable nitrogen and phosphorus levels
- Biomass (mg/m3) of phytoplankton in Lake Winnipeg
- Number of water bodies in Quebec with harmful algal blooms present
- Species composition (by percent) of phytoplankton in Lake Erie
- Phosphorus and chlorophyll (µg/L) in Skaha Lake
- Dissolved oxygen (mg/L) in Skaha Lake
• Acid deposition:
- Number of unit areas where the critical acid load has been exceeded
- Sulphates (µg/L) and pH in Boreal Shield lakes
- Number of salmon rivers in Nova Scotia impacted by acid deposition
• Climate Change:
- Average annual air temperature (˚C)
- Total change in average annual temperature (˚C)
- Timing of annual Canada geese arrivals
- Timing of tufted puffins hatchings
- Increase in the mass of vegetation in the Arctic
93
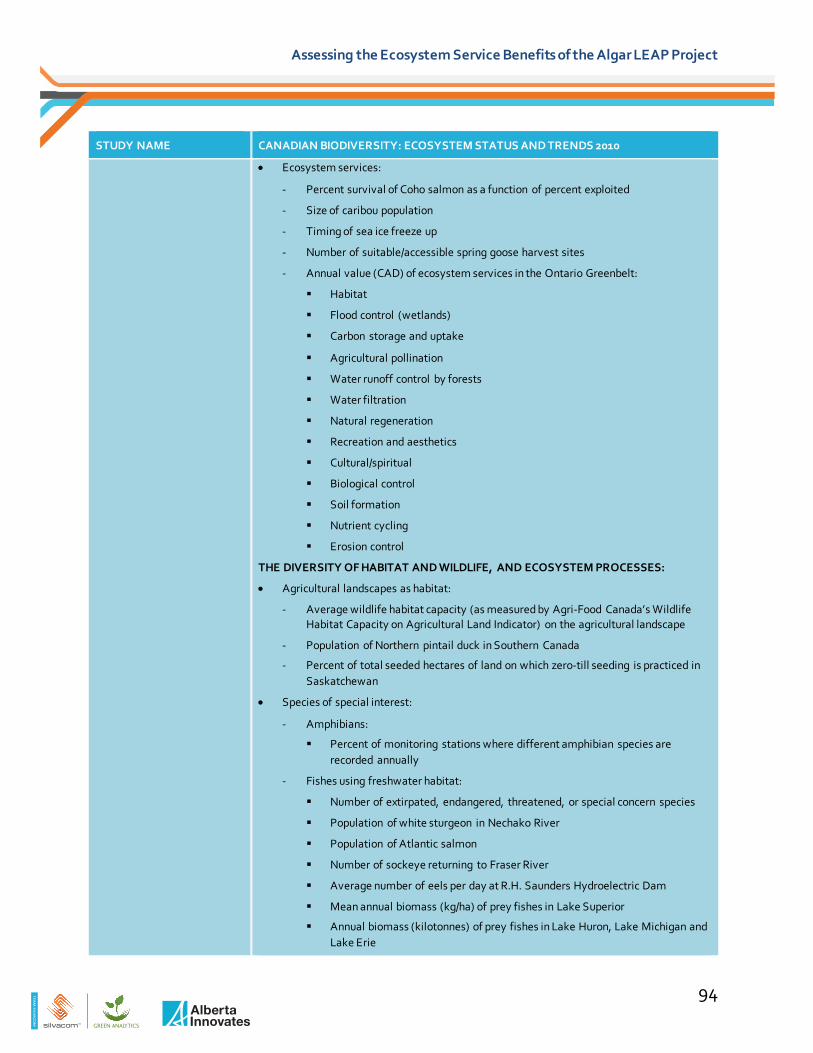
TE
AM
SIL
VA
CO
M
Assessing the Ecosystem Service Benefits of the Algar LEAP Project
STUDY NAME CANADIAN BIODIVERSITY: ECOSYSTEM STATUS AND TRENDS 2010
• Ecosystem services:
- Percent survival of Coho salmon as a function of percent exploited
- Size of caribou population
- Timing of sea ice freeze up
- Number of suitable/accessible spring goose harvest sites
- Annual value (CAD) of ecosystem services in the Ontario Greenbelt:
Habitat
Flood control (wetlands)
Carbon storage and uptake
Agricultural pollination
Water runoff control by forests
Water filtration
Natural regeneration
Recreation and aesthetics
Cultural/spiritual
Biological control
Soil formation
Nutrient cycling
Erosion control
THE DIVERSITY OF HABITAT AND WILDLIFE, AND ECOSYSTEM PROCESSES:
• Agricultural landscapes as habitat:
- Average wildlife habitat capacity (as measured by Agri-Food Canada’s Wildlife Habitat Capacity on Agricultural Land Indicator) on the agricultural landscape
- Population of Northern pintail duck in Southern Canada
- Percent of total seeded hectares of land on which zero-till seeding is practiced in Saskatchewan
• Species of special interest:
- Amphibians:
Percent of monitoring stations where different amphibian species are recorded annually
- Fishes using freshwater habitat:
Number of extirpated, endangered, threatened, or special concern species
Population of white sturgeon in Nechako River
Population of Atlantic salmon
Number of sockeye returning to Fraser River
Average number of eels per day at R.H. Saunders Hydroelectric Dam
Mean annual biomass (kg/ha) of prey fishes in Lake Superior
Annual biomass (kilotonnes) of prey fishes in Lake Huron, Lake Michigan and Lake Erie
94

TE
AM
SIL
VA
CO
M
Assessing the Ecosystem Service Benefits of the Algar LEAP Project
STUDY NAME CANADIAN BIODIVERSITY: ECOSYSTEM STATUS AND TRENDS 2010
Mean annual biomass (kg per trawl tow) of prey fishes in Lake Ontario
Annual fish production (tonnes) in Lake Winnipeg
Number of fish caught annually by recreational fishing
- Birds:
Number of seabird populations that are increasing, decreasing, and stable
Percent change in landbird populations by habitat type
Population of ring-necked ducks and scaup in Western Boreal region
- Caribou:
Number of herds that are increasing, decreasing and stable
Number of herds in each eco-zone
• Primary productivity:
- Where peaks in primary productivity on land are increasing and decreasing
- Amount of chlorophyll (mg/g) in Lost Pack Lake
- Total amount of chlorophyll (mg/m3) in the North Pacific
• Natural disturbances:
- Fire:
Area (km2) of land burned by large fires
Where risk of wildfires is increasing and decreasing
- Insects:
Area (km2) of land defoliated by Eastern spruce budworm east of the Manitoba border
Area (km2) of land affected annually by mountain pine beetle in B.C.
• Food webs:
- Density of Amphipod Diporeia (thousands per m2) in Lake Huron
- Cycle of hare and lynx populations in Yukon boreal forest:
Number of hare present given the time period
Number of lynx present given the time period
- Decline in the temporal range of the wolverine
Data source(s) Because this report presents a synthesis of work completed previously for each of the 22 key findings considered in the analysis, the data sources are too numerous to present here. A complete list of references can be accessed in the References section of this study, at: http://www.biodivcanada.ca/A8E1EFFD-FCC0-4502-832A-359A50BAB5A3/EN_CanadianBiodiversity_PRINT_FRIENDLY.pdf.
Key assumption(s) No explicit assumptions were made for this study, as it is a review and synthesis of past work completed on this subject for the region of interest.
Limitations/uncertainties • If aspects of the ecosystems are not well understood or data are inadequate in spatial or temporal coverage, the confidence in the conclusions drawn for each key finding is lowered. Confidence is based on an evaluation of the adequacy of the supporting evidence. For some of the key findings, there is low to medium confidence in the
95
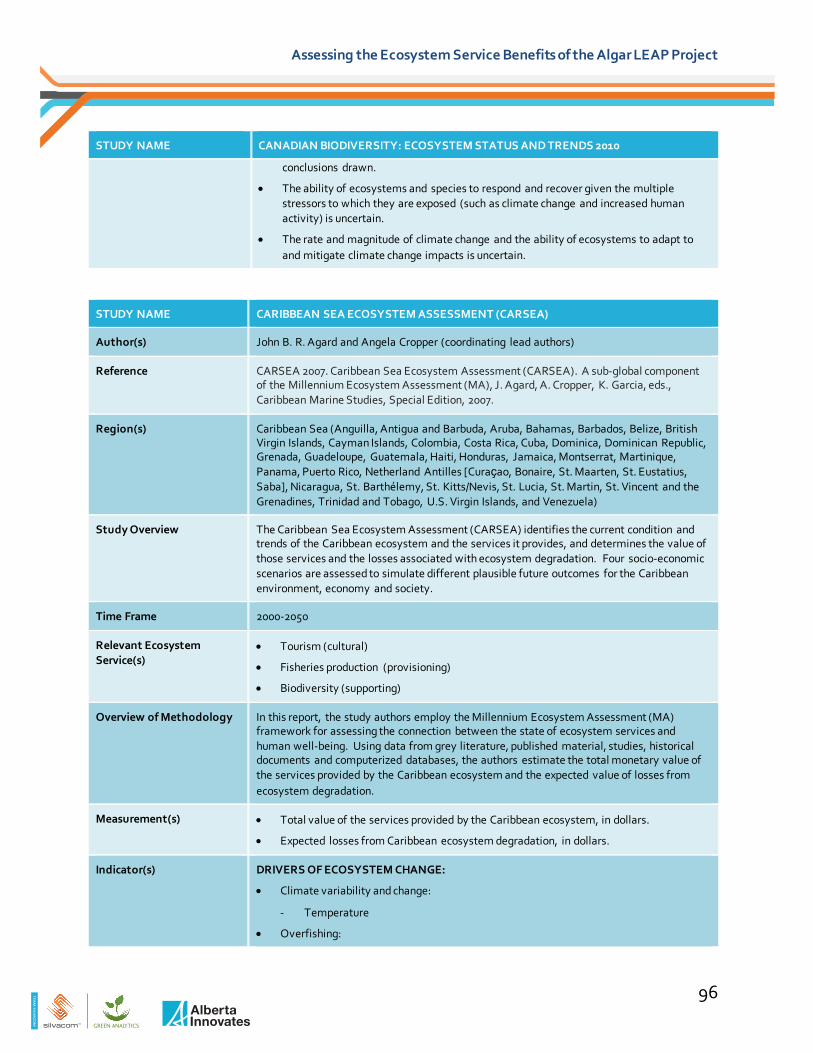
TE
AM
SIL
VA
CO
M
Assessing the Ecosystem Service Benefits of the Algar LEAP Project
STUDY NAME CANADIAN BIODIVERSITY: ECOSYSTEM STATUS AND TRENDS 2010
conclusions drawn.
• The ability of ecosystems and species to respond and recover given the multiple stressors to which they are exposed (such as climate change and increased human activity) is uncertain.
• The rate and magnitude of climate change and the ability of ecosystems to adapt to and mitigate climate change impacts is uncertain.
STUDY NAME CARIBBEAN SEA ECOSYSTEM ASSESSMENT (CARSEA)
Author(s) John B. R. Agard and Angela Cropper (coordinating lead authors)
Reference CARSEA 2007. Caribbean Sea Ecosystem Assessment (CARSEA). A sub-global component of the Millennium Ecosystem Assessment (MA), J. Agard, A. Cropper, K. Garcia, eds., Caribbean Marine Studies, Special Edition, 2007.
Region(s) Caribbean Sea (Anguilla, Antigua and Barbuda, Aruba, Bahamas, Barbados, Belize, British Virgin Islands, Cayman Islands, Colombia, Costa Rica, Cuba, Dominica, Dominican Republic, Grenada, Guadeloupe, Guatemala, Haiti, Honduras, Jamaica, Montserrat, Martinique, Panama, Puerto Rico, Netherland Antilles [Curaҫao, Bonaire, St. Maarten, St. Eustatius, Saba], Nicaragua, St. Barthélemy, St. Kitts/Nevis, St. Lucia, St. Martin, St. Vincent and the Grenadines, Trinidad and Tobago, U.S. Virgin Islands, and Venezuela)
Study Overview The Caribbean Sea Ecosystem Assessment (CARSEA) identifies the current condition and trends of the Caribbean ecosystem and the services it provides, and determines the value of those services and the losses associated with ecosystem degradation. Four socio-economic scenarios are assessed to simulate different plausible future outcomes for the Caribbean environment, economy and society.
Time Frame 2000-2050
Relevant Ecosystem Service(s)
• Tourism (cultural)
• Fisheries production (provisioning)
• Biodiversity (supporting)
Overview of Methodology In this report, the study authors employ the Millennium Ecosystem Assessment (MA) framework for assessing the connection between the state of ecosystem services and human well-being. Using data from grey literature, published material, studies, historical documents and computerized databases, the authors estimate the total monetary value of the services provided by the Caribbean ecosystem and the expected value of losses from ecosystem degradation.
Measurement(s) • Total value of the services provided by the Caribbean ecosystem, in dollars.
• Expected losses from Caribbean ecosystem degradation, in dollars.
Indicator(s) DRIVERS OF ECOSYSTEM CHANGE:
• Climate variability and change:
- Temperature
• Overfishing:
96
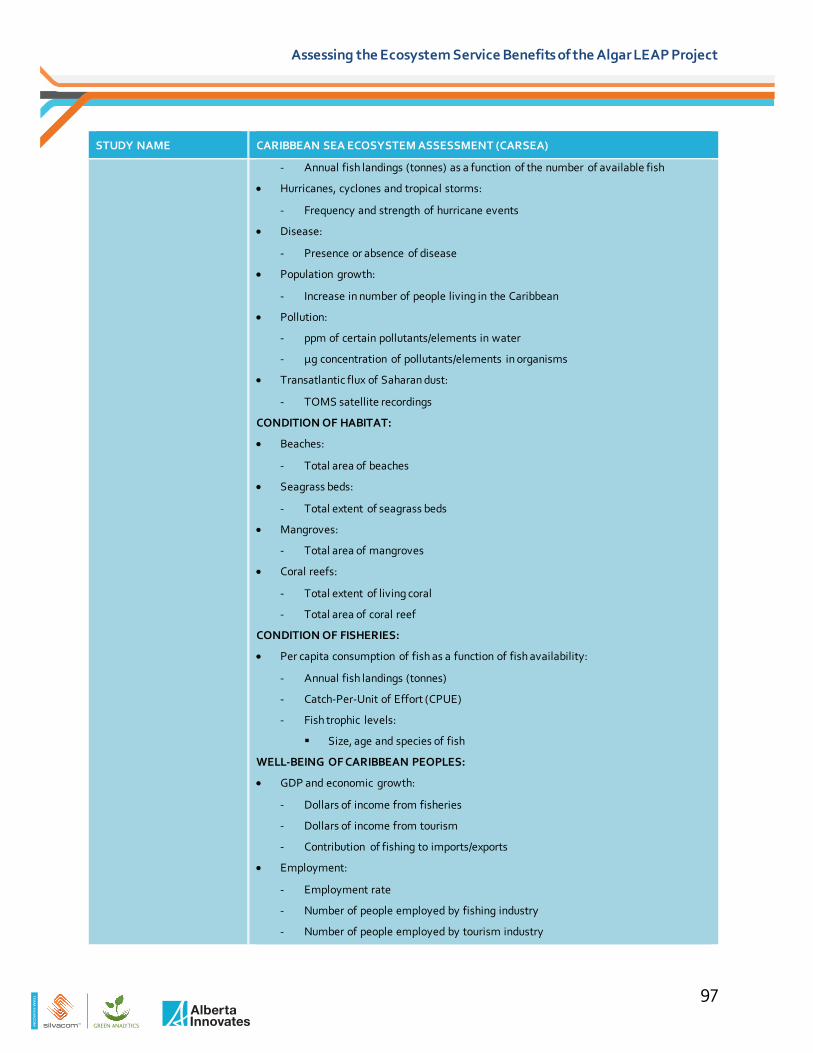
TE
AM
SIL
VA
CO
M
Assessing the Ecosystem Service Benefits of the Algar LEAP Project
STUDY NAME CARIBBEAN SEA ECOSYSTEM ASSESSMENT (CARSEA)
- Annual fish landings (tonnes) as a function of the number of available fish
• Hurricanes, cyclones and tropical storms:
- Frequency and strength of hurricane events
• Disease:
- Presence or absence of disease
• Population growth:
- Increase in number of people living in the Caribbean
• Pollution:
- ppm of certain pollutants/elements in water
- µg concentration of pollutants/elements in organisms
• Transatlantic flux of Saharan dust:
- TOMS satellite recordings
CONDITION OF HABITAT:
• Beaches:
- Total area of beaches
• Seagrass beds:
- Total extent of seagrass beds
• Mangroves:
- Total area of mangroves
• Coral reefs:
- Total extent of living coral
- Total area of coral reef
CONDITION OF FISHERIES:
• Per capita consumption of fish as a function of fish availability:
- Annual fish landings (tonnes)
- Catch-Per-Unit of Effort (CPUE)
- Fish trophic levels:
Size, age and species of fish
WELL-BEING OF CARIBBEAN PEOPLES:
• GDP and economic growth:
- Dollars of income from fisheries
- Dollars of income from tourism
- Contribution of fishing to imports/exports
• Employment:
- Employment rate
- Number of people employed by fishing industry
- Number of people employed by tourism industry
97
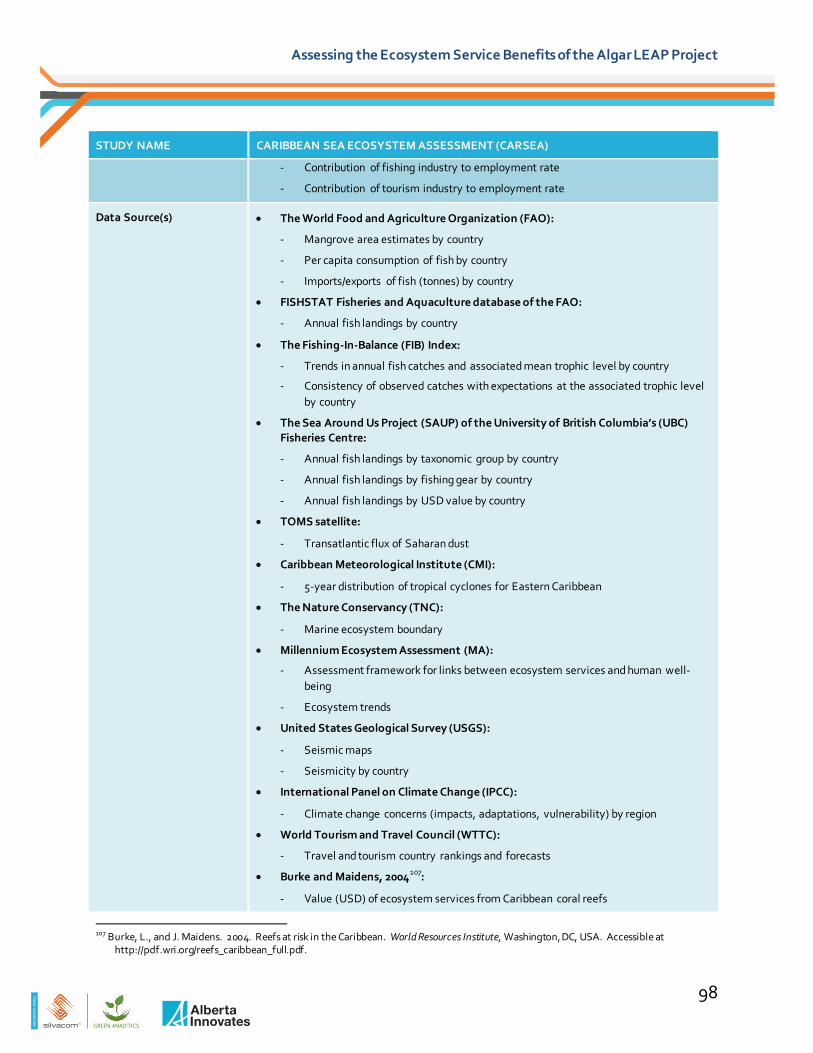
TE
AM
SIL
VA
CO
M
Assessing the Ecosystem Service Benefits of the Algar LEAP Project
STUDY NAME CARIBBEAN SEA ECOSYSTEM ASSESSMENT (CARSEA)
- Contribution of fishing industry to employment rate
- Contribution of tourism industry to employment rate
Data Source(s) • The World Food and Agriculture Organization (FAO):
- Mangrove area estimates by country
- Per capita consumption of fish by country
- Imports/exports of fish (tonnes) by country
• FISHSTAT Fisheries and Aquaculture database of the FAO:
- Annual fish landings by country
• The Fishing-In-Balance (FIB) Index:
- Trends in annual fish catches and associated mean trophic level by country
- Consistency of observed catches with expectations at the associated trophic level by country
• The Sea Around Us Project (SAUP) of the University of British Columbia’s (UBC) Fisheries Centre:
- Annual fish landings by taxonomic group by country
- Annual fish landings by fishing gear by country
- Annual fish landings by USD value by country
• TOMS satellite:
- Transatlantic flux of Saharan dust
• Caribbean Meteorological Institute (CMI):
- 5-year distribution of tropical cyclones for Eastern Caribbean
• The Nature Conservancy (TNC):
- Marine ecosystem boundary
• Millennium Ecosystem Assessment (MA):
- Assessment framework for links between ecosystem services and human well-being
- Ecosystem trends
• United States Geological Survey (USGS):
- Seismic maps
- Seismicity by country
• International Panel on Climate Change (IPCC):
- Climate change concerns (impacts, adaptations, vulnerability) by region
• World Tourism and Travel Council (WTTC):
- Travel and tourism country rankings and forecasts
• Burke and Maidens, 2004107:
- Value (USD) of ecosystem services from Caribbean coral reefs
107 Burke, L., and J. Maidens. 2004. Reefs at risk in the Caribbean. World Resources Institute, Washington, DC, USA. Accessible at http://pdf.wri.org/reefs_caribbean_full.pdf.
98
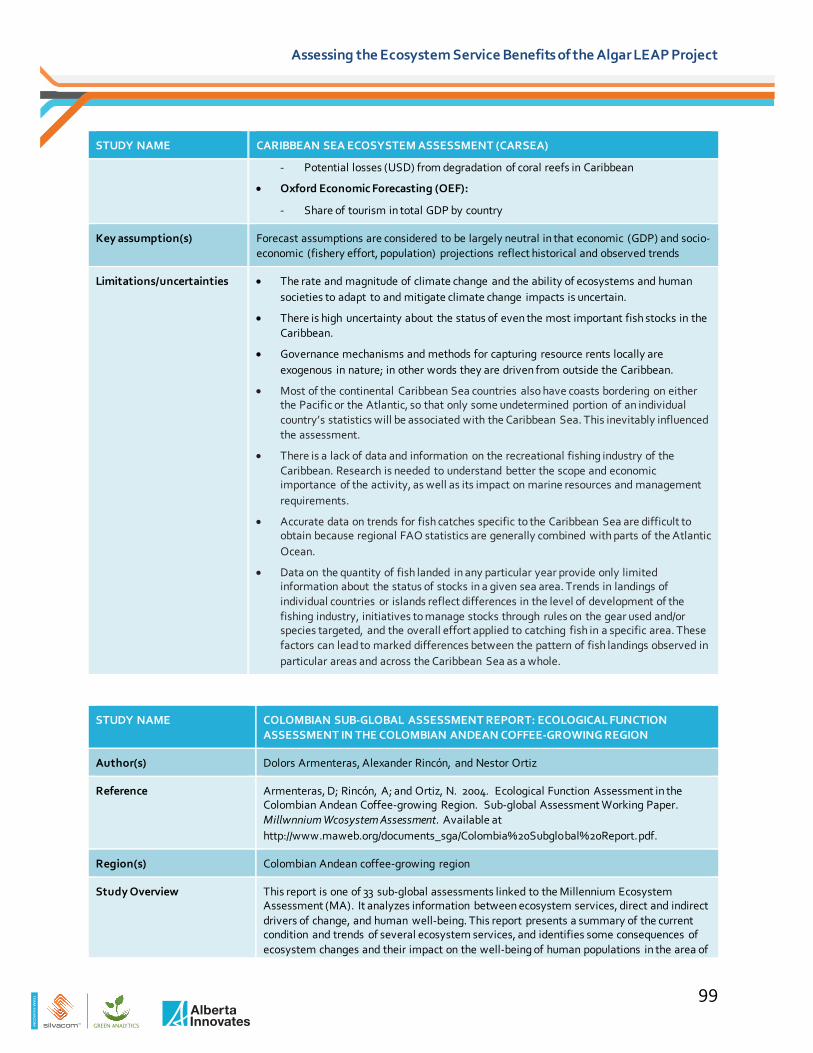
TE
AM
SIL
VA
CO
M
Assessing the Ecosystem Service Benefits of the Algar LEAP Project
STUDY NAME CARIBBEAN SEA ECOSYSTEM ASSESSMENT (CARSEA)
- Potential losses (USD) from degradation of coral reefs in Caribbean
• Oxford Economic Forecasting (OEF):
- Share of tourism in total GDP by country
Key assumption(s) Forecast assumptions are considered to be largely neutral in that economic (GDP) and socio-economic (fishery effort, population) projections reflect historical and observed trends
Limitations/uncertainties • The rate and magnitude of climate change and the ability of ecosystems and human societies to adapt to and mitigate climate change impacts is uncertain.
• There is high uncertainty about the status of even the most important fish stocks in the Caribbean.
• Governance mechanisms and methods for capturing resource rents locally are exogenous in nature; in other words they are driven from outside the Caribbean.
• Most of the continental Caribbean Sea countries also have coasts bordering on either the Pacific or the Atlantic, so that only some undetermined portion of an individual country’s statistics will be associated with the Caribbean Sea. This inevitably influenced the assessment.
• There is a lack of data and information on the recreational fishing industry of the Caribbean. Research is needed to understand better the scope and economic importance of the activity, as well as its impact on marine resources and management requirements.
• Accurate data on trends for fish catches specific to the Caribbean Sea are difficult to obtain because regional FAO statistics are generally combined with parts of the Atlantic Ocean.
• Data on the quantity of fish landed in any particular year provide only limited information about the status of stocks in a given sea area. Trends in landings of individual countries or islands reflect differences in the level of development of the fishing industry, initiatives to manage stocks through rules on the gear used and/or species targeted, and the overall effort applied to catching fish in a specific area. These factors can lead to marked differences between the pattern of fish landings observed in particular areas and across the Caribbean Sea as a whole.
STUDY NAME COLOMBIAN SUB-GLOBAL ASSESSMENT REPORT: ECOLOGICAL FUNCTION ASSESSMENT IN THE COLOMBIAN ANDEAN COFFEE-GROWING REGION
Author(s) Dolors Armenteras, Alexander Rincón, and Nestor Ortiz
Reference Armenteras, D; Rincón, A; and Ortiz, N. 2004. Ecological Function Assessment in the Colombian Andean Coffee-growing Region. Sub-global Assessment Working Paper. Millwnnium Wcosystem Assessment. Available at http://www.maweb.org/documents_sga/Colombia%20Subglobal%20Report.pdf.
Region(s) Colombian Andean coffee-growing region
Study Overview This report is one of 33 sub-global assessments linked to the Millennium Ecosystem Assessment (MA). It analyzes information between ecosystem services, direct and indirect drivers of change, and human well-being. This report presents a summary of the current condition and trends of several ecosystem services, and identifies some consequences of ecosystem changes and their impact on the well-being of human populations in the area of
99
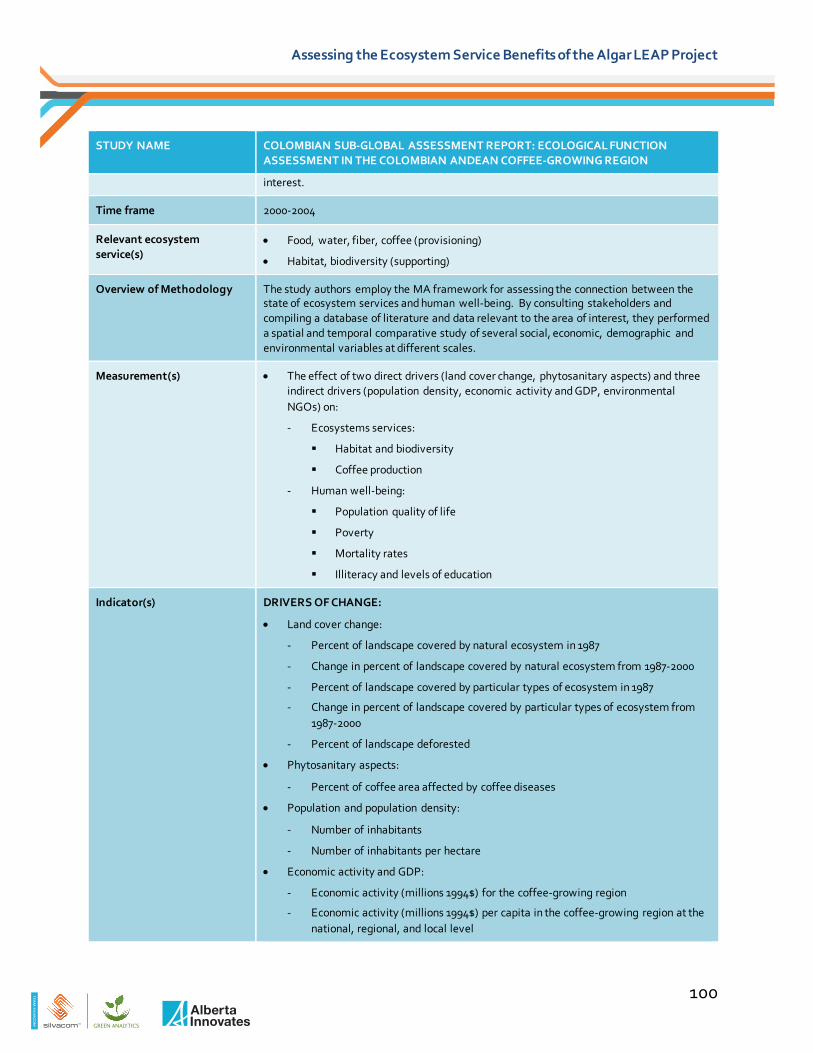
TE
AM
SIL
VA
CO
M
Assessing the Ecosystem Service Benefits of the Algar LEAP Project
STUDY NAME COLOMBIAN SUB-GLOBAL ASSESSMENT REPORT: ECOLOGICAL FUNCTION ASSESSMENT IN THE COLOMBIAN ANDEAN COFFEE-GROWING REGION
interest.
Time frame 2000-2004
Relevant ecosystem service(s)
• Food, water, fiber, coffee (provisioning)
• Habitat, biodiversity (supporting)
Overview of Methodology The study authors employ the MA framework for assessing the connection between the state of ecosystem services and human well-being. By consulting stakeholders and compiling a database of literature and data relevant to the area of interest, they performed a spatial and temporal comparative study of several social, economic, demographic and environmental variables at different scales.
Measurement(s) • The effect of two direct drivers (land cover change, phytosanitary aspects) and three indirect drivers (population density, economic activity and GDP, environmental NGOs) on:
- Ecosystems services:
Habitat and biodiversity
Coffee production
- Human well-being:
Population quality of life
Poverty
Mortality rates
Illiteracy and levels of education
Indicator(s) DRIVERS OF CHANGE:
• Land cover change:
- Percent of landscape covered by natural ecosystem in 1987
- Change in percent of landscape covered by natural ecosystem from 1987-2000
- Percent of landscape covered by particular types of ecosystem in 1987
- Change in percent of landscape covered by particular types of ecosystem from 1987-2000
- Percent of landscape deforested
• Phytosanitary aspects:
- Percent of coffee area affected by coffee diseases
• Population and population density:
- Number of inhabitants
- Number of inhabitants per hectare
• Economic activity and GDP:
- Economic activity (millions 1994$) for the coffee-growing region
- Economic activity (millions 1994$) per capita in the coffee-growing region at the national, regional, and local level
100

TE
AM
SIL
VA
CO
M
Assessing the Ecosystem Service Benefits of the Algar LEAP Project
STUDY NAME COLOMBIAN SUB-GLOBAL ASSESSMENT REPORT: ECOLOGICAL FUNCTION ASSESSMENT IN THE COLOMBIAN ANDEAN COFFEE-GROWING REGION
- Percent of national GDP participation by coffee-growing region
- GDP per sector in 1990:
Added value (USD) of agriculture
- Change in GDP per sector from 1900-2000:
Change in value (USD) added by agriculture
• Environmental NGOs:
- Number of environmental NGOs in the area
- Number of farmers associated with an NGO
ECOSYSTEM SERVICES:
• Habitat and biodiversity:
- Percent of landscape covered by natural ecosystem
- Number and area (ha) of protected areas
- Percent of landscape under natural forest
- Percent of natural forest landscape fragmented by roads and development
- Number of insect, bird and plant species present
- Number of insect, bird and plant species threatened or endangered
• Coffee-production:
- Area (ha) of the region covered by coffee fields
- Percent of coffee production properties over 3 hectares in size
- Coffee property size (ha) for each coffee variety
- Area (ha) for each coffee variety
HUMAN WELL-BEING:
• Population quality of life:
- Quality of Life Index and Unsatisfied Basic Needs Index (percent values)
- Percent of households in the region with unsatisfied basic needs
• Poverty:
- Percent of population below the poverty line
- Population unemployment rate
• Mortality rates:
- Population mortality rate per cause of death
• Illiteracy and levels of education:
- Population illiteracy rate
- Number of schools in the area
- Percent of population with no education
- Percent of population with post-secondary education
Data source(s) • The ecosystem information on the Colombian Andean coffee-growing region is drawn
101
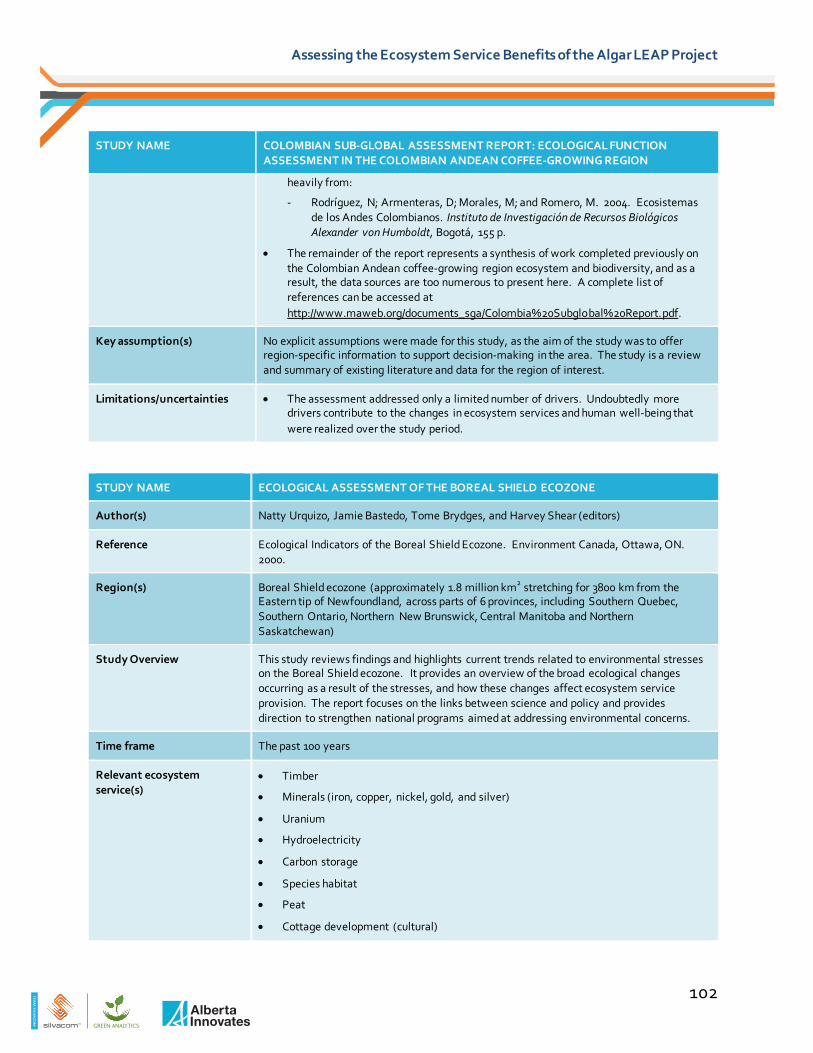
TE
AM
SIL
VA
CO
M
Assessing the Ecosystem Service Benefits of the Algar LEAP Project
STUDY NAME COLOMBIAN SUB-GLOBAL ASSESSMENT REPORT: ECOLOGICAL FUNCTION ASSESSMENT IN THE COLOMBIAN ANDEAN COFFEE-GROWING REGION
heavily from:
- Rodríguez, N; Armenteras, D; Morales, M; and Romero, M. 2004. Ecosistemas de los Andes Colombianos. Instituto de Investigación de Recursos Biológicos Alexander von Humboldt, Bogotá, 155 p.
• The remainder of the report represents a synthesis of work completed previously on the Colombian Andean coffee-growing region ecosystem and biodiversity, and as a result, the data sources are too numerous to present here. A complete list of references can be accessed at http://www.maweb.org/documents_sga/Colombia%20Subglobal%20Report.pdf.
Key assumption(s) No explicit assumptions were made for this study, as the aim of the study was to offer region-specific information to support decision-making in the area. The study is a review and summary of existing literature and data for the region of interest.
Limitations/uncertainties • The assessment addressed only a limited number of drivers. Undoubtedly more drivers contribute to the changes in ecosystem services and human well-being that were realized over the study period.
STUDY NAME ECOLOGICAL ASSESSMENT OF THE BOREAL SHIELD ECOZONE
Author(s) Natty Urquizo, Jamie Bastedo, Tome Brydges, and Harvey Shear (editors)
Reference Ecological Indicators of the Boreal Shield Ecozone. Environment Canada, Ottawa, ON. 2000.
Region(s) Boreal Shield ecozone (approximately 1.8 million km2 stretching for 3800 km from the Eastern tip of Newfoundland, across parts of 6 provinces, including Southern Quebec, Southern Ontario, Northern New Brunswick, Central Manitoba and Northern Saskatchewan)
Study Overview This study reviews findings and highlights current trends related to environmental stresses on the Boreal Shield ecozone. It provides an overview of the broad ecological changes occurring as a result of the stresses, and how these changes affect ecosystem service provision. The report focuses on the links between science and policy and provides direction to strengthen national programs aimed at addressing environmental concerns.
Time frame The past 100 years
Relevant ecosystem service(s)
• Timber
• Minerals (iron, copper, nickel, gold, and silver)
• Uranium
• Hydroelectricity
• Carbon storage
• Species habitat
• Peat
• Cottage development (cultural)
102
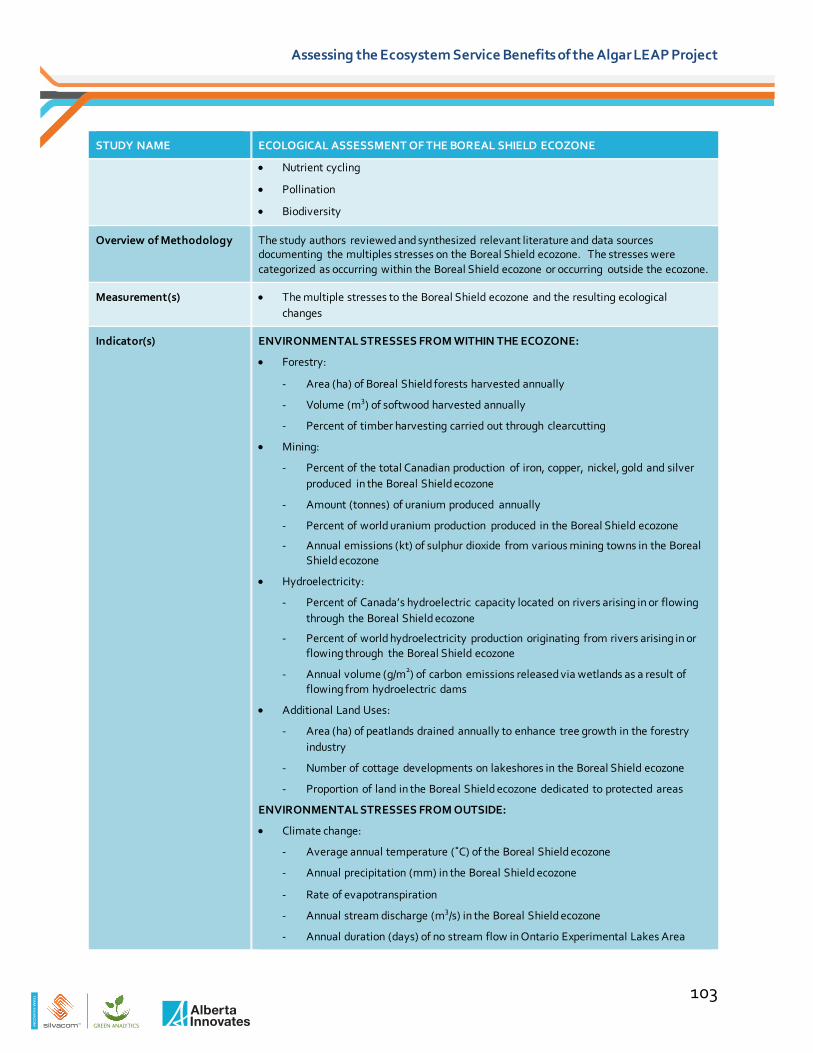
TE
AM
SIL
VA
CO
M
Assessing the Ecosystem Service Benefits of the Algar LEAP Project
STUDY NAME ECOLOGICAL ASSESSMENT OF THE BOREAL SHIELD ECOZONE
• Nutrient cycling
• Pollination
• Biodiversity
Overview of Methodology The study authors reviewed and synthesized relevant literature and data sources documenting the multiples stresses on the Boreal Shield ecozone. The stresses were categorized as occurring within the Boreal Shield ecozone or occurring outside the ecozone.
Measurement(s) • The multiple stresses to the Boreal Shield ecozone and the resulting ecological changes
Indicator(s) ENVIRONMENTAL STRESSES FROM WITHIN THE ECOZONE:
• Forestry:
- Area (ha) of Boreal Shield forests harvested annually
- Volume (m3) of softwood harvested annually
- Percent of timber harvesting carried out through clearcutting
• Mining:
- Percent of the total Canadian production of iron, copper, nickel, gold and silver produced in the Boreal Shield ecozone
- Amount (tonnes) of uranium produced annually
- Percent of world uranium production produced in the Boreal Shield ecozone
- Annual emissions (kt) of sulphur dioxide from various mining towns in the Boreal Shield ecozone
• Hydroelectricity:
- Percent of Canada’s hydroelectric capacity located on rivers arising in or flowing through the Boreal Shield ecozone
- Percent of world hydroelectricity production originating from rivers arising in or flowing through the Boreal Shield ecozone
- Annual volume (g/m2) of carbon emissions released via wetlands as a result of flowing from hydroelectric dams
• Additional Land Uses:
- Area (ha) of peatlands drained annually to enhance tree growth in the forestry industry
- Number of cottage developments on lakeshores in the Boreal Shield ecozone
- Proportion of land in the Boreal Shield ecozone dedicated to protected areas
ENVIRONMENTAL STRESSES FROM OUTSIDE:
• Climate change:
- Average annual temperature (˚C) of the Boreal Shield ecozone
- Annual precipitation (mm) in the Boreal Shield ecozone
- Rate of evapotranspiration
- Annual stream discharge (m3/s) in the Boreal Shield ecozone
- Annual duration (days) of no stream flow in Ontario Experimental Lakes Area
103
TE
AM
SIL
VA
CO
M
Assessing the Ecosystem Service Benefits of the Algar LEAP Project
STUDY NAME ECOLOGICAL ASSESSMENT OF THE BOREAL SHIELD ECOZONE
- Annual duration (days) of ice cover in Ontario Experimental Lakes Area
• Acid precipitation:
- pH of Boreal Shield ecozone lakes
- Number of fish species with populations in decline due to low pH in Boreal Shield ecozone lakes
- Mean annual dissolved organic carbon concentration (µmol/L) in lakes in the Ontario Experimental Lakes Area
- Five-year (1991-1995) mean excess wet sulphate deposition (kg/ha/yr) for Eastern Northern America
- Annual average sulphate and calcium deposition (µeg/L) in Lake Batchawana
- Average annual nitrate concentrations (µeg/L) in lakes in the Boreal Shield ecozone
- Average annual magnesium concentrations (mg/L) in lakes in the Boreal Shield ecozone
• Ultraviolet radiation:
- Average annual Uv-B radiation at wavelengths near 300 nm and between 320-325 nm
• Long-range transport of pollutants:
- Spatial distribution of organochlorines in Boreal Shield ecozone lakes
SELECT INDICATORS OF CHANGE:
• Forest Fires:
- Frequency, duration (days) and spatial extent (area in ha) of forest fires
• Insects:
- Percent of total natural (fire, insects, disease) tree mortality due to insects
- Proportion to annual harvest volume of trees killed by insects
- Rate of tree mortality from insects
- Spatial distribution of tree mortality from insects
- Area (ha) of Boreal Shield ecozone forests affected by spruce budworm and forest tent caterpillar
• Mercury:
- Percent of fish tested with elevated levels of mercury in blood/tissue
- Percent of large walleye tested with >0.5 ppm mercury concentration and >1.5 ppm mercury concentration in blood/tissue
• Invasive species:
- Number of invasive species present in Boreal Shield ecozone
- Biomass of invasive species in Boreal Shield ecozone lakes
• Mammals and birds:
- Number of endangered/threatened species present in Boreal Shield ecozone
- Number of species in Boreal Shield ecozone with declining populations
• Plants and lichens:
104
TE
AM
SIL
VA
CO
M
Assessing the Ecosystem Service Benefits of the Algar LEAP Project
STUDY NAME ECOLOGICAL ASSESSMENT OF THE BOREAL SHIELD ECOZONE
- Number and spatial extent of red and white pine trees in Newfoundland and Manitoba
- Spatial distribution of Boreal felt lichen
• Drought and blowdown:
- Annual area (ha) of forest tree mortality as a result of drought in the Boreal Shield ecozone
- Annual area (ha) of tree damage and uprooting as a result of severe surface winds in the Boreal Shield ecozone
- Percent of blowdown area succumbed to forest fires within one year
• Leopard frog:
- Annual size of leopard frog population in the Boreal Shield ecozone
Data source(s) Because this report presents a synthesis of work completed previously for each of the stresses and indicators considered in the analysis, the data sources are too numerous to present here. A complete list of references can be accessed in the References section of this study, at: http://www.ec.gc.ca/Publications/1F4C0C47-4E18-4988-8514-A842EED6F774%5CEcologicalAssessmentOfTheBorealShieldEcozone.pdf.
Key assumption(s) No explicit assumptions were made for this study, as it is a review and summary of past work completed on this subject for the region of interest.
Limitations/uncertainties The rate and magnitude of climate change and the ability of the ecosystem to adapt to its impacts is uncertain.
STUDY NAME ECOSYSTEM SERVICES AND WESTERN U.S. RANGELANDS
Author(s) Rhonda Skaggs
Reference Skaggs, R. 2008. Ecosystem services and Western U.S. rangelands. Choices 23(2): p. 37-41.
Region(s) Western United States (Alaska, Oregon, California, Nevada, Idaho, Montana, Wyoming, Utah, Colorado, Arizona, and New Mexico)
Study Overview This study examines the features of United States rangelands, their present ownership, and the value of services (forage production for domestic livestock, carbon sequestration and biodiversity). The study also outlines current efforts towards rangeland conservation and reclamation.
Time frame NA
Relevant ecosystem service(s)
• Forage production for domestic livestock (provisioning)
• Carbon sequestration (regulating)
• Biodiversity (supporting)
Overview of Methodology The study author examines the various services currently provided by Western US rangelands by reviewing and synthesizing previous studies on the region of interest. The review focused on studies detailing the value of forage production for domestic landscape – a more prominent and well-known ecosystem service of Western US rangelands - and the
105
TE
AM
SIL
VA
CO
M
Assessing the Ecosystem Service Benefits of the Algar LEAP Project
STUDY NAME ECOSYSTEM SERVICES AND WESTERN U.S. RANGELANDS
values of two more forthcoming services: carbon sequestration and biodiversity
Measurement(s) • The non-monetary value of rangeland ecosystem services:
- Forage production for domestic livestock
- Carbon sequestration
- Biodiversity
Indicator(s) RANGELAND ECOSYSTEM SERVICES:
• Forage production for domestic livestock:
- Percent of Western US rangelands controlled by US Bureau of Land Management (BLM) and US Forest Service (USFS)
- Percent of Western US rangelands that are publicly/privately owned
- Percent of US beef cattle raised on Western US rangelands
- Percent of total US forage consumption by domestic livestock provided by public lands
- Percent of US beef cattle, sheep and lambs raised on public land
- Percent of US grazing capacity from BLM and USFS lands
- Percent of the forage for US beef cattle supplied by BLM and USFS lands
- Percent dependence of individual ranching operations on forage provided by publicly-owned land
- Percent of beef cattle grazing on federal land for part of the year
- Percent of the total annual forage demand in Western US rangelands met by federal land
• Carbon sequestration:
- Number of carbon credits available from rangelands
- Volume (tonnes) of carbon stored in rangelands per acre
• Biodiversity:
- Number of species present
- Number of present species that are endangered
Data source(s) • This study draws heavily from:
- Swinton, S M; Lupi, F; Robertson, G P; and Landis, D A. 2006. Ecosystem services from agriculture: looking beyond the usual suspects. American Journal of Agricultural Economics 88(5): p. 1160-1166.
• Aggregate Climate Credits Corporation. 2008. Accessed June 17. Website: http://www.agragate.com/.
• U.S. Department of Agriculture, U.S. Forest Service. 1989. An analysis of the land base situation in the United States: 1989-2040. General Technical Report RM-181. Available online: http://www.fs.fed.us/research/rpa/89rpa/Land_Base_Situation.pdf.
• U.S. Department of Agriculture, U.S. Forest Service. 1989. RPA Assessment of the forest and rangeland situation in the United States, 1989. Forest Resource Report No. 26. Available online: http://www.fs.fed.us/research/rpa89/Forest_Rangeland%Stuation.pdf.
106
TE
AM
SIL
VA
CO
M
Assessing the Ecosystem Service Benefits of the Algar LEAP Project
STUDY NAME ECOSYSTEM SERVICES AND WESTERN U.S. RANGELANDS
• The remainder of the report represents a synthesis of work completed previously on the US rangeland ecosystem, and as a result, the data sources are too numerous to present here. A complete list of references can be accessed at: http://www.farmdoc.illinois.edu/policy/choices/20082/theme2/2008-2-09.pdf.
Key assumption(s) No explicit assumptions were made for this study, as the aim of the study was to offer region-specific information to support land management decisions in the area. The study is a review and summary of existing literature and data for the region of interest.
Limitations/uncertainties NA
STUDY NAME ECOSYSTEMS AND HUMAN WELL-BEING: WETLANDS AND WATER SYNTHESIS
Author(s) Stuart Butchart, Ellen Dieme-Amting, Habiba Gitay, Steve Raaymakers, and Douglas Taylor
Reference Millennium Ecosystem Assessment, 2005.
Ecosystems and Human Well-Being: Wetlands and Water Synthesis.
World Resources Institute, Washington, DC.
Region(s) Global:
• 117 sites 108 in North America
• 126 sites in the Neotropics
• 805 sites in Europe
• 160 sites in Africa
• 174 sites in Asia
• 74 sites in Oceania
Study Overview Using the information provided by the various MA global and subglobal assessment reports, this report reviews and synthesizes global wetland ecosystem conditions and trends, the many direct and indirect pressures on wetland ecosystems and the resulting effects on ecosystem service provision and human well-being. This synthesis outlines a range of options for responding to and addressing these pressures, and presents advice to decision-makers on the trade-offs involved in the management of wetland ecosystems.
Time frame 2001-2005
Relevant ecosystem service(s)
• Food, fresh water, fiber, timber, fuel, biochemical products, genetic materials (provisioning)
• Climate regulation, hydrological regimes (e.g. water storage, groundwater recharge, etc.), pollution control, erosion protection, natural hazard protection (e.g. flood control) (regulating)
• Spiritual and inspirational experience, recreation, aesthetics, education (cultural)
• Biodiversity, soil formation, nutrient cycling, pollination (supporting)
108 A wetland site is indicative of an inland water system (marsh, lake, river, peatland, forest, karst or cave), a coastal or near-shore system to a depth at low tide not exceeding 6 meters (mangrove, estuary or coral reef), or a human-made wetland (rice field, reservoir or fish pond).
107
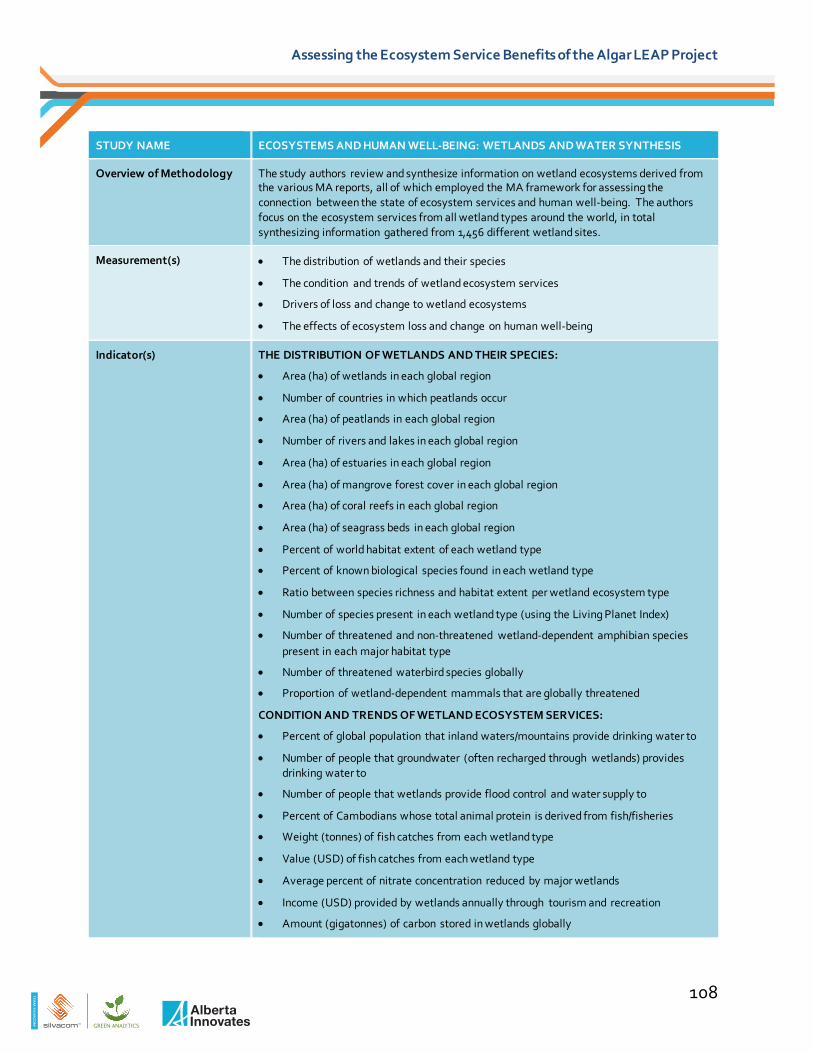
TE
AM
SIL
VA
CO
M
Assessing the Ecosystem Service Benefits of the Algar LEAP Project
STUDY NAME ECOSYSTEMS AND HUMAN WELL-BEING: WETLANDS AND WATER SYNTHESIS
Overview of Methodology The study authors review and synthesize information on wetland ecosystems derived from the various MA reports, all of which employed the MA framework for assessing the connection between the state of ecosystem services and human well-being. The authors focus on the ecosystem services from all wetland types around the world, in total synthesizing information gathered from 1,456 different wetland sites.
Measurement(s) • The distribution of wetlands and their species
• The condition and trends of wetland ecosystem services
• Drivers of loss and change to wetland ecosystems
• The effects of ecosystem loss and change on human well-being
Indicator(s) THE DISTRIBUTION OF WETLANDS AND THEIR SPECIES:
• Area (ha) of wetlands in each global region
• Number of countries in which peatlands occur
• Area (ha) of peatlands in each global region
• Number of rivers and lakes in each global region
• Area (ha) of estuaries in each global region
• Area (ha) of mangrove forest cover in each global region
• Area (ha) of coral reefs in each global region
• Area (ha) of seagrass beds in each global region
• Percent of world habitat extent of each wetland type
• Percent of known biological species found in each wetland type
• Ratio between species richness and habitat extent per wetland ecosystem type
• Number of species present in each wetland type (using the Living Planet Index)
• Number of threatened and non-threatened wetland-dependent amphibian species present in each major habitat type
• Number of threatened waterbird species globally
• Proportion of wetland-dependent mammals that are globally threatened
CONDITION AND TRENDS OF WETLAND ECOSYSTEM SERVICES:
• Percent of global population that inland waters/mountains provide drinking water to
• Number of people that groundwater (often recharged through wetlands) provides drinking water to
• Number of people that wetlands provide flood control and water supply to
• Percent of Cambodians whose total animal protein is derived from fish/fisheries
• Weight (tonnes) of fish catches from each wetland type
• Value (USD) of fish catches from each wetland type
• Average percent of nitrate concentration reduced by major wetlands
• Income (USD) provided by wetlands annually through tourism and recreation
• Amount (gigatonnes) of carbon stored in wetlands globally
108

TE
AM
SIL
VA
CO
M
Assessing the Ecosystem Service Benefits of the Algar LEAP Project
STUDY NAME ECOSYSTEMS AND HUMAN WELL-BEING: WETLANDS AND WATER SYNTHESIS
• Percent of global carbon storage provided by wetlands
• Annual global economic value (USD) of all services from unconverted wetlands (e.g. flood control, pollination, pollution control, climate regulation)
• Volume (km3) of water withdrawn by humans from inland wetlands annually
DRIVERS OF LOSS AND CHANGE TO WETLAND ECOSYSTEMS:
• Increase in average global temperatures (˚C)
• Increase in volume (km3) of water impounded behind dams since 1960
• Increase in the percent of global wetlands drained for agriculture
• Change in the surface area (in km2) of inland water bodies
• Percent of wetland habitat lost due to anthropogenic activities
• Percent of wetland species affected by habitat loss and degradation
• Decrease in the number of undisturbed wetlands
THE EFFECTS OF ECOSYSTEM LOSS AND CHANGE ON HUMAN WELL-BEING:
• Change in the availability of quality drinking water
• Change in the provision of ecosystem services from wetlands
• Decrease in the net economic benefit (USD) and income (USD) from the degradation of coral reeds
• Change in the frequency and severity of water-borne diseases
• Decrease in the global net economic value (USD) of all services from unconverted wetlands (e.g. flood control, pollination, pollution control, climate regulation)
Data source(s) Because this report presents a synthesis of work completed previously on wetland ecosystems around the world, the data sources are too numerous to present here. A complete list of references can be accessed at: http://www.epa.gov/ncer/events/calendar/2007/sep26/millenium.pdf.
Key assumption(s) No explicit assumptions were made for this study, as it is a review and summary of past studies completed on the ecosystems of interest.
Limitations/uncertainties • The ability of species to respond and recover given the multiple stressors to which they are exposed (such as climate change and increased human activity) is uncertain.
• The rate and magnitude of climate change (and other drivers) and the ability of wetland species to adapt to climate change impacts (or impacts from other drivers) is uncertain.
STUDY NAME ASSESSING FUTURE ECOSYSTEM SERVICES: A CASE STUDY OF THE NORTHERN HIGHLANDS LAKE DISTRICT, WISCONSIN
Author(s) Garry D. Peterson, T. Douglas Beard Jr., Beatrix E. Beisner, Elena M. Bennet, Stephen R. Carpenter, Graeme S. Cumming, C. Lisa Dent, and Tanya D Havlicek
Reference Peterson, G D; Beard, T D Jr.; Beisner, B E; Bennett, E M; Carpenter, S R; Cumming, G S; Dent, C L; Havlicek, T D. 2003. Assessing future ecosystem services: a case study of the
109

TE
AM
SIL
VA
CO
M
Assessing the Ecosystem Service Benefits of the Algar LEAP Project
STUDY NAME ASSESSING FUTURE ECOSYSTEM SERVICES: A CASE STUDY OF THE NORTHERN HIGHLANDS LAKE DISTRICT, WISCONSIN
Northern Highlands Lake District, Wisconsin. Conservation Ecology 7(3): article 1.
Region(s) Northern Highlands Lake District, Wisconsin
Study Overview This study identifies the current condition and trends of the Northern Highlands Lake District (NHLD) ecosystem and the services it provides. The NHLD is transitioning from being relatively sparsely settled to being more densely populated. The study examines the impact of this transition on the regional ecosystem. Given the social and ecological processes that are known to take place in the NHLD, three socio-economic scenarios simulating different plausible future outcomes for the NHLD are assessed.
Time frame 2000-2025
Relevant ecosystem service(s)
• Water (provisioning)
• Fishing (provisioning, cultural)
• Recreation (cultural)
• Habitat (supporting)
Overview of Methodology The authors used the ecological assessment framework developed by the Millennium Ecosystem Assessment to determine key social and ecological drivers in the NHLD. Alternative migration patterns and levels of ecological vulnerability were then used to define three socio-economic scenarios, each of which projected different degrees of use of ecological services.
Measurement(s) • Spatial distribution of humans on the NHLD landscape
• The effects of human activity on NHLD ecosystem services
Indicator(s) DRIVERS OF CHANGE:
• Climate change:
- Temperature (˚C)
- Time of first snowfall
- Time of snow melt
• Population growth and distribution:
- Number of residents
- Location of residents
- Rate of increase/decrease in the number of residents over a time period
• Changes in human activity:
- Number of tourists to the NHLD annually
- Rate of increase/decrease in number of tourists annually
- Number of people engaging in recreational activities
- Rate of increase/decrease in the number of people performing recreational activities
ECOSYSTEM CHANGES:
• Changes in ecosystem stability:
110
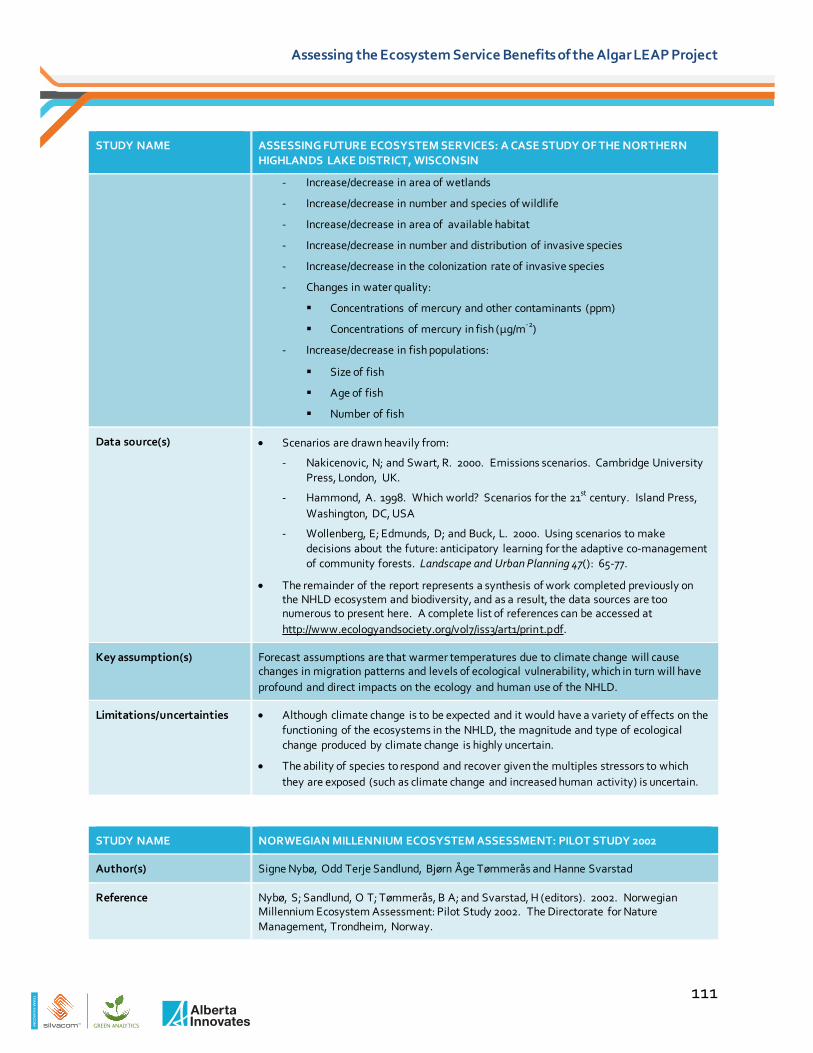
TE
AM
SIL
VA
CO
M
Assessing the Ecosystem Service Benefits of the Algar LEAP Project
STUDY NAME ASSESSING FUTURE ECOSYSTEM SERVICES: A CASE STUDY OF THE NORTHERN HIGHLANDS LAKE DISTRICT, WISCONSIN
- Increase/decrease in area of wetlands
- Increase/decrease in number and species of wildlife
- Increase/decrease in area of available habitat
- Increase/decrease in number and distribution of invasive species
- Increase/decrease in the colonization rate of invasive species
- Changes in water quality:
Concentrations of mercury and other contaminants (ppm)
Concentrations of mercury in fish (µg/m-2)
- Increase/decrease in fish populations:
Size of fish
Age of fish
Number of fish
Data source(s) • Scenarios are drawn heavily from:
- Nakicenovic, N; and Swart, R. 2000. Emissions scenarios. Cambridge University Press, London, UK.
- Hammond, A. 1998. Which world? Scenarios for the 21st century. Island Press, Washington, DC, USA
- Wollenberg, E; Edmunds, D; and Buck, L. 2000. Using scenarios to make decisions about the future: anticipatory learning for the adaptive co-management of community forests. Landscape and Urban Planning 47(): 65-77.
• The remainder of the report represents a synthesis of work completed previously on the NHLD ecosystem and biodiversity, and as a result, the data sources are too numerous to present here. A complete list of references can be accessed at http://www.ecologyandsociety.org/vol7/iss3/art1/print.pdf.
Key assumption(s) Forecast assumptions are that warmer temperatures due to climate change will cause changes in migration patterns and levels of ecological vulnerability, which in turn will have profound and direct impacts on the ecology and human use of the NHLD.
Limitations/uncertainties • Although climate change is to be expected and it would have a variety of effects on the functioning of the ecosystems in the NHLD, the magnitude and type of ecological change produced by climate change is highly uncertain.
• The ability of species to respond and recover given the multiples stressors to which they are exposed (such as climate change and increased human activity) is uncertain.
STUDY NAME NORWEGIAN MILLENNIUM ECOSYSTEM ASSESSMENT: PILOT STUDY 2002
Author(s) Signe Nybø, Odd Terje Sandlund, Bjørn Åge Tømmerås and Hanne Svarstad
Reference Nybø, S; Sandlund, O T; Tømmerås, B A; and Svarstad, H (editors). 2002. Norwegian Millennium Ecosystem Assessment: Pilot Study 2002. The Directorate for Nature Management, Trondheim, Norway.
111

TE
AM
SIL
VA
CO
M
Assessing the Ecosystem Service Benefits of the Algar LEAP Project
STUDY NAME NORWEGIAN MILLENNIUM ECOSYSTEM ASSESSMENT: PILOT STUDY 2002
Region(s) • Conditions and trends assessed for all ecosystem types in Norway
• Case study conducted for Norway’s Glomma River Basin region
Study Overview This project demonstrates how a Norwegian project linked to the MA can be carried out by the Norwegian Ministry of the Environment, and how a full-scale study is needed to assess how Norwegian ecosystems can continue to supply the values and services required by the nation. The pilot project identifies the current condition and trends of the primary Norwegian ecosystems and the services they provide, as well as examines the impact of various social and ecological stressors.
Time frame Conditions and trends assessed from 1900–2000
Relevant ecosystem service(s)
• Food, fiber, water (provisioning)
• Water cleansing, erosion protection, climate control, pollution control (regulating)
• Biodiversity (supporting)
• Recreation, tourism (cultural)
Overview of Methodology The study authors use the MA framework to determine key social and ecological drivers of change. Then they examine the conditions and observed trends of Norwegian ecosystems and their services by reviewing and synthesizing relevant previous studies. Data uncertainties and limitations are highlighted to emphasize the need for a full-scale study. Finally, the study authors conduct a case study of the Glomma River Basin with reference to the ecosystem services of interest.
Measurement(s) • The average condition of the primary Norwegian ecosystems, rated as:
- Excellent
- Good
- Fair
- Poor
- Bad
- Not assessed
• The development trends of the Norwegian ecosystem, rated as:
- Stable
- Increasing
- Decreasing
• The observed impacts of various social and ecological drivers of change:
- Population growth
- Climate change
- Consumption increase
- Pollution
- Land use changes
- Harvesting
- Invasive species
112
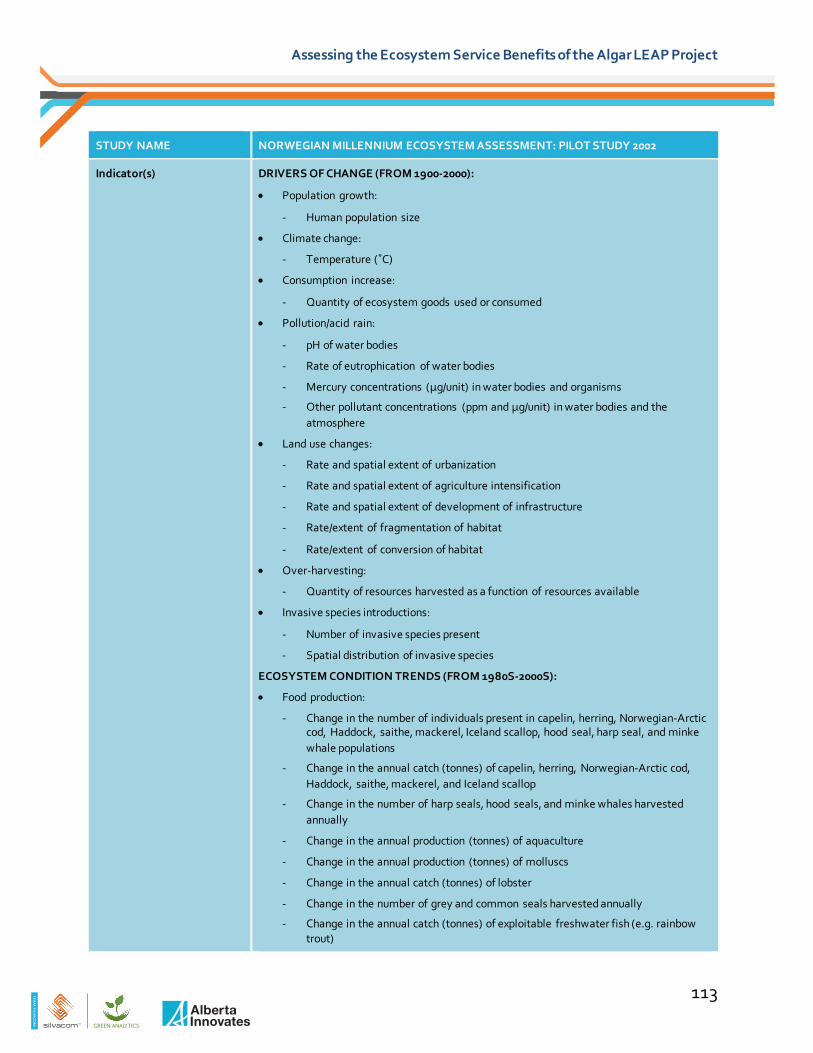
TE
AM
SIL
VA
CO
M
Assessing the Ecosystem Service Benefits of the Algar LEAP Project
STUDY NAME NORWEGIAN MILLENNIUM ECOSYSTEM ASSESSMENT: PILOT STUDY 2002
Indicator(s) DRIVERS OF CHANGE (FROM 1900-2000):
• Population growth:
- Human population size
• Climate change:
- Temperature (˚C)
• Consumption increase:
- Quantity of ecosystem goods used or consumed
• Pollution/acid rain:
- pH of water bodies
- Rate of eutrophication of water bodies
- Mercury concentrations (µg/unit) in water bodies and organisms
- Other pollutant concentrations (ppm and µg/unit) in water bodies and the atmosphere
• Land use changes:
- Rate and spatial extent of urbanization
- Rate and spatial extent of agriculture intensification
- Rate and spatial extent of development of infrastructure
- Rate/extent of fragmentation of habitat
- Rate/extent of conversion of habitat
• Over-harvesting:
- Quantity of resources harvested as a function of resources available
• Invasive species introductions:
- Number of invasive species present
- Spatial distribution of invasive species
ECOSYSTEM CONDITION TRENDS (FROM 1980S-2000S):
• Food production:
- Change in the number of individuals present in capelin, herring, Norwegian-Arctic cod, Haddock, saithe, mackerel, Iceland scallop, hood seal, harp seal, and minke whale populations
- Change in the annual catch (tonnes) of capelin, herring, Norwegian-Arctic cod, Haddock, saithe, mackerel, and Iceland scallop
- Change in the number of harp seals, hood seals, and minke whales harvested annually
- Change in the annual production (tonnes) of aquaculture
- Change in the annual production (tonnes) of molluscs
- Change in the annual catch (tonnes) of lobster
- Change in the number of grey and common seals harvested annually
- Change in the annual catch (tonnes) of exploitable freshwater fish (e.g. rainbow trout)
113

TE
AM
SIL
VA
CO
M
Assessing the Ecosystem Service Benefits of the Algar LEAP Project
STUDY NAME NORWEGIAN MILLENNIUM ECOSYSTEM ASSESSMENT: PILOT STUDY 2002
- Change in the number of ducks taken each hunting season
- Change in the quantity of cloudberries harvested annually from wetland ecosystems
- Change in the area of land suitable for production of food cereals
- Change in annual grain yields
- Change in annual meat production
- Change in the number of small game harvested annually from mountain landscapes
- Change in the annual production of berries in mountain ecosystems
- Change in the number of alpine dairy farms
- Change in the area of alpine grazing land for sheep farms
- Change in the number of moose and red and roe deer harvested annually
- Change in the number of woodland birds and small game harvested annually
- Change in the annual production of forest berries and fungi
- Change in the use of grazing resources in forests by deer and sheep
• Fiber:
- Change in the number of sealskins harvested annually
- Change in the annual production (tonnes) of kelp and knotted wrack
- Change in the quantity (tonnes) of peat harvested annually
- Change in the quantity of wool harvested annually
- Change in the quantity of fur pelts and hides harvested annually
- Change in the quantity (m3) of tree felling
- Change in the annual production of net forest biomass
- Change in the quantity of wool harvested annually
- Change in the quantity of fur pelts and hides harvested annually
- Change in the quantity of lichens and other plant products harvested annually
• Hydrology/erosion protection/pollution:
- Change in the quantity of uncontrolled and permitted operational emissions
- Change in the quantity of radioactive particles present
- Change in the occurrence of organic pollutants
- Change in the occurrence of precipitation runoff
- Change in water storage capacity
- Change in the ability of wetland ecosystems to reduce pollution
- Change in the occurrence of surface runoff, erosion and pollution
- Change in the percent of nitrogen and phosphorus concentrations in water bodies
- Change in the occurrence of extensive clearcutting of trees and drainage of marshy woodland
- Acidification of the soil
114

TE
AM
SIL
VA
CO
M
Assessing the Ecosystem Service Benefits of the Algar LEAP Project
STUDY NAME NORWEGIAN MILLENNIUM ECOSYSTEM ASSESSMENT: PILOT STUDY 2002
- Change in the pH in and pollutants of water and soil from abandoned mines
• Biodiversity:
- Change in the number of different species present in each ecosystem type
- Change in the number of endangered species present in each ecosystem type
- Change in the occurrence of water-borne diseases
- Change in the number of biologically productive lakes, ponds, and other stationary waters
• Recreation:
- Change in the number of tourists annually
- Change in the number of people engaging in angling activities
- Change in the number of people engaging in boating and swimming activities
- Change in the number of people engaging in hunting activities
- Change in the level of attraction and accessibility of each ecosystem type to Norwegian people
• Water quantity:
- Change in the availability of water suitable for drinking without treatment
- Change in the daily per capita consumption (L) of freshwater
- Change in the volume of precipitation
Data source(s) Data for the pilot study was obtained from ongoing research projects, monitoring programs, mapping authorities, national statistics, and the global MA project. The report represents a synthesis of work completed previously on the Norwegian ecosystems and their services, and as a result, the data sources are too numerous to present here. A complete list of references can be accessed at: http://english.dirnat.no/multimedia/48289/Rapport_2002-1b_Millenium_Ecosystem_Assessment.pdf.
Key assumption(s) No explicit assumptions were made for this study, as it is a review and summary of past work completed on this subject for the region of interest.
Limitations/uncertainties There are many uncertainties (i.e. on fish stocks, biodiversity in marine areas, water storage capacity in mires, etc.) involving the condition and trends for the majority of the primary Norwegian ecosystems, which is the reason for the pilot study. These uncertainties are highlighted to prompt a full-scale ecosystem assessment, and are too numerous to list here. However, the uncertainties garnering the most concern are:
• Good estimates for the fish stocks are not available.
• There is uncertainty regarding the status and development of harp and hooded seals, partly because estimates are based on old mark-recapture experiments, and partly because they are uncorrected minimum estimates.
• There is little data available relating to biodiversity in the ocean. Knowledge about the impact of over-fishing, pollution and various activities on biodiversity is insufficient.
• Catch statistics for lobster are very unreliable. Both the size of the population and catches of crabs are unknown. Little is known about the population size of the Norway lobster.
• There is scarce information about biodiversity in marine areas, including the coastal areas.
115
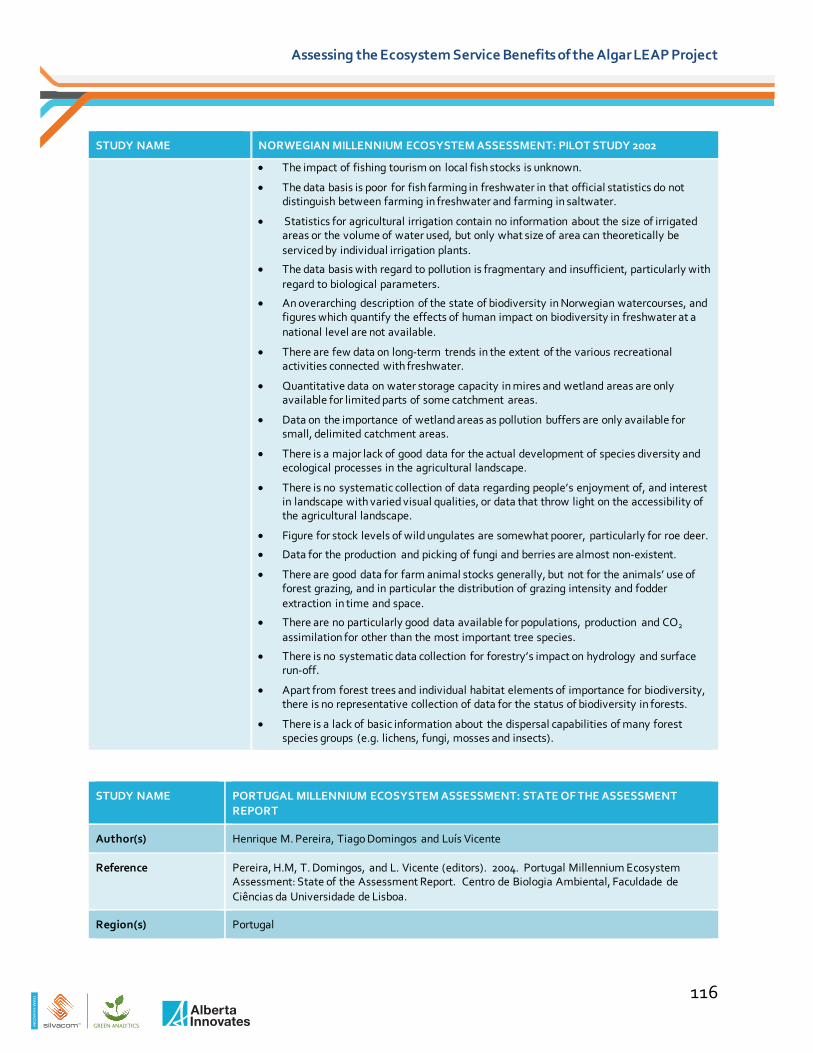
TE
AM
SIL
VA
CO
M
Assessing the Ecosystem Service Benefits of the Algar LEAP Project
STUDY NAME NORWEGIAN MILLENNIUM ECOSYSTEM ASSESSMENT: PILOT STUDY 2002
• The impact of fishing tourism on local fish stocks is unknown.
• The data basis is poor for fish farming in freshwater in that official statistics do not distinguish between farming in freshwater and farming in saltwater.
• Statistics for agricultural irrigation contain no information about the size of irrigated areas or the volume of water used, but only what size of area can theoretically be serviced by individual irrigation plants.
• The data basis with regard to pollution is fragmentary and insufficient, particularly with regard to biological parameters.
• An overarching description of the state of biodiversity in Norwegian watercourses, and figures which quantify the effects of human impact on biodiversity in freshwater at a national level are not available.
• There are few data on long-term trends in the extent of the various recreational activities connected with freshwater.
• Quantitative data on water storage capacity in mires and wetland areas are only available for limited parts of some catchment areas.
• Data on the importance of wetland areas as pollution buffers are only available for small, delimited catchment areas.
• There is a major lack of good data for the actual development of species diversity and ecological processes in the agricultural landscape.
• There is no systematic collection of data regarding people’s enjoyment of, and interest in landscape with varied visual qualities, or data that throw light on the accessibility of the agricultural landscape.
• Figure for stock levels of wild ungulates are somewhat poorer, particularly for roe deer.
• Data for the production and picking of fungi and berries are almost non-existent.
• There are good data for farm animal stocks generally, but not for the animals’ use of forest grazing, and in particular the distribution of grazing intensity and fodder extraction in time and space.
• There are no particularly good data available for populations, production and CO2 assimilation for other than the most important tree species.
• There is no systematic data collection for forestry’s impact on hydrology and surface run-off.
• Apart from forest trees and individual habitat elements of importance for biodiversity, there is no representative collection of data for the status of biodiversity in forests.
• There is a lack of basic information about the dispersal capabilities of many forest species groups (e.g. lichens, fungi, mosses and insects).
STUDY NAME PORTUGAL MILLENNIUM ECOSYSTEM ASSESSMENT: STATE OF THE ASSESSMENT REPORT
Author(s) Henrique M. Pereira, Tiago Domingos and Luís Vicente
Reference Pereira, H.M, T. Domingos, and L. Vicente (editors). 2004. Portugal Millennium Ecosystem Assessment: State of the Assessment Report. Centro de Biologia Ambiental, Faculdade de Ciências da Universidade de Lisboa.
Region(s) Portugal
116
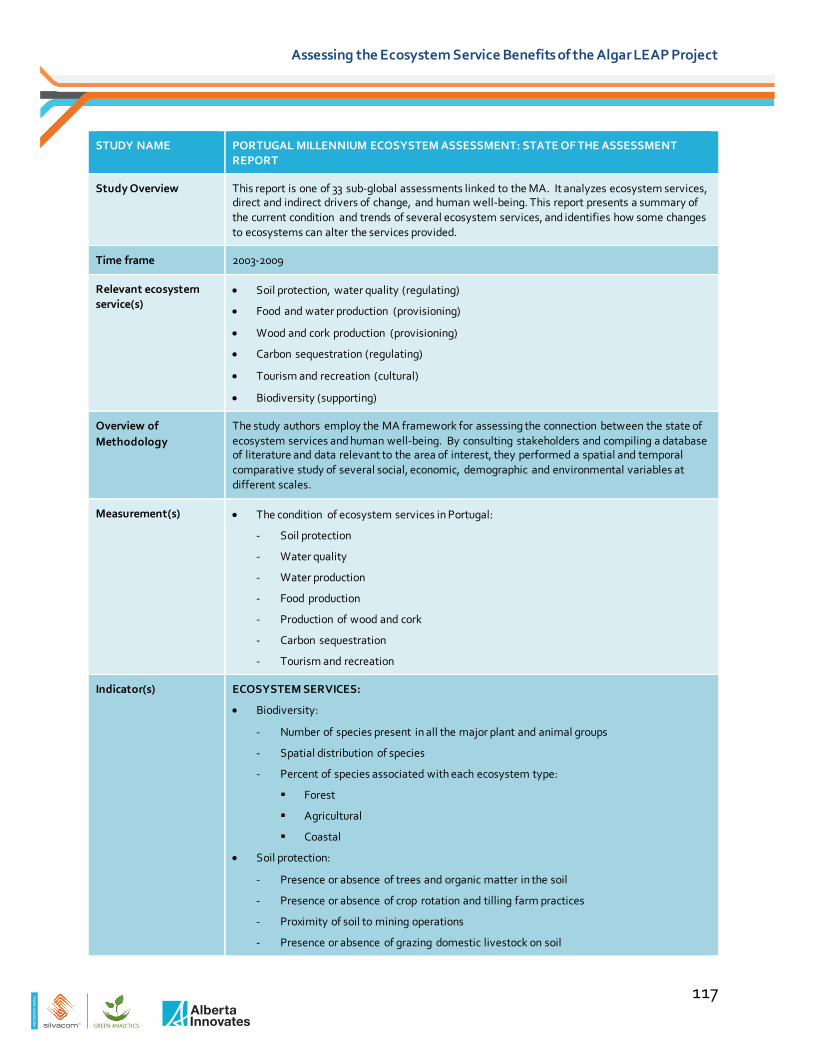
TE
AM
SIL
VA
CO
M
Assessing the Ecosystem Service Benefits of the Algar LEAP Project
STUDY NAME PORTUGAL MILLENNIUM ECOSYSTEM ASSESSMENT: STATE OF THE ASSESSMENT REPORT
Study Overview This report is one of 33 sub-global assessments linked to the MA. It analyzes ecosystem services, direct and indirect drivers of change, and human well-being. This report presents a summary of the current condition and trends of several ecosystem services, and identifies how some changes to ecosystems can alter the services provided.
Time frame 2003-2009
Relevant ecosystem service(s)
• Soil protection, water quality (regulating)
• Food and water production (provisioning)
• Wood and cork production (provisioning)
• Carbon sequestration (regulating)
• Tourism and recreation (cultural)
• Biodiversity (supporting)
Overview of Methodology
The study authors employ the MA framework for assessing the connection between the state of ecosystem services and human well-being. By consulting stakeholders and compiling a database of literature and data relevant to the area of interest, they performed a spatial and temporal comparative study of several social, economic, demographic and environmental variables at different scales.
Measurement(s) • The condition of ecosystem services in Portugal:
- Soil protection
- Water quality
- Water production
- Food production
- Production of wood and cork
- Carbon sequestration
- Tourism and recreation
Indicator(s) ECOSYSTEM SERVICES:
• Biodiversity:
- Number of species present in all the major plant and animal groups
- Spatial distribution of species
- Percent of species associated with each ecosystem type:
Forest
Agricultural
Coastal
• Soil protection:
- Presence or absence of trees and organic matter in the soil
- Presence or absence of crop rotation and tilling farm practices
- Proximity of soil to mining operations
- Presence or absence of grazing domestic livestock on soil
117
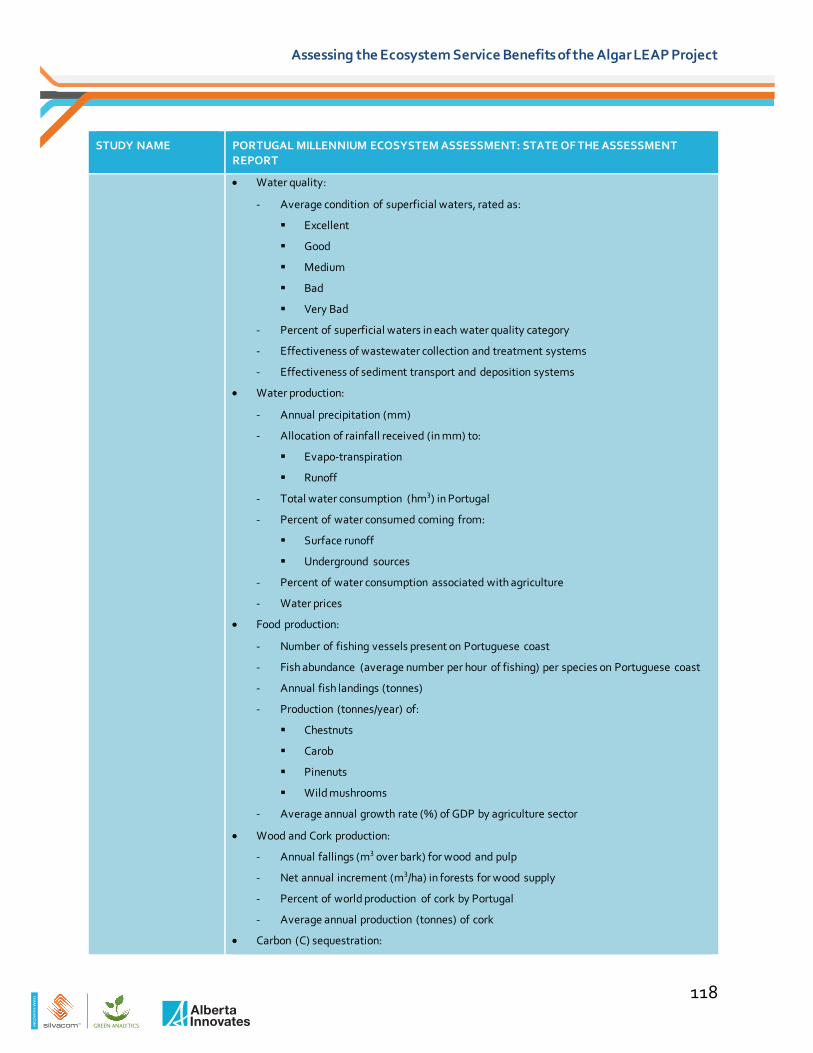
TE
AM
SIL
VA
CO
M
Assessing the Ecosystem Service Benefits of the Algar LEAP Project
STUDY NAME PORTUGAL MILLENNIUM ECOSYSTEM ASSESSMENT: STATE OF THE ASSESSMENT REPORT
• Water quality:
- Average condition of superficial waters, rated as:
Excellent
Good
Medium
Bad
Very Bad
- Percent of superficial waters in each water quality category
- Effectiveness of wastewater collection and treatment systems
- Effectiveness of sediment transport and deposition systems
• Water production:
- Annual precipitation (mm)
- Allocation of rainfall received (in mm) to:
Evapo-transpiration
Runoff
- Total water consumption (hm3) in Portugal
- Percent of water consumed coming from:
Surface runoff
Underground sources
- Percent of water consumption associated with agriculture
- Water prices
• Food production:
- Number of fishing vessels present on Portuguese coast
- Fish abundance (average number per hour of fishing) per species on Portuguese coast
- Annual fish landings (tonnes)
- Production (tonnes/year) of:
Chestnuts
Carob
Pinenuts
Wild mushrooms
- Average annual growth rate (%) of GDP by agriculture sector
• Wood and Cork production:
- Annual fallings (m3 over bark) for wood and pulp
- Net annual increment (m3/ha) in forests for wood supply
- Percent of world production of cork by Portugal
- Average annual production (tonnes) of cork
• Carbon (C) sequestration:
118
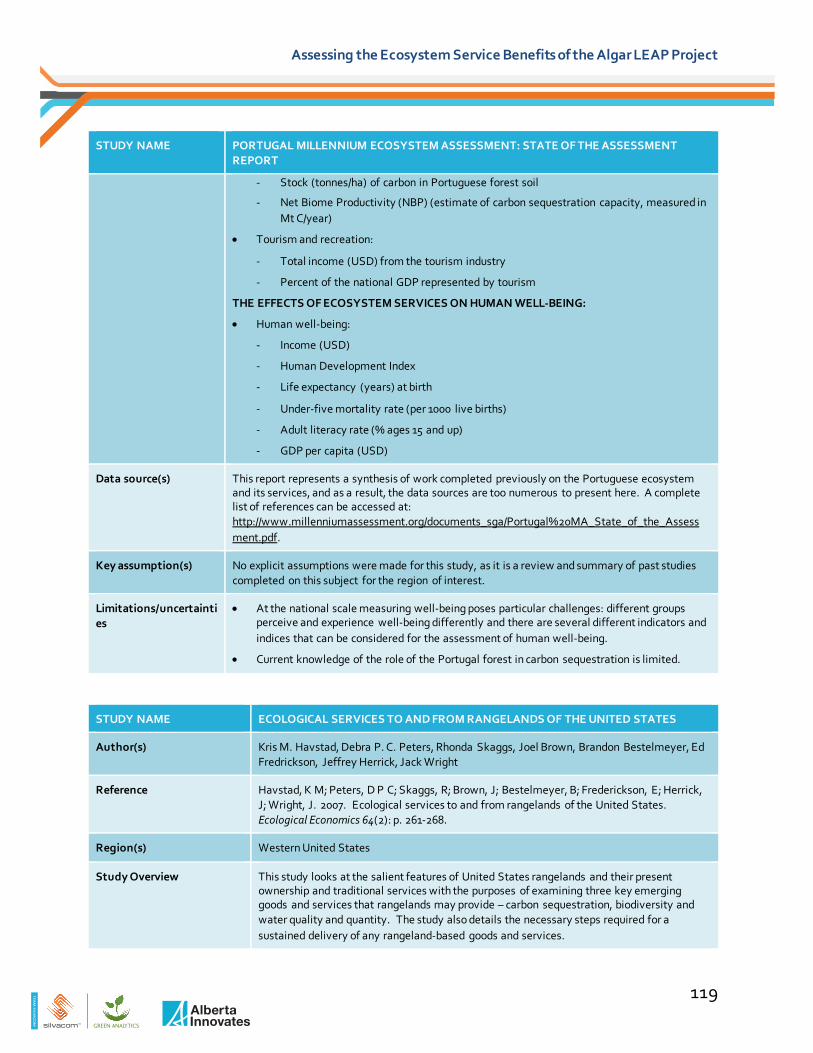
TE
AM
SIL
VA
CO
M
Assessing the Ecosystem Service Benefits of the Algar LEAP Project
STUDY NAME PORTUGAL MILLENNIUM ECOSYSTEM ASSESSMENT: STATE OF THE ASSESSMENT REPORT
- Stock (tonnes/ha) of carbon in Portuguese forest soil
- Net Biome Productivity (NBP) (estimate of carbon sequestration capacity, measured in Mt C/year)
• Tourism and recreation:
- Total income (USD) from the tourism industry
- Percent of the national GDP represented by tourism
THE EFFECTS OF ECOSYSTEM SERVICES ON HUMAN WELL-BEING:
• Human well-being:
- Income (USD)
- Human Development Index
- Life expectancy (years) at birth
- Under-five mortality rate (per 1000 live births)
- Adult literacy rate (% ages 15 and up)
- GDP per capita (USD)
Data source(s) This report represents a synthesis of work completed previously on the Portuguese ecosystem and its services, and as a result, the data sources are too numerous to present here. A complete list of references can be accessed at: http://www.millenniumassessment.org/documents_sga/Portugal%20MA_State_of_the_Assessment.pdf.
Key assumption(s) No explicit assumptions were made for this study, as it is a review and summary of past studies completed on this subject for the region of interest.
Limitations/uncertainties
• At the national scale measuring well-being poses particular challenges: different groups perceive and experience well-being differently and there are several different indicators and indices that can be considered for the assessment of human well-being.
• Current knowledge of the role of the Portugal forest in carbon sequestration is limited.
STUDY NAME ECOLOGICAL SERVICES TO AND FROM RANGELANDS OF THE UNITED STATES
Author(s) Kris M. Havstad, Debra P. C. Peters, Rhonda Skaggs, Joel Brown, Brandon Bestelmeyer, Ed Fredrickson, Jeffrey Herrick, Jack Wright
Reference Havstad, K M; Peters, D P C; Skaggs, R; Brown, J; Bestelmeyer, B; Frederickson, E; Herrick, J; Wright, J. 2007. Ecological services to and from rangelands of the United States. Ecological Economics 64(2): p. 261-268.
Region(s) Western United States
Study Overview This study looks at the salient features of United States rangelands and their present ownership and traditional services with the purposes of examining three key emerging goods and services that rangelands may provide – carbon sequestration, biodiversity and water quality and quantity. The study also details the necessary steps required for a sustained delivery of any rangeland-based goods and services.
119
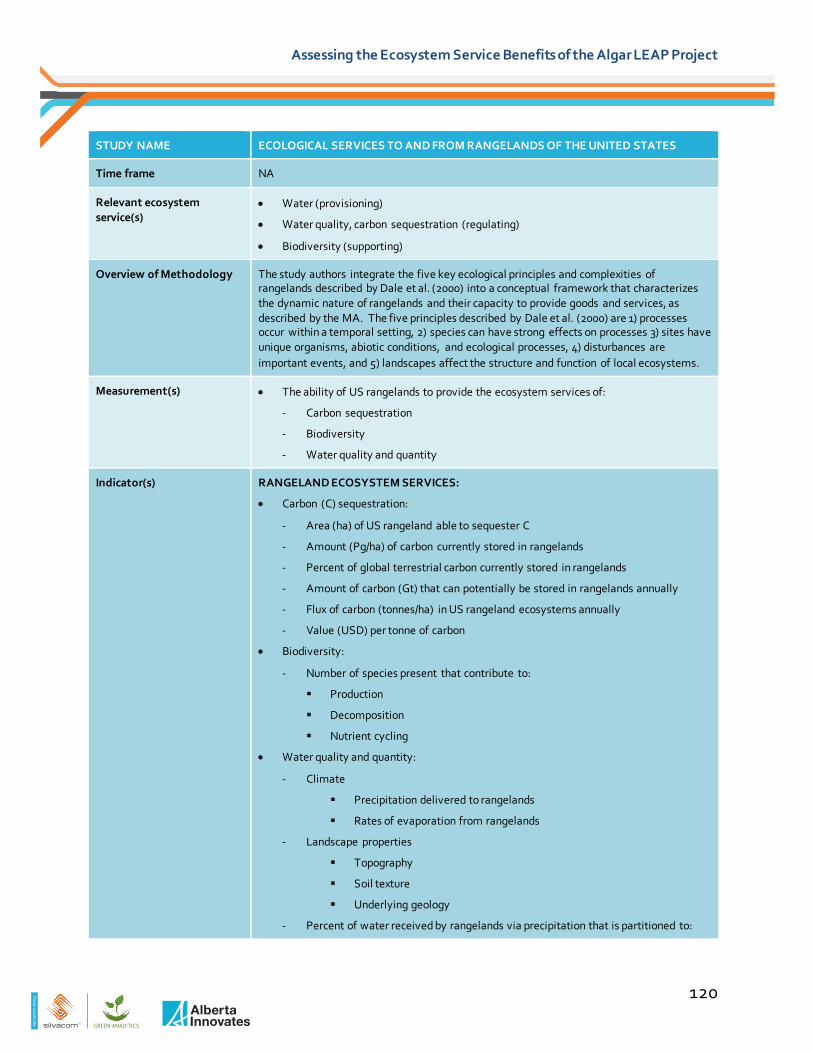
TE
AM
SIL
VA
CO
M
Assessing the Ecosystem Service Benefits of the Algar LEAP Project
STUDY NAME ECOLOGICAL SERVICES TO AND FROM RANGELANDS OF THE UNITED STATES
Time frame NA
Relevant ecosystem service(s)
• Water (provisioning)
• Water quality, carbon sequestration (regulating)
• Biodiversity (supporting)
Overview of Methodology The study authors integrate the five key ecological principles and complexities of rangelands described by Dale et al. (2000) into a conceptual framework that characterizes the dynamic nature of rangelands and their capacity to provide goods and services, as described by the MA. The five principles described by Dale et al. (2000) are 1) processes occur within a temporal setting, 2) species can have strong effects on processes 3) sites have unique organisms, abiotic conditions, and ecological processes, 4) disturbances are important events, and 5) landscapes affect the structure and function of local ecosystems.
Measurement(s) • The ability of US rangelands to provide the ecosystem services of:
- Carbon sequestration
- Biodiversity
- Water quality and quantity
Indicator(s) RANGELAND ECOSYSTEM SERVICES:
• Carbon (C) sequestration:
- Area (ha) of US rangeland able to sequester C
- Amount (Pg/ha) of carbon currently stored in rangelands
- Percent of global terrestrial carbon currently stored in rangelands
- Amount of carbon (Gt) that can potentially be stored in rangelands annually
- Flux of carbon (tonnes/ha) in US rangeland ecosystems annually
- Value (USD) per tonne of carbon
• Biodiversity:
- Number of species present that contribute to:
Production
Decomposition
Nutrient cycling
• Water quality and quantity:
- Climate
Precipitation delivered to rangelands
Rates of evaporation from rangelands
- Landscape properties
Topography
Soil texture
Underlying geology
- Percent of water received by rangelands via precipitation that is partitioned to:
120
TE
AM
SIL
VA
CO
M
Assessing the Ecosystem Service Benefits of the Algar LEAP Project
STUDY NAME ECOLOGICAL SERVICES TO AND FROM RANGELANDS OF THE UNITED STATES
Surface water flow
Plant production
Groundwater recharge
Evaporation from soil and plants
Data source(s)
Rangeland principles and characteristics drawn heavily from:
Dale, V H; Brown, S; Haeuber, R A; Hobbs, N T; Huntly, N; Naiman, R J; Riebsame, W E; Turner, M G; Valone, T J. 2000. Ecological principles and guidelines for managing the use of land. Ecological Applications 10(3): p. 639-670.
The remainder of the report represents a synthesis of work completed previously on the US rangeland ecosystem, and as a result, the data sources are too numerous to present here. A complete list of references can be accessed at: http://jornada.nmsu.edu/bibliography/07-031.pdf.
Key assumption(s) No explicit assumptions were made for this study, as the aim of the study was to offer region-specific information to support land management decisions in the area. The study is a review and summary of existing literature and data for the region of interest.
Limitations/uncertainties NA
121
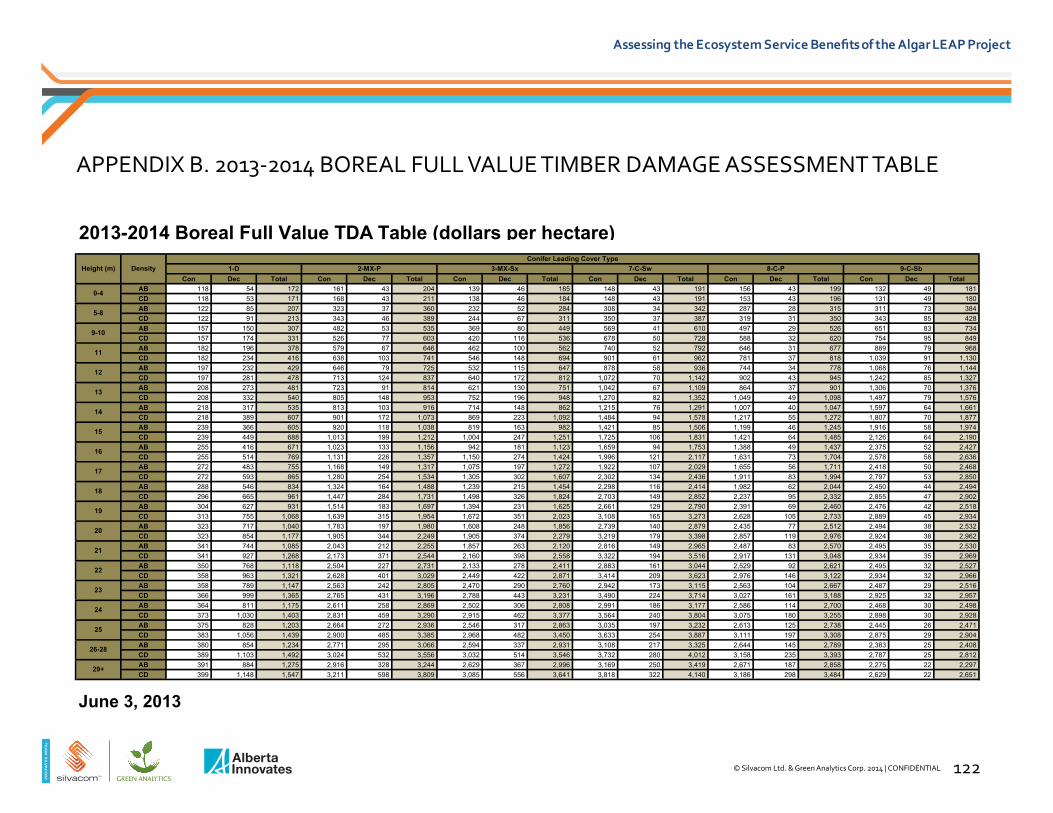
2013-2014 Boreal Full Value TDA Table (dollars per hectare)
Con Dec Total Con Dec Total Con Dec Total Con Dec Total Con Dec Total Con Dec TotalAB 118 54 172 161 43 204 139 46 185 148 43 191 156 43 199 132 49 181 CD 118 53 171 168 43 211 138 46 184 148 43 191 153 43 196 131 49 180 AB 122 85 207 323 37 360 232 52 284 308 34 342 287 28 315 311 73 384 CD 122 91 213 343 46 389 244 67 311 350 37 387 319 31 350 343 85 428 AB 157 150 307 482 53 535 369 80 449 569 41 610 497 29 526 651 83 734 CD 157 174 331 526 77 603 420 116 536 678 50 728 588 32 620 754 95 849 AB 182 196 378 579 67 646 462 100 562 740 52 792 646 31 677 889 79 968 CD 182 234 416 638 103 741 546 148 694 901 61 962 781 37 818 1,039 91 1,130 AB 197 232 429 646 79 725 532 115 647 878 58 936 744 34 778 1,068 76 1,144 CD 197 281 478 713 124 837 640 172 812 1,072 70 1,142 902 43 945 1,242 85 1,327 AB 208 273 481 723 91 814 621 130 751 1,042 67 1,109 864 37 901 1,306 70 1,376 CD 208 332 540 805 148 953 752 196 948 1,270 82 1,352 1,049 49 1,098 1,497 79 1,576 AB 218 317 535 813 103 916 714 148 862 1,215 76 1,291 1,007 40 1,047 1,597 64 1,661 CD 218 389 607 901 172 1,073 869 223 1,092 1,484 94 1,578 1,217 55 1,272 1,807 70 1,877 AB 239 366 605 920 118 1,038 819 163 982 1,421 85 1,506 1,199 46 1,245 1,916 58 1,974 CD 239 449 688 1,013 199 1,212 1,004 247 1,251 1,725 106 1,831 1,421 64 1,485 2,126 64 2,190 AB 255 416 671 1,023 133 1,156 942 181 1,123 1,659 94 1,753 1,388 49 1,437 2,375 52 2,427 CD 255 514 769 1,131 226 1,357 1,150 274 1,424 1,996 121 2,117 1,631 73 1,704 2,578 58 2,636 AB 272 483 755 1,168 149 1,317 1,075 197 1,272 1,922 107 2,029 1,655 56 1,711 2,418 50 2,468 CD 272 593 865 1,280 254 1,534 1,305 302 1,607 2,302 134 2,436 1,911 83 1,994 2,797 53 2,850 AB 288 546 834 1,324 164 1,488 1,239 215 1,454 2,298 116 2,414 1,982 62 2,044 2,450 44 2,494 CD 296 665 961 1,447 284 1,731 1,498 326 1,824 2,703 149 2,852 2,237 95 2,332 2,855 47 2,902 AB 304 627 931 1,514 183 1,697 1,394 231 1,625 2,661 129 2,790 2,391 69 2,460 2,476 42 2,518 CD 313 755 1,068 1,639 315 1,954 1,672 351 2,023 3,108 165 3,273 2,628 105 2,733 2,889 45 2,934 AB 323 717 1,040 1,783 197 1,980 1,608 248 1,856 2,739 140 2,879 2,435 77 2,512 2,494 38 2,532 CD 323 854 1,177 1,905 344 2,249 1,905 374 2,279 3,219 179 3,398 2,857 119 2,976 2,924 38 2,962 AB 341 744 1,085 2,043 212 2,255 1,857 263 2,120 2,816 149 2,965 2,487 83 2,570 2,495 35 2,530 CD 341 927 1,268 2,173 371 2,544 2,160 398 2,558 3,322 194 3,516 2,917 131 3,048 2,934 35 2,969 AB 350 768 1,118 2,504 227 2,731 2,133 278 2,411 2,883 161 3,044 2,529 92 2,621 2,495 32 2,527 CD 358 963 1,321 2,628 401 3,029 2,449 422 2,871 3,414 209 3,623 2,976 146 3,122 2,934 32 2,966 AB 358 789 1,147 2,563 242 2,805 2,470 290 2,760 2,942 173 3,115 2,563 104 2,667 2,487 29 2,516 CD 366 999 1,365 2,765 431 3,196 2,788 443 3,231 3,490 224 3,714 3,027 161 3,188 2,925 32 2,957 AB 364 811 1,175 2,611 258 2,869 2,502 306 2,808 2,991 186 3,177 2,586 114 2,700 2,468 30 2,498 CD 373 1,030 1,403 2,831 459 3,290 2,915 462 3,377 3,564 240 3,804 3,075 180 3,255 2,898 30 2,928 AB 375 828 1,203 2,664 272 2,936 2,546 317 2,863 3,035 197 3,232 2,613 125 2,738 2,445 26 2,471 CD 383 1,056 1,439 2,900 485 3,385 2,968 482 3,450 3,633 254 3,887 3,111 197 3,308 2,875 29 2,904 AB 380 854 1,234 2,771 295 3,066 2,594 337 2,931 3,108 217 3,325 2,644 145 2,789 2,383 25 2,408 CD 389 1,103 1,492 3,024 532 3,556 3,032 514 3,546 3,732 280 4,012 3,158 235 3,393 2,787 25 2,812 AB 391 884 1,275 2,916 328 3,244 2,629 367 2,996 3,169 250 3,419 2,671 187 2,858 2,275 22 2,297 CD 399 1,148 1,547 3,211 598 3,809 3,085 556 3,641 3,818 322 4,140 3,186 298 3,484 2,629 22 2,651
June 3, 2013
26-28
29+
20
21
22
23
24
25
19
0-4
5-8
9-10
11
12
13
14
15
16
17
18
Height (m) DensityConifer Leading Cover Type
1-D 2-MX-P 3-MX-Sx 7-C-Sw 8-C-P 9-C-Sb
TE
AM
SIL
VA
CO
M
Assessing the Ecosystem Service Benefits of the Algar LEAP Project
APPENDIX B. 2013-2014 BOREAL FULL VALUE TIMBER DAMAGE ASSESSMENT TABLE
© Silvacom Ltd. & Green Analytics Corp. 2014 | CONFIDENTIAL 122
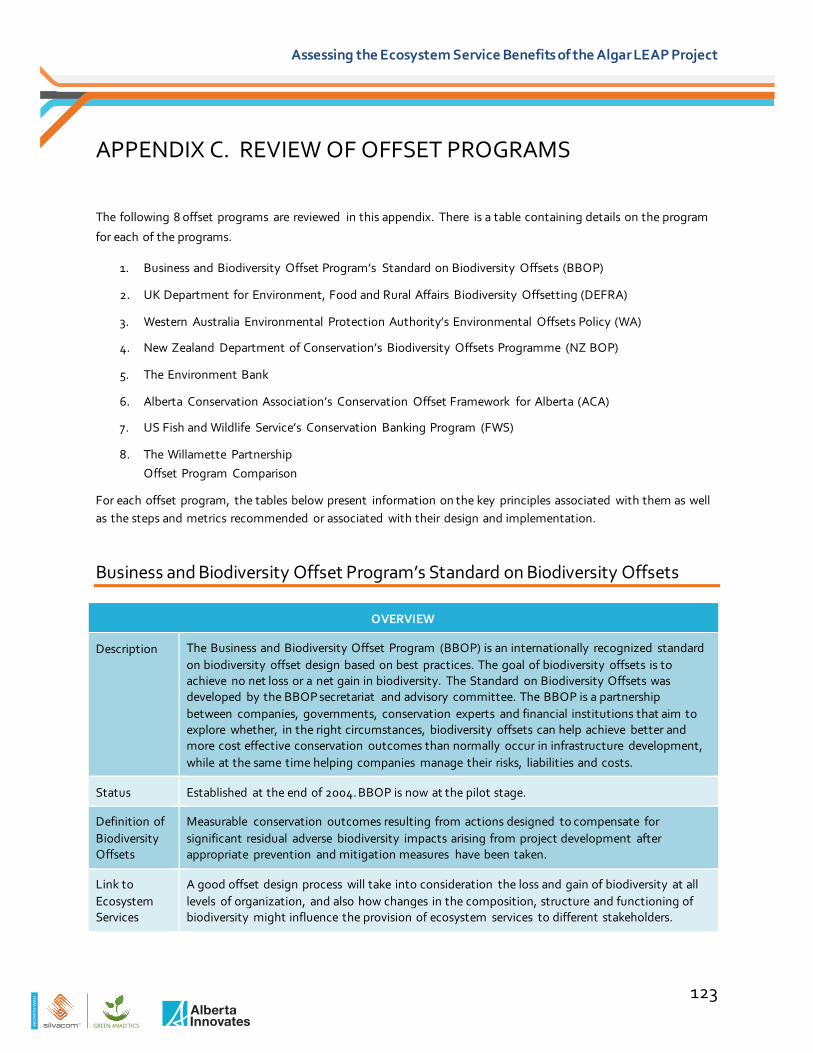
TE
AM
SIL
VA
CO
M
Assessing the Ecosystem Service Benefits of the Algar LEAP Project
APPENDIX C. REVIEW OF OFFSET PROGRAMS
The following 8 offset programs are reviewed in this appendix. There is a table containing details on the program
for each of the programs.
1. Business and Biodiversity Offset Program’s Standard on Biodiversity Offsets (BBOP)
2. UK Department for Environment, Food and Rural Affairs Biodiversity Offsetting (DEFRA)
3. Western Australia Environmental Protection Authority’s Environmental Offsets Policy (WA)
4. New Zealand Department of Conservation’s Biodiversity Offsets Programme (NZ BOP)
5. The Environment Bank
6. Alberta Conservation Association’s Conservation Offset Framework for Alberta (ACA)
7. US Fish and Wildlife Service’s Conservation Banking Program (FWS)
8. The Willamette Partnership Offset Program Comparison
For each offset program, the tables below present information on the key principles associated with them as well as the steps and metrics recommended or associated with their design and implementation.
Business and Biodiversity Offset Program’s Standard on Biodiversity Offsets
OVERVIEW
Description The Business and Biodiversity Offset Program (BBOP) is an internationally recognized standard on biodiversity offset design based on best practices. The goal of biodiversity offsets is to achieve no net loss or a net gain in biodiversity. The Standard on Biodiversity Offsets was developed by the BBOP secretariat and advisory committee. The BBOP is a partnership between companies, governments, conservation experts and financial institutions that aim to explore whether, in the right circumstances, biodiversity offsets can help achieve better and more cost effective conservation outcomes than normally occur in infrastructure development, while at the same time helping companies manage their risks, liabilities and costs.
Status Established at the end of 2004. BBOP is now at the pilot stage.
Definition of Biodiversity Offsets
Measurable conservation outcomes resulting from actions designed to compensate for significant residual adverse biodiversity impacts arising from project development after appropriate prevention and mitigation measures have been taken.
Link to Ecosystem Services
A good offset design process will take into consideration the loss and gain of biodiversity at all levels of organization, and also how changes in the composition, structure and functioning of biodiversity might influence the provision of ecosystem services to different stakeholders.
123

TE
AM
SIL
VA
CO
M
Assessing the Ecosystem Service Benefits of the Algar LEAP Project
PRINCIPLES
Mitigation Hierarchy
A biodiversity offset is a commitment to compensate for significant residual adverse impacts on biodiversity identified after appropriate avoidance, minimization and on-site rehabilitation measures have been taken according to the mitigation hierarchy.
Baseline Assessment
Pre-project condition of biodiversity is identified, characterised, and documented. All residual biodiversity losses due to the project are quantified relative to the ‘pre-project’ condition of affected biodiversity, which is identified, characterized, and documented.
Additionality A biodiversity offset should achieve conservation outcomes above and beyond results that would have occurred if the offset had not taken place. Evidence is provided that the conservation gains at the offset site(s), calculated as the difference between the conservation outcomes with and without the proposed offset activities, were caused by the offset activities. The gains are predicted for a specified, long-term period, and monitored and verified during offset implementation.
Equivalence The biodiversity offset process needs to ensure that biodiversity gains are comparable - in ecological terms, from a conservation-priority perspective, and to local stakeholders to losses that occur as a result of the development project.
Permanence The design and implementation of a biodiversity offset should be based on an adaptive management approach, incorporating monitoring and evaluation, with the objective of securing outcomes that last at least as long as the project’s impacts and preferably in perpetuity. The biodiversity offset shall be designed and implemented for the long term, taking into consideration other likely developments (e.g. competing land use pressures) within the landscape.
Geographic Location
The temporal and geographic scale of the analysis needs to be meaningful at the level of the development project, and with regards to the characteristics of the biodiversity and ecosystem services affected. The methods used for determining equivalence of biodiversity losses and gains address equity in the type and condition, the location, and if possible, the timing of biodiversity losses and gains, and explicitly consider the key biodiversity components.
Limits There are situations where residual impacts cannot be fully compensated for by a biodiversity offset because of the irreplaceability or vulnerability of the biodiversity affected.
No Net Loss A biodiversity offset should be designed and implemented to achieve in situ, measurable conservation outcomes that can reasonably be expected to result in no net loss and preferably a net gain of biodiversity.
Stakeholder Participation
In areas affected by the development project and by the biodiversity offset, the effective participation of stakeholders should be ensured in decision-making about biodiversity offsets, including their evaluation, selection, design, implementation, and monitoring.
124

TE
AM
SIL
VA
CO
M
Assessing the Ecosystem Service Benefits of the Algar LEAP Project
STEPS
Project Scope Understand the purpose and scope of the development project and the main activities likely to take place throughout the different stages of its life cycle. Identify key decision ‘windows’ and suitable ‘entry points’ for integration of biodiversity offsets with project planning.
Legal/Policy Context
Review any legal requirement to undertake an offset and understand the policy context within which a biodiversity offset would be designed and implemented. The policy context would cover government policies, financial or lending institutions’ policies, as well as internal company policies.
Stakeholder Participation
Identify relevant stakeholders at an early stage and establish a process for their effective involvement in the design and implementation of any biodiversity offset.
Offset Need Confirm whether there are residual adverse effects on biodiversity remaining after appropriate application of the mitigation hierarchy, for which an offset is required and appropriate.
Loss / Gain Calculate gains and losses and residual losses from project site using appropriate metrics (described below).
Offset Sites Identify potential offset locations and activities using appropriate biophysical and socioeconomic criteria and select preferred options for more detailed offset planning.
Offset Gains Finalize the selection of offset locations and activities that should result in no net loss of biodiversity. Applying the same metrics and methods that were used to quantify losses due to the project, calculate the biodiversity gains that could be achieved by the shortlist of preferred offset options, check that they offer adequate compensation to any communities affected so they benefit from both the project and the offset, and select final offset location(s) and activities.
Offset Design Record a description of the offset activities and location(s), including the final ‘loss / gain’ account which demonstrates how no net loss of biodiversity will be achieved, how stakeholders will be satisfied and how the offset will contribute to any national requirements and policies.
METRIC
Identify Biodiversity Components
Use a “Key Biodiversity Components Matrix” (table below) to identify and record key biodiversity components at the species, habitat and whole ecosystem levels. This information can help inform the selection of the components of biodiversity to be used to calculate loss and gain.
Bio-diversity Component Intrinsic Values
Use Values
Cultural Values
Vulnerability/Threat Irreplaceability
Global National Local Site endemic Localized Wide-spread Species Communities/ Assemblages/ Habitats
Whole Landscape/ Ecosystem
125
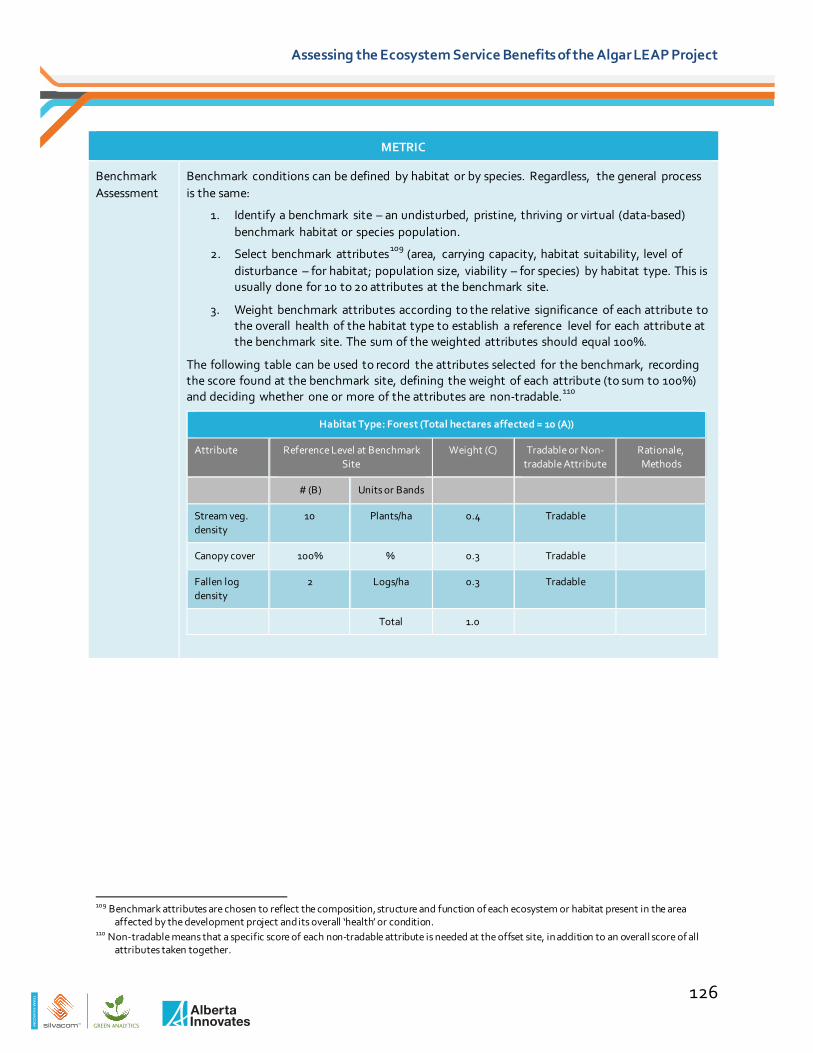
TE
AM
SIL
VA
CO
M
Assessing the Ecosystem Service Benefits of the Algar LEAP Project
METRIC
Benchmark Assessment
Benchmark conditions can be defined by habitat or by species. Regardless, the general process is the same:
1. Identify a benchmark site – an undisturbed, pristine, thriving or virtual (data-based) benchmark habitat or species population.
2. Select benchmark attributes109 (area, carrying capacity, habitat suitability, level of disturbance – for habitat; population size, viability – for species) by habitat type. This is usually done for 10 to 20 attributes at the benchmark site.
3. Weight benchmark attributes according to the relative significance of each attribute to the overall health of the habitat type to establish a reference level for each attribute at the benchmark site. The sum of the weighted attributes should equal 100%.
The following table can be used to record the attributes selected for the benchmark, recording the score found at the benchmark site, defining the weight of each attribute (to sum to 100%) and deciding whether one or more of the attributes are non-tradable.110
Habitat Type: Forest (Total hectares affected = 10 (A))
Attribute Reference Level at Benchmark Site
Weight (C) Tradable or Non-tradable Attribute
Rationale, Methods
# (B) Units or Bands
Stream veg. density
10 Plants/ha 0.4 Tradable
Canopy cover 100% % 0.3 Tradable
Fallen log density
2 Logs/ha 0.3 Tradable
Total 1.0
109 Benchmark attributes are chosen to reflect the composition, structure and function of each ecosystem or habitat present in the area affected by the development project and its overall ‘health’ or condition.
110 Non-tradable means that a specific score of each non-tradable attribute is needed at the offset site, in addition to an overall score of all attributes taken together.
126
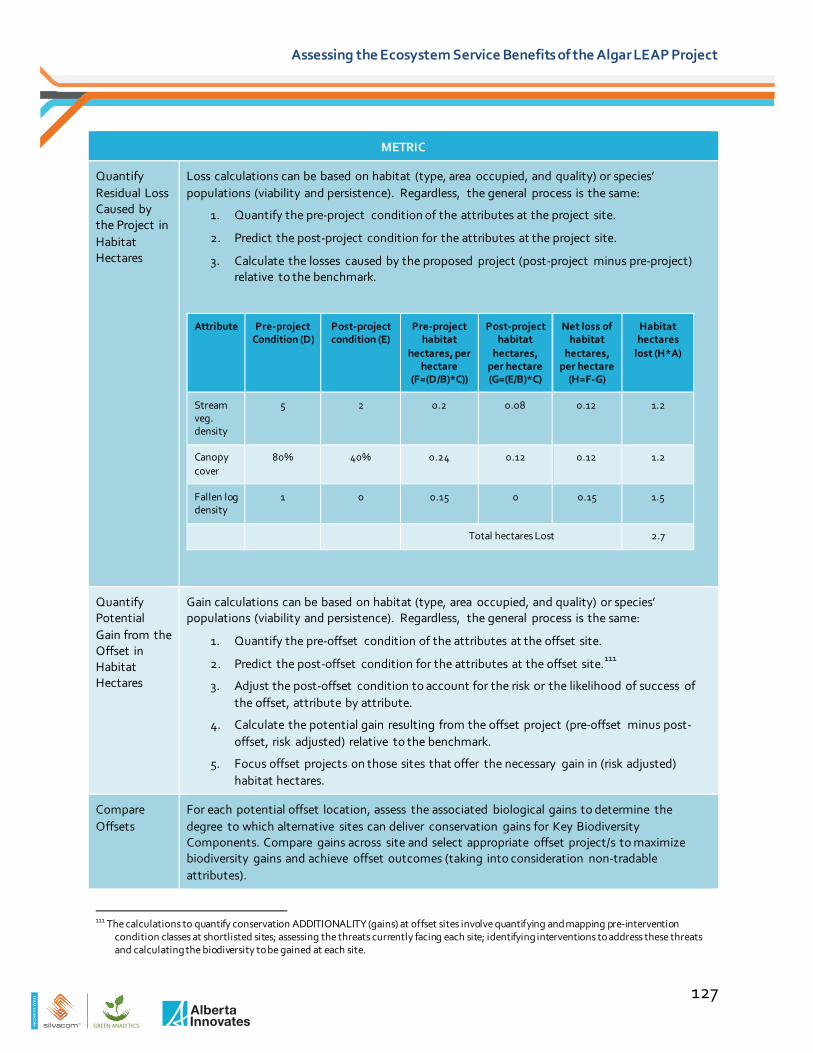
TE
AM
SIL
VA
CO
M
Assessing the Ecosystem Service Benefits of the Algar LEAP Project
METRIC
Quantify Residual Loss Caused by the Project in Habitat Hectares
Loss calculations can be based on habitat (type, area occupied, and quality) or species’ populations (viability and persistence). Regardless, the general process is the same:
1. Quantify the pre-project condition of the attributes at the project site.
2. Predict the post-project condition for the attributes at the project site.
3. Calculate the losses caused by the proposed project (post-project minus pre-project) relative to the benchmark.
Attribute Pre-project Condition (D)
Post-project condition (E)
Pre-project habitat
hectares, per hectare
(F=(D/B)*C))
Post-project habitat
hectares, per hectare (G=(E/B)*C)
Net loss of habitat
hectares, per hectare
(H=F-G)
Habitat hectares
lost (H*A)
Stream veg. density
5 2 0.2 0.08 0.12 1.2
Canopy cover
80% 40% 0.24 0.12 0.12 1.2
Fallen log density
1 0 0.15 0 0.15 1.5
Total hectares Lost 2.7
Quantify Potential Gain from the Offset in Habitat Hectares
Gain calculations can be based on habitat (type, area occupied, and quality) or species’ populations (viability and persistence). Regardless, the general process is the same:
1. Quantify the pre-offset condition of the attributes at the offset site.
2. Predict the post-offset condition for the attributes at the offset site.111
3. Adjust the post-offset condition to account for the risk or the likelihood of success of the offset, attribute by attribute.
4. Calculate the potential gain resulting from the offset project (pre-offset minus post-offset, risk adjusted) relative to the benchmark.
5. Focus offset projects on those sites that offer the necessary gain in (risk adjusted) habitat hectares.
Compare Offsets
For each potential offset location, assess the associated biological gains to determine the degree to which alternative sites can deliver conservation gains for Key Biodiversity Components. Compare gains across site and select appropriate offset project/s to maximize biodiversity gains and achieve offset outcomes (taking into consideration non-tradable attributes).
111 The calculations to quantify conservation ADDITIONALITY (gains) at offset sites involve quantifying and mapping pre-intervention condition classes at shortlisted sites; assessing the threats currently facing each site; identifying interventions to address these threats and calculating the biodiversity to be gained at each site.
127
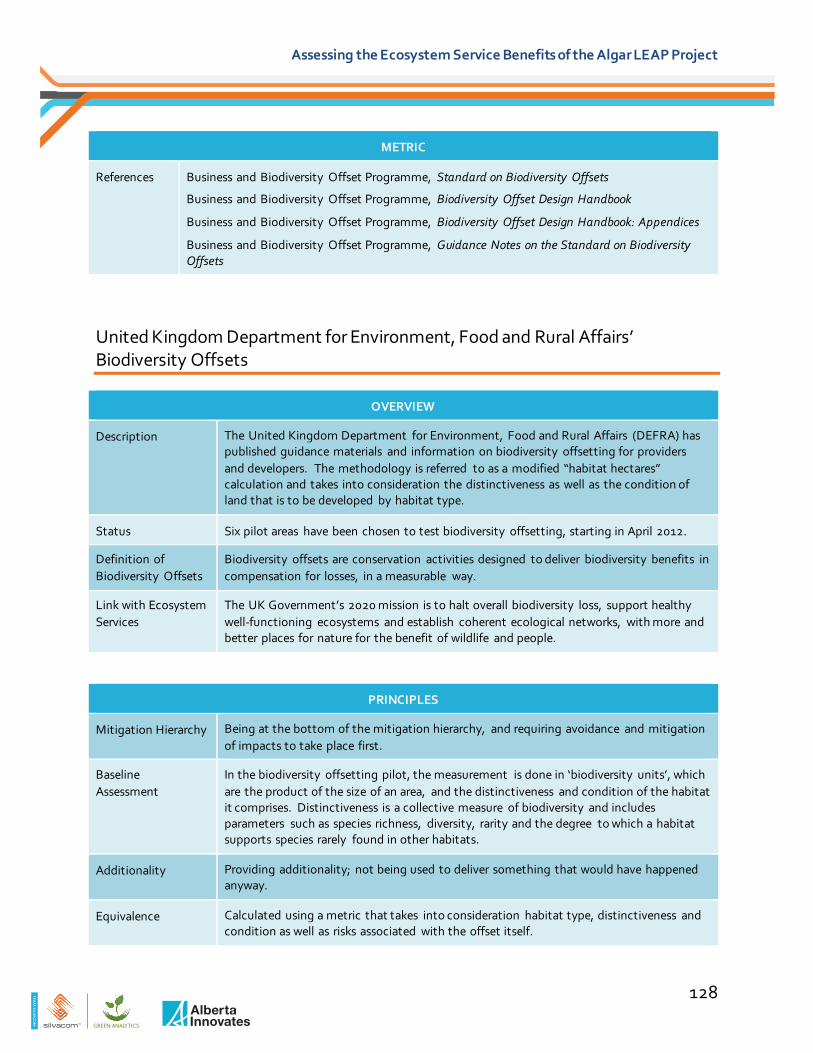
TE
AM
SIL
VA
CO
M
Assessing the Ecosystem Service Benefits of the Algar LEAP Project
METRIC
References Business and Biodiversity Offset Programme, Standard on Biodiversity Offsets
Business and Biodiversity Offset Programme, Biodiversity Offset Design Handbook
Business and Biodiversity Offset Programme, Biodiversity Offset Design Handbook: Appendices
Business and Biodiversity Offset Programme, Guidance Notes on the Standard on Biodiversity Offsets
United Kingdom Department for Environment, Food and Rural Affairs’ Biodiversity Offsets
OVERVIEW
Description The United Kingdom Department for Environment, Food and Rural Affairs (DEFRA) has published guidance materials and information on biodiversity offsetting for providers and developers. The methodology is referred to as a modified “habitat hectares” calculation and takes into consideration the distinctiveness as well as the condition of land that is to be developed by habitat type.
Status Six pilot areas have been chosen to test biodiversity offsetting, starting in April 2012.
Definition of Biodiversity Offsets
Biodiversity offsets are conservation activities designed to deliver biodiversity benefits in compensation for losses, in a measurable way.
Link with Ecosystem Services
The UK Government’s 2020 mission is to halt overall biodiversity loss, support healthy well-functioning ecosystems and establish coherent ecological networks, with more and better places for nature for the benefit of wildlife and people.
PRINCIPLES
Mitigation Hierarchy Being at the bottom of the mitigation hierarchy, and requiring avoidance and mitigation of impacts to take place first.
Baseline Assessment
In the biodiversity offsetting pilot, the measurement is done in ‘biodiversity units’, which are the product of the size of an area, and the distinctiveness and condition of the habitat it comprises. Distinctiveness is a collective measure of biodiversity and includes parameters such as species richness, diversity, rarity and the degree to which a habitat supports species rarely found in other habitats.
Additionality Providing additionality; not being used to deliver something that would have happened anyway.
Equivalence Calculated using a metric that takes into consideration habitat type, distinctiveness and condition as well as risks associated with the offset itself.
128

TE
AM
SIL
VA
CO
M
Assessing the Ecosystem Service Benefits of the Algar LEAP Project
PRINCIPLES
Permanence Offsets need to last at least as long as the development project’s impacts, and preferably in perpetuity.
Geographic Location
Be managed at the local level as far as possible.
Limits No information found.
No Net Loss No information found.
Stakeholder Participation
Need to involve local communities and be transparent, giving clarity on how the offset calculations are derived and allowing people to see how offset resources are being used.
STEPS
Apply the Mitigation Hierarchy
To determine whether offsets are justified, the mitigation hierarchy should first be applied. If a developer is able to avoid biodiversity loss or is able to take sufficient mitigation actions on site, then compensation for residual biodiversity loss may not be required. If compensation is justified, biodiversity offsetting may be pursued.
Identify Habitat Types
Assuming offsetting is justified; the development site should be mapped and divided into habitat parcels. Parcels are assigned one of three habitat type bands on the basis of distinctiveness. Distinctiveness is a collective measure of biodiversity and includes parameters such as species richness, diversity, rarity and the degree to which a habitat supports species rarely found in other habitats.
Assess the Baseline Condition
The methodologies for assessing the condition of various habitats as are described in the document “Higher Level Stewardship: Farm Environment Plan Manual”112 should be used to assign a condition score to each habitat parcel. The process for assessing the condition of a habitat varies by habitat type.
Calculate Biodiversity Units
The condition weighting is then combined with the distinctiveness band to determine an overall score expressed in biodiversity units per hectare for each of the habitats impacted by development.
Determine Offset Requirements
Particular offsetting requirements will be determined by the distinctiveness band of the impacted land. High distinctiveness will generally need to be “like for like”, medium distinctiveness can usually be replaced by the same distinctiveness band, while low distinctiveness offsets should involve a “trade up” in distinctiveness.
Undertake Offsets Offsets can be undertaken by developers themselves or be purchased or commissioned by the developers.
112 http://publications.naturalengland.org.uk/publication/32037
129

TE
AM
SIL
VA
CO
M
Assessing the Ecosystem Service Benefits of the Algar LEAP Project
METRIC
Identify and Quantify Habitat Types
Map the area to be impacted and identify and quantify the different habitat types within the project area. For each habitat type, assign a habitat distinctiveness rating. Appendix 1 of the report titled “Biodiversity Offsetting Pilots: Guidance for Developers” published by DEFRA provides a detailed list of distinctiveness ratings by habitat type. Assign ratings as per the table below.
Habitat Distinctiveness Distinctiveness Rating
High 6
Medium 4 Low 2
Assess Baseline Conditions
The condition of each habitat type is then assessed based on the Farm Environment Plan, which contains detailed directions on how to assess the full range of habitat types. The resulting habitat condition is then assigned a habitat condition weighting based on the table below.
Habitat Condition Condition Weighting
Good 3
Moderate 2 Poor 1
Calculate Biodiversity Units
For each habitat type, combine the condition weighting with the distinctiveness weighting to establish an overall score expressed in biodiversity units per hectare.
Distinctiveness
Condition Low (2) Medium (4) High (6)
Good (3) 6 12 18 Moderate (2) 4 8 12
Poor (1) 2 4 6
Offset Requirements
The offset requirements will be determined by the biodiversity units as well as the distinctiveness of the lost habitat as per the table below. High distinctiveness habitat can only be offset with high distinctiveness habitat usually of the same type, while medium and low distinctiveness habitat can be offset with either medium or high distinctiveness habitat.
Distinctiveness of Lost Habitat Distinctiveness of Habitat Provided by an Offset High High – and usually the same habitat type
Medium Medium or high
Low Medium or high
130

TE
AM
SIL
VA
CO
M
Assessing the Ecosystem Service Benefits of the Algar LEAP Project
METRIC
Account for Risk Factors
To take into consideration the risk associated with undertaking offset projects, risk multipliers can be applied to the offset area. The table below presents risk multipliers related to the successful delivery of the offset project. Appendix 1 of the Biodiversity Offsetting Pilots Technical Paper: the metric for biodiversity offsetting pilot in England assigns difficulty ratings to the various habitat types. Given the habitat types needed as part of the offset project, a difficulty risk (as per table below) can be assigned and the resulting area comprising the offset adjusted accordingly.
Difficulty of re-creation/restoration Multiplier
Very high 10 High 3
Medium 1.5
Low 1
The location of the offset can also pose a risk factor on an offset project. Locating offsets strategically will greatly reduce the risk of an offset being delivered in a spatially less favorable location than the impacted site. Multipliers (table below) can be applied to offset projects to compensate for offsets that take place in locations that have a higher chance of failing to deliver on biodiversity objectives.
Location Parameters Multiplier
Offset is in a location identified in the offsetting strategy
No multiplier required
Offset is buffering, linking, restoring or expanding a habitat outside an area identified in the offsetting
strategy
2
Offset is not making a contribution to the offsetting strategy
3
There is also a risk element associated with time as lands may be developed in advance of offset projects being completed. Assuming a 3.5% discount rate, the table below presents multipliers associated with different time periods.
Years to Target Condition Multiplier
5 1.2
10 1.4 15 1.7
20 2.0
25 2.4
30 2.8 32 3
131
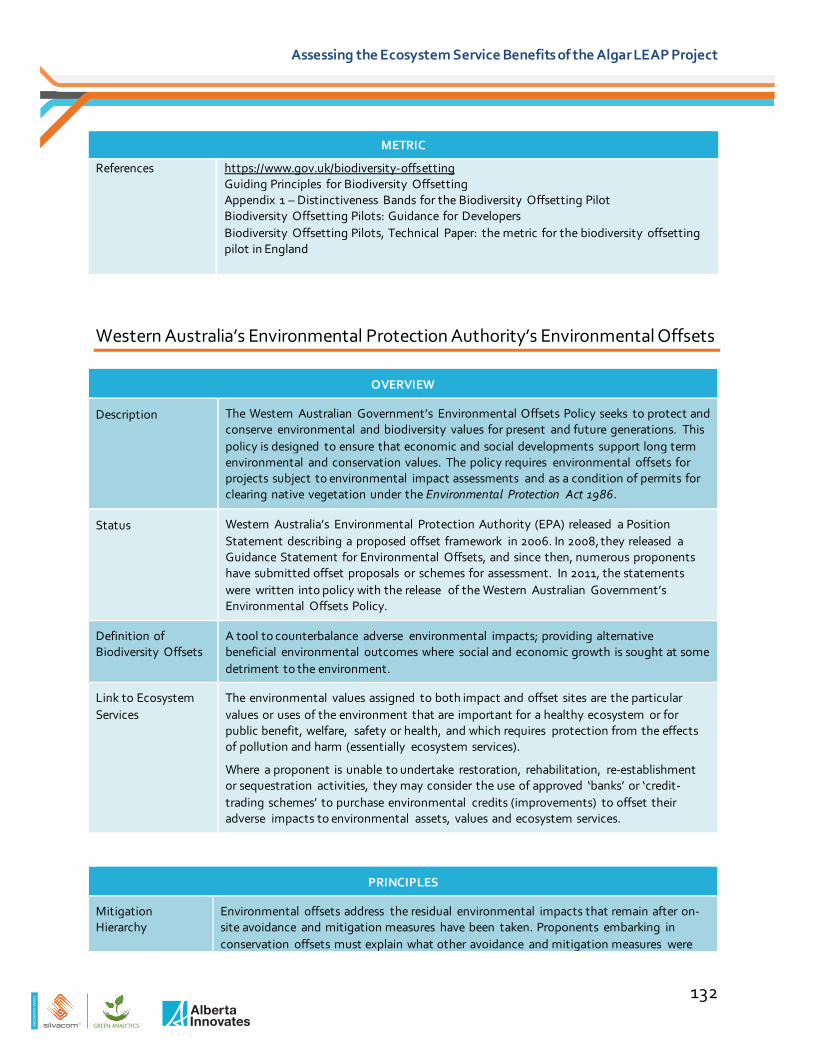
TE
AM
SIL
VA
CO
M
Assessing the Ecosystem Service Benefits of the Algar LEAP Project
METRIC
References https://www.gov.uk/biodiversity-offsetting Guiding Principles for Biodiversity Offsetting Appendix 1 – Distinctiveness Bands for the Biodiversity Offsetting Pilot Biodiversity Offsetting Pilots: Guidance for Developers Biodiversity Offsetting Pilots, Technical Paper: the metric for the biodiversity offsetting pilot in England
Western Australia’s Environmental Protection Authority’s Environmental Offsets
OVERVIEW
Description The Western Australian Government’s Environmental Offsets Policy seeks to protect and conserve environmental and biodiversity values for present and future generations. This policy is designed to ensure that economic and social developments support long term environmental and conservation values. The policy requires environmental offsets for projects subject to environmental impact assessments and as a condition of permits for clearing native vegetation under the Environmental Protection Act 1986.
Status Western Australia’s Environmental Protection Authority (EPA) released a Position Statement describing a proposed offset framework in 2006. In 2008, they released a Guidance Statement for Environmental Offsets, and since then, numerous proponents have submitted offset proposals or schemes for assessment. In 2011, the statements were written into policy with the release of the Western Australian Government’s Environmental Offsets Policy.
Definition of Biodiversity Offsets
A tool to counterbalance adverse environmental impacts; providing alternative beneficial environmental outcomes where social and economic growth is sought at some detriment to the environment.
Link to Ecosystem Services
The environmental values assigned to both impact and offset sites are the particular values or uses of the environment that are important for a healthy ecosystem or for public benefit, welfare, safety or health, and which requires protection from the effects of pollution and harm (essentially ecosystem services).
Where a proponent is unable to undertake restoration, rehabilitation, re-establishment or sequestration activities, they may consider the use of approved ‘banks’ or ‘credit-trading schemes’ to purchase environmental credits (improvements) to offset their adverse impacts to environmental assets, values and ecosystem services.
PRINCIPLES
Mitigation Hierarchy
Environmental offsets address the residual environmental impacts that remain after on-site avoidance and mitigation measures have been taken. Proponents embarking in conservation offsets must explain what other avoidance and mitigation measures were
132
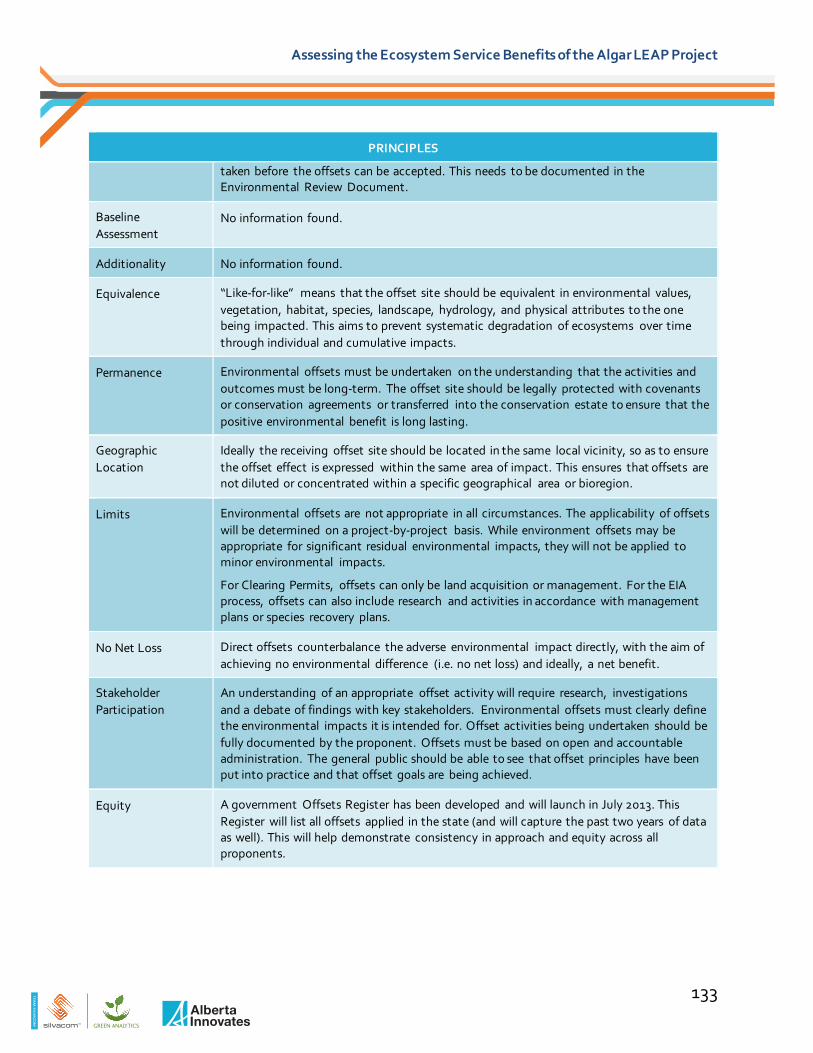
TE
AM
SIL
VA
CO
M
Assessing the Ecosystem Service Benefits of the Algar LEAP Project
PRINCIPLES
taken before the offsets can be accepted. This needs to be documented in the Environmental Review Document.
Baseline Assessment
No information found.
Additionality No information found.
Equivalence “Like-for-like” means that the offset site should be equivalent in environmental values, vegetation, habitat, species, landscape, hydrology, and physical attributes to the one being impacted. This aims to prevent systematic degradation of ecosystems over time through individual and cumulative impacts.
Permanence Environmental offsets must be undertaken on the understanding that the activities and outcomes must be long-term. The offset site should be legally protected with covenants or conservation agreements or transferred into the conservation estate to ensure that the positive environmental benefit is long lasting.
Geographic Location
Ideally the receiving offset site should be located in the same local vicinity, so as to ensure the offset effect is expressed within the same area of impact. This ensures that offsets are not diluted or concentrated within a specific geographical area or bioregion.
Limits Environmental offsets are not appropriate in all circumstances. The applicability of offsets will be determined on a project-by-project basis. While environment offsets may be appropriate for significant residual environmental impacts, they will not be applied to minor environmental impacts.
For Clearing Permits, offsets can only be land acquisition or management. For the EIA process, offsets can also include research and activities in accordance with management plans or species recovery plans.
No Net Loss Direct offsets counterbalance the adverse environmental impact directly, with the aim of achieving no environmental difference (i.e. no net loss) and ideally, a net benefit.
Stakeholder Participation
An understanding of an appropriate offset activity will require research, investigations and a debate of findings with key stakeholders. Environmental offsets must clearly define the environmental impacts it is intended for. Offset activities being undertaken should be fully documented by the proponent. Offsets must be based on open and accountable administration. The general public should be able to see that offset principles have been put into practice and that offset goals are being achieved.
Equity A government Offsets Register has been developed and will launch in July 2013. This Register will list all offsets applied in the state (and will capture the past two years of data as well). This will help demonstrate consistency in approach and equity across all proponents.
133

TE
AM
SIL
VA
CO
M
Assessing the Ecosystem Service Benefits of the Algar LEAP Project
STEPS 113
Type of Environmental Assets
Determine whether the project disturbs critical or high value environment, and describe the associated environmental values and assets. Assets might include:
• Nature reserve (considered a critical asset)
• Threatened Ecological Community (TEC) (considered a critical asset)
• Buffer to a lake (considered a high value asset)
A project proposal must include the environmental attributes of the land to be disturbed: the area of impacted land (ha) and the biodiversity of the area (number and type of trees, number and type of plant and animal species, etc.). Then, a public consultation process will identify the environmental values relating to environmental health, structure, composition, function and beneficial uses. This might include, for example:
• Provision of food, habitat and shelter for native biota and threatened species
• Maintenance of interactions between species
• Cycling, filtering and retention of nutrients
• Maintenance of geological and geochemical processes
• Public amenity
• Cultural and spiritual uses
Significant Impacts Determine the significant adverse environmental impacts related to the proposal or scheme before mitigation measures are applied.
The type, duration of, and area of land disturbed by the proposed project must all be documented. In addition, the impacts to the environment as a result of the project must be described. Impacts might include, for example:
1. Clearing of regionally significant vegetation in a Nature Reserve
2. Disturbance of bushland buffer around a TEC
3. Construction within a lake buffer
4. Impacts to the water regime of a lake associated with stormwater runoff from road
5. Risk of contamination of a lake and the associated buffer from spills
Mitigation Measures
Determine all measures to avoid, minimize, rectify and reduce impacts.
Proposed on-site management measures for the Nature Reserve (Impact 1 above):
• Design to ensure encroachment of road formation on native vegetation in Nature Reserve is minimized.
• Management activities and performance criteria for rehabilitation of Nature Reserve inside proposed road reserve.
• Fencing and access plan.
113 These steps outline the information needed for developing an offset package for a range of residual impacts. The impacts and offsets mentioned here are hypothetical and should not be considered fixed for every proposal.
134
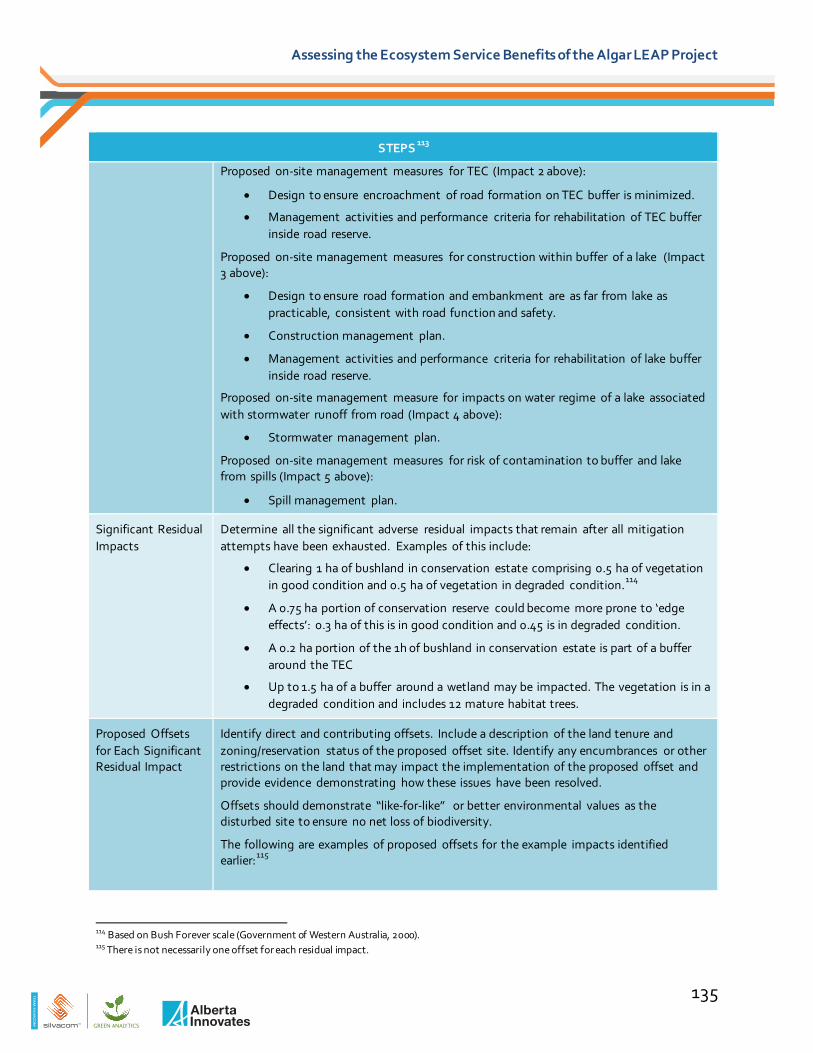
TE
AM
SIL
VA
CO
M
Assessing the Ecosystem Service Benefits of the Algar LEAP Project
STEPS 113
Proposed on-site management measures for TEC (Impact 2 above):
• Design to ensure encroachment of road formation on TEC buffer is minimized.
• Management activities and performance criteria for rehabilitation of TEC buffer inside road reserve.
Proposed on-site management measures for construction within buffer of a lake (Impact 3 above):
• Design to ensure road formation and embankment are as far from lake as practicable, consistent with road function and safety.
• Construction management plan.
• Management activities and performance criteria for rehabilitation of lake buffer inside road reserve.
Proposed on-site management measure for impacts on water regime of a lake associated with stormwater runoff from road (Impact 4 above):
• Stormwater management plan.
Proposed on-site management measures for risk of contamination to buffer and lake from spills (Impact 5 above):
• Spill management plan.
Significant Residual Impacts
Determine all the significant adverse residual impacts that remain after all mitigation attempts have been exhausted. Examples of this include:
• Clearing 1 ha of bushland in conservation estate comprising 0.5 ha of vegetation in good condition and 0.5 ha of vegetation in degraded condition.114
• A 0.75 ha portion of conservation reserve could become more prone to ‘edge effects’: 0.3 ha of this is in good condition and 0.45 is in degraded condition.
• A 0.2 ha portion of the 1h of bushland in conservation estate is part of a buffer around the TEC
• Up to 1.5 ha of a buffer around a wetland may be impacted. The vegetation is in a degraded condition and includes 12 mature habitat trees.
Proposed Offsets for Each Significant Residual Impact
Identify direct and contributing offsets. Include a description of the land tenure and zoning/reservation status of the proposed offset site. Identify any encumbrances or other restrictions on the land that may impact the implementation of the proposed offset and provide evidence demonstrating how these issues have been resolved.
Offsets should demonstrate “like-for-like” or better environmental values as the disturbed site to ensure no net loss of biodiversity.
The following are examples of proposed offsets for the example impacts identified earlier:115
114 Based on Bush Forever scale (Government of Western Australia, 2000). 115 There is not necessarily one offset for each residual impact.
135

TE
AM
SIL
VA
CO
M
Assessing the Ecosystem Service Benefits of the Algar LEAP Project
STEPS 113
Offset 1: Direct
Acquisition of 4 ha of land to be dedicated as a nature reserve with funding to enable its protection and rehabilitation to a state that requires minimum active management over time.
Offset 2: Direct
Rehabilitation of 0.3 ha in TEC buffer in nature reserve.
Offset 3: Direct
Rehabilitation of 2 ha of lake buffer.
Offset 4: Contributing
Contribute to implementation of Wetland Management Plan for impacted lake.
Offset 5: Contributing
Contribute to community education program promoting protection of local biodiversity for the impacted Nature Reserve (TEC) and lake.
Spatial Data Requirements
Provide proposed offset boundaries as spatial data. The EPA considers offset sites in the context of spatial data and uses this to:
• Find what environmental assets and issues are on or near the proposed offset
• Serve as an administrative record
• Communicate where the EPA has made decisions to others and their processes
• Support transparency and to audit the effectiveness of the process
METRIC
There are no standard metrics for calculating impacts and determining offsets. Offsets are awarded on a case-by-case basis.
A standard approach to proposals in the Pilbara area is currently being applied. This is a metric involving the contribution to a strategic fund based on the number of hectares of vegetation cleared and whether the clearing involves any areas of higher environmental value (e.g. a Threatened Ecological Community). An example can be found here: http://edit.epa.wa.gov.au/EPADocLib/R ep%201457 %20Nammuldi-Silvergrass%20PER %20211112.pdf (see section 3.4 and condition 11).
References Environmental Protection Authority of Western Australia. January 2006. Position Statement No. 9: Environmental Offsets. Accessed online from http://www.epa.wa.gov.au/docs/1863_PS9.pdf
The Government of Western Australia. September 2011. WA Environmental Offsets Policy. Accessed online from http://www.epa.wa.gov.au/EPADocLib/ WAEnvOffsetsPolicy-270911.pdf
Environmental Protection Authority of Western Australia. September 2008. Guidance for the Assessment of Environmental Factors, No. 19: Environmental Offsets – Biodiversity. Accessed online from http://www.epa.wa.gov.au/docs/2783_GS19OffsetsBiodiv18808.pdf
136
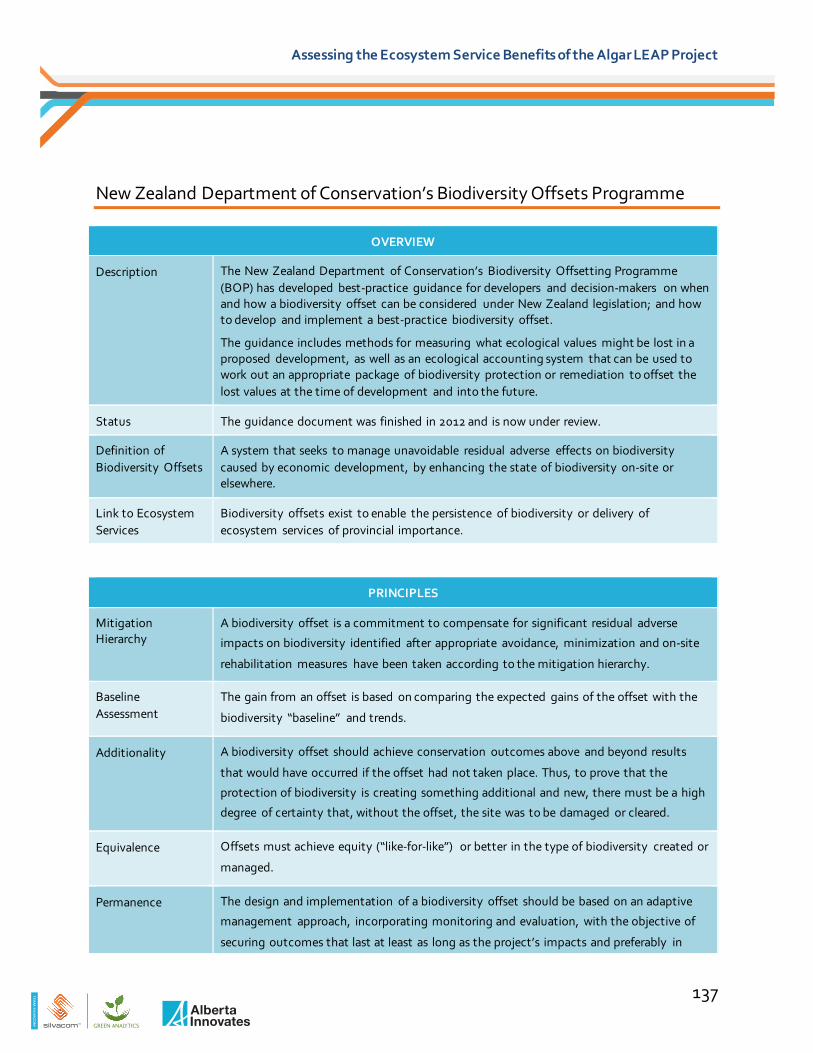
TE
AM
SIL
VA
CO
M
Assessing the Ecosystem Service Benefits of the Algar LEAP Project
New Zealand Department of Conservation’s Biodiversity Offsets Programme
OVERVIEW
Description The New Zealand Department of Conservation’s Biodiversity Offsetting Programme (BOP) has developed best-practice guidance for developers and decision-makers on when and how a biodiversity offset can be considered under New Zealand legislation; and how to develop and implement a best-practice biodiversity offset.
The guidance includes methods for measuring what ecological values might be lost in a proposed development, as well as an ecological accounting system that can be used to work out an appropriate package of biodiversity protection or remediation to offset the lost values at the time of development and into the future.
Status The guidance document was finished in 2012 and is now under review.
Definition of Biodiversity Offsets
A system that seeks to manage unavoidable residual adverse effects on biodiversity caused by economic development, by enhancing the state of biodiversity on-site or elsewhere.
Link to Ecosystem Services
Biodiversity offsets exist to enable the persistence of biodiversity or delivery of ecosystem services of provincial importance.
PRINCIPLES
Mitigation Hierarchy
A biodiversity offset is a commitment to compensate for significant residual adverse
impacts on biodiversity identified after appropriate avoidance, minimization and on-site
rehabilitation measures have been taken according to the mitigation hierarchy.
Baseline Assessment
The gain from an offset is based on comparing the expected gains of the offset with the
biodiversity “baseline” and trends.
Additionality A biodiversity offset should achieve conservation outcomes above and beyond results
that would have occurred if the offset had not taken place. Thus, to prove that the
protection of biodiversity is creating something additional and new, there must be a high
degree of certainty that, without the offset, the site was to be damaged or cleared.
Equivalence Offsets must achieve equity (“like-for-like”) or better in the type of biodiversity created or
managed.
Permanence The design and implementation of a biodiversity offset should be based on an adaptive
management approach, incorporating monitoring and evaluation, with the objective of
securing outcomes that last at least as long as the project’s impacts and preferably in
137

TE
AM
SIL
VA
CO
M
Assessing the Ecosystem Service Benefits of the Algar LEAP Project
PRINCIPLES
perpetuity.
Geographic Location
The offset mitigation should be applied as close as possible to the site where the adverse
effects occur. An offset site is appropriate if it is capable of providing a gain in biodiversity
that is at least equivalent to the loss.
Limits There are situations where residual impacts cannot be fully compensated for by a
biodiversity offset because of the irreplaceability or vulnerability of the biodiversity
affected.
No Net Loss A biodiversity offset should be designed and implemented to achieve in situ, measurable
conservation outcomes that can reasonably be expected to result in no net loss and
preferably a net gain of biodiversity.
Stakeholder Participation
In areas affected by the project and by the biodiversity offset, the effective participation
of stakeholders should be ensured in decision-making about biodiversity offsets,
including their evaluation, selection, design, implementation and monitoring. The design
and implementation of a biodiversity offset and communication of its results to the public
should be undertaken in a transparent and timely manner.
STEPS
Rank Biodiversity Values using a Threshold System
Vulnerability and irreplaceability are used to develop a conceptual global biodiversity
offset thresholds framework for assessing the risk of undertaking like-for-like biodiversity
offsets (i.e. the varying biodiversity risk, feasibility or appropriateness of different
offsets). The framework involves first ranking biodiversity values in a thresholded system
and then identifying key issues relating to significant residual impacts, offset availability
and offset feasibility.
Irreplaceability: Biodiversity features with higher irreplaceability are those which have
fewer options for conservation (or, indeed, offsetting) in space or time (e.g. ecosystems
which occur only on a very specific geology with a limited distribution, or birds which
depend heavily on one or two wetlands during the course of migration).
Vulnerability: Biodiversity features with higher vulnerability are those which are at risk of
– or currently facing – threats which may cause their loss (e.g. species threatened with
extinction).
The table below combines the vulnerability of the biodiversity features with the
irreplaceability of the management unit to obtain a biodiversity value for each relevant
feature.
138

TE
AM
SIL
VA
CO
M
Assessing the Ecosystem Service Benefits of the Algar LEAP Project
STEPS
Irreplaceability of management unit
Vulnerability of biodiversity feature
Critically Endangered Endangered Vulnerable
Near Threatened/ Least Concern
Data Deficient/
Not Evaluated
Sustaining ≥ 95% of global range/ population
Extremely High Risk
Extremely High Risk
Very High Risk
High Risk
Assign to a threat level or apply pre-cautionary principle116
Sustaining ≥ 10% of global range/ population
Extremely High Risk
Very High Risk
High Risk
Medium Risk
Sustaining ≥ 1% of global range/ population
Very High Risk
High Risk
Medium Risk
Low Risk
Sustaining ≥ 0.1% of global range/ population
High Risk
Medium Risk
Low Risk
Low Risk
Sustaining < 0.1% of global range/ population
Medium Risk
Low Risk
Low Risk
Low Risk
The highest irreplaceability level (≥ 95%) includes sites at which particular biodiversity features are so concentrated that even low impact development may pose serious threats through offset failure or insufficient impact management.117
Thresholds for the highest (≥ 95%) irreplaceability level are based on those for Alliance for Zero Extinction sites118 (which are also ≥ 95%), just as those for the third irreplaceability level (≥ 1%) have a strong basis in Key Biodiversity Area119 (KBA) thresholds (which are also ≥ 1% for globally significant congregations and source populations).
Offsets for lower risk levels can be progressively viewed as more feasible or more appropriate and thus a lower burden of proof applies to a developer proposing an offset of such areas. Higher standards of proof are likely to be required by regulators from developers for higher risk levels – e.g. developers may be required to prove 'beyond reasonable doubt' that high-risk offsets can be successful.
116 Where any species/ecosystems have not been assessed using guidelines based on the IUCN Red List, the onus should be on developers to ensure screening using RAMAS Rapid List (www.ramas.com/RapidList.htm), and to ensure full assessment of species where such a process suggests they may be threatened. Where there are simply insufficient data to assign a particular threat category, the precautionary principle should be used to assign the highest likely categorisation. 117 For example, construction of a radio mast at such a site may have little predicted direct impact on a globally-threatened plant or its habitat,
but a cigarette discarded by a construction worker could start a fire which causes the species' extinction. 118 Alliance for Zero Extinction sites are sites that are identified and safeguarded where species are evaluated to be Endangered or Critically
Endangered under IUCN-World Conservation Union criteria. 119 Key Biodiversity Areas are various site-scale thresholds for biodiversity conservation priorities collated into a single system. They are now
widely accepted globally, with increasing incorporation into national legislation and funding priorities. The threshold system presented here has KBA principles and thresholds at its core.
139
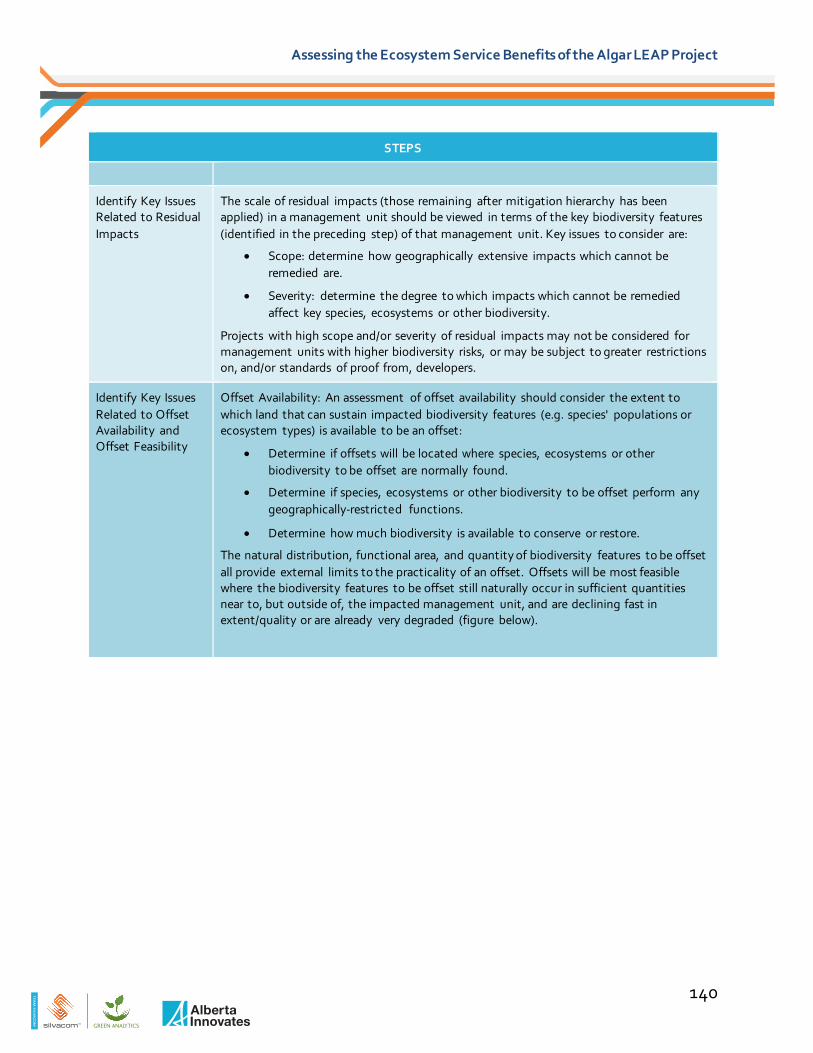
TE
AM
SIL
VA
CO
M
Assessing the Ecosystem Service Benefits of the Algar LEAP Project
STEPS
Identify Key Issues Related to Residual Impacts
The scale of residual impacts (those remaining after mitigation hierarchy has been applied) in a management unit should be viewed in terms of the key biodiversity features (identified in the preceding step) of that management unit. Key issues to consider are:
• Scope: determine how geographically extensive impacts which cannot be remedied are.
• Severity: determine the degree to which impacts which cannot be remedied affect key species, ecosystems or other biodiversity.
Projects with high scope and/or severity of residual impacts may not be considered for management units with higher biodiversity risks, or may be subject to greater restrictions on, and/or standards of proof from, developers.
Identify Key Issues Related to Offset Availability and Offset Feasibility
Offset Availability: An assessment of offset availability should consider the extent to which land that can sustain impacted biodiversity features (e.g. species' populations or ecosystem types) is available to be an offset:
• Determine if offsets will be located where species, ecosystems or other biodiversity to be offset are normally found.
• Determine if species, ecosystems or other biodiversity to be offset perform any geographically-restricted functions.
• Determine how much biodiversity is available to conserve or restore.
The natural distribution, functional area, and quantity of biodiversity features to be offset all provide external limits to the practicality of an offset. Offsets will be most feasible where the biodiversity features to be offset still naturally occur in sufficient quantities near to, but outside of, the impacted management unit, and are declining fast in extent/quality or are already very degraded (figure below).
140

TE
AM
SIL
VA
CO
M
Assessing the Ecosystem Service Benefits of the Algar LEAP Project
STEPS
Figure 3. The conceptual relationship between vulnerability, irreplaceability, risk and opportunity. Risk Increases when biodiversity is more irreplaceable and/or vulnerable; opportunity is greatest when biodiversity is highly vulnerable but of limited irreplaceability (few options for offsetting exist where biodiversity has been little depleted and is well protected); thus offsets will generally be most feasible and relevant for biodiversity features of low irreplaceability and moderate vulnerability.120
Offset Feasibility: Assessment of the practical feasibility of offsets should include temporal, technical, capacity and financial considerations:
• Determine if offsets can be implemented within meaningful timeframes.
• Determine the likelihood of offset success.
• Determine if offset implementers are likely to do a good job.
• Determine if developers are likely to do a good job.
• Determine if sufficient funding is secured for the offset duration.
Combine Biodiversity Values and Key Issues in a Burden of Proof
A burden of proof framework (Appendix B) is used to combine the analysis of the biodiversity values (step 1 above) at the management site and key issues related to impacts, offset availability and offset feasibility (step 3 above). When impacts have insignificant effects on biodiversity values that are rapidly expanding, resilient, and secure, offsets may not be necessary. This is because low risk management units could be
120 Adapted from New Zealand Department of Conservation. May 2011. Biodiversity offsets: appropriate limits and thresholds. Accessed at http://www.doc.govt.nz/Documents/conservation/biodiversity-offsets-limits-thresholds.pdf.
141

TE
AM
SIL
VA
CO
M
Assessing the Ecosystem Service Benefits of the Algar LEAP Project
STEPS
Framework viewed as the lower threshold for offsetting, at which offsets may not be required, if cumulative loss is not an issue. Offsets may best be avoided for most management units with extremely high risk biodiversity values or, more practically, where key (perhaps non-biological) issues mean that offsets have a low likelihood of success (a 'higher threshold to offsetability'). In other cases, offsets may be undertaken at management units with higher risk biodiversity values with higher standards of proof and/or where key issues make offsets easier (e.g. where impacts are low, offset availability is high, and offset feasibility is high).
METRIC – Habitat Hectares 121
The DOC has not specified specific metrics that should be used to calculate impacts and determine offsets. Proposed offsets are assessed and undertaken on a case-by-case basis.
However, the BOP makes reference to the international Business and Biodiversity Offsets Programme (BBOP) offsets framework, presented earlier in this report, on which many of the aspects of the DOC framework are based. The BBOP metrics for quantifying biodiversity loss and gain are identified below.
Benchmark Assessment
Benchmark conditions can be defined by habitat or by species. Regardless, the general process is the same:
• Identify a benchmark site – an undisturbed, pristine, thriving or virtual (data-based) benchmark habitat or species population.
• Select benchmark attributes122 (area, carrying capacity, habitat suitability, level of disturbance – for habitat; population size, viability – for species) by habitat type. This is usually done for 10 to 20 attributes at the benchmark site.
• Weight benchmark attributes according to the relative significance of each attribute to the overall health of the habitat type to establish a reference level for each attribute at the benchmark site. The sum of the weighted attributes should equal 100%.
The following table can be used to record the attributes selected for the benchmark, recording the score found at the benchmark site, defining the weight of each attribute (to sum to 100%) and deciding whether one or more of the attributes are non-tradable.123
121 In some cases, it may be appropriate to demonstrate ‘NO NET LOSS’ for a particularly significant species. This may be especially relevant where residual negative impacts are predicted for species of global conservation concern and / or concern to local stakeholders may be adversely affected. Where impacts on such species are not linked directly with the structure and composition of habitat (e.g. intensified hunting pressure, increased disturbance or interruption to migration or dispersal, increased mortality due to road kill, decreased reproductive success due to disturbance to breeding animals, or reduced population viability due to barriers to dispersal of sub-populations), then metrics based on habitat proxies may not be particularly informative. In these cases, it is preferable to use metrics specifically tailored to the species concerned (See page 55 of Appendix C to the Biodiversity Offset Design Handbook for details on how to apply the BBOP species specific methodology).
122 Benchmark attributes are chosen to reflect the composition, structure and function of each ecosystem or habitat present in the area affected by the development project and its overall ‘health’ or condition.
123 Non-tradable means that a specific score of each non-tradable attribute is needed at the offset site, in addition to an overall score of all attributes taken together.
142

TE
AM
SIL
VA
CO
M
Assessing the Ecosystem Service Benefits of the Algar LEAP Project
METRIC – Habitat Hectares 121
Habitat Type: Forest (Total hectares affected = 10 (A))
Attribute Reference Level at Benchmark Site
Weight (C) Tradable or Non-tradable
Attribute
Rationale, Methods
# (B) Units or Bands
Stream veg. density
10 Plants/ha 0.4 Tradable
Canopy cover 100% % 0.3 Tradable
Fallen log density
2 Logs/ha 0.3 Tradable
Total 1.0
Quantify Residual Loss Caused by the Project
Loss calculations can be based on habitat (type, area occupied, and quality) or species’ populations (viability and persistence). Regardless, the general process is the same:
• Quantify the pre-project condition of the attributes at the project site.
• Predict the post-project condition for the attributes at the project site.
• Calculate the losses caused by the proposed project (post-project minus pre-project) relative to the benchmark.
Attribute Pre-project Condition
(D)
Post-project condition (E)
Pre-project habitat
hectares, per hectare
(F=(D/B)*C))
Post-project habitat
hectares, per hectare
(G=(E/B)*C)
Net loss of habitat
hectares, per
hectare (H=F-G)
Habitat hectares
lost (H*A)
Stream veg. density
5 2 0.2 0.08 0.12 1.2
Canopy cover
80% 40% 0.24 0.12 0.12 1.2
Fallen log density
1 0 0.15 0 0.15 1.5
Total hectares Lost 2.7
Quantify Potential Gain from the Offset
Gain calculations can be based on habitat (type, area occupied, and quality) or species’ populations (viability and persistence). Regardless, the general process is the same:
143
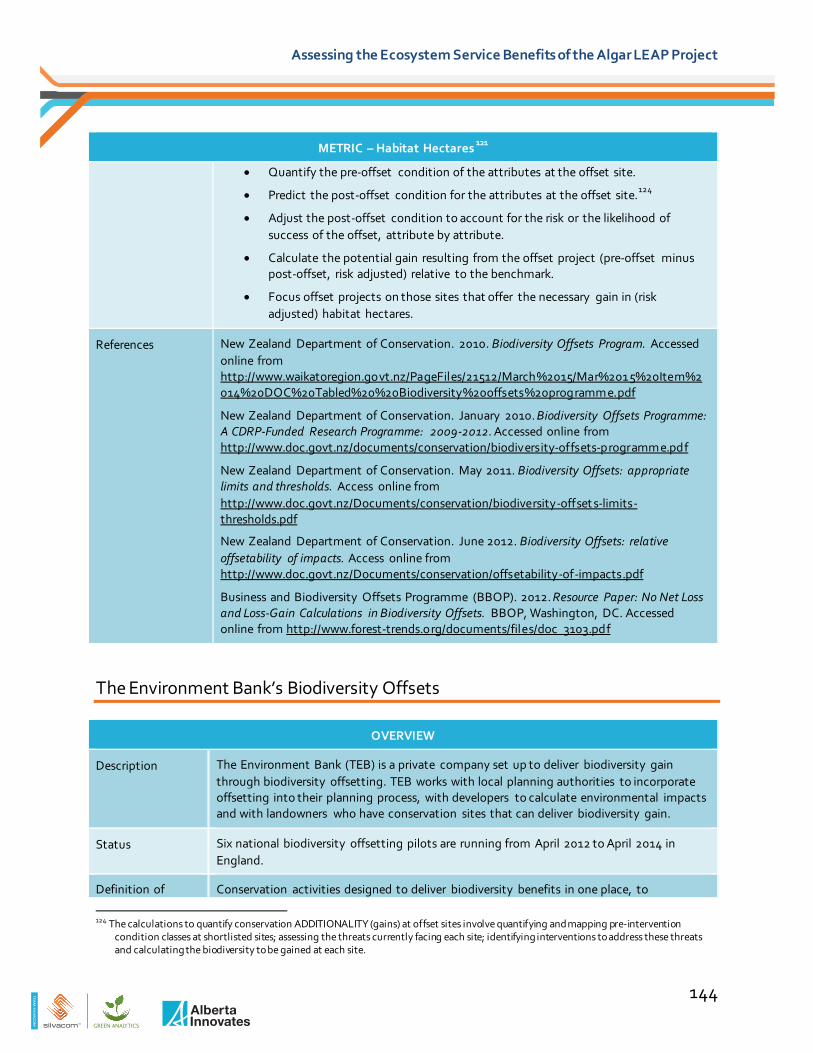
TE
AM
SIL
VA
CO
M
Assessing the Ecosystem Service Benefits of the Algar LEAP Project
METRIC – Habitat Hectares 121
• Quantify the pre-offset condition of the attributes at the offset site.
• Predict the post-offset condition for the attributes at the offset site.124
• Adjust the post-offset condition to account for the risk or the likelihood of success of the offset, attribute by attribute.
• Calculate the potential gain resulting from the offset project (pre-offset minus post-offset, risk adjusted) relative to the benchmark.
• Focus offset projects on those sites that offer the necessary gain in (risk adjusted) habitat hectares.
References New Zealand Department of Conservation. 2010. Biodiversity Offsets Program. Accessed online from http://www.waikatoregion.govt.nz/PageFiles/21512/March%2015/Mar%2015%20Item%2014%20DOC%20Tabled%20%20Biodiversity%20offsets%20programme.pdf
New Zealand Department of Conservation. January 2010. Biodiversity Offsets Programme: A CDRP-Funded Research Programme: 2009-2012. Accessed online from http://www.doc.govt.nz/documents/conservation/biodiversity-offsets-programme.pdf
New Zealand Department of Conservation. May 2011. Biodiversity Offsets: appropriate limits and thresholds. Access online from http://www.doc.govt.nz/Documents/conservation/biodiversity-offset s-limits-thresholds.pdf
New Zealand Department of Conservation. June 2012. Biodiversity Offsets: relative offsetability of impacts. Access online from http://www.doc.govt.nz/Documents/conservation/offsetability-of-impacts.pdf
Business and Biodiversity Offsets Programme (BBOP). 2012. Resource Paper: No Net Loss and Loss-Gain Calculations in Biodiversity Offsets. BBOP, Washington, DC. Accessed online from http://www.forest-trends.org/documents/files/doc_3103.pdf
The Environment Bank’s Biodiversity Offsets
124 The calculations to quantify conservation ADDITIONALITY (gains) at offset sites involve quantifying and mapping pre-intervention condition classes at shortlisted sites; assessing the threats currently facing each site; identifying interventions to address these threats and calculating the biodiversity to be gained at each site.
OVERVIEW
Description The Environment Bank (TEB) is a private company set up to deliver biodiversity gain through biodiversity offsetting. TEB works with local planning authorities to incorporate offsetting into their planning process, with developers to calculate environmental impacts and with landowners who have conservation sites that can deliver biodiversity gain.
Status Six national biodiversity offsetting pilots are running from April 2012 to April 2014 in England.
Definition of Conservation activities designed to deliver biodiversity benefits in one place, to
144
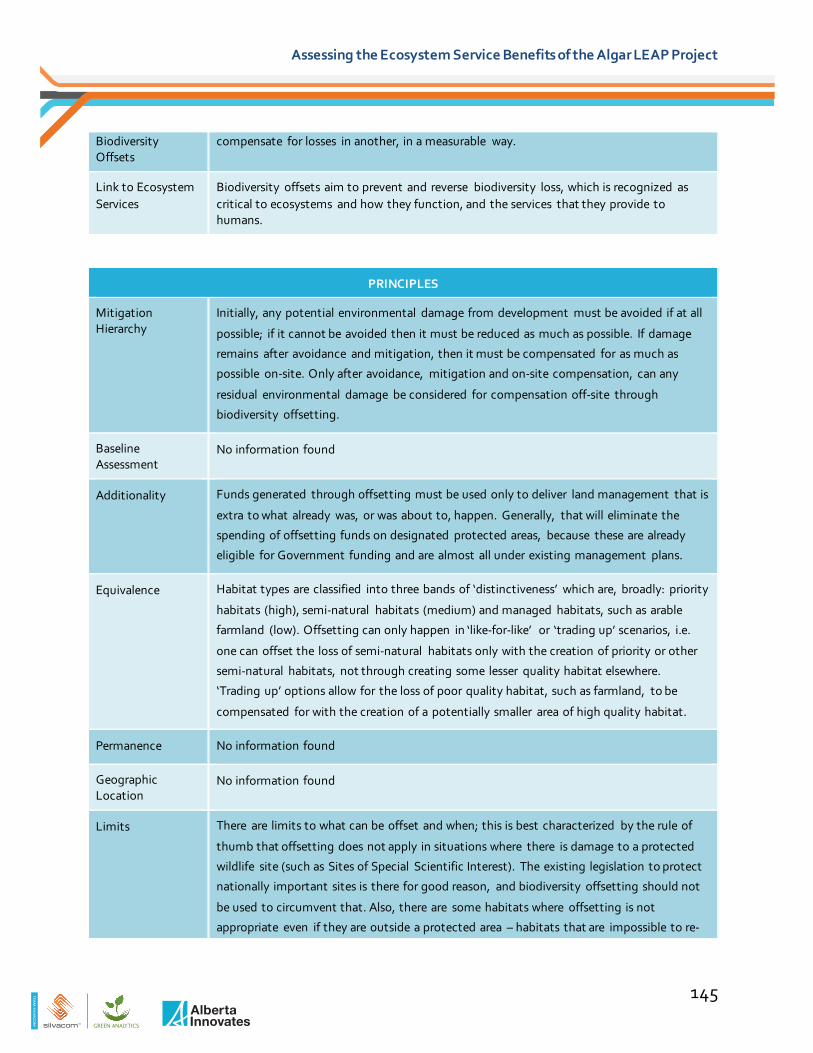
TE
AM
SIL
VA
CO
M
Assessing the Ecosystem Service Benefits of the Algar LEAP Project
Biodiversity Offsets
compensate for losses in another, in a measurable way.
Link to Ecosystem Services
Biodiversity offsets aim to prevent and reverse biodiversity loss, which is recognized as critical to ecosystems and how they function, and the services that they provide to humans.
PRINCIPLES
Mitigation Hierarchy
Initially, any potential environmental damage from development must be avoided if at all
possible; if it cannot be avoided then it must be reduced as much as possible. If damage
remains after avoidance and mitigation, then it must be compensated for as much as
possible on-site. Only after avoidance, mitigation and on-site compensation, can any
residual environmental damage be considered for compensation off-site through
biodiversity offsetting.
Baseline Assessment
No information found
Additionality Funds generated through offsetting must be used only to deliver land management that is
extra to what already was, or was about to, happen. Generally, that will eliminate the
spending of offsetting funds on designated protected areas, because these are already
eligible for Government funding and are almost all under existing management plans.
Equivalence Habitat types are classified into three bands of ‘distinctiveness’ which are, broadly: priority
habitats (high), semi-natural habitats (medium) and managed habitats, such as arable
farmland (low). Offsetting can only happen in ‘like-for-like’ or ‘trading up’ scenarios, i.e.
one can offset the loss of semi-natural habitats only with the creation of priority or other
semi-natural habitats, not through creating some lesser quality habitat elsewhere.
‘Trading up’ options allow for the loss of poor quality habitat, such as farmland, to be
compensated for with the creation of a potentially smaller area of high quality habitat.
Permanence No information found
Geographic Location
No information found
Limits There are limits to what can be offset and when; this is best characterized by the rule of
thumb that offsetting does not apply in situations where there is damage to a protected
wildlife site (such as Sites of Special Scientific Interest). The existing legislation to protect
nationally important sites is there for good reason, and biodiversity offsetting should not
be used to circumvent that. Also, there are some habitats where offsetting is not
appropriate even if they are outside a protected area – habitats that are impossible to re-
145
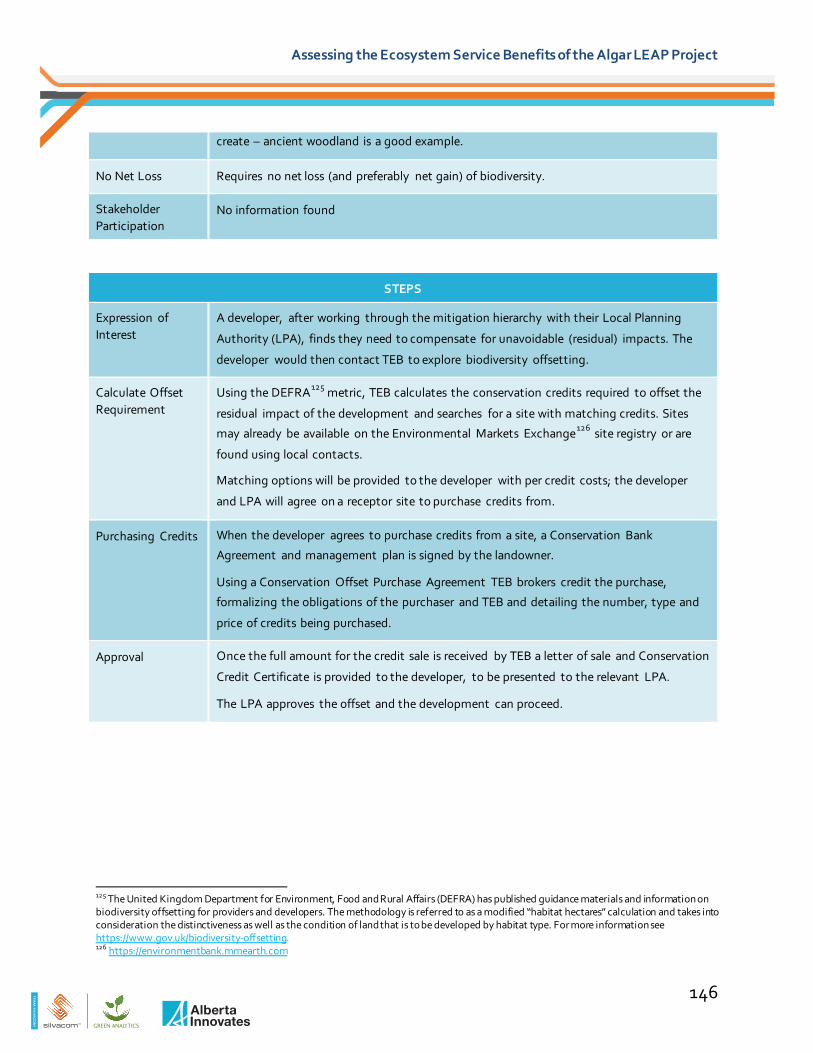
TE
AM
SIL
VA
CO
M
Assessing the Ecosystem Service Benefits of the Algar LEAP Project
125 The United Kingdom Department for Environment, Food and Rural Affairs (DEFRA) has published guidance materials and information on biodiversity offsetting for providers and developers. The methodology is referred to as a modified “habitat hectares” calculation and takes into consideration the distinctiveness as well as the condition of land that is to be developed by habitat type. For more information see https://www.gov.uk/biodiversity-offsetting. 126 https://environmentbank.mmearth.com
create – ancient woodland is a good example.
No Net Loss Requires no net loss (and preferably net gain) of biodiversity.
Stakeholder Participation
No information found
STEPS
Expression of Interest
A developer, after working through the mitigation hierarchy with their Local Planning
Authority (LPA), finds they need to compensate for unavoidable (residual) impacts. The
developer would then contact TEB to explore biodiversity offsetting.
Calculate Offset Requirement
Using the DEFRA125 metric, TEB calculates the conservation credits required to offset the
residual impact of the development and searches for a site with matching credits. Sites
may already be available on the Environmental Markets Exchange126 site registry or are
found using local contacts.
Matching options will be provided to the developer with per credit costs; the developer
and LPA will agree on a receptor site to purchase credits from.
Purchasing Credits When the developer agrees to purchase credits from a site, a Conservation Bank
Agreement and management plan is signed by the landowner.
Using a Conservation Offset Purchase Agreement TEB brokers credit the purchase,
formalizing the obligations of the purchaser and TEB and detailing the number, type and
price of credits being purchased.
Approval Once the full amount for the credit sale is received by TEB a letter of sale and Conservation
Credit Certificate is provided to the developer, to be presented to the relevant LPA.
The LPA approves the offset and the development can proceed.
146
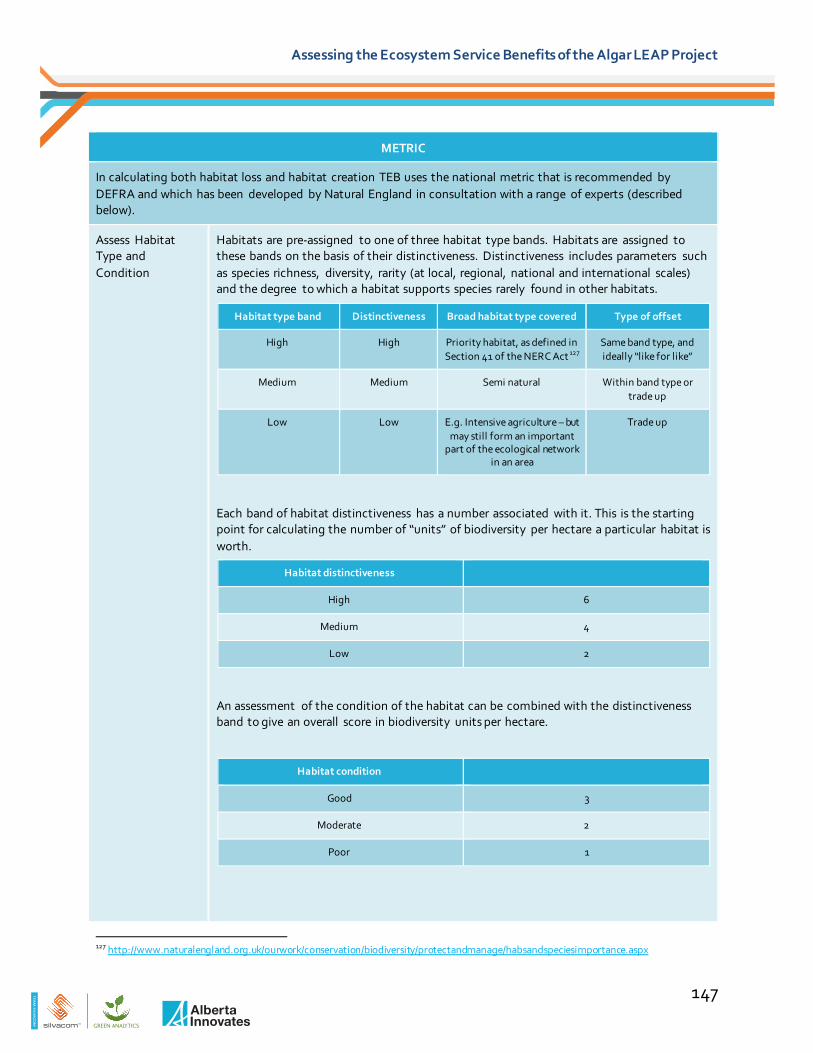
TE
AM
SIL
VA
CO
M
Assessing the Ecosystem Service Benefits of the Algar LEAP Project
127 http://www.naturalengland.org.uk/ourwork/conservation/biodiversity/protectandmanage/habsandspeciesimportance.aspx
METRIC
In calculating both habitat loss and habitat creation TEB uses the national metric that is recommended by DEFRA and which has been developed by Natural England in consultation with a range of experts (described below).
Assess Habitat Type and Condition
Habitats are pre-assigned to one of three habitat type bands. Habitats are assigned to these bands on the basis of their distinctiveness. Distinctiveness includes parameters such as species richness, diversity, rarity (at local, regional, national and international scales) and the degree to which a habitat supports species rarely found in other habitats.
Habitat type band Distinctiveness Broad habitat type covered Type of offset
High High Priority habitat, as defined in Section 41 of the NERC Act 127
Same band type, and ideally “like for like”
Medium Medium Semi natural Within band type or trade up
Low Low E.g. Intensive agriculture – but may still form an important
part of the ecological network in an area
Trade up
Each band of habitat distinctiveness has a number associated with it. This is the starting point for calculating the number of “units” of biodiversity per hectare a particular habitat is worth.
Habitat distinctiveness
High 6
Medium 4
Low 2
An assessment of the condition of the habitat can be combined with the distinctiveness band to give an overall score in biodiversity units per hectare.
Habitat condition
Good 3
Moderate 2
Poor 1
147

TE
AM
SIL
VA
CO
M
Assessing the Ecosystem Service Benefits of the Algar LEAP Project
Habitat distinctiveness
Low Medium High
Con
diti
on Good 6 12 18
Moderate 4 8 12
Poor 2 4 6
Determine Offset Requirement
The measurement of the biodiversity value of impacted sites determines the offsetting requirement. It is also necessary to measure the offsetting potential of proposed offset sites, so that providers can calculate how many units they can offer.
Offset providers can either expand or restore habitat to deliver units of biodiversity.
The number of units of biodiversity an offset can provide could be based on either:
• A future target value (i.e. the number of units available would be the difference between the current condition and the target future condition);
• The habitat’s current condition (i.e. there would need to be a record of the initial condition of the habitat, before work was undertaken, so that additionality could be demonstrated, and the number of units provided could be calculated).
On the offset provision side, therefore, the value of an offset site in terms of biodiversity units is a function of:
• The size of the site;
• The habitat type band it is assigned to (distinctiveness); and
• Its quality: the condition of the habitat at the start of the offset project, and its condition at the end.
Using Multipliers to Calculate Units of Biodiversity: A “currency based multiplier” is used to describe the difference between the size of an area of an impacted site and the size of an area covered by the offset. As a simple example, if the impacted site is worth 10 biodiversity units per hectare, and the offset site worth 30 units per hectare, 3 hectares of impacted site could be offset with 1 hectare of offset. This is referred to as a “fraction multiplier”. Because of the number of uncertainties in terms of currency and what is being exchanged, the area ratio should never go below 1:1.
There is a developing body of evidence about the likelihood of success or failure of expansion or re-creation projects for a number of different habitats, including the time that such habitats would take to develop. Once there is an estimate of the failure risk, it is possible to work out the necessary multiplier to achieve a suitable level of confidence. DEFRA employs categories of difficulty of restoration/expansion, and associated multipliers (table below).
148
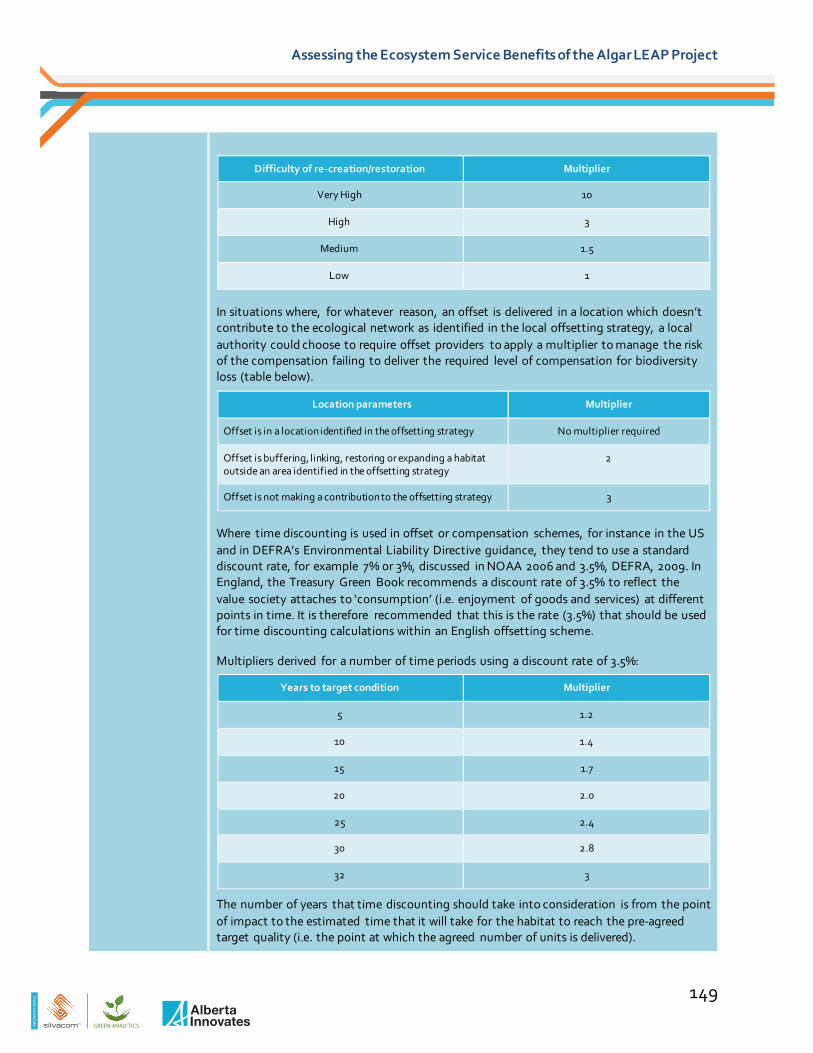
TE
AM
SIL
VA
CO
M
Assessing the Ecosystem Service Benefits of the Algar LEAP Project
Difficulty of re-creation/restoration Multiplier
Very High 10
High 3
Medium 1.5
Low 1
In situations where, for whatever reason, an offset is delivered in a location which doesn’t contribute to the ecological network as identified in the local offsetting strategy, a local authority could choose to require offset providers to apply a multiplier to manage the risk of the compensation failing to deliver the required level of compensation for biodiversity loss (table below).
Location parameters Multiplier
Offset is in a location identified in the offsetting strategy No multiplier required
Offset is buffering, linking, restoring or expanding a habitat outside an area identified in the offsetting strategy
2
Offset is not making a contribution to the offsetting strategy 3
Where time discounting is used in offset or compensation schemes, for instance in the US and in DEFRA’s Environmental Liability Directive guidance, they tend to use a standard discount rate, for example 7% or 3%, discussed in NOAA 2006 and 3.5%, DEFRA, 2009. In England, the Treasury Green Book recommends a discount rate of 3.5% to reflect the value society attaches to ‘consumption’ (i.e. enjoyment of goods and services) at different points in time. It is therefore recommended that this is the rate (3.5%) that should be used for time discounting calculations within an English offsetting scheme.
Multipliers derived for a number of time periods using a discount rate of 3.5%:
Years to target condition Multiplier
5 1.2
10 1.4
15 1.7
20 2.0
25 2.4
30 2.8
32 3
The number of years that time discounting should take into consideration is from the point of impact to the estimated time that it will take for the habitat to reach the pre-agreed target quality (i.e. the point at which the agreed number of units is delivered).
149

TE
AM
SIL
VA
CO
M
Assessing the Ecosystem Service Benefits of the Algar LEAP Project
Alberta Conservation Association’s Conservation Offset Framework for Alberta
OVERVIEW
Description This proposed theoretical framework is meant to start a discussion around a viable conservation offset framework that could be implemented in Alberta. This framework is based on the experience gained through the application of conservation offset tools around the world and the voluntary offset system that Alberta Conservation Association currently has in place in Alberta. Its success indicates that conservation offsets can be an effective and operationally efficient method of achieving important conservation objectives in Alberta.
Status A theoretical conceptual framework for Alberta Definition of Biodiversity Offsets
A system for providing compensatory mitigation for any demonstrated, unavoidable, residual impacts to ecosystems and biodiversity.
Link to Ecosystem Services
As the Alberta Conservation Association’s mission is to conserve, protect, and enhance fish, wildlife, and habitat for all Albertans to enjoy, value and use, this framework provides the opportunity for Alberta’s ecosystems to keep providing these services.
The calculations around the time discount multiplier should cover the whole period concerned. The calculations should assume that there is a quality jump from the baseline condition to the target condition once the relevant number of years has elapsed. The calculations therefore do not need to take into account increasing quality in the habitat, and do not need to be re-done annually. Offsets should last at least as long as the impact of the development, and ideally in perpetuity.
References The Environment Bank. 2012. Biodiversity Offsetting: a general guide. Accessed online from
http://www.environmentbank.com/documents/BiodiversityOffsetting-
Ageneralguide_000.pdf
The Environment Bank. May 2013. Biodiversity Offsetting: a new income stream for
landowners. Accessed online from
http://www.environmentbank.com/documents/Landownerbooklet-M ay2013.pdf
Department for Environment, Food and Rural Affairs. March 2012. Biodiversity Offsetting
Pilots, Technical Paper: the metric for the biodiversity offsetting pilot in England. Accessed
online from
https://www.gov.uk/government/uploads/syst em/uploads/attachment_data/file/69531/pb
13745-bio-technical-paper.pdf
The Environment Bank. May 2013. Biodiversity Offsetting Information Sheet 4: Guidance for
Developers. Accessed online from
http://www.environmentbank.com/documents/4_Developer_info_sheet_May2013.pdf
150

TE
AM
SIL
VA
CO
M
Assessing the Ecosystem Service Benefits of the Algar LEAP Project
PRINCIPLES
Mitigation Hierarchy
Offsets are a tool to be used in conjunction with the conventional hierarchical strategies of avoid, minimize, and mitigate, for managing environmental impacts.
Baseline Assessment
A “like-for-like” exchange of land in order to achieve “no-net loss” or a net gain in biodiversity value is reliant on accurate baseline biodiversity measures. In Alberta, the ecological classification system developed for northern Alberta by Beckingham and Archibald (1996) serves as a reliable surrogate for baseline data.
Additionality Offsetting must demonstrate that it provides benefits that would not otherwise occur. For any offset to be considered valid, it must be shown that the lands identified have, at some point in the future, a legitimate risk of being disturbed, without the protection provided by a conservation offset designation.
Equivalence At its core, equivalency is the need to compare the disturbed land to the offset land to determine how similar or “equivalent” the offset is to what will be lost as a result of development. Equivalency encompasses both a measure of physical area, as well as a measure of ecological value. This conservation offset framework is based on a “like-for-like” exchange of land in order to achieve “no-net loss” or a net gain in biodiversity value.
Permanence The permanence of conservation offsets ensures that there is a net conservation benefit from every development, as is expected for social and economic aspects of developments. On private land, a conservation easement must be used to ensure offset permanence. On public land, appropriate legislative protection must be in place to ensure permanence.
Geographic Location
Offsetting can occur with an ecosite that exists inside or outside the same natural sub-region where the disturbance occurred, but there will be offset ratio penalties for the latter.
Limits Offsetting cannot occur on land that is already protected.
No Net Loss A “like-for-like” exchange of land in order to achieve “no-net loss” or a net gain in biodiversity value is reliant on the use of a coarse scale surrogate for biodiversity in the form of “habitat units”(ecosites) as described in Beckingam and Archibald (1996).
Stakeholder Participation
No information found.
STEPS
Offset Required A proponent identifies the type of offset required (total ha of each ecosite classification, generally identified in the Environmental Impact Assessment process).
Land Trust The proponent engages a land trust to seek out appropriate offset lands.
Restoration Requirements
The land trust undertakes an assessment of the lands to determine the ecosite distribution on the land and any requirements for restoration.
Report A report is supplied to the proponent and the proponent approves or rejects the purchase of the lands.
151

TE
AM
SIL
VA
CO
M
Assessing the Ecosystem Service Benefits of the Algar LEAP Project
STEPS
Purchase Once lands are identified for purchase the proponent supplies funds to the land trust to acquire the land.
Land Secured The land trust purchases the land and becomes the title holder.
Title A conservation easement is registered on title to ensure permanence of the offset.
Registry The land is registered on the public registry.
METRIC
Offset is chosen based on “like for like” of ecosites,128 where the disturbed area is offset with the same area of the same type of ecosite(s). In other words, 1 ha of an ecosite for 1 ha of an ecosite (with some exceptions). However, when “like for like” cannot be achieved, a mechanism for determining equivalency and setting offset ratios is required. This is based on ecosite rarity, and is outlined below. Determine Ecosite Rarity
Terrestrial ecosite rarity for the Central Mixedwood Natural sub-region of Alberta is characterized as follows:
Ecosite F B E C G B A D Total
Area (ha)
6406.4 16014.9 17592.1 30137.1 40147.6 78691.8 80243 220201 489433.9
% 1.3 3.3 3.6 6.2 8.2 16.1 16.4 45 100
Determine Offset Ratios
Conservation offsets characterized by ecosites of equal or greater rarity than a disturbed site must be secured at a ratio of 1:1. Offset habitat characterized by ecosites more common than a disturbed site must be secured at a ratio greater than 1:1, up to a maximum ratio of 4:1 (e.g. most common (D) ecosite offsetting rarest ecosites (E, F, or H) disturbed). As an example, if Proponent X had a development that disturbed 100 ha of ecosite E, the proponent could offset this disturbance with 100 ha of an ecosite of equal rarity. In this case, ecosite E, F or H would count as equivalent rarity and, as such, 100 ha of any combination of these ecosites would meet the offset requirements. Alternatively, if the proponent planned to offset the 100 ha disturbance of ecosite E with ecosite A, they would require 300 ha (3:1) of ecosite A to meet the offsite requirements. The following table describes this notion:
Disturbance Ecosites
Off
set E
cosi
tes
E, F, H C, G A, B D
E, F, H 1:1 1:1 1:1 1:1
C, G 2:1 1:1 1:1 1:1
A, B 3:1 2:1 1:1 1:1
D 4:1 3:1 2:1 1:1
If offsetting a disturbance outside of the same natural sub-region, there are two possibilities: 1) offsetting with an ecosite that exists in a sub-region that is ecologically similar and/or adjacent to the natural sub-region where the disturbance occurred, in which
128 Ecosite = Basic functional ecological unit, characterized by the interaction of biophysical factors which dictate the availability of moisture and nutrients for plant growth.
152
TE
AM
SIL
VA
CO
M
Assessing the Ecosystem Service Benefits of the Algar LEAP Project
METRIC
case the ratio would only double as a penalty for offsetting outside the same natural sub-region (e.g., disturbing ecosite E and offsetting with ecosite A in a different sub-region results in a 6:1 ratio requirement, as opposed to 3:1); or 2) offsetting with an ecosite that does not exist within a sub-region that is ecologically similar and/or adjacent to the natural sub-region where the disturbance occurred, in which case the ratio will be 10:1.
References Croft, C D; Zimmerling, T; and Zimmer, K. August 2011. Conservation Offsets: A Working Framework for Alberta. Alberta Conservation Association. Accessed online from http://www.abconservation.com/go/default/assets/File/Publications/AC A%20Conservation%20Offsets%20Framework%20Aug%202011.pdf
US Fish and Wildlife Service’s Conservation Banking Program
OVERVIEW
Description Conservation banks are permanently protected lands that contain natural resource values. These lands are conserved and permanently managed for species that are endangered, threatened, candidates for listing, or are otherwise species-at-risk. Conservation banks function to offset adverse impacts to these species that occurred elsewhere, sometimes referred to as off-site mitigation. In exchange for permanently protecting the land and managing it for these species, the U.S. Fish and Wildlife Service (FWS) approves a specified number of habitat or species credits that bank owners may sell. Developers or other project proponents who need to compensate for the unavoidable adverse impacts their projects have on species may purchase the credits from conservation bank owners to mitigate their impacts.
Status Implemented as part of the Endangered Species Act of 1973, conservation banking is fully practicable in the US. In the early 1990s, the FWS began approving conservation banks. In 2003, the FWS issued the first comprehensive Federal guidelines designed to promote conservation banks as a tool for mitigating adverse impacts to species. As of October of 2011, 105 conservation banks have thus far been approved.
Definition of Biodiversity Offsets
A verified crediting system for permanently protecting lands that contain natural resource values critical to the survival of endangered, threatened or at-risk species by offsetting adverse impacts to these species that occurred elsewhere.
Link to Ecosystem Services
With a focus on protecting endangered or threatened species by creating a net benefit of habitat, the conservation banking program supports biodiversity, which is a supporting ecosystem service.
PRINCIPLES
Mitigation Hierarchy
Conservation banking is not a substitute for avoiding and minimizing effects on listed species on-site.
Baseline Assessment
No information found
Additionality Land used to establish conservation banks must not already exist for conservation purposes. Conservation banks must create additional habitat.
153

TE
AM
SIL
VA
CO
M
Assessing the Ecosystem Service Benefits of the Algar LEAP Project
PRINCIPLES
Equivalence If a project displaces habitat and it affects a certain species, a conservation bank can be used to offset that displacement by creating alternative habitat. However conservation biology principles must be used to evaluate the conservation needs of the species and determine if the conservation bank will provide sufficient habitat to support a thriving population of the displaced species. This is determined on a case-by-case basis depending on the needs of the species proposed to be covered in the bank, the location of the bank, and the habitat values that are provided. Boundaries must encompass all areas that are necessary to maintain the habitat function specific to the species covered by the bank, which may include the appropriate buffer against edge effects from adjacent land use.
Permanence Resource values protected by banks must be conserved and managed in perpetuity. Geographic Location
The offsets purchased do not have to be in the same location as the impacts. However, the conservation bank must fit into the overall conservation needs of the listed species the bank intends to cover.
Limits Land used to establish conservation banks must not have been previously designated for conservation purposes (e.g. parks, green spaces, municipal watershed lands), unless the proposed designation as a bank would add additional conservation benefit.
No Net Loss No information found Stakeholder Participation
The bank credits will be sold in conjunction with incidental take of listed species exempted under Section 7 or authorized under Section 10 of the ESA. Both of these processes have opportunities for public review.
STEPS
Plan Goals and Objectives
The overall goal of any conservation bank should be to provide an economically effective process that provides options to landowners to offset the adverse effects of proposed projects to listed species. The goal of a bank should be focused on producing conservation benefits for the species for which the bank is being established. The important point in establishing a bank is to site banks in appropriate areas that can reduce the threat of fragmentation and provide management measures that address other threats that a species might encounter.
Develop Conservation Strategy
Any conservation strategy that FWS develops should identify threats, conservation needs and actions that address those threats and needs in FWS area. This information can then help FWS evaluate whether the banking concept, the geographic location, the size, and management for the species is appropriate. The recovery plan can help guide FWS in evaluating whether creation of a bank will contribute to the conservation needs of the species.
Select a Site FWS will give careful consideration to the ecological suitability of a site for achieving mitigation. FWS will evaluate the location, size, and configuration of the proposed bank. Additional items to consider when determining the suitability of an area as a conservation bank might be topographic features, habitat quality, compatibility of existing and future land use activities surrounding the bank, and species use of the area. Conservation biology principles suggest that conserving large, unfragmented habitat blocks, to reduce the edge effect, in a reserve network will help to maintain viable populations. A conservation bank could be large enough to maintain a viable population within its boundaries or be situated in a strategic location that would add to an already
154

TE
AM
SIL
VA
CO
M
Assessing the Ecosystem Service Benefits of the Algar LEAP Project
STEPS
established conserved area. Bank boundaries should ordinarily be drawn so as to exclude developed areas or other areas that cannot reasonably be restored. It is also possible to establish conservation banks within the boundaries of a proposed project, such as an HCP planning area, if it is both feasible and appropriate given the habitat type and species needs. If the project plan area contains sufficient land and the project impacts are fairly localized, it may be possible, or even desirable, to designate a conservation bank within its boundaries. Ultimately, the habitat credits purchased from a conservation bank must provide biologically comparable habitat values to the area affected by the activity to be mitigated.
Submit for Public Review and Comment
The bank credits will be sold in conjunction with incidental take of listed species exempted under section 7 or authorized under section 10 of the ESA. Both of these processes have opportunities for public review. Section 7 consultations are conducted when Federal agencies propose projects that have adverse effects to listed species. The Federal action agencies are required to consider reasonable alternatives and analyze those impacts through the National Environmental Policy Act, which includes public review of the project including mitigating factors. Through the section 10 process, all applications for permits authorizing the taking of listed species must be noticed by FWS for at least a 30-day public comment period.
Monitor Bank Monitoring is the responsibility of the conservation bank. The scope of the monitoring program should be commensurate with the scope of the conservation actions undertaken by the bank. Biological goals of the bank provide a framework for developing a monitoring program that measures progress toward meeting those goals. The appropriate protective measures and level of monitoring will vary by individual circumstance, and an effective monitoring program should be sufficiently flexible to allow modifications, if necessary, to obtain the appropriate information.
METRIC
In general, it is important that banks be of sufficient size to ensure the maintenance of ecological integrity in perpetuity. However, the minimum or maximum sizes of parcels of land designated as a conservation bank will be determined on a case-by-case basis depending on the needs of the species proposed to be covered in the bank, the location of the bank, and the habitat values that are provided. In its simplest form, one credit will equal one acre of habitat or the area supporting one nest site or family group. Other examples include:
• 1 acre = 1 credit
• 1 individual = 1 credit
• 1 mating pair of individuals = 1 credit
• Overlapping habitats with different credit values per acre for different species
• Existing/restored/enhanced habitat with different credit values for each
• Combination of CWA (wetland or stream) and ESA credits
155

TE
AM
SIL
VA
CO
M
Assessing the Ecosystem Service Benefits of the Algar LEAP Project
METRIC
References US Fish and Wildlife Service. August 2012. Conservation Banking: Incentives for
Stewardship. Washington, DC. Accessed online from http://www.fws.gov/endangered/ esa-library/pdf/conservation_banking.pdf US Fish and Wildlife Service. May 2003. Guidance for the Establishment, Use, and Operation of Conservation Banks. Washington, DC. Accessed online from http://www.fws.gov/endangered/ esa-library/pdf/Conservation_Banking_Guidance.pdf US Fish and Wildlife Service. January 2013. ESA Basics: 40 Years of Conserving Endangered Species. Washington, DC. Accessed online from http://www.fws.gov/endangered/esa-library/pdf/ESA_basics.pdf US Fish and Wildlife Service. 1973. Endangered Species Act of 1973. 108th Congress. Washington, DC. Accessed online from http://www.fws.gov/endangered/esa-library/pdf/ESAall.pdf
The Willamette Partnership
OVERVIEW
Description The Willamette Partnership’s mission is to expand the pace, scope, and effectiveness of restoration by using market-based approaches to promote conservation. In 2008, the Partnership launched the Counting on the Environment Program to quantify ecosystem services and develop an Ecosystem Credit Accounting System (ECAS). Now the protocol and the credit accounting system from the program have been adopted and are being used in Oregon and other parts of the western United States.
Status As of August 2009, 27 state and federal natural resource management agencies and other important non-profit stakeholders agreed in principle with the ECAS developed by the Willamette Partnership through the Counting on the Environment Program. The accounting system has been implemented and pilots are taking place.
Market transactions have occurred for water quality, specifically thermal benefits of shade from riparian forest restoration (thermal credits). 3 municipalities in western Oregon are purchasing verified and registered water temperature credits to meet regulatory compliance obligations under the CWA. Thermal credits are also being purchased by 2 voluntary buyers who intend to retire the water quality benefits for conservation benefit.
Definition of Biodiversity Offsets
An ecosystem credit accounting system that quantifies and verifies the benefits of voluntary conservation actions in a way that can be linked to and used for mitigation of unavoidable environmental impacts.
Link to Ecosystem Services
The ECAS is based on ecosystem service credits, which are quantified and verified units of ecosystem function.
156

TE
AM
SIL
VA
CO
M
Assessing the Ecosystem Service Benefits of the Algar LEAP Project
PRINCIPLES
Mitigation Hierarchy Buyers/permittees will also need to meet some minimum standards before accessing markets. These standards are often set in agency rules. Generally, these rules require that buyers avoid or minimize the impact of their development actions, by being in full compliance with all relevant laws and rules and by using best practicable technology and practices, prior to using credits to offset impacts.
Baseline Assessment
The first step is establishing baseline ecosystem functions. The baseline defines the current condition from which a conservation action improves function or a development action degrades function. The baseline consists of a collection of: 1) spatial data and info (aerial photos, verification of current animal species, topography info, GIS, etc.); and 2) field data (habitat type and performance indicators that are associated with structural conditions, etc.). Field map data is used to confirm map unit boundaries complete functional calculations and establish relationships between these calculations and the spatial map units.
Additionality All credited projects need to demonstrate that they provide 'additional' benefits beyond what is required under current regulations and business as usual. The additionality requirement ensures that credits are awarded for doing more than would otherwise have happened without a market mechanism in place.
Equivalence No information found. Permanence For permanent impacts (e.g. wetland removal), creditable projects need permanent
conservation easements or another equivalent agreement (deed restrictions, covenants, or agreements from public agencies, etc.).
Geographic Location
Multiple watersheds in western Oregon, increasingly present in the Pacific northwest region and western United States
Limits No information found. No Net Loss Programmatically, the ECAS is designed to generate a net positive environmental impact
through the use of trading ratios and a reserve pool. Existing state and federal policies on mitigation are in no way altered by the Ecosystem Credit Accounting System. This includes the no net loss of wetlands and obligation to avoid and minimize impacts before using mitigation.
Stakeholder Participation
From 2008 - 2009, 27 state and federal natural resource management agencies and other important non-profit stakeholders collaborated to develop the Ecosystem Credit Accounting System. Updates and adaptations to the ECAS standards and protocols are managed by Willamette Partnership with the advice and consent of a stakeholder advisory/governance board known as the Coordinating Team. The Coordinating Team includes representation from state and federal agencies and other non-profit organizations.
STEPS
Offset Site Selection and Validation
A seller selects a potential site to conduct conservation activities, and submits a Validation Checklist to the Market Administrator to confirm the project’s eligibility. Validation provides Project Developers with confirmation of what actions are eligible to generate credits and some technical commentary on project design. Validation is mandatory for credit producers. This stage provides a screen to minimize investment and expenditures on the part of market participants for projects that, for one reason or another, may not be eligible to generate credits. The Market Administrator (Willamette Partnership) reviews the checklist and supporting
157

TE
AM
SIL
VA
CO
M
Assessing the Ecosystem Service Benefits of the Algar LEAP Project
STEPS
documentation for consistency with the ECAS eligibility requirements:
• Additionality – projects must go above and beyond the relevant regulatory thresholds for compliance and “business as usual” (e.g. typical operations).
• Suitability – projects must be ecologically appropriate, as defined by action or BMP-specific quality standards.
• Sustainability – credit generating activities must be legally protected for the life of the credit. Project Protection Agreements, which may include leases, contracts, easements or other agreements, must run with the land to ensure the project will not be affected if ownership changes.
Projects that meet these standards are issued a Notice of Validation indicating that the project is likely to generate credits.
Offset Credit Calculation
With a basic understanding of the site’s location and the site’s potential to generate ecosystem service credits, sellers then complete a more in-depth analysis of the site to determine the exact type and number of credits that can be produced. A baseline assessment and a post-action condition assessment based on conservation or restoration designs are then completed. This stage produces a formal estimate of credit quantity that can be independently verified.
Offset Verification All projects require verification. Verification is an independent, expert check on the credit estimate provided by the Project Developer. Verifiers include both the lead agencies overseeing regulated markets and individuals accredited by Willamette Partnership to verify credits. The purpose of verification is to provide confidence to all program participants that credit calculations are a faithful, true and fair account – free of material misstatement and conforming to credit generation and accounting standards. Verification covers the review of documentation for eligibility requirements, the credit calculation, and a site visit to confirm project implementation that meets quality standards.
Offset Certification During Certification, Willamette Partnership and regulatory agencies (as necessary) perform a final review of verified credit estimates and all project documentation. Willamette Partnership coordinates this process and notifies Project Developers when certification is complete. Most compliance credit types will need an agency certification before credits can be issued.
Offset Registration and Issuance
Registration ensures that ecosystem credits from a specific project are transparent and traceable throughout their entire life. All verified and certified credits generated through the Ecosystem Credit Accounting System must be registered on a web-based, publicly accessible registry. Willamette Partnership uses Markit Environmental Registry129(Markit), which allows all supported currencies to be tracked in the same place, including those for which no current registration or tracking systems exist. Some agencies have their own systems for tracking projects. Once a project has been verified, a package of information is sent to Markit. Markit will review the package for completeness and issue credits to the project developer’s account. Project documentation becomes publicly accessible via Markit Public View. Credit quantity and ownership is tracked by Markit for the life of the credit.
Debit Calculation Buyers purchasing credits as a regulatory offset need to do so in accordance with existing agency mitigation programs, which may set out service area requirements or dictate the
129 A global centralized financial-markets based registry system that manages environmental (carbon, water and biodiversity) credits. http://www.markit.com/en/products/environmental/markit-environmental-registry.page?
158

TE
AM
SIL
VA
CO
M
Assessing the Ecosystem Service Benefits of the Algar LEAP Project
STEPS
appropriate timing for credit purchase. In many cases, the number of credits a Buyer is required to purchase is worked out between Buyers and agencies on a case-by-case basis or is set through an existing agency process, such as load allocations in water quality, which are determined by the TMDL process and set in waste water permits. In other cases, agencies may indicate that a Buyer’s credit obligation be determined by the debits that the development action creates (e.g. habitat impacted by development). Debits are quantified and verified units of functional loss. In this case, the process of calculation and verification is the same for quantifying debits as it is for quantifying credits except that verification occurs prior to permits being issued and before project implementation.
Permit Allowance/ Validation
In most cases, potential buyers of ecosystem service credits need formal approval from the necessary regulatory agencies to achieve partial or full compliance with their permit requirements through the trading of credits. This step also determines that buyers are eligible to purchase credits to offset their impacts.
Set Up a Buyer’s Account
Buyers must open an account on the Markit Registry. Buyers pay an account origination fee to help defer the costs of managing the Registry. Willamette Partnership has pre-purchased rights to several accounts on the registry. Contact Willamette Partnership for availability and pricing of these accounts.
Negotiate and Finalize Credit Purchase
The Registry does not set the price of the credits listed, nor does it set the terms and conditions of sales. The price, terms and conditions are all set and agreed upon by the seller and buyer—with the only exception being the verification requirements associated with final and ongoing certification.
Selling and Transferring Credits
The sale of credits involves the seller and buyer. Willamette Partnership issues an Approval of Sale after a transaction is completed. Markit receives the Approval of Sale and moves credits from one account to another.
Tracking Credits Sellers need to conduct annual verifications of their credits until the credits are sold. Failure to verify credits results in their removal from the Markit Registry. Sellers use the same verifier for the first five years.
METRIC
Software is used to estimate the amount of credits required for purchase through this program. Examples are provided below for two types of habitat: wetlands and upland prairie lands. The relevant software is noted and an overview of the process is provided below.
159
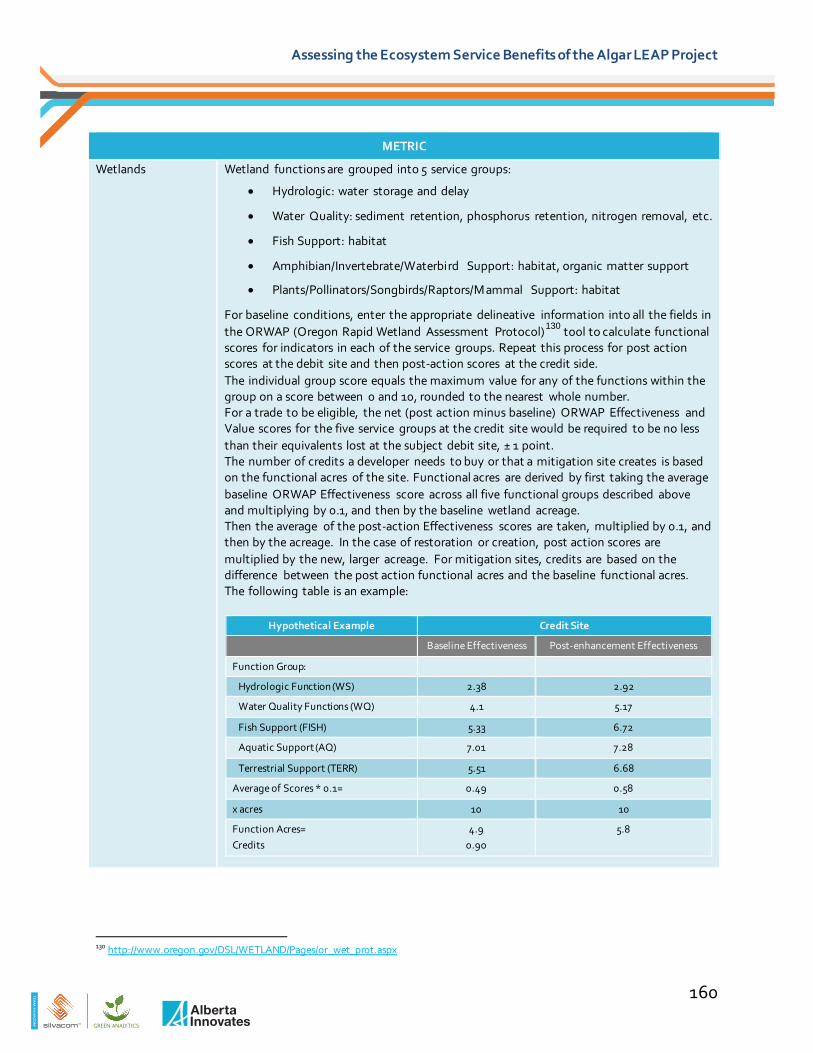
TE
AM
SIL
VA
CO
M
Assessing the Ecosystem Service Benefits of the Algar LEAP Project
METRIC
Wetlands Wetland functions are grouped into 5 service groups:
• Hydrologic: water storage and delay
• Water Quality: sediment retention, phosphorus retention, nitrogen removal, etc.
• Fish Support: habitat
• Amphibian/Invertebrate/Waterbird Support: habitat, organic matter support
• Plants/Pollinators/Songbirds/Raptors/M ammal Support: habitat
For baseline conditions, enter the appropriate delineative information into all the fields in the ORWAP (Oregon Rapid Wetland Assessment Protocol)130 tool to calculate functional scores for indicators in each of the service groups. Repeat this process for post action scores at the debit site and then post-action scores at the credit side. The individual group score equals the maximum value for any of the functions within the group on a score between 0 and 10, rounded to the nearest whole number. For a trade to be eligible, the net (post action minus baseline) ORWAP Effectiveness and Value scores for the five service groups at the credit site would be required to be no less than their equivalents lost at the subject debit site, ± 1 point. The number of credits a developer needs to buy or that a mitigation site creates is based on the functional acres of the site. Functional acres are derived by first taking the average baseline ORWAP Effectiveness score across all five functional groups described above and multiplying by 0.1, and then by the baseline wetland acreage. Then the average of the post-action Effectiveness scores are taken, multiplied by 0.1, and then by the acreage. In the case of restoration or creation, post action scores are multiplied by the new, larger acreage. For mitigation sites, credits are based on the difference between the post action functional acres and the baseline functional acres. The following table is an example:
Hypothetical Example Credit Site
Baseline Effectiveness Post-enhancement Effectiveness
Function Group:
Hydrologic Function (WS) 2.38 2.92
Water Quality Functions (WQ) 4.1 5.17
Fish Support (FISH) 5.33 6.72
Aquatic Support (AQ) 7.01 7.28
Terrestrial Support (TERR) 5.51 6.68
Average of Scores * 0.1= 0.49 0.58
x acres 10 10
Function Acres= Credits
4.9 0.90
5.8
130 http://www.oregon.gov/DSL/WETLAND/Pages/or_wet_prot.aspx
160

TE
AM
SIL
VA
CO
M
Assessing the Ecosystem Service Benefits of the Algar LEAP Project
METRIC
Upland Prairie For baseline conditions, enter the appropriate delineative information into all the fields in the Rapid Assessment form131, which is a tool to calculate functional scores for indicators of an upland prairie habitat. Example #1 (Preservation): A 9-acre upland prairie remnant is assessed using the Calculator. Applying the Calculator to those 9 acres yields a score of 5.0. The result is 4.5 functional acre credits (9.0 x 0.5) available as soon as a conservation easement is recorded. Example #2 (Preservation & Enhancement): A 50-acre upland prairie with Fender’s blue butterfly is assessed using the Calculator prior to acquisition for conservation. Exactly 10 acres will be enhanced. Applying the Calculator to those 50 acres in their present condition, gives a score of 7.5 (on scale of 0 to 10). The project developer would have 37.5 functional acres (50 x 0.75) of credit immediately available to sell. Applying the Calculator again to the 10 acres as they are imagined to look after the enhancement (or ideally, as measured after the enhancement has occurred) yields a score of 9.0. The gain in score is 1.5, and when combined with the 10 acres of treated area, yields an additional 1.5 credits (10 x 0.15).
References Willamette Partnership. September 2009. Ecosystem Credit Accounting, Pilot General Crediting Protocol: Willamette Basin Version 1.1. Accessed online from http://willamettepartnership.org/ecosyst em-credit-accounting/willamette-ecosyst em-marketplace-documents/General%20Crediting%20 Protocol%201.1.pdf Adamus, P; and Cochran, B. July 2009. Wetland Crediting Procedure: Translating Functional Scores to Credits Accounting. Willamette Partnership. Accessed online from http://willamettepartnership.org/ecosyst em-credit-accounting/orwap/WetlandCreditingProc edure_071309.pdf Adamus, P. July 2009. Procedure for Upland Prairie Credit Calculator, Wilammet Partnership. Accessed online from http://willamettepartnership.org/ecosystem-credit-accounting/prairie/UplandPrairieMetric Proc edure_071409.pdf
131 http://willamettepartnership.org/ecosystem-credit-accounting/prairie/copy_of_upland-prairie-habitat
161