Embed Size (px)
Citation preview
University of Massachusetts AmherstScholarWorks@UMass AmherstEnvironmental & Water Resources EngineeringMasters Projects Civil and Environmental Engineering
5-2016
Assessing the Economic and Flow RegimeOutcomes of Alternative Hydropower Operationson the Connecticut River's MainstemLuke Detwiler
Follow this and additional works at: https://scholarworks.umass.edu/cee_ewre
Part of the Environmental Engineering Commons
This Article is brought to you for free and open access by the Civil and Environmental Engineering at ScholarWorks@UMass Amherst. It has beenaccepted for inclusion in Environmental & Water Resources Engineering Masters Projects by an authorized administrator of ScholarWorks@UMassAmherst. For more information, please contact [email protected].
Detwiler, Luke, "Assessing the Economic and Flow Regime Outcomes of Alternative Hydropower Operations on the ConnecticutRiver's Mainstem" (2016). Environmental & Water Resources Engineering Masters Projects. 76.https://doi.org/10.7275/r2z8-h213
Assessing the Economic and Flow Regime Outcomes of Alternative Hydropower
Operations on the Connecticut River’s Mainstem
A Project Presented
by
Luke W. Detwiler
Master of Science in Civil Engineering
Department of Civil and Environmental Engineering
University of Massachusetts
Amherst, MA 01003
May 2016
1
Table of Contents Table of Figures .............................................................................................................................. 2
Table of Tables ............................................................................................................................... 3
1 Abstract ................................................................................................................................... 4
2 Introduction ............................................................................................................................. 5
3 Background ............................................................................................................................. 7
3.1 Managing Altered Streams for Ecological Improvement .............................................. 10
3.2 Developing a Comprehensive Assessment Framework ................................................. 11
3.3 Exploring Reoperations .................................................................................................. 11
3.4 Connection to Project ..................................................................................................... 12
4 Study Area and Model .......................................................................................................... 13
4.1 Connecticut River & FERC Study Area ........................................................................ 13
4.2 Hydropower System Description ................................................................................... 14
4.3 Hydropower Model ........................................................................................................ 17
4.3.1 Model Inputs ........................................................................................................... 18
4.3.2 Calibration............................................................................................................... 20
5 Case study: Evaluating the Impacts of a Run-of-River Operating procedure ...................... 22
5.1 Run-of-River Condition ................................................................................................. 22
5.2 Flow Regime Impacts..................................................................................................... 23
5.3 Economic Impacts of Run-of-River Reoperations ......................................................... 27
5.3.1 Assessing Potential for Improved Hydropower Performance under the Run of River
Condition............................................................................................................................... 30
4 Discussion and Conclusions ................................................................................................. 34
Appendix A: CHOP model formulation & parameterization ................................................... 42
A.1 General model structure ..................................................................................................... 42
A.2 LP formulation ................................................................................................................... 43
A.2.1 Objective function ....................................................................................................... 43
A.2.2 Model constraints ........................................................................................................ 44
A.3 Baseline LINGO script....................................................................................................... 44
A.4 Run-of-River LINGO script ............................................................................................... 47
A.5 Model parameterization ..................................................................................................... 49
2
Table of Figures
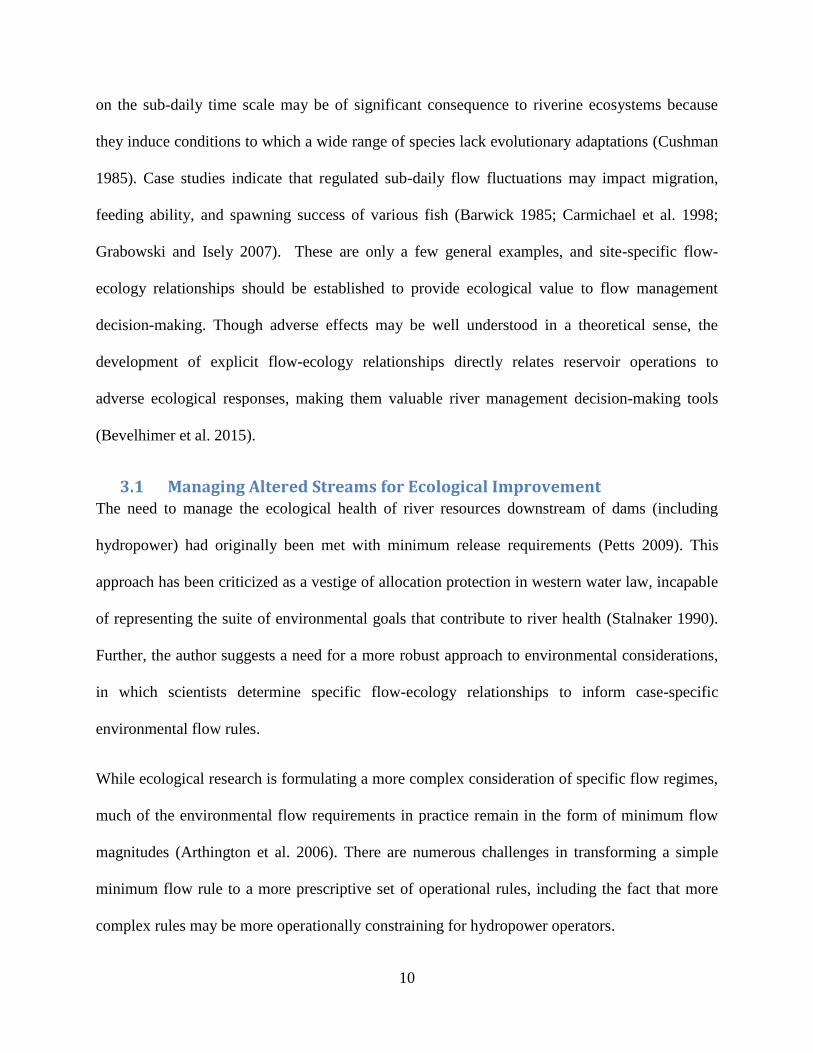
Figure 1 – Hydropower production is present at 13% of the major dams from the National
Inventory of Dams (NID) dataset. Here, major dams are defined as those with greater than 5,000
acre-foot of reservoir storage or 50 feet of head. ............................................................................ 6
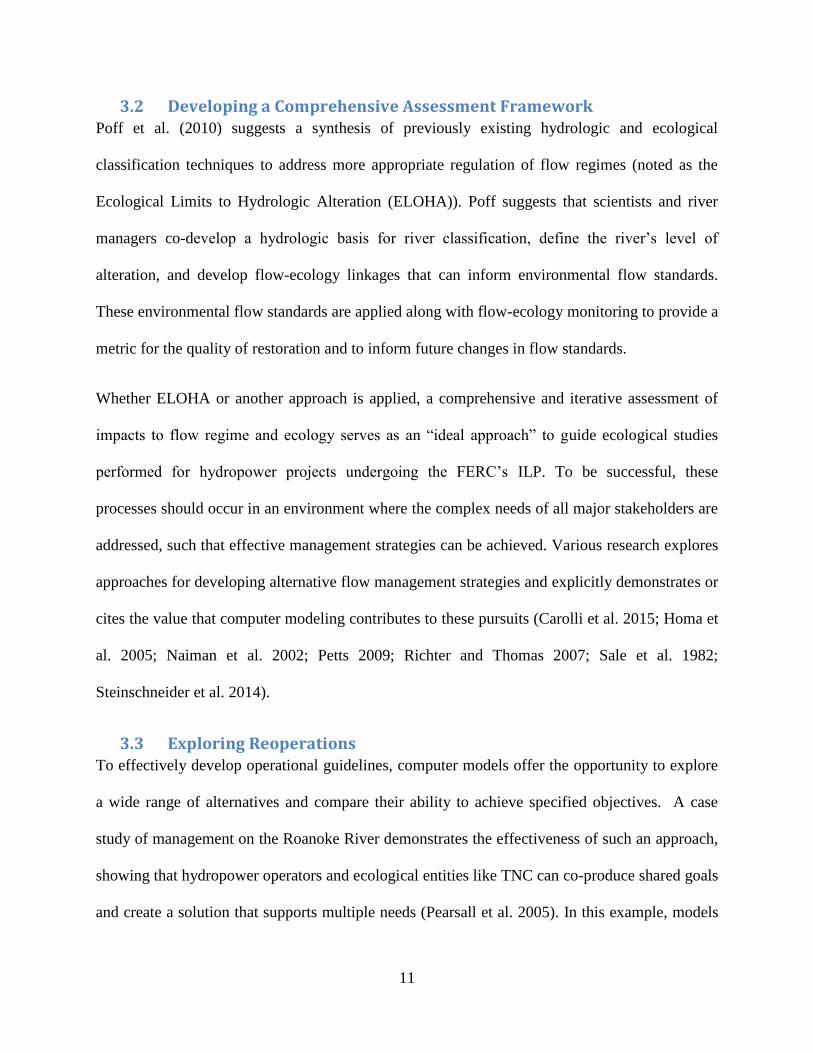
Figure 2 - Study Area for the Connecticut River hydropower facilities undergoing the FERC
joint Integrated Licensing Process. The inset map provides detail on the location of the off-
stream Northfield pumped-storage facilityas well as the two power houses at the Turners Falls
project. .......................................................................................................................................... 14
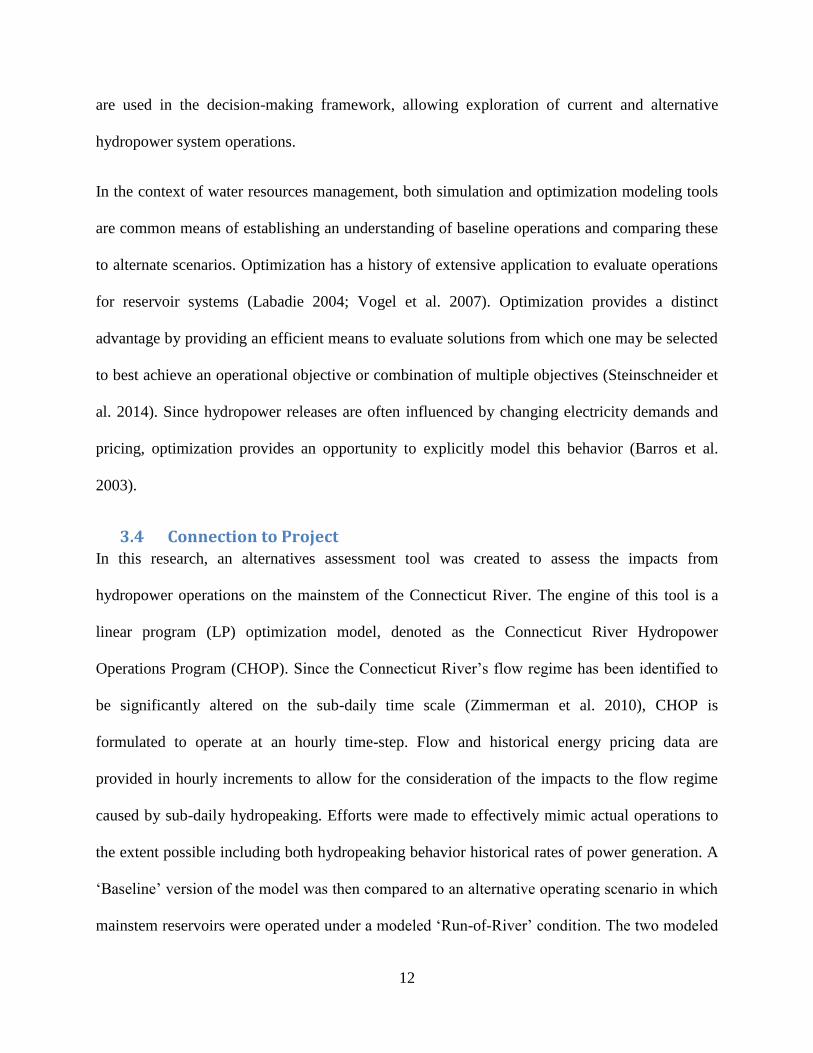
Figure 3 – Hydrograph (USGS #01144500) for October of 2015, demonstrating typical
hydropeaking operations at Wilder Dam. ..................................................................................... 16
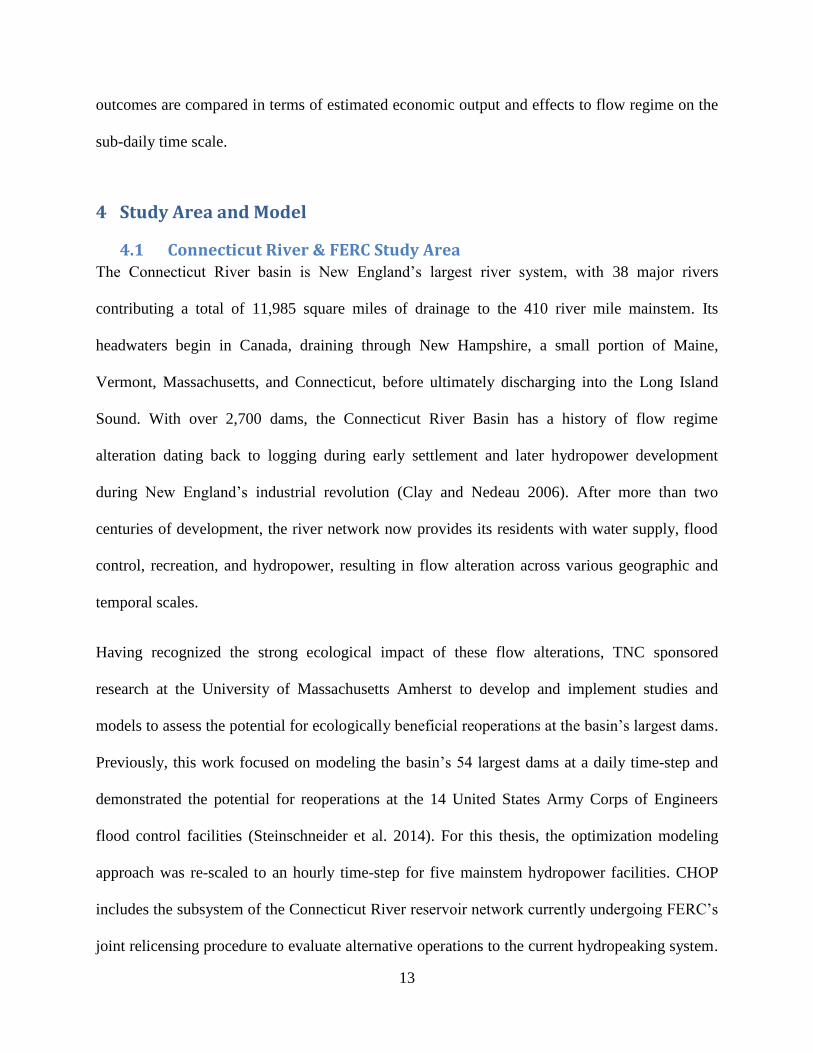
Figure 4 – Sample hydrograph of modeled flow input to Wilder Dam, including historical
operations at 15-Mile Falls for a period in July of 2004. The flow dataset includes CRUISE
combined with estimated natural flows USGS 01138500 data. ................................................... 19
Figure 5 - Sample hydropower optimization showing modeled turbine releases at Bellows Falls,
timed with ISO-NE's historical energy price signal for January of 2005. .................................... 20
Figure 6 - Modeled average annual hydropower generation for the 2003-2009 period for which
model data and historical power generation data overlapped. ...................................................... 21
Figure 7 - Hydropower optimization schematic for modeled Baseline and Run-of-River
scenarios. ....................................................................................................................................... 23
Figure 8 - Sample modeled hydrograph demonstrating a difference in flow regime between
Baseline and Run-of-River downstream of Turners Falls Dam.................................................... 24
Figure 9 - Comparison between Baseline and Run-of-River modeled average flow rates by
season. ........................................................................................................................................... 25
Figure 10 - Comparison between Baseline and Run-of-River modeled average daily peak flow
rates by season. ............................................................................................................................. 26
3
Figure 11 - Comparison between Baseline and Run-of-River modeled RBF by season with
historical White River data as reference for natural. .................................................................... 27
Figure 12 - Modeled average annual hydropower revenues for the 2003-2011 period for which
input energy price data and flow data overlapped. ....................................................................... 28
Figure 13 - Schematic of allowed vs. licensed reservoir fluctuation at Turners Falls. Elevations
are reported with respect to mean sea level. ................................................................................. 30
Figure 14 - Modeled Run-of-River scenario results for the exploration of the relationship
between allowed Turners Falls reservoir fluctuation and Northfield revenues. ........................... 31
Figure 15 - Schematic of the generalized CHOP workflow ......................................................... 42
Table of Tables
Table 1 – Dam characteristics for the studied Connecticut River hydropower dams. .................. 15
4
Assessing the Economic and Flow Regime Outcomes of Alternative
Hydropower Operations on the Connecticut River’s Mainstem
To be submitted to the Journal of Water Resources Management and Planning
1 Abstract Hydropower provides a source of reliable and inexpensive energy, producing approximately 20%
of the global energy supply, though it comes at a cost to riverine ecosystems. To maximize
revenues, major hydropower facilities store and release water with respect to short-term changes
in energy price, causing significant sub-daily flow regime alterations that impact downstream
ecological communities. In the United States, the Federal Energy Regulatory Commission
(FERC) is responsible for hydropower regulation and this is administered, in part, during
periodic relicensing of existing facilities. The process of relicensing provides the opportunity to
evaluate the goals and concerns of interested parties and evaluate potential operational changes
in licensure which may support these goals, often including constraints aimed at supporting
ecological improvements.
This paper explores potential changes in reservoir operating rules for a series of five peaking
hydropower facilities on the Connecticut River undergoing FERC relicensing that should
complete in 2019. This paper evaluates the trade-offs between two primary goals: maximizing
revenues from hydroelectric power generation and returning the river to a more natural flow
regime. These trade-offs are assessed using the Connecticut River Hydropower Operations
Program (CHOP), a linear programming (LP) optimization model applied at an hourly time-step
to capture the sub-daily effects to the flow regime. The model objective function is formulated to
maximize hydropower revenues with respect to historical regional energy price data and is
5
demonstrated to accurately mimic hydropeaking operating conditions and match historical power
generating rates.
A case study compares modeled hydropower operating conditions between current hydropeaking
operations and a strict run-of-river condition, where dam inflows must be directly released as
outflows at all times. Analysis suggests that the run-of-river condition would result in a total
economic loss of 7-9% of average annual revenues at the four mainstem facilities and as much as
17% at the larger, pumped-storage facility. However, an exploration of operating revenue losses
at the pumped-storage facility suggests that there is potential for reoperations within the run-of-
river operating condition to substantially reduce these losses. The run-of-river operation is
demonstrated to improve the Connecticut River’s flow regime on the sub-daily time scale, with
significant reductions in rates of change in flows to levels that approach those observed at a
nearby unaltered location. The modeled improvements to the flow regime demonstrate the merit
of this run-of-river condition as a potential reoperation for the hydropower system.
2 Introduction Hydropower currently provides approximately 20% of the world’s energy supply and is noted for
being inexpensive, reliable, and having a low CO2 footprint (Sommers 2004). However, the
negative impacts of hydropower on natural ecosystems have been noted for decades and concern
for the preservation of riverine ecosystem services has subjected the hydropower industry to
increased environmental regulation (Jager and Bevelhimer 2007; Pearsall et al. 2005; Richter and
Thomas 2007). The impacts of dams and their operations have significant consequences for
natural riverine ecologies, creating the need to seek management solutions that support both
ecological and power generating goals (Arthington et al. 2006; Petts 2009; Poff and Zimmerman
2010).
6
Hydropower, together with municipal water supply, irrigation, flood control, navigation, and
recreation represent the primary human uses of major river systems. In addition, river systems
provide a variety of environmental services that are essential to the health of river ecology.
Features of a river’s flow regime affect hydrological and geomorphological processes which
provide stability and diversity of habitat necessary for the persistence of aquatic and riparian
communities (Naiman et al. 2002). In this way, riverine ecosystems can be seen as legitimate
water users with needs that often compete with those of human water uses, including
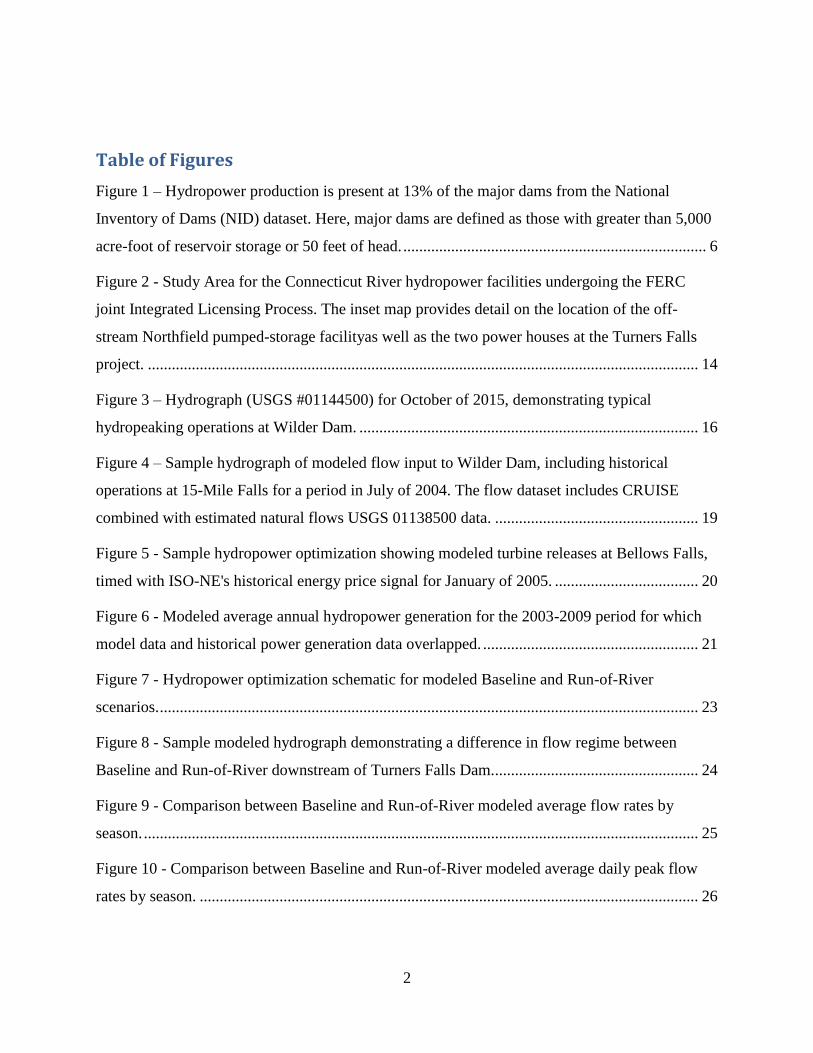
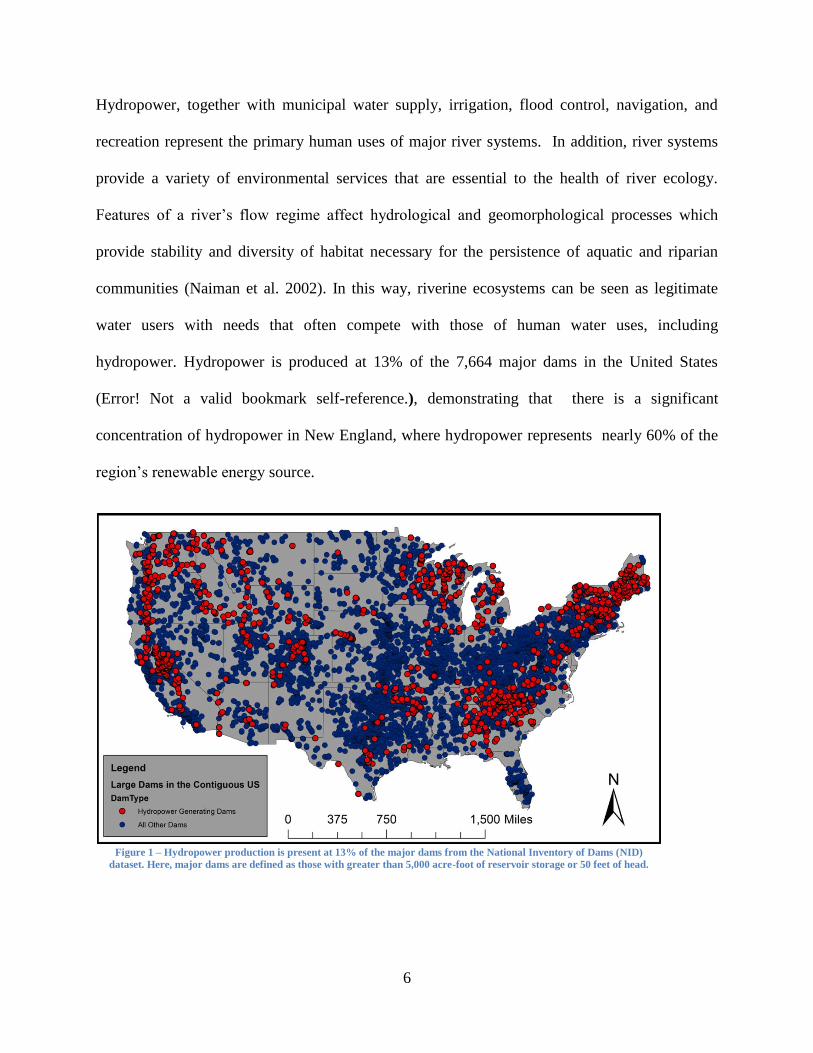
hydropower. Hydropower is produced at 13% of the 7,664 major dams in the United States
(Error! Not a valid bookmark self-reference.), demonstrating that there is a significant
concentration of hydropower in New England, where hydropower represents nearly 60% of the
region’s renewable energy source.
Figure 1 – Hydropower production is present at 13% of the major dams from the National Inventory of Dams (NID)
dataset. Here, major dams are defined as those with greater than 5,000 acre-foot of reservoir storage or 50 feet of head.
7
Hydropower in the United States is regulated by the Federal Energy Regulatory Commission
(FERC). Hydropower facilities must obtain operating licenses from FERC, which typically have
a 30-50 year operational period. FERC offers an Integrated Licensing Process (ILP) that allows
interested parties to request the investigation and mitigation of specific environmental concerns
before licenses are granted (Viers 2011). Currently, the FERC is responsible for more than 1,000
active hydropower licenses, 303 of which expire between 2015 and 2025.
The Connecticut River has five sequential hydropower projects that are currently in a joint FERC
relicensing process, scheduled to conclude in 2019. This joint relicensing procedure presents a
unique opportunity to consider potential hydropower reoperations to minimize the negative
effects on riverine ecology while maintaining many of the hydropower benefits. Using an
established optimization-based reservoir operations modeling tool, this research evaluates
potential hydropower system reoperations that will improve ecological health in the context of
returning the river to a less altered flow regime.
3 Background Researchers have created a substantial body of literature that addresses how to best quantify the
ecological impacts of human water use changes on the natural flow regime and determine the
management strategies necessary to support the natural needs of a river system (Petts 2007; Poff
et al. 2010; Richter et al. 2003). Numerous researchers suggest that river ecosystems are
healthiest in their most natural state, with natural flow serving as a master variable in the
ecological equation (Naiman et al. 2002; Poff et al. 1997). Under this framework, understanding
a river’s natural flow regime and attempting to return an altered flow regime to this state serves
as a means to specifically address potential for ecological reparations.
8
A river’s flow regime may be categorized by five characteristics: magnitude, frequency,
duration, timing, and rate of change in flows. While the features of a river’s natural flow regime
are site specific, ecosystem functions may include the mobilization of nutrient rich sediments
during high flow events and seasonally timed flow magnitudes which serve as environmental
cues in the life cycles of various species. Flow regime alterations from human water uses
generally degrade the river’s ability to provide these ecosystem functions (Postel and Carpenter
1997).
To describe the degree of flow regime alteration, river scientists quantify the differences between
a river’s natural state in comparison to its current state (Petts 2007). Richter (1996), together
with other researchers at The Nature Conservancy (TNC) developed and implemented 32 flow
metrics (termed the Indicators of Hydrologic Alteration (IHA)) to create a framework to quantify
the degree of river alteration in terms of the five major flow regime characteristics. These
metrics are applied across varied time scales to calculate the difference between altered and pre-
altered periods of record to identify the specific nature of a river’s hydrologic alteration.
The IHA framework contains metrics that are correlated, suggesting that a subset of
representative metrics may be more appropriate (Gao et al. 2009; Yang et al. 2008). Still, authors
of the IHA submit that the complete suite of metrics should be considered to preserve the quality
of information on the alterations to a river system. Regardless of these debates, there is an
important need to quantify specific hydrologic alterations in order to inform management
strategies.
Hydropower dam operations impose distinctive alterations to a river’s natural flow regime. They
often cause unnaturally large sub-daily variations in flow rates in response to quick, demand-
9
driven changes in energy pricing (Cushman 1985). Further, these variations can have antecedent
effects on water quality and temperature both in-reservoir and downstream (Caissie 2006).
Hydropeaking may also lead to the unnatural loss of water in the hyporheic zone during low flow
months (Yellen and Boutt 2015).
The rapid change in flows from a hydropower facility may be overlooked if viewed from a daily,
rather than hourly, perspective. For instance, analysis of daily mean flows may reveal
systematically lower weekend flows attributed to lower energy demand, but they may seriously
underestimate peak flow magnitudes and can ignore characteristic sub-daily variations. Given
that the IHA and other longstanding metrics were designed for the analysis of daily flow data,
new indices have been developed to assess sub-daily fluctuations in flow. These indices
generally compare the rate of change in flow at the finer 15-minute, or hourly time scale to the
total flow during the period of a day, allowing for a relative assessment of the sub-daily
alteration between different flow regimes.
Zimmerman et al. (2010) utilized four sub-daily flow metrics to demonstrate the range of
alterations observed at many gage sites along the Connecticut River. Analysis of these data
demonstrated that river reaches downstream of peaking hydropower facilities exhibit a
noticeably higher degree of sub-daily alteration than reaches subjected to run-of-river operations
or those that remain unregulated. Similar applications in both the United States and Europe have
demonstrated the value of quantifying alterations from hydropower operations on a sub-daily
time scale (Bevelhimer et al. 2015; Carolli et al. 2015).
While flow alteration caused by a hydropeaking flow regime may be quantified, understanding
ecological responses to these alterations poses a greater challenge. It is expected that alterations
10
on the sub-daily time scale may be of significant consequence to riverine ecosystems because
they induce conditions to which a wide range of species lack evolutionary adaptations (Cushman
1985). Case studies indicate that regulated sub-daily flow fluctuations may impact migration,
feeding ability, and spawning success of various fish (Barwick 1985; Carmichael et al. 1998;
Grabowski and Isely 2007). These are only a few general examples, and site-specific flow-
ecology relationships should be established to provide ecological value to flow management
decision-making. Though adverse effects may be well understood in a theoretical sense, the
development of explicit flow-ecology relationships directly relates reservoir operations to
adverse ecological responses, making them valuable river management decision-making tools
(Bevelhimer et al. 2015).
3.1 Managing Altered Streams for Ecological Improvement The need to manage the ecological health of river resources downstream of dams (including
hydropower) had originally been met with minimum release requirements (Petts 2009). This
approach has been criticized as a vestige of allocation protection in western water law, incapable
of representing the suite of environmental goals that contribute to river health (Stalnaker 1990).
Further, the author suggests a need for a more robust approach to environmental considerations,
in which scientists determine specific flow-ecology relationships to inform case-specific
environmental flow rules.
While ecological research is formulating a more complex consideration of specific flow regimes,
much of the environmental flow requirements in practice remain in the form of minimum flow
magnitudes (Arthington et al. 2006). There are numerous challenges in transforming a simple
minimum flow rule to a more prescriptive set of operational rules, including the fact that more
complex rules may be more operationally constraining for hydropower operators.
11
3.2 Developing a Comprehensive Assessment Framework Poff et al. (2010) suggests a synthesis of previously existing hydrologic and ecological
classification techniques to address more appropriate regulation of flow regimes (noted as the
Ecological Limits to Hydrologic Alteration (ELOHA)). Poff suggests that scientists and river
managers co-develop a hydrologic basis for river classification, define the river’s level of
alteration, and develop flow-ecology linkages that can inform environmental flow standards.
These environmental flow standards are applied along with flow-ecology monitoring to provide a
metric for the quality of restoration and to inform future changes in flow standards.
Whether ELOHA or another approach is applied, a comprehensive and iterative assessment of
impacts to flow regime and ecology serves as an “ideal approach” to guide ecological studies
performed for hydropower projects undergoing the FERC’s ILP. To be successful, these
processes should occur in an environment where the complex needs of all major stakeholders are
addressed, such that effective management strategies can be achieved. Various research explores
approaches for developing alternative flow management strategies and explicitly demonstrates or
cites the value that computer modeling contributes to these pursuits (Carolli et al. 2015; Homa et
al. 2005; Naiman et al. 2002; Petts 2009; Richter and Thomas 2007; Sale et al. 1982;
Steinschneider et al. 2014).
3.3 Exploring Reoperations To effectively develop operational guidelines, computer models offer the opportunity to explore
a wide range of alternatives and compare their ability to achieve specified objectives. A case
study of management on the Roanoke River demonstrates the effectiveness of such an approach,
showing that hydropower operators and ecological entities like TNC can co-produce shared goals
and create a solution that supports multiple needs (Pearsall et al. 2005). In this example, models
12
are used in the decision-making framework, allowing exploration of current and alternative
hydropower system operations.
In the context of water resources management, both simulation and optimization modeling tools
are common means of establishing an understanding of baseline operations and comparing these
to alternate scenarios. Optimization has a history of extensive application to evaluate operations
for reservoir systems (Labadie 2004; Vogel et al. 2007). Optimization provides a distinct
advantage by providing an efficient means to evaluate solutions from which one may be selected
to best achieve an operational objective or combination of multiple objectives (Steinschneider et
al. 2014). Since hydropower releases are often influenced by changing electricity demands and
pricing, optimization provides an opportunity to explicitly model this behavior (Barros et al.
2003).
3.4 Connection to Project In this research, an alternatives assessment tool was created to assess the impacts from
hydropower operations on the mainstem of the Connecticut River. The engine of this tool is a
linear program (LP) optimization model, denoted as the Connecticut River Hydropower
Operations Program (CHOP). Since the Connecticut River’s flow regime has been identified to
be significantly altered on the sub-daily time scale (Zimmerman et al. 2010), CHOP is
formulated to operate at an hourly time-step. Flow and historical energy pricing data are
provided in hourly increments to allow for the consideration of the impacts to the flow regime
caused by sub-daily hydropeaking. Efforts were made to effectively mimic actual operations to
the extent possible including both hydropeaking behavior historical rates of power generation. A
‘Baseline’ version of the model was then compared to an alternative operating scenario in which
mainstem reservoirs were operated under a modeled ‘Run-of-River’ condition. The two modeled
13
outcomes are compared in terms of estimated economic output and effects to flow regime on the
sub-daily time scale.
4 Study Area and Model
4.1 Connecticut River & FERC Study Area The Connecticut River basin is New England’s largest river system, with 38 major rivers
contributing a total of 11,985 square miles of drainage to the 410 river mile mainstem. Its
headwaters begin in Canada, draining through New Hampshire, a small portion of Maine,
Vermont, Massachusetts, and Connecticut, before ultimately discharging into the Long Island
Sound. With over 2,700 dams, the Connecticut River Basin has a history of flow regime
alteration dating back to logging during early settlement and later hydropower development
during New England’s industrial revolution (Clay and Nedeau 2006). After more than two
centuries of development, the river network now provides its residents with water supply, flood
control, recreation, and hydropower, resulting in flow alteration across various geographic and
temporal scales.
Having recognized the strong ecological impact of these flow alterations, TNC sponsored
research at the University of Massachusetts Amherst to develop and implement studies and
models to assess the potential for ecologically beneficial reoperations at the basin’s largest dams.
Previously, this work focused on modeling the basin’s 54 largest dams at a daily time-step and
demonstrated the potential for reoperations at the 14 United States Army Corps of Engineers
flood control facilities (Steinschneider et al. 2014). For this thesis, the optimization modeling
approach was re-scaled to an hourly time-step for five mainstem hydropower facilities. CHOP
includes the subsystem of the Connecticut River reservoir network currently undergoing FERC’s
joint relicensing procedure to evaluate alternative operations to the current hydropeaking system.
14
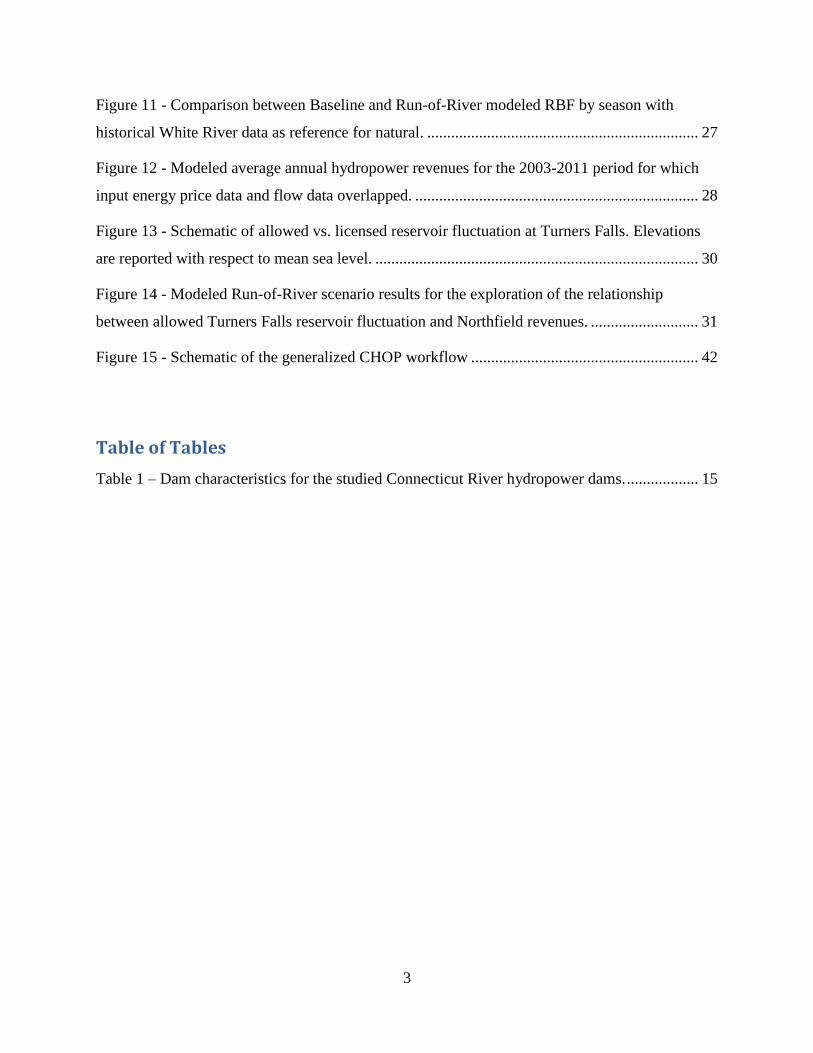
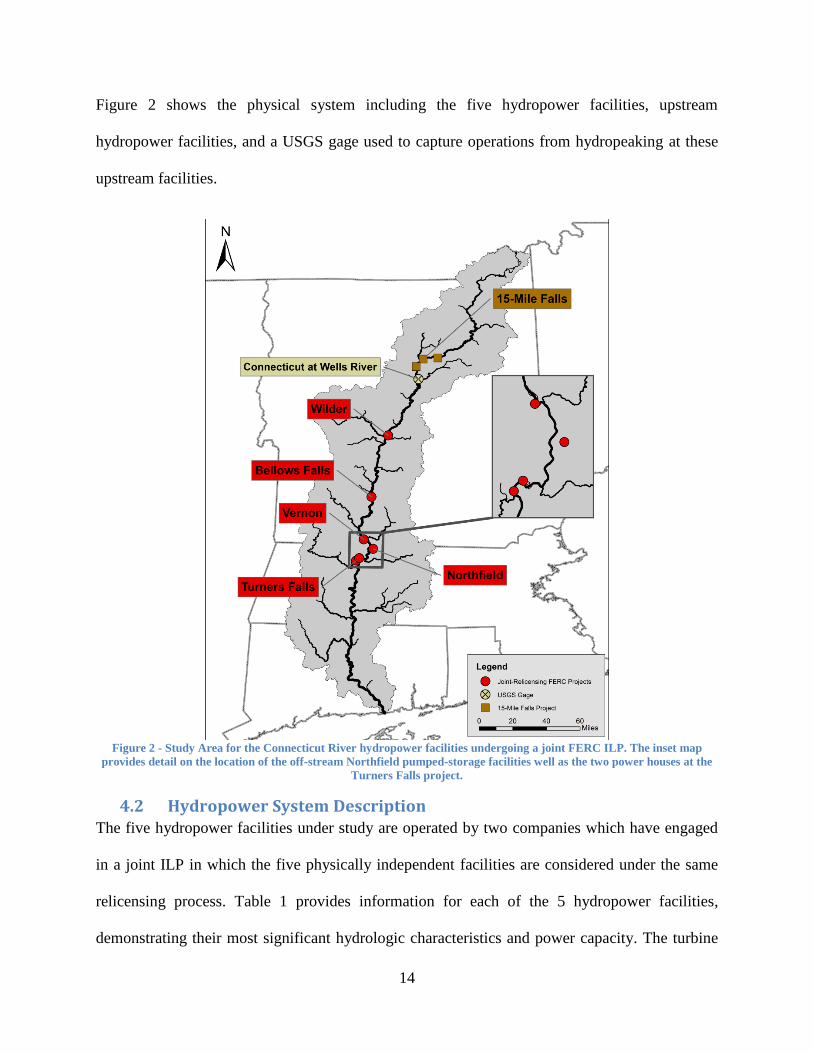
Figure 2 shows the physical system including the five hydropower facilities, upstream
hydropower facilities, and a USGS gage used to capture operations from hydropeaking at these
upstream facilities.
Figure 2 - Study Area for the Connecticut River hydropower facilities undergoing a joint FERC ILP. The inset map
provides detail on the location of the off-stream Northfield pumped-storage facilities well as the two power houses at the
Turners Falls project.
4.2 Hydropower System Description The five hydropower facilities under study are operated by two companies which have engaged
in a joint ILP in which the five physically independent facilities are considered under the same
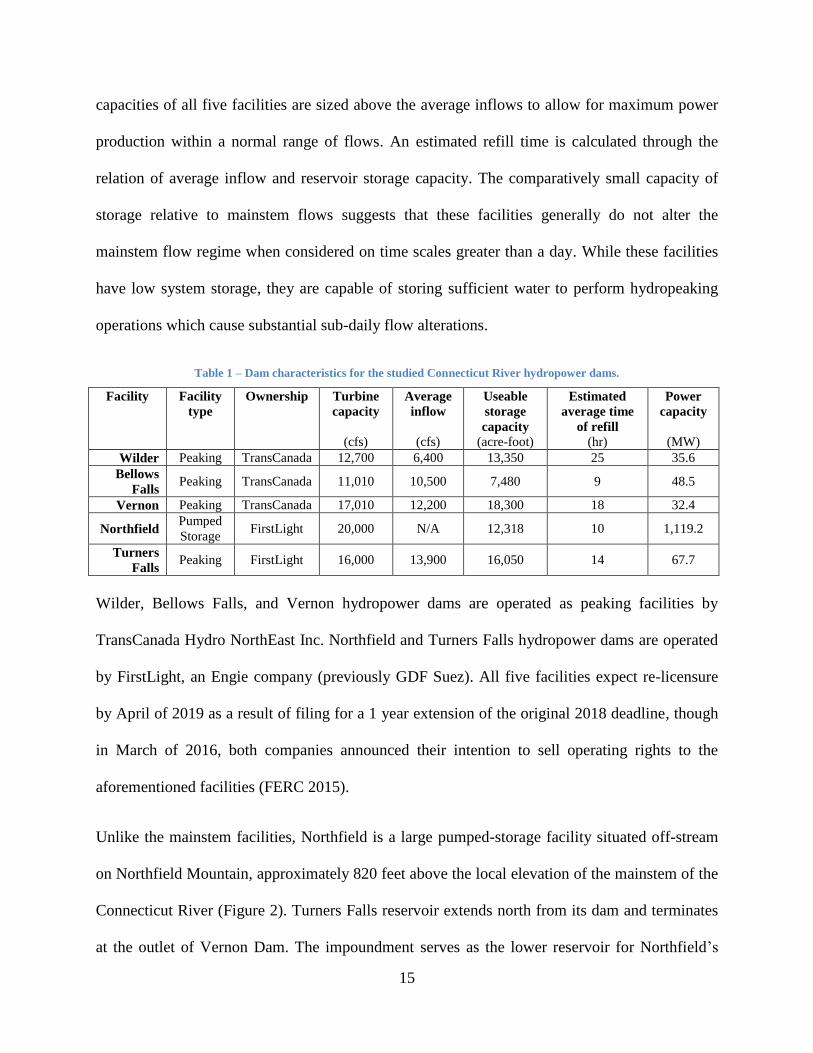
relicensing process. Table 1 provides information for each of the 5 hydropower facilities,
demonstrating their most significant hydrologic characteristics and power capacity. The turbine
15
capacities of all five facilities are sized above the average inflows to allow for maximum power
production within a normal range of flows. An estimated refill time is calculated through the
relation of average inflow and reservoir storage capacity. The comparatively small capacity of
storage relative to mainstem flows suggests that these facilities generally do not alter the
mainstem flow regime when considered on time scales greater than a day. While these facilities
have low system storage, they are capable of storing sufficient water to perform hydropeaking
operations which cause substantial sub-daily flow alterations.
Table 1 – Dam characteristics for the studied Connecticut River hydropower dams.
Facility Facility
type
Ownership Turbine
capacity
(cfs)
Average
inflow
(cfs)
Useable
storage
capacity
(acre-foot)
Estimated
average time
of refill
(hr)
Power
capacity
(MW)
Wilder Peaking TransCanada 12,700 6,400 13,350 25 35.6
Bellows
Falls Peaking TransCanada 11,010 10,500 7,480 9 48.5
Vernon Peaking TransCanada 17,010 12,200 18,300 18 32.4
Northfield Pumped
Storage FirstLight 20,000 N/A 12,318 10 1,119.2
Turners
Falls Peaking FirstLight 16,000 13,900 16,050 14 67.7
Wilder, Bellows Falls, and Vernon hydropower dams are operated as peaking facilities by
TransCanada Hydro NorthEast Inc. Northfield and Turners Falls hydropower dams are operated
by FirstLight, an Engie company (previously GDF Suez). All five facilities expect re-licensure
by April of 2019 as a result of filing for a 1 year extension of the original 2018 deadline, though
in March of 2016, both companies announced their intention to sell operating rights to the
aforementioned facilities (FERC 2015).
Unlike the mainstem facilities, Northfield is a large pumped-storage facility situated off-stream
on Northfield Mountain, approximately 820 feet above the local elevation of the mainstem of the
Connecticut River (Figure 2). Turners Falls reservoir extends north from its dam and terminates
at the outlet of Vernon Dam. The impoundment serves as the lower reservoir for Northfield’s
16
pumped-storage operations, with Northfield’s intake located directly west of the pumped-storage
facility’s mapped location. Where others only have one, the Turners Falls facility has two
powerhouses; the upstream Station No. 1 and downstream Cabot Station, with the power
capacities of 5.7 MW and 62 MW, respectively.
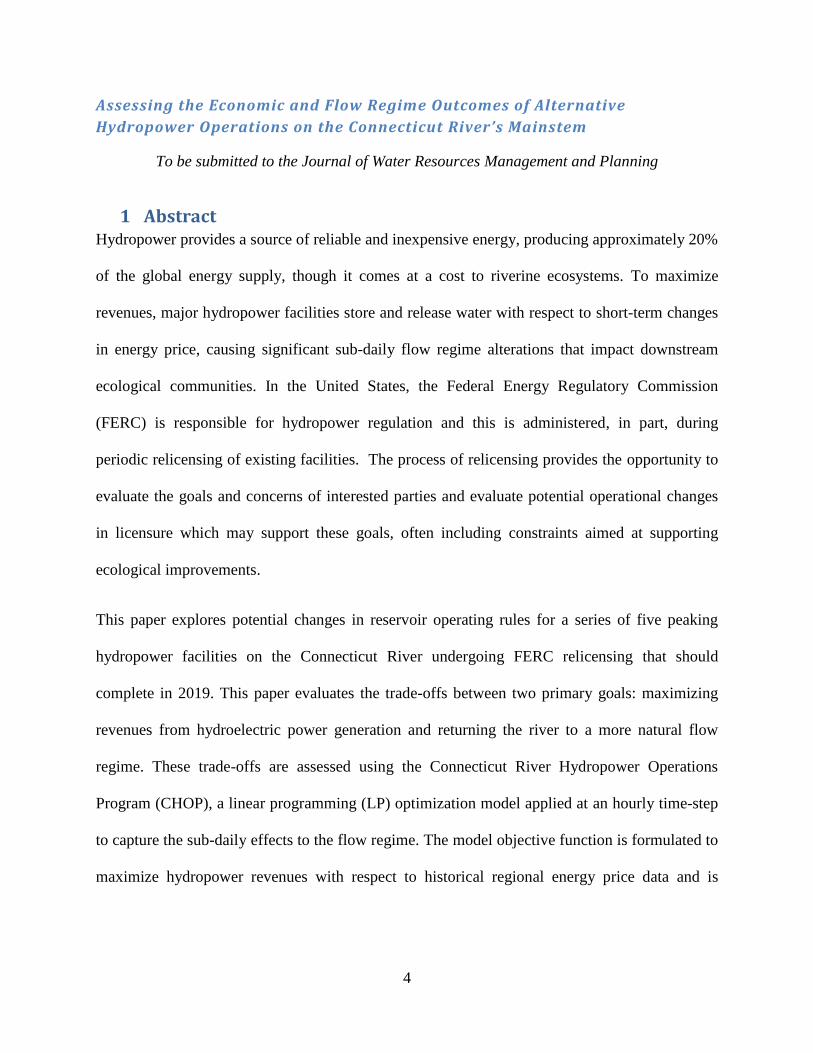
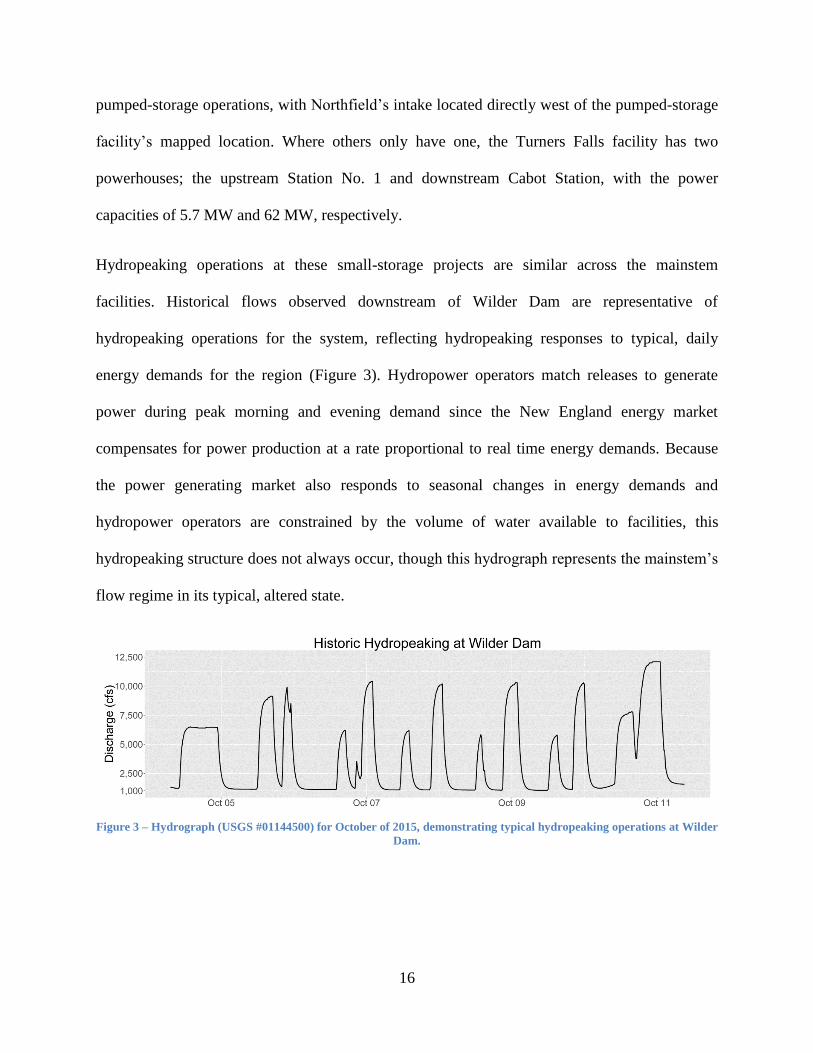
Hydropeaking operations at these small-storage projects are similar across the mainstem
facilities. Historical flows observed downstream of Wilder Dam are representative of
hydropeaking operations for the system, reflecting hydropeaking responses to typical, daily
energy demands for the region (Figure 3). Hydropower operators match releases to generate
power during peak morning and evening demand since the New England energy market
compensates for power production at a rate proportional to real time energy demands. Because
the power generating market also responds to seasonal changes in energy demands and
hydropower operators are constrained by the volume of water available to facilities, this
hydropeaking structure does not always occur, though this hydrograph represents the mainstem’s
flow regime in its typical, altered state.
Figure 3 – Hydrograph (USGS #01144500) for October of 2015, demonstrating typical hydropeaking operations at Wilder
Dam.
17
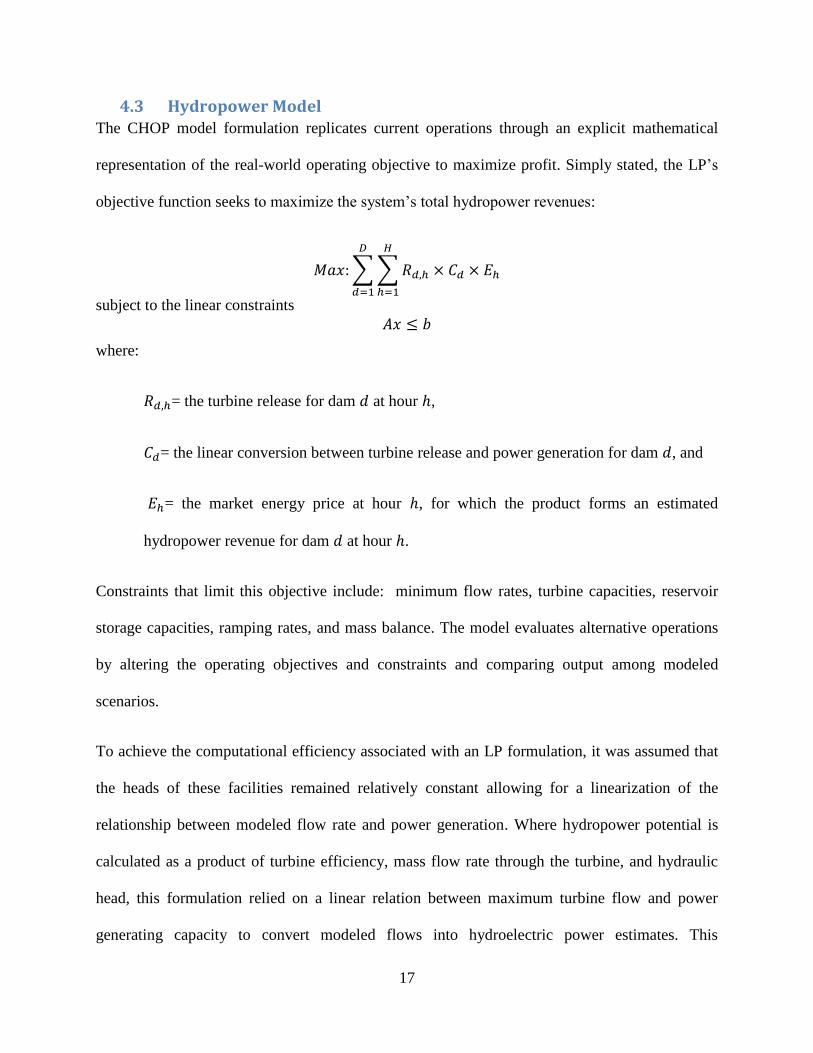
4.3 Hydropower Model The CHOP model formulation replicates current operations through an explicit mathematical
representation of the real-world operating objective to maximize profit. Simply stated, the LP’s
objective function seeks to maximize the system’s total hydropower revenues:
𝑀𝑎𝑥:∑∑𝑅𝑑,ℎ × 𝐶𝑑 × 𝐸ℎ
𝐻
ℎ=1
𝐷
𝑑=1
subject to the linear constraints
𝐴𝑥 ≤ 𝑏
where:
𝑅𝑑,ℎ= the turbine release for dam 𝑑 at hour ℎ,
𝐶𝑑= the linear conversion between turbine release and power generation for dam 𝑑, and
𝐸ℎ= the market energy price at hour ℎ, for which the product forms an estimated
hydropower revenue for dam 𝑑 at hour ℎ.
Constraints that limit this objective include: minimum flow rates, turbine capacities, reservoir
storage capacities, ramping rates, and mass balance. The model evaluates alternative operations
by altering the operating objectives and constraints and comparing output among modeled
scenarios.
To achieve the computational efficiency associated with an LP formulation, it was assumed that
the heads of these facilities remained relatively constant allowing for a linearization of the
relationship between modeled flow rate and power generation. Where hydropower potential is
calculated as a product of turbine efficiency, mass flow rate through the turbine, and hydraulic
head, this formulation relied on a linear relation between maximum turbine flow and power
generating capacity to convert modeled flows into hydroelectric power estimates. This
18
assumption was deemed acceptable following the fact that the possible range of hydraulic head is
relatively small (<10%) in comparison to the total operating head for each of these facilities. On
the mainstem, the largest range of operating head relative to net head is calculated as 7% at
Turners Falls where reservoir elevation may fluctuate as much as 4 feet with respect to its normal
operating head of 60 feet. The same calculation for Northfield shows that operating head may
vary by 62.5 feet, an 8% range of head with respect to its lowest operating head of 753 feet.
4.3.1 Model Inputs
Model inputs include hydrologic flow data for the basin and historical energy price data for the
Western Massachusetts region. The two datasets overlapped for the years 2003 – 2011, providing
9 years of hourly model data. To calculate the hydrologic inputs for the modeled hydropower
facilities, contributing flows were selected from a basin-wide dataset of estimated natural daily
flows calculated using the Connecticut River UnImpacted Streamflow Estimation (CRUISE) tool
developed by the United States Geological Survey (USGS) (Archfield et al. 2013). These flows
were disaggregated from the daily time-step to 24 hour increments using a simple smoothing
function to prevent discrete changes in flow at the daily scale.
Stakeholders in the modeling process were interested in ensuring that CHOP included
considerations of hydropeaking from upstream facilities which contribute to the mainstem flow
regime by operating upstream of Wilder. Since these facilities and their licensed operations are
outside the scope of the current FERC relicensing process, stakeholders identified the need to
consider how these upstream operations might continue to affect the downstream study area
during alternative operations of the modeled facilities. As a result, historical hourly flows from
the Connecticut River at Wells River USGS gage (01138500) were incorporated into the hourly
disaggregated CRUISE dataset, effectively capturing hydropeaking effects from the three
19
upstream facilities collectively termed the 15-Mile Falls project (Figure 2). Because of changes
to licensed operations at 15-Mile Falls in 2002, the modeled inflows were limited to the 2003-
2011 period where available CRUISE and USGS flow data overlapped and reflected recent 15-
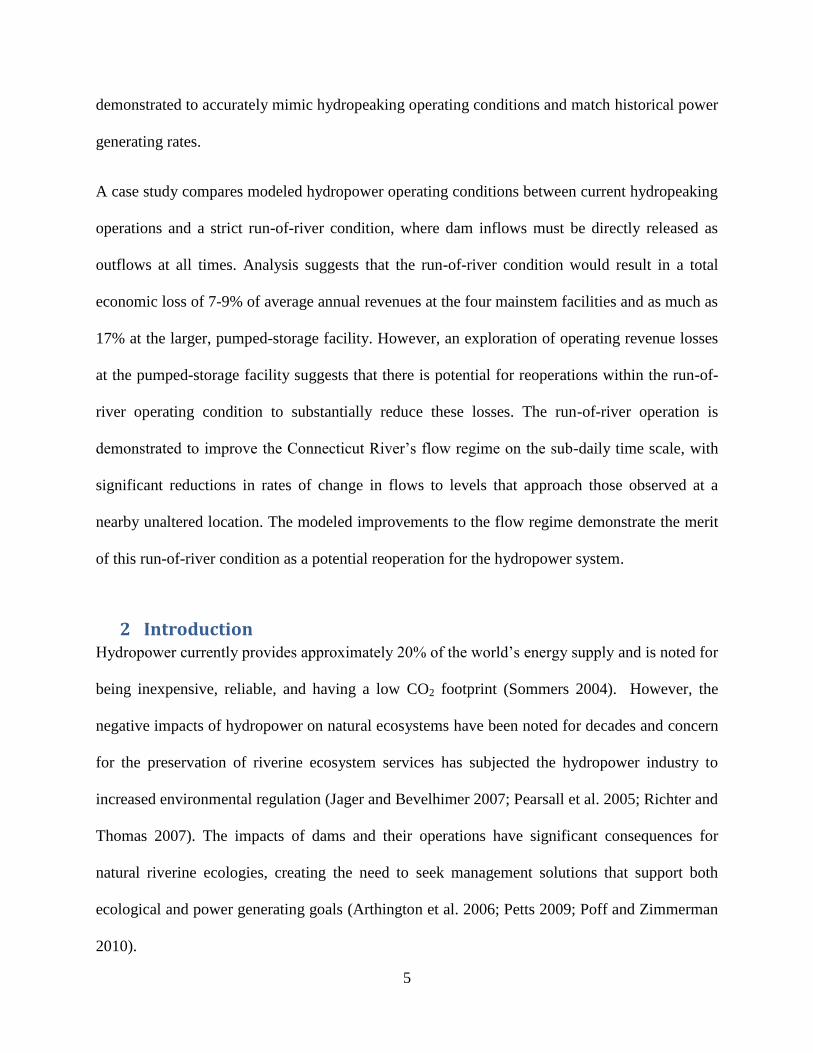
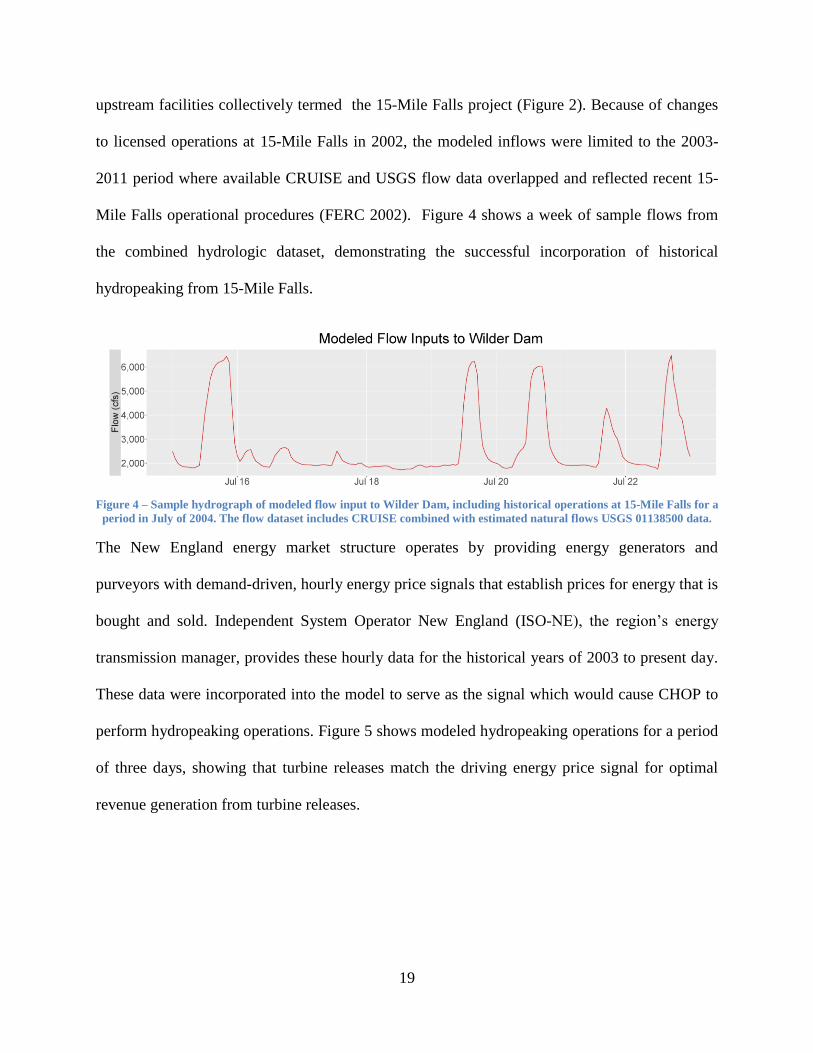
Mile Falls operational procedures (FERC 2002). Figure 4 shows a week of sample flows from
the combined hydrologic dataset, demonstrating the successful incorporation of historical
hydropeaking from 15-Mile Falls.
Figure 4 – Sample hydrograph of modeled flow input to Wilder Dam, including historical operations at 15-Mile Falls for a
period in July of 2004. The flow dataset includes CRUISE combined with estimated natural flows USGS 01138500 data.
The New England energy market structure operates by providing energy generators and
purveyors with demand-driven, hourly energy price signals that establish prices for energy that is
bought and sold. Independent System Operator New England (ISO-NE), the region’s energy
transmission manager, provides these hourly data for the historical years of 2003 to present day.
These data were incorporated into the model to serve as the signal which would cause CHOP to
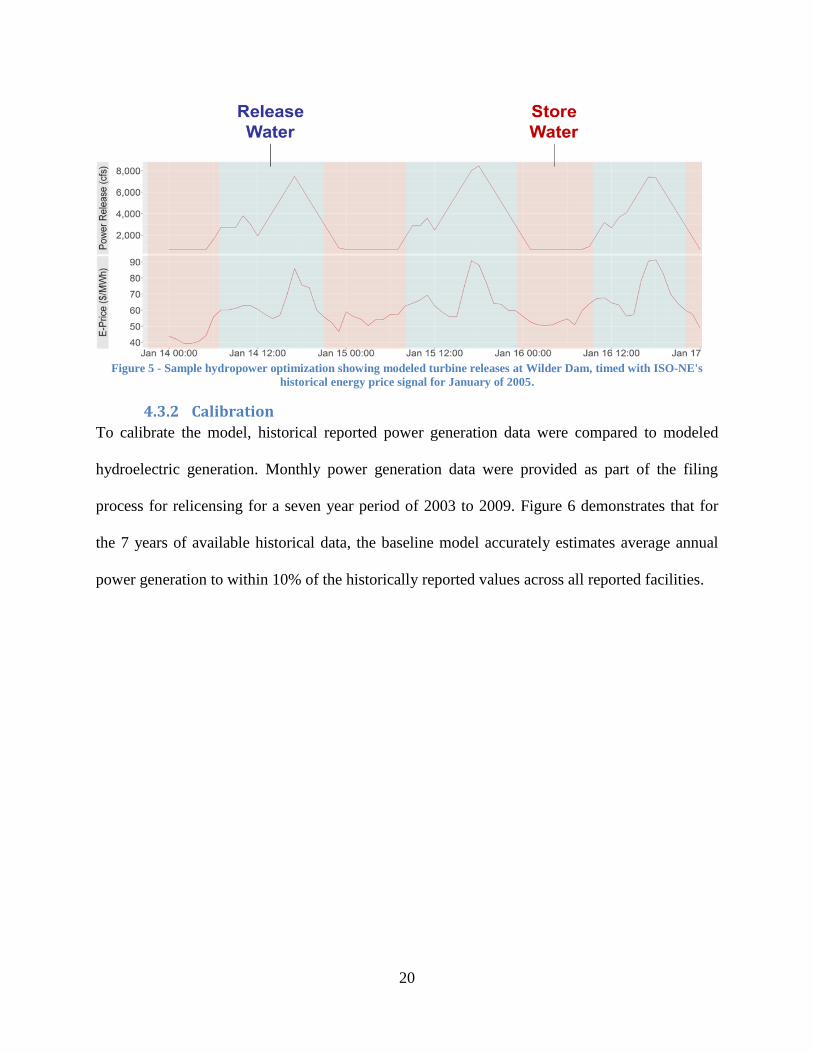
perform hydropeaking operations. Figure 5 shows modeled hydropeaking operations for a period
of three days, showing that turbine releases match the driving energy price signal for optimal
revenue generation from turbine releases.
20
Figure 5 - Sample hydropower optimization showing modeled turbine releases at Wilder Dam, timed with ISO-NE's
historical energy price signal for January of 2005.
4.3.2 Calibration
To calibrate the model, historical reported power generation data were compared to modeled
hydroelectric generation. Monthly power generation data were provided as part of the filing
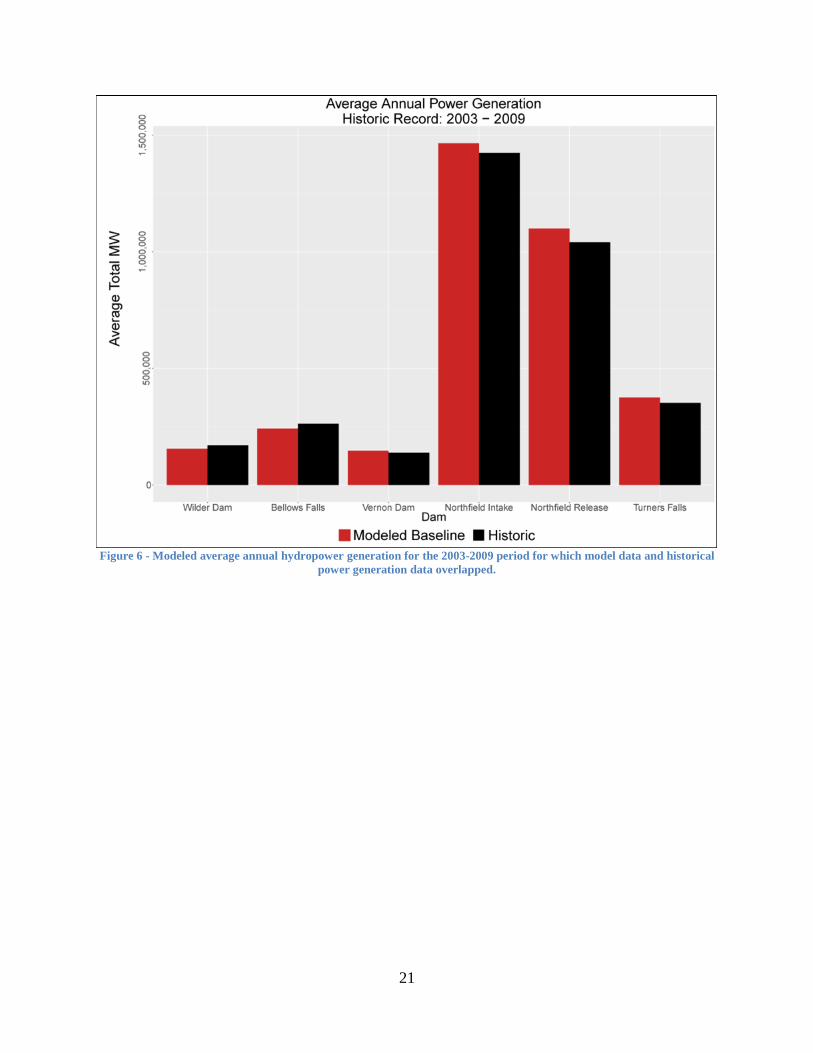
process for relicensing for a seven year period of 2003 to 2009. Figure 6 demonstrates that for
the 7 years of available historical data, the baseline model accurately estimates average annual
power generation to within 10% of the historically reported values across all reported facilities.
21
Figure 6 - Modeled average annual hydropower generation for the 2003-2009 period for which model data and historical
power generation data overlapped.
22
5 Case study: Evaluating the Impacts of a Run-of-River Operating
procedure
5.1 Run-of-River Condition Ecologically interested parties like TNC are actively pursuing means within the FERC
relicensing process to benefit the riverine ecosystems on the Connecticut River. Much of this
work focuses on identifying potential improvements to the flow regime by considering
alternative hydropower operations procedures. One consideration is an instantaneous run-of-river
flow requirement, where hydropower operators must ensure that operated releases equal inflows
at all times. This operational regime is of interest because it has the potential to mitigate
alterations to the sub-daily flow regime caused by hydropeaking while still allowing operators to
generate hydroelectric power.
Jager and Bevelhimer (2007) describe 38 hydropower facilities in the U.S. where this operational
change has been successfully implemented. While there are site-specific reasons for the adoption
of these reoperations, they generally seek to improve the ecological services provided by the
rivers, including those to populations of migrating fish and other aquatic biota. Jager et al.
suggest an estimated 3% loss of hydroelectric power generation across these facilities, though
this work neglects to consider how operational revenues have been affected. This is likely due to
the challenge of comparing these multiple hydropower facilities across their varied operational
conditions and energy markets, though a consideration of economic impact is a major component
of evaluating reoperations.
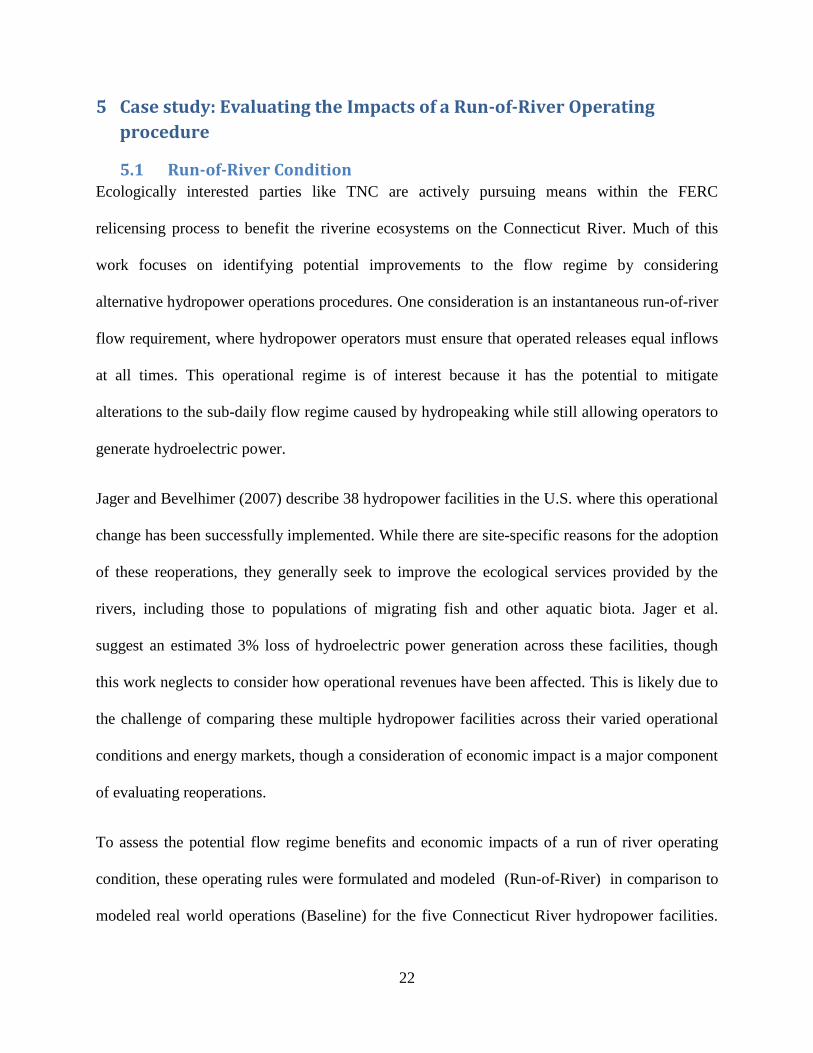
To assess the potential flow regime benefits and economic impacts of a run of river operating
condition, these operating rules were formulated and modeled (Run-of-River) in comparison to
modeled real world operations (Baseline) for the five Connecticut River hydropower facilities.
23
Figure 7 illustrates the functional differences between the two scenarios. The Baseline model is
formulated as the current physical system during real-world operations, allowing for
hydropeaking at all five facilities. The Run-of-River model forces inflows at mainstem facilities
to be equal to outflows during all time-steps, while allowing Northfield to perform normal
hydropeaking operations by drawing water from its lower Turners Falls reservoir. The Run-of-
River condition is achieved by constraints that require inflows to be equal to outflows at all
mainstem facilities during all time-steps.
Figure 7 - Hydropower optimization schematic for modeled Baseline and Run-of-River scenarios.
Since the three consecutive peaking facilities known as 15-Mile Falls are operated upstream of
this reservoir system (Figure 4), the Run-of-River condition only prevents local hydropeaking
operations, though peaks from upstream operations are attenuated by contributing inflows.
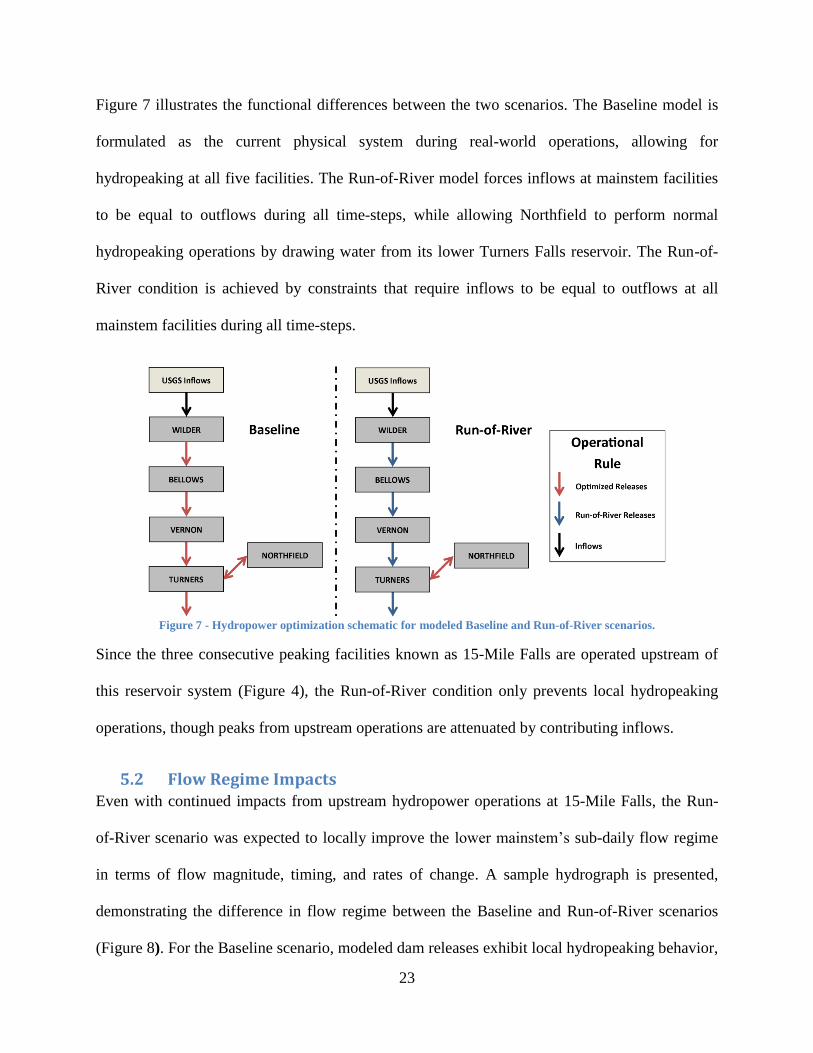
5.2 Flow Regime Impacts Even with continued impacts from upstream hydropower operations at 15-Mile Falls, the Run-
of-River scenario was expected to locally improve the lower mainstem’s sub-daily flow regime
in terms of flow magnitude, timing, and rates of change. A sample hydrograph is presented,
demonstrating the difference in flow regime between the Baseline and Run-of-River scenarios
(Figure 8). For the Baseline scenario, modeled dam releases exhibit local hydropeaking behavior,
24
while inflows are instantaneously released during the Run-of-River scenario. The peaks observed
in the Run-of-River hydrograph are from operations at the upstream 15-Mile Falls facilities,
demonstrating that the lower mainstem would remain impacted by hydropeaking, albeit at
attenuated magnitudes.
Figure 8 - Sample modeled hydrograph demonstrating a difference in flow regime between Baseline and Run-of-River
downstream of Turners Falls Dam.
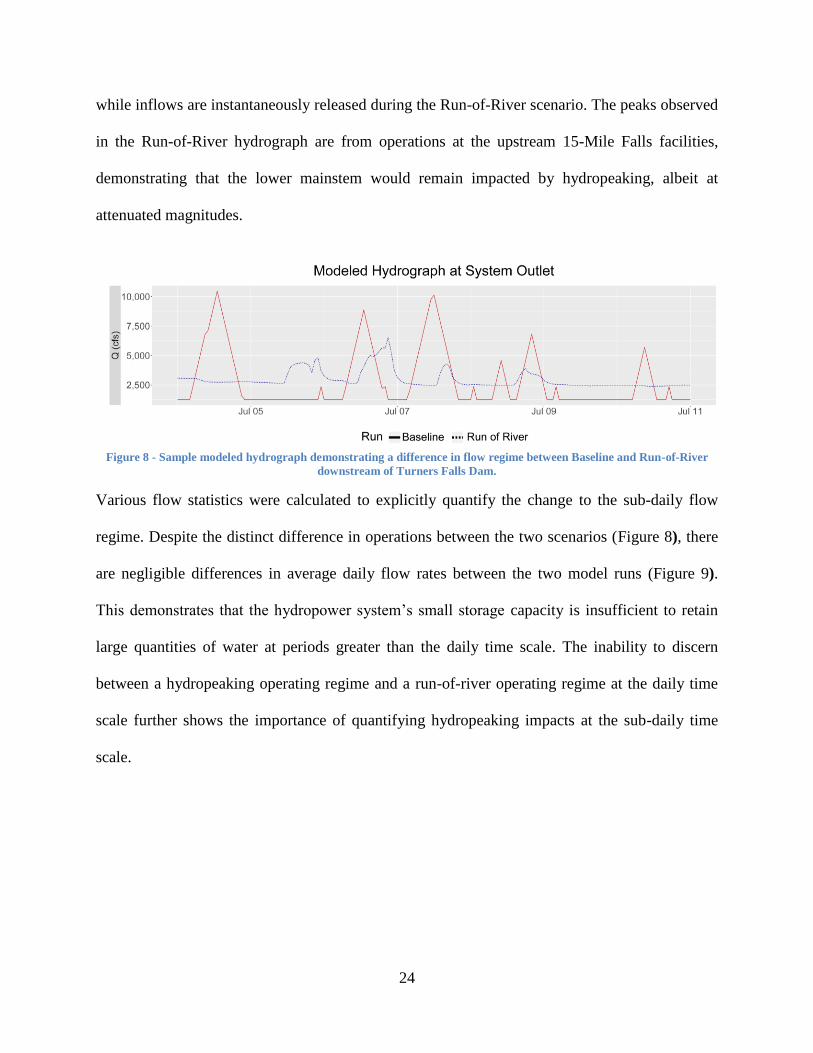
Various flow statistics were calculated to explicitly quantify the change to the sub-daily flow
regime. Despite the distinct difference in operations between the two scenarios (Figure 8), there
are negligible differences in average daily flow rates between the two model runs (Figure 9).
This demonstrates that the hydropower system’s small storage capacity is insufficient to retain
large quantities of water at periods greater than the daily time scale. The inability to discern
between a hydropeaking operating regime and a run-of-river operating regime at the daily time
scale further shows the importance of quantifying hydropeaking impacts at the sub-daily time
scale.
25
Figure 9 - Comparison between Baseline and Run-of-River modeled average flow rates by season.
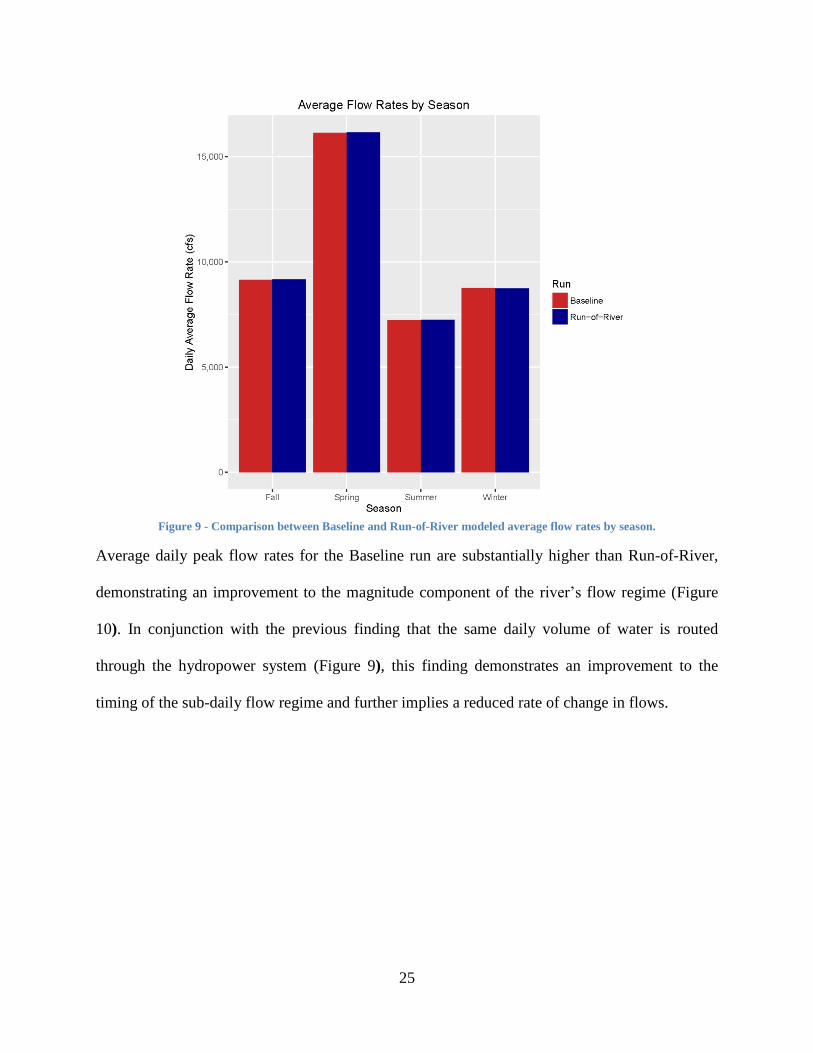
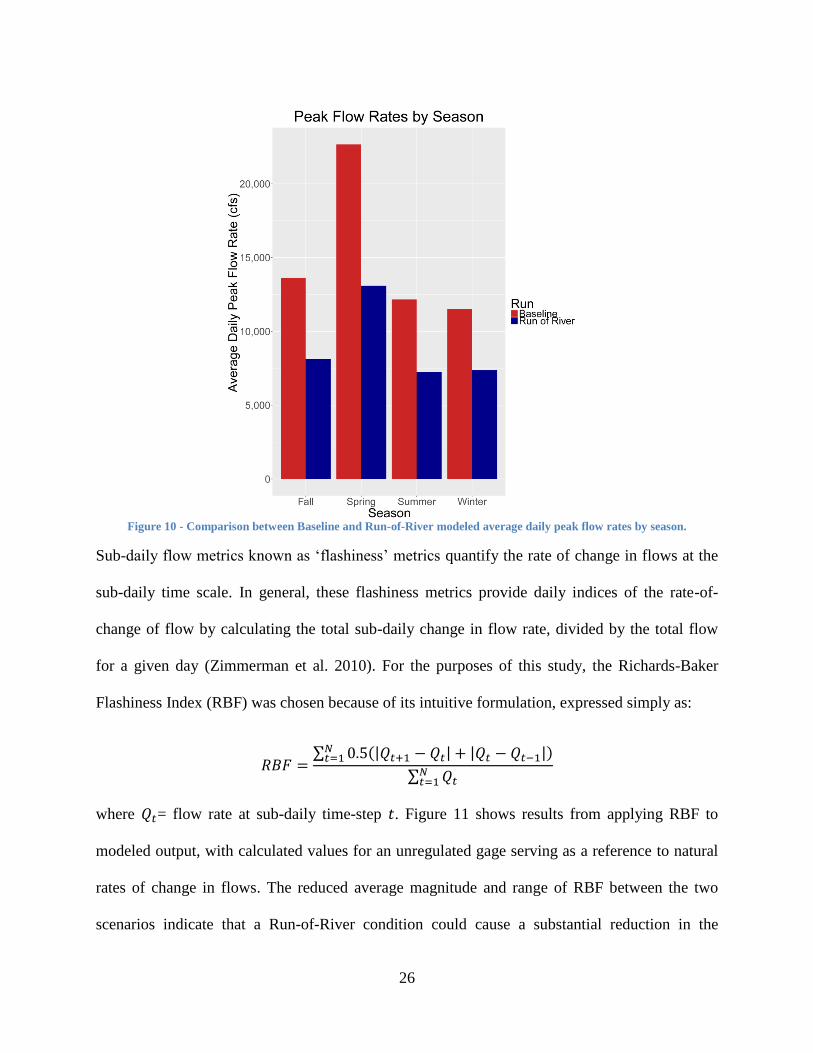
Average daily peak flow rates for the Baseline run are substantially higher than Run-of-River,
demonstrating an improvement to the magnitude component of the river’s flow regime (Figure
10). In conjunction with the previous finding that the same daily volume of water is routed
through the hydropower system (Figure 9), this finding demonstrates an improvement to the
timing of the sub-daily flow regime and further implies a reduced rate of change in flows.
26
Figure 10 - Comparison between Baseline and Run-of-River modeled average daily peak flow rates by season.
Sub-daily flow metrics known as ‘flashiness’ metrics quantify the rate of change in flows at the
sub-daily time scale. In general, these flashiness metrics provide daily indices of the rate-of-
change of flow by calculating the total sub-daily change in flow rate, divided by the total flow
for a given day (Zimmerman et al. 2010). For the purposes of this study, the Richards-Baker
Flashiness Index (RBF) was chosen because of its intuitive formulation, expressed simply as:
𝑅𝐵𝐹 =∑ 0.5(|𝑄𝑡+1 − 𝑄𝑡| + |𝑄𝑡 − 𝑄𝑡−1|)𝑁𝑡=1
∑ 𝑄𝑡𝑁𝑡=1
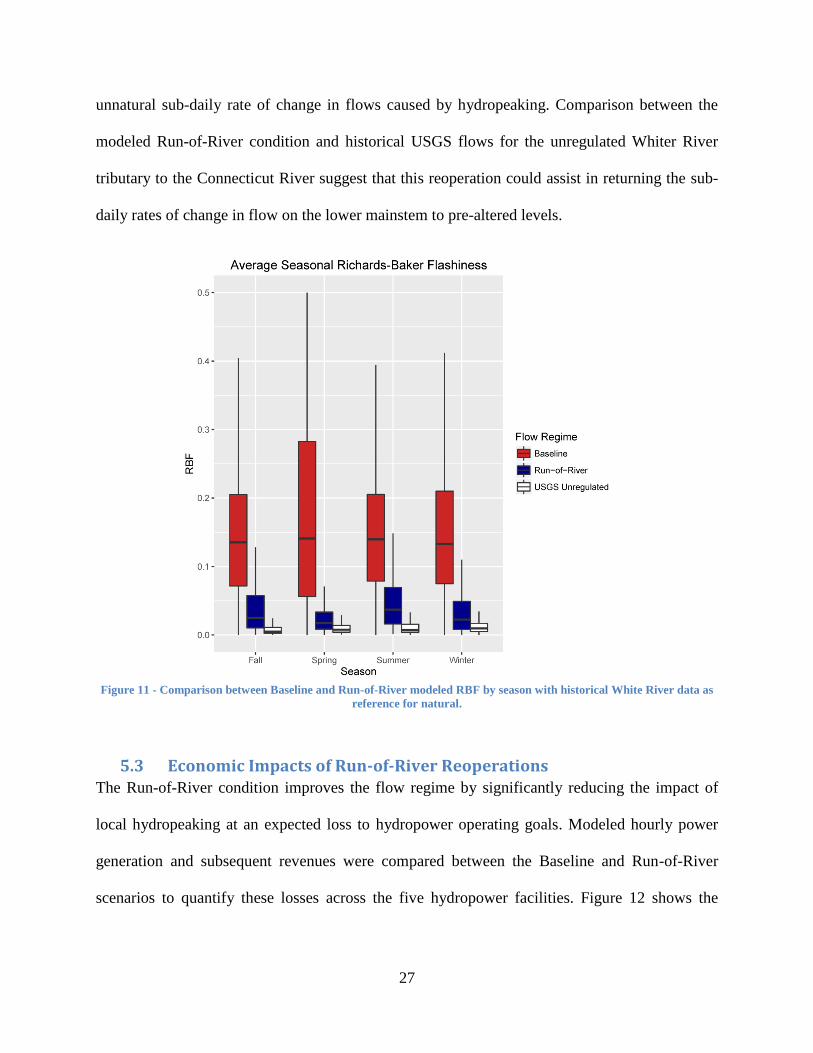
where 𝑄𝑡= flow rate at sub-daily time-step 𝑡. Figure 11 shows results from applying RBF to
modeled output, with calculated values for an unregulated gage serving as a reference to natural
rates of change in flows. The reduced average magnitude and range of RBF between the two
scenarios indicate that a Run-of-River condition could cause a substantial reduction in the
27
unnatural sub-daily rate of change in flows caused by hydropeaking. Comparison between the
modeled Run-of-River condition and historical USGS flows for the unregulated Whiter River
tributary to the Connecticut River suggest that this reoperation could assist in returning the sub-
daily rates of change in flow on the lower mainstem to pre-altered levels.
Figure 11 - Comparison between Baseline and Run-of-River modeled RBF by season with historical White River data as
reference for natural.
5.3 Economic Impacts of Run-of-River Reoperations The Run-of-River condition improves the flow regime by significantly reducing the impact of
local hydropeaking at an expected loss to hydropower operating goals. Modeled hourly power
generation and subsequent revenues were compared between the Baseline and Run-of-River
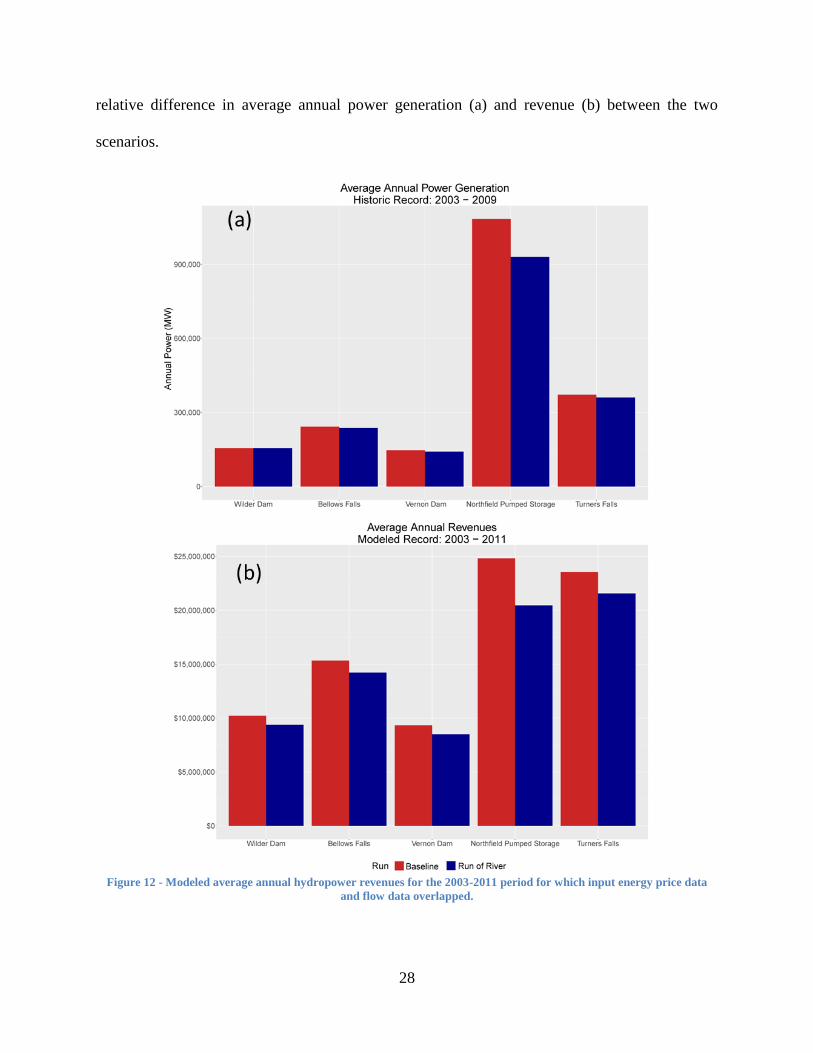
scenarios to quantify these losses across the five hydropower facilities. Figure 12 shows the
28
relative difference in average annual power generation (a) and revenue (b) between the two
scenarios.
Figure 12 - Modeled average annual hydropower revenues for the 2003-2011 period for which input energy price data
and flow data overlapped.
29
A comparison of power generation shows negligible change for the mainstem facilities, since the
same volume of water passes through the turbines at large enough time scales (Figure 3).
However, the Northfield pumped-storage facility does experience a loss in power generation due
to a limited supply of water under the Run-of-River condition. Northfield can only draw stored
water from the Turners Falls reservoir where the Baseline condition provides both stored water
and inflows from Vernon Dam.
A comparison of average annual revenues demonstrates economic losses to the system caused by
the Run of River scenario. For mainstem facilities, modeled revenue losses are within the range
of 7-9%, while Northfield experiences a 17% loss in annual revenues. These revenues can be
attributed to limits on available water to Northfield caused by the Run-of-River condition.
Northfield pumped-storage operates with the Turners Falls reservoir as its lower source. During
normal operations, Northfield may rely on both the storage capacity of Turners Falls and
upstream inflows to provide ample supply for its 12,318 acre-foot reservoir. However, the Run-
of-River condition forces the upstream inflows to be routed directly through Turners Falls,
leaving only the reservoir capacity for supply to Northfield. The Turners Falls reservoir is
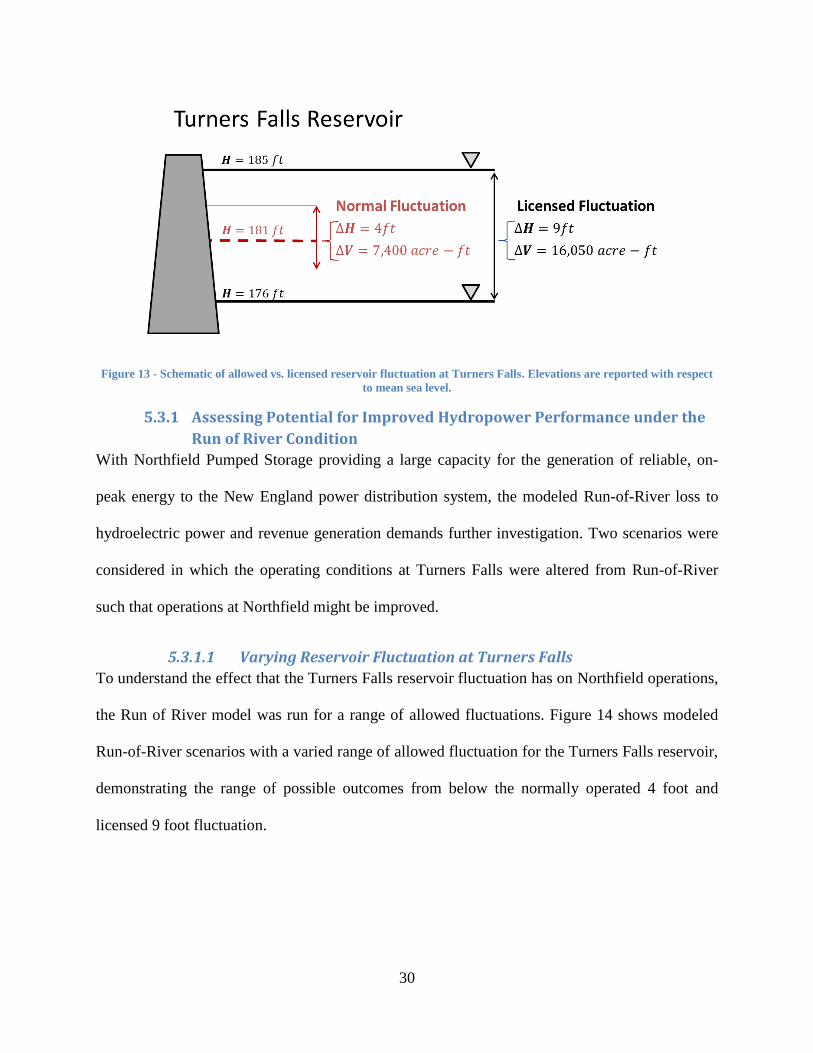
licensed for a 9 foot fluctuation though the reservoir rarely fluctuates more than 4 feet and is
modeled as such to correspond to real world operations Figure 13. With the lower reservoir
limited to a smaller storage capacity than the upper reservoir, the Run-of-River condition
effectively limits Northfield’s net storage capacity, thus limiting its power generating capacity.
30
Figure 13 - Schematic of allowed vs. licensed reservoir fluctuation at Turners Falls. Elevations are reported with respect
to mean sea level.
5.3.1 Assessing Potential for Improved Hydropower Performance under the
Run of River Condition
With Northfield Pumped Storage providing a large capacity for the generation of reliable, on-
peak energy to the New England power distribution system, the modeled Run-of-River loss to
hydroelectric power and revenue generation demands further investigation. Two scenarios were
considered in which the operating conditions at Turners Falls were altered from Run-of-River
such that operations at Northfield might be improved.
5.3.1.1 Varying Reservoir Fluctuation at Turners Falls
To understand the effect that the Turners Falls reservoir fluctuation has on Northfield operations,
the Run of River model was run for a range of allowed fluctuations. Figure 14 shows modeled
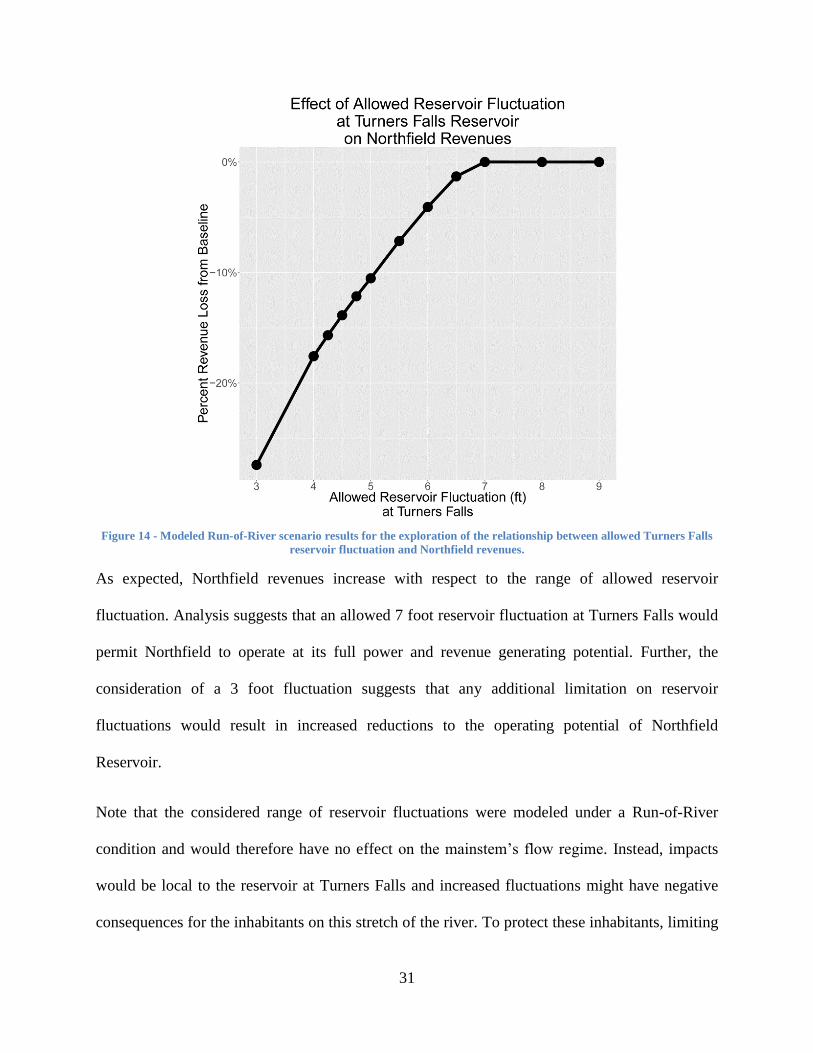
Run-of-River scenarios with a varied range of allowed fluctuation for the Turners Falls reservoir,
demonstrating the range of possible outcomes from below the normally operated 4 foot and
licensed 9 foot fluctuation.
31
Figure 14 - Modeled Run-of-River scenario results for the exploration of the relationship between allowed Turners Falls
reservoir fluctuation and Northfield revenues.
As expected, Northfield revenues increase with respect to the range of allowed reservoir
fluctuation. Analysis suggests that an allowed 7 foot reservoir fluctuation at Turners Falls would
permit Northfield to operate at its full power and revenue generating potential. Further, the
consideration of a 3 foot fluctuation suggests that any additional limitation on reservoir
fluctuations would result in increased reductions to the operating potential of Northfield
Reservoir.
Note that the considered range of reservoir fluctuations were modeled under a Run-of-River
condition and would therefore have no effect on the mainstem’s flow regime. Instead, impacts
would be local to the reservoir at Turners Falls and increased fluctuations might have negative
consequences for the inhabitants on this stretch of the river. To protect these inhabitants, limiting
32
the Turners Falls fluctuation to no more than the current 4 foot fluctuation may be in the best
interest of the local ecology. A Run-of-River condition that allows larger reservoir fluctuations at
Turners Falls could minimize negative impacts to hydropower operators and the New England
energy market while still improving the sub-daily flow regime on the Connecticut River’s
mainstem. If operators were to consider a Run-of-River condition, the outlined economic
relationship may support some compromise between the currently licensed 9 foot fluctuation and
the targeted 4 foot fluctuation.
5.3.1.2 Allowing Inflow Storage at Turners Falls
As an alternative to increasing the allowed reservoir fluctuations at Turners Falls, an alteration to
the modeled Run of River condition was considered for Turners Falls. Where the original Run of
River condition forces all inflows to be discharged through Turners Falls, a percentage of
upstream inflows is allowed to be stored at the Turners Falls dam during this scenario,
effectively increasing the available water for Northfield operations. Figure 15 shows the modeled
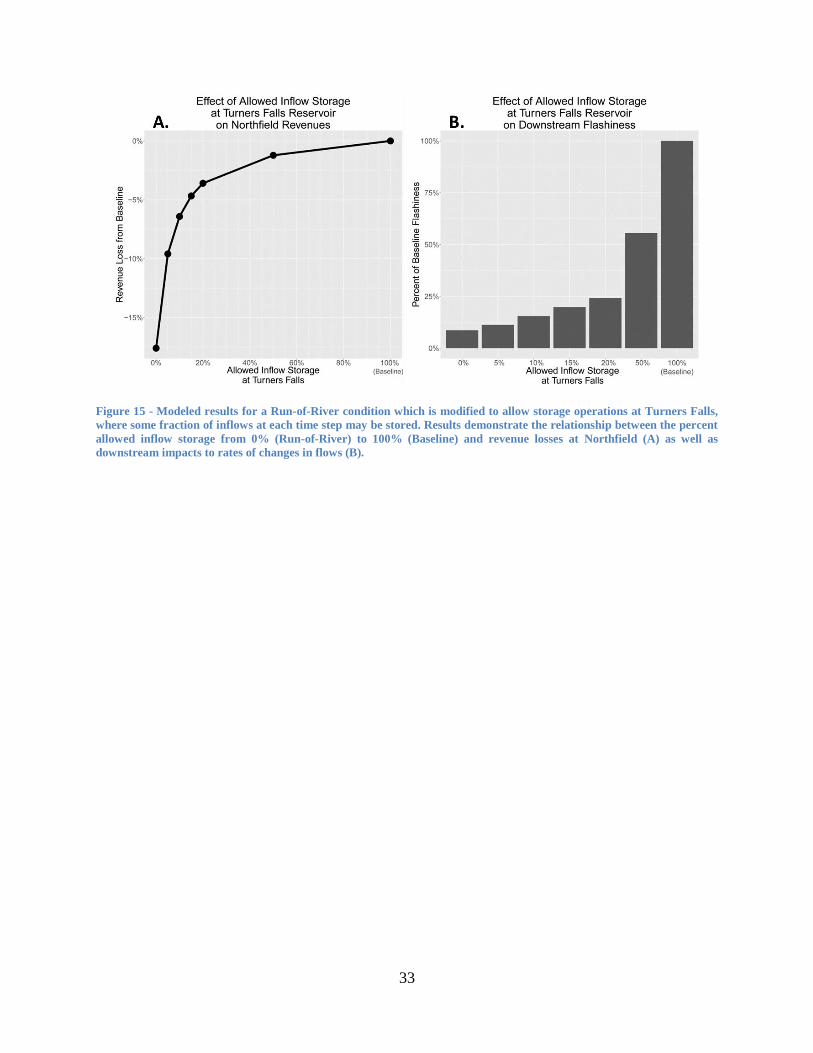
results from varying the amount of allowed inflow storage at Turners Falls. Figure 15 A shows
the relationship between the amount of allowed inflow storage at each time step and average
annual revenue losses at Northfield in comparison to revenues from the Baseline model run. At
15% allowed inflow storage, revenue loss is shown to be below 5% of Baseline, down from 17%
under the original Run of River condition. Figure 15 B demonstrates the impact that this change
in operations could have on downstream rates of change in flows. Under the same 15% allowed
inflow storage condition, the average downstream flashiness is shown to be less than 20% of the
Baseline scenario. This alternative demonstrates a marked improvement in flow regime and,
though it is lesser than that observed during the original Run-of-River condition, it demonstrates
potential for reoperations which continue to improve the river’s flow regime while working to
minimize losses to hydropower operators.
33
Figure 15 - Modeled results for a Run-of-River condition which is modified to allow storage operations at Turners Falls,
where some fraction of inflows at each time step may be stored. Results demonstrate the relationship between the percent
allowed inflow storage from 0% (Run-of-River) to 100% (Baseline) and revenue losses at Northfield (A) as well as
downstream impacts to rates of changes in flows (B).
34
6 Discussion and Conclusions This research demonstrates the successful implementation of CHOP, a reservoir operations
model which serves as an alternatives assessment tool used to evaluate the potential flow regime
and economic impacts to hydropower reoperations on the Connecticut River’s mainstem. It is
important to note the limitations of the CHOP formulation to inform the quality of modeled
output as decision support data. The model contains the assumption of a linear relationship
between modeled turbine releases and hydroelectric power generation. This assumption provides
a significant computational advantage over nonlinear alternatives and appears reasonable given
the small range of head fluctuations at these facilities.
Further, the model contains the assumption of constant efficiency across a range of head and
flows. It is known that power production efficiency is affected by the specific physical
characteristics of independently operating turbines. To maintain a LP formulation, the model
considers the bulk generating capacity at each hydropower facility and while this approach
neglects specific turbine efficiencies, it allows for an effective, systems-scale consideration of
hydropower operations.
Finally, the model is only capable of calculating the revenues generated by producing and selling
power in regional energy markets. It is known that these hydropower facilities also engage in
other energy markets, like the forward capacity market, where operators are paid to guarantee
their facility’s power generating capacity three years in advance. The capability to understand
the impacts that system reoperations may have on the ability of these facilities to compete and
generate revenue in these forward markets is beyond the scope of this model.
Despite these limitations, CHOP provides a framework to provide meaningful relative
comparisons between various hydropower operational schemes in the absence of better
35
information. The ability to consider relative trade-offs in both economic output and flow regime,
makes the model a useful tool in an arena where these considerations represent some of the
major, and potentially conflicting, goals of operators and other stakeholders.
In this case study, CHOP demonstrates an instantaneous run-of-river scenario for mainstem
hydropower facilities as a reoperation which indicates substantial improvements to the flow
regime on the Connecticut River’s mainstem at a cost to hydropower operating goals. This
improvement comes at a loss to hydropower operating objectives because it redistributes
hydropower releases over the course of the day, leading to the loss of optimal revenue generation
attained through hydropeaking. For mainstem facilities, these modeled economic losses are
within the range of 7-9% of average annual revenues, while Northfield is modeled to experience
losses of 17%. Though, further modeling suggests that there is potential for improved operational
performance at Northfield under scenarios which continue to improve the mainstem flow regime.
Modeled results indicate that the application of a strict run-of-river condition applied to
mainstem peaking facilities could improve the flow regime by reducing unnatural sub-daily
impacts to the magnitude, timing, and rates of change in flows on the mainstem. Ecologically
interested parties have the expectation that riverine ecologies will experience substantial
ecological benefits from a more natural flow regime. While this expectation has a strong
theoretical basis, it lacks the same tangibility afforded by the comparison of economic outcomes.
While the development of case-specific flow-ecology relationships is indeed a challenging task,
these or other means to provide linkages between modeled flow regime improvements and
positive species responses to these improvements could help to bolster the value of the modeled
run-of-river scenario and other alternative operations.

36
Future work will involve the application of CHOP to various other alternative hydropower
operations scenarios which may demonstrate other means of improving the ecological viability
of the Connecticut River’s flow regime and attempt to incorporate useful findings from
ecological studies performed as part of the FERC relicensing process. Future modeling efforts
will also focus on improving the resolution of the modeled reservoir system such that the two
power stations at the Turners Falls facility and other unique components might be discretely
modeled in hopes of assessing more localized impacts of hydropower operation.
37
References
Archfield, S. A., Steeves, P. A., Guthrie, J. D., Ries III, K. G. (2013). "Towards a Publicly
Available, Map-Based Regional Software Tool to Estimate Unregulated Daily Streamflow at
Ungauged Rivers." Geoscientific Model Development, 6(1), 101-115.
Arthington, A. H., Bunn, S. E., Poff, N. L., Naiman, R. J. (2006). "The Challenge of Providing
Environmental Flow Rules to Sustain River Ecosystems." Ecol. Appl., 16(4), 1311-1318.
Barros, M., Tsai, F., Yang, S., Lopes, J., Yeh, W. (2003). "Optimization of Large-Scale
Hydropower System Operations." J. Water Resour. Plann. Manage., 129(3), 178-188.
Barwick, D. (1985). "Food and Feeding of Fish in Hartwell Reservoir Tailwater, Georgia-South
Carolina." Proc. Annu. Conf. SEAFWA, 39, 185-193.
Bevelhimer, M. S., McManamay, R. A., O'Connor, B. (2015). "Characterizing Sub-Daily Flow
Regimes: Implications of Hydrologic Resolution on Ecohydrology Studies." River Research and
Applications, 31(7), 867-879.
Caissie, D. (2006). "The Thermal Regime of Rivers: A Review." Freshwat. Biol., 51(8), 1389-
1406.
Carmichael, J. T., Haeseker, S. L., Hightower, J. E. (1998). "Spawning Migration of Telemetered
Striped Bass in the Roanoke River, North Carolina." Trans. Am. Fish. Soc., 127(2), 286-297.
Carolli, M., Vanzo, D., Siviglia, A., Zolezzi, G., Bruno, M. C., Alfredsen, K. (2015). "A Simple
Procedure for the Assessment of Hydropeaking Flow Alterations Applied to several European
Streams." Aquat. Sci., 77(4), 639-653.
38
Clay, C., and Nedeau, E. (2006). "The Connecticut River Watershed: Conserving the Heart of
New England." The Trust for Public Land, .
Cushman, R. M. (1985). "Review of Ecological Effects of Rapidly Varying Flows Downstream
from Hydroelectric Facilities." N. Am. J. Fish. Manage., 5(3), 330-339.
FERC. (2015). "Order Amending Licenses; TransCanada; Project Nos.1855-048, 1892-028,
1904-076." 152 Ferc ¶ 62,048, .
FERC. (2002). "ORDER ISSUING NEW LICENSE (MAJOR PROJECT); USGen New
England, Inc.; Project no. 2077-016." 99 Ferc ¶ 62, 025, .
Gao, Y., Vogel, R. M., Kroll, C. N., Poff, N. L., Olden, J. D. (2009). "Development of
Representative Indicators of Hydrologic Alteration." Journal of Hydrology, 374(1–2), 136-147.
Grabowski, T. B., and Isely, J. J. (2007). "Effects of Flow Fluctuations on the Spawning Habitat
of a Riverine Fish." Southeastern Naturalist, 6(3), 471-478.
Homa, E., Vogel, R., Smith, M., Apse, C., Huber-Lee, A., Sieber, J. (2005). "An optimization
approach for balancing human and ecological flow needs." Proc., Proceedings of the EWRI 2005
World Water and Environmental Resources Congress, .
Jager, H. I., and Bevelhimer, M. S. (2007). "How Run-of-River Operation Affects Hydropower
Generation and Value." Environ. Manage., 40(6), 1004-1015.
Labadie, J. (2004). "Optimal Operation of Multireservoir Systems: State-of-the-Art Review." J.
Water Resour. Plann. Manage., 130(2), 93-111.
39
LINDO Systems, I. (2010). LINGO 14.0 User's Guide, Chicago, LINDO Systems, Inc., 1415
North Dayton Street; Chicago, IL 60642.
Naiman, R., Bunn, S., Nilsson, C., Petts, G., Pinay, G., Thompson, L. (2002). "Legitimizing
Fluvial Ecosystems as Users of Water: An Overview." Environ. Manage., 30(4), 455-467.
Pearsall, S. H., McCrodden, B. J., Townsend, P. A. (2005). "Adaptive Management of Flows in
the Lower Roanoke River, North Carolina, USA." Environ. Manage., 35(4), 353-367.
Petts, G. E. (2009). Instream Flow Science for Sustainable River Management1, .
Petts, G. E. (2007). Hydroecology: The Scientific Basis for Water Resources Management and
River Regulation, John Wiley and Sons: Hoboken, NJ, .
Poff, N. L., Richter, B. D., Arthington, A. H., Bunn, S. E., Naiman, R. J., Kendy, E., Acreman,
M., APSE, C., Bledsoe, B. P., Freeman, M. C., Henriksen, J., Jacobson, R. B., Kennen, J. G.,
Merritt, D. M., O’Keefe, J. H., Olden, J. D., Rogers, K., Tharme, R. E., Warner, A. (2010). "The
Ecological Limits of Hydrologic Alteration (ELOHA): A New Framework for Developing
Regional Environmental Flow Standards." Freshwat. Biol., 55(1), 147-170.
Poff, N. L., and Zimmerman, J. K. H. (2010). "Ecological Responses to Altered Flow Regimes:
A Literature Review to Inform the Science and Management of Environmental Flows."
Freshwat. Biol., 55(1), 194-205.
Poff, N. L., Allan, J. D., Bain, M. B., Karr, J. R., Prestegaard, K. L., Richter, B. D., Sparks, R.
E., Stromberg, J. C. (1997). "The Natural Flow Regime." Bioscience, 47(11), pp. 769-784.
40
Postel, S., and Carpenter, S. (1997). "Freshwater Ecosystem Services." Nature's Services:
Societal Dependence on Natural Ecosystems. Island Press, Washington, D.C., 195-214.
Richter, B. D., and Thomas, G. A. (2007). "Restoring Environmental Flows by Modifying Dam
Operations." Ecology and Society, 12(1), 12.
Richter, B. D., Mathews, R., Harrison, D. L., Wigington, R. (2003). "Ecologically Sustainable
Water Management: Managing River Flows for Ecological Integrity." Ecol. Appl., 13(1), 206-
224.
Richter, B. D., Baumgartner, J. V., Powell, J., Braun, D. P. (1996). "A Method for Assessing
Hydrologic Alteration within Ecosystems; Un Métro Para Evaluar Alteraciones Hidrológicas
Dentro De Ecosistemas." Conserv. Biol., 10(4), 1163-1174.
Sale, M. J., Brill, E. D., Herricks, E. E. (1982). "An Approach to Optimizing Reservoir
Operation for Downstream Aquatic Resources." Water Resour. Res., 18(4), 705-712.
Sommers, G. L. (2004). "Hydropower Resources." Encyclopedia of Energy, Elsevier, New York,
325-332.
Stalnaker, C. (1990). "Minimum Flow is a Myth." Bain MB, 90(5), 31-33.
Steinschneider, S., Bernstein, A., Palmer, R., Polebitski, A. (2014). "Reservoir Management
Optimization for Basin-Wide Ecological Restoration in the Connecticut River." J. Water Resour.
Plann. Manage., 140(9), 04014023.
41
Viers, J. H. (2011). "Hydropower Relicensing and Climate Change1." JAWRA Journal of the
American Water Resources Association, 47(4), 655-661.
Vogel, R. M., Sieber, J., Archfield, S. A., Smith, M. P., Apse, C. D., Huber-Lee, A. (2007).
"Relations among Storage, Yield, and Instream Flow." Water Resour. Res., 43(5), n/a-n/a.
Yang, Y. E., Cai, X., Herricks, E. E. (2008). "Identification of Hydrologic Indicators Related to
Fish Diversity and Abundance: A Data Mining Approach for Fish Community Analysis." Water
Resour. Res., 44(4), n/a-n/a.
Yellen, B., and Boutt, D. F. (2015). "Hydropeaking Induces Losses from a River Reach:
Observations at Multiple Spatial Scales." Hydrol. Process., 29(15), 3261-3275.
Zimmerman, J. K. H., Letcher, B. H., Nislow, K. H., Lutz, K. A., Magilligan, F. J. (2010).
"Determining the Effects of Dams on Subdaily Variation in River Flows at a Whole-Basin
Scale." River Research and Applications, 26(10), 1246-1260.
42
Appendix A: CHOP model formulation & parameterization The Connecticut River Hydropower Operations Program (CHOP) is formulated in the
proprietary LINGOTM
optimization software environment. LINGOTM
provides a modeling
environment where optimization problems are intuitively formulated using the software’s set-
based modeling language and solved using the software’s suite of linear, binary, and nonlinear
optimization algorithms (LINDO Systems 2010). The CHOP model uses the simplex-based
solver to solve the linear program (LP) hydropower optimization formulation and takes
advantage of LINGO’sTM
interactive data management capabilities to import modeled input data
from a Visual Basic for Applications (VBA) enabled Microsoft Excel workbook. The following
sections explain the CHOP modeling environment, the components of the LP formulation, the
scripts used to model the Baseline and Run-of-River scenarios, and important model parameters.
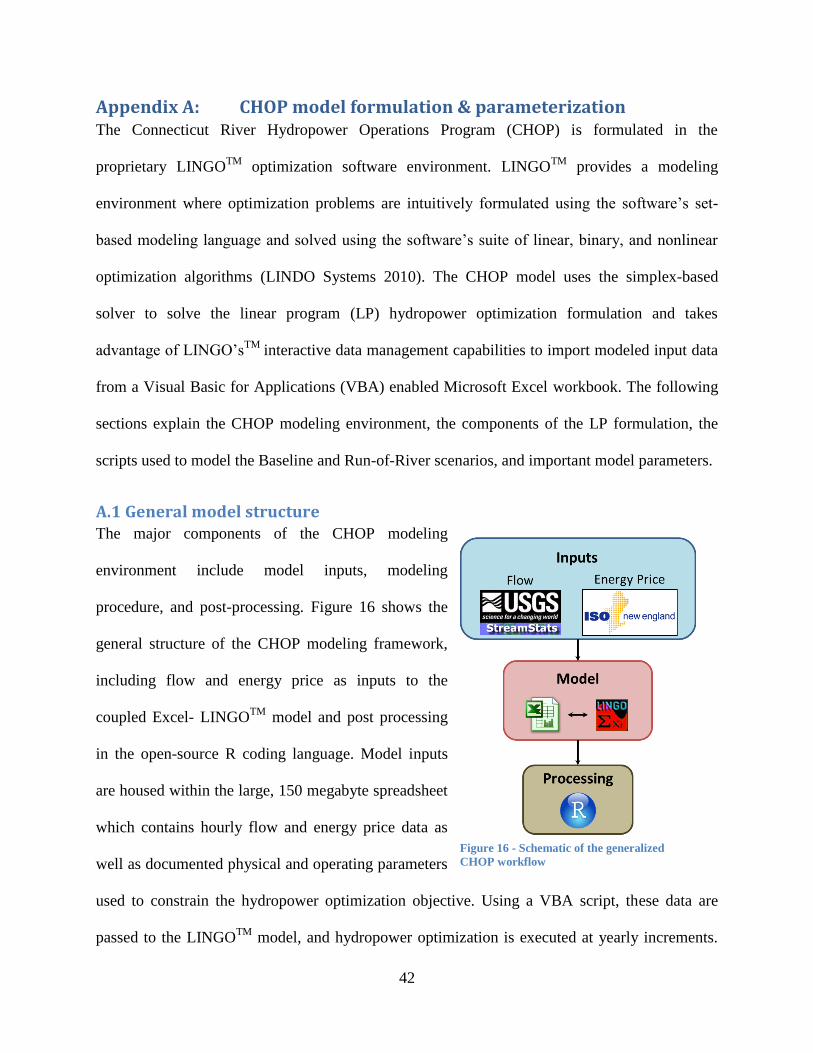
A.1 General model structure The major components of the CHOP modeling
environment include model inputs, modeling
procedure, and post-processing. Figure 16 shows the
general structure of the CHOP modeling framework,
including flow and energy price as inputs to the
coupled Excel- LINGOTM
model and post processing
in the open-source R coding language. Model inputs
are housed within the large, 150 megabyte spreadsheet
which contains hourly flow and energy price data as
well as documented physical and operating parameters
used to constrain the hydropower optimization objective. Using a VBA script, these data are
passed to the LINGOTM
model, and hydropower optimization is executed at yearly increments.
Figure 16 - Schematic of the generalized
CHOP workflow
43
Modeled output is aggregated in simple text files for post-processing in the R coding
environment where necessary data adjustments can be made before performing model analyses.
A.2 LP formulation The following section defines the unique components of the linear program formulation for
CHOP including the objective function formulation and operational constraints used to limit
hydropower operations to real-world operations in the order presented in the LINGOTM
script
defined in the next section.
A.2.1 Objective function
Simply stated, the hydropower optimization objective is formulated to maximize revenue from
hydropower dams as described in the main document. For each year of hydropower optimization,
the objective function maximizes the aggregate revenues of the modeled five dams at the hourly
time-step. Within the objective function, weights are associated with each of the hydropower
facilities such that the relative importance of these facilities can be operated correctly. For
instance, releases from Vernon Dam supply water to Northfield and since Northfield may
generate three times the revenue of Vernon, the optimization may unintelligently choose
operations which maximize Northfield revenues at a detriment to Vernon’s. In order to ensure
normal operations, the objective weight for Vernon is scaled to be three times as large as
Northfield, encouraging the model to model intuitive hydropower operations.
While only the hydropower objective was used in this study, the model is easily formulated for a
multi-objective approach which allows for the consideration of explicit ecological objectives. A
version of this model already exists, though this ecological objective was not of interest to
ecological stakeholders in its current form. The opportunity to reformulate and use this multi-
44
objective approach to explicitly consider trade-offs between ecological and hydropower
objectives is a basis for future work.
A.2.2 Model constraints
To ensure that CHOPS accurately mimics operations on the current hydropower system, various
physical and operational constraints are applied to the model to define the basic functional
components of hydropower facilities and their operation.
A.2.2.1 Continuity
A mass balance is applied at each modeled reservoir to ensure continuity of flows and water
storage along the mainstem. The mass balance constraint simply states that the storage of any
given reservoir is the summation of its storage at the previous time-step and its inflows and
releases at the current time-step. To ensure continuity of reservoir storage across modeled years,
the initial and final storages are constrained to the same value for each year.
A.2.2.2 Physical and operating constraints
Each facility is constrained to its physical limitations including useable reservoir storage,
maximum turbine flow rate, and maximum power generating capacity. Operating constraints are
applied in the form of licensed minimum flows and hydropower release ramping rates. The
ramping rates are applied to ensure realistic hydropower generation at levels matching closely to
historically reported power generation.
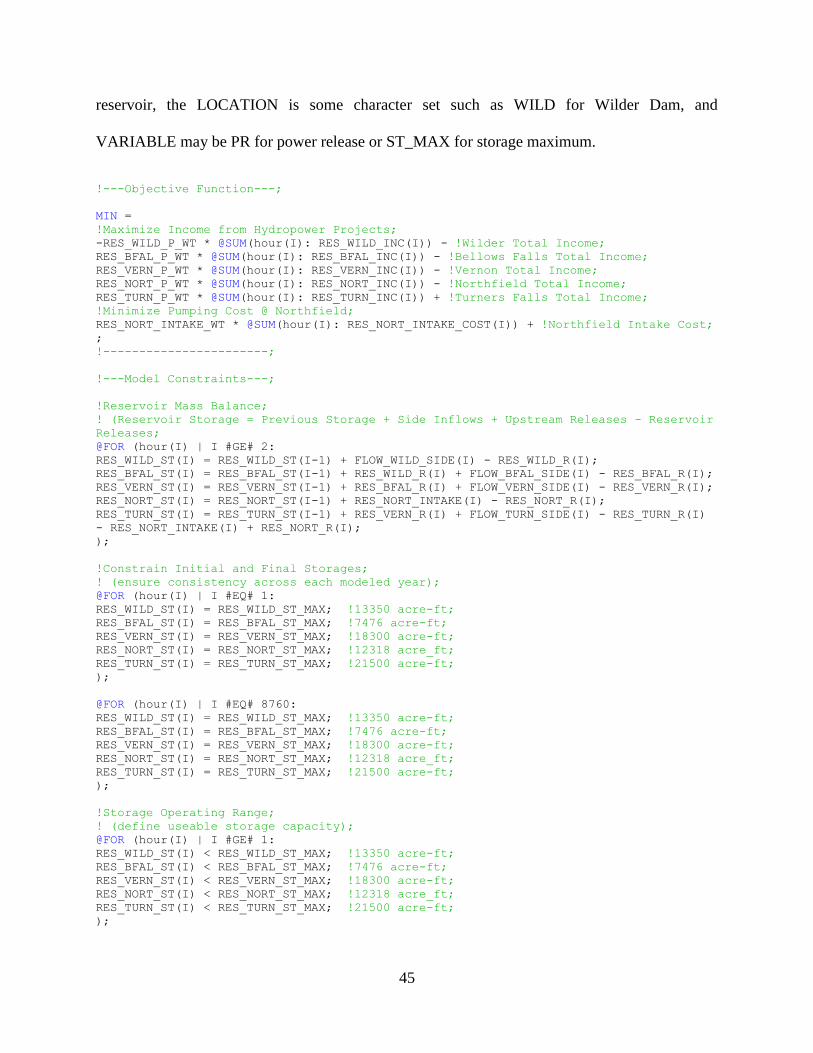
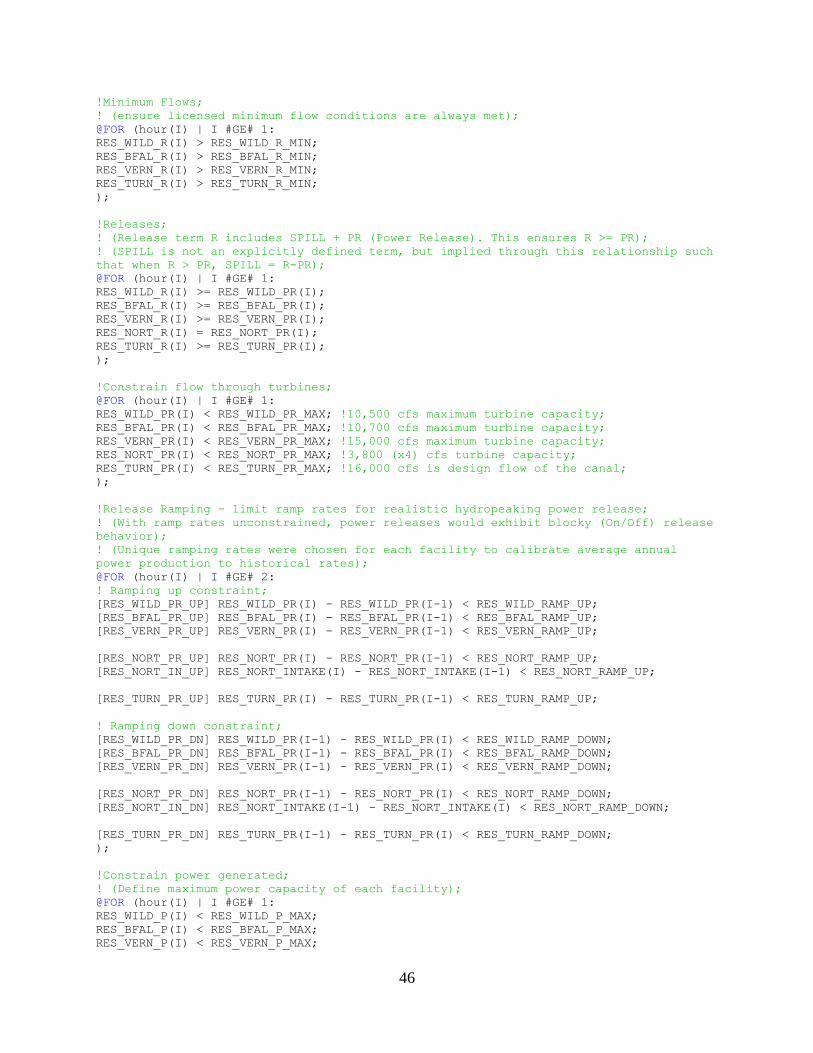
A.3 Baseline LINGO script The following section shows the LINGO
TM script code for the objective and constraint
formulation of the Baseline model, designed to mimic real-world hydropower operations for the
FERC relicensing system. Both the programming language and the variable nomenclature follow
an intuitive scheme which is supported by commented explanations. Variables names follow the
general format: TYPE_LOCATION_VARIABLE where the TYPE is most generally RES for
45
reservoir, the LOCATION is some character set such as WILD for Wilder Dam, and
VARIABLE may be PR for power release or ST_MAX for storage maximum.
!---Objective Function---;
MIN =
!Maximize Income from Hydropower Projects;
-RES_WILD_P_WT * @SUM(hour(I): RES_WILD_INC(I)) - !Wilder Total Income;
RES_BFAL_P_WT * @SUM(hour(I): RES_BFAL_INC(I)) - !Bellows Falls Total Income;
RES_VERN_P_WT * @SUM(hour(I): RES_VERN_INC(I)) - !Vernon Total Income;
RES_NORT_P_WT * @SUM(hour(I): RES_NORT_INC(I)) - !Northfield Total Income;
RES_TURN_P_WT * @SUM(hour(I): RES_TURN_INC(I)) + !Turners Falls Total Income;
!Minimize Pumping Cost @ Northfield;
RES_NORT_INTAKE_WT * @SUM(hour(I): RES_NORT_INTAKE_COST(I)) + !Northfield Intake Cost;
;
!-----------------------;
!---Model Constraints---;
!Reservoir Mass Balance;
! (Reservoir Storage = Previous Storage + Side Inflows + Upstream Releases - Reservoir
Releases;
@FOR (hour(I) | I #GE# 2:
RES_WILD_ST(I) = RES_WILD_ST(I-1) + FLOW_WILD_SIDE(I) - RES_WILD_R(I);
RES_BFAL_ST(I) = RES_BFAL_ST(I-1) + RES_WILD_R(I) + FLOW_BFAL_SIDE(I) - RES_BFAL_R(I);
RES_VERN_ST(I) = RES_VERN_ST(I-1) + RES_BFAL_R(I) + FLOW_VERN_SIDE(I) - RES_VERN_R(I);
RES_NORT_ST(I) = RES_NORT_ST(I-1) + RES_NORT_INTAKE(I) - RES_NORT_R(I);
RES_TURN_ST(I) = RES_TURN_ST(I-1) + RES_VERN_R(I) + FLOW_TURN_SIDE(I) - RES_TURN_R(I)
- RES_NORT_INTAKE(I) + RES_NORT_R(I);
);
!Constrain Initial and Final Storages;
! (ensure consistency across each modeled year);
@FOR (hour(I) | I #EQ# 1:
RES_WILD_ST(I) = RES_WILD_ST_MAX; !13350 acre-ft;
RES_BFAL_ST(I) = RES_BFAL_ST_MAX; !7476 acre-ft;
RES_VERN_ST(I) = RES_VERN_ST_MAX; !18300 acre-ft;
RES_NORT_ST(I) = RES_NORT_ST_MAX; !12318 acre_ft;
RES_TURN_ST(I) = RES_TURN_ST_MAX; !21500 acre-ft;
);
@FOR (hour(I) | I #EQ# 8760:
RES_WILD_ST(I) = RES_WILD_ST_MAX; !13350 acre-ft;
RES_BFAL_ST(I) = RES_BFAL_ST_MAX; !7476 acre-ft;
RES_VERN_ST(I) = RES_VERN_ST_MAX; !18300 acre-ft;
RES_NORT_ST(I) = RES_NORT_ST_MAX; !12318 acre_ft;
RES_TURN_ST(I) = RES_TURN_ST_MAX; !21500 acre-ft;
);
!Storage Operating Range;
! (define useable storage capacity);
@FOR (hour(I) | I #GE# 1:
RES_WILD_ST(I) < RES_WILD_ST_MAX; !13350 acre-ft;
RES_BFAL_ST(I) < RES_BFAL_ST_MAX; !7476 acre-ft;
RES_VERN_ST(I) < RES_VERN_ST_MAX; !18300 acre-ft;
RES_NORT_ST(I) < RES_NORT_ST_MAX; !12318 acre_ft;
RES_TURN_ST(I) < RES_TURN_ST_MAX; !21500 acre-ft;
);
46
!Minimum Flows;
! (ensure licensed minimum flow conditions are always met);
@FOR (hour(I) | I #GE# 1:
RES_WILD_R(I) > RES_WILD_R_MIN;
RES_BFAL_R(I) > RES_BFAL_R_MIN;
RES_VERN_R(I) > RES_VERN_R_MIN;
RES_TURN_R(I) > RES_TURN_R_MIN;
);
!Releases;
! (Release term R includes SPILL + PR (Power Release). This ensures R >= PR);
! (SPILL is not an explicitly defined term, but implied through this relationship such
that when R > PR, SPILL = R-PR);
@FOR (hour(I) | I #GE# 1:
RES_WILD_R(I) >= RES_WILD_PR(I);
RES_BFAL_R(I) >= RES_BFAL_PR(I);
RES_VERN_R(I) >= RES_VERN_PR(I);
RES_NORT_R(I) = RES_NORT_PR(I);
RES_TURN_R(I) >= RES_TURN_PR(I);
);
!Constrain flow through turbines;
@FOR (hour(I) | I #GE# 1:
RES_WILD_PR(I) < RES_WILD_PR_MAX; !10,500 cfs maximum turbine capacity;
RES_BFAL_PR(I) < RES_BFAL_PR_MAX; !10,700 cfs maximum turbine capacity;
RES_VERN_PR(I) < RES_VERN_PR_MAX; !15,000 cfs maximum turbine capacity;
RES_NORT_PR(I) < RES_NORT_PR_MAX; !3,800 (x4) cfs turbine capacity;
RES_TURN_PR(I) < RES_TURN_PR_MAX; !16,000 cfs is design flow of the canal;
);
!Release Ramping - limit ramp rates for realistic hydropeaking power release;
! (With ramp rates unconstrained, power releases would exhibit blocky (On/Off) release
behavior);
! (Unique ramping rates were chosen for each facility to calibrate average annual
power production to historical rates);
@FOR (hour(I) | I #GE# 2:
! Ramping up constraint;
[RES_WILD_PR_UP] RES_WILD_PR(I) - RES_WILD_PR(I-1) < RES_WILD_RAMP_UP;
[RES_BFAL_PR_UP] RES_BFAL_PR(I) - RES_BFAL_PR(I-1) < RES_BFAL_RAMP_UP;
[RES_VERN_PR_UP] RES_VERN_PR(I) - RES_VERN_PR(I-1) < RES_VERN_RAMP_UP;
[RES_NORT_PR_UP] RES_NORT_PR(I) - RES_NORT_PR(I-1) < RES_NORT_RAMP_UP;
[RES_NORT_IN_UP] RES_NORT_INTAKE(I) - RES_NORT_INTAKE(I-1) < RES_NORT_RAMP_UP;
[RES_TURN_PR_UP] RES_TURN_PR(I) - RES_TURN_PR(I-1) < RES_TURN_RAMP_UP;
! Ramping down constraint;
[RES_WILD_PR_DN] RES_WILD_PR(I-1) - RES_WILD_PR(I) < RES_WILD_RAMP_DOWN;
[RES_BFAL_PR_DN] RES_BFAL_PR(I-1) - RES_BFAL_PR(I) < RES_BFAL_RAMP_DOWN;
[RES_VERN_PR_DN] RES_VERN_PR(I-1) - RES_VERN_PR(I) < RES_VERN_RAMP_DOWN;
[RES_NORT_PR_DN] RES_NORT_PR(I-1) - RES_NORT_PR(I) < RES_NORT_RAMP_DOWN;
[RES_NORT_IN_DN] RES_NORT_INTAKE(I-1) - RES_NORT_INTAKE(I) < RES_NORT_RAMP_DOWN;
[RES_TURN_PR_DN] RES_TURN_PR(I-1) - RES_TURN_PR(I) < RES_TURN_RAMP_DOWN;
);
!Constrain power generated;
! (Define maximum power capacity of each facility);
@FOR (hour(I) | I #GE# 1:
RES_WILD_P(I) < RES_WILD_P_MAX;
RES_BFAL_P(I) < RES_BFAL_P_MAX;
RES_VERN_P(I) < RES_VERN_P_MAX;
47
RES_NORT_P(I) < RES_NORT_P_MAX;
RES_TURN_P(I) < RES_TURN_P_MAX;
);
!Calculate the power production;
@FOR (hour(I)| I #GE# 1:
! CONV term = PR_MAX/(P_MAX * efficiency);
RES_WILD_P(I) = RES_WILD_PR(I)/RES_WILD_P_CONV; !334 cfs per MW produced;
RES_BFAL_P(I) = RES_BFAL_PR(I)/RES_BFAL_P_CONV; !349 cfs per MW produced;
RES_VERN_P(I) = RES_VERN_PR(I)/RES_VERN_P_CONV; !644 cfs per MW produced;
RES_NORT_P(I) = RES_NORT_PR(I)/RES_NORT_P_CONV; !23 cfs per MW produced;
RES_TURN_P(I) = RES_TURN_PR(I)/RES_TURN_P_CONV; !295 cfs per MW produced;
);
!Reservoir Income;
! (Revenue calculated from product of estimated power and historical energy price);
@FOR (hour(I) | I #GE# 1:
RES_WILD_INC(I) = RES_WILD_P(I) * ENERGY_PRICE(I);
RES_BFAL_INC(I) = RES_BFAL_P(I) * ENERGY_PRICE(I);
RES_VERN_INC(I) = RES_VERN_P(I) * ENERGY_PRICE(I);
RES_NORT_INC(I) = RES_NORT_P(I) * ENERGY_PRICE(I);
RES_TURN_INC(I) = RES_TURN_P(I) * ENERGY_PRICE(I);
);
!Northfield Power Intake;
! (Modeling Northfield's pumped storage operations requires an INTAKE term to define
flow rates, power, & costs associated pumping water up to the facility);
@FOR (hour(I)| I #GE# 1:
! Define limits for INTAKE flow term between 0 and MAX (15,000 cfs);
@BND(0,RES_NORT_INTAKE(I), RES_NORT_INTAKE_MAX);
! Define INTAKE_P power generation term;
! (the power conversion ratio (cfs/MW) for pumping water is ~4/3 the ratio used for
power generated using release);
! (pg. 99/537 of the Firstlight FERC Pre-Application document defines this
relationship (17.9 cfs/13.6 cfs ~ 4/3));
RES_NORT_INTAKE_P(I) = (RES_NORT_INTAKE(I)/RES_NORT_P_CONV)*4/3;
!Conversion from power generation to power cost;
RES_NORT_INTAKE_COST(I) = RES_NORT_INTAKE_P(I)*ENERGY_PRICE(I););
!-----------------------;
A.4 Run-of-River LINGO script The following section shows the changes in the LINGO
TM script from the Baseline model to the
Run-of-River system. The objective formulation remains the same as in the Baseline scenario,
though mainstem facility operations are constrained such hydropower releases may not be
optimized at these locations. Constraints which were removed from the Baseline run are shown
in strikethrough and added constraints are shown in normal text below.
48
!Release Ramping - limit ramp rates for realistic hydropeaking power release;
! (With ramp rates unconstrained, power releases would exhibit blocky (On/Off) release
behavior);
! (Unique ramping rates were chosen for each facility to calibrate average annual
power production to historical rates);
@FOR (hour(I) | I #GE# 2:
! Ramping up constraint;
[RES_WILD_PR_UP] RES_WILD_PR(I) - RES_WILD_PR(I-1) < RES_WILD_RAMP_UP;
[RES_BFAL_PR_UP] RES_BFAL_PR(I) - RES_BFAL_PR(I-1) < RES_BFAL_RAMP_UP;
[RES_VERN_PR_UP] RES_VERN_PR(I) - RES_VERN_PR(I-1) < RES_VERN_RAMP_UP;
[RES_NORT_PR_UP] RES_NORT_PR(I) - RES_NORT_PR(I-1) < RES_NORT_RAMP_UP;
[RES_NORT_IN_UP] RES_NORT_INTAKE(I) - RES_NORT_INTAKE(I-1) < RES_NORT_RAMP_UP;
[RES_TURN_PR_UP] RES_TURN_PR(I) - RES_TURN_PR(I-1) < RES_TURN_RAMP_UP;
! Ramping down constraint;
[RES_WILD_PR_DN] RES_WILD_PR(I-1) - RES_WILD_PR(I) < RES_WILD_RAMP_DOWN;
[RES_BFAL_PR_DN] RES_BFAL_PR(I-1) - RES_BFAL_PR(I) < RES_BFAL_RAMP_DOWN;
[RES_VERN_PR_DN] RES_VERN_PR(I-1) - RES_VERN_PR(I) < RES_VERN_RAMP_DOWN;
[RES_NORT_PR_DN] RES_NORT_PR(I-1) - RES_NORT_PR(I) < RES_NORT_RAMP_DOWN;
[RES_NORT_IN_DN] RES_NORT_INTAKE(I-1) - RES_NORT_INTAKE(I) < RES_NORT_RAMP_DOWN;
[RES_TURN_PR_DN] RES_TURN_PR(I-1) - RES_TURN_PR(I) < RES_TURN_RAMP_DOWN;
);
!Run of river condition (releases = inflows);
@FOR (hour(I) | I #GE# 2:
RES_WILD_R(I) = FLOW_WILD_SIDE(I);
RES_BFAL_R(I) = RES_WILD_R(I) + FLOW_BFAL_SIDE(I);
RES_VERN_R(I) = RES_BFAL_R(I) + FLOW_VERN_SIDE(I);
RES_TURN_R(I) = RES_VERN_R(I) + FLOW_TURN_SIDE(I);
);
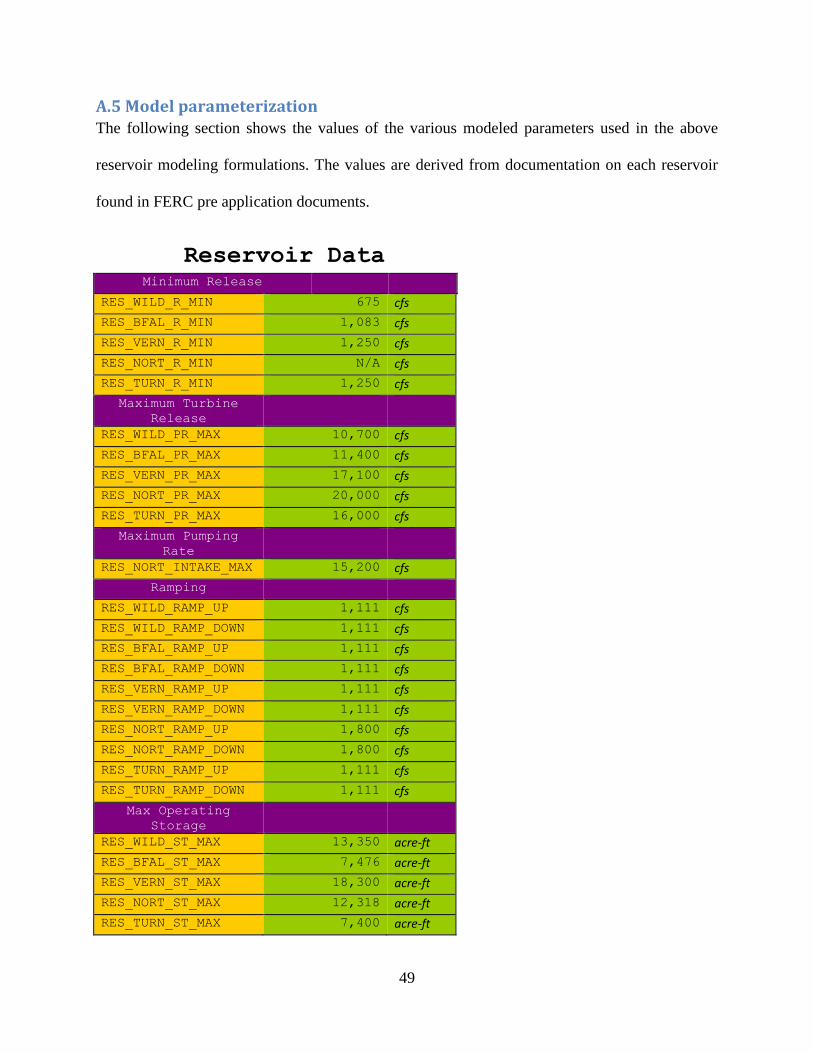
49
A.5 Model parameterization The following section shows the values of the various modeled parameters used in the above
reservoir modeling formulations. The values are derived from documentation on each reservoir
found in FERC pre application documents.
Reservoir Data
Minimum Release
RES_WILD_R_MIN 675 cfs
RES_BFAL_R_MIN 1,083 cfs
RES_VERN_R_MIN 1,250 cfs
RES_NORT_R_MIN N/A cfs
RES_TURN_R_MIN 1,250 cfs
Maximum Turbine
Release
RES_WILD_PR_MAX 10,700 cfs
RES_BFAL_PR_MAX 11,400 cfs
RES_VERN_PR_MAX 17,100 cfs
RES_NORT_PR_MAX 20,000 cfs
RES_TURN_PR_MAX 16,000 cfs
Maximum Pumping
Rate
RES_NORT_INTAKE_MAX 15,200 cfs
Ramping
RES_WILD_RAMP_UP 1,111 cfs
RES_WILD_RAMP_DOWN 1,111 cfs
RES_BFAL_RAMP_UP 1,111 cfs
RES_BFAL_RAMP_DOWN 1,111 cfs
RES_VERN_RAMP_UP 1,111 cfs
RES_VERN_RAMP_DOWN 1,111 cfs
RES_NORT_RAMP_UP 1,800 cfs
RES_NORT_RAMP_DOWN 1,800 cfs
RES_TURN_RAMP_UP 1,111 cfs
RES_TURN_RAMP_DOWN 1,111 cfs
Max Operating
Storage
RES_WILD_ST_MAX 13,350 acre-ft
RES_BFAL_ST_MAX 7,476 acre-ft
RES_VERN_ST_MAX 18,300 acre-ft
RES_NORT_ST_MAX 12,318 acre-ft
RES_TURN_ST_MAX 7,400 acre-ft

50
Power Data Maximum Power Generation
RES_WILD_P_MAX 35.6 MW
RES_BFAL_P_MAX 48.6 MW
RES_VERN_P_MAX 32.4 MW
RES_NORT_P_MAX 1119 MW
RES_TURN_P_MAX 67.7 MW
General Turbine
Efficiency
RES_WILD_EFF 0.9 ratio
RES_BFAL_EFF 0.8 ratio
RES_VERN_EFF 0.82 ratio
RES_NORT_EFF 0.88 ratio
RES_TURN_EFF 0.9 ratio
cfh per MW (=Max Turbine
Release/(Max MW x Efficiency))
RES_WILD_P_CONV 334 cfs/MW
RES_BFAL_P_CONV 293 cfs/MW
RES_VERN_P_CONV 644 cfs/MW
RES_NORT_P_CONV 20 cfs/MW
RES_TURN_P_CONV 263 cfs/MW
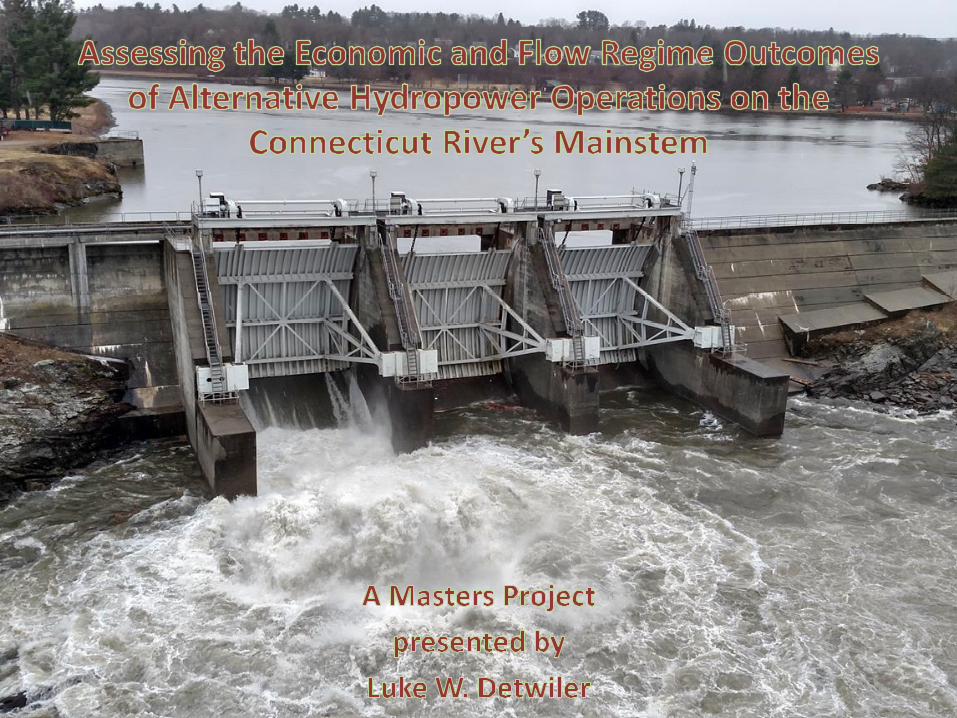

Overview
2
1. Project
2. Background
3. Study Area & Model
4. Findings
5. Conclusions & Future Work
Connecticut River Project
TNC Goals:
• Provide conservation services to benefit the Connecticut River basin’s ecosystem
Project Goals:
• Identify alternative dam operations which may improve flow regime
UMass Task:
• Develop models and assessment tools to assist in this process
3
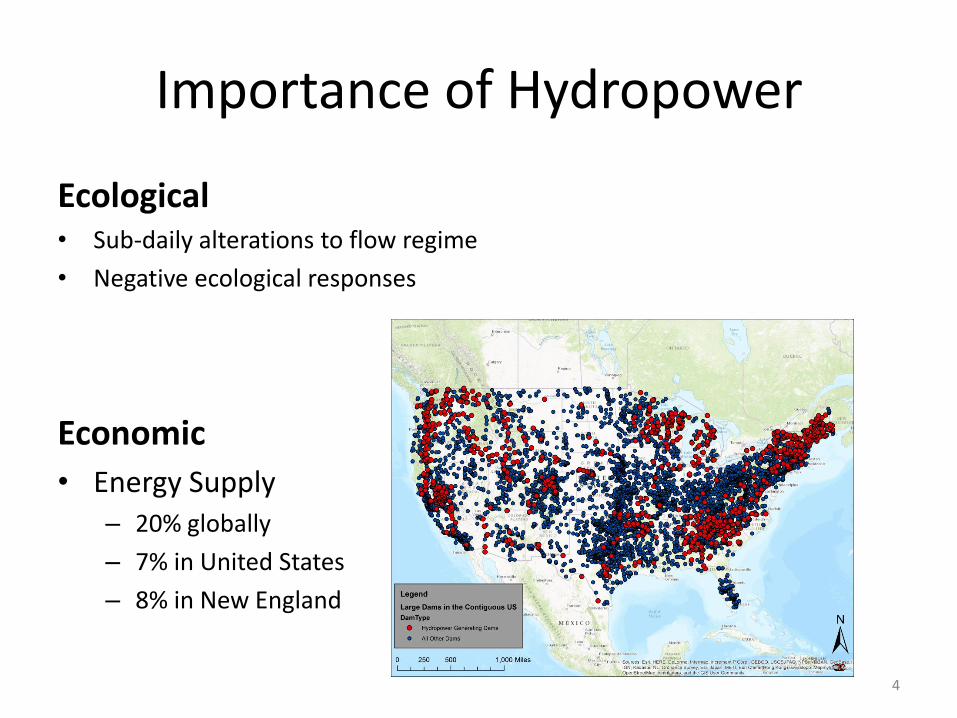
Importance of Hydropower
Ecological • Sub-daily alterations to flow regime
• Negative ecological responses
Economic
• Energy Supply – 20% globally
– 7% in United States
– 8% in New England
4
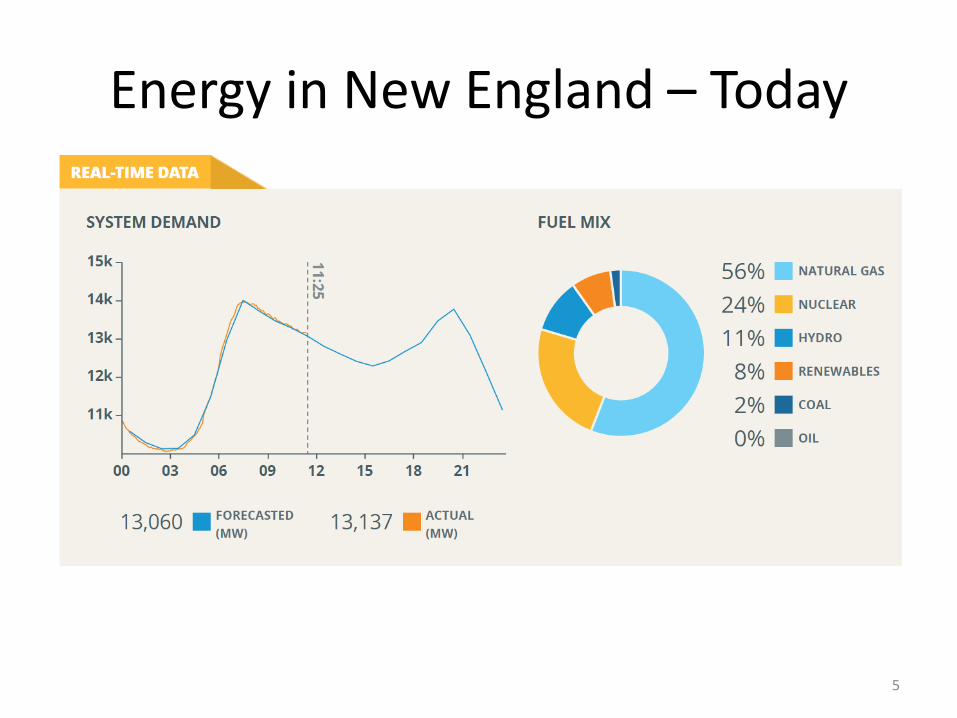
Energy in New England – Today
5
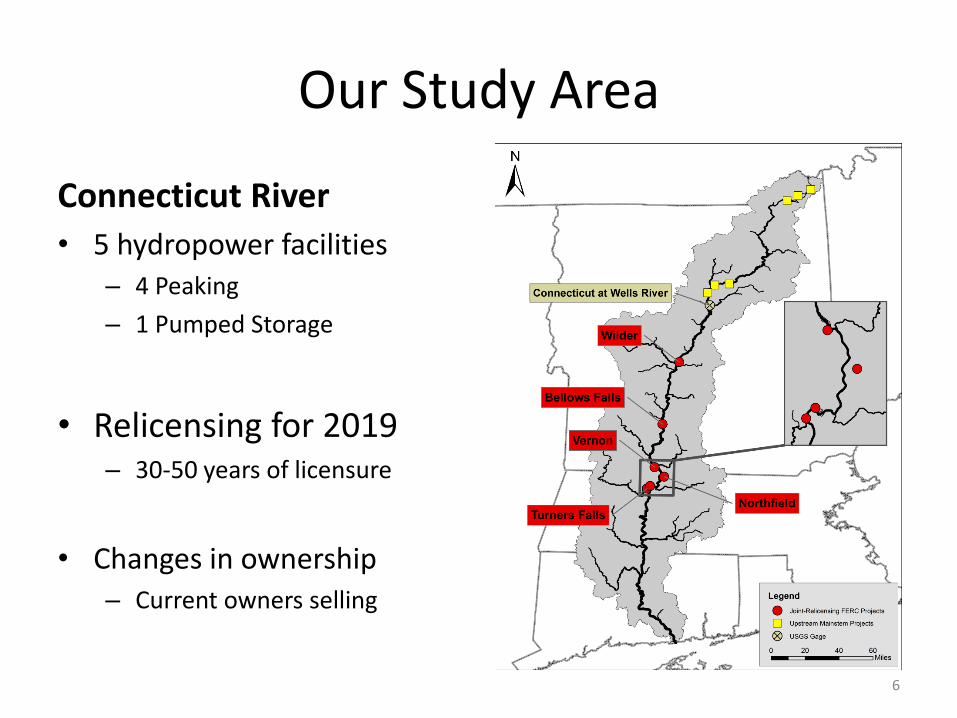
Our Study Area
Connecticut River
• 5 hydropower facilities – 4 Peaking
– 1 Pumped Storage
• Relicensing for 2019 – 30-50 years of licensure
• Changes in ownership – Current owners selling
6
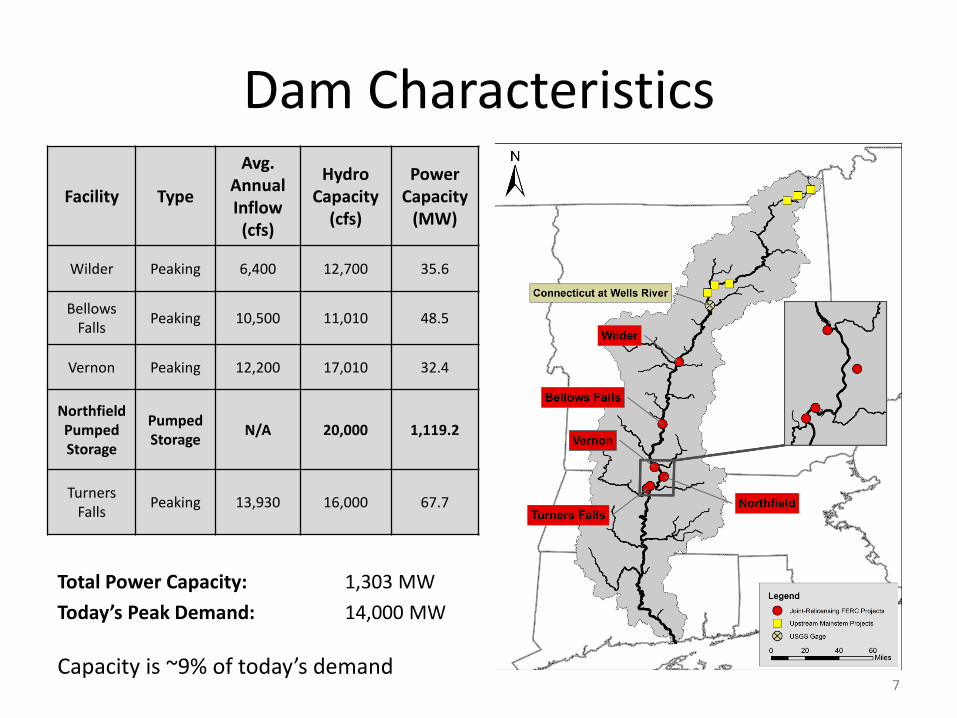
Facility Type
Avg. Annual Inflow
(cfs)
Hydro Capacity
(cfs)
Power Capacity
(MW)
Wilder Peaking 6,400 12,700 35.6
Bellows Falls
Peaking 10,500 11,010 48.5
Vernon Peaking 12,200 17,010 32.4
Northfield Pumped Storage
Pumped Storage
N/A 20,000 1,119.2
Turners Falls
Peaking 13,930 16,000 67.7
Dam Characteristics
Total Power Capacity: 1,303 MW
Today’s Peak Demand: 14,000 MW
Capacity is ~9% of today’s demand
7
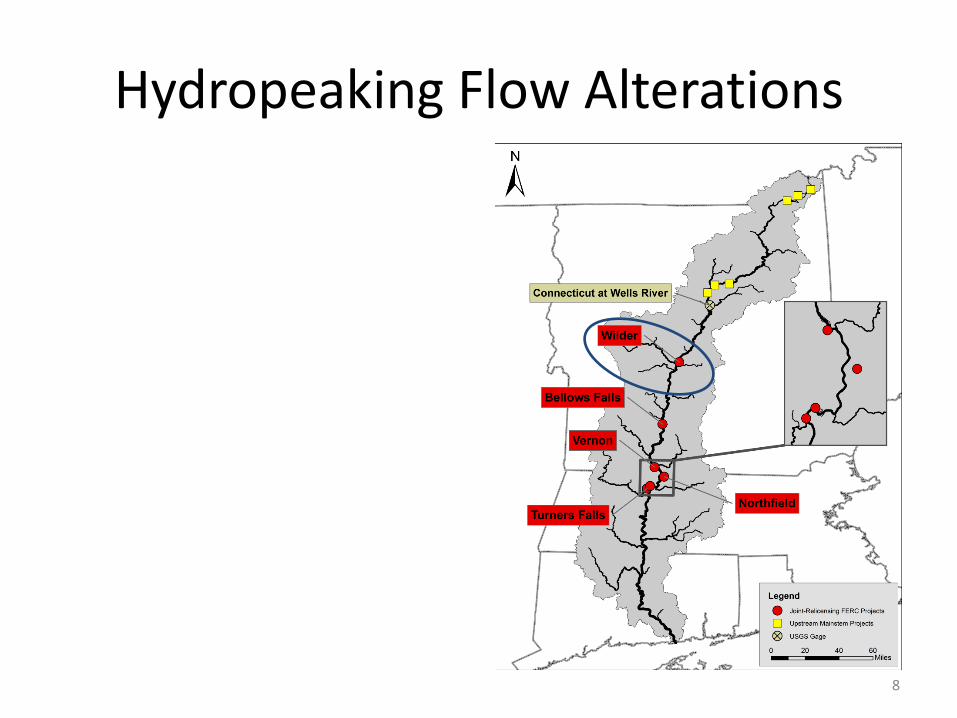
Hydropeaking Flow Alterations
8
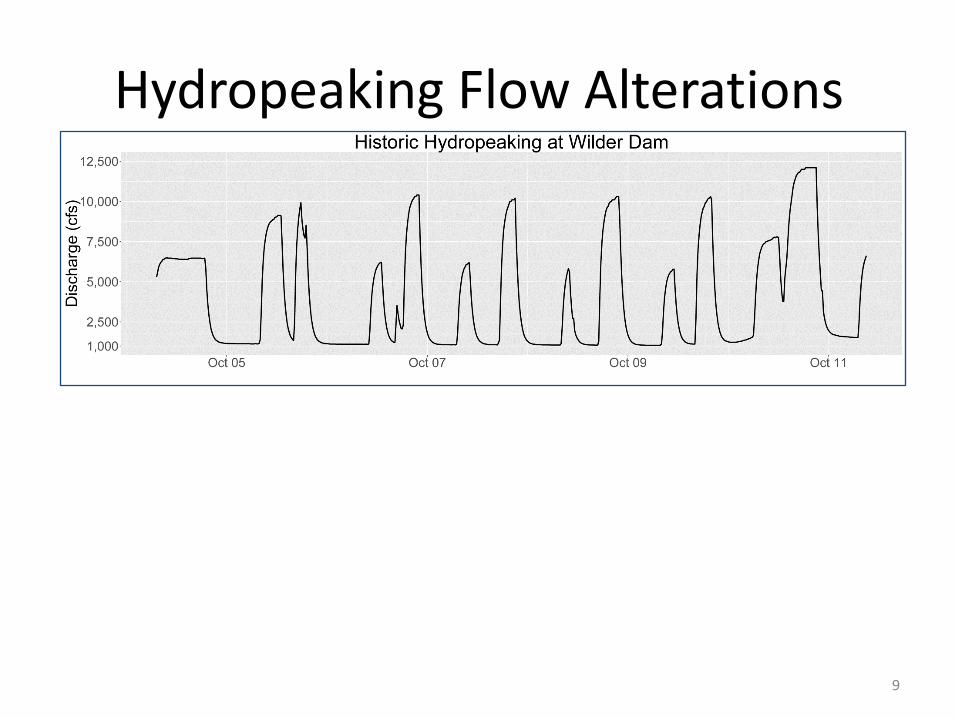
Hydropeaking Flow Alterations
9
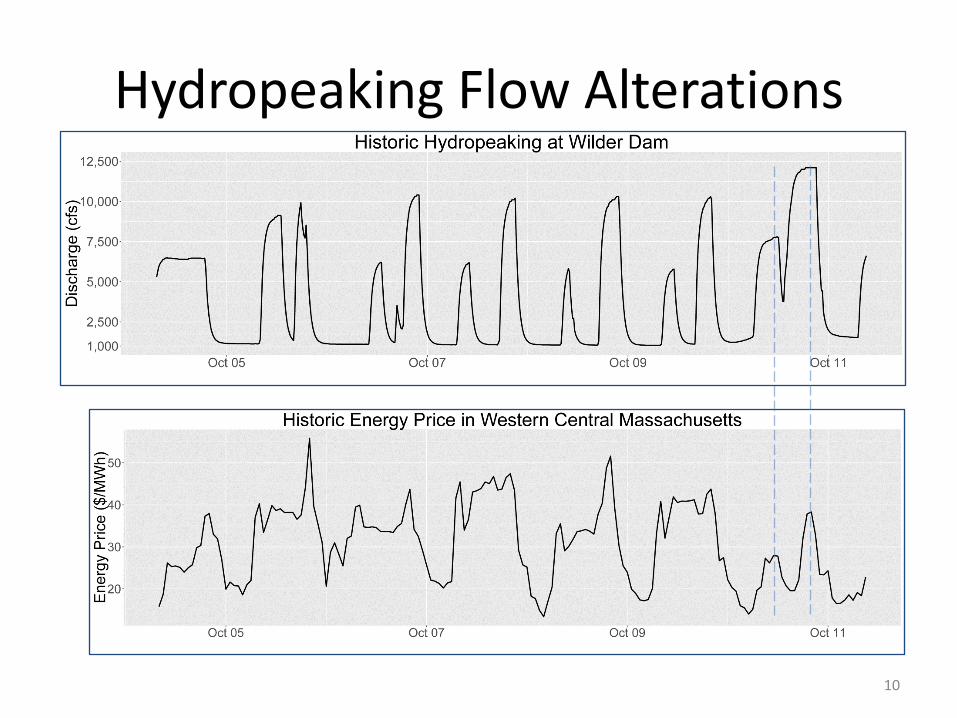
Hydropeaking Flow Alterations
10
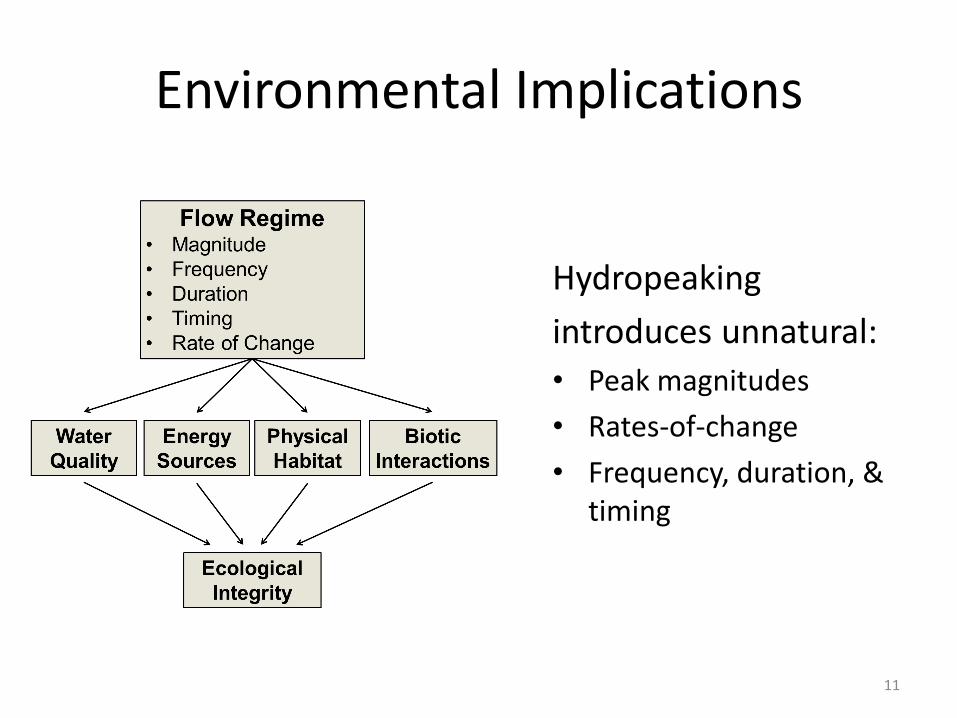
Environmental Implications
Hydropeaking
introduces unnatural:
• Peak magnitudes
• Rates-of-change
• Frequency, duration, & timing
11
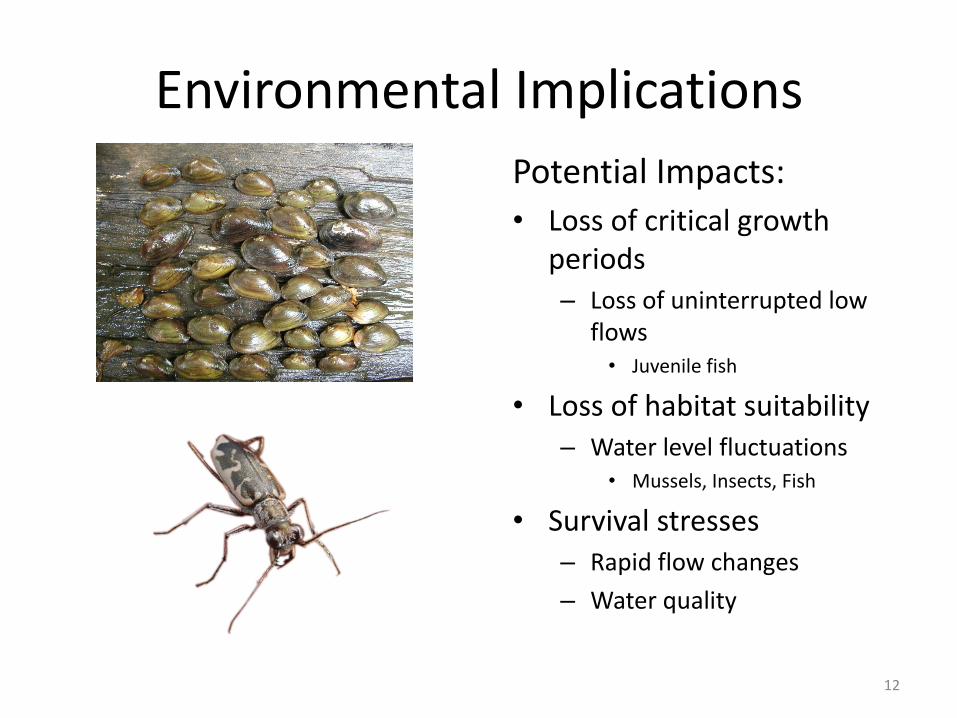
Environmental Implications
Potential Impacts:
• Loss of critical growth periods – Loss of uninterrupted low
flows • Juvenile fish
• Loss of habitat suitability – Water level fluctuations
• Mussels, Insects, Fish
• Survival stresses – Rapid flow changes
– Water quality
12

Our Question
What alternative operations could mitigate
these sub-daily flow alterations?
(to provide a more ecologically healthy flow regime)
13
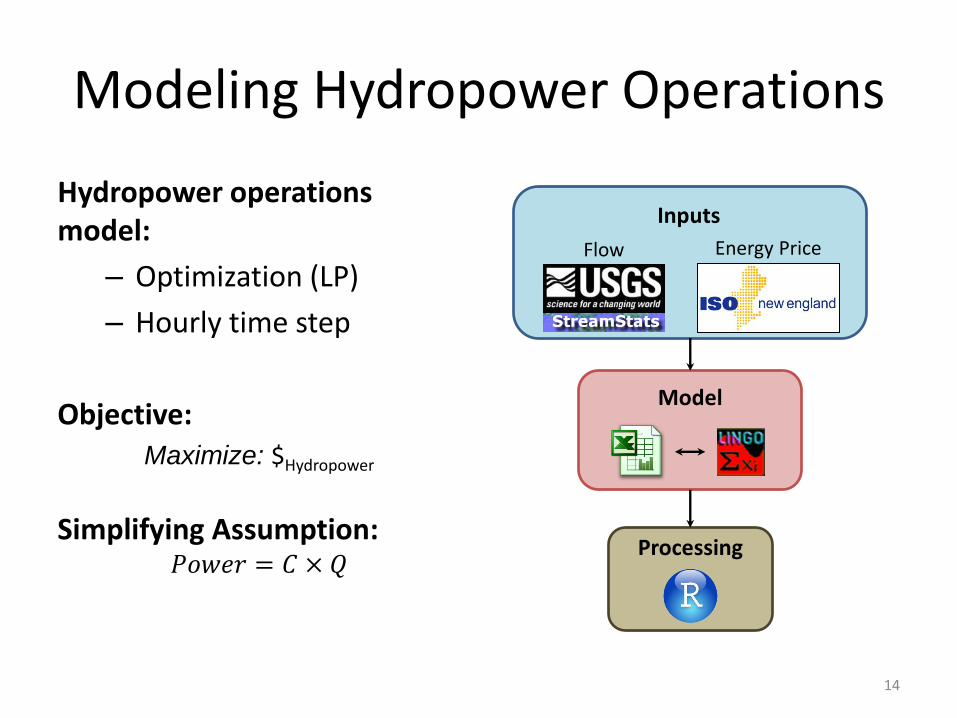
Modeling Hydropower Operations
Hydropower operations model:
– Optimization (LP)
– Hourly time step
Objective:
Maximize: $Hydropower
Simplifying Assumption: 𝑃𝑜𝑤𝑒𝑟 = 𝐶 × 𝑄
14
Processing
Model
Flow Energy Price
Inputs
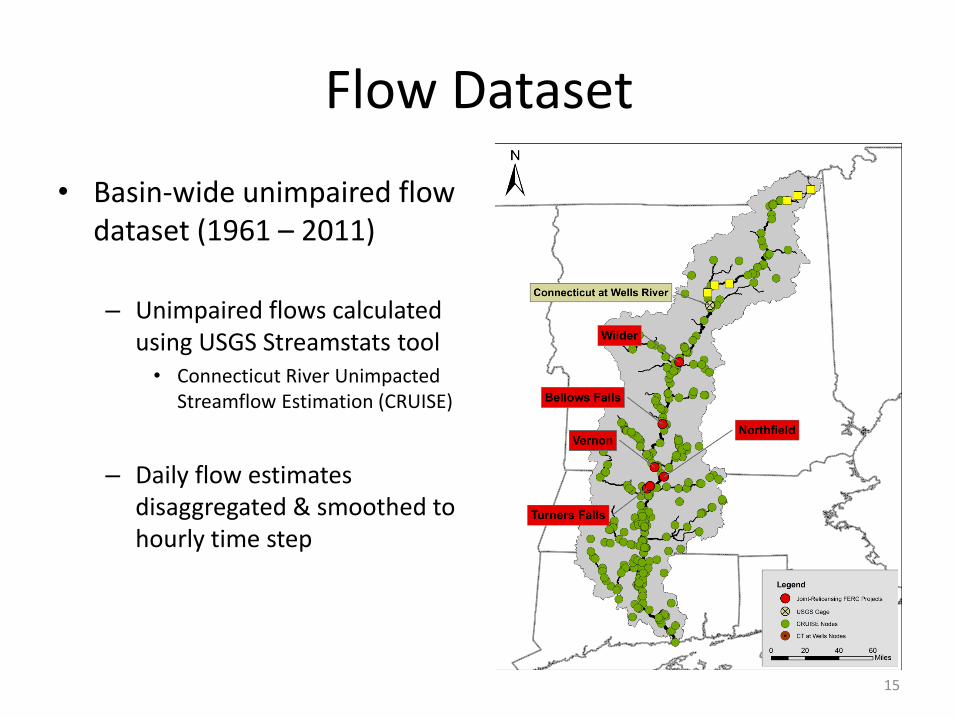
Flow Dataset
• Basin-wide unimpaired flow dataset (1961 – 2011)
– Unimpaired flows calculated using USGS Streamstats tool • Connecticut River Unimpacted
Streamflow Estimation (CRUISE)
– Daily flow estimates disaggregated & smoothed to hourly time step
15
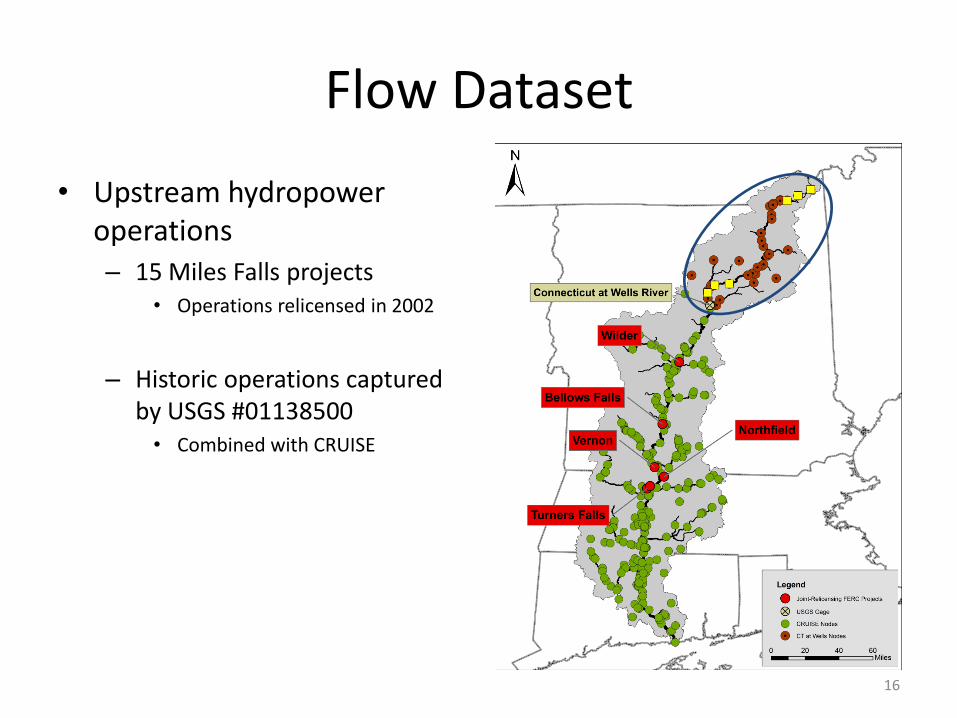
Flow Dataset
• Upstream hydropower operations – 15 Miles Falls projects
• Operations relicensed in 2002
– Historic operations captured by USGS #01138500 • Combined with CRUISE
– Final dataset 2003-2011
16
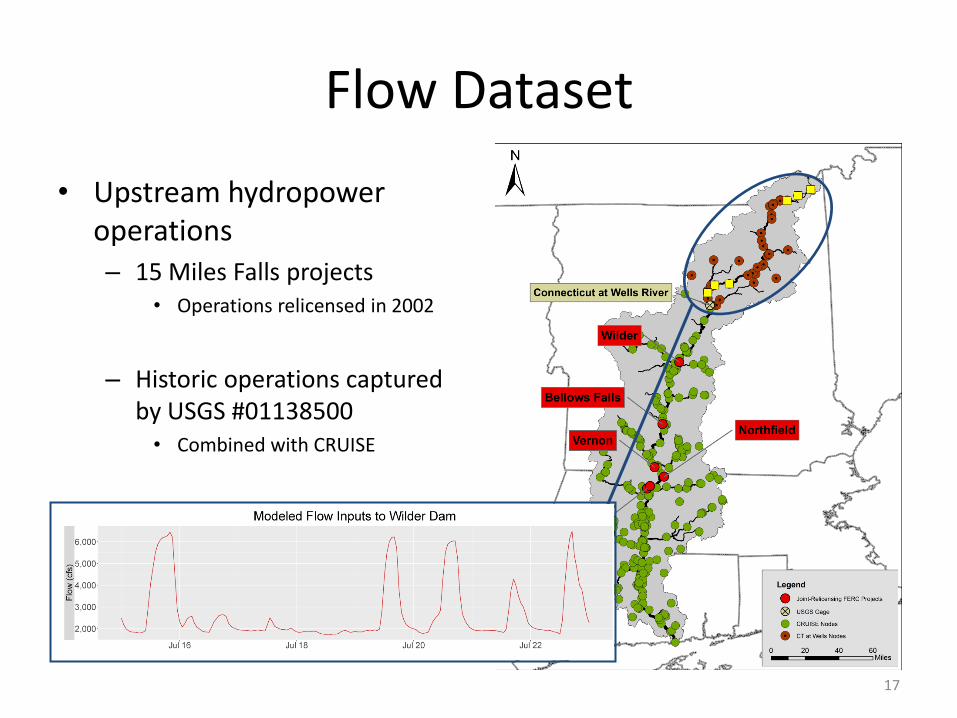
Flow Dataset
• Upstream hydropower operations – 15 Miles Falls projects
• Operations relicensed in 2002
– Historic operations captured by USGS #01138500 • Combined with CRUISE
– Final dataset 2003-2011
17
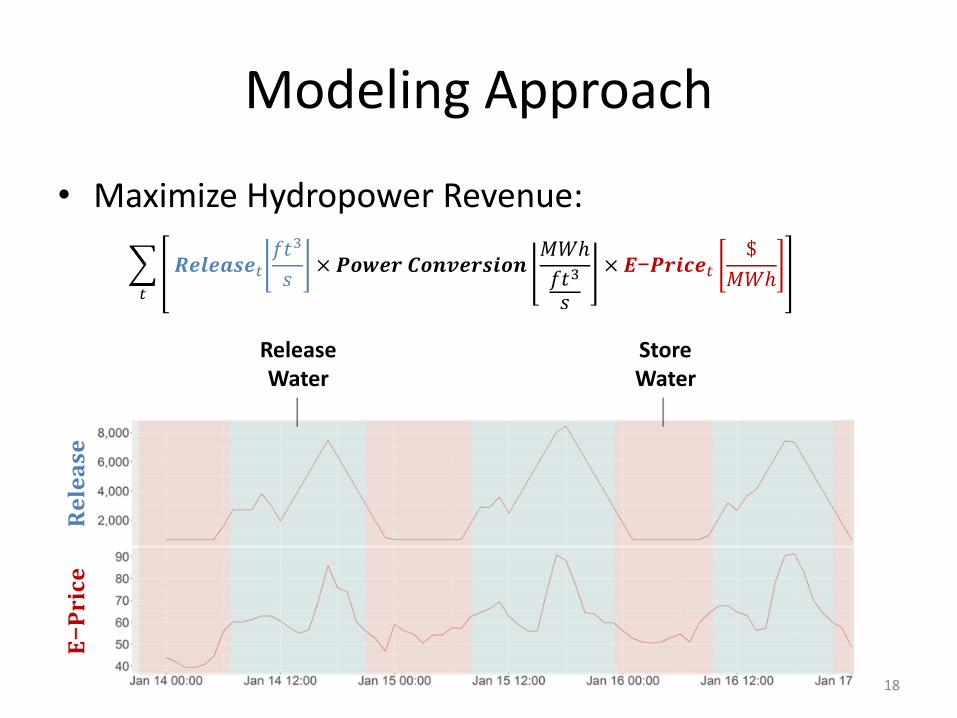
Modeling Approach
18
• Maximize Hydropower Revenue:
• ‘Calibrated’ to:
– Known physical constraints of each facility
– Historical power generation
𝑹𝒆𝒍𝒆𝒂𝒔𝒆𝑡𝑓𝑡3
𝑠× 𝑷𝒐𝒘𝒆𝒓 𝑪𝒐𝒏𝒗𝒆𝒓𝒔𝒊𝒐𝒏
𝑀𝑊ℎ
𝑓𝑡3
𝑠
× 𝑬−𝑷𝒓𝒊𝒄𝒆𝑡$
𝑀𝑊ℎ𝑡
𝐑𝐞𝐥𝐞𝐚𝐬𝐞
𝐄−𝐏𝐫𝐢𝐜𝐞
Release Water
Store Water
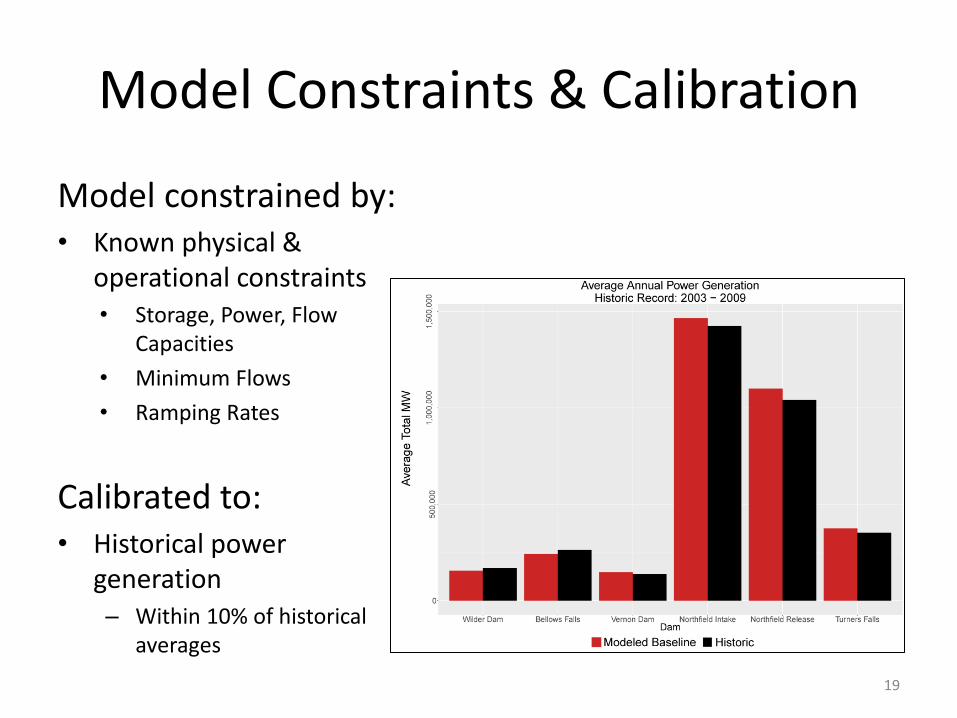
Model Constraints & Calibration
19
Model constrained by: • Known physical &
operational constraints • Storage, Power, Flow
Capacities
• Minimum Flows
• Ramping Rates
Calibrated to: • Historical power
generation – Within 10% of historical
averages
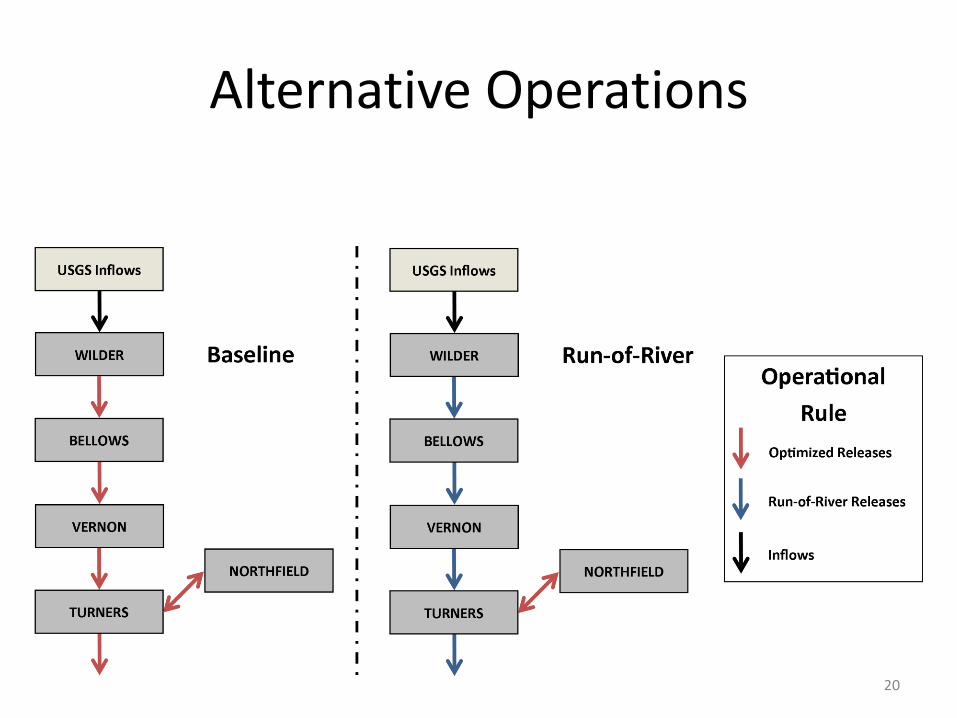
Alternative Operations
20
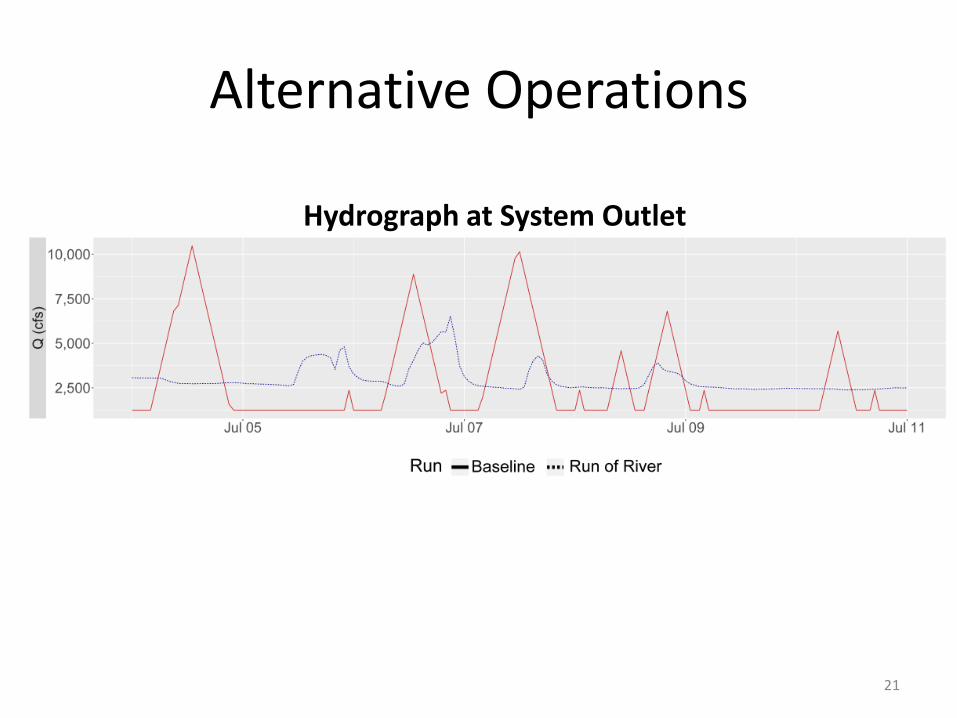
Alternative Operations
21
Hydrograph at System Outlet
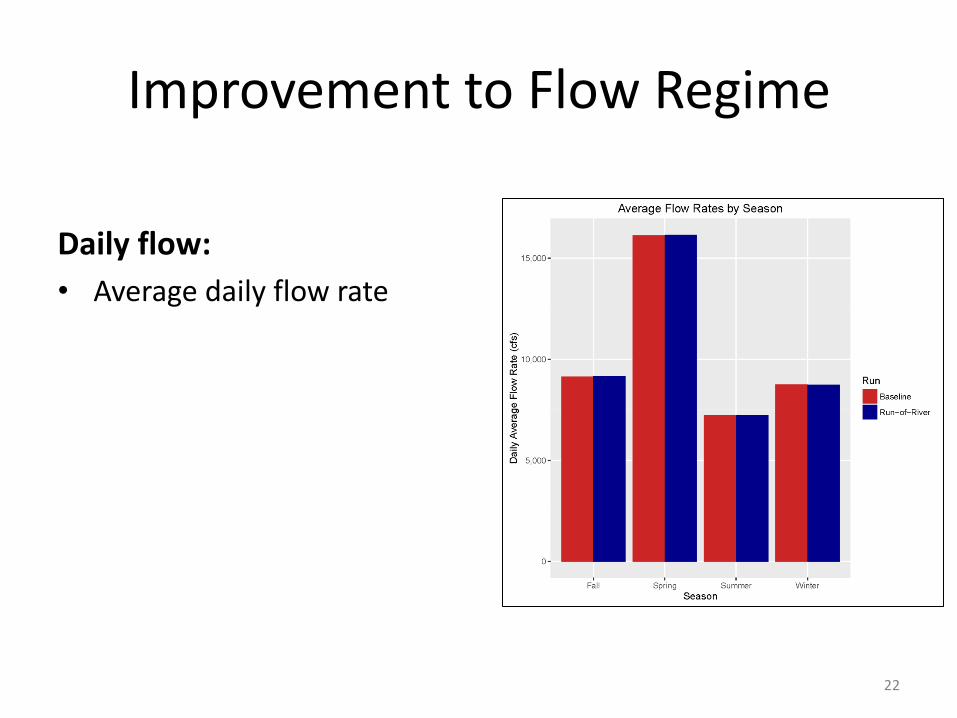
Improvement to Flow Regime
Daily flow:
• Average daily flow rate
• Average maximum flow rate – Reduced peak flow
22
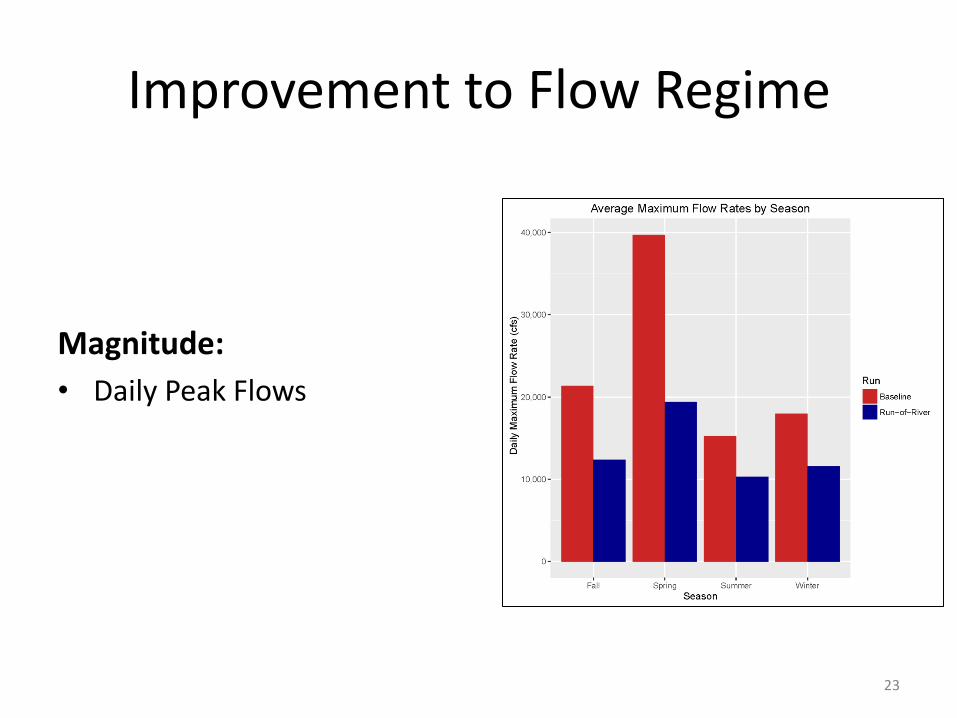
Improvement to Flow Regime
Magnitude:
• Daily Peak Flows
23
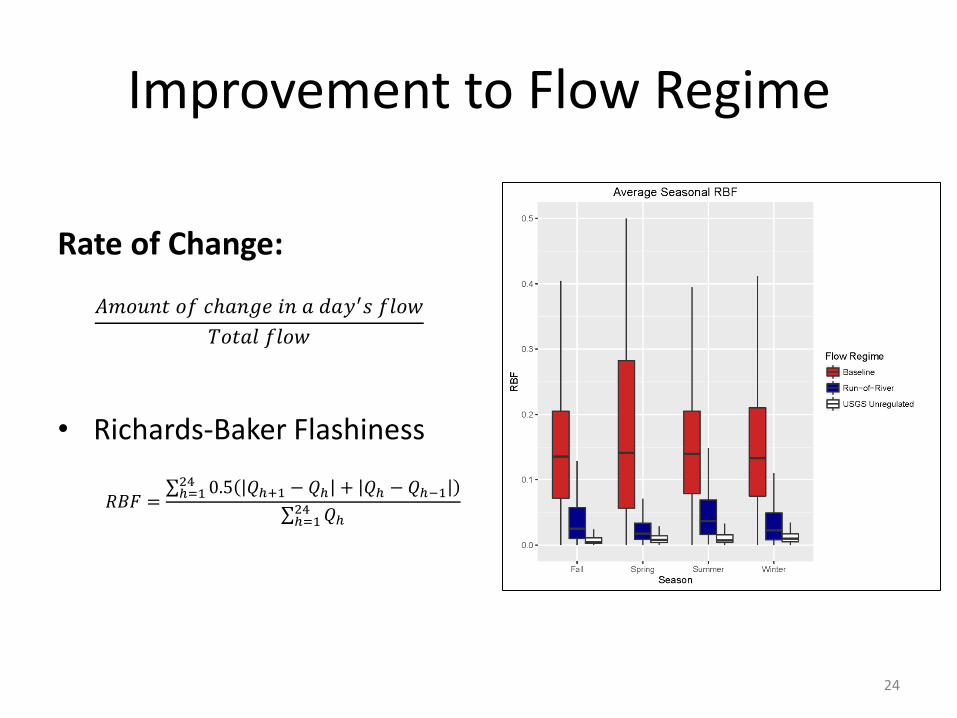
Improvement to Flow Regime
Rate of Change: 𝐴𝑚𝑜𝑢𝑛𝑡 𝑜𝑓 𝑐ℎ𝑎𝑛𝑔𝑒 𝑖𝑛 𝑎 𝑑𝑎𝑦′𝑠 𝑓𝑙𝑜𝑤
𝑇𝑜𝑡𝑎𝑙 𝑓𝑙𝑜𝑤
• Richards-Baker Flashiness
𝑅𝐵𝐹 = 0.5 𝑄ℎ+1 − 𝑄ℎ + 𝑄ℎ − 𝑄ℎ−124ℎ=1
𝑄ℎ24ℎ=1
24
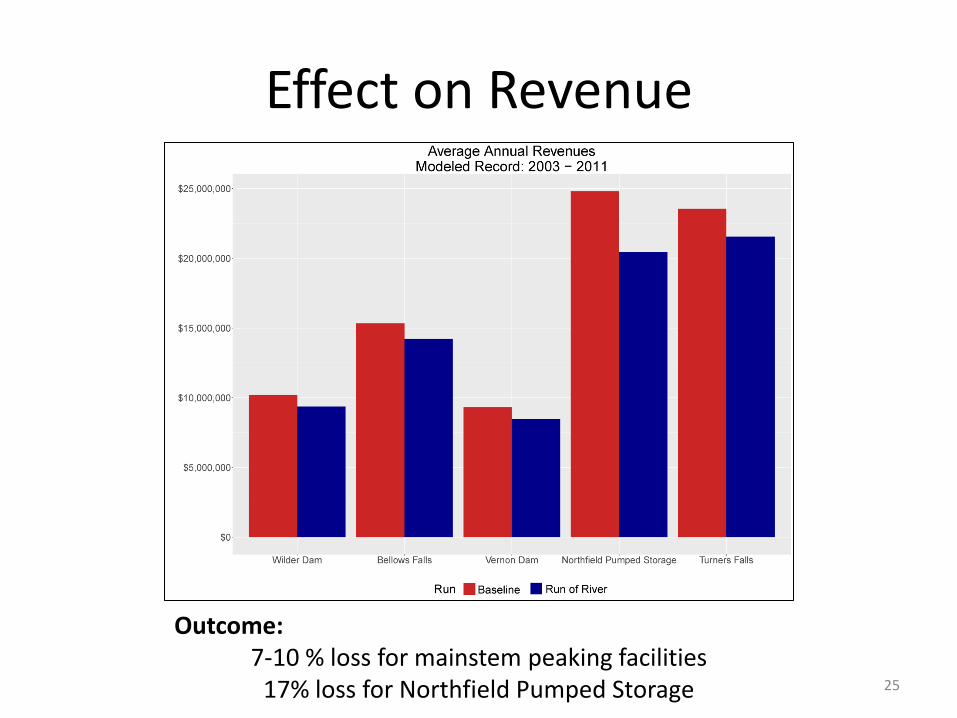
Effect on Revenue
25
Outcome: 7-10 % loss for mainstem peaking facilities
17% loss for Northfield Pumped Storage
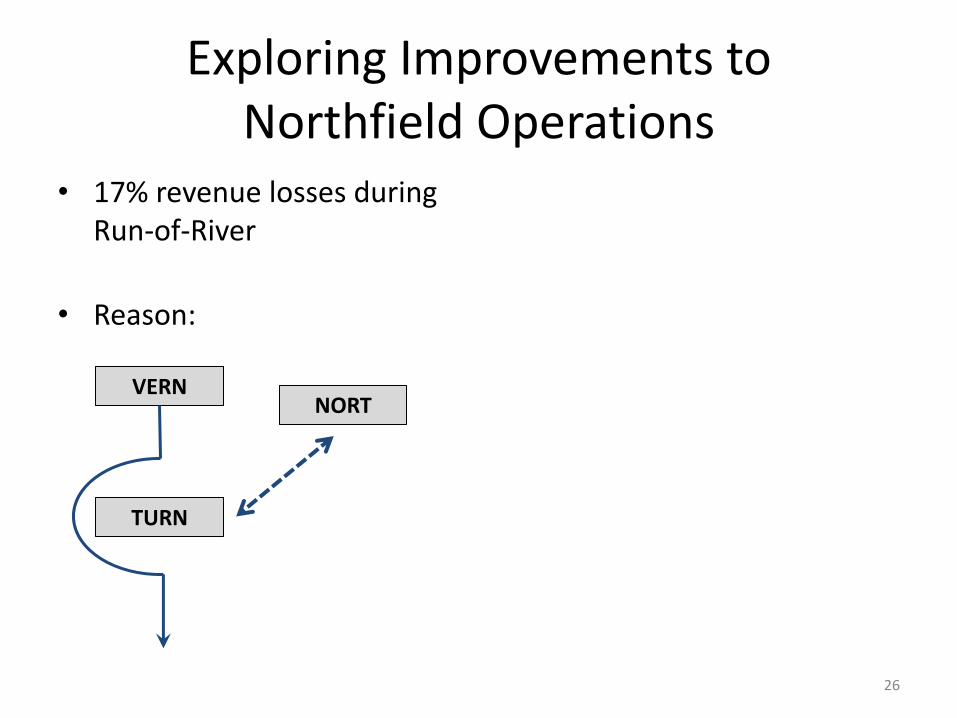
Exploring Improvements to Northfield Operations
• 17% revenue losses during Run-of-River
• Reason: – Lower storage limits
Northfield operations • No supplemental volume from
mainstem inflows
• How can we improve Northfield operations at low impact to ecological goals?
26
VERN
TURN
NORT
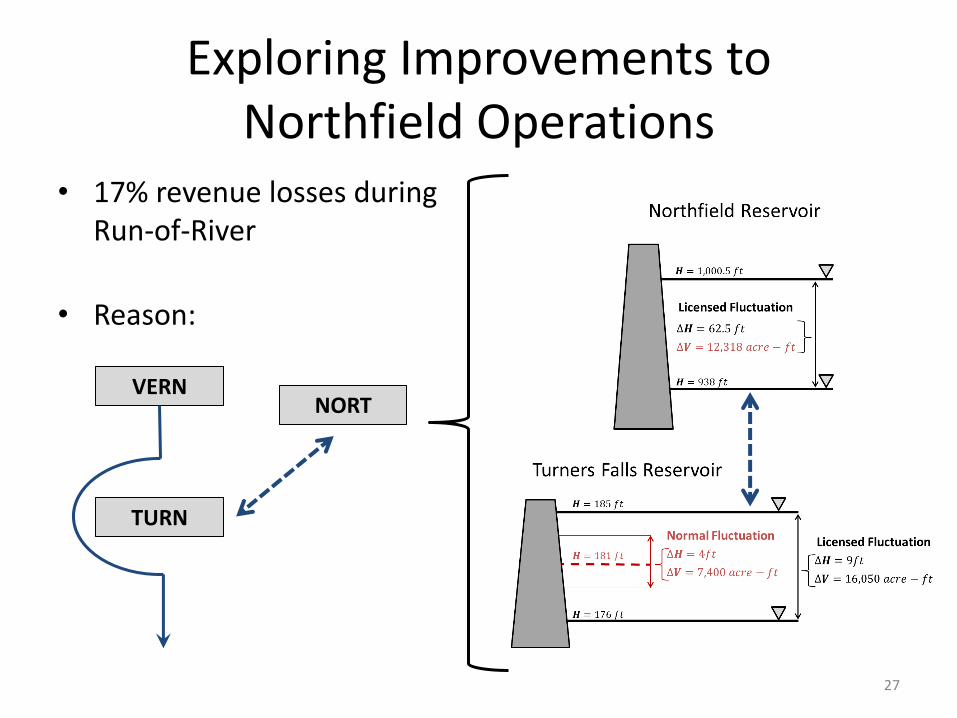
Exploring Improvements to Northfield Operations
• 17% revenue losses during Run-of-River
• Reason: – Lower storage limits
Northfield operations • No supplemental volume from
mainstem inflows
• How can we improve Northfield operations at low impact to ecological goals?
27
VERN
TURN
NORT
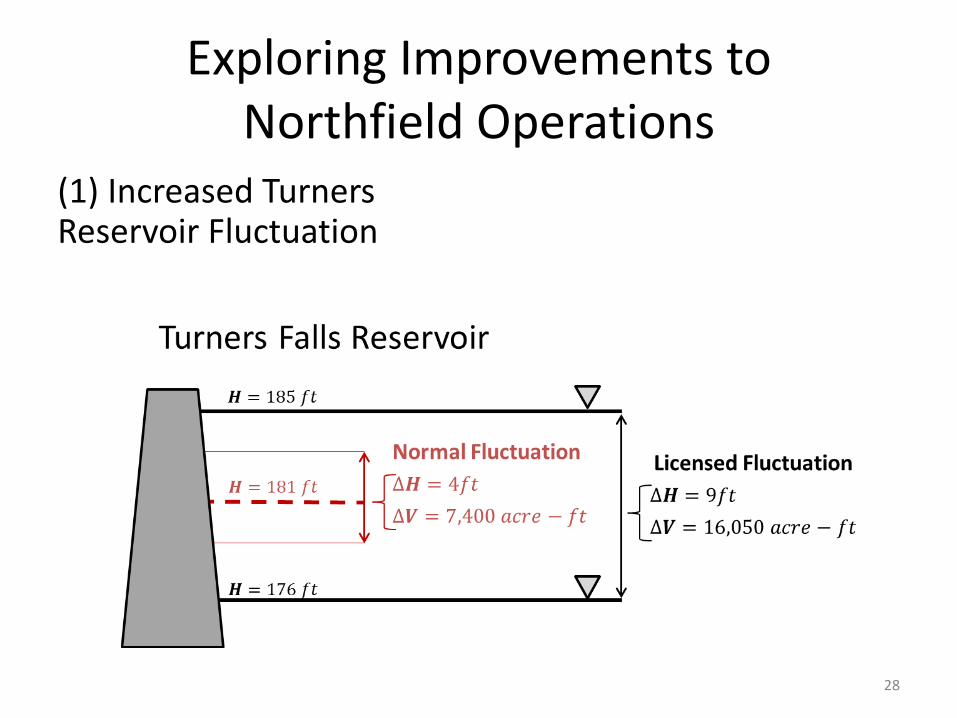
Exploring Improvements to Northfield Operations
(1) Increased Turners Reservoir Fluctuation
• Improves Northfield operations
• 4 ft reservoir fluctuation – Ecological stakeholder goal
Alternatively, allow
storage of inflows?
28
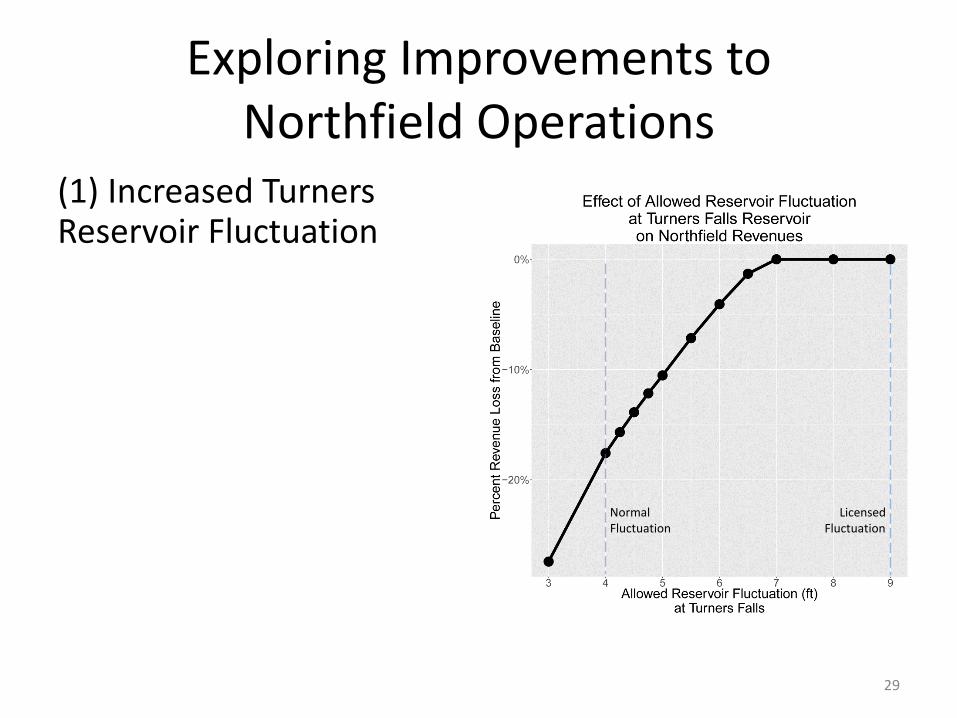
Exploring Improvements to Northfield Operations
(1) Increased Turners Reservoir Fluctuation
• Improves Northfield operations
• 4 ft reservoir fluctuation – Ecological stakeholder goal
Alternatively, allow
storage of inflows?
Normal Fluctuation
Licensed Fluctuation
29
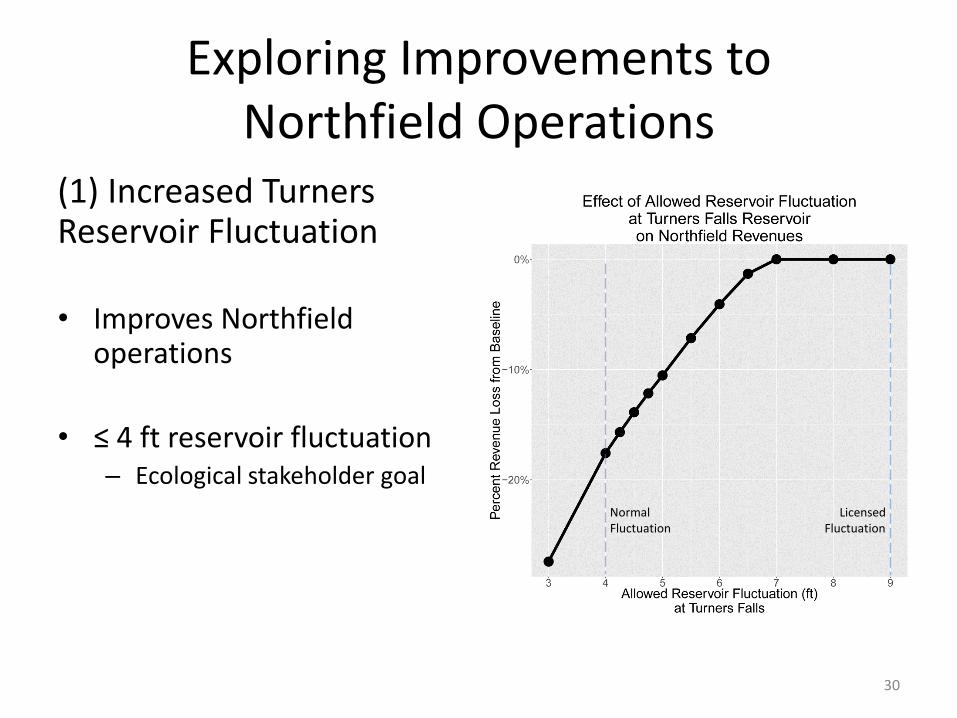
Exploring Improvements to Northfield Operations
(1) Increased Turners Reservoir Fluctuation
• Improves Northfield operations
• ≤ 4 ft reservoir fluctuation – Ecological stakeholder goal
Alternatively, allow
storage of inflows?
Normal Fluctuation
Licensed Fluctuation
30
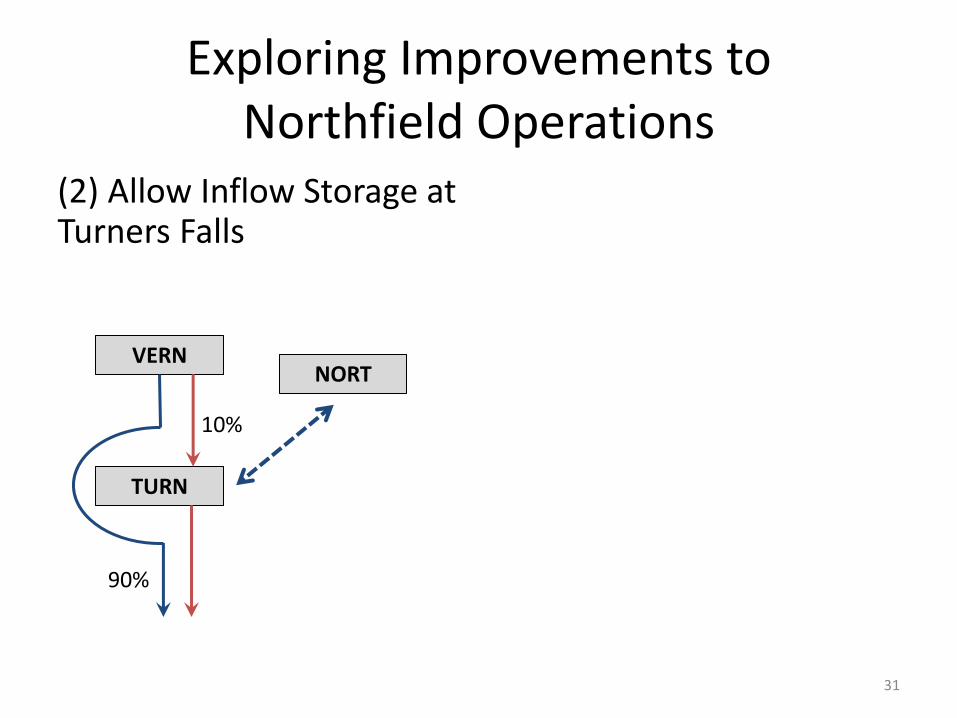
Exploring Improvements to Northfield Operations
(2) Allow Inflow Storage at Turners Falls
• Improves Northfield operations – <5% revenue losses at 15%
inflow storage
• Downstream flow regime
– Still significantly reduces flashiness • ~20% of Baseline
VERN
TURN
NORT
10%
90%
31
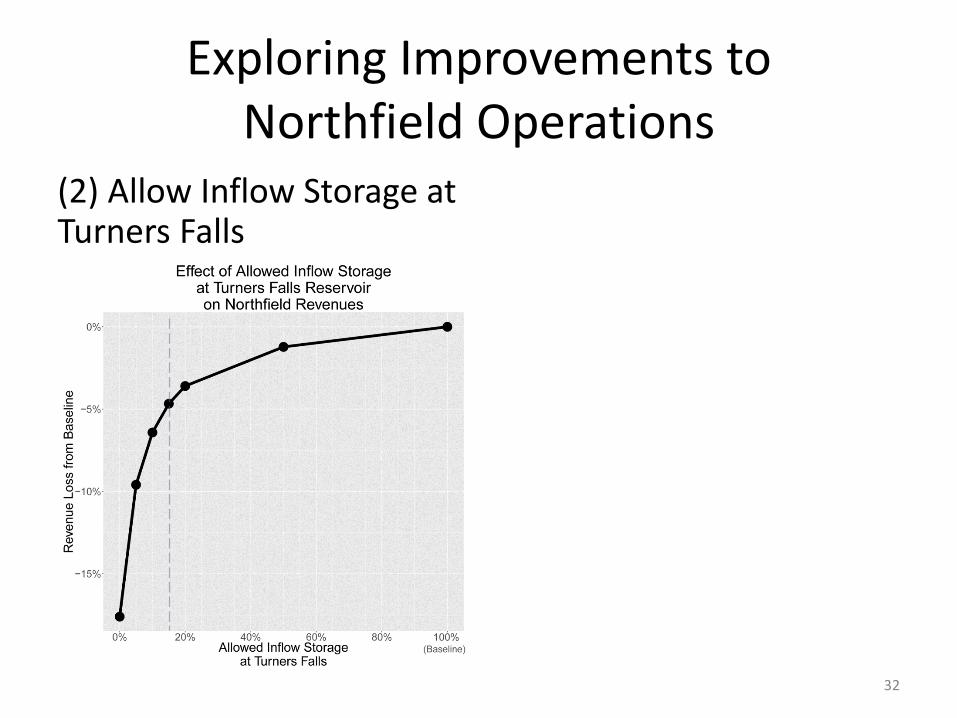
Exploring Improvements to Northfield Operations
(2) Allow Inflow Storage at Turners Falls
• Improves Northfield operations – <5% revenue losses at 15%
inflow storage
• Downstream flow regime
– Still significantly reduces flashiness • ~20% of Baseline
32
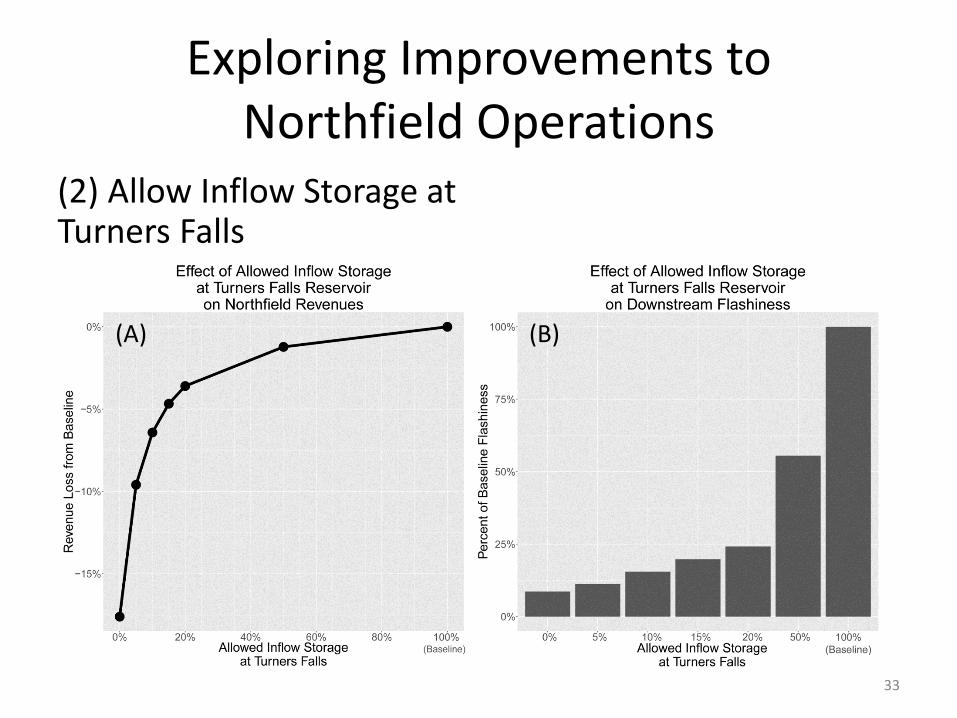
Exploring Improvements to Northfield Operations
(2) Allow Inflow Storage at Turners Falls
• Improves Northfield operations – <5% revenue losses at 15%
inflow storage
• Downstream flow regime
– Still significantly reduces flashiness • ~20% of Baseline
33
(A) (B)
• Model effectively mimics real world hydropower operations – Provides
• Estimate of power generation & revenue
• Means of assessing various implications of alternate flow regimes:
• Modeling suggests a run-of-river reoperation would: – Reduce unnatural sub-daily flow alteration
– Reduce hydropower generation revenue • Losses at Northfield could be mitigated through two alternative
operations
Conclusions
34
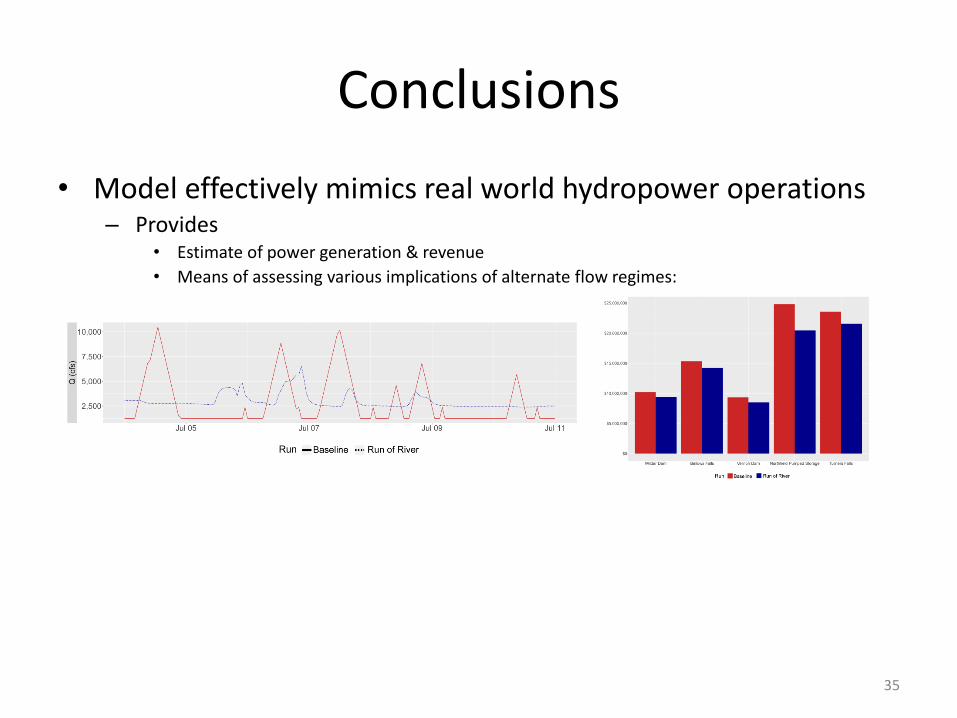
• Model effectively mimics real world hydropower operations – Provides
• Estimate of power generation & revenue
• Means of assessing various implications of alternate flow regimes:
• Modeling suggests a run-of-river reoperation would: – Reduce unnatural sub-daily flow alteration
– Reduce hydropower generation revenue • Losses at Northfield could be mitigated through two alternative
operations
Conclusions
35
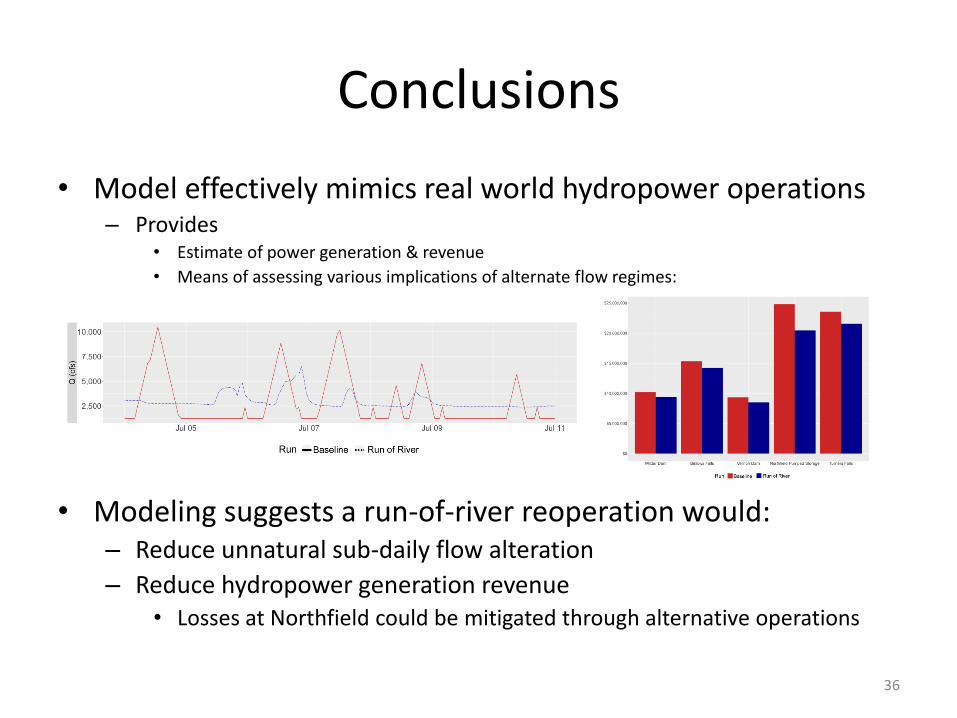
• Model effectively mimics real world hydropower operations – Provides
• Estimate of power generation & revenue
• Means of assessing various implications of alternate flow regimes:
• Modeling suggests a run-of-river reoperation would: – Reduce unnatural sub-daily flow alteration
– Reduce hydropower generation revenue • Losses at Northfield could be mitigated through alternative operations
Conclusions
36
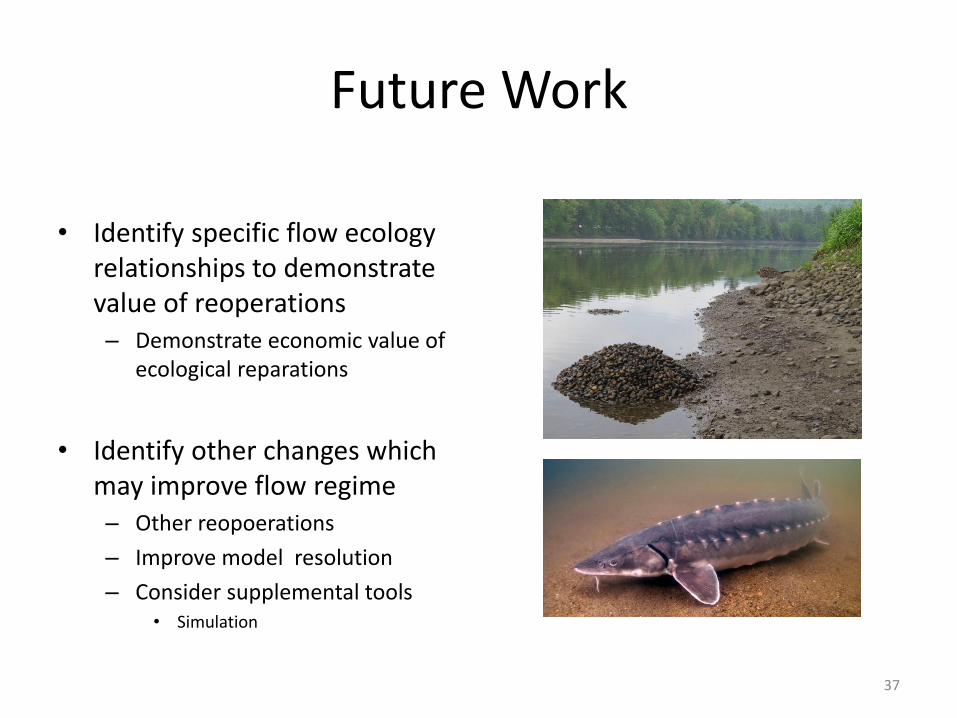
Future Work
• Identify specific flow ecology relationships to demonstrate value of reoperations – Demonstrate economic value of
ecological reparations
• Identify other changes which may improve flow regime – Other reopoerations
– Improve model resolution
– Consider supplemental tools • Simulation
37
Acknowledgements
UMass Amherst:
• Dr. Richard Palmer - Advisor
• Sohely Borjian - Modeling Support
• Dr. Brett Towler - Committee Member
The Nature Conservancy:
• Kim Lutz - Program Director
• Katie Kennedy - Applied River Scientist
38
Data & Support:
Funding: