Embed Size (px)
Citation preview
Assessing the Ecological Sustainability of theTasmanian Giant Crab fishery
A draft report prepared for the Department of Environmentand Heritage as required for assessment against the
Guidelines for the Ecologically Sustainable Management ofFisheries for the purposes of Part 13 and Part 13A of the
Environment Protection and Biodiversity Conservation Act1999
Hilary Revill
April 2006
Department of Primary Industries and Water April 2006 Page 1
Assessing the Ecological Sustainability of the Tasmanian Giant Crab Fishery
A report prepared for the Department of Environment and Heritage (DEH) as required for
assessment against the Guidelines for the Ecologically Sustainable Management of
Fisheries for the purposes of Part 13 and Part 13A of the Environment Protection and
Biodiversity Conservation Act 1999
Hilary Revill
Principal Fisheries Management Officer
Department of Primary Industries and Water
Wild Fisheries Management Branch
GPO Box 44
HOBART TAS 7001
Ph: +61 (0) 3 6233 6036
Fax: +61 (0) 3 6223 1539
Email: [email protected]
Department of Primary Industries and Water April 2006Page 2
Contents
EXECUTIVE SUMMARY 3A.1 History of the fishery 8A.2 Context of the current management plan 10A.3 Objectives of the management plan 12A.3 Availability of the policy document and management plan 13A.4 Consultative process for developing a management plan under the Act 13A.5 Stakeholder involvement in the development and assessment of a management plan 14
B ESD ASSESSMENT 16B.1 PRINCIPLE 1. 16B.1.1 Objective 1. 16
B.1.1.1 Information requirements 16B.1.1.2-5 Assessment 19B.1.1.6-9 Management responses 35
B.1.2 Objective 2. 40B.1.2.1-2 Management responses 40
B.2 PRINCIPLE 2. 45B.2.1 Objective 1. 45
B.2.1.1 Information requirements 45B.2.1.2 Assessments 47B.2.1.3-6 Management responses 48
B.2.2 Objective 2. 49B.2.2.1 Information requirements 49B.2.2.2-3 Assessments 50B.2.2.4-6 Management responses 52
B.2.3 Objective 3. 53B.2.3.1 Information requirements 53B.2.3 Assessment 54B.2.3.3-5 Management responses 56
C REFERENCES 59D APPENDICES 62
Department of Primary Industries and Water April 2006 Page 3
EXECUTIVE SUMMARY
This report provides an updated assessment of the Tasmanian Giant Crab fishery against the
Guidelines for Ecologically Sustainable Management of Fisheries. Major progress has been
made to address all the DEH recommendations following the first assessment of the fishery in
2003.
Historically associated with the Southern rock lobster fishery, the Giant crab fishery developed
substantially during the 1990s, and has been managed by Tasmania using an Individual
Transferable Quota (ITQ) system since 1999.
The crab fishery is a limited entry, minor pot fishery with a small number (< 12) of specialised
licensed fishers harvesting over 90% of the 62 tonne total allowable catch. The fishery operates
in deep water (120 – 250m) at the edge of the continental shelf. Bycatch of other species is
negligible. The risk of interactions with endangered, threatened or protected species is assessed
to be very low. The impact of the crab traps on the benthic habitat is also assessed to be of low
risk by virtue of a small total annual ‘footprint’ of approximately 150m x 150m.
The major management tools are the total allowable catch (TAC) and the minimum size limit.
The TAC is currently 62.1 tonnes. The size limit is set at a conservative level with estimated egg
production in excess of 50% of virgin production. Commercial landings are subject to a rigorous
monitoring system. Recreational and indigenous fishing is negligible.
Legislation (the management plan) provides the framework for legal access to the resource
within Tasmania’s jurisdiction. The relevant legislation was the Fisheries (Rock Lobster and
Giant Crab) Rules 2001 and from 28 February 2006 is the Fisheries (Giant Crab) Rules 2006
Strategic objectives, performance indicators and trigger points are documented in the 1999 Giant
Crab Policy Document. There is an analysis of fishery performance under the management plan
in the annual stock assessment report. The management plan expires after 5 years. Changes to
the management plan are subject to a statutory legislative review process, which includes public
consultation. The Tasmanian Police Department has responsibility for enforcing the management
plan.
At the time of the first assessment of the fishery by DEH in 2003, the giant crab fishery had been
under a quota management system for just 3 years. There was concern about the declining catch
Department of Primary Industries and Water April 2006 Page 4
rates (catch rates being the major indicator of the status of the stocks available at the time) and
potential impact of fishing operations from a separate fishing sector, not within Tasmania’s
jurisdiction. There were also gaps in the biological data about the species.
The completion of the FRDC project development of assessment tools, (Gardner et al 2006)
provides a significant improvement in the state of knowledge about relevant biological data,
particularly growth data and recruitment. The subsequent development of a stock assessment
model has dramatically enhanced the scientific basis to estimate the potential productivity of the
fished stock and the proportion that could be harvested.
The latest stock assessment report for the 2004/5 quota year (Mills and Gardner 2006 in prep.)
provides a number of positive indicators about the state of the stocks. There is robust evidence
that the current management regime and management responses within this regime are effective
and have a high probability of maintaining sustainable harvests.
Extensive research on the ecosystem and habitat has been undertaken by the FRDC project
‘Understanding shelf break habitat for sustainable management of fisheries with spatial
overlap’. This project has addressed a number of issues of habitat structure and fishery
interactions and is scheduled for completion in late 2006.
Department of Primary Industries and Water April 2006 Page 5
A INTRODUCTION
The Tasmanian Department of Primary Industries, Water and Environment (DPIWE) prepared
and submitted a report, Assessing the Ecological Sustainability of the Tasmanian Giant Crab
Fishery, to Environment Australia in April 2003 for assessment under Parts 13 and 13A of the
Environment Protection and Biodiversity Conservation Act 1999 (EPBC Act). A copy of this
report is available from the DEH website, http://www.deh.gov.au/coasts/fisheries/tas/giant-
crab/submission.html.
The Tasmanian Giant crab fishery was assessed by Environment Australia and declared
approved as a Wildlife Trade Operation in July 2003, subject to conditions, in accordance with
Part 13A of the EPBC Act.
DPIWE was to achieve the following recommendations before the next review in 2006:
Recommendation 1
DPIWE to inform EA of any changes to the Management Plan or to the Giant Crab Policy
Document that may impact on the sustainability of the Giant Crab fishery.
DPIWE 2003 review report was forwarded to DEH.
Recommendation 2
Further research and analysis to be undertaken into giant crab biology, in particular:
a. Estimation of recruitment to the fishery;
b. Completion of the analysis of existing growth rate information;
c. Estimation of fishing mortality;
d. Ecosystem and habitat research
FRDC project 2002/238 Development of the tools for long-term management of the giant crab resource:
data collection methodology, stock assessment and harvest strategy evaluation. This project has been completed
and addresses dot points a – c. The draft final report (Gardner et al 2006) ‘development of assessment tool’s is
currently with FRDC for their consideration and approval prior to distribution.
FRDC project 2004/066 ‘Understanding shelf break habitat for sustainable management of fisheries with
spatial overlap’. (this project will be referred to as FRDC project ‘understanding shelf break habitat’ ) The
project is due to be completed by the end of 2006 and addresses dot point d.
Recommendation 3
DPIWE to develop and implement an ongoing data collection and monitoring system to enable
identification of long term trends in giant crab discards within two years.
Department of Primary Industries and Water April 2006 Page 6
Fishers record details of giant crab discards (returned to sea) in logbook data (section 1.1.1).
How this data is used in the stock assessment is discussed in section 1.1.2
Recommendation 4
DPIWE to participate in any cross-jurisdictional activities regarding the target species and any
relevant by-product species. All available information regarding removals of giant crab by other
jurisdictions and sectors (including Commonwealth trawlers) is to be factored into annual stock
assessments.
DPIWE participated in various cross jurisdictional activities facilitated by DAFF and NOO.
How crab removals by the trawl sector are factored into the stock assessment is discussed in section 1.1.4
Recommendation 5
DPIWE to develop and implement, within three years, meaningful performance indicators and
trigger points relating to legal size biomass and egg production. If existing research yields
sufficient biological data, this work should be undertaken as soon as possible.
Addressing this recommendation was totally reliant on the additional biological data generated through the
FRDC project developing assessment tools. This project was not able to commence until about 18 months later
than was anticipated when the first assessment report was drafted. Hence DPIWE has not been able to address
this recommendation to date. However, as a draft final report (Gardner et al 2006) has now been submitted to
FRDC, a review of meaningful indicators and triggers for the crab fishery is scheduled as a high priority.
Recommendation 6
DPIWE to continue to respond actively and without delay to the activation of trigger points in
the policy document by developing and implementing specific management strategies in
response to any sustainability issues that may be raised by the activation of trigger points.
Details of the activation of trigger points and management responses are discussed in section 1.1.6
Recommendation 7
DPIWE to develop and implement a recovery strategy within one year to actively promote the
recovery of giant crab stocks to ecologically viable stock levels. EA notes that the review and
development of a rebuilding strategy as required under the Giant Crab Policy Document is
underway. DPIWE to advise EA of the outcomes of that review.
Recommendations from the DPIWE 2003 Review report were implemented.Giant crab fishery total allowable catch was lowered from 103.5 tonnes to 62.1 tonnes (recommendation fromreview report) for the 2004/5 quota year. The TAC has remained at this level for the 2005/6 and 2006/7 quotayears.
Department of Primary Industries and Water April 2006 Page 7
Recommendation 8
DPIWE to investigate strategies to assess, on an ongoing basis, changes in bycatch trends in the
fishery within two years.
A number of strategies were considered. A research program has been initiated to provide ongoing monitoring
of bycatch in the absence of a regular observer program (which is not economically feasible). This involves
bycatch data collection by fishers at sea using waterproof disposable cameras. This project is funded by
DPIWE and is ongoing with results to be reported in the next stock assessment.
Recommendation 9
To support the implementation of the Protected Species Interaction Monthly Record, DPIWE to
develop and implement an education program for fishers to promote the importance of protected
species protection and accurate incident reporting within one year.
Amendments to the Giant crab catch effort logbook including the addition of a protected species interaction
monthly record were implemented in March 2006. (the implementation date anticipated in 2003 assessment was
subject to number of delays)
The education program includes direct contact between individual fishers and DPIW staff (see section 2.2.4)
Recommendation 10
DPIWE, in collaboration with industry, to develop and encourage the adoption of an
environmental code of practice that aims to minimise fishing effects on ecosystems, threatened
species and threatened ecological communities within three years and develop and implement a
means of monitoring fisher adoption of the code of practice.
The Tasmanian Rock Lobster Fishermen’s Association (TRLFA), )the peak industry body representing rock
lobster and giant crab fishers) has actively promoted the adoption an certified environmental management
system called the “Clean green program”. DPIW has supported adoption of the program and is monitoring
fisher adoption of the voluntary program. (see section 2.3.3)
Recommendation 11
DPIWE to collaborate with the Australian Fisheries Management Authority on collecting data
and assessing the impact of harvest and incidental damage to giant crabs and their habitat by
trawling activity in Tasmanian giant crab fishing grounds as defined under the Commonwealth's
Offshore Constitutional Settlement (OCS) agreement with Tasmania.
This recommendation is being addressed through the FRDC project Understanding Shelf break habitat.
Recommendation 12
Department of Primary Industries and Water April 2006 Page 8
DPIWE to initiate research to assess the risk of ghost fishing within one year and develop
management strategies to address the risk of ghost fishing by lost giant crab pots within three
years should the research indicate significant risk of ghost fishing.
The potential for crab traps to ghost fish is being assessed through a number of research investigations. (see
section 2.3.2)
The estimated number of traps lost per year is believed to be very low
A.1 History of the fishery
The Tasmanian commercial crab fishery targets the Giant crab (Pseudocarcinus gigas), formerly
referred to as the King crab, in the waters adjacent to Tasmania. The Giant crab fishery is
relatively recent, with commercial fishing commencing in 1992 (Ford, 1998). Prior to this,
Tasmanian Giant crabs were taken as a bycatch of the rock lobster, shark and trawl fisheries
(Ford, 1998) and as part of an experimental fishery (Dix and Sumner, 1980). At that time,
information about both the species and geographic distribution of fishing effort was insufficient
to commence management of the resource (Levings et al, 2001). Giant crabs are predominantly
taken at the edge of the continental shelf at depths between 150m and 300m, but are present
within a depth range of 18m to more than 500m.
Management of the fishery effectively commenced in 1993 when the Australian Fisheries
Management Authority began issuing permits (under Section 32 (1) of the Fisheries
Management Act 1991) for the targeting of Giant crabs in Commonwealth waters (Ford, 1998).
The first management measures, comprising a 150mm size limit and the prohibition of the taking
and possession of berried females, were implemented in 1993 (Ford, 1998). Subsequent
negotiations between Tasmania, Victoria, South Australia and the Commonwealth led, as from 1
January 1997, to the signing of an Offshore Constitutional Settlement (OCS) (Anon, 1996)
between Tasmania and the Commonwealth. The OCS granted the State of Tasmania jurisdiction
over the Giant crab fishery in waters generally south of 39° 12’, and out to 200 nautical miles
from the coastline. Subsequently (January 1998), Commonwealth permit holders who wished to
continue fishing in Tasmanian waters had to obtain a Tasmanian permit (Ford, 1998). A total of
106 permits to fish for Giant crab in Tasmania were issued (Levings et al, 2001).
Historically, the fishery has operated as a traditional adjunct to the Tasmanian rock lobster
fishery, with rock lobster fishers recording Giant crab catches from the late 1970s. From the late
Department of Primary Industries and Water April 2006 Page 9
1980s, vessels operating as part of the SE demersal trawl fishery began landing Giant crabs
sporadically as bycatch (Gardner & Mackinnon, 2002). With the development of techniques for
holding and transporting live fish (Gardner, 1998), came new export markets. As a result, the
taking of Giant crabs by rock lobster fishers using modified rock-lobster pots (traps) (and also as
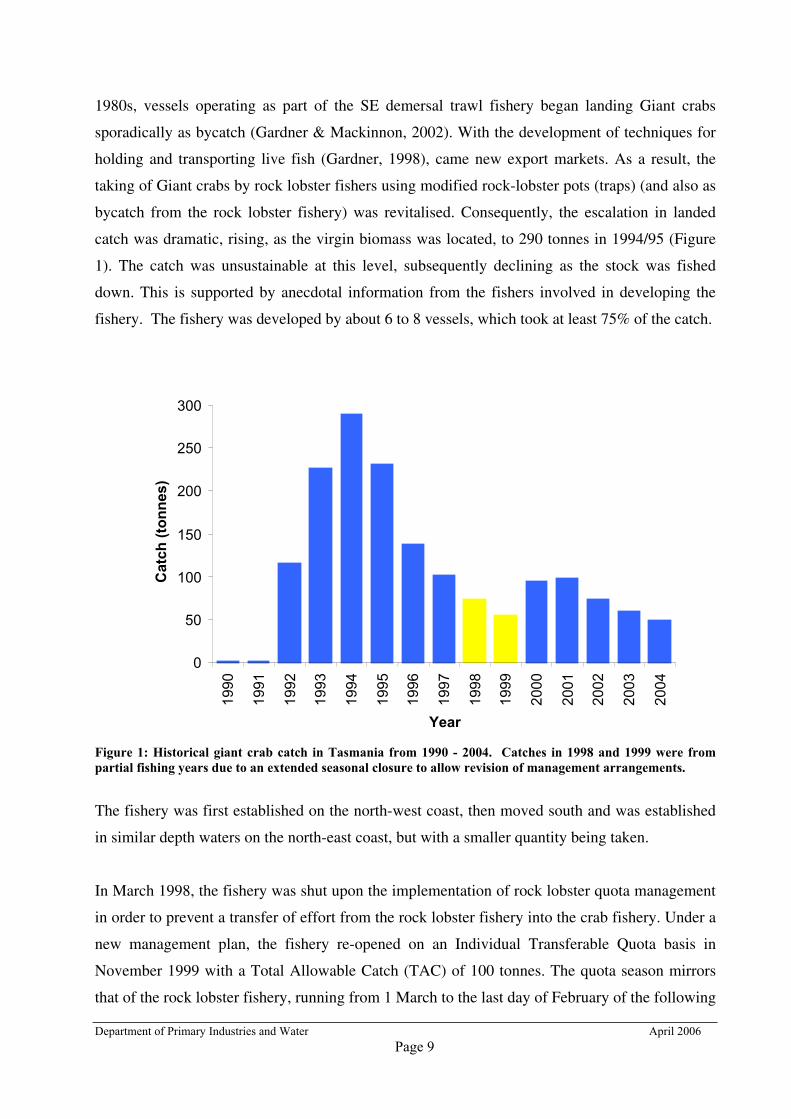
bycatch from the rock lobster fishery) was revitalised. Consequently, the escalation in landed
catch was dramatic, rising, as the virgin biomass was located, to 290 tonnes in 1994/95 (Figure
1). The catch was unsustainable at this level, subsequently declining as the stock was fished
down. This is supported by anecdotal information from the fishers involved in developing the
fishery. The fishery was developed by about 6 to 8 vessels, which took at least 75% of the catch.
Figure 1: Historical giant crab catch in Tasmania from 1990 - 2004. Catches in 1998 and 1999 were frompartial fishing years due to an extended seasonal closure to allow revision of management arrangements.
The fishery was first established on the north-west coast, then moved south and was established
in similar depth waters on the north-east coast, but with a smaller quantity being taken.
In March 1998, the fishery was shut upon the implementation of rock lobster quota management
in order to prevent a transfer of effort from the rock lobster fishery into the crab fishery. Under a
new management plan, the fishery re-opened on an Individual Transferable Quota basis in
November 1999 with a Total Allowable Catch (TAC) of 100 tonnes. The quota season mirrors
that of the rock lobster fishery, running from 1 March to the last day of February of the following
0
50
100
150
200
250
300
1990
1991
1992
1993
1994
1995
1996
1997
1998
1999
2000
2001
2002
2003
2004
Year
Cat
ch (t
onne
s)
Department of Primary Industries and Water April 2006 Page 10
year. The Giant crab fishery is integrated with the Rock Lobster fishery, as it is a requirement of
the management plan that Giant crab fishers must also be holders of a rock lobster fishing
entitlement (licence).
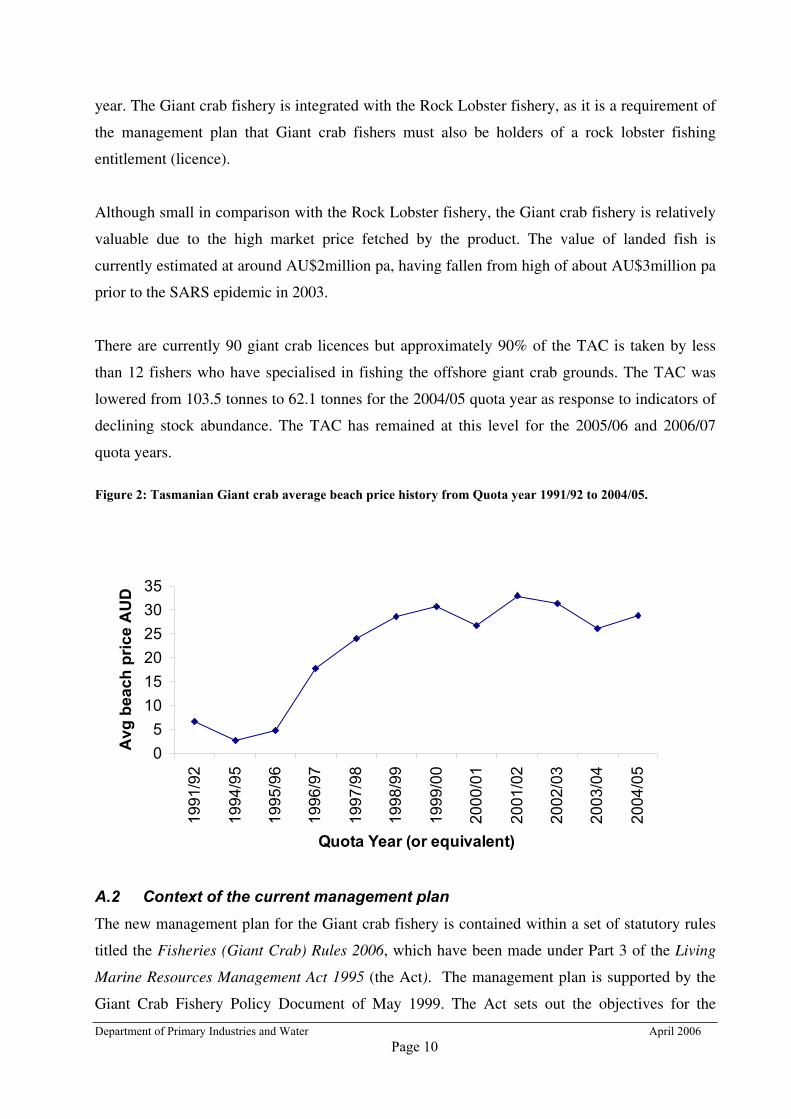
Although small in comparison with the Rock Lobster fishery, the Giant crab fishery is relatively
valuable due to the high market price fetched by the product. The value of landed fish is
currently estimated at around AU$2million pa, having fallen from high of about AU$3million pa
prior to the SARS epidemic in 2003.
There are currently 90 giant crab licences but approximately 90% of the TAC is taken by less
than 12 fishers who have specialised in fishing the offshore giant crab grounds. The TAC was
lowered from 103.5 tonnes to 62.1 tonnes for the 2004/05 quota year as response to indicators of
declining stock abundance. The TAC has remained at this level for the 2005/06 and 2006/07
quota years.
Figure 2: Tasmanian Giant crab average beach price history from Quota year 1991/92 to 2004/05.
A.2 Context of the current management planThe new management plan for the Giant crab fishery is contained within a set of statutory rules
titled the Fisheries (Giant Crab) Rules 2006, which have been made under Part 3 of the Living
Marine Resources Management Act 1995 (the Act). The management plan is supported by the
Giant Crab Fishery Policy Document of May 1999. The Act sets out the objectives for the
05
101520253035
1991
/92
1994
/95
1995
/96
1996
/97
1997
/98
1998
/99
1999
/00
2000
/01
2001
/02
2002
/03
2003
/04
2004
/05
Quota Year (or equivalent)
Avg
bea
ch p
rice
AU
D
Department of Primary Industries and Water April 2006 Page 11
sustainable management of living marine resources in Tasmania and provides the framework for
developing and implementing management plans for each of the State’s fisheries. The objectives
of the legislation are provided in Section 7 and Schedule 1 of the Act and are consistent with the
objectives of the resource management planning system of Tasmania.
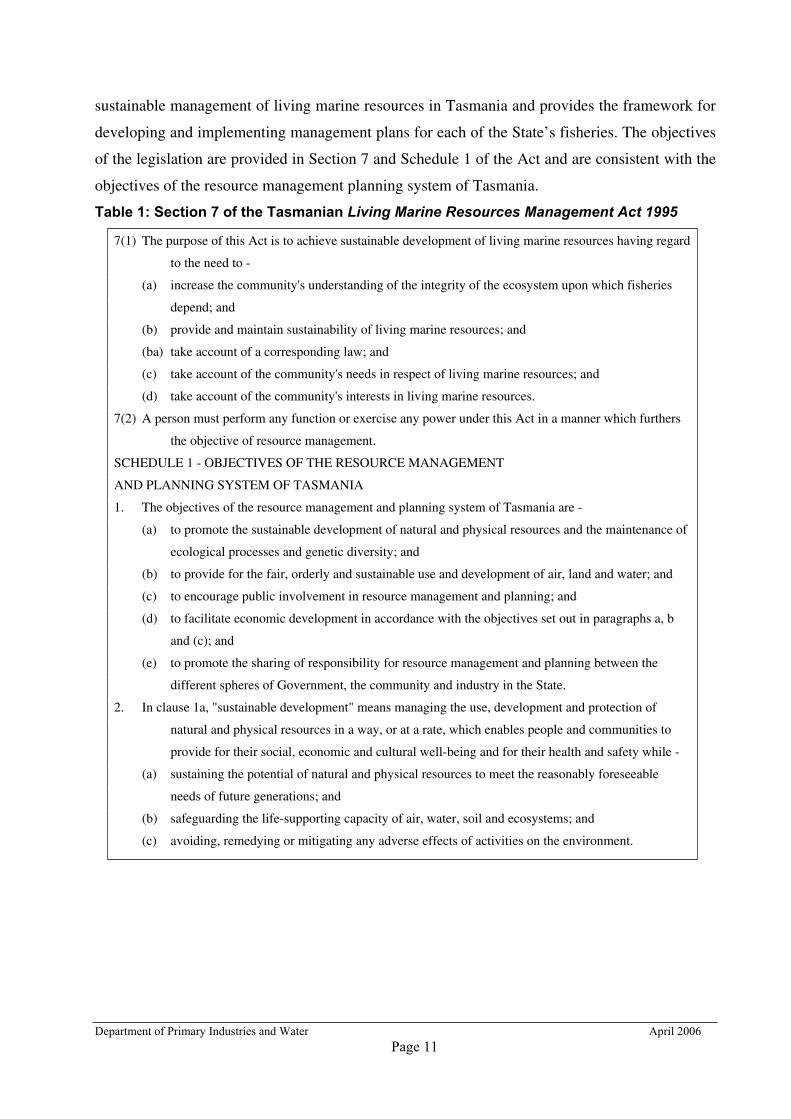
Table 1: Section 7 of the Tasmanian Living Marine Resources Management Act 1995
7(1) The purpose of this Act is to achieve sustainable development of living marine resources having regard
to the need to -
(a) increase the community's understanding of the integrity of the ecosystem upon which fisheries
depend; and
(b) provide and maintain sustainability of living marine resources; and
(ba) take account of a corresponding law; and
(c) take account of the community's needs in respect of living marine resources; and
(d) take account of the community's interests in living marine resources.
7(2) A person must perform any function or exercise any power under this Act in a manner which furthers
the objective of resource management.
SCHEDULE 1 - OBJECTIVES OF THE RESOURCE MANAGEMENT
AND PLANNING SYSTEM OF TASMANIA
1. The objectives of the resource management and planning system of Tasmania are -
(a) to promote the sustainable development of natural and physical resources and the maintenance of
ecological processes and genetic diversity; and
(b) to provide for the fair, orderly and sustainable use and development of air, land and water; and
(c) to encourage public involvement in resource management and planning; and
(d) to facilitate economic development in accordance with the objectives set out in paragraphs a, b
and (c); and
(e) to promote the sharing of responsibility for resource management and planning between the
different spheres of Government, the community and industry in the State.
2. In clause 1a, "sustainable development" means managing the use, development and protection of
natural and physical resources in a way, or at a rate, which enables people and communities to
provide for their social, economic and cultural well-being and for their health and safety while -
(a) sustaining the potential of natural and physical resources to meet the reasonably foreseeable
needs of future generations; and
(b) safeguarding the life-supporting capacity of air, water, soil and ecosystems; and
(c) avoiding, remedying or mitigating any adverse effects of activities on the environment.
Department of Primary Industries and Water April 2006Page 12
A.3 Objectives of the management plan
Management objectives and strategies for the fishery (1999 Giant Crab policy document)
Objective 1 - To maintain fish stocks at optimum sustainable levels by constraining the totalcatch and the size of individual giant crabs taken by the commercial sector.
Strategies1. Limiting the targeted commercial catch through setting a total allowable catch (TAC) and
using individual transferable quotas to allocate proportions of the TAC.
2. Limiting access to by-catches of giant crabs.
3. Minimise the opportunity for illegal activity through a monitoring, compliance and
enforcement strategy.
4. Conserving egg production and restricting fishing mortality on spawning or berried female
giant crabs by the use of minimum size limits and the closure of the fishery for female giant
crabs during the peak spawning period.
5. Conserve breeding capability by introducing a maximum size limit to ensure a proportion oflarge males and females are returned to the water.
Objective 2 - Managing commercial fishing interactions
To mitigate any conflict that results from competition between different fishingmethods for access to shared fishing grounds
Strategies1. Restrict the number of giant crab traps/pots that can be used from individual fishing vessels.
2. Restrict the number of giant crab fishing vessels in the fishery.
3. Restrict the separation of licences for the giant crab and rock lobster fisheries.
Objective 3 - Sustaining yield and reducing incidental fishing mortality
To take fish at a size likely to result in the best use of the yield from the fishery. To provide measures to protect under-size giant crabs To minimise incidental fishing mortality as a result of fishing operations.
Strategies1. Maintenance of size limits.
2. Escape gaps (incidental fishing mortality).
Objective 4 - Providing socio-economic benefits to the community
To recover a financial contribution from the commercial giant crab fishers tocontribute to the real costs of management, compliance and research. To ensure the giant crab fishing fleet continues to provide employment and aneconomic return to coastal communities of Tasmania.
Department of Primary Industries and Water April 2006 Page 13
Strategies1. Determine the real costs of management, compliance and necessary research costs for the
giant crab fishery.
2. Equitably pass on the additional management and research costs, as identified in this
document, to participants in the giant crab fishery.
3. Optimising the economic return to fishers from the resource by providing flexible and
workable operating rules, which can be enforced in a cost efficient manner.
4. Collecting a granting fee and an annual resource levy for each quota unit to provide a returnto the Community.
Objective 5 - Providing high quality produce
To promote and maintain handling and processing practices which ensure the highestquality giant crab product for human consumption.
Strategies1. Promote quality carrying, handling and storage practices for giant crab on board fishing
vessels and by fish processors, through the use of codes of practice and industry initiatives.
The development of a new strategic policy document for the fishery and review of the currentobjectives and strategies is a high priority.
A.3 Availability of the policy document and management plan
The Giant Crab Policy Document 1999 is a public document and is available from the
Department of Primary Industries and Water website (www.dpiw.tas.gov.au). The management
plan (Fisheries (Giant Crab) Rules 2006) is available from the Tasmanian Government
legislation website (www.thelaw.tas.gov.au) as well as the Printing Authority of Tasmania. The
fishery stock assessment reports produced by the Tasmanian Aquaculture and Fisheries Institute
are available from the TAFI website (www.utas.edu.au/docs/tafi).
A.4 Consultative process for developing a management plan under the Act
The Act prescribes a consultative process for both the development and review of a management
plan. However, in practice the consultation process is often more comprehensive than the
minimum requirements prescribed in the Act.
Department of Primary Industries and Water April 2006 Page 14
The following consultative process was followed for the 2005 review of the rock lobster and
giant crab fisheries management plan -
Consultation with the relevant Ministerial Fishery Advisory Committee, in this case the Crustacean Fisheries
Advisory Committee (CFAC) and the Recreational Fishery Advisory Committee (RecFAC);
Consultation with any appointed fishing body, in this case the Tasmanian Rock Lobster Fishermen’s
Association (TRLFA) as well as the industry peak body, the Tasmanian Fishing Industry Council (TFIC) and
TARFish, the recreational peak body;
The preparation and distribution of an issues paper and questionnaire to licence holders, licence users,
representative bodies, and any interested party, supported by regional port meetings prior to the preparation of a
draft management plan;
The draft plan was approved by the Minister for release for public comment, which in practice means sending it
to licence holders and various recreational, conservation and aboriginal groups and placing notices of its
availability in the papers and on the web;
A public comment period of at least 60 days;
Conduction of regional port meetings to discuss the draft proposals;
Consideration of written submissions by the Department and Advisory Committees.
A report was submitted to the Minister on issues raised in written submissions and recommendations for
changes to the draft plans.
Once approved by the Minister, the management plan is tabled in State Parliament for fixed number of sitting
days. The legislation may be debated and passed or all or part of the rules may be disallowed. The subordinate
legislation committee may take submissions and conduct a hearing if satisfied the rules are not in the interest of
the public, or can not be justified, or have not been made lawfully.
A.5 Stakeholder involvement in the development and assessment of amanagement plan
As described in the previous section, there is a statutory process, which provides an opportunity
for any interested person to make submissions on the development of a management plan or on
changes to a plan.
Ongoing stakeholder involvement in the management of the Giant crab fishery is through the
expertise based Crustacean Fisheries Advisory Committee (CFAC). This committee is appointed
by the Minister under the Living Marine Resources Management Act 1995 to provide advice
about the management of the Giant crab fishery. The committee is comprised of: three industry
members nominated by the TRLFA; a representative of the Tasmanian Fishing Industry Council
(TFIC); a rock lobster fisher not on the TRLFA board; two giant crab fishers (one with 15 +
quota units); the executive officer of the TRLFA; two processing sector representatives; the
Department of Primary Industries and Water April 2006 Page 15
DPIW fishery manager; a TAFI research representative; a Marine Police representative; the
DPIW Chief Fisheries Investigations Officer; a conservation / community representative
nominated by the Tasmanian Conservation Trust. There is an independent chairperson and the
executive officer is provided by DPIW - 17 persons in total.
The committee meets four to five times per year and the term of appointment is for two years.
The Crustacean Research Advisory Group (CRAG) provides strategic research planning advice
for the rock lobster and giant crab fisheries, to the Tasmanian Aquaculture and Fisheries Institute
(TAFI) and the Tasmanian Fisheries Research Assessment Board. The CRAG is appointed by
the Director of TAFI. This group includes research scientists from TAFI, CSIRO and the
Australian Maritime College, the commercial and recreational fishery managers, commercial and
recreational representatives and one conservation /community representative. The group meets
one to two times per year.
The Crustacean Fisheries Assessment Working Group includes TAFI research scientists, the
commercial and recreational fishery managers, commercial and recreational representatives. This
group provides advice to TAFI, DPIW and the CFAC relating to the assessment of the fishery
and the total allowable catch. The group meets one to two times per year.
Department of Primary Industries and Water April 2006 Page 16
The following sections of this assessment report are presented to address the “Guidelines for the
Ecologically Sustainability Management of Fisheries” produced by The Department of
Environment and Heritage. The headings, principles and objectives are presented using the same
numbering as the guidelines.
B ESD ASSESSMENT
B.1 PRINCIPLE 1.
A fishery must be conducted in a manner that does not lead to over-fishing, or for those
stocks that are over-fished, the fishery must be conducted such that there is a high degree
of probability the stock(s) will recover.
B.1.1 Objective 1.
The fishery shall be conducted at catch levels that maintain ecologically
viable stock levels at an agreed point or range, with acceptable levels of
probability.
B.1.1.1 Information requirements
1.1.1 There is a reliable information collection system in place appropriate to the scale of the
fishery. The level of data collection should be based upon an appropriate mix of fishery
independent and dependent research and monitoring.
Fishery dependent information
Giant crab catch and effort logbook
The giant crab catch and effort logbook program has been place since 1999 (prior to this
catch and effort data was recorded in a general fishing logbook). The provision of log sheets
on a monthly basis is mandatory. Fishers cannot renew their giant crab licence unless all their
Department of Primary Industries and Water April 2006 Page 17
log sheets have been submitted. Giant crab fishers are required to complete a daily catch and
effort log sheet by midnight for every day that fishing occurs.
Data collected includes: date, time, depth, position and number of traps set; date, and time
traps were hauled; number of male and female crabs retained; number of undersize crabs
discarded; number of legal size discarded, and number and weight of crabs unloaded.
There have been no changes to the logbook between the first Department of the Environment
and Heritage (DEH) assessment of the fishery in 2003 until March this year when a number
of additional data fields were incorporated. Additions included protected species interaction,
numbers of fish placed in a fish cauf, and markers to indicate which sets contributed to each
unloading. The record of discards was also expanded to collect data on numbers of over size
male discards and numbers of berried and un-berried females discarded. From 1 March 2006
the discard section was made voluntary instead of mandatory.
Copies of the catch effort logsheets pre March 2006 (Appendix 1a) and the revised logsheets
(Appendix 1b) are included in this report.
The change to voluntary reporting of discards has been done in part to increase data precision, as
there is no method to enforce this data collection. Making this section voluntary reduces the risk
of the collection of spurious data. The other reason for the shift is that discard data is of limited
value for fisheries assessment and of much less value than length frequency (LF) data. Many
fishers collect LF data on a voluntary basis. Reducing the workload of fishers in discard
reporting increases their ability to participate in the more valuable LF data collection.
Note that discarding of crabs is not of concern in terms of increased mortality of crabs. Crabs do
not contain air spaces so are unaffected by pressure changes during hauling. They remain
healthy after hauling as evidenced by their survival in the live export market. Discard mortality
of other crustaceans such as rock lobsters has repeatedly been shown to be non-detectable /
negligible as evidenced by natural mortality estimates derived from tag-recapture data that
incorporates discard mortality. Giant crabs would be expected to have lower discard mortality
than rock lobsters as they are less associated with specific (reef) habitat, so predation risk
through landing on inappropriate habitat is reduced. Discard mortality has been examined in
other deep sea crabs (eg king crabs Lithodes aequispinus) by tracking discarded crabs using
acoustic tags and manned submersible – with the conclusion of zero discard mortality.
Experiments on giant crab include placing crabs in traps that were sealed and hauled one week
Department of Primary Industries and Water April 2006 Page 18
later to determine survival (100%) and estimation of mortality from tag-recapture data indicated
no discard mortality; (Levings et al. 2001).
Additional voluntary data collection.
Voluntary collection of length frequency data using electronic callipers is conducted by 5 of
the 12 major fishers. This type of data collection is vital in a small scale fishery with
relatively low economic value, where scientific observer programs are simply not cost
effective. Participation has been excellent with some fishers recording lengths from 100% of
their catch.
Giant crabs can only be retained as byproduct by Tasmanian rock lobster fishers and
Commonwealth trawl operators. Catch and effort information on this byproduct is recorded in
the Tasmanian General fishing logbook by rock lobster fishers and in the appropriate
Commonwealth catch effort logbook by trawl operators.
No discard data is collected from rock lobster fishers. Discards are likely to be negligible
given the low number of crabs retained and the fact that the majority of rock lobster fishing in
occurring in shallower waters outside normal crab habitat. Some information on giant crab
discards from trawlers is collected from the scientific observer program for the South East
Fishery.
Validation of fishery dependent data
Landings of all giant crab are subject to the rigorous reporting requirements of the giant crab
quota monitoring system. The QMS involves completion of documentation including an
accurate weight of giant crab before the crabs leave the wharf and real time telephone reports
prior to landing and transport to a processing premise. The processor is required to validate
the weight of landed crab. A copy of the giant crab quota docket is attached. (Attachment 1c)
Rock Lobster fishers who land giant crab as byproduct are subject to similar rigorous
reporting requirements in the rock lobster quota monitoring system. This system provides an
accurate weight of giant crab landed by rock lobster fishers.
AFMA provides DPIW with a total weight of crabs (recorded as king crabs or giant crabs)
declared in the relevant logbook. This weight is validated against catch disposal records.
Department of Primary Industries and Water April 2006 Page 19
Any discrepancies on the Tasmanian catch effort log sheets are followed up by staff in the
logbook monitoring section with the fisher concerned. Annual auditing of the catch effort
logbook unloaded weight and comparison with the weights declared on quota dockets
provides an additional check on the catch effort data. In general, the majority of fisher catch
records match their quota records. Accuracy of catch effort data is also enhanced by the
requirement to complete log sheets on a daily basis rather than fishers “remembering” data at
the end of each month. At sea police inspections and the penalties associated with breaches of
the reporting requirements provide a significant deterrent.
Fishery independent information
Fisheries independent information has been collected from the catch sampling associated with
the FRDC project 2001/042 entitled: Developing the tools for long-term management of the
giant crab resource: Data collection methodology, stock assessment and harvest strategy
evaluation. (This project will be referred to as the FRDC project to develop assessment
tools). Outcomes from this project are detailed in the next section (Gardner et al 2006).
On going routine collection of fishery independent data is not economically feasible for this
fishery, hence future data collection will be on an ad hoc basis.
B.1.1.2-5 Assessment
There is a robust assessment of the dynamics and status of the species/fishery and periodic
review of the process and the data collected. Assessment should include a process to identify
any reduction in biological diversity and/or reproductive capacity. Review should take place at
regular intervals but at least every three years.
The Giant crab fishery is formally assessed annually through the preparation of a fishery
assessment report. The assessment uses all the data described in the previous section to provide
an assessment of the fishery evaluated against the performance indicators and triggers points
specified in the Giant Crab Fishery Policy Document 1999 and are detailed in section 1.1.6. The
fishery assessment also provides other analyses including bycatch of other species, byproduct
species, protected species interactions, ecosystem impacts and interactions, spatial distribution of
catch and effort, structure of catches including undersize, male/female and discards.
Department of Primary Industries and Water April 2006 Page 20
DEH made a specific recommendation following the first assessment of the fishery that further
research and analysis to be undertaken into giant crab biology, in particular:
a. Estimation of recruitment to the fishery;
b. Completion of the analysis of existing growth rate information;
c. Estimation of fishing mortality;
d. Ecosystem and habitat research.
This has been achieved through two significant FRDC research projects. The first project has
been completed and addresses dot points a – c. The draft final report (Gardner et al 2006)
‘development of assessment tool’s is currently with FRDC for their consideration and approval
prior to distribution. The draft report is a large document and is available on CD for DEH staff if
required.
The results of this project were incorporated in the 2004/05 fishery assessment. (Mills and
Gardner 2006 in prep) As this project is highly relevant to this section, a summary of the
objectives and key outcomes from the draft final report is detailed below.
FRDC project 2002/238 Development of the tools for long-term management of the giant
crab resource: data collection methodology, stock assessment and harvest strategy evaluation.
Principal investigator Dr Caleb Gardner TAFI
Objectives1. To develop a low cost, long term, giant crab resource assessment and data collection
methodology.
2. To quantify biases in the historical logbook data to increase its value for resource
assessments.
3. To obtain industry’s understanding/observations of basic biological and market processes
(eg. moulting, egg-bearing, mating, migration, beach price influences) and how their fishing
effort is adapted to this knowledge (eg. targeting of size classes, seasonality of effort, etc.).
4. To develop the ability to investigate alternative harvest strategies (sustainability of different
TACs, closed seasons etc.).
Non-Technical Summary
Outcomes achievedThe project has developed tools for low cost assessment of the giant crab resource across
southern Australia.
Department of Primary Industries and Water April 2006 Page 21
Historical data sets have been “cleaned” and corrected so that they have become more
informative about changes in the fishery during the period when the virgin biomass was
being fished down. The presence of known errors in these data sets, such as deliberate
under-reporting of effort, had distracted discussion of giant crab management prior to this
project. The ability to correct for these types of problems has enabled discussions to move
beyond debate about statistics to more constructive discussion of management options.
This project was constructed with the awareness that the resource was small and the fishery
would have little ability to fund expensive data collection systems in the future, beyond catch
rate data from logbooks. Size structure data from the fishery was considered the main data
type to be valuable for ongoing assessment, but also expensive to collect. Fishers have
enthusiastically adopted electronic callipers combined with an electronic data logger, the
solution developed in this project. This system has dispensed with paper records so that
work at sea is easier, and costs for data management (e.g. data entry) are reduced.
A length-based stock assessment model has been developed and provides a significant
benefit for giant crab management. Guidance on alternative management options, especially
alternative TACs, has enhanced management. A range of analyses including catch rate
standardisation and re-analysis of tag-recapture data to estimate growth parameters
underpinned the stock assessment modelling process. Fisher’s knowledge was collated
through interviews and contributed to this process, especially for CPUE standardisation.
Specialised software was developed for conducting model runs to facilitate altering
parameters, running a range of alternative scenarios, and plotting outcomes.
Use of the new stock assessment model
The following extract from the draft 2004/5 fishery assessment report describes how the new
stock assessment model is being used in the Tasmanian Giant Crab Fishery.
IntroductionA size-based stock assessment model using an annual time-step was developed using methods similar tothose described by Punt and Kennedy (1997) who developed a size-based model for the Tasmanian rocklobster. The giant crab model was developed as part of the FRDC funded project (FRDC 2001/049entitled: Developing the tools for long-term management of the giant crab resource: Data collectionmethodology, stock assessment and harvest strategy evaluation). Full details of the model and theunderlying description of giant crab growth are given in that document.
UncertaintiesThere are many uncertainties when modelling the stock dynamics of giant crabs and these must be kept inmind when considering the management implications of the model outcomes. In the case of theTasmanian giant crab one of the biggest sources of uncertainty derives from the description of growth;which is a fundamental component of any size-based stock assessment model. As a stock assessmentmodelling problem giant crab stocks are rather more complex than rock lobsters because of theirexceptional growth. In order to grow, Crustacea like rock lobsters and giant crabs, have to go through amoulting process whereby their old carapace is shed and the new exoskeleton expands and then hardens.
Department of Primary Industries and Water April 2006 Page 22
The periods between moulting are, not unreasonably, known as inter-moult periods. The rock lobstermodel currently describes the growth of rock lobsters by summarizing the expected growth of each sizeclass every three months. It was possible to provide such a detailed description of growth because of theextensive tagging of rock lobsters that has occurred around Tasmania. Giant crabs, on the other hand, arenot so simple. They live far longer than rock lobsters and their growth includes very long inter-moultperiods lasting several years. Not only does the moulting growth increment vary with size but so does theinter-moult interval. A new model structure was developed to account for the extremes exhibited by giantcrabs. While this model is stable and behaves well, the details of the growth of the largest crabs (most ofthe legal sized animals) had to be determined through extrapolation of the details of the growth of smallergiant crabs. Such extrapolation is inherently risky but at least it provides options for exploring thepossible growth patterns and their implied stock dynamics.
The model is still under development, for example, it currently treats the whole of Tasmania as onepopulation and a two population version (east and west coast fisheries treated separately) may be a betteroption although this reduces the available data. At the same time, a greater range of growth possibilitieswill be included in the analyses in an attempt to capture more of the potential uncertainty in theassessment.
MethodsData was available on catches from 16 years, 1989/1990 to 2004/2005, though the reported catches in thefirst three years were all less than one tonne. There are catch rate data, standardized to 1995/1996,available from 1995/1996 to 2004/2005; the statistical standardization is described elsewhere in thisreport. In addition, data reflecting the length frequency of the commercial catch was available for thequota years between 1993/1994 to 2004/2005.
In total there are 21 parameters estimated by the model, these are the average recruitment level, fourselectivity parameters, and 16 recruitment residuals defining how far the recruitment was expected tohave been each year from the average recruitment.
The model outputs include:the harvest rate (the proportion of the legal sized biomass removed each year),
the exploitable biomass (the legal sized biomass at the start of each year),
the total biomass (biomass of all size classes,
the catch rates (both observed and predicted),
the egg production each year, and finally
the observed and expected length frequency of the commercial catch each year.
A bootstrap procedure on the catch rate data provides an initial estimate of the uncertainty inherent in thisassessment. It is likely to underestimate the uncertainty simply because there are processes such asrecruitment that require a longer time series.
The model permits risk assessments related to altering the management arrangements with the availableoptions for exploration including:
varying the minimum and maximum legal lengths for either sex,
varying the TAC,
allowing the take of egg-bearing females,
varying the length of the closed season for females.
In this present assessment all management options remained as they are currently except an array ofdifferent TAC values were examined for their implications for management.
Department of Primary Industries and Water April 2006 Page 23
The model was projected forward for ten years under each different harvest strategy. The legal lengthsremained at 150 mm minimum legal length and 210 mm maximum legal length for both males andfemales.
The alternative TACs examined ranged from 50 t, 60 t, 75 t, and 100 t.
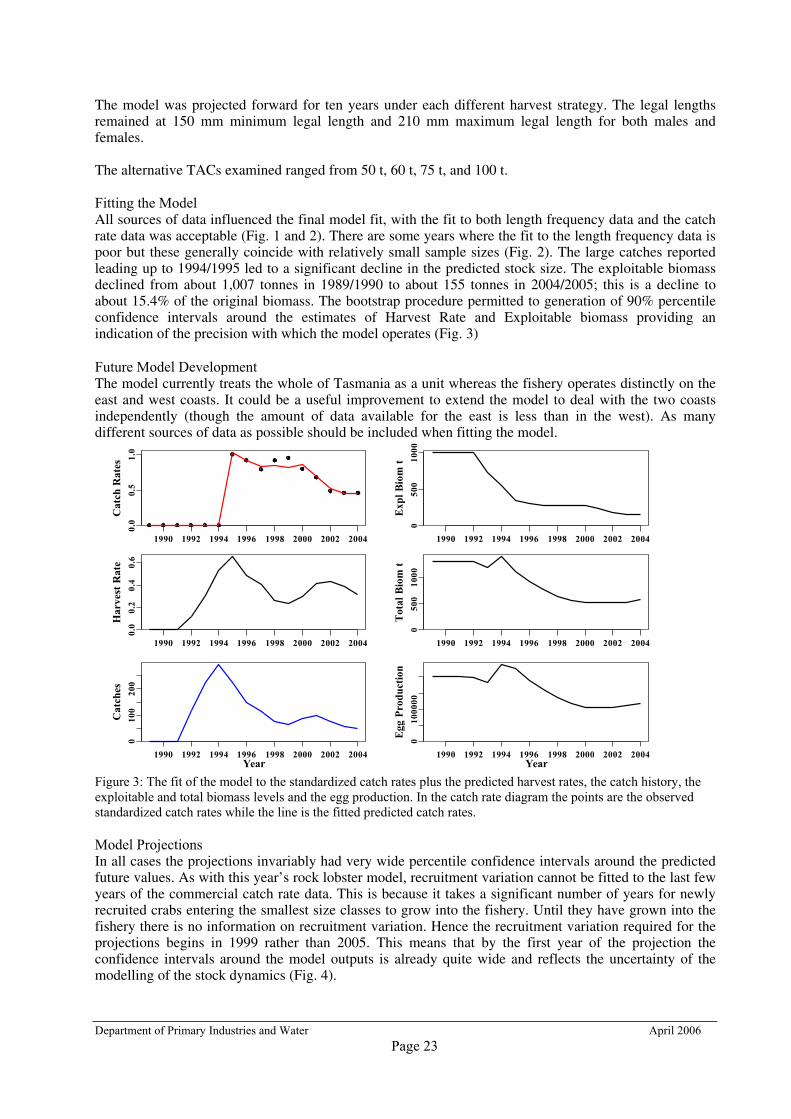
Fitting the ModelAll sources of data influenced the final model fit, with the fit to both length frequency data and the catchrate data was acceptable (Fig. 1 and 2). There are some years where the fit to the length frequency data ispoor but these generally coincide with relatively small sample sizes (Fig. 2). The large catches reportedleading up to 1994/1995 led to a significant decline in the predicted stock size. The exploitable biomassdeclined from about 1,007 tonnes in 1989/1990 to about 155 tonnes in 2004/2005; this is a decline toabout 15.4% of the original biomass. The bootstrap procedure permitted to generation of 90% percentileconfidence intervals around the estimates of Harvest Rate and Exploitable biomass providing anindication of the precision with which the model operates (Fig. 3)
Future Model DevelopmentThe model currently treats the whole of Tasmania as a unit whereas the fishery operates distinctly on theeast and west coasts. It could be a useful improvement to extend the model to deal with the two coastsindependently (though the amount of data available for the east is less than in the west). As manydifferent sources of data as possible should be included when fitting the model.
1990 1992 1994 1996 1998 2000 2002 2004
0.0
0.5
1.0
Cat
ch R
ates
1990 1992 1994 1996 1998 2000 2002 2004
050
010
00Ex
pl B
iom
t
1990 1992 1994 1996 1998 2000 2002 2004
0.0
0.2
0.4
0.6
Har
vest
Rat
e
1990 1992 1994 1996 1998 2000 2002 2004
050
010
00T
otal
Bio
m t
1990 1992 1994 1996 1998 2000 2002 2004
010
020
0C
atch
es
Year1990 1992 1994 1996 1998 2000 2002 2004
010
0000
Egg
Pro
duct
ion
Year
Figure 3: The fit of the model to the standardized catch rates plus the predicted harvest rates, the catch history, theexploitable and total biomass levels and the egg production. In the catch rate diagram the points are the observedstandardized catch rates while the line is the fitted predicted catch rates.
Model ProjectionsIn all cases the projections invariably had very wide percentile confidence intervals around the predictedfuture values. As with this year’s rock lobster model, recruitment variation cannot be fitted to the last fewyears of the commercial catch rate data. This is because it takes a significant number of years for newlyrecruited crabs entering the smallest size classes to grow into the fishery. Until they have grown into thefishery there is no information on recruitment variation. Hence the recruitment variation required for theprojections begins in 1999 rather than 2005. This means that by the first year of the projection theconfidence intervals around the model outputs is already quite wide and reflects the uncertainty of themodelling of the stock dynamics (Fig. 4).
Department of Primary Industries and Water April 2006 Page 24
1990 1995 2000 2005 2010 2015
0.0
1.0
2.0
Cat
ch R
ates
1990 1995 2000 2005 2010 2015
040
080
0E
xpl B
iom
t
1990 1995 2000 2005 2010 2015
0.0
0.2
0.4
0.6
Har
vest
Rat
e
1990 1995 2000 2005 2010 2015
040
010
00T
otal
Bio
m t
1990 1995 2000 2005 2010 2015
010
020
0C
atch
es
Year1990 1995 2000 2005 2010 2015
010
0000
2500
00E
gg P
rodu
ctio
nYear
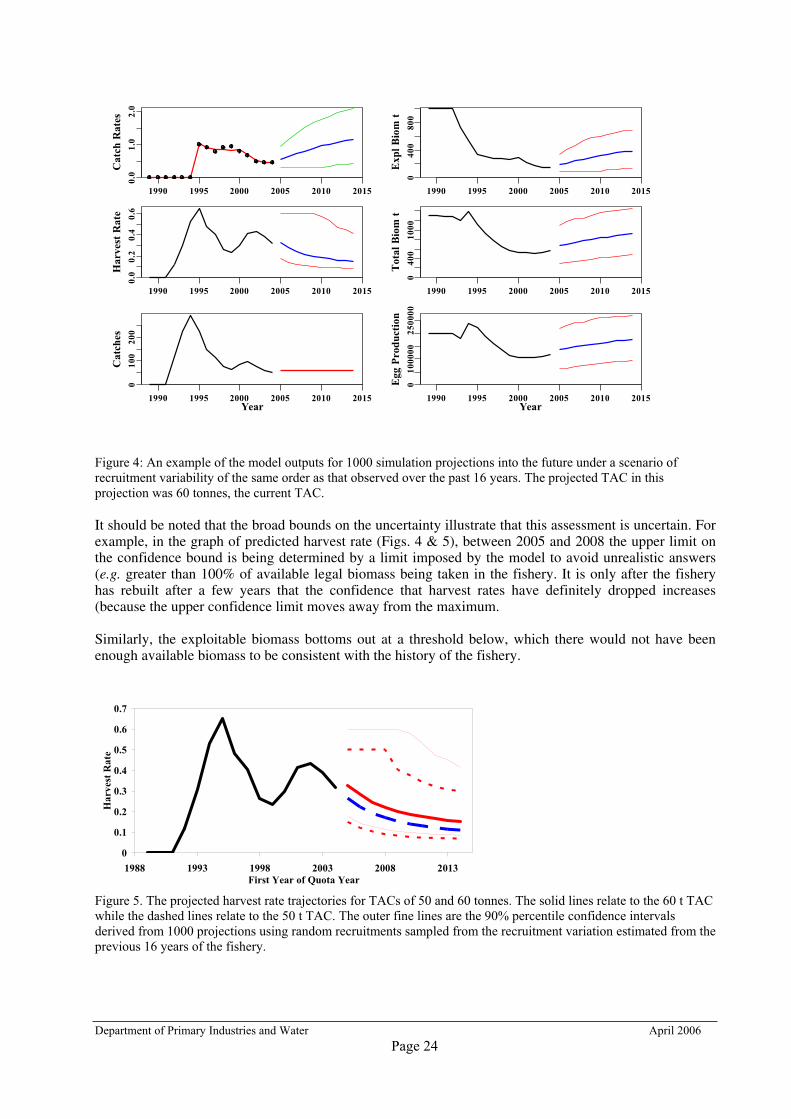
Figure 4: An example of the model outputs for 1000 simulation projections into the future under a scenario ofrecruitment variability of the same order as that observed over the past 16 years. The projected TAC in thisprojection was 60 tonnes, the current TAC.
It should be noted that the broad bounds on the uncertainty illustrate that this assessment is uncertain. Forexample, in the graph of predicted harvest rate (Figs. 4 & 5), between 2005 and 2008 the upper limit onthe confidence bound is being determined by a limit imposed by the model to avoid unrealistic answers(e.g. greater than 100% of available legal biomass being taken in the fishery. It is only after the fisheryhas rebuilt after a few years that the confidence that harvest rates have definitely dropped increases(because the upper confidence limit moves away from the maximum.
Similarly, the exploitable biomass bottoms out at a threshold below, which there would not have beenenough available biomass to be consistent with the history of the fishery.
0
0.1
0.2
0.3
0.4
0.5
0.6
0.7
1988 1993 1998 2003 2008 2013First Year of Quota Year
Har
vest
Rat
e
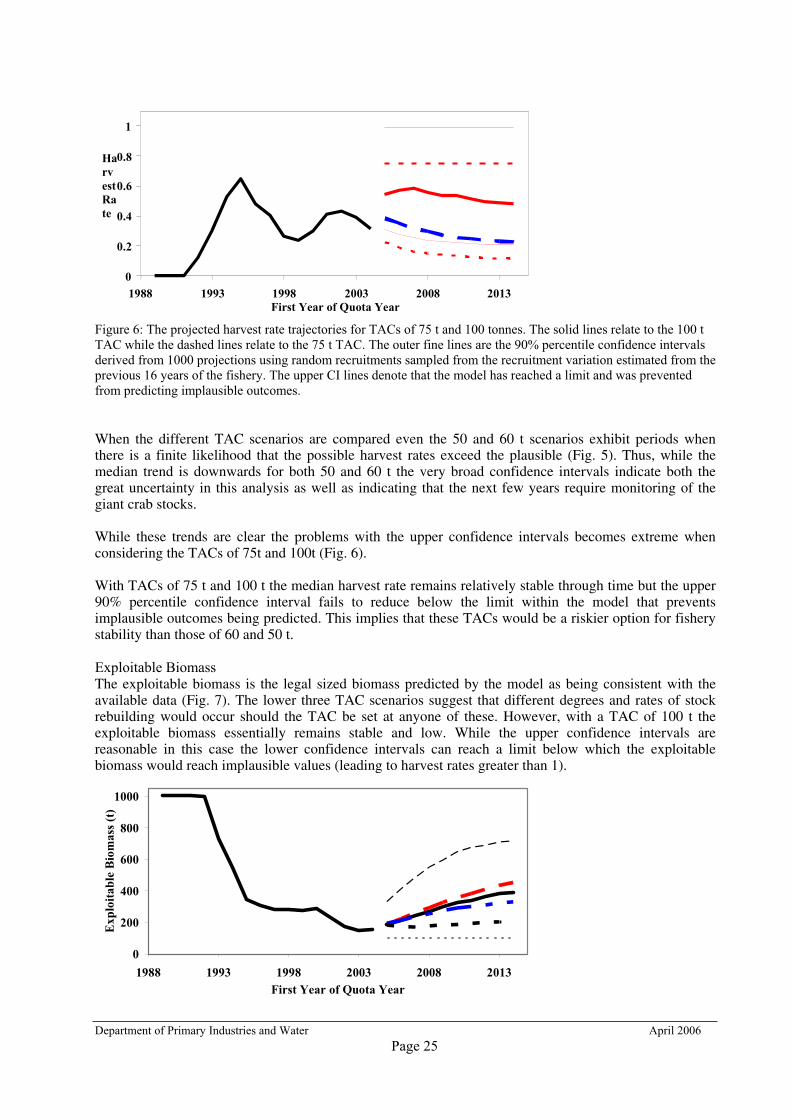
Figure 5. The projected harvest rate trajectories for TACs of 50 and 60 tonnes. The solid lines relate to the 60 t TACwhile the dashed lines relate to the 50 t TAC. The outer fine lines are the 90% percentile confidence intervalsderived from 1000 projections using random recruitments sampled from the recruitment variation estimated from theprevious 16 years of the fishery.
Department of Primary Industries and Water April 2006 Page 25
0
0.2
0.4
0.6
0.8
1
1988 1993 1998 2003 2008 2013First Year of Quota Year
HarvestRate
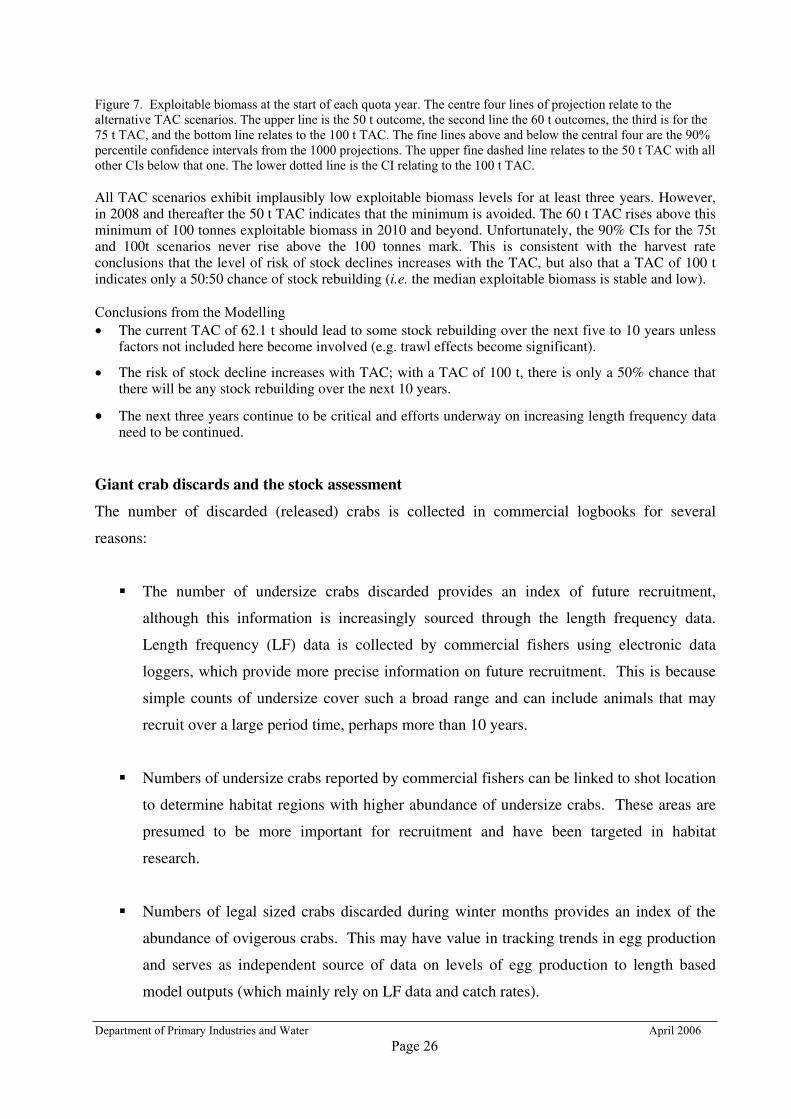
Figure 6: The projected harvest rate trajectories for TACs of 75 t and 100 tonnes. The solid lines relate to the 100 tTAC while the dashed lines relate to the 75 t TAC. The outer fine lines are the 90% percentile confidence intervalsderived from 1000 projections using random recruitments sampled from the recruitment variation estimated from theprevious 16 years of the fishery. The upper CI lines denote that the model has reached a limit and was preventedfrom predicting implausible outcomes.
When the different TAC scenarios are compared even the 50 and 60 t scenarios exhibit periods whenthere is a finite likelihood that the possible harvest rates exceed the plausible (Fig. 5). Thus, while themedian trend is downwards for both 50 and 60 t the very broad confidence intervals indicate both thegreat uncertainty in this analysis as well as indicating that the next few years require monitoring of thegiant crab stocks.
While these trends are clear the problems with the upper confidence intervals becomes extreme whenconsidering the TACs of 75t and 100t (Fig. 6).
With TACs of 75 t and 100 t the median harvest rate remains relatively stable through time but the upper90% percentile confidence interval fails to reduce below the limit within the model that preventsimplausible outcomes being predicted. This implies that these TACs would be a riskier option for fisherystability than those of 60 and 50 t.
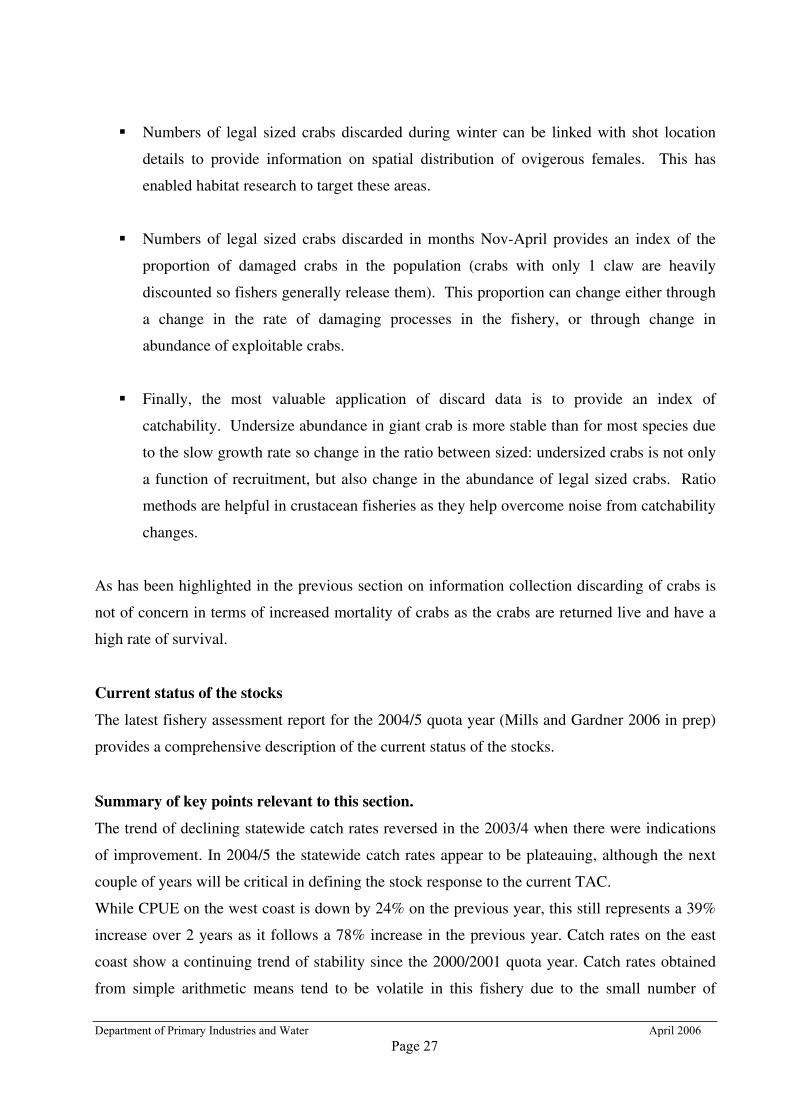
Exploitable BiomassThe exploitable biomass is the legal sized biomass predicted by the model as being consistent with theavailable data (Fig. 7). The lower three TAC scenarios suggest that different degrees and rates of stockrebuilding would occur should the TAC be set at anyone of these. However, with a TAC of 100 t theexploitable biomass essentially remains stable and low. While the upper confidence intervals arereasonable in this case the lower confidence intervals can reach a limit below which the exploitablebiomass would reach implausible values (leading to harvest rates greater than 1).
0
200
400
600
800
1000
1988 1993 1998 2003 2008 2013First Year of Quota Year
Exp
loita
ble
Bio
mas
s (t)
Department of Primary Industries and Water April 2006 Page 26
Figure 7. Exploitable biomass at the start of each quota year. The centre four lines of projection relate to thealternative TAC scenarios. The upper line is the 50 t outcome, the second line the 60 t outcomes, the third is for the75 t TAC, and the bottom line relates to the 100 t TAC. The fine lines above and below the central four are the 90%percentile confidence intervals from the 1000 projections. The upper fine dashed line relates to the 50 t TAC with allother CIs below that one. The lower dotted line is the CI relating to the 100 t TAC.
All TAC scenarios exhibit implausibly low exploitable biomass levels for at least three years. However,in 2008 and thereafter the 50 t TAC indicates that the minimum is avoided. The 60 t TAC rises above thisminimum of 100 tonnes exploitable biomass in 2010 and beyond. Unfortunately, the 90% CIs for the 75tand 100t scenarios never rise above the 100 tonnes mark. This is consistent with the harvest rateconclusions that the level of risk of stock declines increases with the TAC, but also that a TAC of 100 tindicates only a 50:50 chance of stock rebuilding (i.e. the median exploitable biomass is stable and low).
Conclusions from the ModellingThe current TAC of 62.1 t should lead to some stock rebuilding over the next five to 10 years unlessfactors not included here become involved (e.g. trawl effects become significant).
The risk of stock decline increases with TAC; with a TAC of 100 t, there is only a 50% chance thatthere will be any stock rebuilding over the next 10 years.
The next three years continue to be critical and efforts underway on increasing length frequency dataneed to be continued.
Giant crab discards and the stock assessment
The number of discarded (released) crabs is collected in commercial logbooks for several
reasons:
The number of undersize crabs discarded provides an index of future recruitment,
although this information is increasingly sourced through the length frequency data.
Length frequency (LF) data is collected by commercial fishers using electronic data
loggers, which provide more precise information on future recruitment. This is because
simple counts of undersize cover such a broad range and can include animals that may
recruit over a large period time, perhaps more than 10 years.
Numbers of undersize crabs reported by commercial fishers can be linked to shot location
to determine habitat regions with higher abundance of undersize crabs. These areas are
presumed to be more important for recruitment and have been targeted in habitat
research.
Numbers of legal sized crabs discarded during winter months provides an index of the
abundance of ovigerous crabs. This may have value in tracking trends in egg production
and serves as independent source of data on levels of egg production to length based
model outputs (which mainly rely on LF data and catch rates).
Department of Primary Industries and Water April 2006 Page 27
Numbers of legal sized crabs discarded during winter can be linked with shot location
details to provide information on spatial distribution of ovigerous females. This has
enabled habitat research to target these areas.
Numbers of legal sized crabs discarded in months Nov-April provides an index of the
proportion of damaged crabs in the population (crabs with only 1 claw are heavily
discounted so fishers generally release them). This proportion can change either through
a change in the rate of damaging processes in the fishery, or through change in
abundance of exploitable crabs.
Finally, the most valuable application of discard data is to provide an index of
catchability. Undersize abundance in giant crab is more stable than for most species due
to the slow growth rate so change in the ratio between sized: undersized crabs is not only
a function of recruitment, but also change in the abundance of legal sized crabs. Ratio
methods are helpful in crustacean fisheries as they help overcome noise from catchability
changes.
As has been highlighted in the previous section on information collection discarding of crabs is
not of concern in terms of increased mortality of crabs as the crabs are returned live and have a
high rate of survival.
Current status of the stocks
The latest fishery assessment report for the 2004/5 quota year (Mills and Gardner 2006 in prep)
provides a comprehensive description of the current status of the stocks.
Summary of key points relevant to this section.
The trend of declining statewide catch rates reversed in the 2003/4 when there were indications
of improvement. In 2004/5 the statewide catch rates appear to be plateauing, although the next
couple of years will be critical in defining the stock response to the current TAC.
While CPUE on the west coast is down by 24% on the previous year, this still represents a 39%
increase over 2 years as it follows a 78% increase in the previous year. Catch rates on the east
coast show a continuing trend of stability since the 2000/2001 quota year. Catch rates obtained
from simple arithmetic means tend to be volatile in this fishery due to the small number of
Department of Primary Industries and Water April 2006 Page 28
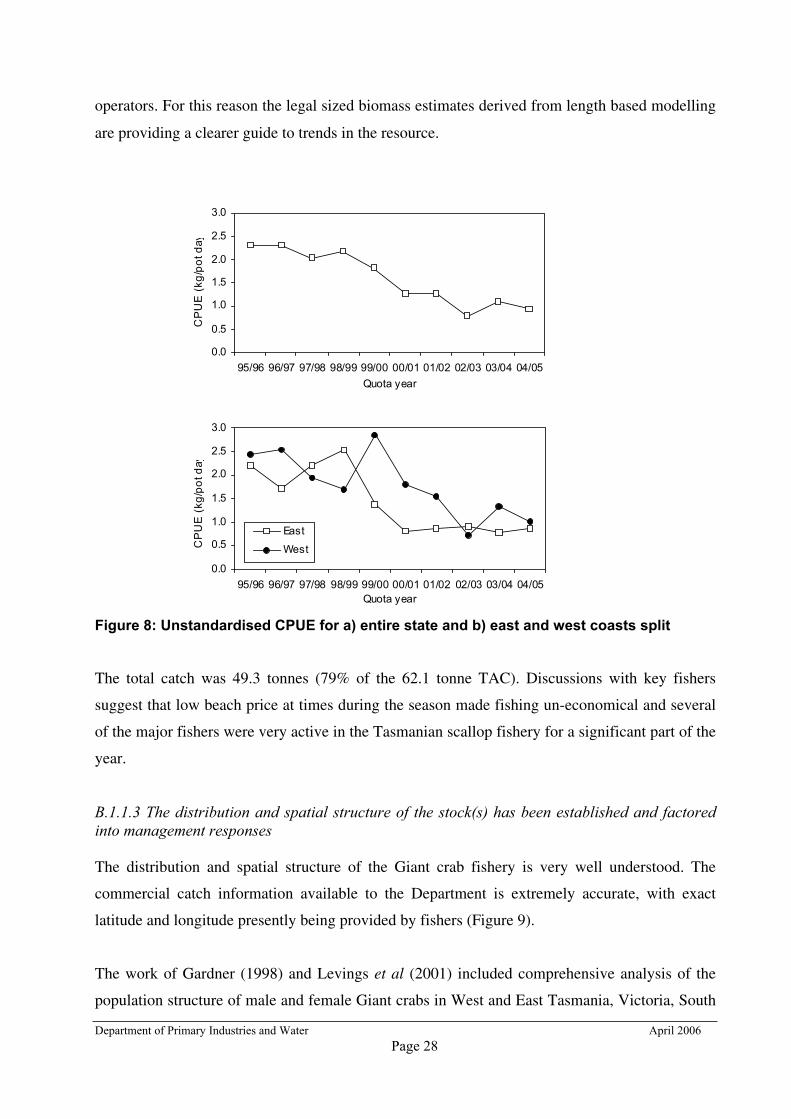
operators. For this reason the legal sized biomass estimates derived from length based modelling
are providing a clearer guide to trends in the resource.
Figure 8: Unstandardised CPUE for a) entire state and b) east and west coasts split
The total catch was 49.3 tonnes (79% of the 62.1 tonne TAC). Discussions with key fishers
suggest that low beach price at times during the season made fishing un-economical and several
of the major fishers were very active in the Tasmanian scallop fishery for a significant part of the
year.
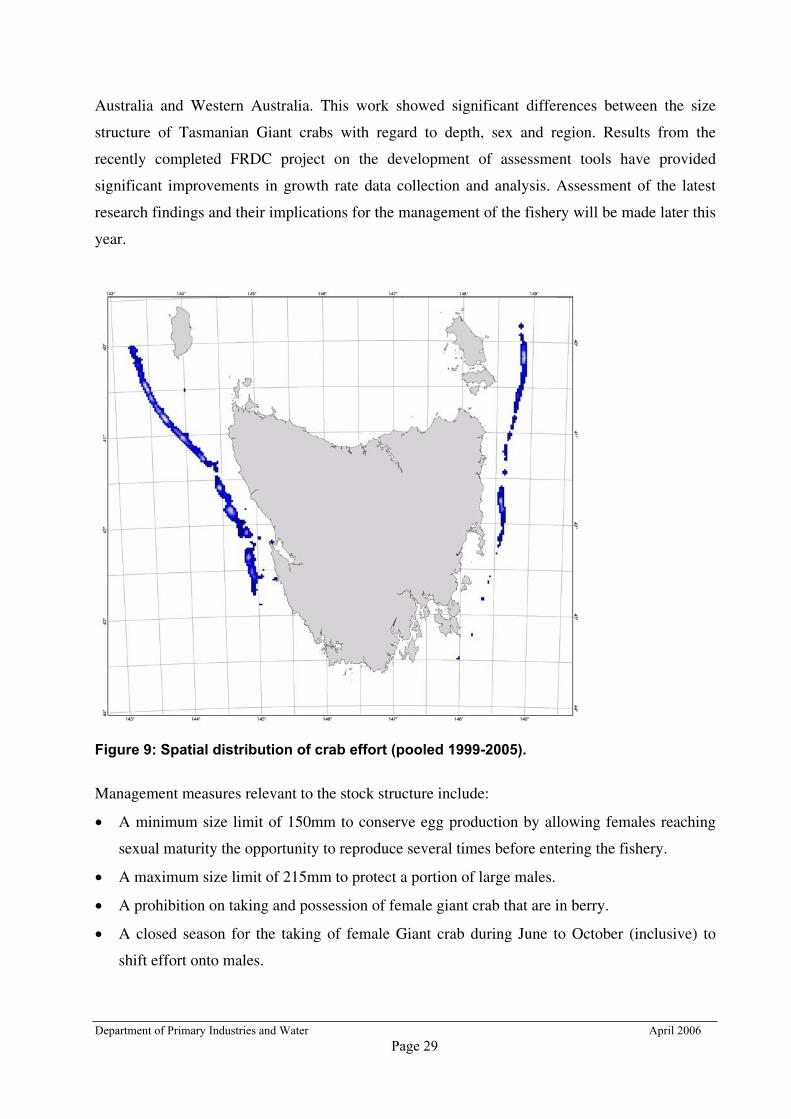
B.1.1.3 The distribution and spatial structure of the stock(s) has been established and factoredinto management responses
The distribution and spatial structure of the Giant crab fishery is very well understood. The
commercial catch information available to the Department is extremely accurate, with exact
latitude and longitude presently being provided by fishers (Figure 9).
The work of Gardner (1998) and Levings et al (2001) included comprehensive analysis of the
population structure of male and female Giant crabs in West and East Tasmania, Victoria, South
0.0
0.5
1.0
1.5
2.0
2.5
3.0
95/96 96/97 97/98 98/99 99/00 00/01 01/02 02/03 03/04 04/05Quota year
CP
UE
(kg
/pot
day
0.0
0.5
1.0
1.5
2.0
2.5
3.0
95/96 96/97 97/98 98/99 99/00 00/01 01/02 02/03 03/04 04/05Quota year
CP
UE
(kg
/pot
day
East
West
Department of Primary Industries and Water April 2006 Page 29
Australia and Western Australia. This work showed significant differences between the size
structure of Tasmanian Giant crabs with regard to depth, sex and region. Results from the
recently completed FRDC project on the development of assessment tools have provided
significant improvements in growth rate data collection and analysis. Assessment of the latest
research findings and their implications for the management of the fishery will be made later this
year.
Figure 9: Spatial distribution of crab effort (pooled 1999-2005).
Management measures relevant to the stock structure include:
A minimum size limit of 150mm to conserve egg production by allowing females reaching
sexual maturity the opportunity to reproduce several times before entering the fishery.
A maximum size limit of 215mm to protect a portion of large males.
A prohibition on taking and possession of female giant crab that are in berry.
A closed season for the taking of female Giant crab during June to October (inclusive) to
shift effort onto males.
Department of Primary Industries and Water April 2006 Page 30
The fishery is managed on a statewide basis, however the stock assessment evaluates and reports
on annual catch rates for 8 regions around the state. In the 2003 DPIWE review of the fishery,
there was concern about declining catch rates in the western region of the fishery. To address this
concern and to minimise the risk of a significant shift in effort from the west coast to the east
coast, in 2004/5 the statewide TAC was reduced from 103.5 tonnes to 62.1 tonnes and a series of
trigger points relating to total catch from the east and west regions were adopted.
B1.1.4 There are reliable estimates of all removals, including commercial (landings and
discards), recreational and indigenous, from the fished stock. These estimates have been
factored into stock assessments and target species catch levels.
The giant crab quota management system provides very accurate weights of commercial
giant crab landings. (as discussed in section 1.1.1 data collection).
The rock lobster quota management system provides very accurate weights of commercial
giant crab byproduct landings.
Giant crab discards are not considered a removal as they are returned alive as discussed
previously.
The recreational catch of giant crab is believed to be negligible. In collecting information
using phone surveys and fisher diaries in respect of recreational rock lobster fishing (Forward
and Lyle, 2002), only one instance of a single giant crab being taken for recreational
purposes was noted (Gardner, pers. com.). Similarly, indigenous fishing activity is believed
to be nil, as the fishery is concentrated in deeper waters not traditionally associated with
indigenous fishing activity.
There is no estimate of illegal catch, but again it is thought to be negligible. The reporting
requirements for fishers and processors are very comprehensive and provide an auditable
documentation system and real time reporting of key steps in the landing, transportation and
receipt of fish through a telephone reporting system. Compliance with the fisheries rules is
managed by Tasmanian Police and includes random at sea inspections, regular inspections of
unloading at the wharf, checks at processor premises and covert surveillance. Police records
indicate that detected illegal activity is low.
Removals by other fishers
Department of Primary Industries and Water April 2006 Page 31
No commercial fishers under a Tasmanian State licence may retain giant crab except for rock
lobster fishers.
Removals by the Commonwealth Trawl sector (addresses DEH recommendation 4 from first
assessment)
Data on retained bycatch of crabs from trawlers has been obtained from:
AFMA logbook records (although giant crab catch was generally recorded generically as
“crab” and could thus include king crabs (lithodid species) and spider crabs
(Leptomithrax spp.).
AFMA observer programs.
Voluntary recording by one trawl operator.
Each of these data sources have some problems; ie, lack of species identification in logbooks;
and low area coverage of observer programs, and limited voluntary data recording.
The total weight of “Giant Crab” recorded for the South East Trawl fishery is 2,194kg for the
04/05 quota year. Only two vessels recorded giant crab from Commonwealth waters that overlap
the Tasmanian giant crab fishing area. The total weight of giant crab recorded by these vessels
was less than 500kgs.
Anecdotal information from trawl operators suggests that they are recording the species in their
log books with the common name of either King Crab or Giant Crab, however they are using the
species code of “CRK” which is the Pseudocarcinus gigas in the AFMA database.(AFMA
personal comm)
How is this data factored into the giant crab stock assessment?
Trawler crab bycatch is another source of fishing mortality in addition to trap fishing and thus
would be expected to contribute to trends in indices of abundance such as estimated biomass
trends and catch rates. For this reason, the actual annual bycatch tonnage as a stand-alone data
point is not considered an important data source for the new stock assessment model. However,
it is anticipated that future the stock assessments will report on crab catch data provided by
AFMA. The proposed 2006 review of performance indicators and trigger points will also
consider if an appropriate indicator is warranted.
Department of Primary Industries and Water April 2006 Page 32
At the time of the first assessment of this fishery by DEH in 2003, the gear conflict between crab
fishers and certain Commonwealth trawl operators and the potential impact of trawling
operations on crab habitat and ecosystems was one of the most significant issues in the fishery.
The region where declining giant crab catch rates were of most concern (west coast of Tasmania)
included the area where there was spatial overlap of the crab and trawl fishing grounds.
Several Tasmanian giant crab fisheries assessments have highlighted concerns for the resource in
relation to benthic trawling operations due to increased trawling effort off western Tasmania
commencing in 2001. That effort expanded into shallower habitats so that trawlers were
increasingly operating on shelf break habitats that had received little trawl effort previously
(shallower than 350m).
Concern in relation to this issue was related to the loss of gear, restriction of fishing area, trawler
bycatch of crabs, damage to discarded crabs, and habitat alteration. Some of these issues were of
concern in relation to sustainability of the resource while others were of economic impact.
Issues of economic impact include the loss of gear, restriction of fishing area (as traps could not
be set in regions where trawlers were likely to pass within the next week) and damage to crabs
(which reduces beach price). Note that the first two of these issues relate to both mid-water and
benthic trawlers. DPIWE representatives participated in a number of inter-sector discussions
facilitated by Department of Agriculture, Fisheries and Forestry (DAFF) in 2003, in an attempt
to resolve these issues. Outcomes from “industry only” meetings in 2003 resulted in the
adoption of voluntary exclusion areas for both sectors. There have also been positive reports
from fishers on progress in terms of loss of gear through better at-sea communication. The level
of trawl fishing effort in the crab fishing grounds also appears to have significantly decreased
over the last 2 years.
In 2004, DPIWE representatives participated in a series of workshops facilitated by the National
Oceans office (NOO) - the Ottways Case Study. The aim of the case study was to identify tools
and approaches that are currently used to deal with multiple use management issues. Seven
multiple-use management issues were selected for inclusion in the Case Study. The Giant Crab
Fishery and South East Trawl Fishery had been selected by the Working Group as a good
example of direct interaction between fisheries across jurisdictions.
Department of Primary Industries and Water April 2006 Page 33
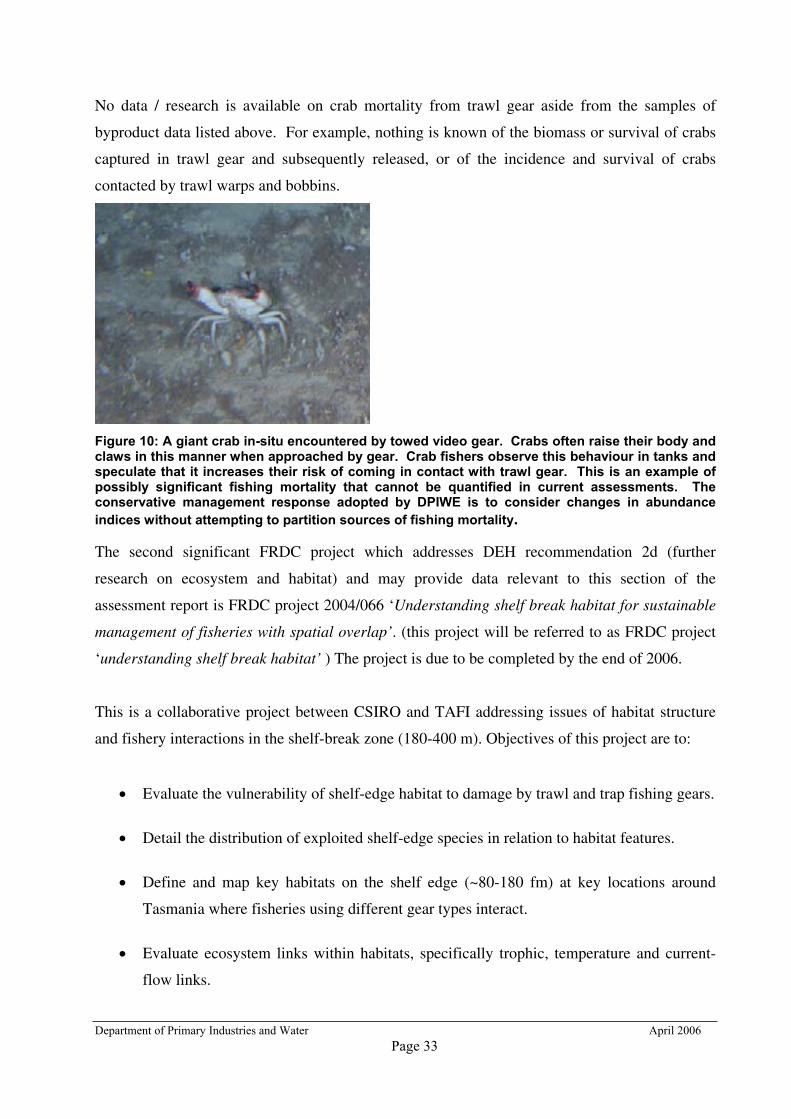
No data / research is available on crab mortality from trawl gear aside from the samples of
byproduct data listed above. For example, nothing is known of the biomass or survival of crabs
captured in trawl gear and subsequently released, or of the incidence and survival of crabs
contacted by trawl warps and bobbins.
Figure 10: A giant crab in-situ encountered by towed video gear. Crabs often raise their body andclaws in this manner when approached by gear. Crab fishers observe this behaviour in tanks andspeculate that it increases their risk of coming in contact with trawl gear. This is an example ofpossibly significant fishing mortality that cannot be quantified in current assessments. Theconservative management response adopted by DPIWE is to consider changes in abundanceindices without attempting to partition sources of fishing mortality.
The second significant FRDC project which addresses DEH recommendation 2d (further
research on ecosystem and habitat) and may provide data relevant to this section of the
assessment report is FRDC project 2004/066 ‘Understanding shelf break habitat for sustainable
management of fisheries with spatial overlap’. (this project will be referred to as FRDC project
‘understanding shelf break habitat’ ) The project is due to be completed by the end of 2006.
This is a collaborative project between CSIRO and TAFI addressing issues of habitat structure
and fishery interactions in the shelf-break zone (180-400 m). Objectives of this project are to:
Evaluate the vulnerability of shelf-edge habitat to damage by trawl and trap fishing gears.
Detail the distribution of exploited shelf-edge species in relation to habitat features.
Define and map key habitats on the shelf edge (~80-180 fm) at key locations around
Tasmania where fisheries using different gear types interact.
Evaluate ecosystem links within habitats, specifically trophic, temperature and current-
flow links.
Department of Primary Industries and Water April 2006 Page 34
Evaluate our ability to use video to obtain fishery independent stock assessment
information such as abundance, sex ratio, condition and size of target species.
A milestone progress report (Gardner 2005) has been completed. Full assessment of the results
of this project and any implications for the management of the crab fishery will be considered in
2007.
1.1.5 There is a sound estimate of the potential productivity of the fished stock/s and the
proportion that could be harvested.
Management of the Tasmanian crab resource is primarily through two instruments: the total
allowable catch and the size limit. The size limit in this fishery is set at such a conservative level
in terms of maintaining egg production that biological sustainability of the fishery is effectively
managed regardless of the TAC or the size of the legal sized biomass. Estimated egg production
remains well above 50% of virgin production, which is significantly greater than other
Australian crustacean fisheries and international fisheries benchmarks (typically 20-25%). The
role of the TAC is thus primarily to manage the economic benefit of the resource by producing
stable harvests. It is critically important to recognise this distinction between economic and
biological sustainability and the roles of the TAC when discussing sustainability of the fishery.
Prior to the development of the stock assessment model in 2005, interpreting catch and effort
data was the only tool available to assess whether the TAC is set at an appropriate level to ensure
an economically sustainable harvest strategy. The TAC between 1999/2000 and 2003/04 was set
conservatively in relation to previous catch levels, in the absence of other appropriate biological
data.
In response to concerns about declining catch rates the TAC was significantly reduced by about
40% in 2004/5 as a very conservative precautionary measure, but again there was little
appropriate biological data to base the level of TAC on.
The completion of the FRDC project development of assessment tools, provides a significant
improvement state of knowledge about relevant biological data particularly growth data and
recruitment. The subsequent development of a stock assessment model has dramatically
enhanced the scientific basis to estimate the potential productivity of the fished stock and the
proportion that could be harvested.
Department of Primary Industries and Water April 2006 Page 35
Details of the project and the preliminary use of the model to assess different harvest strategies
in the 2004/5 stock assessment (Mills and Gardner 2006 in prep), have been comprehensively
discussed in section 1.1.2.
Further development of the model and an increasing time series / data set for the fishery should
facilitate improved precision and confidence in setting sustainable harvesting strategies. One
difficulty that is acknowledged with using the assessment model for management purposes is
that the time series is short. Assessment models ultimately estimate the strength of annual
recruitment so a short time series is problematic. This is because there is higher likelihood of
future recruitment being different to that seen historically. The only response to this is
conservative setting of the TAC.
B.1.1.6-9 Management responses
There are reference points (target and/or limit), that trigger management actions including a
biological bottom line and/or a catch or effort upper limit beyond which the stock should not be
taken.
Performance indicators and trigger points are documented in the 1999 Giant Crab Policy
Document. The performance of the Giant Crab Fishery Management Plan in meeting the
objectives of maintaining biomass and recruitment will be measured through a combination of
performance indicators concerning the sustainability of the giant crab resource.
Analysis of fishery performance under this management plan will be examined and measured
variously by the use of, but not restricted to, the following items:
Catch per unit effort (CPUE)Catch per unit of effort is a measure of the catch rate and is also commonly used as a index ofrelative abundance.
Trigger point
When CPUE for the State declines for two consecutive years.
When CPUE for any region declines by a total of 20% in two years
The total annual commercial catch, including by-catch
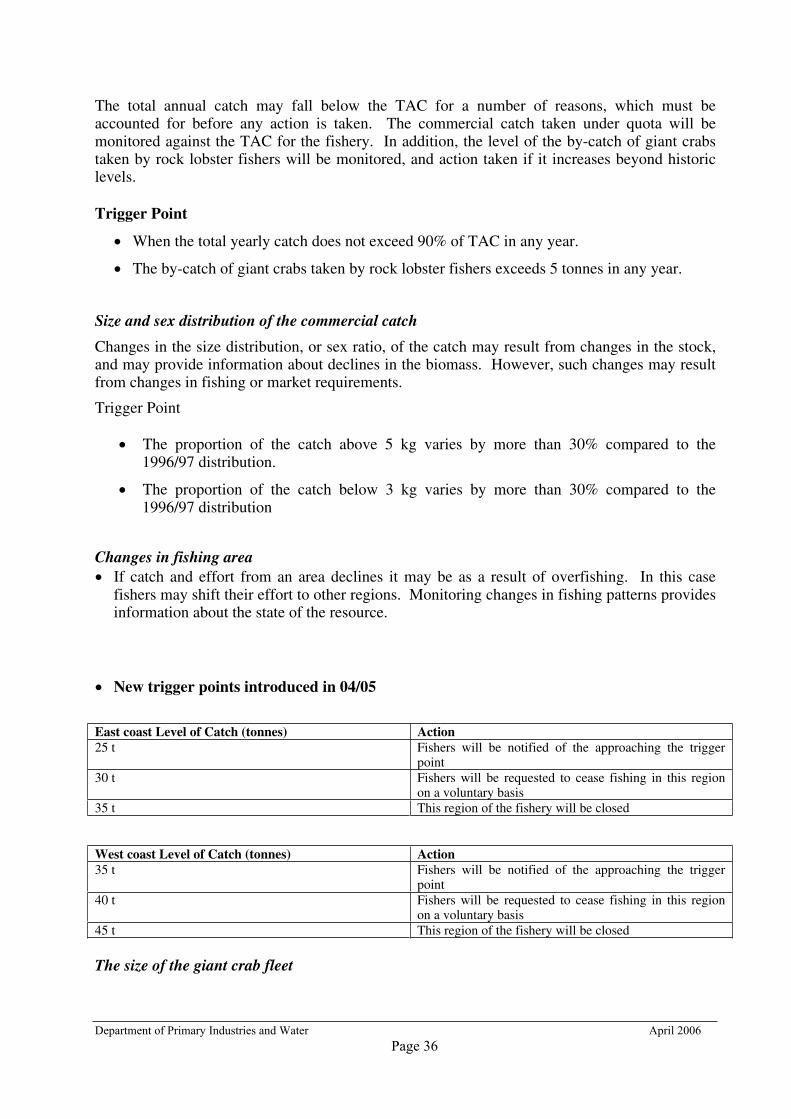
Department of Primary Industries and Water April 2006 Page 36
The total annual catch may fall below the TAC for a number of reasons, which must beaccounted for before any action is taken. The commercial catch taken under quota will bemonitored against the TAC for the fishery. In addition, the level of the by-catch of giant crabstaken by rock lobster fishers will be monitored, and action taken if it increases beyond historiclevels.
Trigger Point
When the total yearly catch does not exceed 90% of TAC in any year.
The by-catch of giant crabs taken by rock lobster fishers exceeds 5 tonnes in any year.
Size and sex distribution of the commercial catch
Changes in the size distribution, or sex ratio, of the catch may result from changes in the stock,and may provide information about declines in the biomass. However, such changes may resultfrom changes in fishing or market requirements.
Trigger Point
The proportion of the catch above 5 kg varies by more than 30% compared to the1996/97 distribution.
The proportion of the catch below 3 kg varies by more than 30% compared to the1996/97 distribution
Changes in fishing areaIf catch and effort from an area declines it may be as a result of overfishing. In this casefishers may shift their effort to other regions. Monitoring changes in fishing patterns providesinformation about the state of the resource.
New trigger points introduced in 04/05
East coast Level of Catch (tonnes) Action25 t Fishers will be notified of the approaching the trigger
point 30 t Fishers will be requested to cease fishing in this region
on a voluntary basis35 t This region of the fishery will be closed
West coast Level of Catch (tonnes) Action35 t Fishers will be notified of the approaching the trigger
point 40 t Fishers will be requested to cease fishing in this region
on a voluntary basis45 t This region of the fishery will be closed
The size of the giant crab fleet
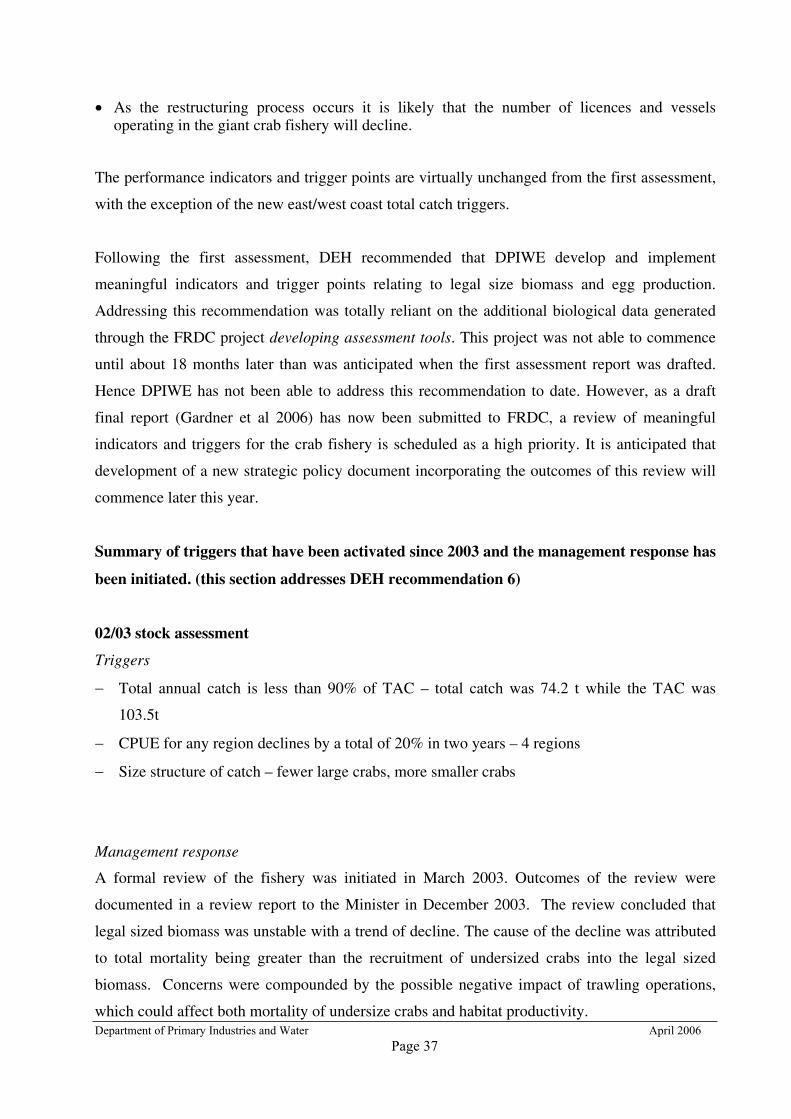
Department of Primary Industries and Water April 2006 Page 37
As the restructuring process occurs it is likely that the number of licences and vesselsoperating in the giant crab fishery will decline.
The performance indicators and trigger points are virtually unchanged from the first assessment,
with the exception of the new east/west coast total catch triggers.
Following the first assessment, DEH recommended that DPIWE develop and implement
meaningful indicators and trigger points relating to legal size biomass and egg production.
Addressing this recommendation was totally reliant on the additional biological data generated
through the FRDC project developing assessment tools. This project was not able to commence
until about 18 months later than was anticipated when the first assessment report was drafted.
Hence DPIWE has not been able to address this recommendation to date. However, as a draft
final report (Gardner et al 2006) has now been submitted to FRDC, a review of meaningful
indicators and triggers for the crab fishery is scheduled as a high priority. It is anticipated that
development of a new strategic policy document incorporating the outcomes of this review will
commence later this year.
Summary of triggers that have been activated since 2003 and the management response has
been initiated. (this section addresses DEH recommendation 6)
02/03 stock assessment
Triggers
Total annual catch is less than 90% of TAC – total catch was 74.2 t while the TAC was
103.5t
CPUE for any region declines by a total of 20% in two years – 4 regions
Size structure of catch – fewer large crabs, more smaller crabs
Management response
A formal review of the fishery was initiated in March 2003. Outcomes of the review were
documented in a review report to the Minister in December 2003. The review concluded that
legal sized biomass was unstable with a trend of decline. The cause of the decline was attributed
to total mortality being greater than the recruitment of undersized crabs into the legal sized
biomass. Concerns were compounded by the possible negative impact of trawling operations,
which could affect both mortality of undersize crabs and habitat productivity.
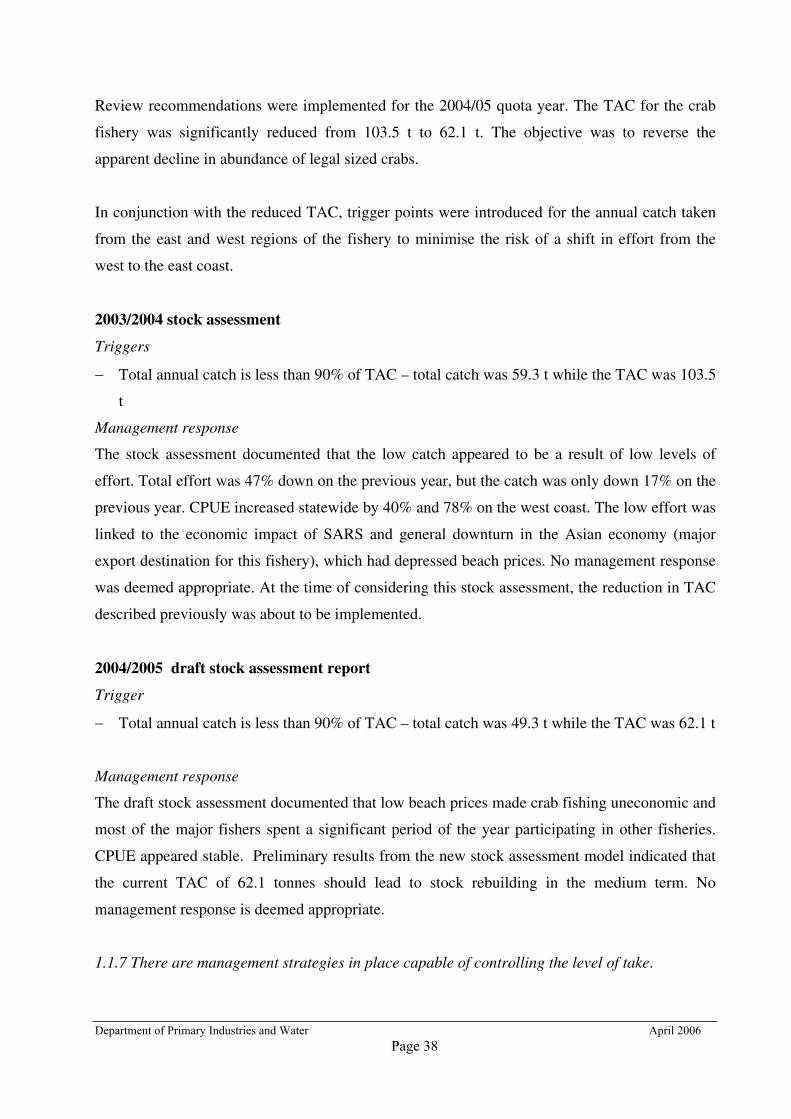
Department of Primary Industries and Water April 2006 Page 38
Review recommendations were implemented for the 2004/05 quota year. The TAC for the crab
fishery was significantly reduced from 103.5 t to 62.1 t. The objective was to reverse the
apparent decline in abundance of legal sized crabs.
In conjunction with the reduced TAC, trigger points were introduced for the annual catch taken
from the east and west regions of the fishery to minimise the risk of a shift in effort from the
west to the east coast.
2003/2004 stock assessment
Triggers
Total annual catch is less than 90% of TAC – total catch was 59.3 t while the TAC was 103.5
t
Management response
The stock assessment documented that the low catch appeared to be a result of low levels of
effort. Total effort was 47% down on the previous year, but the catch was only down 17% on the
previous year. CPUE increased statewide by 40% and 78% on the west coast. The low effort was
linked to the economic impact of SARS and general downturn in the Asian economy (major
export destination for this fishery), which had depressed beach prices. No management response
was deemed appropriate. At the time of considering this stock assessment, the reduction in TAC
described previously was about to be implemented.
2004/2005 draft stock assessment report
Trigger
Total annual catch is less than 90% of TAC – total catch was 49.3 t while the TAC was 62.1 t
Management response
The draft stock assessment documented that low beach prices made crab fishing uneconomic and
most of the major fishers spent a significant period of the year participating in other fisheries.
CPUE appeared stable. Preliminary results from the new stock assessment model indicated that
the current TAC of 62.1 tonnes should lead to stock rebuilding in the medium term. No
management response is deemed appropriate.
1.1.7 There are management strategies in place capable of controlling the level of take.
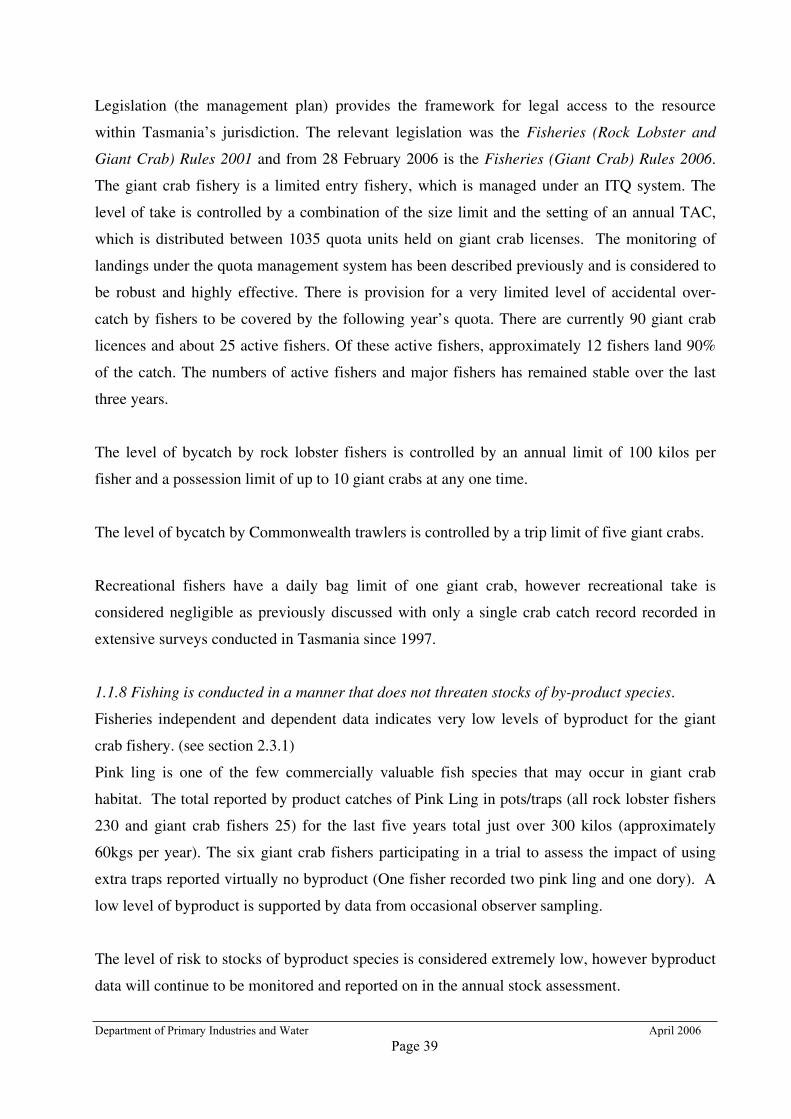
Department of Primary Industries and Water April 2006 Page 39
Legislation (the management plan) provides the framework for legal access to the resource
within Tasmania’s jurisdiction. The relevant legislation was the Fisheries (Rock Lobster and
Giant Crab) Rules 2001 and from 28 February 2006 is the Fisheries (Giant Crab) Rules 2006.
The giant crab fishery is a limited entry fishery, which is managed under an ITQ system. The
level of take is controlled by a combination of the size limit and the setting of an annual TAC,
which is distributed between 1035 quota units held on giant crab licenses. The monitoring of
landings under the quota management system has been described previously and is considered to
be robust and highly effective. There is provision for a very limited level of accidental over-
catch by fishers to be covered by the following year’s quota. There are currently 90 giant crab
licences and about 25 active fishers. Of these active fishers, approximately 12 fishers land 90%
of the catch. The numbers of active fishers and major fishers has remained stable over the last
three years.
The level of bycatch by rock lobster fishers is controlled by an annual limit of 100 kilos per
fisher and a possession limit of up to 10 giant crabs at any one time.
The level of bycatch by Commonwealth trawlers is controlled by a trip limit of five giant crabs.
Recreational fishers have a daily bag limit of one giant crab, however recreational take is
considered negligible as previously discussed with only a single crab catch record recorded in
extensive surveys conducted in Tasmania since 1997.
1.1.8 Fishing is conducted in a manner that does not threaten stocks of by-product species.
Fisheries independent and dependent data indicates very low levels of byproduct for the giant
crab fishery. (see section 2.3.1)
Pink ling is one of the few commercially valuable fish species that may occur in giant crab
habitat. The total reported by product catches of Pink Ling in pots/traps (all rock lobster fishers
230 and giant crab fishers 25) for the last five years total just over 300 kilos (approximately
60kgs per year). The six giant crab fishers participating in a trial to assess the impact of using
extra traps reported virtually no byproduct (One fisher recorded two pink ling and one dory). A
low level of byproduct is supported by data from occasional observer sampling.
The level of risk to stocks of byproduct species is considered extremely low, however byproduct
data will continue to be monitored and reported on in the annual stock assessment.
Department of Primary Industries and Water April 2006 Page 40
There is no formal validation of the weight of byproduct landed with that received by the
processing sector. The current levels of byproduct do not appear to warrant additional measures
above those already in place relating to the accurate recording of data in the general fishing
logbook and associated penalties for non compliance.
1.1.9 The management response, considering uncertainties in the assessment and precautionary
management actions, has a high chance of achieving the objective.
At the time of the first assessment of the fishery by DEH in 2003, the giant crab fishery had been
under a quota management system for just of 3 years. There was concern about the declining
catch rates (catch rates being the major indicator of the status of the stocks available at the time)
and potential impact of fishing operations from a separate fishing sector, not within Tasmania’s
jurisdiction. There were also gaps in the biological data about the species.
The latest stock assessment report provides a number of positive indicators about the state of the
stocks. Also encouraging are developments in the understanding of the species biology and
understanding of the ecosystem and habitat of the fishery, which have been described in previous
sections. DPIWE would conclude that there is robust evidence that the current management
regime and management responses within this regime are effective and have a high probability
of maintaining harvests.
Developments in the assessment process also contribute to management of uncertainty with
stochastic modelling of the stock. Consequently, projections of the outcomes of future harvests
include an evaluation of risk (for example, confidence bounds around egg production levels
under alternative TAC scenarios).
B.1.2 Objective 2.
Where the fished stock(s) are below a defined reference point, the fishery will
be managed to promote recovery to ecologically viable stock levels within
nominated timeframes.
B.1.2.1-2 Management responses
Department of Primary Industries and Water April 2006 Page 41
A precautionary recovery strategy is in place specifying management actions, or staged
management responses, which are linked to reference points. The recovery strategy should
apply until the stock recovers, and should aim for recovery within a specific time period
appropriate to the biology of the stock.
This section addresses DEH recommendation 7
Declining catch rates and trigger points were documented in the 2002/03 stock assessment and in
first assessment of the fishery. DEH, concluded there was evidence that the crab stocks showed
signs of being growth overfished. The outcomes of the DPIWE 2003 review of the fishery and
implementation of recommendations and preliminary indications about the effectiveness of the
management response been discussed in the previous section. There has only been one
assessment since the management response was initiated, and given the slow growth rate of giant
crabs, the stock assessment notes that it will be at least two more years before the stock response
to the current TAC will become clearer. The TAC for the 2006/07 year was set at 62.1 t on this
basis.
The 2003 DPIWE review considered a variety of management strategies that could address the a
number of fishery objectives. These objectives were:
i. Reverse the decline in abundance of legal sized crabs by ensuring that annual catch is at a level that takesinto account the slow growth rates of crabs, the population size, and recruitment levels;
ii. Correct the skewed size-distribution of size crabs by ensuring that annual catch is at a level that allows aproportion of fish to survive through all commercial size-classes and achieve the maximum size limit.
iii. Ensure that the undersize stock is protected so that the objectives i) and ii) are achieved in the shortestpossible time;
iv. Protect the habitat of both juvenile and adult crabs, particularly from the threat of irreversible degradationby bottom trawlers from the SE-trawl fishery;
v. Minimise the economic impact of these measures on fishers.
Potential management strategies that address these objectives include: -
i. Reducing the Total Allowable Catch to a level that rebuilds the stock and is also sustainable in the long-term.
ii. Closure of the fishery, either just on the West Coast or Statewide, to allow stock rebuilding to take place.
iii. Shortening the quota year in order to constrain both catch and effort.
iv. Regional management of crab fishing activity in order to maintain stability and constrain regional catch andeffort.
v. Spatial management of the crab and trawl fisheries to eliminate the threat of habitat damage and minimisegear conflicts between the fisheries;
Department of Primary Industries and Water April 2006 Page 42
vi. Reducing the maximum size limit for all crabs to protect the remaining crabs in larger size-classes toensure a base for rebuilding the stock and to reduce the proportion of female crabs landed
vii. Altering the minimum-size limit for male crabs in order to reduce the proportion of female crabs landed.
The DPIWE 2003 review report discusses the implications of each option for the both fishery
and fishers in detail. Changing crab size limits for example was not considered a particularly
effective strategy to achieve the objectives.
In 2005, crab fishers suggested that research be undertaken to review giant crab size limits. A
project (Re-assessing giant crab (Pseudocarcinas gigas) size limits to optimise value and
sustainability of the fishery) is currently under consideration for funding by FRDC.
DEH has raised concerns about the increasing proportion of undersize crabs being caught and
discarded as documented in the 2003/04 stock assessment report. As has been discussed in
previous sections, undersize crabs are returned live and have a high rate of survival. There are,
therefore, no perceived negative implications for the resource from this trend. Undersize
abundance in giant crab is more stable than for most species due to the slow growth rate so
change in the ratio between sized: undersized crabs is not only a function of recruitment, but also
change in the abundance of legal sized crabs (and is described in the assessment report primarily
for the purpose of an index of legal-sized abundance independent of catch rates). The use of
crab discard data in the stock assessment has been detailed in section 1.1.2.
In 2005, there was a review of the Fisheries (Rock Lobster and Giant Crab) Rules 2001 – the
management plans for the rock lobster and giant crab fisheries. The 2001 rules expired in
February 2006 and new management plans had to be drafted. The review process is a statutory
process under the Living Marine Resources Management Act 1995. A review information paper
detailing the proposed changes to the management plans was released for public comment in
August 2005. No major changes to the management of the giant crab fishery were proposed.
The changes proposed included separating the rock lobster and giant crab legislation into two
separate sets of rules, increasing the season for male crabs and increasing the number of traps
that could be set in deep water (>140 m).
The following is an extract from the information paper released for comment in 2005.
Separation of management plans
RECOMMENDATION
Department of Primary Industries and Water April 2006 Page 43
The Fisheries (Rock Lobster and Giant Crab) Rules be separated into a separate set of rules for each fishery.
Currently the management arrangements for two fisheries, Rock Lobster and Giant Crab, are combined into onepiece of legislation. The Department proposes that a separate set of rules for the Giant Crab fishery be developed.The main benefits include separating the timing of the review of each management plan (when the rules expire), sothat the Department can better target its resources to focus on the issues for each fishery separately. The separationshould also make it simpler and easier for frequent users of the rules to find the information they require.
Giant Crab Fishing Season
RECOMMENDATIONThe season dates will be fixed for the life of the plan (five years).
The commercial season for female giant crab be open from 15 November to 30 May, inclusive.
The commercial season for male giant crab be open Statewide all year round.
Female season
The purpose of the proposed seasonal closure for females is to limit harvesting during the months when the giantcrab are breeding and carrying eggs. However there are some concerns about the high proportion of females in theoverall giant crab catch. This proportion will be closely monitored and if there is a need to reduce effort on thefemale fishery, an option of summer closure may be considered in the future.
Male season
There are no biological issues to justify a closure to the male giant crab season between September and November.The economic benefits are likely to be similar to those detailed in the section on the male rock lobster season.
Giant Crab Trap Numbers
RECOMMENDATIONThat the giant crab rules provide for:
Giant crab fishers who have 25 or more crab quota units specified on their licence, to use two traps per crabquota unit, up to a maximum of 100 traps, during the crab fishing season when fishing in waters deeper than120m;
A prohibition on retaining any rock lobster during a fishing trip when more than 50 traps are used;
A requirement for a giant crab fisher to make telephone reports notifying the start and end of a trip when morethan 50 traps will be set;
The taking and possession of giant crab and rock lobster on the same trip (subject to the amount of giant craband rock lobster quota units specified on their licence) when setting traps in waters less than 120m; and
The use of a giant crab trap for each giant crab quota unit specified on the licence up to a maximum of 50 traps,or use the equivalent number of traps for each rock lobster pot permitted under the rock lobster rules.
Currently crab fishers are subject to the same restrictions on the numbers of pots as determined on their rock lobsterentitlement. For the last few years, the Department has been conducting a trial which allowed crab fishers to applyfor a permit to use up to 2 traps for each quota unit on the licence, up to a maximum of 100 traps, in waters deeperthan 80 fathoms (140 metres) during the period from March to September. The trial demonstrated clear economicbenefits to fishers and no significant change in bycatch trends associated with the extra pots.
The Department does not believe that spatial conflict issues or localised stock depletion issues normally associatedwith the use of extra traps are relevant in the deep water giant crab fishery. There are 92 giant crab licences,however on average over the last few years between 25 and 30 vessels have landed giant crab. Of these only 7vessels have taken the opportunity to fish under permit and use additional traps. The Department does not expect
Department of Primary Industries and Water April 2006 Page 44
this number to change significantly in the future. However, appropriate trigger points will be developed in the giantcrab strategic policy document to assist in monitoring any changing trends.
Following public consultation, a report was provided the Minister with final recommendations
for the new management plans (Anon DPIWE 2006). These recommendations were included in
the new plan, which commenced on 28 February 2006.
There is no longer a short (6-8 week) closed season for male crabs. In the past the male crab
season simply mirrored the rock lobster season. The economic benefits include new
opportunities to fish when beach prices are traditionally high, a greater opportunity to improve
continuity of supply and encourage new markets in the global market place and more
opportunity for licence holders to improve their returns from the fishery. The change may also
help to reduce the proportion of female crabs in the total annual catch. DPIW does not consider
this change will have a negative impact on the sustainability of the resource because catch
remains constrained by the TAC and egg production is maintained at very high levels by a
conservative legal minimum length.
The use of up to 50 extra traps by crab fishers with appropriate levels of quota in deep waters
should allow the major crab fishers (less than 12) to catch their quota quicker and, therefore,
reduce the costs of each fishing trip. All 90 crab licence holders could use up to 50 traps each
under the previous management plan. The potential amount of gear is, therefore, far in excess of
the actual gear that is likely to be used in the fishery under this change. The potential to change
the number of potlifts, and their impact via the total ‘footprint’ and impact on the ecosystem (see
detailed discussion in section 2.3.2) is still considered to be extremely low, but will be monitored
and reported in the annual stock assessment.
1.2.2 If the stock is estimated as being at or below the biological and / or effort bottom line,
management responses such as a zero targeted catch, temporary fishery closure or a
‘whole of fishery’ effort or quota reduction are implemented.
The objectives of the Living Marine Resource Management Act 1995, require the Minister to
take appropriate action to ensure a fishery is managed sustainably. The Act provides powers to
review or revoke management plans or to take emergency action to rectify threatening actions.
Department of Primary Industries and Water April 2006 Page 45
B.2 PRINCIPLE 2.
Fishing operations should be managed to minimise their impact on the structure,
productivity, function and biological diversity of the ecosystem.
The Tasmanian Giant Crab Fishery is a minor pot fishery with a small number (< 12) of
specialised licensed fishers harvesting over 90% of the 62t total allowable catch. The fishery
operates in deep waters (120 – 250m) at the edge of the continental shelf. The total number of
pot lifts for these fishers has ranged between 28561 and 18225 over the last 4 years. The total
footprint is estimated by assuming that each trap covers 1 square meter and that no two traps
land on the same point. Total annual footprint has thus averaged around 23500 m2, which
equates to a tiny area around 150 x 150 m. Also note that benthos contacted by the crab trap is
not necessarily removed or impacted. Habitat damage from crab traps is thus clearly an
extremely low risk issue in terms of impact on the structure, productivity, function and biological
diversity of the ecosystem.
Impact on the ecosystem through interactions with the removal of a portion of the crab
population is managed through maintenance of legal size biomass.
B.2.1 Objective 1.
The fishery is conducted in a manner that does not threaten bycatch species.
B.2.1.1 Information requirements
Reliable information, appropriate to the scale of the fishery, is collected on the composition and
abundance of bycatch.
Bycatch of other species in the crab fishery
Fisheries independent data
Collection of bycatch species occurred as part of the catch sampling component of the FRDC
project aimed at improving giant crab assessment techniques. Fieldwork also took place between
2001 and 2004 with scientific observers on industry vessels. This data indicated there was very
Department of Primary Industries and Water April 2006 Page 46
little bycatch in crab traps. This research was undertaken through core funding provided by
DPIWE rather than through any of the large FRDC projects.
Few species were recorded. The bycatch composition was dominated by 3 crustacean species,
the antlered crab Paramola petterdi, and hermit crabs (Strigipagurus strigimanus and Dardanus
arrosor). The next most common species was pink ling Genypterus blacodes. (discussed under
byproduct sub heading).
Due to the low level of bycatch in this fishery, future fisheries independent data collection of
bycatch species information will occur on an ad hoc basis whenever scientific observers are on
industry vessels. In 2004 the TAFI research database was modified to include bycatch data.
The FRDC project ‘understanding the Shelf Break Habitat’ has collected substantial additional
data about the biotic communities within the area of the fishery, which will be reported at the
end of 2006. Interim data has been compiled in a faunal catalogue for the project (Gardner
2006).
Fishery dependent data collection of other bycatch species
Giant crab fishers are not required to record other species bycatch. However, the fishers (8) who
participated in a trial to assess the effects of using additional traps in waters deeper than 120m
were required to record all observations of bycatch (at an appropriate level of knowledge by the
fisher) as a condition of their trial permit (2002-5 March to August). This data indicated no other
species bycatch other than ling and dory (discussed under byproduct) with trivial volume.
A research program has been initiated to provide ongoing monitoring of bycatch in the absence
of a regular observer program (which is not economically feasible). This involves bycatch data
collection by fishers at sea using waterproof disposable cameras. This project is funded by
DPIWE and is ongoing with results to be reported in the next assessment.
Byproduct
Byproduct differs from bycatch in that it is retained for sale or use as pot bait.
Fisheries independent by product data has been collected by scientific observers during the
FRDC project referred to in the above section. In waters deeper than 100m from which the
majority of the crab catch is taken, there is only one significant by product species, pink Ling,
and the levels of this species observed in crab traps is very low.
Department of Primary Industries and Water April 2006 Page 47
Fisheries dependent byproduct data collection is mandatory for giant crab fishers. Byproduct is
recorded in the Tasmanian General Fishing Logbook and catches can be traced back against the
gear type “pot”. Therefore byproduct data is aggregated for the rock lobster (240 vessels) and
giant crab fisheries. The total reported by product catches of pink ling in pots for the last 5 years
total just over 300 kilos (approximately 60kgs per year).
B.2.1.2 Assessments
There is a risk analysis of the bycatch with respect to its vulnerability to fishing.
Other species bycatch
All hermit crabs (species code 141 in the faunal catalogue Gardner 2006) and 90% of antlered
crabs (species code 139) were observed to be released unharmed. These animals do not contain
air spaces and thus show no apparent effect of the pressure change experienced during hauling to
the surface.
There are no specific assessments or risk analyses on by-catch species as the impact is believed
to be low, particularly as many of the species can be returned to the water alive. However, in
response to a specific DEH recommendation from the first assessment of this fishery, DPIWE
has in conjunction with TAFI considered strategies to assess changes in bycatch trends. Three
types of strategy were considered.
Scientific observer program
This is a high cost strategy, which was deemed unfeasible for this fishery given the low levels of
bycatch, low vulnerability and relative low production value of the fishery itself. (approximately
$1.5M). Costs of the observer program are compounded by many days paid for observer
sampling without the collection of any data due to soak times of several days and exposure to
bad weather.
Physical retention of all bycatch by fishers for analysis by researchers
The major crab fishers are often at sea for 2 week trips. Bycatch would need to be stored in a
frozen state and then transported from ports in Victoria or Tasmania to TAFI. It was concluded
that practical issues, potential quarantine issues, condition of bycatch at time of analysis and
Department of Primary Industries and Water April 2006 Page 48
running costs of this strategy were not really viable. In addition, this approach would be
counter-productive to reducing mortality of benthic organisms.
Photographic recording of bycatch by fishers for analysis by researchers
Disposable cameras can be distributed to the major fishers with instructions about photographing
bycatch and returning the cameras to TAFI when the film was completed. Photos would be
analysed by research staff and would provide quantitative and qualitative bycatch data with some
spatial data at a trip by trip level. Trials of this simple cost effective strategy have commenced
and will be reported on in the next stock assessment.
Byproduct
This has been discussed under section “Fishing is conducted in a manner that does not threaten
stocks of by product species”.
B.2.1.3-6 Management responses
Measures are in place to avoid capture and mortality of bycatch species unless it is determined
that the level of catch is sustainable (except in relation to endangered, threatened or protected
species). Steps must be taken to develop suitable technology if none is available.
The primary measure in place to avoid capture and mortality of bycatch species is the mandatory
escape gap in each pot. Pot specifications including escape gap specifications are detailed in the
management plan (Fisheries (Giant Crab) Rule 2006). These specifications have been in place
for many decades. Pot specifications are currently identical for the rock lobster and giant crab
fisheries. The work of Frusher and Gibson (1999) details the effectiveness of escape gaps to
reduce bycatch in traps. The most numerous bycatch species in both fisheries is the same
(Hermit crab – Strigipagurus strigimanus), which supports similar gear restrictions.
An additional measure for traps set in waters less than 120m is maximum soak time rule of 48
hours. This measure aims to minimise mortality of bycatch species.
An indicator group of bycatch species is monitored.
No bycatch species has been determined to be suitable as an indicator species. Given the low
number of bycatch species, monitoring general trends of all bycatch appears to be a more
appropriate strategy.
Department of Primary Industries and Water April 2006 Page 49
There are decision rules that trigger additional management measures when there are
significant perturbations in the indicator species numbers.
Not specifically. However, the Act provides for amendments to management plan and
emergency responses that could be used to protect a species that was perceived to be under
threat. The development of a new strategic policy document for the fishery will include
investigation of whether there are any appropriate triggers that could be developed for bycatch.
The management response, considering uncertainties in the assessment and precautionary
management actions, has a high chance of achieving the objective.
In a general sense only those management responses that had a high chance of achieving the
objective would be considered.
B.2.2 Objective 2.
The fishery is conducted in a manner that avoids mortality of, or injuries to,
endangered, threatened or protected species and avoids or minimises impacts
on threatened ecological communities.
B.2.2.1 Information requirements
Reliable information is collected on the interaction with endangered, threatened or protected
species and threatened ecological communities.
A protected species interaction monthly record was introduced into the Giant Crab catch and
effort logbook on 1 March 2006. Fishers are required to tick the protected species interaction
field on the catch effort log sheet for any day when an interaction occurs and are required to
complete the protected species interaction monthly record at the back of the log book to provide
full details about the interaction. A list of protected species is provided at the front of the
logbook. The logbook instructions state that The Environment Protection and Biodiversity
Conservation Act (EPBC) 1999 requires all interaction information to be collected by all
fisheries.
A copy of the monthly record and protected species list is attached (Attachments 3 a and 3 b).
Department of Primary Industries and Water April 2006 Page 50
In practice fishers tend to only consider interactions with protected species as those that involve
snagging or mortality of animals. Interactions can be more benign than this, which isn’t well
documented through data collected by logbooks. Fisheries independent data on protected species
interactions comes through the extensive monitoring conducted for the rock lobster fishery.
Gear and vessels operating in the two fisheries are essentially identical so it is reasonable to
assume that interactions are equivalent. This fisheries independent data source includes
interactions such as consumption of discarded bait by protected species and roosting on vessels.
B.2.2.2-3 Assessments
There is an assessment of the impact of the fishery on endangered, threatened or protected
species.
The main groups of marine animals that may be negatively impacted by Giant crab fishing are
whales, seals, turtles and seabirds. According to Frusher et al (2003), interactions with protected
or threatened fish (eg great white shark and spotted handfish) or invertebrate species are unlikely
given the habitats where Giant crab fishing occurs. The main impact on seals would be through
discarded rubbish. The main threat to sea birds from the giant crab fishery is via entrapment in
fishing gear and marine debris or collision with lights whilst night fishing. Benign or possibly
positive impacts are now recorded routinely in independent potting surveys.
Seabirds
According to Frusher et al (2003) rock lobster fishers contacted informally during the 2001/02
season and asked to provide interaction information, reported numerous interactions with
protected bird species, primarily with silver and pacific gulls, cormorant species, prion species,
shearwater species, albatross species, and other waterbirds. These interactions were generally
non-damaging such as birds roosting on vessels or eating discarded bait. Fishers working in the
Bass Strait also reported interaction with migrating silvereyes, which were observed to rest on
the vessel. One fisher reported the drowning of a pied cormorant in a lobster trap. Drowning of a
black cormorant has also been observed in independent surveys but is clearly an infrequent event
(given that these surveys have been undertaken for around 40 years). The drowning of
cormorants in pots is presumably restricted to shallow waters that do not support crab fishing
operations.
Department of Primary Industries and Water April 2006 Page 51
Turtles
The Draft Recovery Plan for Marine Turtles in Australia (Anon EA 1998) required Tasmania to
quantify the entanglement events and the mortalities as a result of rock lobster pot lines. From
time to time fishers report entanglements of turtles and seals. The incidence appears to be very
low. Information collected for inclusion in the draft recovery plan concluded there had been 118
sightings of turtles in 10 years. In contrast, Bone (1998) undertook a preliminary investigation
into the abundance and occurrences of the leatherback turtle in waters around Tasmania,
concluding that the frequency of turtles occurring in Tasmanian waters may be higher than
previously thought. These sightings are not separated to provide mortalities, but it is reasonable
to assume that the number of interactions that result in the death of the turtle is likely to be a rare.
In the 10 years to 1998, only 4 turtle deaths were recorded from entanglements in fishing gear
(Anon. EA 1998). In January 2002, a leatherback turtle (Dermochelys coriacea) weighing
approximately 250 kg was entangled in a lobster buoy line off Flinders Island and subsequently
drowned (Frusher et al, 2003.). The animal was recovered by the lobster fisher and supplied to
the Tasmanian Museum.
Seals
In the background report to the Tasmanian Seal Fishery Interaction Management Strategy (Anon,
2002), it was noted that no interactions with giant crab fishing operations have been reported. It
is likely that the small number of participants and the deep-water nature of the fishery limit the
opportunity for interactions to occur. Seal drownings observed in other fisheries tend to occur in
shallow depths and near breeding sites as pups are more vulnerable. Although seals have been
observed in the deep-water video surveys of crab habitat, these were all adult, which indicates
reduced risk.
Low level interactions occur in the Tasmanian rock lobster fishery (Anon, 2002), the most
frequently reported being the pulling of bait out of savers, predation or damage to discarded
(undersize, female or soft-shell) lobster. Occasional drowning of juvenile seals in pots has also
been reported in Tasmania (Anon, 2002).
Seal interactions with discarded rubbish and ropes have been documented, some of this may
have originated from giant crab vessels. The Nature Conservation Branch of DPIWE and the
Department of Primary Industries and Water April 2006 Page 52
Tasmanian Fishing Industry Council have been promoting retaining all rubbish and rope discards
and returning them to port.
The report “A Seal / Fishery Interaction Management Strategy” (Anon, 2002) suggested
mitigation measures in the lobster fishery such as modifications to fishing practice and gear
design, however no specific measures were identified for the giant crab fishery.
DPIWE believes that given the gear type, and the small scale of the crab fishery in terms vessel
numbers, catch, effort and offshore fishing grounds, the likely risk of a negative interaction is
very low and the thus the impact of the fishery on endangered, threatened or protected species is
also very low.
This was also the conclusion of the 2005 report of the DEH Technical working group on Fishing
Risk Assessment for the development of MPA’s in the SE Marine region. The report listed a X =
‘occurrence does not occur’ against interactions with seals, sealions, whales, dolphins, porpoises,
seabirds and turtles.
Empirical data collected from the compulsory reporting of protected species interaction will be
analysed as part of the annual fishery assessment. This will allow any emerging trends to be
monitored.
There is an assessment of the impact of the fishery on threatened ecological communities.
There are no known threatened ecological communities within the crab fishing grounds, however
the knowledge about the shelf break habitat (giant crab habitat) will be greatly enhanced on
completion of the FRDC project later this year.
B.2.2.4-6 Management responses
There are measures in place to avoid capture and/or mortality of endangered, threatened or
protected species.
A specific DEH recommendation from the first assessment of the fishery was to development
and implement an education program for fishers to promote the importance of protected species
protection and accurate incident reporting.
This is being undertaken in several ways:
Direct office or phone contact with fishers by Logbook data entry and monitoring staff;
Department of Primary Industries and Water April 2006 Page 53
Letter from DPIWE to all giant crab licence holders (copy attached);
Port meetings (10 statewide port meetings for rock lobster and giant crab fishers are
scheduled for late April/early May this year).
There are measures in place to avoid impact on threatened ecological communities.
Not applicable at this stage.
There are currently a number of locations where fishers cannot set giant crab traps, these include
areas that have been established as marine protected areas. For example, an area is closed to
fishing with traps to protect some unique habitat on the eastern side of King Island. New MPA’s
that have been declared since last assessment include no take areas for potting. Note that no
habitats or ecological communities that support crab or lobster fisheries have been described.
The management response, considering uncertainties in the assessment and precautionary
management actions, has a high chance of achieving the objective.
N/A
B.2.3 Objective 3.
The fishery is conducted, in a manner that minimises the impact of fishing
operations on the ecosystem generally.
B.2.3.1 Information requirements
Information appropriate for the analysis in 2.3.2 is collated and/or collected covering the
fisheries impact on the ecosystem and environment generally.
Given the very low level of bycatch for the fishery, and the nature of the pot gear type, the main
focus in relation to the impact of fishing operations has been on the “footprint” of the fishery.
The footprint is the calculated area of the seabed that would be impacted by all the pot lifts
assuming that no pot lands in exactly the same spot twice.
As noted at Section B2, the total number of pot lifts for these fishers has ranged between 28561
and 18225 over the last four years. The total footprint is estimated by assuming that each trap
covers 1 square meter. Total annual footprint has thus averaged around 23500 m2, which
Department of Primary Industries and Water April 2006 Page 54
equates to an area around 150 x 150 m, which is obviously trivial relative to the area of the giant
crab habitat within the 200 mile jurisdiction area of the Tasmanian fishery.
Significant information has been collected during the FRDC project ‘Understanding the shelf
break habitat’.
B.2.3 Assessment
2.3.2 Information is collected and a risk analysis, appropriate to the scale of the fishery and its
potential impacts, is conducted into the susceptibility of each of the following ecosystem
components to the fishery.
Impacts on ecological communities
Benthic communities
Ecologically related, associated or dependent species
Water column communities
Impacts on food chains
Structure
Productivity/flows
Impacts on the physical environment
Physical habitat
Water quality
A risk assessment of the impact of the giant crab traps on a range of habitats was conducted by
the Technical working group reporting to DEH on fishing risk assessment for the development of
MPA’s. The risk assessment report (Anon DEH 2005) states that the most significant interaction
is through contact of the traps on the bottom. The traps are heavy enough to avoid movements
with currents on the bottom, and the footprint is small. The consequences of the interaction were
that settling traps could damage fragile species and there could be some long term damage to the
habitat, with affected organisms taking some time to recover. However these consequences were
deemed to be negligible by virtue of the very small footprint and the overall risk rating is low.
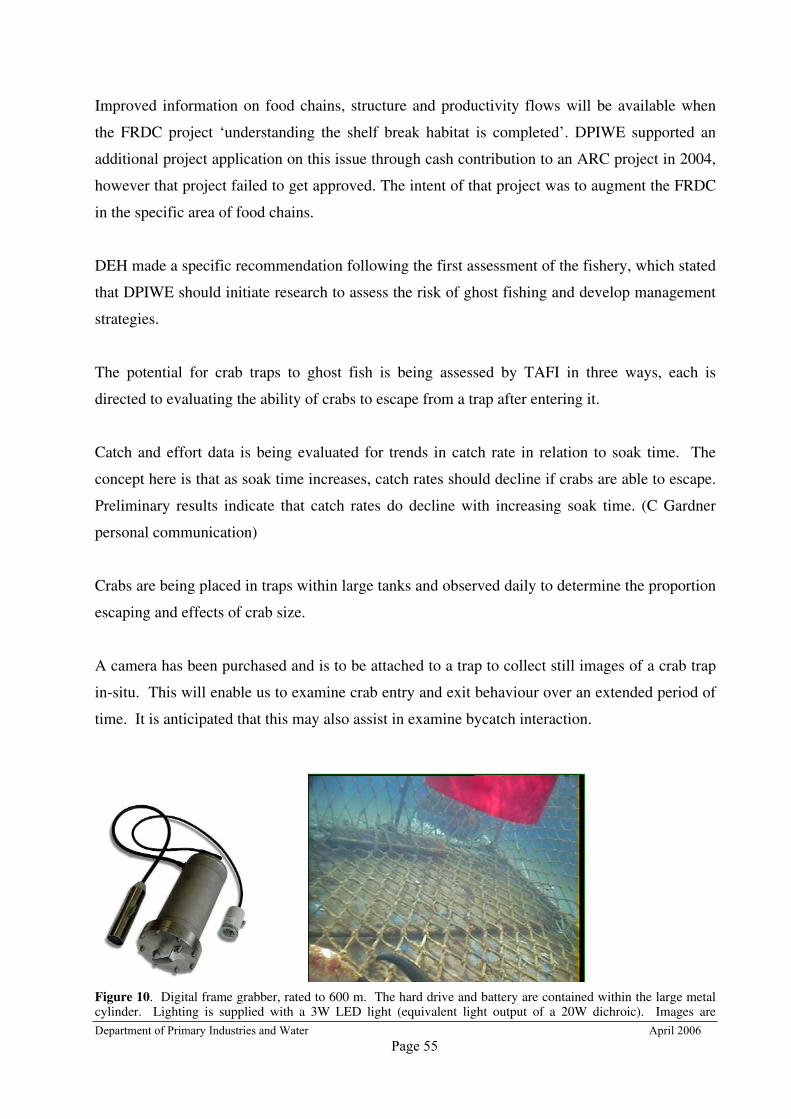
Department of Primary Industries and Water April 2006 Page 55
Improved information on food chains, structure and productivity flows will be available when
the FRDC project ‘understanding the shelf break habitat is completed’. DPIWE supported an
additional project application on this issue through cash contribution to an ARC project in 2004,
however that project failed to get approved. The intent of that project was to augment the FRDC
in the specific area of food chains.
DEH made a specific recommendation following the first assessment of the fishery, which stated
that DPIWE should initiate research to assess the risk of ghost fishing and develop management
strategies.
The potential for crab traps to ghost fish is being assessed by TAFI in three ways, each is
directed to evaluating the ability of crabs to escape from a trap after entering it.
Catch and effort data is being evaluated for trends in catch rate in relation to soak time. The
concept here is that as soak time increases, catch rates should decline if crabs are able to escape.
Preliminary results indicate that catch rates do decline with increasing soak time. (C Gardner
personal communication)
Crabs are being placed in traps within large tanks and observed daily to determine the proportion
escaping and effects of crab size.
A camera has been purchased and is to be attached to a trap to collect still images of a crab trap
in-situ. This will enable us to examine crab entry and exit behaviour over an extended period of
time. It is anticipated that this may also assist in examine bycatch interaction.
Figure 10. Digital frame grabber, rated to 600 m. The hard drive and battery are contained within the large metalcylinder. Lighting is supplied with a 3W LED light (equivalent light output of a 20W dichroic). Images are
Department of Primary Industries and Water April 2006 Page 56
collected every 2 minutes for a period of over 20 days. Image to the right shows a frame from a shallow water trialdeployment. The claws of a large male can be seen in the foreground, while a female crab outside the trap is visiblein the background.
Giant crab fisher estimates on the number of traps lost per year ranges from 3 to 30.
Extrapolating this number for all major crab fishers and adding a factor to cover the minor
operators suggests that the number of lost pots per annum is likely to be significantly less than
500.
Impact on water column communities and water quality is not deemed to be relevant for this
fishery.
B.2.3.3-5 Management responses
Management actions are in place to ensure significant damage to ecosystems does not arise from
the impacts described in 2.3.1.
DEH made a specific recommendation following the first assessment of the fishery relating to the
development and encouraging the adoption of an environment code of practice in consultation with
industry. The recommendation also included implementing a means of monitoring fisher adoption
of the code of practice.
In 2004, the peak industry body representing rock lobster and giant crab fishers the Tasmanian
Rock Lobster Fishermen’s Association (TRLFA), began actively promoting adoption of a
program called the “Clean Green Program”. This program is an environmental management
system which is certified and conforms to nationally recognised JAS-ANZ and ISO/IEC
standards. The program is a pot – to – plate initiative with standards of best practice covering
environmental practice, seafood safety and quality and occupational health and safety. The
standards have been developed by industry, for industry, to meet developing market, community
and government expectations/legislation in environmental management. Performance against all
criteria is audited independently.
The program was developed by Southern Rock Lobster Ltd (a company formed by the South
Australian, Tasmanian and Victorian Rock Lobster Industry Associations). The company recently
Department of Primary Industries and Water April 2006 Page 57
won the environmental best practice program award at the United Nations Association of
Australia’s 2005 World Environment Day Awards.
DPIWE has actively supported the adoption of this program by financial support through the Farm
Biz initiative, which the Dept administers in Tasmania and through administrative support such as
providing venues free of charge to run part of the induction progress.
To be accredited, fishers have to first attend a 2 day structured induction and assessment program.
This is being run by Southern Rock Lobster on a port by port basis. In 2005 the program was run at
King Island and Hobart, with 25 fishers attending. Independent auditing of the skipper and vessels
occurs on a random basis every year. In May 2006, another 25 fishers scheduled to be assessed.
The environmental practice covered by the program includes fishery sustainability, minimising
bycatch, minimising ecological interactions, avoiding seal breeding colonies, whale identification,
introduced pests, waste disposal procedures, safe refuelling and spill kit use. For more details refer
to the summary table in attachment 4.
This program is not specific to the giant crab fishery, however given the generic nature of the
environmental issues covered by the program and the assessed low impact of the gear type, DPIWE
believes that it is a highly suitable cost effective environmental program for the fishery. Note all
giant crab fishers have to hold a rock lobster licence.
DPIWE can monitor fisher adoption of the program by liasing with the Southern Rock Lobster co-
ordinator of the program.
FRDC project ‘understanding shelf break habitat’ - when this project is completed any new data on
the impact of crab fishing operations will be assessed and appropriate management responses will
be considered if warranted.
Ghost fishing
When the results of the camera research are available, suitable management responses new
management responses will be considered if warranted. DPIWE may also consider collecting lost
trap data from all fishers through the giant crab catch effort logbook.
Department of Primary Industries and Water April 2006 Page 58
There are decision rules that trigger further management responses when monitoring detects
impacts on selected ecosystem indicators beyond a predetermined level, or where action
is indicated by application of the precautionary approach.
Not currently, but appropriate triggers will be considered during the development of the new
strategic policy document later this year.
The management response, considering uncertainties in the assessment and precautionary
management actions, has a high chance of achieving the objective
N/A
Department of Primary Industries and Water April 2006Page 59
C REFERENCES
Anonymous (1996) Arrangement between the Commonwealth and State of Tasmania in relation
to the fishery for invertebrates and certain finfish to be managed under State law in waters
relevant to Tasmania. Commonwealth of Australia Gazette, No. P Fisheries Legislation.
Anonymous – EA (1998) Draft Recovery Plan for Marine Turtles in Australia. Biodiversity
Group, Environment Australia.
Anonymous – DPIWE (1999) Giant Crab Fishery Policy Document Unpublished report,
Department of Primary Industries, Water and Environment, Tasmania.
Anonymous – DPIWE (2002) A Seal / Fishery Interaction Management Strategy Unpublished
report, Department of Primary Industries, Water and Environment, Tasmania.
Anonymous – DEH (2005) Fishing Risk Assessment for the development of a representative
system of marine Protected Areas in the South –east Marine region –report of the
Technical Working Group Unpublished report, Department Environment and Heritage,
Australia.
Anonymous – DPIWE (2003) Review of the Giant Crab Fishery –report to the Minister
Unpublished report, Department of Primary Industries, Water and Environment, Tasmania.
Anonymous – DPIWE (2005) Rock Lobster and Giant Crab Fisheries Management Plan Review
Information Paper Unpublished report, Department of Primary Industries, Water and
Environment, Tasmania.
Anonymous – DPIWE (2005) Report to the Minister on the Public Consultation Process for the
Review of the Rock Lobster and Giant Crab Fisheries Management Plan Unpublished
report, Department of Primary Industries, Water and Environment, Tasmania.
Bone, C. (1998) Preliminary investigation into Leatherback turtle Dermochelys coriacea
distribution, abundance and interactions with fisheries in Tasmanian waters. Unpublished
report to Environment Australia (project no. SOMS97-06). Parks and Wildlife Service,
Tasmania.
Department of Primary Industries and Water April 2006 Page 60
Bryant, S. and J. Jackson (1999) Tasmania’s Threatened Fauna Handbook: what, where and how
to protect Tasmania’s threatened animals. Threatened Species Unit, Parks and Wildlife
Service, Department Primary Industries, Water and Environment, Tasmania.
Dix, T.G. and C.B. Sumner (1980) Development of small-scale invertebrate fisheries in
Tasmanian waters. Final report of the Tasmanian Fisheries Development Authority.
Ford, W. (1998) Management Options for the Giant Crab fishery in Tasmania. Unpublished
discussion paper, Department of Primary Industries, Water and Environment, Tasmania.
Forward, J., and Lyle , J.M. (2002). A survey of the 2000/01 Tasmanian recreational rock lobster
fishery and options for future assessment. Tasmanian Aquaculture and Fisheries Institute,
Final report to the Marine Recreational Fishery Council.
Frusher, S.D. and I.D. Gibson (1999) Bycatch in the Tasmanian rock lobster fishery. In
Establishing meaningful targets for bycatch reduction in Australian fisheries, edited by
Buxton, C. D. and S.E. Eayers, Australian Society for Fish Biology Workshop Proceedings,
Hobart, September 1998. Australian Society for Fish Biology, Sydney, 73-81.
Frusher, S. D., C. Gardner and M. Haddon. (2003). Tasmanian Rock Lobster Fishery 2001/2002.
Fishery Assessment Report, Unpublished report, Tasmanian Aquaculture and Fisheries
Institute, University of Tasmania.
Gardner, C. (1998) The Tasmanian Giant Crab Fishery: A synopsis of Biological and Fisheries
Information. Unpublished report, Department of Primary Industries and Fisheries,
Tasmania.
Gardner, C. and C. Mackinnon. (2002) Tasmanian Giant Crab Fishery 2000/2001. Fishery
Assessment Report, Unpublished report, Tasmanian Aquaculture and Fisheries Institute,
University of Tasmania.
Gardner, C., M. Bermudes and C. Mackinnon. (2003) Tasmanian Giant Crab Fishery 2001/2002.
Fishery Assessment Report, Unpublished report, Tasmanian Aquaculture and Fisheries
Institute, University of Tasmania.
Gardner, C., C. Mackinnon, P Burch and M. Bermudes (2004) Tasmanian Giant Crab Fishery
2002/2003. Fishery Assessment Report, Unpublished report, Tasmanian Aquaculture and
Fisheries Institute, University of Tasmania.
Department of Primary Industries and Water April 2006 Page 61
Gardner, C. (2005) Milestone Progress Report FRDC project 2004/066 ‘Understanding shelf
break habitat for sustainable management of fisheries with spatial overlap’ Unpublished
report, Tasmanian Aquaculture and Fisheries Institute, University of Tasmania.
Gardner, C. (2006) Faunal Catalogue FRDC project 2004/066 ‘Understanding shelf break habitat
for sustainable management of fisheries with spatial overlap’ Unpublished report,
Tasmanian Aquaculture and Fisheries Institute, University of Tasmania.
Gardner, C., M. Haddon, D. Hobday and R. McGarvey (2006) Final Report FRDC project
2001/042 Developing the tools for long-term management of the giant crab resource: Data
collection methodology, stock assessment and harvest strategy evaluation. Unpublished
report, Tasmanian Aquaculture and Fisheries Institute, University of Tasmania.
Mills, D., C. Mackinnon and Gardner, C. (2005) Tasmanian Giant Crab Fishery 2003/2004.
Fishery Assessment Report, Unpublished report, Tasmanian Aquaculture and Fisheries
Institute, University of Tasmania.
Mills, D., and Gardner, C. (2006 in prep.) Tasmanian Giant Crab Fishery 2004/2005. Fishery
Assessment Report, Unpublished report, Tasmanian Aquaculture and Fisheries Institute,
University of Tasmania.
Levings, A., B.D. Mitchell, R.McGarvey, J. Mathews, L. Laurenson, C. Austin, T. Heeron, N.
Murphy, A. Miller, M. Rowsell and P. Jones (2001) Fisheries Biology of the Giant Crab
Pseudocarcinus gigas. FRDC final report 93/220 & 97/132. Deakin University, Geelong.
Department of Primary Industries and Water April 2006 Page 62
D APPENDICES
Appendix 1a - Giant crab catch effort logsheet from 1999 to February 2006 inclusive
Appendix 1b - New Giant crab catch effort logsheet from 1 March 2006
Appendix 1c - Giant crab commercial quota docket
Appendix 2a - Protected species interaction monthly record
Appendix 2b - Protected species list
Appendix 3 - Summary table of Southern Rock Lobster Limited's Clean Green Program
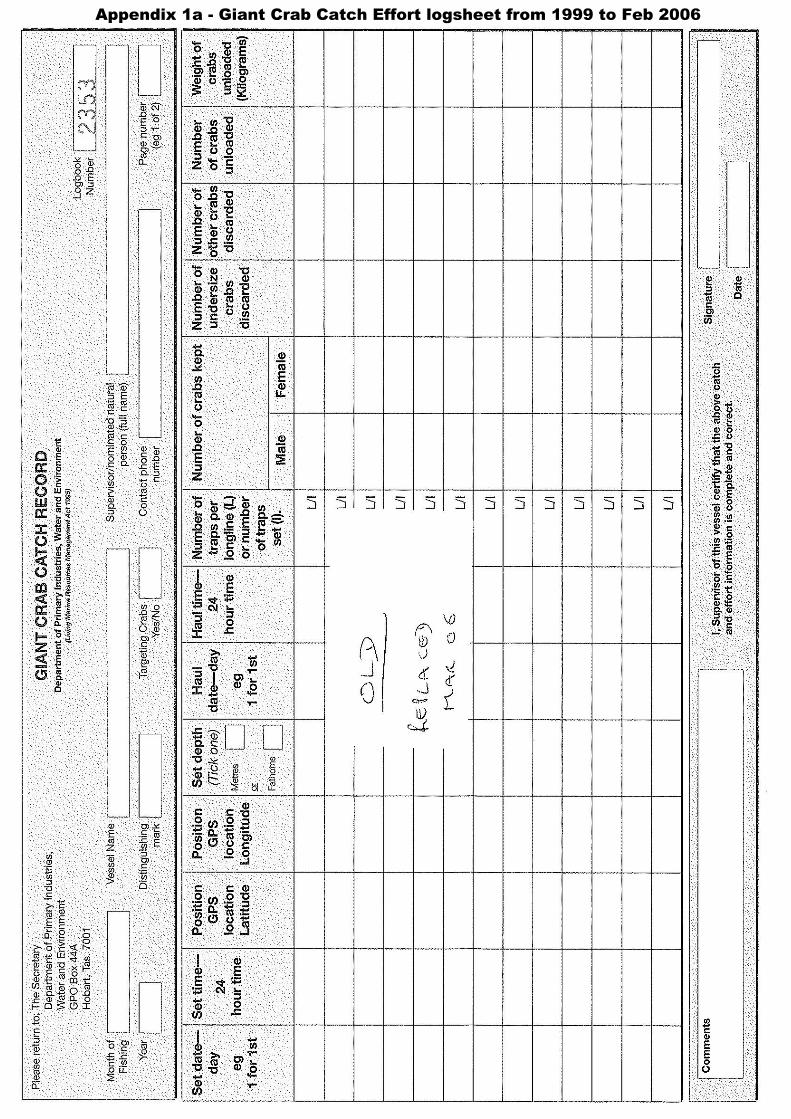
Appendix 1a - Giant Crab Catch Effort logsheet from 1999 to Feb 2006
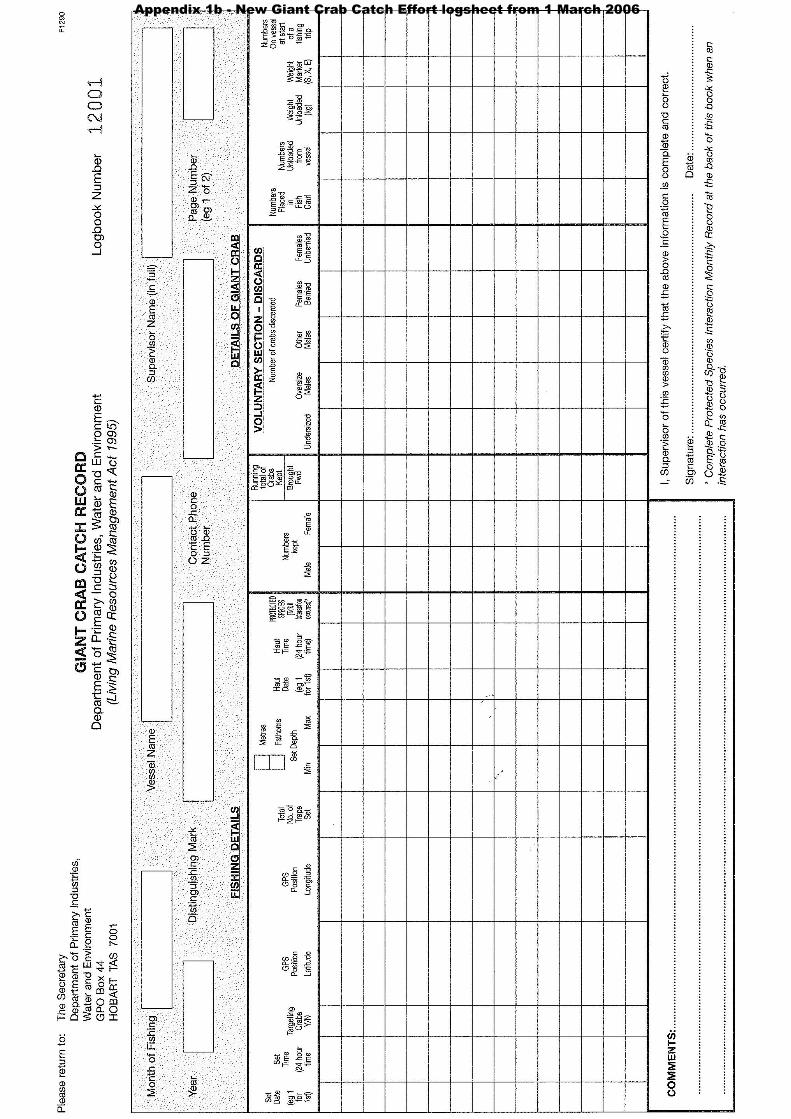
Appendix 1b - New Giant Crab Catch Effort logsheet from 1 March 2006
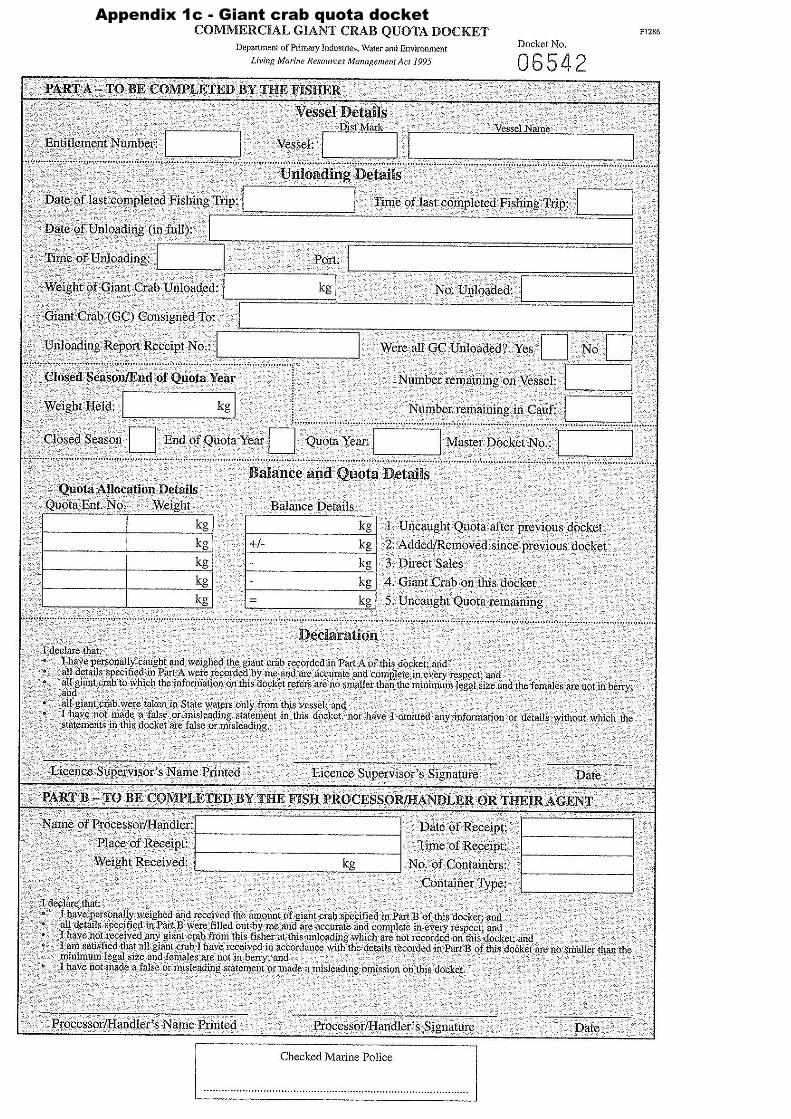
Appendix 1c - Giant crab quota docket
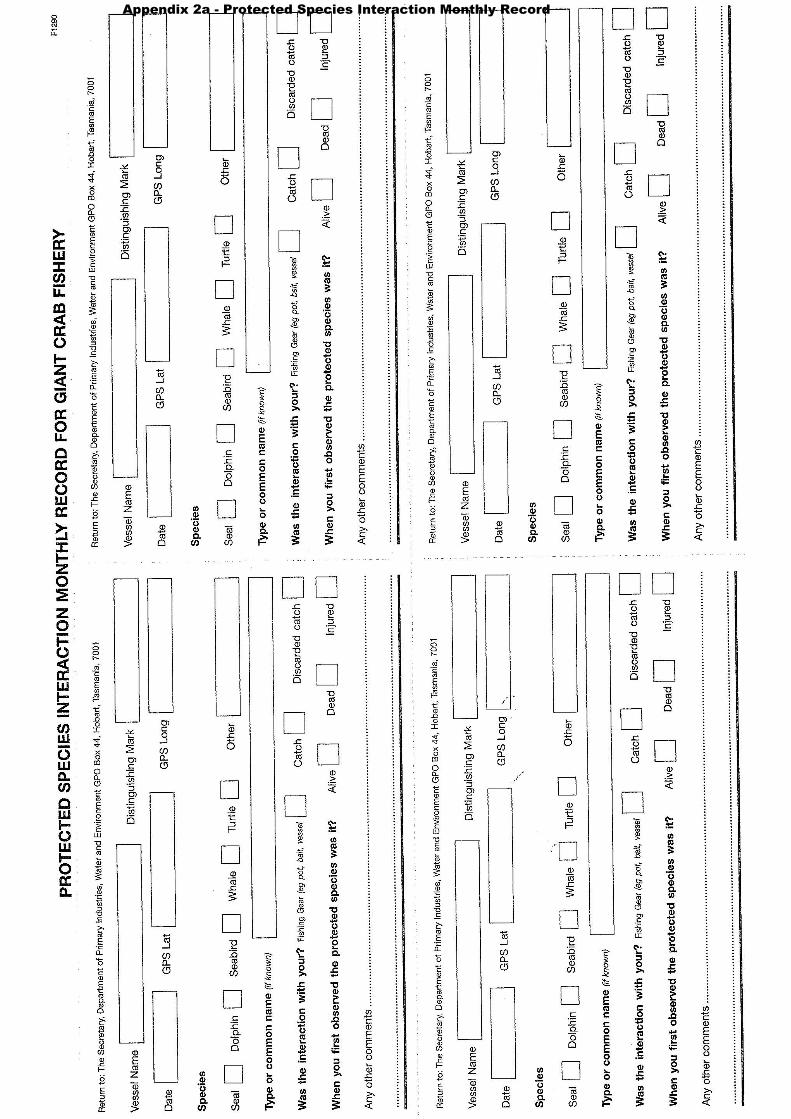
Appendix 2a - Protected Species Interaction Monthly Record
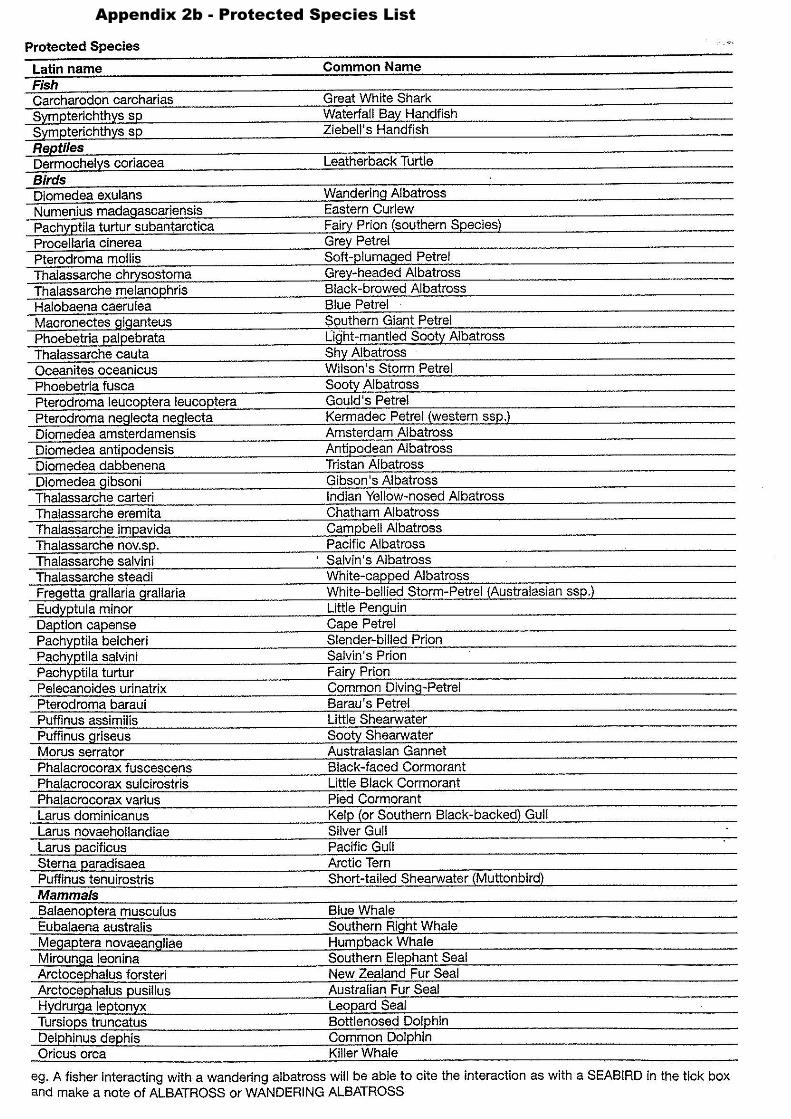
Appendix 2b - Protected Species List
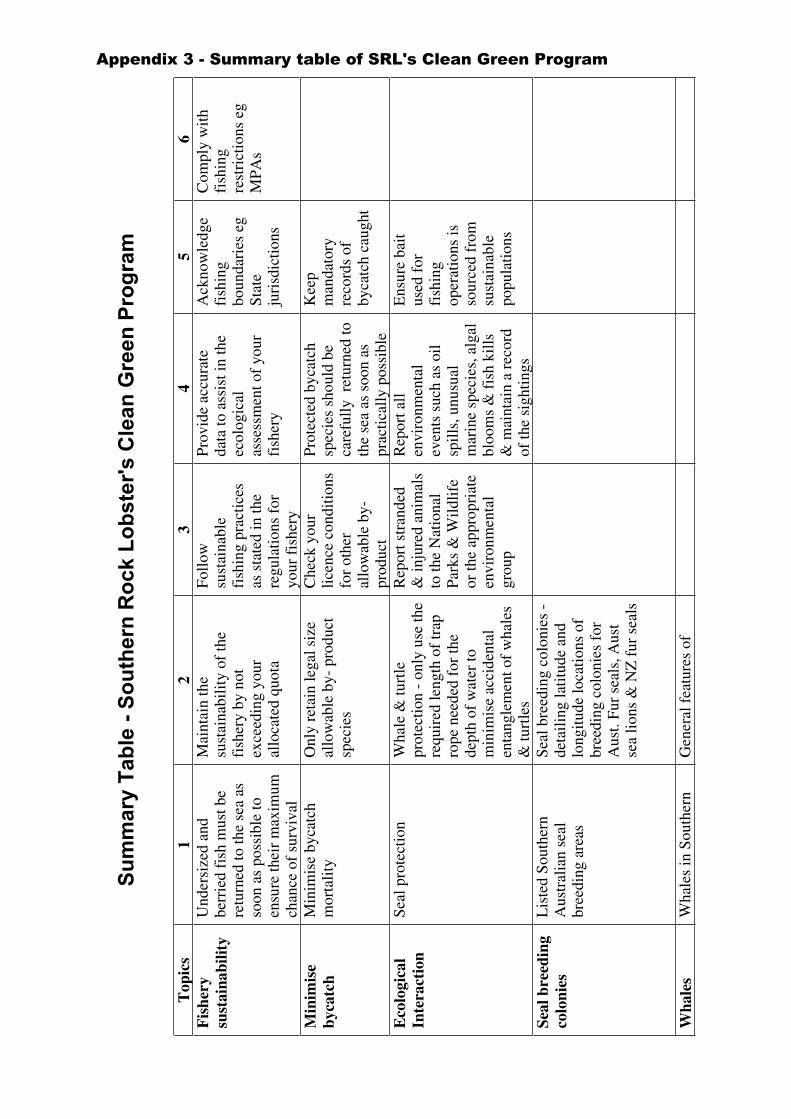
Sum
mar
y Ta
ble
- Sou
ther
n R
ock
Lobs
ter's
Cle
an G
reen
Pro
gram
Top
ics
12
34
56
Fis
hery
sust
aina
bilit
yU
nder
size
d an
dbe
rrie
d fi
sh m
ust b
ere
turn
ed to
the
sea
asso
on a
s po
ssib
le to
ensu
re th
eir
max
imum
chan
ce o
f su
rviv
al
Mai
ntai
n th
esu
stai
nabi
lity
of th
efi
sher
y by
not
exce
edin
g yo
ural
loca
ted
quot
a
Follo
wsu
stai
nabl
efi
shin
g pr
actic
esas
sta
ted
in th
ere
gula
tions
for
your
fis
hery
Prov
ide
accu
rate
data
to a
ssis
t in
the
ecol
ogic
alas
sess
men
t of
your
fish
ery
Ack
now
ledg
efi
shin
gbo
unda
ries
eg
Stat
eju
risd
ictio
ns
Com
ply
with
fish
ing
rest
rict
ions
eg
MPA
s
Min
imis
eby
catc
hM
inim
ise
byca
tch
mor
talit
y O
nly
reta
in le
gal s
ize
allo
wab
le b
y- p
rodu
ctsp
ecie
s
Che
ck y
our
licen
ce c
ondi
tions
for
othe
ral
low
able
by-
prod
uct
Prot
ecte
d by
catc
hsp
ecie
s sh
ould
be
care
full
y r
etur
ned
toth
e se
a as
soo
n as
prac
tical
ly p
ossi
ble
Kee
pm
anda
tory
reco
rds
ofby
catc
h ca
ught
Eco
logi
cal
Inte
ract
ion
Seal
pro
tect
ion
Wha
le &
turt
lepr
otec
tion
- on
ly u
se th
ere
quir
ed le
ngth
of
trap
rope
nee
ded
for
the
dept
h of
wat
er to
min
imis
e ac
cide
ntal
enta
ngle
men
t of
wha
les
& tu
rtle
s
Rep
ort s
tran
ded
& in
jure
d an
imal
sto
the
Nat
iona
lPa
rks
& W
ildlif
eor
the
appr
opri
ate
envi
ronm
enta
lgr
oup
Rep
ort a
llen
viro
nmen
tal
even
ts s
uch
as o
ilsp
ills,
unu
sual
mar
ine
spec
ies,
alg
albl
oom
s &
fis
h ki
lls&
mai
ntai
n a
reco
rdof
the
sigh
tings
Ens
ure
bait
used
for
fish
ing
oper
atio
ns is
sour
ced
from
sust
aina
ble
popu
latio
ns
Seal
bre
edin
gco
loni
esL
iste
d So
uthe
rnA
ustr
alia
n se
albr
eedi
ng a
reas
Seal
bre
edin
g co
loni
es -
deta
iling
latit
ude
and
long
itude
loca
tions
of
bree
ding
col
onie
s fo
rA
ust.
Fur
seal
s, A
ust
sea
lions
& N
Z f
ur s
eals
Wha
les
Wha
les
in S
outh
ern
Gen
eral
fea
ture
s of
Appendix 3 - Summary table of SRL's Clean Green Program
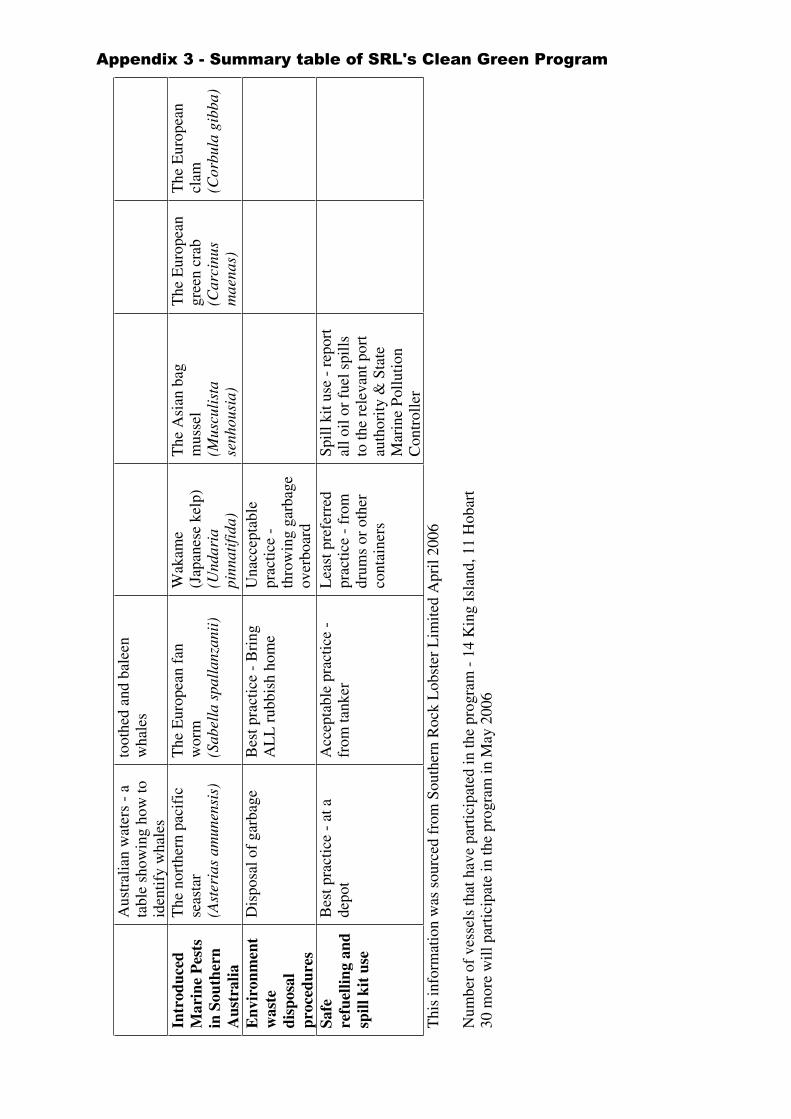
Aus
tral
ian
wat
ers
- a
tabl
e sh
owin
g ho
w to
iden
tify
wha
les
toot
hed
and
bale
enw
hale
s
Intr
oduc
edM
arin
e P
ests
in S
outh
ern
Aus
tral
ia
The
nor
ther
n pa
cifi
cse
asta
r(A
ster
ias
amun
ensi
s)
The
Eur
opea
n fa
nw
orm
(Sab
ella
spa
llan
zani
i)
Wak
ame
(Jap
anes
e ke
lp)
(Und
aria
pinn
atif
ida)
The
Asi
an b
agm
usse
l(M
uscu
list
ase
nhou
sia)
The
Eur
opea
ngr
een
crab
(Car
cinu
sm
aena
s)
The
Eur
opea
ncl
am(C
orbu
la g
ibba
)
Env
iron
men
tw
aste
disp
osal
proc
edur
es
Dis
posa
l of
garb
age
Bes
t pra
ctic
e -
Bri
ngA
LL
rub
bish
hom
eU
nacc
epta
ble
prac
tice
-th
row
ing
garb
age
over
boar
dSa
fere
fuel
ling
and
spill
kit
use
Bes
t pra
ctic
e -
at a
depo
tA
ccep
tabl
e pr
actic
e -
from
tank
erL
east
pre
ferr
edpr
acti
ce -
fro
mdr
ums
or o
ther
cont
aine
rs
Spil
l kit
use
- r
epor
tal
l oil
or
fuel
spi
lls
to th
e re
leva
nt p
ort
auth
ority
& S
tate
Mar
ine
Pollu
tion
Con
trol
ler
Thi
s in
form
atio
n w
as s
ourc
ed f
rom
Sou
ther
n R
ock
Lob
ster
Lim
ited
Apr
il 20
06
Num
ber
of v
esse
ls th
at h
ave
part
icip
ated
in th
e pr
ogra
m -
14
Kin
g Is
land
, 11
Hob
art
30 m
ore
will
par
ticip
ate
in th
e pr
ogra
m in
May
200
6
Appendix 3 - Summary table of SRL's Clean Green Program