Embed Size (px)
Citation preview
Assessing the benefits from improved hydromet services
Orders of magnitude and future research
Stéphane HallegatteThe World Bank, Sustainable Development Network
Email: [email protected]
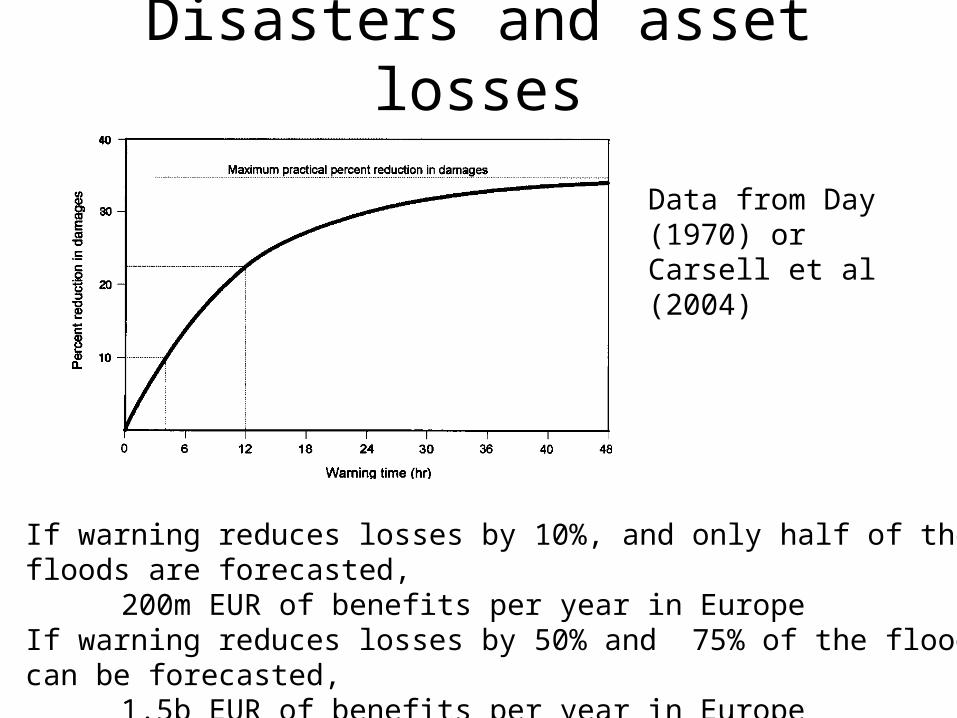
Disasters and asset losses
If warning reduces losses by 10%, and only half of the floods are forecasted, 200m EUR of benefits per year in Europe
If warning reduces losses by 50% and 75% of the floods can be forecasted, 1.5b EUR of benefits per year in Europe
Idem with windstorm: between 460m and 2.7b in Europe
Data from Day (1970) or Carsell et al (2004)
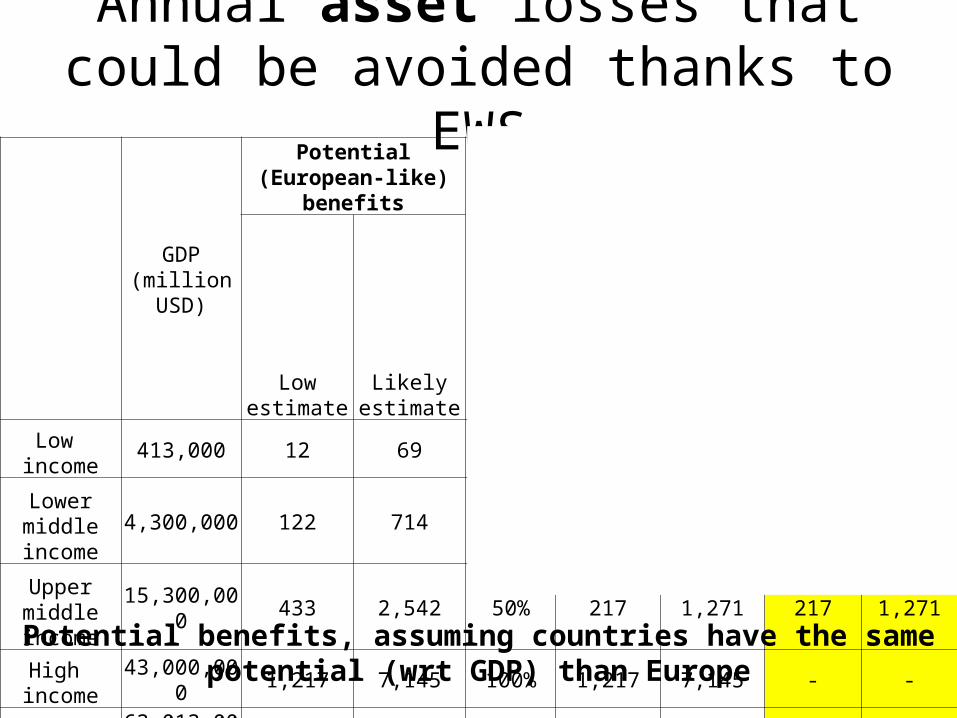
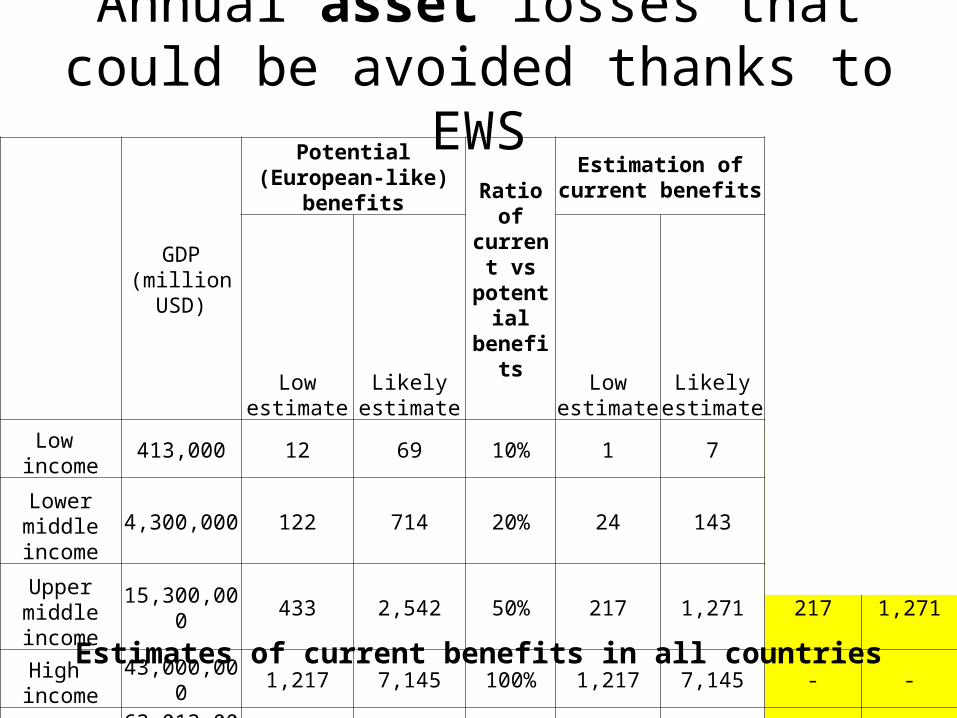
Annual asset losses that could be avoided thanks to EWS
GDP (million USD)
Potential (European-like) benefits Ratio of
current vs potential benefits
Estimation of current benefits
Benefits from improved services
Low estimate
Likely estimate
Low estimate
Likely estimate
Low estimate
Likely estimate
Low income 413,000 12 69 10% 1 7 11 62
Lower middle income 4,300,000 122 714 20% 24 143 97 572
Upper middle income 15,300,000 433 2,542 50% 217 1,271 217 1,271
High income 43,000,000 1,217 7,145 100% 1,217 7,145 - -
TOTAL 63,013,000 1,784 10,470 1,459 8,565 324 1,904
Potential benefits, assuming countries have the same potential (wrt GDP) than Europe
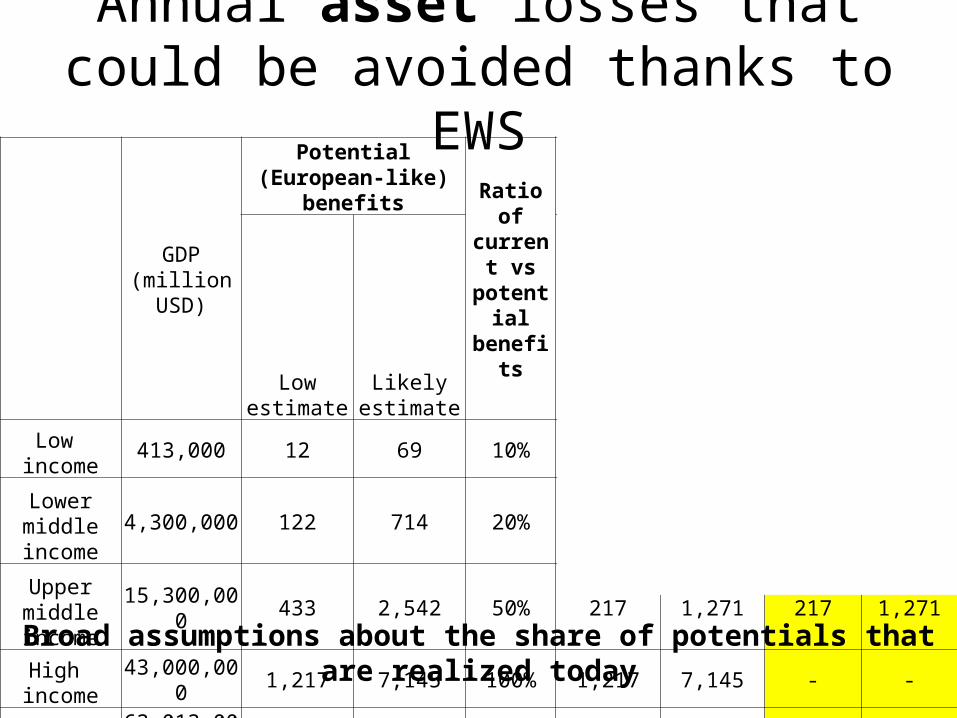
Annual asset losses that could be avoided thanks to EWS
GDP (million USD)
Potential (European-like) benefits Ratio of
current vs potential benefits
Estimation of current benefits
Benefits from improved services
Low estimate
Likely estimate
Low estimate
Likely estimate
Low estimate
Likely estimate
Low income 413,000 12 69 10% 1 7 11 62
Lower middle income 4,300,000 122 714 20% 24 143 97 572
Upper middle income 15,300,000 433 2,542 50% 217 1,271 217 1,271
High income 43,000,000 1,217 7,145 100% 1,217 7,145 - -
TOTAL 63,013,000 1,784 10,470 1,459 8,565 324 1,904
Broad assumptions about the share of potentials that are realized today
Annual asset losses that could be avoided thanks to EWS
GDP (million USD)
Potential (European-like) benefits Ratio of
current vs potential benefits
Estimation of current benefits
Benefits from improved services
Low estimate
Likely estimate
Low estimate
Likely estimate
Low estimate
Likely estimate
Low income 413,000 12 69 10% 1 7 11 62
Lower middle income 4,300,000 122 714 20% 24 143 97 572
Upper middle income 15,300,000 433 2,542 50% 217 1,271 217 1,271
High income 43,000,000 1,217 7,145 100% 1,217 7,145 - -
TOTAL 63,013,000 1,784 10,470 1,459 8,565 324 1,904
Estimates of current benefits in all countries

Annual asset losses that could be avoided thanks to EWS
GDP (million USD)
Potential (European-like) benefits Ratio of
current vs potential benefits
Estimation of current benefits
Benefits from improved services
Low estimate
Likely estimate
Low estimate
Likely estimate
Low estimate
Likely estimate
Low income 413,000 12 69 10% 1 7 11 62
Lower middle income 4,300,000 122 714 20% 24 143 97 572
Upper middle income 15,300,000 433 2,542 50% 217 1,271 217 1,271
High income 43,000,000 1,217 7,145 100% 1,217 7,145 - -
TOTAL 63,013,000 1,784 10,470 1,459 8,565 324 1,904
Hydromet services and early warning systems could reduce annual asset losses by between 300 million and 2 billion USD per year in developing
countries

Other economic benefits from hydromet information in Europe
• Benefits from the optimization of economic production
• Weather sensitive sectors at the global level:– Agriculture, 2,000 billion USD; – Mining and energy, 7,000 billion USD; – Construction, 3,200 billion USD; – Transport, 4,300 billion USD.
• Total: sensitive sectors create more than 16,000 billion USD per year of added value, i.e. about 25% of world GDP.
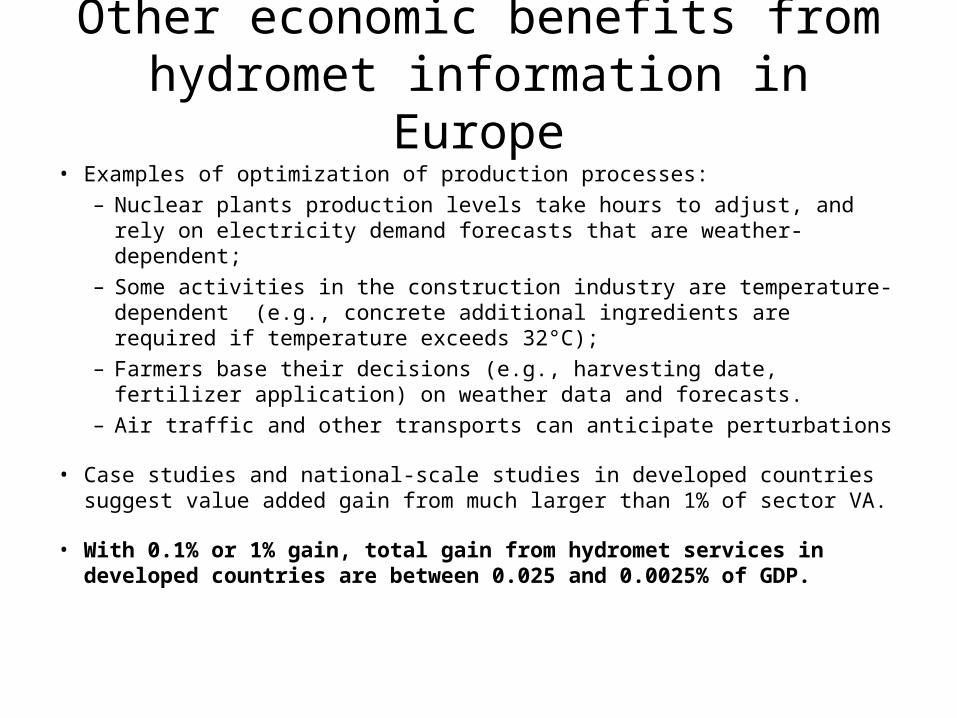
Other economic benefits from hydromet information in Europe
• Examples of optimization of production processes:– Nuclear plants production levels take hours to adjust, and rely on
electricity demand forecasts that are weather-dependent;– Some activities in the construction industry are temperature-dependent
(e.g., concrete additional ingredients are required if temperature exceeds 32°C);
– Farmers base their decisions (e.g., harvesting date, fertilizer application) on weather data and forecasts.
– Air traffic and other transports can anticipate perturbations
• Case studies and national-scale studies in developed countries suggest value added gain from much larger than 1% of sector VA.
• With 0.1% or 1% gain, total gain from hydromet services in developed countries are between 0.025 and 0.0025% of GDP.

Annual economic benefits from hydromet information in developing countries
GDP (million USD)
Potential (European-like) benefits Ratio of
current vs potential benefits
Estimation of actual benefits
Benefits from improved services
Low estimate
Likely estimate
Low estimate
Likely estimate
Low estimate
Likely estimate
Lowincome 413,000 103 1,033 10% 10 103 93 929
Lower middle income 4,300,000 1,075 10,750 20% 215 2,150 860 8,600
Upper middle income 15,300,000 3,825 38,250 50% 1,913 19,125 1,913 19,125
Highincome 43,000,000 10,750 107,500 100% 10,750 107,500 - -
TOTAL 63,013,000 15,753 157,533 12,888 128,878 2,865 28,654

Natural hazards kill on average 43,000 persons per year in developing countries
Number of people reported killed by weather-related natural disasters (1975-2011), in developing countries and at the world level. There is no significant trend in these
series. Data from EM-DAT: The OFDA/CRED International Disaster Database.
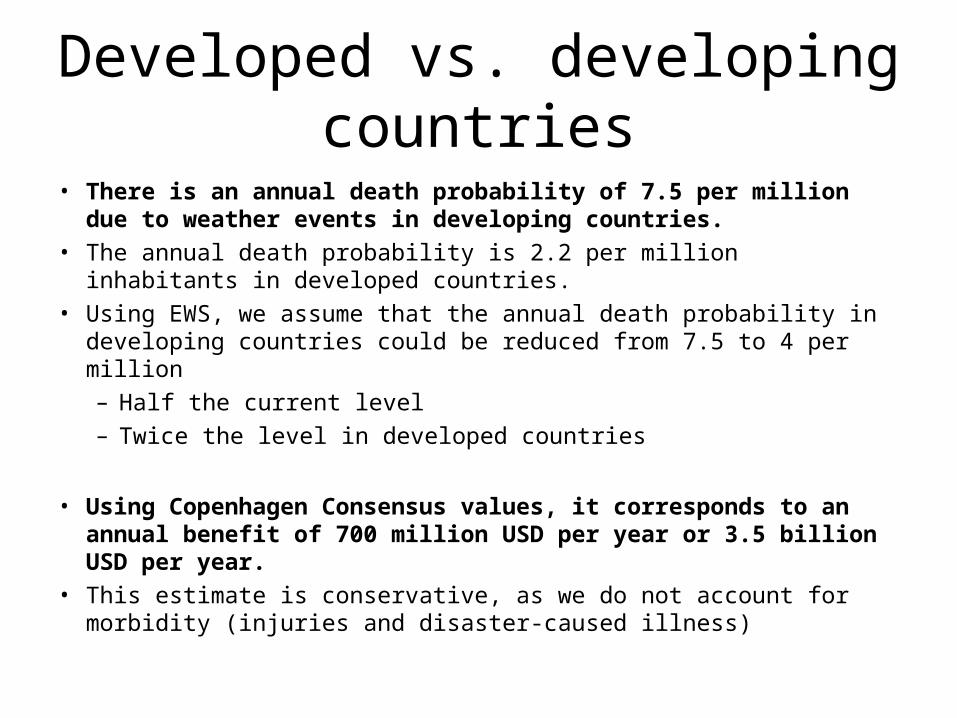
Developed vs. developing countries
• There is an annual death probability of 7.5 per million due to weather events in developing countries.
• The annual death probability is 2.2 per million inhabitants in developed countries.
• Using EWS, we assume that the annual death probability in developing countries could be reduced from 7.5 to 4 per million – Half the current level– Twice the level in developed countries
• Using Copenhagen Consensus values, it corresponds to an annual benefit of 700 million USD per year or 3.5 billion USD per year.
• This estimate is conservative, as we do not account for morbidity (injuries and disaster-caused illness)
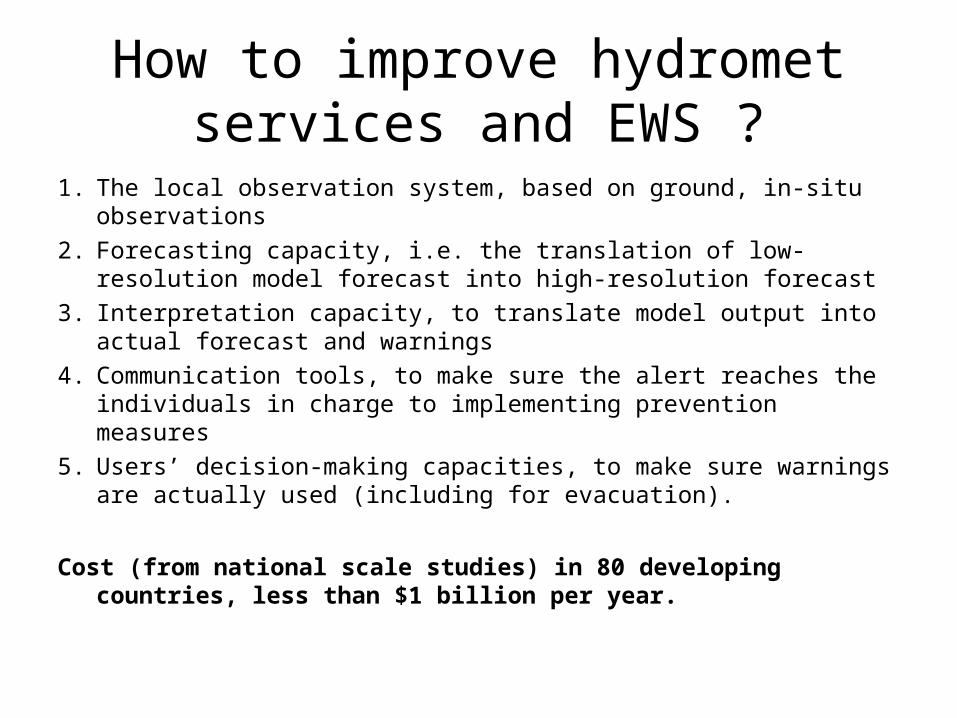
How to improve hydromet services and EWS ?
1. The local observation system, based on ground, in-situ observations2. Forecasting capacity, i.e. the translation of low-resolution model
forecast into high-resolution forecast 3. Interpretation capacity, to translate model output into actual
forecast and warnings 4. Communication tools, to make sure the alert reaches the
individuals in charge to implementing prevention measures5. Users’ decision-making capacities, to make sure warnings are
actually used (including for evacuation).
Cost (from national scale studies) in 80 developing countries, less than $1 billion per year.
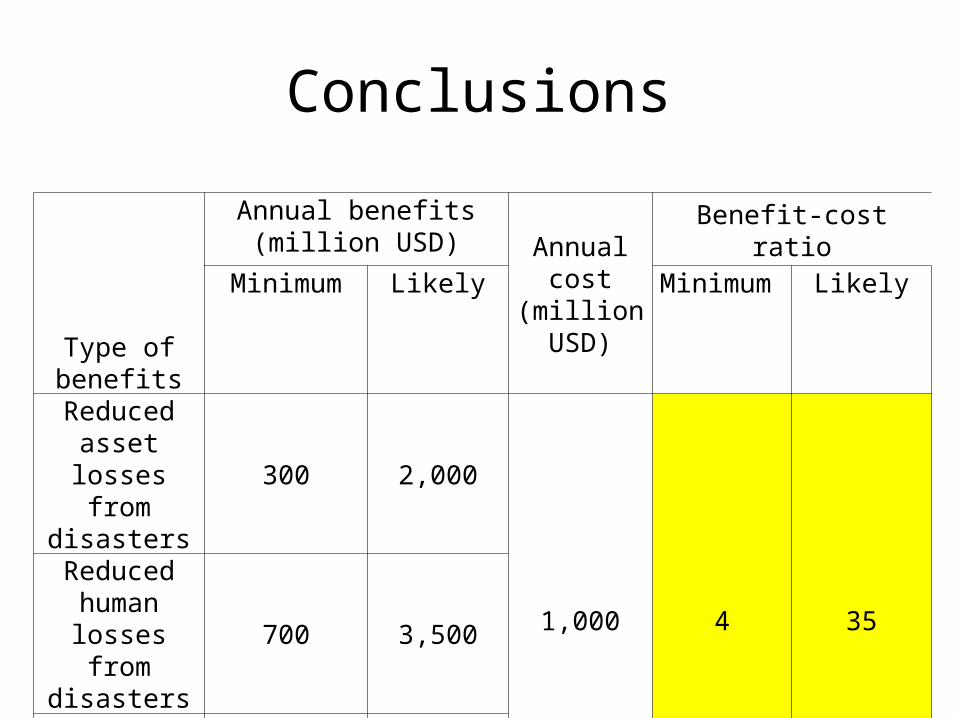
Conclusions
Type of benefits
Annual benefits(million USD) Annual cost
(million USD)
Benefit-cost ratio
Minimum Likely Minimum Likely
Reduced asset losses
from disasters300 2,000
1,000 4 35
Reduced human losses from disasters
700 3,500
Other economic benefits
3,000 30,000
Total 4,000 35,500

Areas for future research

What about marginal benefits?
Cumulative investment
Bene
fits
The problem is the non-convexity of
benefits wrt investments
• To assess whether investments should be increased or decreased, what matters is the marginal benefit (i.e. benefit from one more dollar invested).
Easier when assessing existing capability or instrument(example of the METOP system)
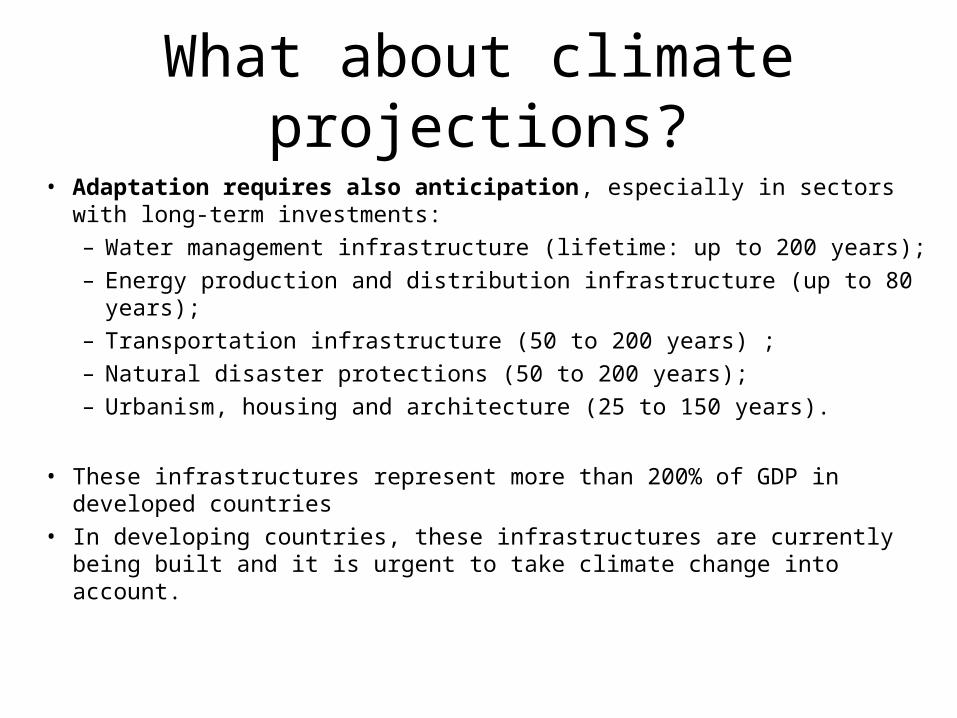
What about climate projections?• Adaptation requires also anticipation, especially in sectors with long-
term investments:– Water management infrastructure (lifetime: up to 200 years);– Energy production and distribution infrastructure (up to 80 years);– Transportation infrastructure (50 to 200 years) ;– Natural disaster protections (50 to 200 years);– Urbanism, housing and architecture (25 to 150 years).
• These infrastructures represent more than 200% of GDP in developed countries
• In developing countries, these infrastructures are currently being built and it is urgent to take climate change into account.

IPCC, 2007

What about national security?
• In the absence of national security considerations, much more cooperation and coordination would be possible.
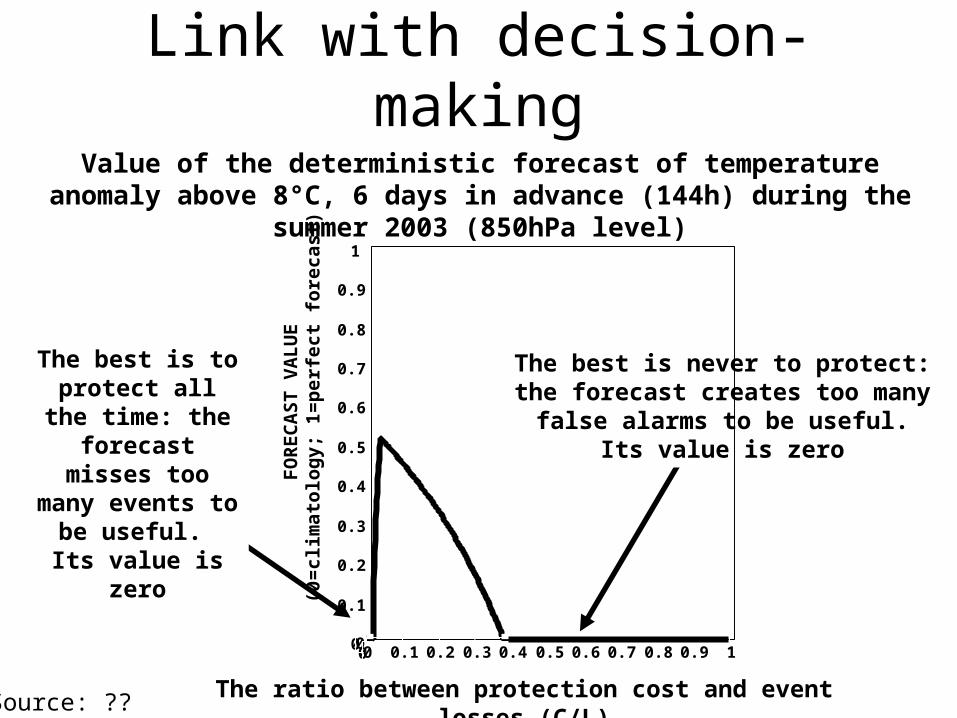
The best is never to protect: the forecast creates too many false
alarms to be useful. Its value is zero
The best is to protect all the
time: the forecast misses too many
events to be useful.
Its value is zero
The ratio between protection cost and event losses (C/L)
Value of the deterministic forecast of temperature anomaly above 8°C, 6 days in advance (144h) during the summer 2003 (850hPa level)
0
0.1
0.2
0.3
0.4
0.5
0.6
0.7
0.8
0.9
1
0
FO
RECA
ST V
ALU
E(0
=clim
atol
ogy;
1=p
erfe
ct fo
reca
st)
00 0.1 0.2 0.3 0.4 0.5 0.6 0.7 0.8 0.9 1
Link with decision-making
Source: ??

Link with decision-making
Source: Olivier Mestre (Meteo-France)
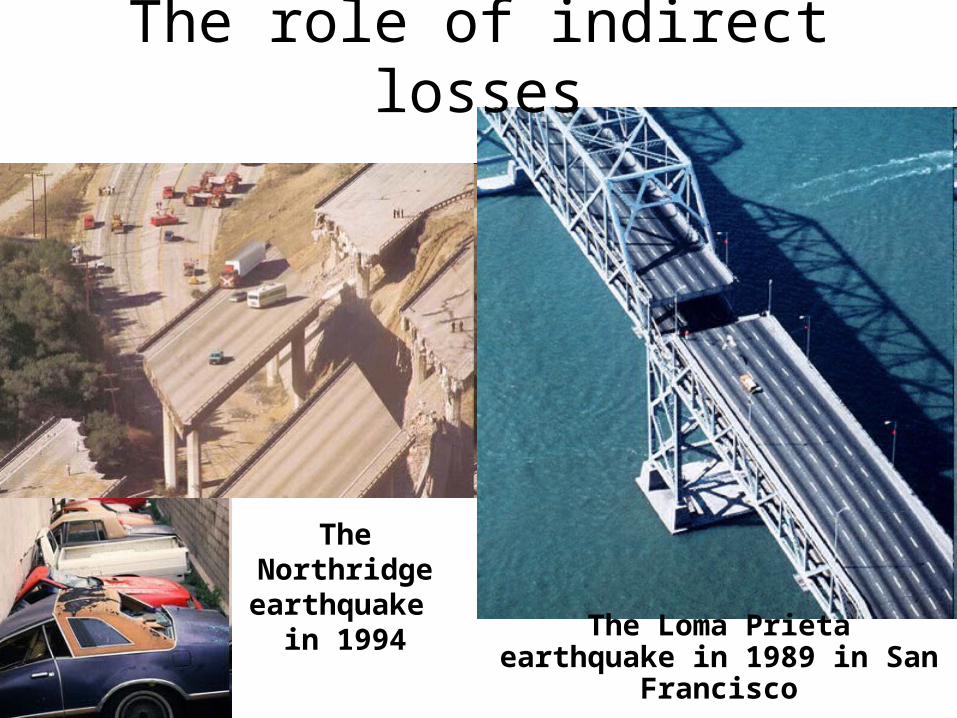
The Northridge earthquake
in 1994The Loma Prieta earthquake in 1989
in San Francisco
The role of indirect losses
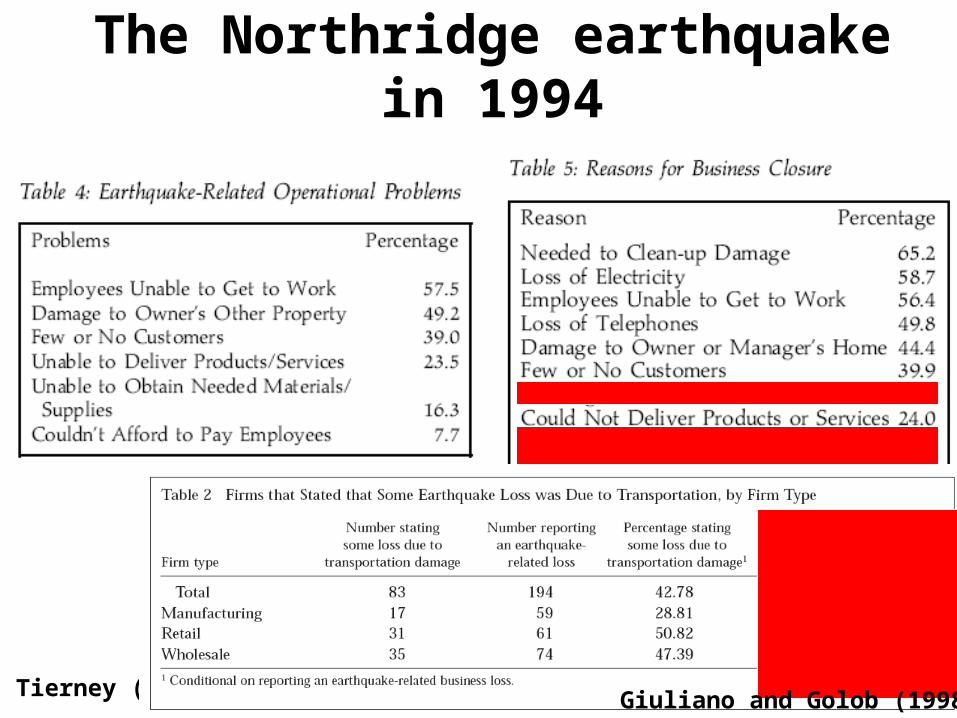
The Northridge earthquake in 1994
Tierney (1997) Giuliano and Golob (1998)
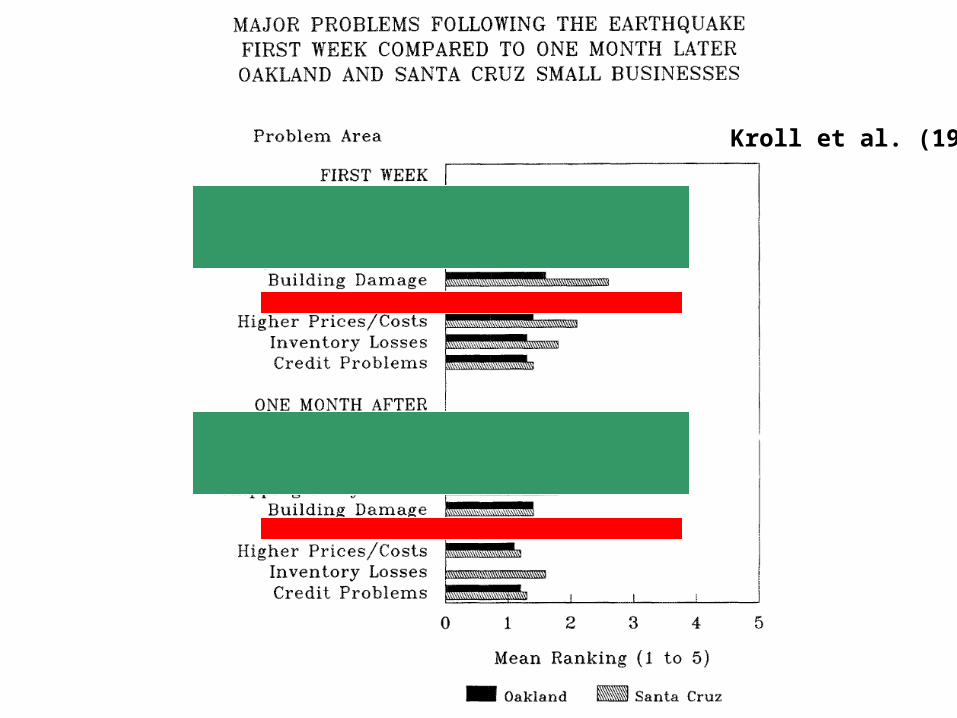
Kroll et al. (1991)
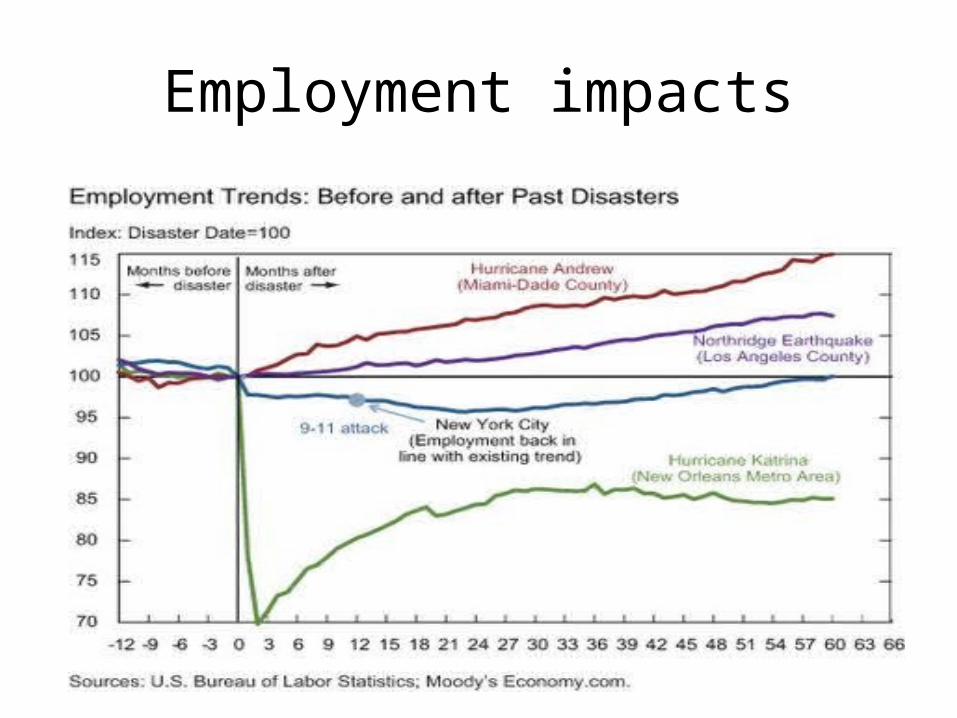
Employment impacts
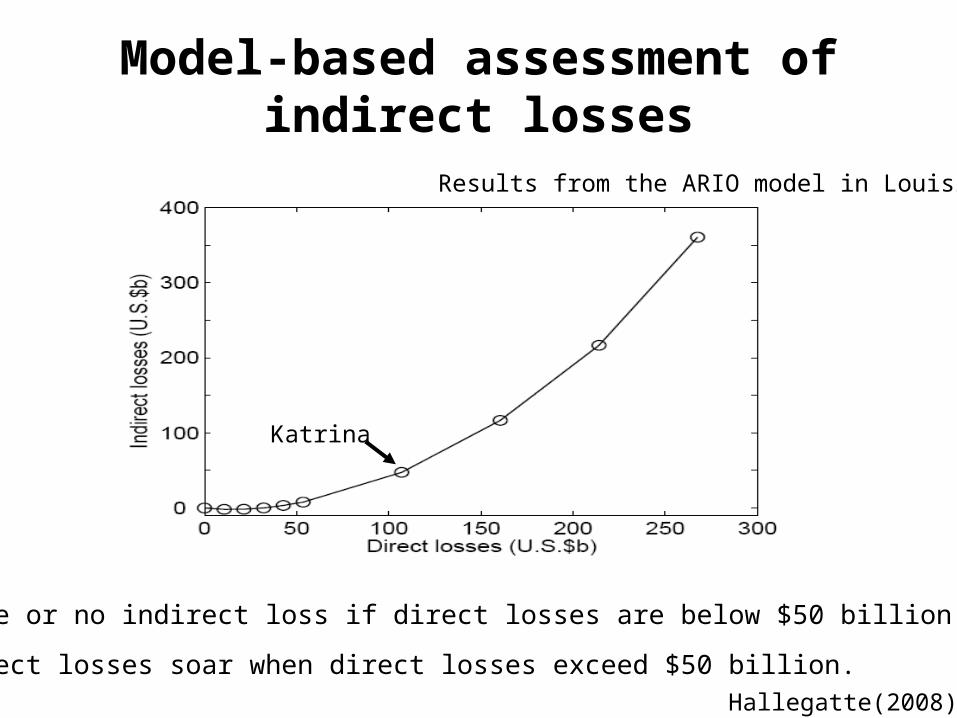
Model-based assessment of indirect losses
Katrina
Results from the ARIO model in Louisiana
• Little or no indirect loss if direct losses are below $50 billion.
• Indirect losses soar when direct losses exceed $50 billion.Hallegatte(2008)

Conclusions• We can claim that hydromet services benefits exceed
costs in rich countries
• We can claim that better hydromet services in developing countries would be cost-efficient (if we can do it)
• We cannot conclude on the “optimal” budget in rich countries and on the cost-effectiveness of selected investments (except in some cases, see the Metop paper)
• We have a long way to go to assess the cost-benefit ratio