Embed Size (px)
Citation preview
ASSESSING THE AMERICAN SIGN LANGUAGE VERSION OF THE COMPUTERIZED REVISED TOKEN TEST
by
Emily Bard Goldberg
B.A. Candidate in Communication Sciences and Disorders
Submitted to the Graduate Faculty of
University of Pittsburgh in partial fulfillment
of the requirements for the degree of
Bachelor of Philosophy
University of Pittsburgh
2015
UNIVERSITY OF PITTSBURGH
HEALTH AND REHABILITATION SCIENCES
This thesis was presented
by
Emily Goldberg
It was defended on
April 20, 2015
and approved by
Malcolm McNeil, PhD., Communication Sciences and Disorders, University of Pittsburgh
Michael Dickey, PhD., Communication Sciences and Disorders, University of Pittsburgh
Claude MAuk, PhD., Less Commonly Taught Languages Center, University of Pittsburgh
Mikael Kimelman, PhD., Speech Language Pathology, Duquesne University
Thesis Advisor: Sheila Pratt, PhD., Communication Sciences and Disorders
ii

Copyright © by Emily Goldberg
2015
iii
Background: Hearing loss and deafness in childhood is a risk factor for delayed communication
(e.g., speech, language, and literacy) development, and the impact is dependent on a number
of factors (e.g.: age of onset, severity, etc.). In the United States a subset of the population
with severe-profound hearing loss uses American Sign Language (ASL) as their primary
mode of communication.
In this study, an ASL version of the Computerized Revised Token Test (CRTT) was
developed and assessed for test-retest reliability. ASL performance was compared to English
reading performance.
Procedures: This study included 20 non-native non-proficient (Group A), 20 non-native
proficient (Group B), and 10 Deaf native (Group C) ASL users. They completed both
the ASL (CRTT-ASL) and English Reading Word-Fade (CRTT-R-wf) versions of the CRTT.
Results: Pearson Product correlation coefficients were derived for Mean CRTT and Mean
Efficiency Scores of two versions between sessions. For mean CRTT Scores for the CRTT-ASL
Group C demonstrated correlations of .70 or above (r=.769). For the Mean Efficiency Scores,
Groups B and C produced acceptable correlations (r=.78 and .75 respectively). Group
C produced correlations between CRTT-ASL and CRTT-R-wf.
All three groups demonstrated improvements on both tests between sessions (specifically
Group A on CRTT-ASL). Performance on the CRTT-R-wf tended to be higher than on the
ASSESSING THE AMERICAN SIGN LANGUAGE VERSION OF THE
COMPUTERIZED REVISED TOKEN TEST
Emily Goldberg
University of Pittsburgh, 2015
iv
CRTT-ASL, especially for Groups A and B. These effects were confirmed with a Mixed Model
ANOVA along with a significant Group effect. Secondary analyses indicated that Group C
differed on the CRTT-R-wf, but the groups were not different from each other on the CRTT-ASL
for either session.
Conclusions: Group C produced acceptable levels of test-retest reliability on CRTT-ASL, and
Group B met criterion with Mean Efficiency Scores. All three groups produced acceptable
correlations on CRTT-R-wf. Correlations between performance on CRTT-ASL and CRTT-R-wf
were high for Group C. All groups increased in performance between sessions on both test
versions, indicating a learning effect. Magnitude of change was pronounced for Group A on
CRTT-ASL. The effect for Group was likely due to differences between Groups. The pattern of
results may be attributed to the diverse language-learning experiences of Group C.
v
TABLE OF CONTENTS
PREFACE…………………………………………………………………………………..……xi
1.0 INTRODUCTION……………………………………………………………..……….……1
1.0.1 ASL VERSUS ENGLISH ……………………………………….............2
1.1 CRTT BACKGROUND………………………………………..…………………....4
1.1.1 CRTT SCORING……………………………………………………..…..6
1.1.2 ENGLISH READING VERSIONS OF THE CRTT…………………...7
1.1.3 TRANSLATING THE CRTT…………………………………………....8
1.2 AMERICAN SIGN LANGUAGE BASICS…………………………………….…..9
1.2.1 DEAF BILINGUALISM…………………………………………..…….11
1.3 EXPERIMENTAL QUESTIONS AND HYPOTHESES…...……………………14
2.0 METHODOLOGY………………………………………………………..………………..15
2.1 PARTICIPANTS………………………………………………………..……….…15
2.1.1 INCLUSION AND PRELIMENARY PROCEDURES…...…………16
2.2 STIMULI…………………………………………………………………...……….18
2.2.1 INCLUSION OF FIVE PARAMETERS INTO THE STIMULI…....21
2.3 PROCEDURES………………………………………………………………….….22
3.0 RESULTS………………………………………………………………………...…...…….24
vi
3.1 TEST-RETEST RELIABILITY PER GROUP……………………...…………...24
3.1.1 DESCRIPTIVE MEASURES PER GROUP……………...………….24
3.1.2 CORRELATIONS………………………………………..…………….28
3.2 TEST OF DIFFERENCE…………………………………………….…………….44
3.2.1 MEAN CRTT SCORES……………………………..…………………44
3.2.2 MEAN EFFICIENCY SCORES…………………….………………...45
3.3 POST-ASSESSMENT QUESTIONNAIRE……………..……………..…………45
4.0 DISCUSSION. ……………………………………………………………...………………46
4.1 OBSERVED GROUP DIFFERENCES…..………………….…………………...47
4.2 DEAF LANGUAGE EXPERIENCES…….………………………………………48
4.3 LIMITATIONS……………………………..………………………………………50
4.4 FUTURE CONSIDERATIONS………………..…………………………………..50
5.0 SUMMARY AND CONCLUSION………………………………………..………………51
APPENDIX……………………………………………………………….………………..……52
BIBLIOGRAPHY………………………………………………………………………….…...60
vii
LIST OF TABLES
Table 1. CRTT scoring categories………………………………………………………………...7
Table 2. Age and sex of participants……………………………………………………………..16
Table 3. Background questionnaire items………………………………………………..………17
Table 4. Median self-rating of proficiency of English and ASL on the LEAP-Q……………….17
Table 5. Mean score and standard deviation scores of the CELF-5………………………..……18
Table 6. Mean CRTT Score descriptive data for the CRTT-ASL…………………………….....25
Table 7. Mean Efficiency Score descriptive data for the CRTT-ASL…………………..……….25
Table 8. Mean CRTT Score descriptive data for the CRTT-wf…………………………….…...26
Table 9. Mean Efficiency Score descriptive data of the CRTT-R-WF…...………………….….26
Table 10. Mean CRTT Score correlations for All Groups combined…………………....………29
Table 11. Mean Efficiency Score correlations for All Groups combined……………….………30
Table 12. Group A Mean CRTT Score correlations……………………………………………..31
Table 13. Group A Mean Efficiency Score correlations…………………….…………………..32
Table 14. Group B Mean CRTT Score correlations………………………………..……………33
Table 15. Group B Mean Efficiency Score correlations…………………………………..……..34
Table 16. Group C Mean CRTT Score correlations……………………………………..………35
Table 17. Group C Mean Efficiency Score correlations…………………………………….…...36
viii
Table 18. Mean CRTT Score comparisons with correlations of .70 or higher………..…………37
Table 19. Mean Efficiency Score comparisons with correlations of .70 or higher………..…….38
Table 20. Medians and ranges of rankings produced by all groups on the post-assessment questionnaire……………………………………………………………………………………..45
Appendix, Table 1. Individual responses to the background questionnaire……………….…….52
Appendix, Table 2. Individual self-rating scores on level of proficiency of specific language capabilities……………………………………………………………………………………….54
Appendix, Table 3. Individual scores on the reading subtests of the CELF-5…………………..56
Appendix, Table 4. Individual subject post-assessment questionnaire results…………………. 58
ix
LIST OF FIGURES
Figure 1. The computerized screen that includes all 20 tokens of the CRTT……………………..5
Figure 2. Example of the position of the signal stimuli………………………………………….20
Figure 3. Mean CRTT Score and Mean Efficiency Score performance across two sessions on CRTT-ASL and CRTT-R-WF…………………………………………………………………...27 Figure 4. Scatter plots for Mean CRTT Scores on the CRTT-ASL between Session 1 and Session 2 on the CRTT-ASL per group…………………………………………………………………..40 Figure 5. Scatter plots for Mean Efficiency Scores on the CRTT-ASL between Sessions 1 and Session 2 on the CRTT-ASL per group………………………………………………………….41 Figure 6. Scatter plots for Mean CRTT Scores on the CRTT-R-WF between Session 1 and Session 2 on the CRTT-R-WF per group………………………………………………………..42 Figure 7. Scatter plots for Mean Efficiency Scores on the CRTT-R-WF between Session 1 and Session 2 per group………………………………………………………………………………43
x
PREFACE
This thesis contains work done from January 2014 to April 2015. Many individuals volunteered
their time to assist the success of this research project and deserve recognition. The supervisor of
this project was Dr. Sheila Pratt, who provided endless support and guidance throughout the
project.
The University of Pittsburgh Honors College as well as Dr. Malcolm McNeil provided
funding for this research study. Kenneth DeHaan accepted the position of signer in the CRTT-
ASL and devoted several hours to be filmed for the purpose of the research study. Neil
Szuminsky programmed the CRTT-ASL, thus the assessment could not have been created
without his significant contributions. Angela Ryu, on behalf of University of Pittsburgh
Television organization, assisted in all video editing. Douglas Roberts conducted filming for the
American Sign Language CRTT. Many thanks for support from advisors, professors, and peers.
xi
1.0 INTRODUCTION
This document provides an overview of the considerations, procedures, methods, and
conclusions of a research study conducted to (1) determine the test-retest reliability of the
American Sign Language (ASL) version of the Computerized-Revised Token Test (CRTT) and
(2) provide data on the differences between performance of Deaf native ASL users, non-native
proficient ASL users, and non-native non-proficient ASL users on the English Reading Fade
CRTT (CRTT-R-wf) and American Sign Language CRTT (CRTT-ASL). The CRTT was adapted
from the Revised Token Test (RTT), which was originally developed to examine the auditory
language processing skills of persons with aphasia (McNeil & Prescott, 1978). Persons with
aphasia typically have a left hemispheric lesion, often as a consequence of stroke, and have
difficulty with language processing and production. Although originally developed for persons
with aphasia, the RTT and CRTT have since been used to assess the language-processing skills
of various populations – e.g., children with language impairments and adults with learning
disabilities. The CRTT includes a listening version consistent with the RTT, as well as reading
and Stroop versions (McNeil & Prescott, 1978; McNeil et al., 2012; McNeil et al., 2015). The
CRTT has been translated into many different languages including Spanish, Korean, Turkish and
Mandarin. The inclusion of a reading version allows for comparisons across written and auditory
modalities, whereas the Stroop version can measure online executive function (McNeil &
Prescott, 1978; McNeil et al., 2015; McNeil et al., 2012).
The response tasks for the CRTT are simple, and include touching or moving one of
multiple geometric shapes (tokens) on a computer screen. The tokens vary in color, shape and
size, and are manipulated in response to commands that range in difficulty. An example of a
simple command is “Touch the big red square”, whereas a more lengthy and complex command
is “Put the big blue circle to the left of the little green square.” The colors, shapes, sizes and
overall vocabulary of the test are limited in difficulty and number, which allows for direct
1
translations to the vast number of spoken languages. The simple language of the test also allows
for use with children and persons with reduced language abilities. Though the commands are
simple, the test is highly sensitive to deficits in language processing, attention, and verbal
working memory skills due to the redundancy of the stimuli and multidimensional scoring
system used to evaluate each response.
1.0.1 ASL Versus English
When considering English and ASL, differences in modality and linguistic structure need to be
considered. For example, English phonology is based on a sound system produced by the
respiratory system and the upper-airway articulators (e.g., velum, tongue, vocal cords, and
lips). Perception of the sounds relies predominately on audition with augmentation from
vision. In contrast, the phonology of ASL uses arms and hands in a sign space that ranges from
the torso to the top of the head, and perception is based on the visual system (Bellugi &
Fischer, 1972; Emmorey, Mehta, & Grabowski, 2007). Although oral English is produced in
a largely linear, serial fashion, the content of ASL is more simultaneous and parallel (Klima
& Bellugi, 1979). Despite these differences, however, comparisons of English and ASL
suggest that both languages show left-hemisphere lateralization suggesting similar brain
mechanisms (Campbell, MacSweeney & Waters, 2007; Petitto, Zatorre, Gauana, et al., 2000).
Mayberry, Chen, Witcher, and Klein (2011) used functional magnetic resonance imaging
(fMRI) with deaf adults to investigate whether age of acquisition was represented in the
linguistic organization in the adult brain. The study found that late acquisition impacted
language-processing activation. The fMRI scans showed that participants born with severe-
profound hearing loss and exposed to ASL early in life demonstrated neural activation in the
classic language areas of the brain, but those participants who began acquiring ASL later in life
did not show the same activation patterns. Specifically, there were negative linear effects
between length of language deprivation and neural processing in the anterior brain areas that are
responsible for high-level linguistic processing, and a positive linear relationship in the posterior
brain areas that are responsible for low-level linguistic processing (Mayberry et al., 2011).
2
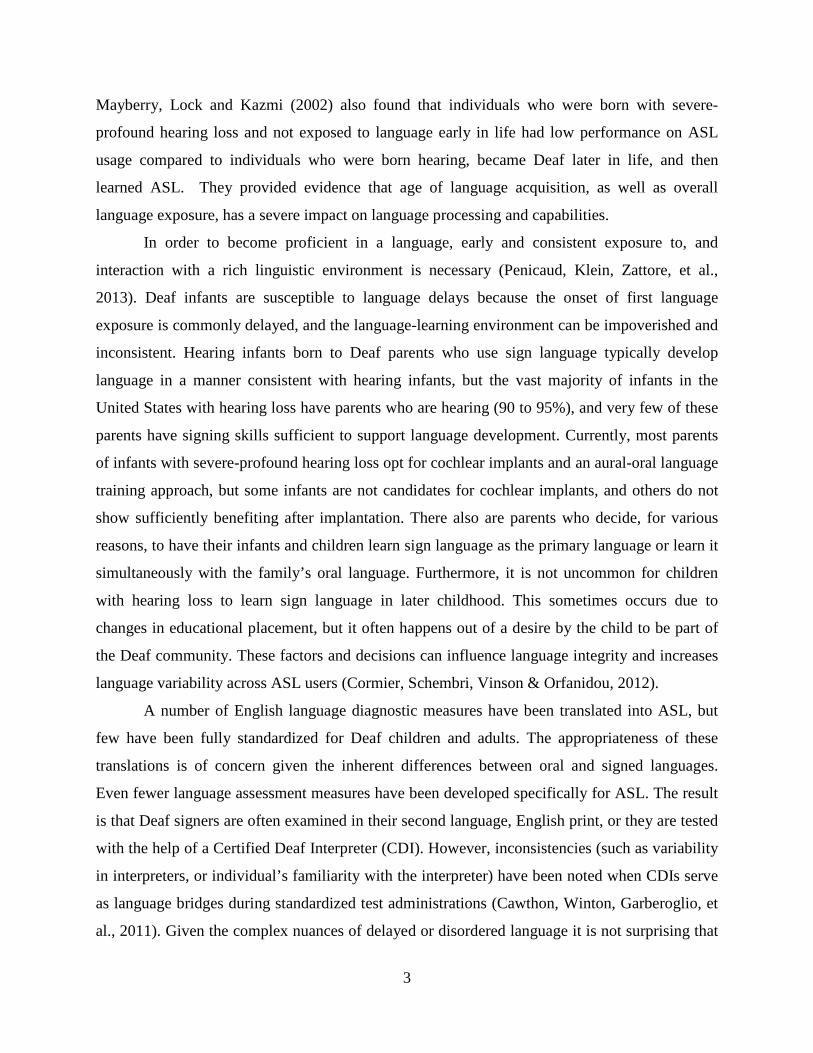
Mayberry, Lock and Kazmi (2002) also found that individuals who were born with severe-
profound hearing loss and not exposed to language early in life had low performance on ASL
usage compared to individuals who were born hearing, became Deaf later in life, and then
learned ASL. They provided evidence that age of language acquisition, as well as overall
language exposure, has a severe impact on language processing and capabilities.
In order to become proficient in a language, early and consistent exposure to, and
interaction with a rich linguistic environment is necessary (Penicaud, Klein, Zattore, et al.,
2013). Deaf infants are susceptible to language delays because the onset of first language
exposure is commonly delayed, and the language-learning environment can be impoverished and
inconsistent. Hearing infants born to Deaf parents who use sign language typically develop
language in a manner consistent with hearing infants, but the vast majority of infants in the
United States with hearing loss have parents who are hearing (90 to 95%), and very few of these
parents have signing skills sufficient to support language development. Currently, most parents
of infants with severe-profound hearing loss opt for cochlear implants and an aural-oral language
training approach, but some infants are not candidates for cochlear implants, and others do not
show sufficiently benefiting after implantation. There also are parents who decide, for various
reasons, to have their infants and children learn sign language as the primary language or learn it
simultaneously with the family’s oral language. Furthermore, it is not uncommon for children
with hearing loss to learn sign language in later childhood. This sometimes occurs due to
changes in educational placement, but it often happens out of a desire by the child to be part of
the Deaf community. These factors and decisions can influence language integrity and increases
language variability across ASL users (Cormier, Schembri, Vinson & Orfanidou, 2012).
A number of English language diagnostic measures have been translated into ASL, but
few have been fully standardized for Deaf children and adults. The appropriateness of these
translations is of concern given the inherent differences between oral and signed languages.
Even fewer language assessment measures have been developed specifically for ASL. The result
is that Deaf signers are often examined in their second language, English print, or they are tested
with the help of a Certified Deaf Interpreter (CDI). However, inconsistencies (such as variability
in interpreters, or individual’s familiarity with the interpreter) have been noted when CDIs serve
as language bridges during standardized test administrations (Cawthon, Winton, Garberoglio, et
al., 2011). Given the complex nuances of delayed or disordered language it is not surprising that
3
the use of CDIs is an unsatisfying solution. It also should be noted that ASL assessment
measures have not been developed for patients with neurogenic communication disorders such as
aphasia. Nor have measures been developed that can directly compare ASL with English
language processing.
In order to adequately explain the background for this study, the introduction is broken
into sections. Chapter 1.1 will provide an overview of the Revised Token Test (RTT), its
evolution into the Computerized-Revised Token Test (CRTT), and the clinical relevance of the
test. Chapter 1.2 will delve into details about ASL that are relevant to the study. Chapter 1.3 will
provide the study’s research questions and hypotheses.
1.1 CRTT BACKGROUND
The Revised Token Test (RTT), the precursor to the CRTT, was developed to assess auditory
processing inefficiencies and disorders that co-occur with brain injury, brain damage, aphasia,
and language disabilities. The RTT materials include 20 tokens that the patient manipulates in
response to commands provided by the examiner. The commands were constructed from a
restricted set of actions, prepositions, shapes, colors and sizes: two actions (touch, put), ten
prepositions (front, before, under, above, below, behind, by, next, beside, on), two shapes (circle
and square) and five colors (black, white, red, blue, and green) (McNeil & Prescott, 1978). The
RTT has ten subtests, and each subtest is increasingly more challenging in regards to attention
and verbal working memory. As a patient progresses through the subtests, concepts such as
touching more than one shape, dragging a shape to the left or right of another shape, and moving
a shape “before,” “on,” “behind,” (along with other prepositional locaters) are incorporated into
the assessment. The RTT has established construct, concurrent and content validity as well as
high test-retest, and inter- and intra-judge reliabilities (McNeil & Prescott 1978; McNeil et al.,
2015). Because the test was originally designed to assess persons suspected of auditory
processing disorders due to brain injury or language disability, it has a heavy emphasis on the
4
relationship between attention, memory and language processing (Sung et al., 2009; Sung,
McNeil, & Pratt, 2010; McNeil et al., 2015).
Recently the RTT was adapted to a digital format (CRTT) and expanded to include
reading and Stroop versions. The auditory version of the CRTT largely mirrors the original RTT.
The commands are the same as in the RTT but they are presented at 75 dB SPL via loudspeaker
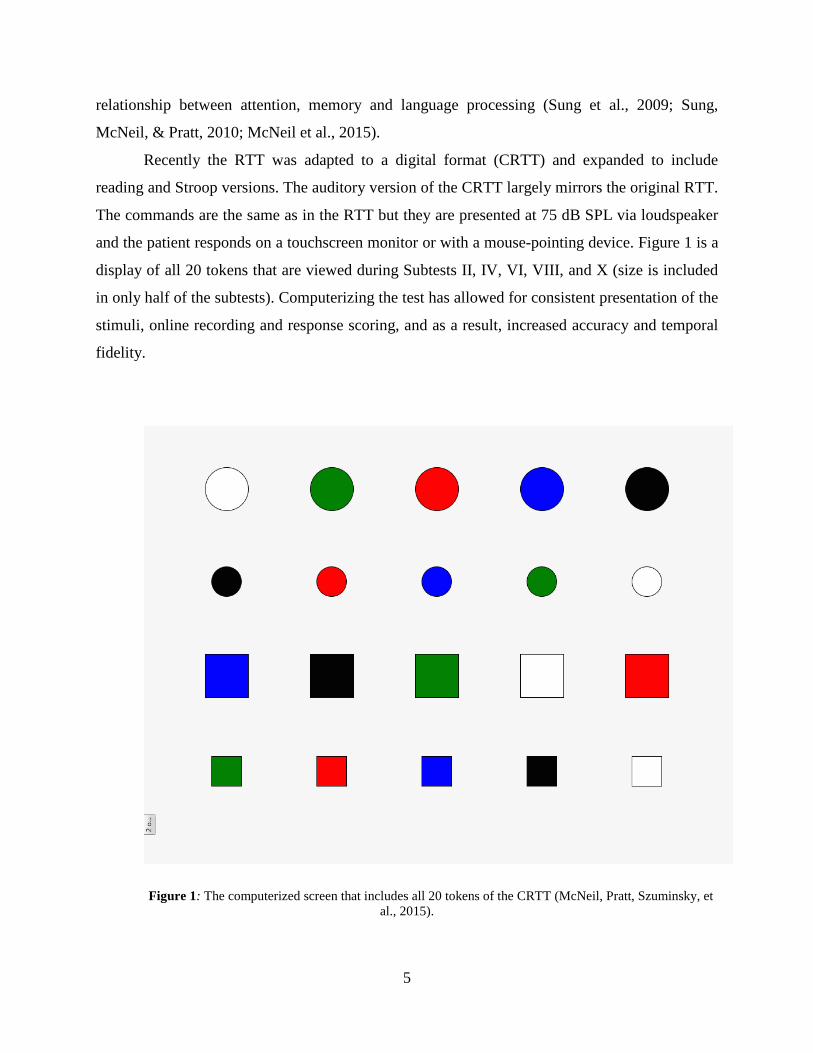
and the patient responds on a touchscreen monitor or with a mouse-pointing device. Figure 1 is a
display of all 20 tokens that are viewed during Subtests II, IV, VI, VIII, and X (size is included
in only half of the subtests). Computerizing the test has allowed for consistent presentation of the
stimuli, online recording and response scoring, and as a result, increased accuracy and temporal
fidelity.
Figure 1: The computerized screen that includes all 20 tokens of the CRTT (McNeil, Pratt, Szuminsky, et al., 2015).
5
1.1.1 CRTT Scoring
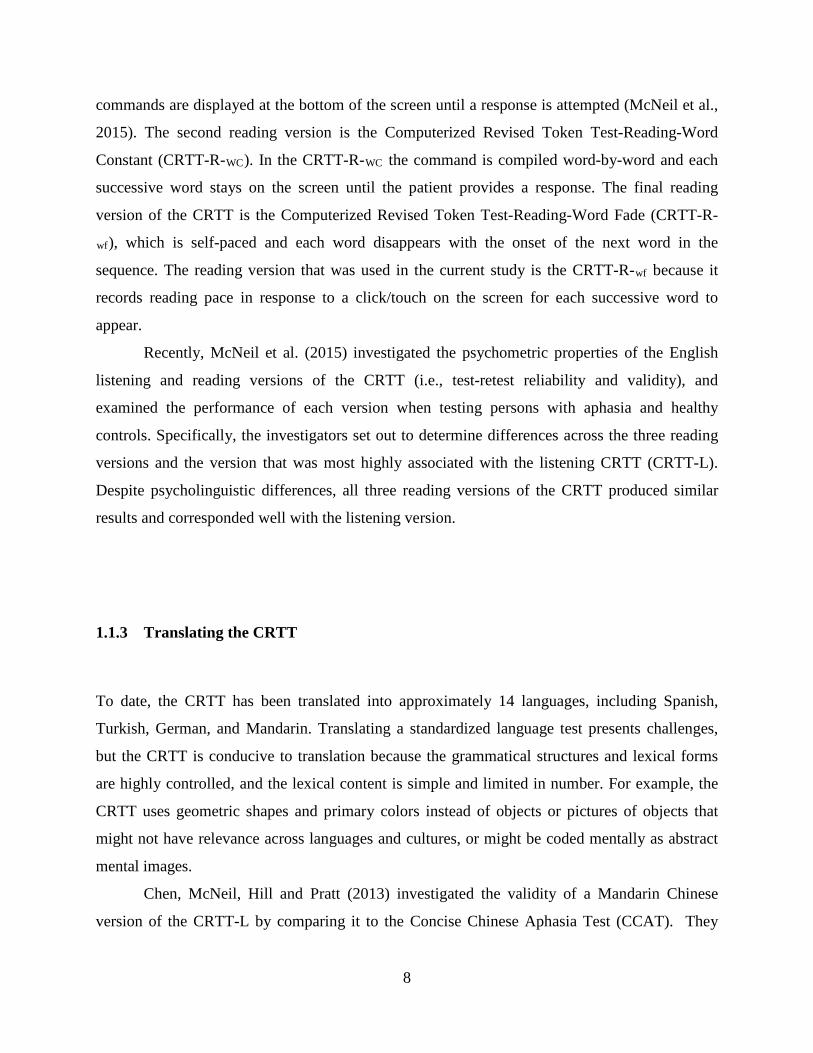
The CRTT has retained most of the RTT multidimensional scoring system (Table 1). A score of
15 translates to “perfect response” (Eberwein et al., 2007). Also, the scoring scale demonstrates
that an incorrect answer does not result in a score of 0, but instead warrants a score of 7. A score
of 1 (the lowest possible score) is given when a patient fails to provide a response.
The scoring of the CRTT depends on the linguistic elements of the command. Each
subtest contains 10 homogenous commands (McNeil & Prescott, 1978). The commands within
one subtest are uniform in sentence length and linguistic elements, however differing subtests
vary in sentence length (5 different lengths), syntactic complexity, and level of vocabulary
(Eberwein et al., 2007). When scoring a patient’s performance, the linguistic elements in each
sentence are averaged. For example, Subtest I contains three linguistic elements (“Touch [verb]
the blue [adjective] circle [noun]”). The command “Touch the blue circle” will then be assigned
three different scores based on the responsiveness, accuracy and completeness of the patient’s
response (Table 1). The three scores are then averaged, and when all of the sentences within each
subtest is completed the sentence scores are averaged. Finally, the 10 subtest scores are
averaged and in this document are referred to as the Mean CRTT Score.
6
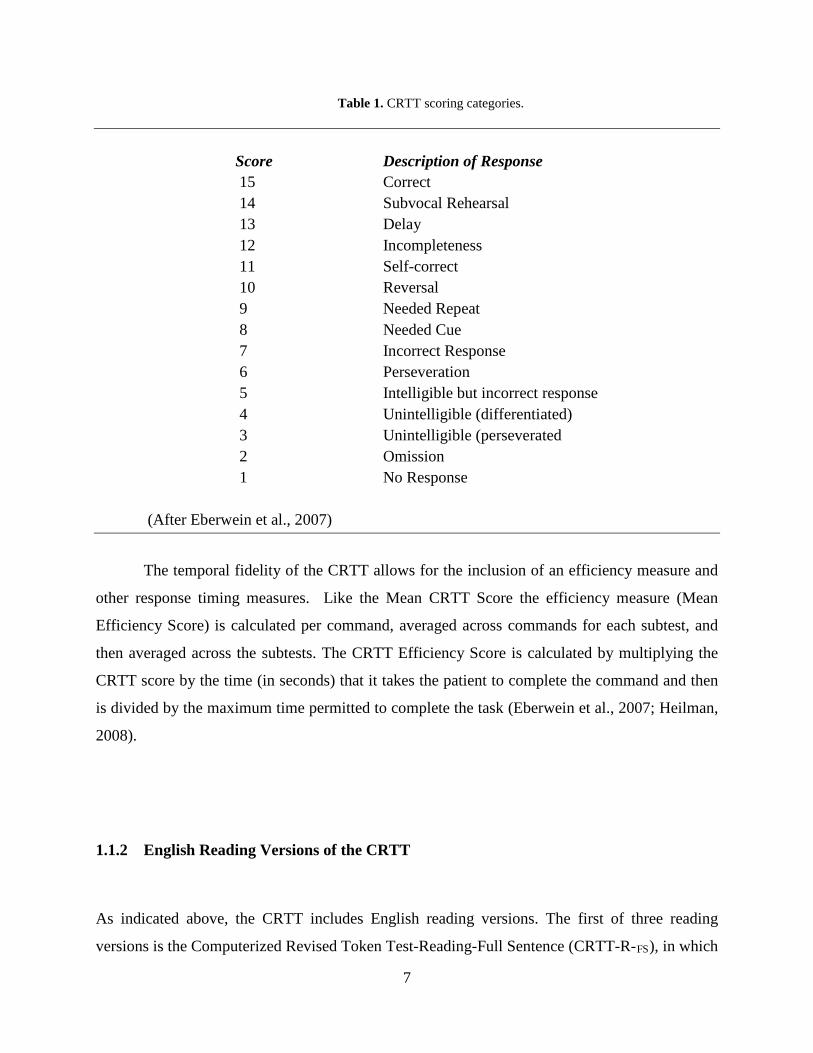
Table 1. CRTT scoring categories.
Score Description of Response 15 Correct 14 Subvocal Rehearsal 13 Delay 12 Incompleteness 11 Self-correct 10 Reversal 9 Needed Repeat 8 Needed Cue 7 Incorrect Response 6 Perseveration 5 Intelligible but incorrect response 4 Unintelligible (differentiated) 3 Unintelligible (perseverated 2 Omission 1 No Response
(After Eberwein et al., 2007)
The temporal fidelity of the CRTT allows for the inclusion of an efficiency measure and
other response timing measures. Like the Mean CRTT Score the efficiency measure (Mean
Efficiency Score) is calculated per command, averaged across commands for each subtest, and
then averaged across the subtests. The CRTT Efficiency Score is calculated by multiplying the
CRTT score by the time (in seconds) that it takes the patient to complete the command and then
is divided by the maximum time permitted to complete the task (Eberwein et al., 2007; Heilman,
2008).
1.1.2 English Reading Versions of the CRTT
As indicated above, the CRTT includes English reading versions. The first of three reading
versions is the Computerized Revised Token Test-Reading-Full Sentence (CRTT-R-FS), in which
7
commands are displayed at the bottom of the screen until a response is attempted (McNeil et al.,
2015). The second reading version is the Computerized Revised Token Test-Reading-Word
Constant (CRTT-R-WC). In the CRTT-R-WC the command is compiled word-by-word and each
successive word stays on the screen until the patient provides a response. The final reading
version of the CRTT is the Computerized Revised Token Test-Reading-Word Fade (CRTT-R-
wf), which is self-paced and each word disappears with the onset of the next word in the
sequence. The reading version that was used in the current study is the CRTT-R-wf because it
records reading pace in response to a click/touch on the screen for each successive word to
appear.
Recently, McNeil et al. (2015) investigated the psychometric properties of the English
listening and reading versions of the CRTT (i.e., test-retest reliability and validity), and
examined the performance of each version when testing persons with aphasia and healthy
controls. Specifically, the investigators set out to determine differences across the three reading
versions and the version that was most highly associated with the listening CRTT (CRTT-L).
Despite psycholinguistic differences, all three reading versions of the CRTT produced similar
results and corresponded well with the listening version.
1.1.3 Translating the CRTT
To date, the CRTT has been translated into approximately 14 languages, including Spanish,
Turkish, German, and Mandarin. Translating a standardized language test presents challenges,
but the CRTT is conducive to translation because the grammatical structures and lexical forms
are highly controlled, and the lexical content is simple and limited in number. For example, the
CRTT uses geometric shapes and primary colors instead of objects or pictures of objects that
might not have relevance across languages and cultures, or might be coded mentally as abstract
mental images.
Chen, McNeil, Hill and Pratt (2013) investigated the validity of a Mandarin Chinese
version of the CRTT-L by comparing it to the Concise Chinese Aphasia Test (CCAT). They
8
administered both tests to persons with aphasia and healthy controls from Taiwan who spoke
Mandarin Chinese. To construct the stimuli a native Mandarin Chinese speaker was selected to
translate the English CRTT-L to Mandarin Chinese and used a method of back translation to
establish the comparability of the translations1. The study established a significantly positive
correlation between the Mandarin CRTT and the CCAT, and thereby demonstrating concurrent
validity. Although the current study is not aiming to investigate concurrent validity of the CRTT-
ASL, the desire to successfully and accurately translate the CRTT to prove reliability and
validity is closely aligned to the motives of the Chen, McNeil, Hill, and Pratt study (2013).
The Spanish version of the CRTT is being assessed, but a previous study has confirmed
the viability of translating the CRTT into Spanish. Gallardo, Guardia, Villasenor, and McNeil
(2011) examined data collected from children aged 4-12 years with a Mexican-Spanish version
of the RTT. They compared it to a previously translated token test based on DeRenzi and
Faglioni (1978) and found a moderately high correlation (r = .659; p < .01). Gallardo et al.
concluded that the translated version of the RTT was a valid measure of auditory language
processing of Mexican-Spanish-speaking children.
1.2 AMERICAN SIGN LANGUAGE BASICS
Before beginning the discussion on ASL, an important distinction should to be made. When
writing about the deaf population there are two methods of writing the word “deaf”: (1) “Deaf,”
– capital D and (2) “deaf” – lower case d. Each form has a separate meaning. When the word is
presented as “deaf,” it is referring to the inability to hear (i.e., a severe-profound hearing loss).
When the word is presented as “Deaf,” it is referring to the Deaf culture and community, which
prizes ASL as its language of choice. Not all deaf individuals identify culturally or choose to
learn ASL.
1 Similarly, in the current CRTT-ASL study the principle investigator translated the English commands into American Sign Language gloss.
9
American Sign Language (ASL) is a visual-spatial language that is largely based on
object-subject-verb (OSV) grammatical order. It has origins in French Sign Language as a
consequence of Thomas Gallaudet traveling to France in the 1800s to observe a teacher of the
Deaf. His goal was to learn how to effectively teach deaf students in the United States
(Rutherford, 1988). Gallaudet brought a Deaf teacher, Laurent Clerc, back to the United States to
teach students French Sign Language, and over time the French signs were adapted and modified
by the indigenous American signers. Today 60% of ASL signs can be traced to French Sign
Language, but the other 40% have been uniquely developed by American Deaf signers
(Rutherford, 1988).
Since the publication of “Sign Language Structure: An Outline of the Visual
Communication Systems of the American Deaf” by William Stokoe (1960), ASL has become
formally recognized as a true language by various states and universities across the United
States. Stokoe, a scholar and professor at Gallaudet University, provided evidence to support the
claim that ASL is a legitimate language with its own grammar, syntax, and linguistic components
(Stokoe, 1960). He characterized ASL using the Stokoe system, which is a notation system that
looks at three parameters: (1) Handshape, (2) Location, and (3) Movement. Two extra
parameters of ASL were added later: (4) Palm Orientation and (5) Non-Manual Signs (Bauer &
Hienz, 2000). These five parameters are considered to be the basic phonological elements of
ASL and can be equated to place, manner, and voice in spoken English (Emory & Korina, 1990).
The five parameters of ASL are the linguistic building blocks of the language, and each
parameter serves a different role in overall communication. For example, facial expressions (an
example of Non-Manual Signals) are vital in conveying information. In spoken English, the use
of eyebrows (up, down, neutral) conveys emotion or stress, but in ASL the position of the
eyebrows can drastically change the meaning of a sentence (Baker & Cokely, 1980). The notion
of eyebrows impacting the meaning of a message has been experimentally proven by a study
done in 2008 by Weast. For example, if someone signs the sentence “YOU EAT” with his/her
eyebrows up, the message would be equivalent to the question “Did you eat?” If “YOU EAT” is
signed with eyebrows down, the signer would be inquiring about where, when, what, and other
“wh” questions. In essence, the use of eyebrows in ASL is equivalent to intonation in spoken
English (Wilbur, 2009).
10
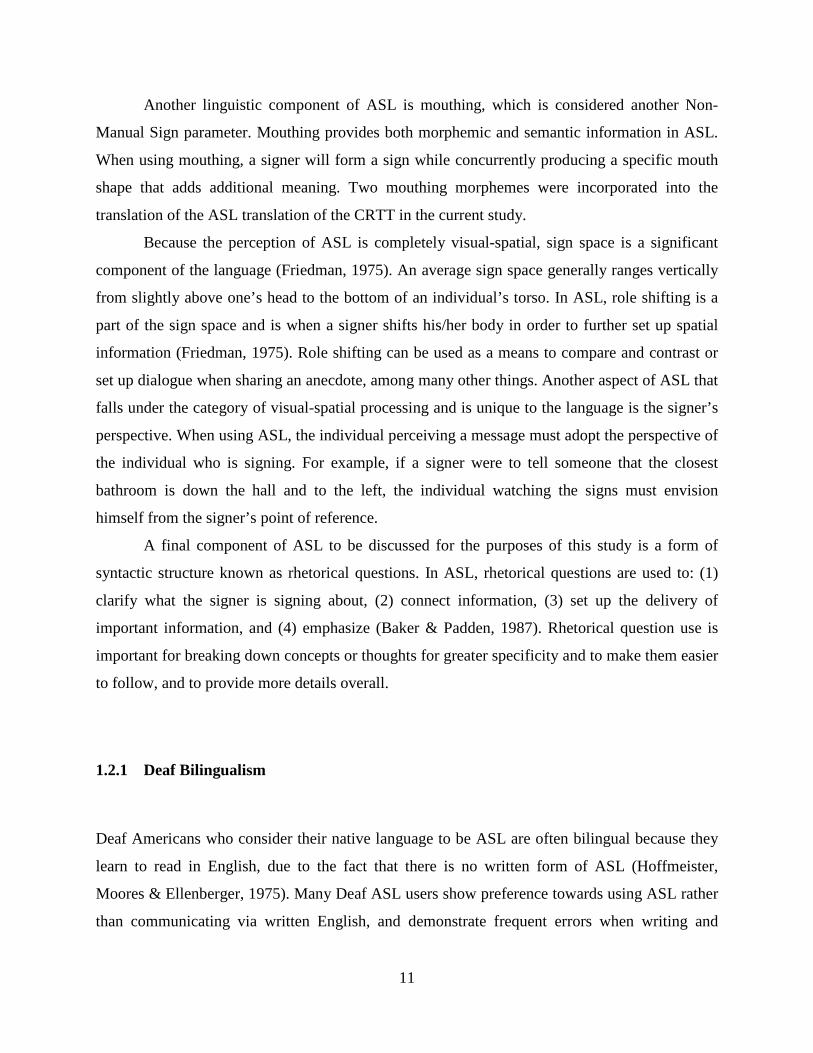
Another linguistic component of ASL is mouthing, which is considered another Non-
Manual Sign parameter. Mouthing provides both morphemic and semantic information in ASL.
When using mouthing, a signer will form a sign while concurrently producing a specific mouth
shape that adds additional meaning. Two mouthing morphemes were incorporated into the
translation of the ASL translation of the CRTT in the current study.
Because the perception of ASL is completely visual-spatial, sign space is a significant
component of the language (Friedman, 1975). An average sign space generally ranges vertically
from slightly above one’s head to the bottom of an individual’s torso. In ASL, role shifting is a
part of the sign space and is when a signer shifts his/her body in order to further set up spatial
information (Friedman, 1975). Role shifting can be used as a means to compare and contrast or
set up dialogue when sharing an anecdote, among many other things. Another aspect of ASL that
falls under the category of visual-spatial processing and is unique to the language is the signer’s
perspective. When using ASL, the individual perceiving a message must adopt the perspective of
the individual who is signing. For example, if a signer were to tell someone that the closest
bathroom is down the hall and to the left, the individual watching the signs must envision
himself from the signer’s point of reference.
A final component of ASL to be discussed for the purposes of this study is a form of
syntactic structure known as rhetorical questions. In ASL, rhetorical questions are used to: (1)
clarify what the signer is signing about, (2) connect information, (3) set up the delivery of
important information, and (4) emphasize (Baker & Padden, 1987). Rhetorical question use is
important for breaking down concepts or thoughts for greater specificity and to make them easier
to follow, and to provide more details overall.
1.2.1 Deaf Bilingualism
Deaf Americans who consider their native language to be ASL are often bilingual because they
learn to read in English, due to the fact that there is no written form of ASL (Hoffmeister,
Moores & Ellenberger, 1975). Many Deaf ASL users show preference towards using ASL rather
than communicating via written English, and demonstrate frequent errors when writing and
11
reading English. Mounty, Pucci, and Harmon (2014) sought to investigate how Deaf
ASL/English bilingual children acquired proficient reading skills and the strategies that were
used. Eleven Deaf bilingual ASL and English-using adults and 1 Child of a Deaf Adult (CODA)
were video recorded. The participants were interviewed about ASL/English acquisition, the
relationship between ASL and English for Deaf individuals, views on the purpose of reading,
identification of characteristics of Deaf skilled readers, and belief about strategies that facilitate
proficient reading.
Mounty, Pucci, and Harmon (2014) found four themes in their interviews. The first was
that, in order for children who use ASL to acquire proficient English reading skills, there must be
exposure to both ASL and English. The participants of the study indicated that the two languages
can support each other, as ASL develops simultaneously with English literacy. The second theme
was that Deaf children should be supplied with a “print-rich culture” in order to connect visual
signs with a written oral language. The third theme was that these children must have the
opportunity to use both ASL and English reading in school and at home, and that they should be
encouraged to think critically about both languages, leading to development of metalinguistic
skills. The final theme was that fingerspelling is a tool that should be used to connect ASL and
English reading. The Mounty et al. study also highlighted the substantive variability of Deaf
individuals in their educational experiences, hearing loss, language history, and social and
language-learning environments.
All of the factors associated with reduced literacy in ASL users have yet to be
determined, but visual cognition is a consideration. Perceptually, ASL users depend heavily on
vision. Belanger, Slattery, Mayberry and Rayner (2012) investigated whether deprivation of
auditory input impacted low-level visual processing in literacy activities (2012). The study
included three groups: skilled reading Deaf signers, non-skilled reading Deaf signers, and skilled
hearing readers. In the past, investigations had looked at whether congenitally Deaf ASL users
have stronger attention to stimuli presented to extrafoveal visual fields and demonstrate overall
increased visual capabilities. Extrofoveal vision refers to vision outside of the fovea where
visual capabilities generally drop to 20/200 (Bavelier, Dye & Hauser, 2006). However, the
results from the Belanger et al. (2012) were mixed. The Deaf ASL users demonstrated increased
attention to the peripheral vision field, and the skilled Deaf readers had enhanced perceptual span
and tended to read ahead.
12
Because of early intervention and educational practices, most Deaf ASL users become
bilingual (as they learn English while learning to read and write). Also, Deaf children (and
adults) of hearing parents are typically delayed in their English literacy abilities with only a
small subset able to read at age level (Hoffmeister & Caldwell-Harris, 2014). Learning written
English as a second language is a significant challenge for Deaf children. Limited exposure to
the sound, lexical and grammatical systems of oral English, and the differences between ASL
and English all contribute to their delays in reading (Hoffmeister & Caldwell-Harris, 2014).
Some deaf children are exposed to English before literacy instruction through their home
environments and training methods (e.g., auditory training, speech and oral language therapy) or
from using manual signing systems that have English origins such as Signing Exact English
(SEE) or Pidgin Signed English (PSE) (Hoffmeister & Caldwell-Harris, 2014). Sign systems that
code English manually, such as SEE and PSE, are problematic because they require language
users to produce a sign for each phoneme or morpheme in a linear fashion, which tends to
overload short term memory and interfere with language processing (Hoffmeister & Caldwell-
Harris, 2014). It also impacts the prosody of the sign and any speech that might accompany it.
Reliance on lip-reading also is unsatisfactory as an independent method of teaching English to
children with severe-profound hearing loss because many English speech sounds are produced
using similar articulations (e.g., /k/ and /g/ are plosives produced in a similar manner towards the
back of the mouth).
Some Deaf children do learn to read English text proficiently, but the mechanisms for
doing so are not well understood. Hoffmeister and Caldwell-Harris (2014) developed a model of
how Deaf children successfully learn written English through formal instruction. The model
includes three stages. The first stage is mapping translation equivalents. For example, the sign
for “dog” is followed by pointing to the written English version of the word. The second stage is
referred to as “from words to sentences: simple translation breakdown,” (pp. 4), which includes
overt instruction of the differences between the ASL and English in order to assist the learner’s
understanding of the rules of English. The final stage is the use of ASL to learn English via print
in a bilingual learning mode, and is characterized by children understanding that a single English
word does not translate directly to one single sign. A child most likely shows the beginnings of
proficiency in both written English and ASL in this stage (Hoffmeister & Caldwell, 2014).
13
Given the linguistic constraints of testing Deaf ASL users in English, the lack of
available ASL assessment tools usable by non-fluent clinicians, and the heterogeneous nature of
the Deaf population, translating the CRTT into ASL should help address an unmet need.
1.3 EXPERIMENTAL QUESTION AND HYPOTHESES
The research questions posed in the current study are listed below:
(1) Is the CRTT-ASL reliable as evidenced by test-retest reliability of .70 and above2?
(2) Will proficient native, proficient non-native, and non-proficient non-native signers
differ in their performance on the CRTT-ASL and on the CRTT-R-wf?
It was hypothesized that the CRTT-ASL would be reliable for all three groups of
participants. It also was hypothesized that the two hearing non-native groups would perform
better on the CRTT-R-wf than the CRTT-ASL, and that the native signers would perform better
on the CRTT-ASL than the CRTT-R-wf. Furthermore, it was hypothesized that the two
proficient groups would perform similarly on the CRTT-ASL but better than the non-proficient
group of participants.
By creating an ASL version of the CRTT, this study aimed to provide a more accurate,
consistent, and reliable measure of working memory and language processing in Deaf signers by
demonstrating test-retest reliability. Also, by investigating ASL and a English reading versions
of the CRTT with Deaf native signers, additional information may come to light about the
differences and similarities in which the two languages are processed by Deaf and hearing
populations.
2 A value of .70 was selected to account for half of the variance, based upon values.
14
2.0 METHODS
2.1 PARTICIPANTS
This study included 50 participants divided into three groups: 20 hearing non-proficient non-
native ASL users (Group A), 20 hearing proficient non-native ASL users (Group B), and 10 Deaf
proficient native ASL users (Group C). Proficiency was based upon years of experience and
information given regarding ASL experience during preliminary procedures that participants
completed prior to the study. The participants ranged in age from 18-45 years. Recruitment of
participants was facilitated through the use of approved flyers, a PowerPoint presentation, and a
video log. Groups A and B were recruited at the University of Pittsburgh, mostly through
classroom presentations. Group C was recruited through presentations at the Pittsburgh
Association of the Deaf, the study flyer, and the video log created by a member of the Deaf
community.
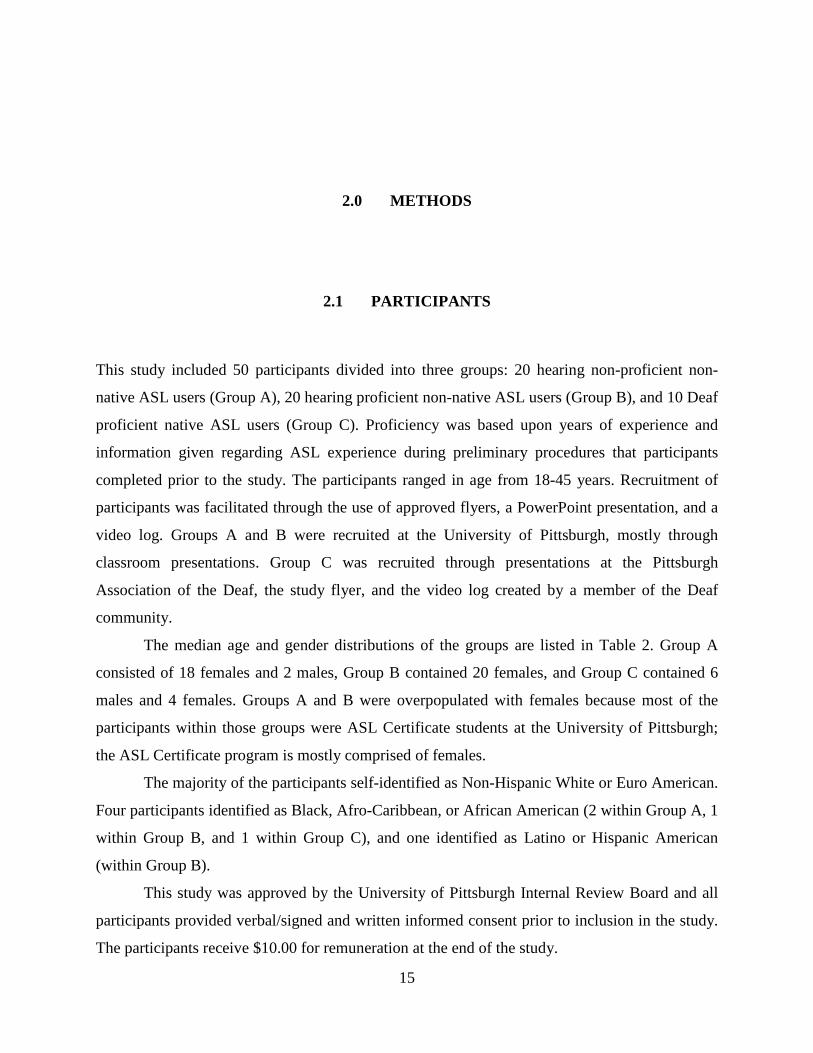
The median age and gender distributions of the groups are listed in Table 2. Group A
consisted of 18 females and 2 males, Group B contained 20 females, and Group C contained 6
males and 4 females. Groups A and B were overpopulated with females because most of the
participants within those groups were ASL Certificate students at the University of Pittsburgh;
the ASL Certificate program is mostly comprised of females.
The majority of the participants self-identified as Non-Hispanic White or Euro American.
Four participants identified as Black, Afro-Caribbean, or African American (2 within Group A, 1
within Group B, and 1 within Group C), and one identified as Latino or Hispanic American
(within Group B).
This study was approved by the University of Pittsburgh Internal Review Board and all
participants provided verbal/signed and written informed consent prior to inclusion in the study.
The participants receive $10.00 for remuneration at the end of the study.
15
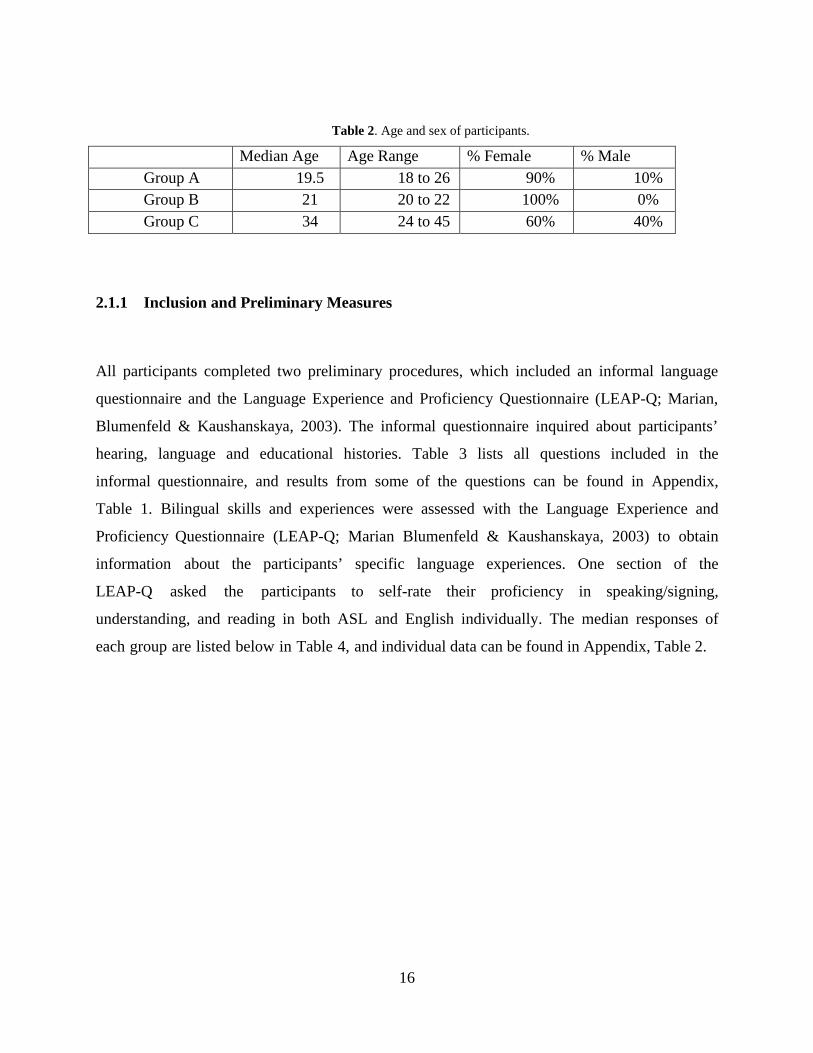
Table 2. Age and sex of participants.
Median Age Age Range % Female % Male Group A 19.5 18 to 26 90% 10% Group B 21 20 to 22 100% 0% Group C 34 24 to 45 60% 40%
2.1.1 Inclusion and Preliminary Measures
All participants completed two preliminary procedures, which included an informal language
questionnaire and the Language Experience and Proficiency Questionnaire (LEAP-Q; Marian,
Blumenfeld & Kaushanskaya, 2003). The informal questionnaire inquired about participants’
hearing, language and educational histories. Table 3 lists all questions included in the
informal questionnaire, and results from some of the questions can be found in Appendix,
Table 1. Bilingual skills and experiences were assessed with the Language Experience and
Proficiency Questionnaire (LEAP-Q; Marian Blumenfeld & Kaushanskaya, 2003) to obtain
information about the participants’ specific language experiences. One section of the
LEAP-Q asked the participants to self-rate their proficiency in speaking/signing,
understanding, and reading in both ASL and English individually. The median responses of
each group are listed below in Table 4, and individual data can be found in Appendix, Table 2.
16
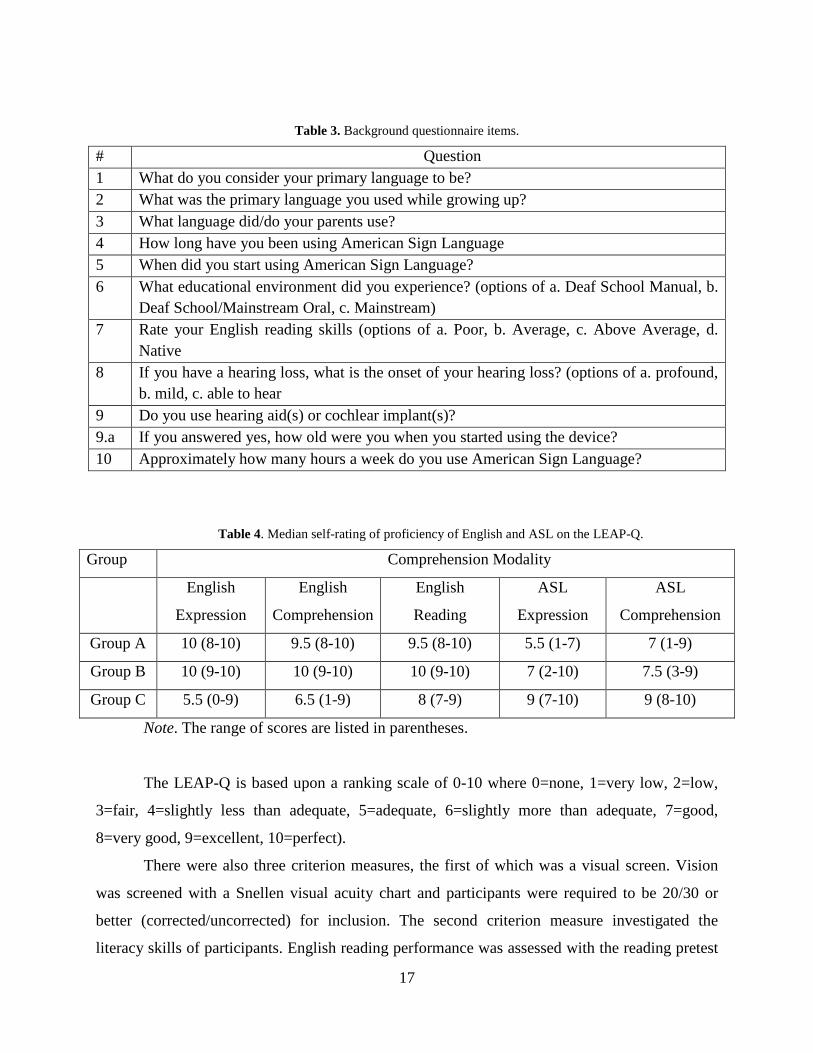
Table 3. Background questionnaire items.
# Question 1 What do you consider your primary language to be? 2 What was the primary language you used while growing up? 3 What language did/do your parents use? 4 How long have you been using American Sign Language 5 When did you start using American Sign Language? 6 What educational environment did you experience? (options of a. Deaf School Manual, b.
Deaf School/Mainstream Oral, c. Mainstream) 7 Rate your English reading skills (options of a. Poor, b. Average, c. Above Average, d.
Native 8 If you have a hearing loss, what is the onset of your hearing loss? (options of a. profound,
b. mild, c. able to hear9 Do you use hearing aid(s) or cochlear implant(s)? 9.a If you answered yes, how old were you when you started using the device?10 Approximately how many hours a week do you use American Sign Language?
Table 4. Median self-rating of proficiency of English and ASL on the LEAP-Q.
Group Comprehension Modality
English
Expression
English
Comprehension
English
Reading
ASL
Expression
ASL
Comprehension
Group A 10 (8-10) 9.5 (8-10) 9.5 (8-10) 5.5 (1-7) 7 (1-9)
Group B 10 (9-10) 10 (9-10) 10 (9-10) 7 (2-10) 7.5 (3-9)
Group C 5.5 (0-9) 6.5 (1-9) 8 (7-9) 9 (7-10) 9 (8-10)
Note. The range of scores are listed in parentheses.
The LEAP-Q is based upon a ranking scale of 0-10 where 0=none, 1=very low, 2=low,
3=fair, 4=slightly less than adequate, 5=adequate, 6=slightly more than adequate, 7=good,
8=very good, 9=excellent, 10=perfect).
There were also three criterion measures, the first of which was a visual screen. Vision
was screened with a Snellen visual acuity chart and participants were required to be 20/30 or
better (corrected/uncorrected) for inclusion. The second criterion measure investigated the
literacy skills of participants. English reading performance was assessed with the reading pretest
17
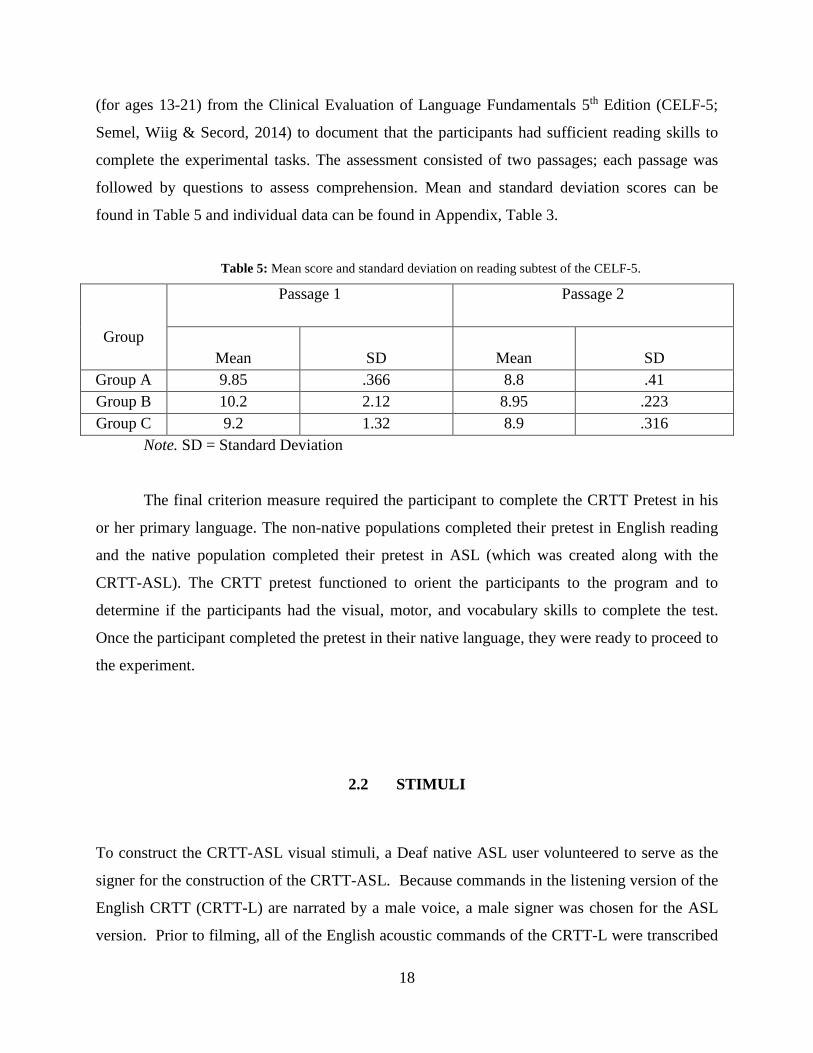
(for ages 13-21) from the Clinical Evaluation of Language Fundamentals 5th Edition (CELF-5;
Semel, Wiig & Secord, 2014) to document that the participants had sufficient reading skills to
complete the experimental tasks. The assessment consisted of two passages; each passage was
followed by questions to assess comprehension. Mean and standard deviation scores can be
found in Table 5 and individual data can be found in Appendix, Table 3.
Table 5: Mean score and standard deviation on reading subtest of the CELF-5.
Group
Passage 1 Passage 2
Mean SD Mean SD Group A 9.85 .366 8.8 .41 Group B 10.2 2.12 8.95 .223 Group C 9.2 1.32 8.9 .316
Note. SD = Standard Deviation
The final criterion measure required the participant to complete the CRTT Pretest in his
or her primary language. The non-native populations completed their pretest in English reading
and the native population completed their pretest in ASL (which was created along with the
CRTT-ASL). The CRTT pretest functioned to orient the participants to the program and to
determine if the participants had the visual, motor, and vocabulary skills to complete the test.
Once the participant completed the pretest in their native language, they were ready to proceed to
the experiment.
2.2 STIMULI
To construct the CRTT-ASL visual stimuli, a Deaf native ASL user volunteered to serve as the
signer for the construction of the CRTT-ASL. Because commands in the listening version of the
English CRTT (CRTT-L) are narrated by a male voice, a male signer was chosen for the ASL
version. Prior to filming, all of the English acoustic commands of the CRTT-L were transcribed
18
and translated into ASL gloss. Gloss is not to be confused with a written form of ASL; gloss is
frequently used by ASL instructors to assist ASL students to learn how to decode ASL and can
serve as a linguistic map. It is written using English words and written notations that represent
signs (Hoffmeister, Moores, & Ellenberg, 1975). After translating the CRTT-L commands into
ASL gloss, the glossed commands were referenced and edited by a Deaf native signer from the
Pittsburgh community.
The ASL stimuli were then recorded using a Canon C100 video camera with the signer
standing in front of a green screen backdrop to allow for subsequent editing. The filming
occurred over the span of two days and required about four hours. The signer produced at least 5
samples of each command, instruction and cue. He also was instructed to have his hands begin
and end in the same resting position. This was to minimize potential confusion with command
onset and offset. It also provided visual consistency within the video frame. Because the
English CRTT-L uses speech produced with a flat, monotonous voice, this study attempted to
replicate the “monotony” without compromising the linguistic significance of facial expressions
in ASL. The use of eyebrow postures also were slightly reduced in magnitude in comparison to
normal, in an effort to be consistent with the limited variability in the vocal intonation in the
English CRTT-L. However, facial expressions were more apparent in the test cues in order to
serve as an aid for the participants, as testing cues appeared if a participant experienced issues or
struggles during a command.
The best version of each sample was selected by the author and edited using Premiere Pro
CC 2014 (Adobe, version 2014.1). The original programmer of the CRTT modified the program
so that the video functioned within the CRTT platform. The size and framing of the videos were
held consistent across subtests but differed for the instructions. The aspect ratio of the pretest
videos was slightly modified to allow visibility of the token images along with the signed
instructions.
To ensure that the signed stimuli were acceptable translations from English to ASL, they
were reverse translated by two volunteers who were Deaf native ASL users from the Pittsburgh
community. They also watched all the pretest commands, subtest cues, and subtest commands
used in the CRTT-ASL. After every video, the volunteers typed in English what they perceived.
The sentences that they produced were then compared to the original CRTT-L commands based
on conceptual content rather individual English elements; this was completed by two individuals
19
familiar with the CRTT (Scorer 1 and Scorer 2). Level of agreement between transcribed CRTT-
L commands and the content of CRTT-ASL commands based on the first Deaf volunteer was
94.9% (calculated by Scorer 1) and 99.1% (scored by Scorer 2). Level of agreement of the
translations produced by the second Deaf translator was 96.7% (calculated by Scorer 1) and
98.1% (calculated by Scorer 2).
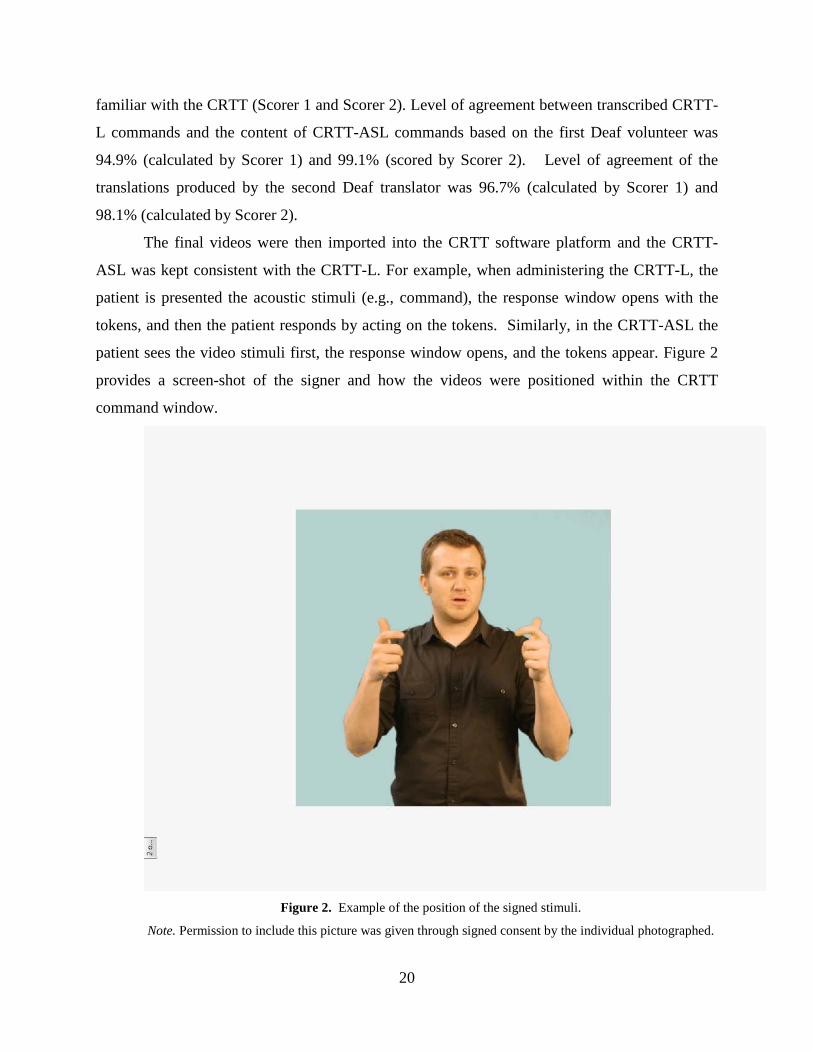
The final videos were then imported into the CRTT software platform and the CRTT-
ASL was kept consistent with the CRTT-L. For example, when administering the CRTT-L, the
patient is presented the acoustic stimuli (e.g., command), the response window opens with the
tokens, and then the patient responds by acting on the tokens. Similarly, in the CRTT-ASL the
patient sees the video stimuli first, the response window opens, and the tokens appear. Figure 2
provides a screen-shot of the signer and how the videos were positioned within the CRTT
command window.
Figure 2. Example of the position of the signed stimuli.
Note. Permission to include this picture was given through signed consent by the individual photographed.
20
2.2.1 Inclusion of Five Parameters Into the Stimuli
The five parameters of ASL were discussed previously in this paper and were applied to the
creation of the CRTT-ASL. Facial expressions were used in designing Subtests IX and X of the
CRTT-ASL. In spoken English, a portion of the commands of Subtests IX and X say, “Instead of
the ________ touch the ________.” In ASL, this message was conveyed using a facial
expression known as “NEG” (negative) and NOD (affirmation) (Wilbur, 2009). A signer uses the
negative facial expression by lowering his/her eyebrows and shaking his/her head (Wilbur,
2009). In the CRTT-ASL, we asked the signer to sign commands that required negation and/or
affirmation as the following:
t NEG t NOD
GREEN SQUARE TOUCH, BLUE CIRCLE TOUCH
In this sentence, the “t” above the first word of the sentence stands for “topic” and
signifies that the signer’s eyebrows should be up only for the duration of the first sign. By
shaking the head when producing the sign “touch” for the green square, the message that the
CRTT-ASL signer conveys is to not touch the green square (Hoffmeister, Moores & Ellenberg,
1975). A positive or affirmative facial morpheme requires a nod (Wilbur, 2009). By nodding his
head when producing the sign “touch” in regards to the blue circle, the message conveys that the
blue circle should be touched.
Role shifting was used in the example of Subtests IX and X for sentences such as
“Instead of the green square touch the blue square.” In this video command, the signer signed
the first shape a little more shifted towards the left, and would then sign the second shape
towards the right (opposite side). As previously discussed, role shifting creates a comparative
situation where, in this example, there is an obvious distinction between the two shapes.
In designing the cues for the CRTT-ASL subtests, rhetorical questions were sometimes
used for their ability to provide clearer instructions. For example, Subtest III cue command
number one in English says, “I want you to first touch the green square and then touch the black
square.” In ASL, the glossed version resembles the following:
21
t rhet
FIRST GREEN SQUARE YOU-TOUCH, FINISH BLACK SQUARE YOU-TOUCH
The “rhet” above the word “finish” stands for “rhetorical” and means that the signer’s
eyebrows should be raised again during the duration of that sign. By asking rhetorically if the
test-taker finished touching the green square, this signed sentence sets up a step-by-step sequence
of events to be followed.
The signer’s perspective was important in designing the CRTT-ASL, specifically in the
creation of Subtests VII and VIII where the commands revolve around moving one shape to the
left or right of another shape. An individual perceiving a message must adopt the perspective of
the individual who is signing. Therefore, test-takers of the CRTT-ASL must adopt the
perspective of the signer when following commands.
Mouthing is used to add meaning to signs, and two specific ASL mouthings were crucial
to include into the stimuli. The inclusion of size in the CRTT warranted the use of the mouthings
“cha” and “OO.” The mouthing “cha” conveys the meaning “large,” for example in signing
“Touch the large circle.” The second mouthing, “OO,” signifies something small, for example
“Touch the small square.”
2.3 PROCEDURES
All of the participants completed the CRTT-ASL and the CRTT-R-wf twice over two sessions.
The order in which participants were presented with the two tests was randomized for the first
session and the order was retained for the second session. The two versions of the CRTT were
administered using a Window’s based computer using a duel screen feature on two monitors.
The participant responded with a wireless mouse rather than a touchscreen.
Prior to completing the first test, the participants completed a CRTT pretest in their
native/dominant language. This means that Groups A and B completed the pretest for the CRTT-
R-wf and Group C completed the ASL pretest. The purpose of administering a pretest in the
participant’s native/dominant language was to orient the participants to the CRTT program and
22
to ensure that they had sufficient skills to complete the test. All of the participants successfully
completed their pretests.
The participants returned for their second session 7-14 days after their first session. At
the end of the second session the participants were asked to complete a post-assessment
questionnaire, received their remuneration, and signed a payment log and receipt.
23
3.0 RESULTS
3.1 TEST-RETEST RELIABILITY PER GROUP
3.1.1 Descriptive Measures Per Group
The mean, standard deviations, difference scores ( Score) between performance in Session 1
and Session 2, and standard error of the Mean CRTT Scores and Mean Efficiency Scores (the
scores that incorporate timing) for the CRTT-ASL are found in Tables 6 and 7 respectively.
The same type of descriptive data for the CRTT-R-wf are presented in Tables 8 and 9. They also
are displayed in Figure 3. These descriptive data show a consistent increase in performance
across the two sessions regardless of group and test, and a relatively high level of variability on
the first administration of the CRTT-ASL. In general, Group C had larger standard deviations
than the other groups. Groups A and B had higher performance on the CRTT-R-wf test than
the CRTT-ASL, whereas performance on the two tests were more comparable for Group C.
24
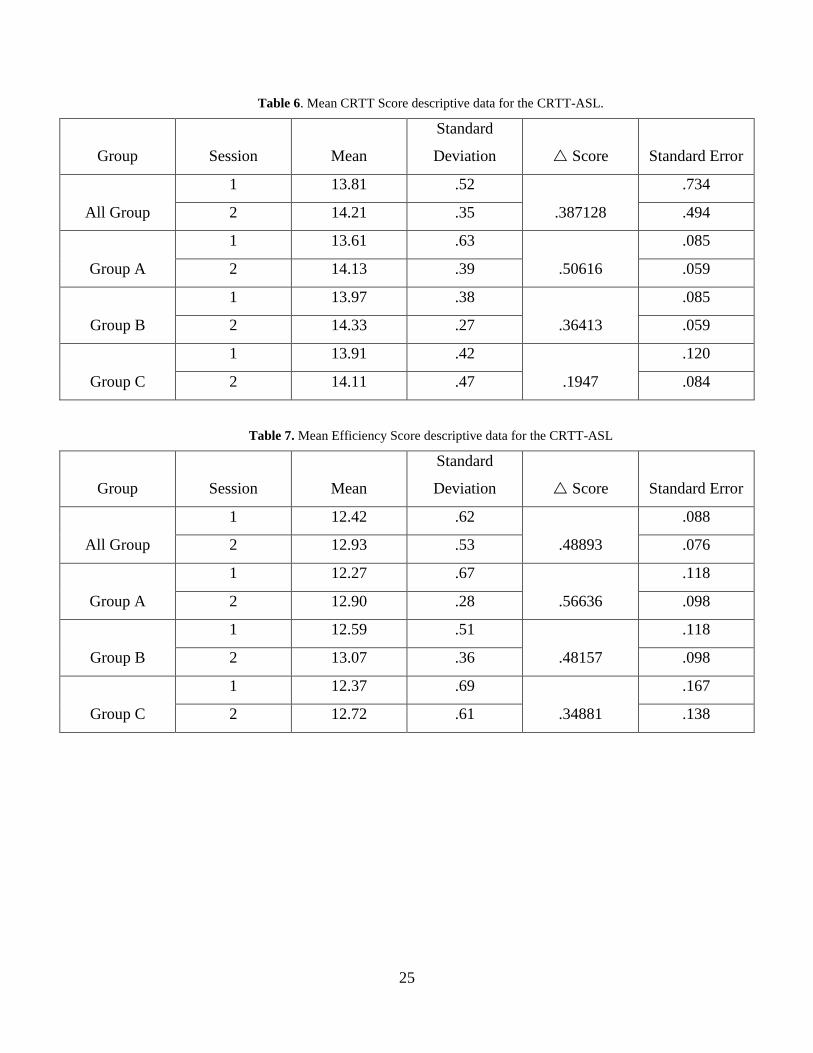
Table 6. Mean CRTT Score descriptive data for the CRTT-ASL.
Group Session Mean
Standard
Deviation Score Standard Error
All Group
1 13.81 .52
.387128
.734
2 14.21 .35 .494
Group A
1 13.61 .63
.50616
.085
2 14.13 .39 .059
Group B
1 13.97 .38
.36413
.085
2 14.33 .27 .059
Group C
1 13.91 .42
.1947
.120
2 14.11 .47 .084
Table 7. Mean Efficiency Score descriptive data for the CRTT-ASL
Group Session Mean
Standard
Deviation Score Standard Error
All Group
1 12.42 .62
.48893
.088
2 12.93 .53 .076
Group A
1 12.27 .67
.56636
.118
2 12.90 .28 .098
Group B
1 12.59 .51
.48157
.118
2 13.07 .36 .098
Group C
1 12.37 .69
.34881
.167
2 12.72 .61 .138
25
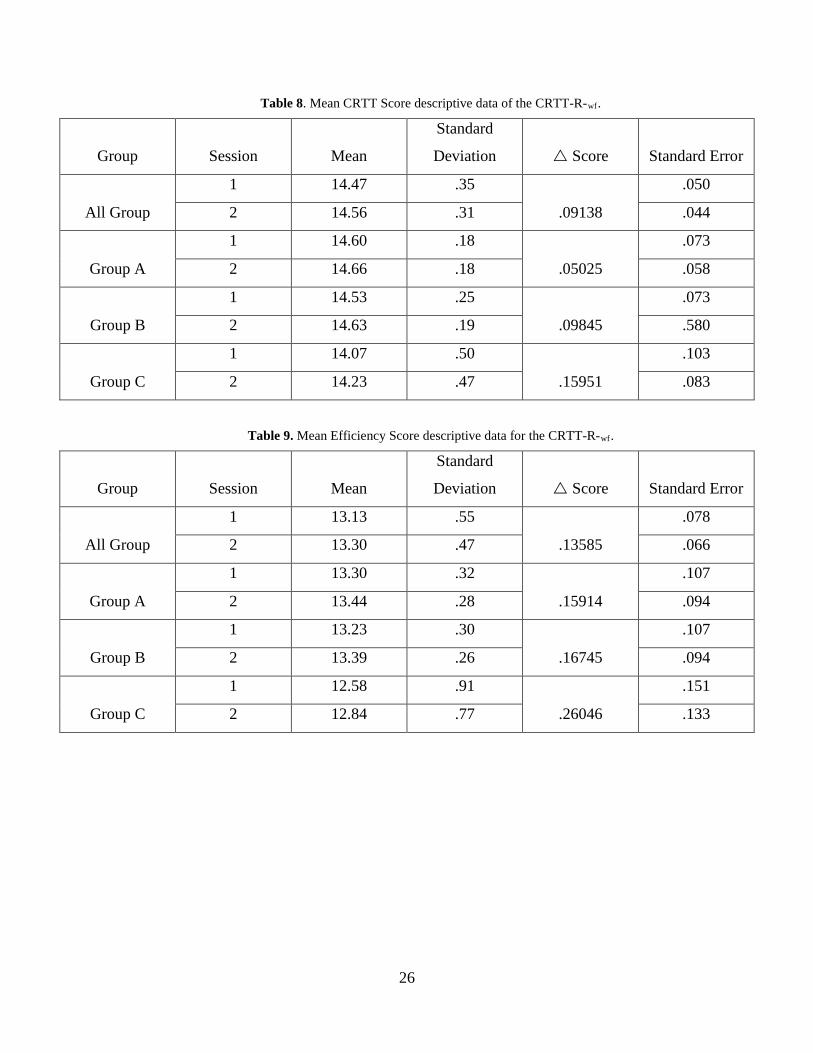
Table 8. Mean CRTT Score descriptive data of the CRTT-R-wf.
Group Session Mean
Standard
Deviation Score Standard Error
All Group
1 14.47 .35
.09138
.050
2 14.56 .31 .044
Group A
1 14.60 .18
.05025
.073
2 14.66 .18 .058
Group B
1 14.53 .25
.09845
.073
2 14.63 .19 .580
Group C
1 14.07 .50
.15951
.103
2 14.23 .47 .083
Table 9. Mean Efficiency Score descriptive data for the CRTT-R-wf.
Group Session Mean
Standard
Deviation Score Standard Error
All Group
1 13.13 .55
.13585
.078
2 13.30 .47 .066
Group A
1 13.30 .32
.15914
.107
2 13.44 .28 .094
Group B
1 13.23 .30
.16745
.107
2 13.39 .26 .094
Group C
1 12.58 .91
.26046
.151
2 12.84 .77 .133
26
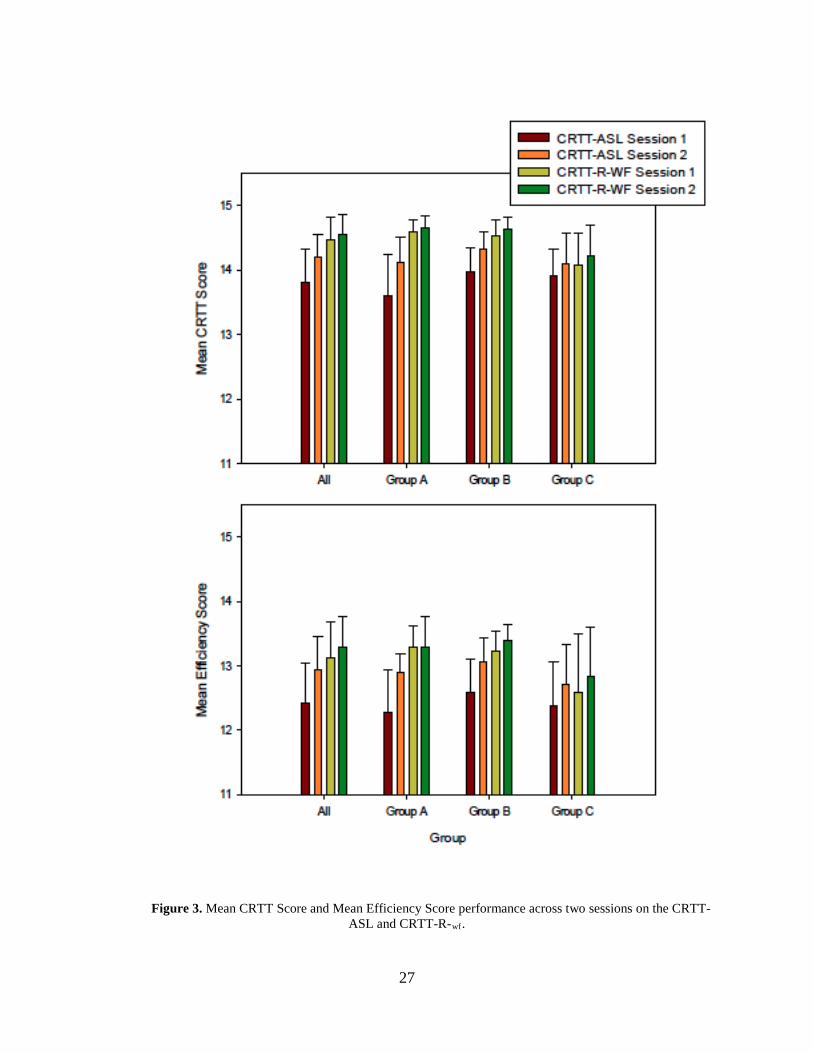
Figure 3. Mean CRTT Score and Mean Efficiency Score performance across two sessions on the CRTT-ASL and CRTT-R-wf.
27
3.1.2 Correlations
To assess the test-retest reliability of the two tests, Pearson Product correlation coefficients were
derived for the Mean CRTT Score and Mean Efficiency Score for both test versions from
Session 1 to Session 2 (IBM Statistical Package for the Social Sciences, SPSS v. 22). The
following data were organized by group: All Group (all data combined), Group A, Group B, and
Group C. Tables 11 through 18 include the correlations separated by group and type of score
(Mean CRTT Scores vs. Mean Efficiency Score). Table 19 lists all of the group by test
combinations with correlations of .70 or higher for the Mean CRTT Scores, and Table 20 lists all
of the combinations producing correlations of .70 or higher for the Mean Efficiency Scores. The
r2 values are included in all tables as a reflection of the amount of variance accounted for by the
correlations.
Although, a number of the correlations met the p=.05 level of significance many did not
reach the minimum criterion of .70 set for acceptable test-retest reliability. Group C produced
correlations on both tests that met the minimum criterion, but Group A met the criterion only for
the CRTT-R- wf (Mean CRTT Score and Mean Efficiency Score). Group B met the criterion for
the CRTT-ASL based on Mean Efficiency Score and for the CRTT-R-wf for both types of scores.
Group C also produced higher correlations between the two tests, whereas Groups A and B
showed little to no relationship in performance between the two tests, suggesting a possible
difference in how the hearing and Deaf participants used language on the two tests.
28
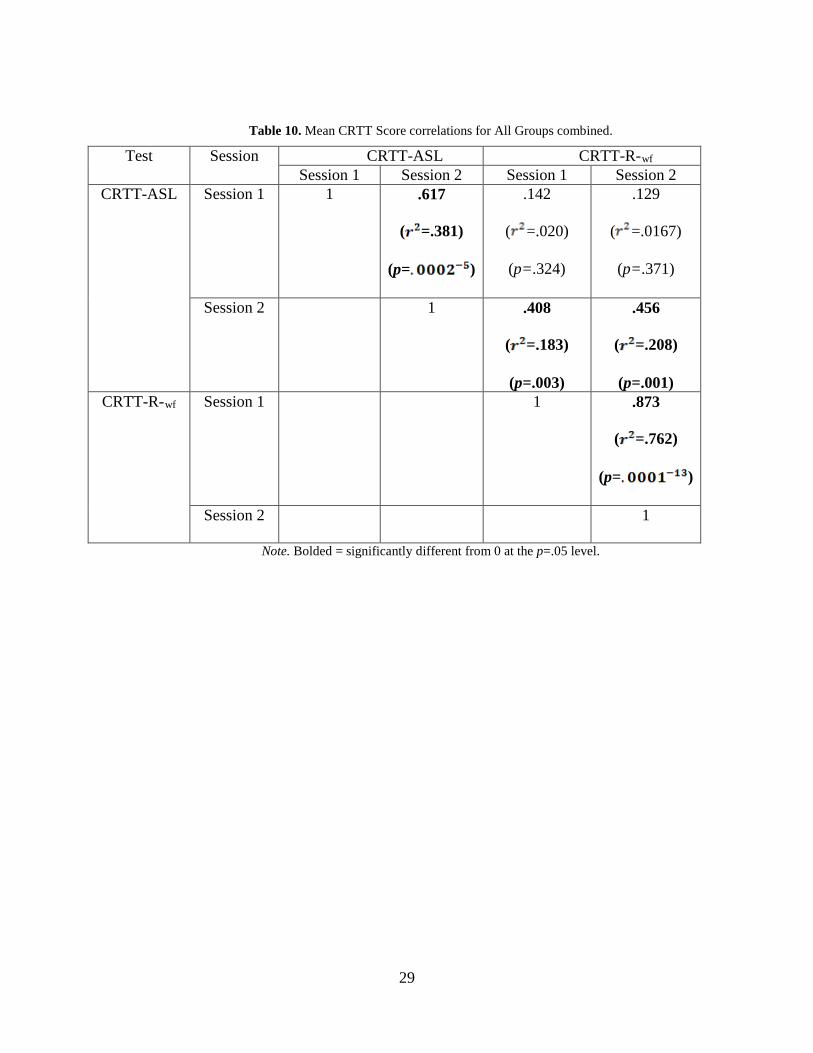
Table 10. Mean CRTT Score correlations for All Groups combined.
Test Session CRTT-ASL CRTT-R-wf Session 1 Session 2 Session 1 Session 2
CRTT-ASL Session 1 1 .617
( =.381)
(p= )
.142
( =.020)
(p=.324)
.129
( =.0167)
(p=.371)
Session 2 1 .408
( =.183)
(p=.003)
.456
( =.208)
(p=.001) CRTT-R-wf Session 1 1 .873
( =.762)
(p= )
Session 2 1
Note. Bolded = significantly different from 0 at the p=.05 level.
29
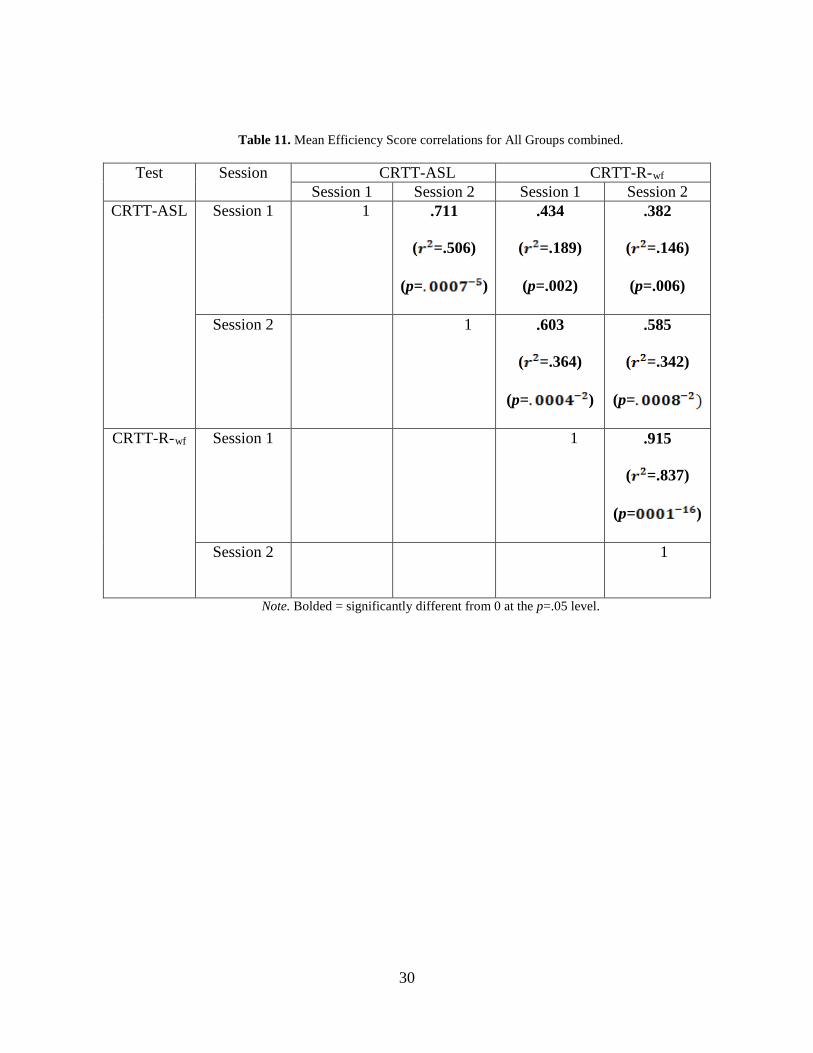
Table 11. Mean Efficiency Score correlations for All Groups combined.
Test Session CRTT-ASL CRTT-R-wf Session 1 Session 2 Session 1 Session 2
CRTT-ASL Session 1 1 .711
( =.506)
(p= )
.434
( =.189)
(p=.002)
.382
( =.146)
(p=.006)
Session 2 1 .603
( =.364)
(p= )
.585
( =.342)
(p=
CRTT-R-wf Session 1 1 .915
( =.837)
(p= )
Session 2 1
Note. Bolded = significantly different from 0 at the p=.05 level.
30

Table 12: Group A Mean CRTT Score correlations
Test Session CRTT-ASL CRTT-R-wf Session 1 Session 2 Session 1 Session 2
CRTT-ASL Session 1 1 .596
( =.320)
(p=.006)
.207
( =.043)
(p=.381)
-.062
( =.003844)
(p=.797) Session 2 1 .327
( =.107)
(p=.159)
.378
( =.143)
(p=.100) CRTT-R-wf Session 1 1 .705
( =.497)
(p=.001) Session 2 1
Note. Bolded = significantly different from 0 at the p=.05 level.
31
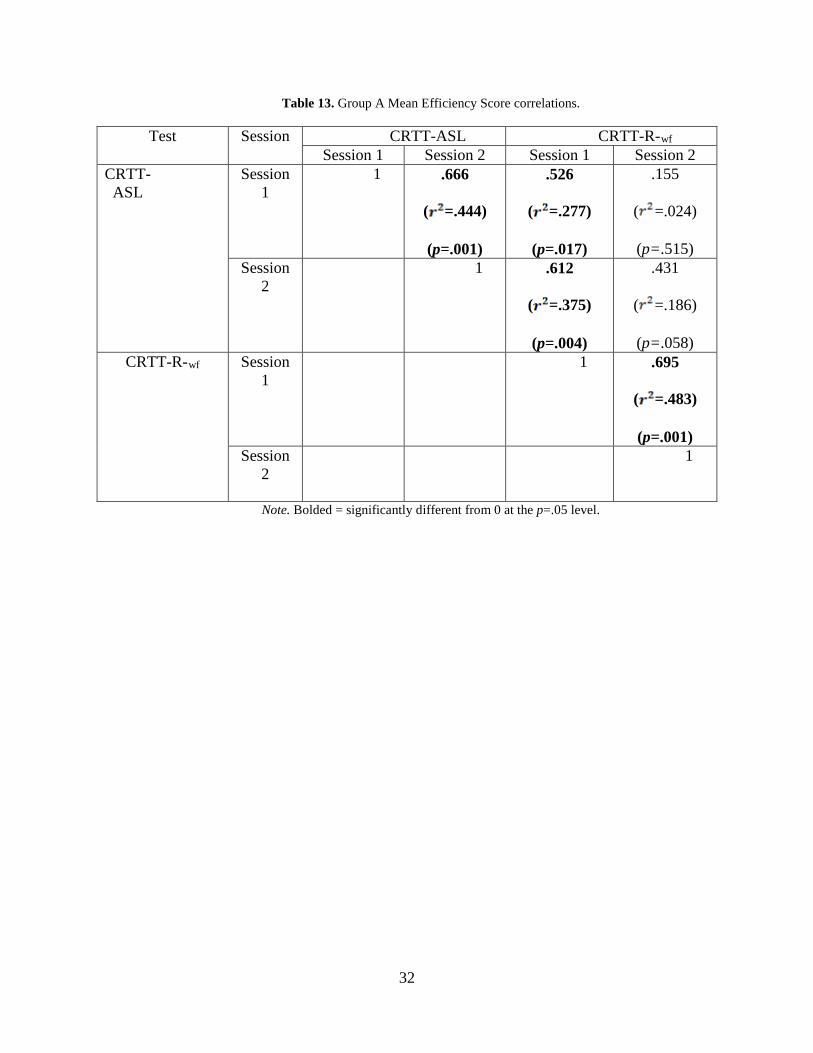
Table 13. Group A Mean Efficiency Score correlations.
Test Session CRTT-ASL CRTT-R-wf Session 1 Session 2 Session 1 Session 2
CRTT-ASL
Session 1
1 .666
( =.444)
(p=.001)
.526
( =.277)
(p=.017)
.155
( =.024)
(p=.515) Session
2 1 .612
( =.375)
(p=.004)
.431
( =.186)
(p=.058) CRTT-R-wf Session
1 1 .695
( =.483)
(p=.001) Session
2 1
Note. Bolded = significantly different from 0 at the p=.05 level.
32
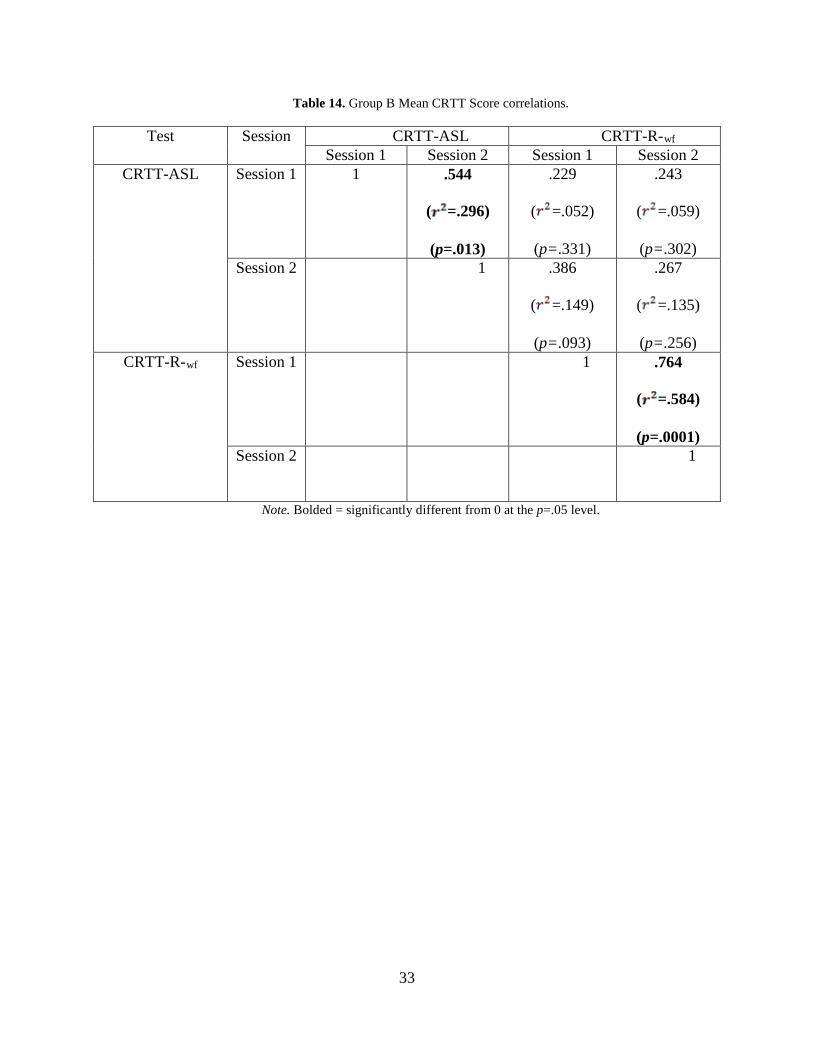
Table 14. Group B Mean CRTT Score correlations.
Test Session CRTT-ASL CRTT-R-wf Session 1 Session 2 Session 1 Session 2
CRTT-ASL Session 1 1 .544
( =.296)
(p=.013)
.229
( =.052)
(p=.331)
.243
( =.059)
(p=.302) Session 2 1 .386
( =.149)
(p=.093)
.267
( =.135)
(p=.256) CRTT-R-wf Session 1 1 .764
( =.584)
(p=.0001) Session 2 1
Note. Bolded = significantly different from 0 at the p=.05 level.
33
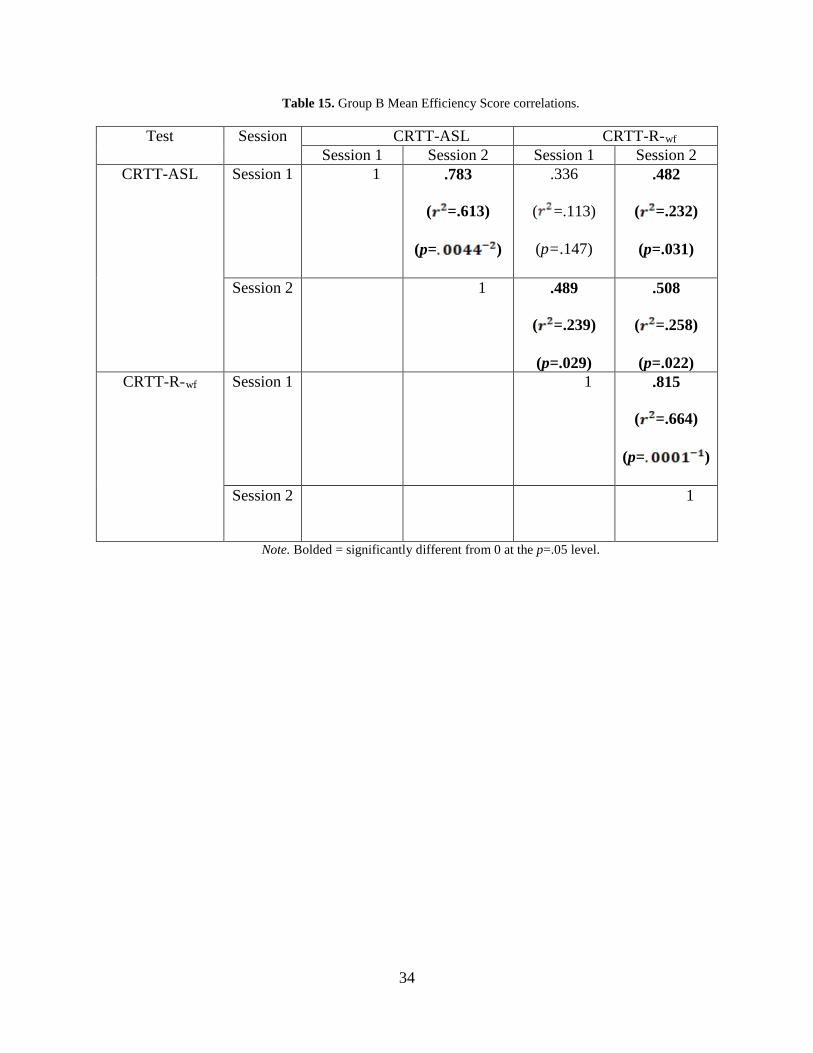
Table 15. Group B Mean Efficiency Score correlations.
Test Session CRTT-ASL CRTT-R-wf Session 1 Session 2 Session 1 Session 2
CRTT-ASL Session 1 1 .783
( =.613)
(p= )
.336
( =.113)
(p=.147)
.482
( =.232)
(p=.031)
Session 2 1 .489
( =.239)
(p=.029)
.508
( =.258)
(p=.022) CRTT-R-wf Session 1 1 .815
( =.664)
(p= )
Session 2 1
Note. Bolded = significantly different from 0 at the p=.05 level.
34
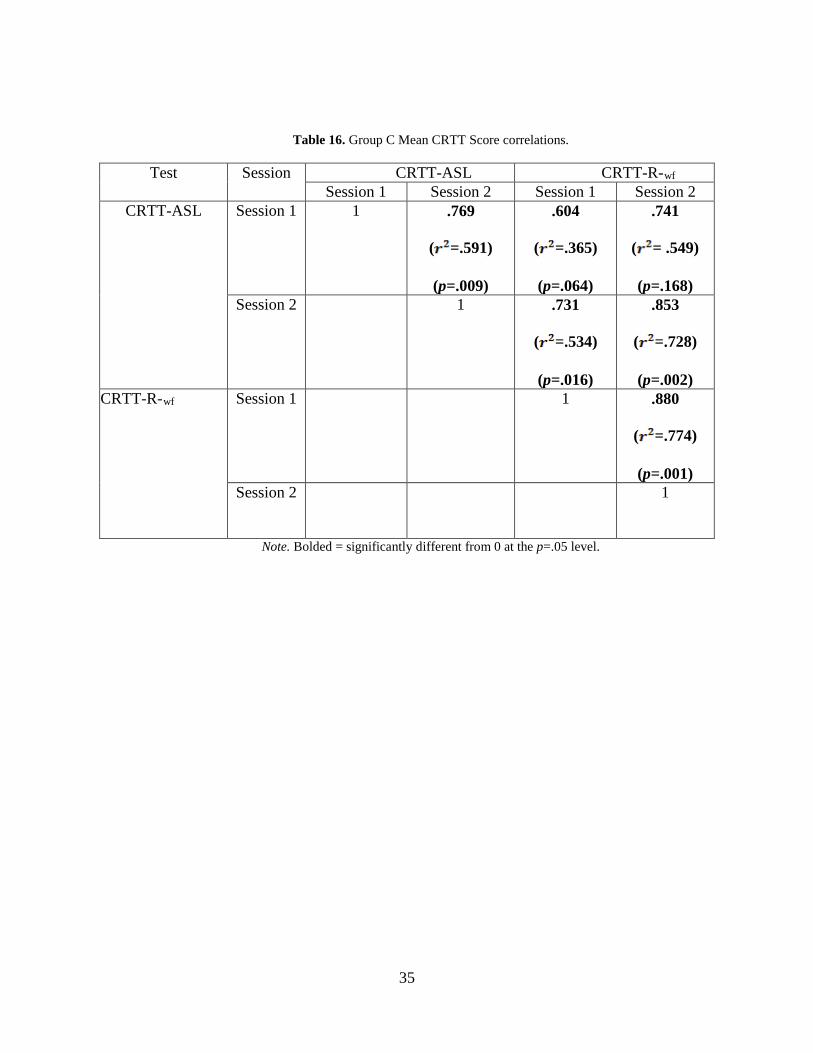
Table 16. Group C Mean CRTT Score correlations.
Test Session CRTT-ASL CRTT-R-wf Session 1 Session 2 Session 1 Session 2
CRTT-ASL Session 1 1 .769
( =.591)
(p=.009)
.604
( =.365)
(p=.064)
.741
( = .549)
(p=.168) Session 2 1 .731
( =.534)
(p=.016)
.853
( =.728)
(p=.002) CRTT-R-wf Session 1 1 .880
( =.774)
(p=.001) Session 2 1
Note. Bolded = significantly different from 0 at the p=.05 level.
35
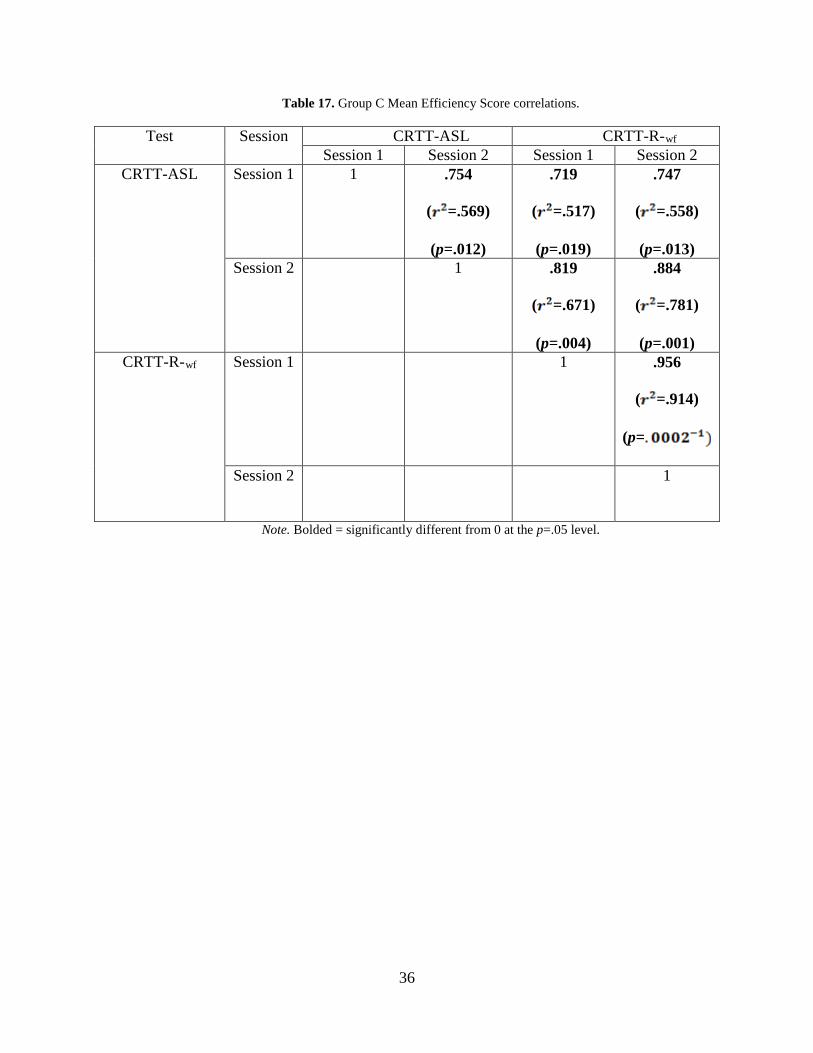
Table 17. Group C Mean Efficiency Score correlations.
Test Session CRTT-ASL CRTT-R-wf Session 1 Session 2 Session 1 Session 2
CRTT-ASL Session 1 1 .754
( =.569)
(p=.012)
.719
( =.517)
(p=.019)
.747
( =.558)
(p=.013) Session 2 1 .819
( =.671)
(p=.004)
.884
( =.781)
(p=.001) CRTT-R-wf Session 1 1 .956
( =.914)
(p=
Session 2 1
Note. Bolded = significantly different from 0 at the p=.05 level.
36
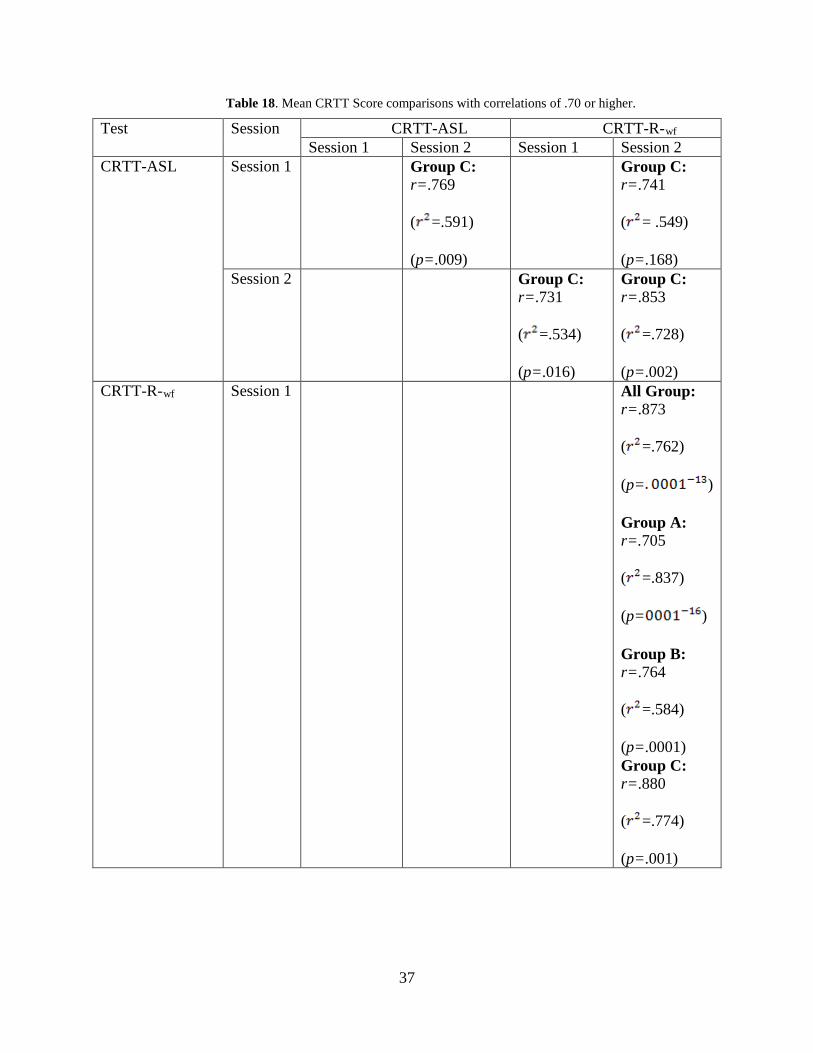
Table 18. Mean CRTT Score comparisons with correlations of .70 or higher.
Test Session CRTT-ASL CRTT-R-wf Session 1 Session 2 Session 1 Session 2
CRTT-ASL Session 1 Group C: r=.769
( =.591)
(p=.009)
Group C: r=.741
( = .549)
(p=.168) Session 2 Group C:
r=.731
( =.534)
(p=.016)
Group C: r=.853
( =.728)
(p=.002) CRTT-R-wf Session 1 All Group:
r=.873
( =.762)
(p= )
Group A: r=.705
( =.837)
(p= )
Group B: r=.764
( =.584)
(p=.0001) Group C: r=.880
( =.774)
(p=.001)
37
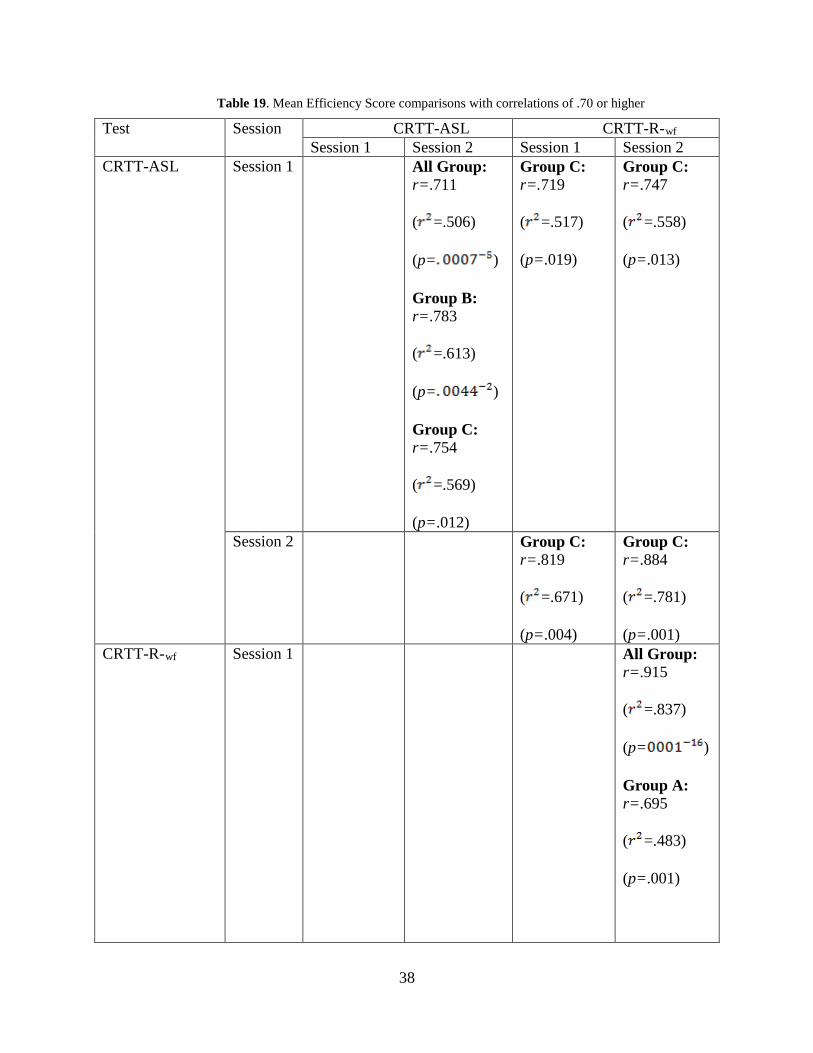
Table 19. Mean Efficiency Score comparisons with correlations of .70 or higher
Test Session CRTT-ASL CRTT-R-wf Session 1 Session 2 Session 1 Session 2
CRTT-ASL Session 1 All Group: r=.711
( =.506)
(p= )
Group B: r=.783
( =.613)
(p= )
Group C: r=.754
( =.569)
(p=.012)
Group C: r=.719
( =.517)
(p=.019)
Group C: r=.747
( =.558)
(p=.013)
Session 2 Group C: r=.819
( =.671)
(p=.004)
Group C: r=.884
( =.781)
(p=.001) CRTT-R-wf Session 1 All Group:
r=.915
( =.837)
(p= )
Group A: r=.695
( =.483)
(p=.001)
38
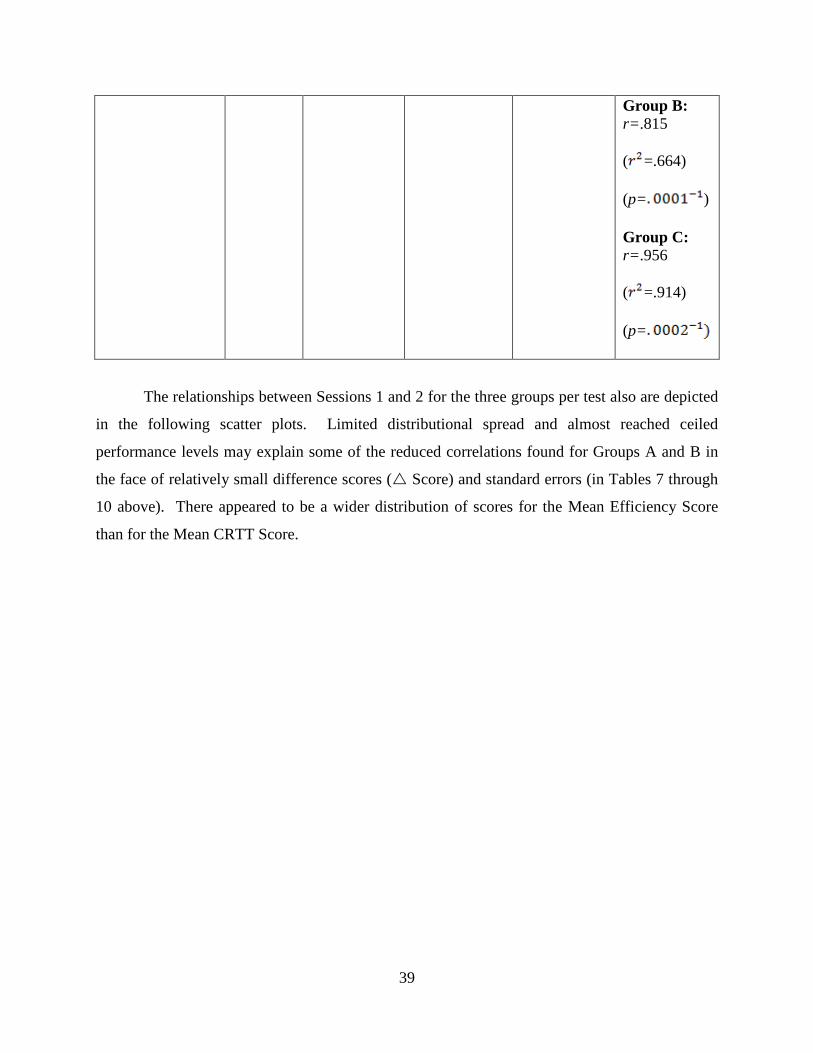
Group B: r=.815
( =.664)
(p= )
Group C: r=.956
( =.914)
(p=
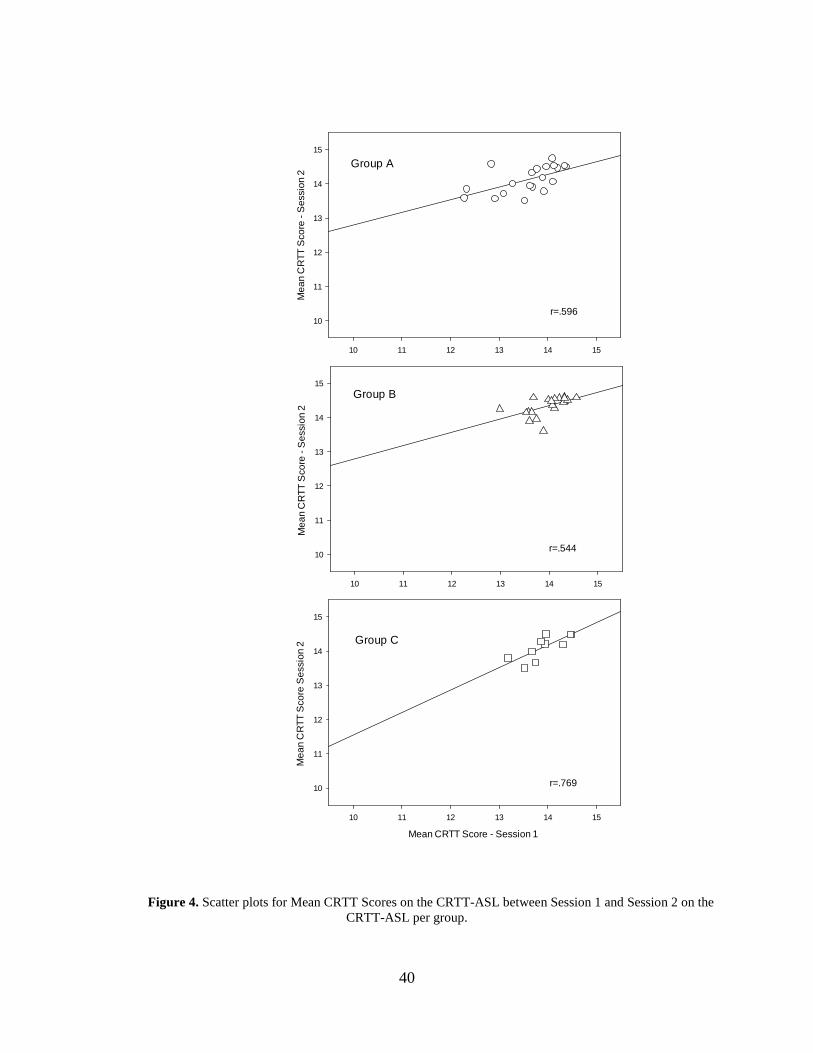
The relationships between Sessions 1 and 2 for the three groups per test also are depicted
in the following scatter plots. Limited distributional spread and almost reached ceiled
performance levels may explain some of the reduced correlations found for Groups A and B in
the face of relatively small difference scores ( Score) and standard errors (in Tables 7 through
10 above). There appeared to be a wider distribution of scores for the Mean Efficiency Score
than for the Mean CRTT Score.
39
10 11 12 13 14 15
Mea
n C
RTT
Sco
re -
Ses
sion
2
10
11
12
13
14
15
10 11 12 13 14 15
Mea
n C
RTT
Sco
re -
Ses
sion
2
10
11
12
13
14
15
Mean CRTT Score - Session 1
10 11 12 13 14 15
Mea
n C
RTT
Sco
re S
essi
on 2
10
11
12
13
14
15
Group A
Group B
Group C
r=.596
r=.544
r=.769
Figure 4. Scatter plots for Mean CRTT Scores on the CRTT-ASL between Session 1 and Session 2 on the CRTT-ASL per group.
40
10 11 12 13 14 15
Mea
n E
ffici
ency
Sco
re -
Ses
sion
2
10
11
12
13
14
15
10 11 12 13 14 15
Mea
n E
ffici
ency
Sco
re -
Ses
sion
2
10
11
12
13
14
15
Mean Efficiency Score - Session 1
10 11 12 13 14 15
Mea
n E
ffici
enty
Sco
re -
Ses
sion
2
10
11
12
13
14
15
Group A
Group B
Group C
r=.669
r=.783
r=.754
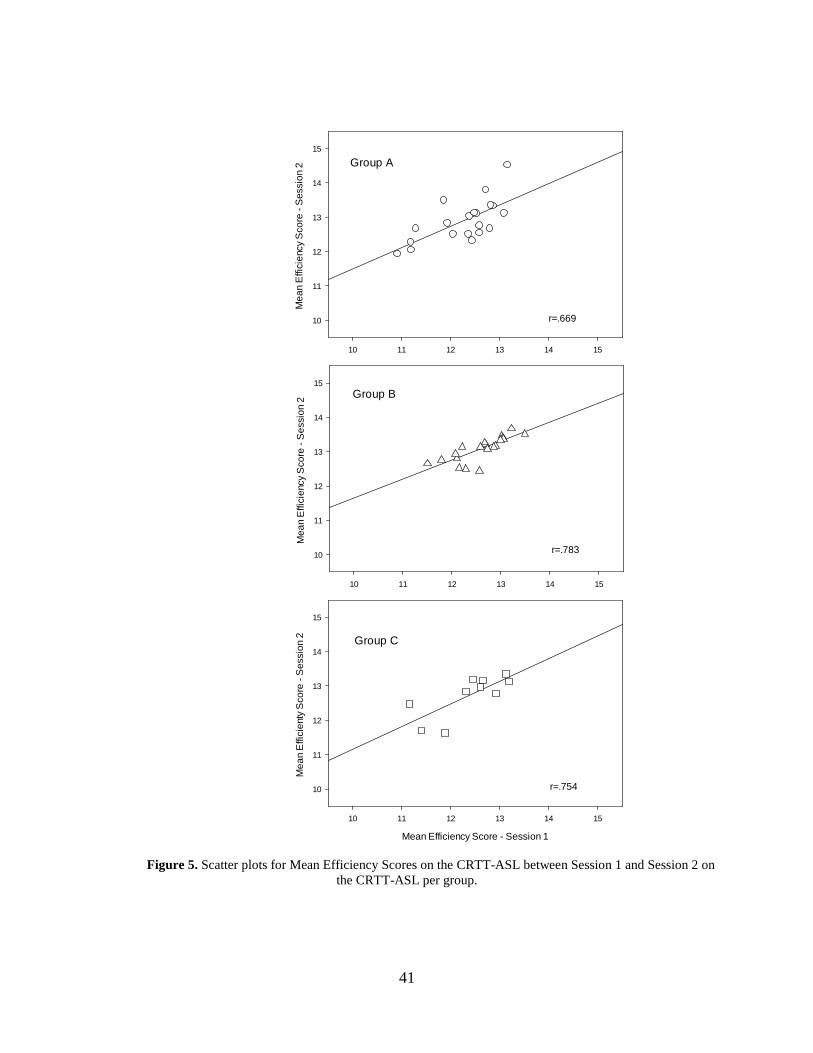
Figure 5. Scatter plots for Mean Efficiency Scores on the CRTT-ASL between Session 1 and Session 2 on the CRTT-ASL per group.
41
10 11 12 13 14 15
Mea
n C
RTT
Sco
re -
Sco
re 2
10
11
12
13
14
15
10 11 12 13 14 15
Mea
n C
RTT
Sco
re -
Ses
sion
2
10
11
12
13
14
15
Mean CRTT Score - Session 1
10 11 12 13 14 15
Mea
n C
RTT
Sco
re -
Ses
sion
2
10
11
12
13
14
15
Group A
Group B
Group C
r=..705
r=..764
r=.880
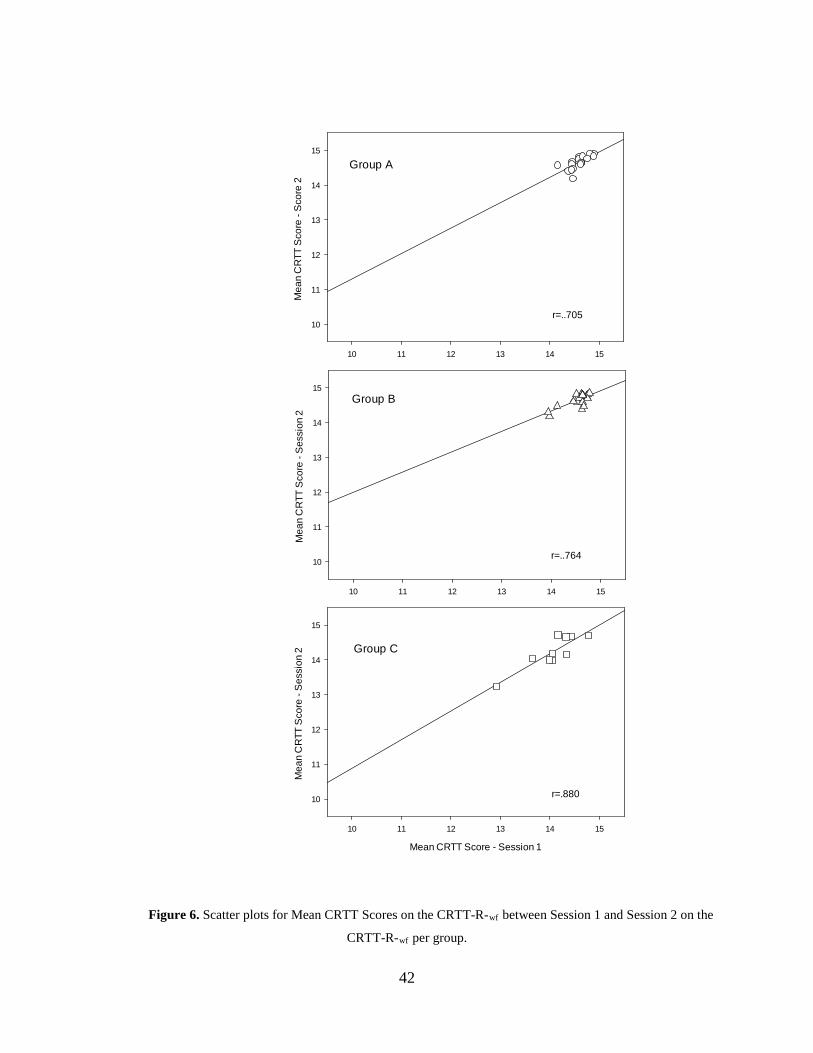
Figure 6. Scatter plots for Mean CRTT Scores on the CRTT-R-wf between Session 1 and Session 2 on the
CRTT-R-wf per group.
42
10 11 12 13 14 15
Mea
n Ef
ficie
ncy S
core
- Se
ssio
n 2
10
11
12
13
14
15
10 11 12 13 14 15
Mea
n Ef
ficie
ncy S
core
- Se
ssio
n 2
10
11
12
13
14
15
Mean Efficiency Score - Session 1
10 11 12 13 14 15
Mea
n Ef
ficie
ncy S
core
- Se
ssio
n 2
10
11
12
13
14
15
Group A
Group B
Group C
r=.695
r=.815
r=.956
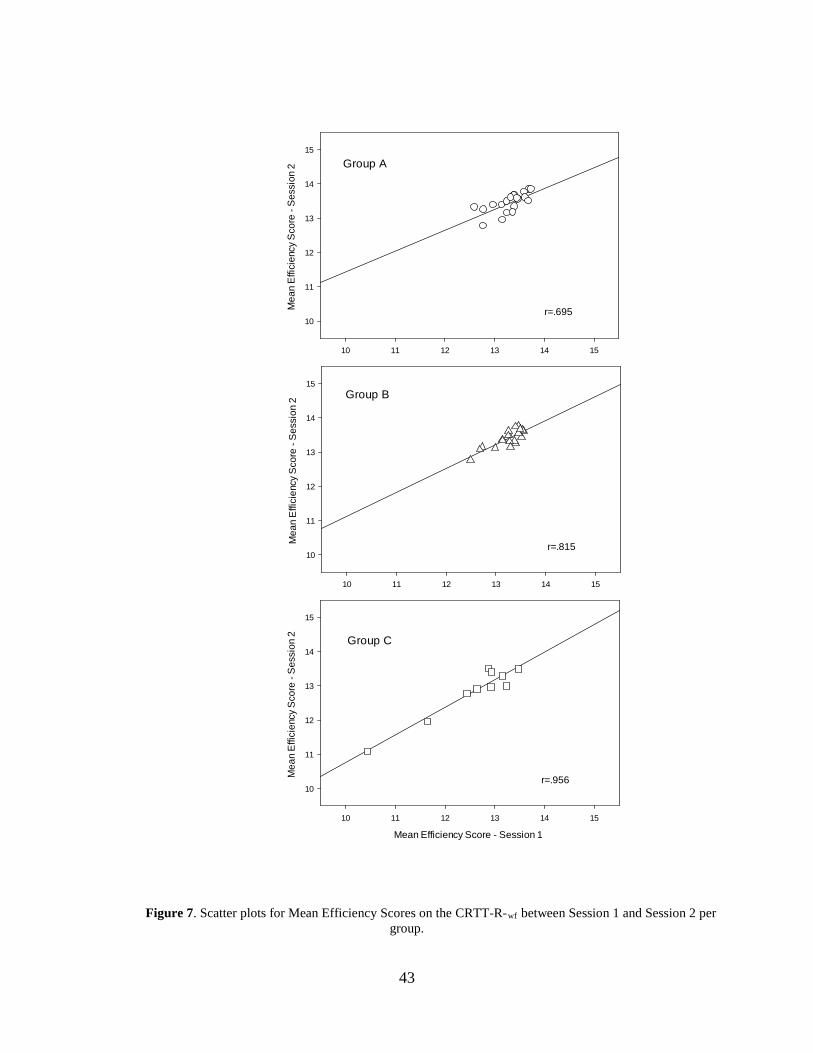
Figure 7. Scatter plots for Mean Efficiency Scores on the CRTT-R-wf between Session 1 and Session 2 per group.
43
3.2 TEST OF DIFFERENCE
3.2.1 Mean CRTT Score
In addition to the correlations, a Mixed Model ANOVA, with repetition on the CRTT-ASL and
CRTT-R-WF was used to test for differences. Sphericity could be assumed, so no normalization
procedures. The alpha level was set at 0.05, and Bonferroni corrections were used for multiple
comparisons where needed.
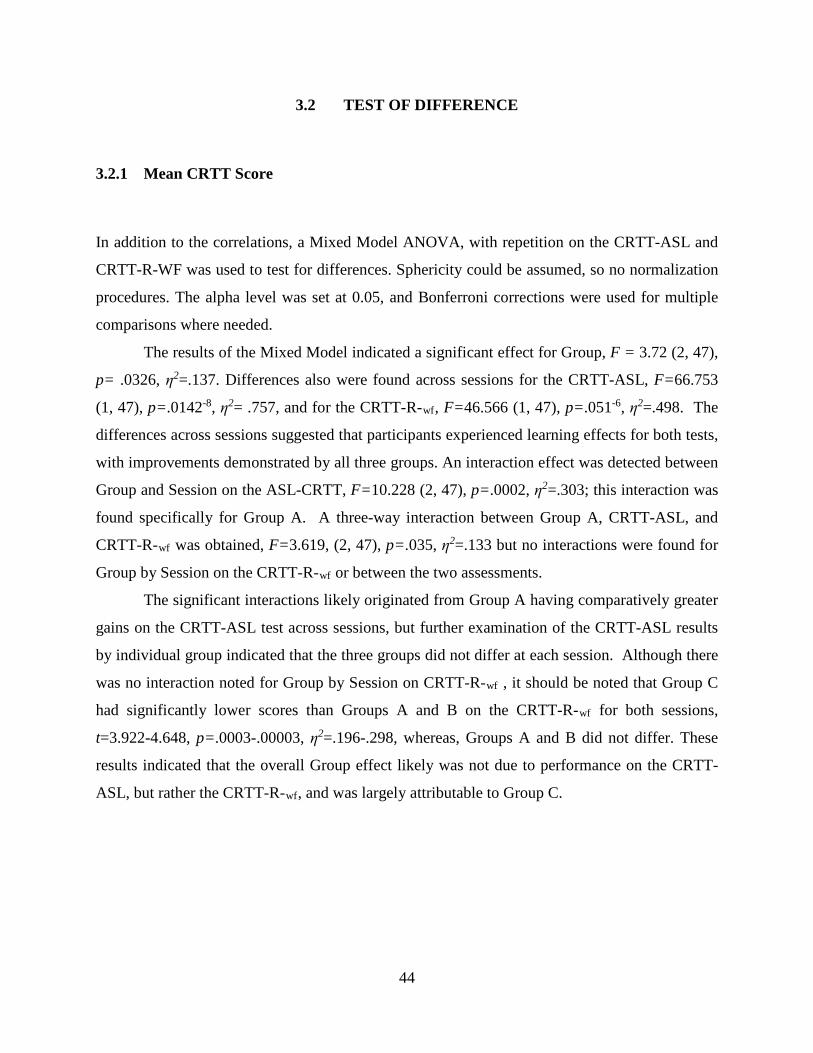
The results of the Mixed Model indicated a significant effect for Group, F = 3.72 (2, 47),
p= .0326, η2=.137. Differences also were found across sessions for the CRTT-ASL, F=66.753
(1, 47), p=.0142-8, η2= .757, and for the CRTT-R-wf, F=46.566 (1, 47), p=.051-6, η2=.498. The
differences across sessions suggested that participants experienced learning effects for both tests,
with improvements demonstrated by all three groups. An interaction effect was detected between
Group and Session on the ASL-CRTT, F=10.228 (2, 47), p=.0002, η2=.303; this interaction was
found specifically for Group A. A three-way interaction between Group A, CRTT-ASL, and
CRTT-R-wf was obtained, F=3.619, (2, 47), p=.035, η2=.133 but no interactions were found for
Group by Session on the CRTT-R-wf or between the two assessments.
The significant interactions likely originated from Group A having comparatively greater
gains on the CRTT-ASL test across sessions, but further examination of the CRTT-ASL results
by individual group indicated that the three groups did not differ at each session. Although there
was no interaction noted for Group by Session on CRTT-R-wf , it should be noted that Group C
had significantly lower scores than Groups A and B on the CRTT-R-wf for both sessions,
t=3.922-4.648, p=.0003-.00003, η2=.196-.298, whereas, Groups A and B did not differ. These
results indicated that the overall Group effect likely was not due to performance on the CRTT-
ASL, but rather the CRTT-R-wf, and was largely attributable to Group C.
44
3.2.2 Mean Efficiency Scores
The same statistical analyses applied to the Mean CRTT Scores were replicated for the Mean
Efficiency Scores. The effects were consistent to those found with the Mean CRTT Scores with
the exception that the three-way interaction failed to reach significance.
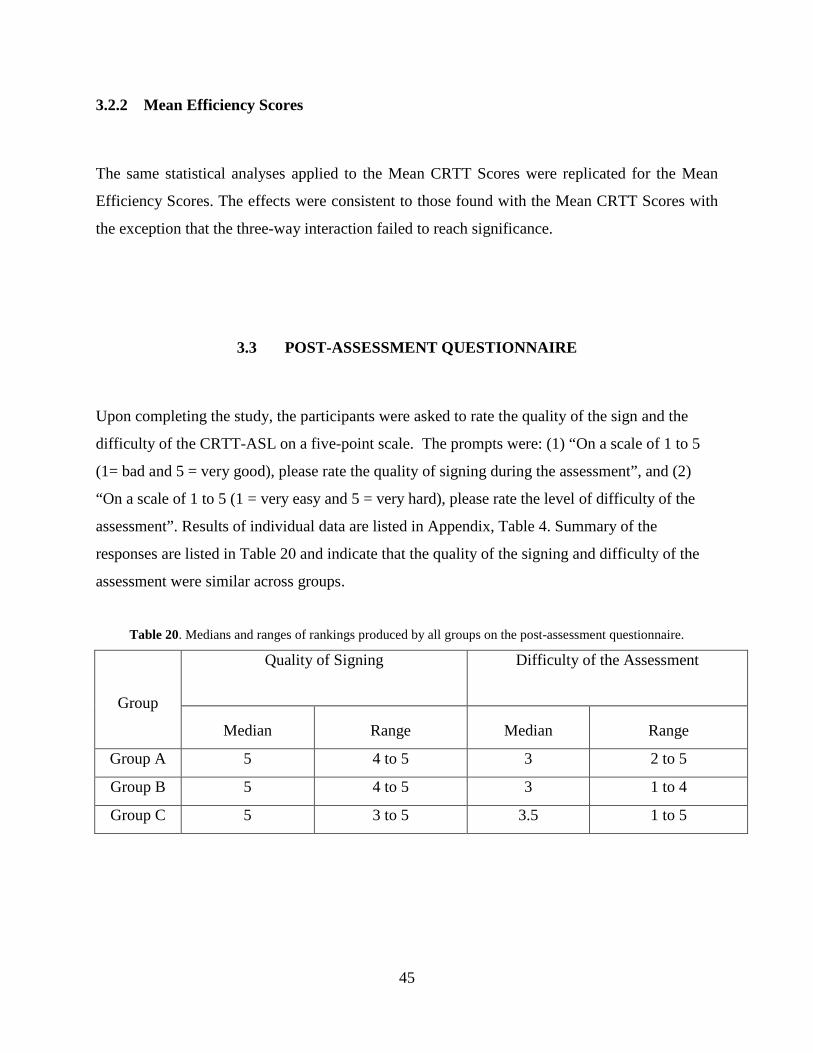
3.3 POST-ASSESSMENT QUESTIONNAIRE
Upon completing the study, the participants were asked to rate the quality of the sign and the
difficulty of the CRTT-ASL on a five-point scale. The prompts were: (1) “On a scale of 1 to 5
(1= bad and 5 = very good), please rate the quality of signing during the assessment”, and (2)
“On a scale of 1 to 5 (1 = very easy and 5 = very hard), please rate the level of difficulty of the
assessment”. Results of individual data are listed in Appendix, Table 4. Summary of the
responses are listed in Table 20 and indicate that the quality of the signing and difficulty of the
assessment were similar across groups.
Table 20. Medians and ranges of rankings produced by all groups on the post-assessment questionnaire.
Group
Quality of Signing Difficulty of the Assessment
Median Range Median Range
Group A 5 4 to 5 3 2 to 5
Group B 5 4 to 5 3 1 to 4
Group C 5 3 to 5 3.5 1 to 5
45
4.0 DISCUSSION
The hypotheses for this study were only partially confirmed. The correlations listed in Tables 11
– 17 showed that the CRTT-ASL was acceptably reliable for Group C, but not for Group A, and
only for Group B when considering the Mean Efficiency Score. All three groups showed
acceptable reliability for the CRTT-R-wf test, but only Group C demonstrated high correlations
between CRTT-ASL and CRTT-R-wf performance.
The modest correlations found for Groups A and B on the CRTT-ASL were in contrast to
the relatively small differences between administrations and the standard errors, and for Group B
could be accounted for by the limited dispersion of scores and ceiling effects.
All three groups demonstrated learning effects on both test versions but the greatest
magnitude of change occurred for the CRTT-ASL. The first CRTT-ASL administration was
particularly low and variable for Group A, but also more variable for all groups when compared
to the results from Session 2.
As expected Groups A and B performed at higher levels on the CRTT-R-wf than the
CRTT-ASL, but the test versions were more equivalent for Group C, which was not expected.
The expectation was that Group C would perform more highly on the CRTT-ASL than the
CRTT-R-wf
Group differences also were found with the Mixed Model, with a main effect for Group,
and Group by session interaction on the CRTT-ASL. The interaction was attributable to the
large gain in performance demonstrated by Group A across sessions, but at each session the
groups did not differ on the CRTT-ASL. The group difference was likely a function of Group C
performing at a lower level than the other groups on the CRTT-R-wf regardless of session – a
finding that was anticipated.
46
4.1 OBSERVED GROUP BEHAVIORAL DIFFERENCES
During administration of the tests for participants in Groups A and B, it was noted that
participants from Groups A and B frequently struggled with Subtests III and IV. In Subtests III
and IV, the instructions are “Touch the _____ and the ____.” In ASL, the signer demonstrates
touching two objects with the handshape “X” to represent “click.” Despite successfully
completing the CRTT-ASL Pretest, many of the non-native participants did not understand the
vocabulary and chose to drag the shapes instead of clicking them independently. On Subtest III,
Group A had an averaged a Mean CRTT Score of 13.05, Group B had a score of 14.23, and
Group C had a score of 14.06. One potential reason could be the lack of instruction on
vocabulary involving computer technology in introductory ASL courses - computer jargon might
not be commonly taught in the ASL classroom. It was observed and noted that both of the non-
native groups demonstrated challenges with understanding verbs used in the CRTT-ASL,
whereas Group C did not. During the CRTT-ASL Pretest, several participants from Group A and
Group B needed further cueing in order to produce a correct response, but they all passed the
Pretest. It is possible that more training is needed for less proficient signers to produce reliable
test results on the CRTT-ASL.
Although Group C did not struggle with verbs on the CRTT-ASL, the participants in this
group frequently made errors on shape, color, and size. Based upon the validity of translations
mentioned in Section 2, the discrepancies were not attributable to the signing in the video clips.
One potential source for these differences is the impact of modality on verbal working memory.
It is possible that managing visual-spatial language in the working memory is more difficult than
reading on the CRTT task, especially if sign was learned late. If ASL is learned as a second
language for individual who learned a first language during their critical language period, such as
Groups A and B along with Deaf individuals who learn ASL as a second language, it could be
possible that they are using their first language to aid their language processing, thus they might
not only be processing the language in ASL (Mayberry, 1993).
47
4.2 DEAF LANGUAGE EXPERIENCES
The ten Deaf participants of this study exemplify heterogeneity of the Deaf population as
demonstrated by their language-learning experiences that ranged from birth to present
(Appendix, Table, 1) as well as varying performance on the CRTT-ASL and CRTT-R-wf.
Based upon a Deaf participants’ language experience, absolute proficiency in ASL likely
varied substantially although they all rated themselves as proficient.
It is crucial to consider the varying language experiences of the Deaf population when
considering the applicability of the CRTT-ASL. For example, a native ASL user who began
learning ASL from birth most likely has ASL that is richer, more easily accessed, and more
nuanced than a signer who began using ASL later in life (both types of individuals were
represented in this study). Appendix, Table 1 provides data on the number of years the Group C
participants had been using ASL. The range was large and many of them indicated that their
parents used English or SEE during their childhood. This variety and diversity of language-
learning experiences might have contributed to the results on the two CRTT versions. Another
contributor factor could be that Deaf Americans are bilingual and learn to read English in diverse
ways, as there is no standard way to teach Deaf children written English (Hoffmeister &
Caldwell Harris, 2014).
Morford and Carlson (2011) investigated whether non-native ASL signers experienced
problems in comprehending all of ASL or only specific components. They found that non-native
Deaf signers performed similarly to Deaf native signers on rapidity and accuracy on a hand
location-monitoring task, but that non-native signers differed from native signers in recognizing
signs. Even more interesting, the hearing non-proficient signers performed similarly to the
groups of Deaf signers on sign recognition tasks. In the current study, the proficient non-native
signers often had Mean CRTT Scores that surpassed those of the proficient native signers. The
original hypothesis for the CRTT-ASL study was that the proficient non-native signers would
perform at levels similar to the native signers, this was the case for the group as a whole but
some performed better than the proficient native group. That being said, it is important to
remember that the proficient non-native group in the current study had twice the number of
participants, which might have influenced the results.
48
A current debate in the literature is whether Deaf ASL and hearing English users differ in
short term memory and working verbal memory skills. Bavalier et al. (2006b) argued that the
short-term memory of individuals who use sign language is not similar to those who use spoken
English. Their study supported the notion that native ASL users have less facility with short-
term memory than native English speakers (Bavalier et al., 2006b). If the claims made by
Bavalier (2006a) and Bavalier et al. (2006b) are true then some of the patterns seen in the current
study may have been influenced by reduced short-term memory skills.
More consistent with the current study is work by Supalla, Hauser, and Bavelier (2014),
who hypothesized that the memory function of ASL users are similar to those of English
speakers. Their study used the American Sign Language Sentence Reproduction Test (ASL-
SRT) to assess verbal working memory. The ASL-SRT requires test-takers watch sentences
signed in ASL and reproduce those sentences. The sentences become increasingly longer, and
more difficult and complex, and like the CRTT-ASL, it evaluates working memory and language
processing. Supalla et al. examined Deaf children, Deaf adults, and hearing proficient ASL
users, and discovered that the verbal working memory function of a signer depended upon their
language-learning experiences. When looking at the individual data, this pattern tended to hold
true for the Deaf participants in the current study.
Age of language acquisition also is a strong influence on language capabilities, language
comprehension and verbal working memory. Mayberry (1993) examined the language recall
skills of Deaf adults based on the age at which they acquired language and whether ASL was
their first or second language. The study discovered that the participants who had learned ASL
as a second language performed better than the participants who were born Deaf and started
learning ASL as their first language from late infancy through childhood. The late first-language
learners demonstrated difficulty with many language-processing characteristics, including
working memory. One reason of this outcome, as explained by Mayberry, is that the late second
language learners can use their working memory to recode language into their first language, but
individuals who are delayed in learning a first language do not have this capability. This could
serve as an explanation for why Group C demonstrated poorer than expected performance on the
CRTT-ASL.
49
4.3 LIMITATIONS
One limitation to the current study was the small sample size of Group C (n=10). Recruiting
Deaf participants was more difficult than anticipated, and the participants that did complete the
study varied in known risk factors such as their language used while growing up, the number of
years using ASL, education, and use of assistive technologies. Another limitation was the
overwhelming percentage of female participants, although gender was not thought to have
influenced the data. Finally, testing order may have been a consideration for some of the
participants. To avoid an order effect the order of test administration for all participants was
randomized; however it is possible that some of the participants in Groups A learned how to
better take the CRTT-ASL in Session 2 after being exposed to the CRTT-R-wf in Session 1,
which could explain why the performance gain across visits for the CRTT-ASL was so large for
this group. It also fits with the errors and behaviors observed for this group, and argues for
additional pre-training.
4.4 FUTURE CONSIDERATIONS
In looking towards the future, there are several video revisions that the CRTT-ASL
would benefit from after noticing specific nuances of Deaf CRTT-ASL test-takers. Also, data
were collected on the response time for every command of each subtest. It would be informative
to investigate the differences in response time between groups and see if it interacts with overall
performance. One future investigation could be assessing performance of Deaf individuals who
have Aphasia on the CRTT-ASL.
50
5.0 SUMMARY AND CONCLUSION
In response to the first research question posed in this study, Groups A and B did not produce
correlations of .70 or above for Mean CRTT Score on the CRTT-ASL, although Group B did
produce an acceptable correlation for Mean Efficiency Score. In contrast, Group C demonstrated
acceptable test-retest reliability on the CRTT-ASL for both score types.
The second experimental question asked whether non-proficient non-native, proficient
non-native, and proficient native ASL users would perform differently on the CRTT-ASL when
compared to the CRTT-R-wf. The study found that all Groups performed better on the CRTT-R-
wf than the CRTT-ASL, and produced higher and more acceptable correlations on the CRTT-R-
wf.
51
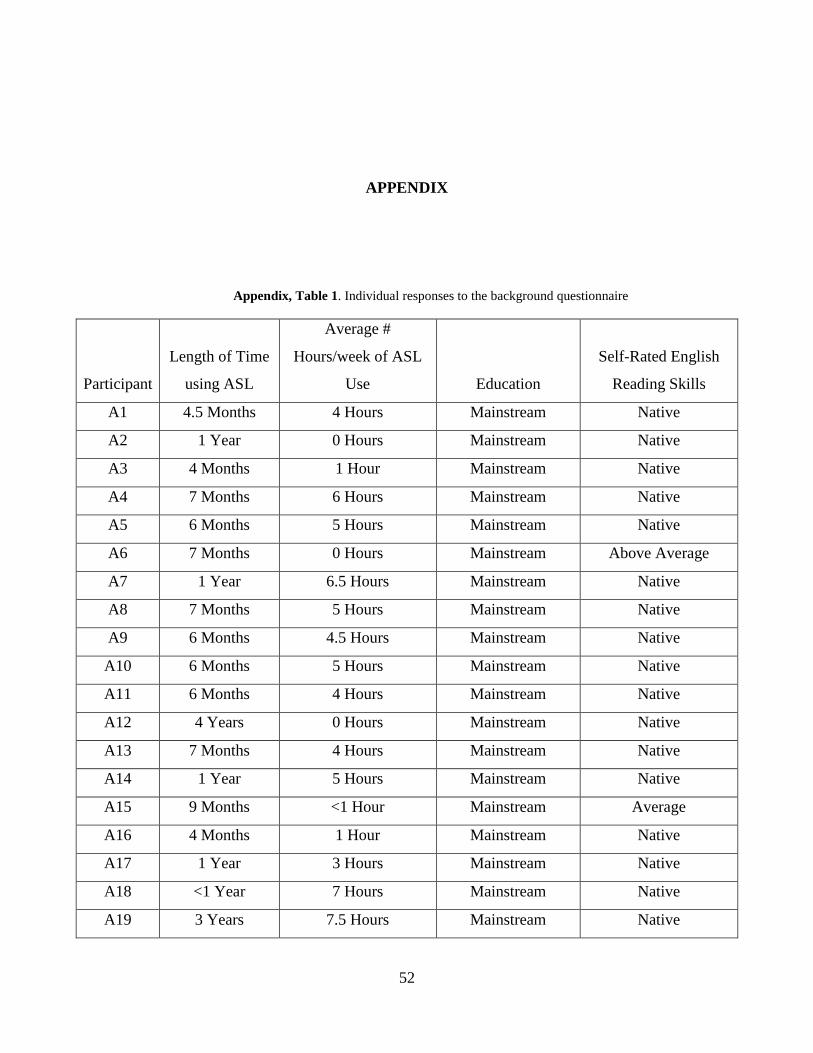
APPENDIX
Appendix, Table 1. Individual responses to the background questionnaire
Participant
Length of Time
using ASL
Average #
Hours/week of ASL
Use Education
Self-Rated English
Reading Skills
A1 4.5 Months 4 Hours Mainstream Native
A2 1 Year 0 Hours Mainstream Native
A3 4 Months 1 Hour Mainstream Native
A4 7 Months 6 Hours Mainstream Native
A5 6 Months 5 Hours Mainstream Native
A6 7 Months 0 Hours Mainstream Above Average
A7 1 Year 6.5 Hours Mainstream Native
A8 7 Months 5 Hours Mainstream Native
A9 6 Months 4.5 Hours Mainstream Native
A10 6 Months 5 Hours Mainstream Native
A11 6 Months 4 Hours Mainstream Native
A12 4 Years 0 Hours Mainstream Native
A13 7 Months 4 Hours Mainstream Native
A14 1 Year 5 Hours Mainstream Native
A15 9 Months <1 Hour Mainstream Average
A16 4 Months 1 Hour Mainstream Native
A17 1 Year 3 Hours Mainstream Native
A18 <1 Year 7 Hours Mainstream Native
A19 3 Years 7.5 Hours Mainstream Native
52
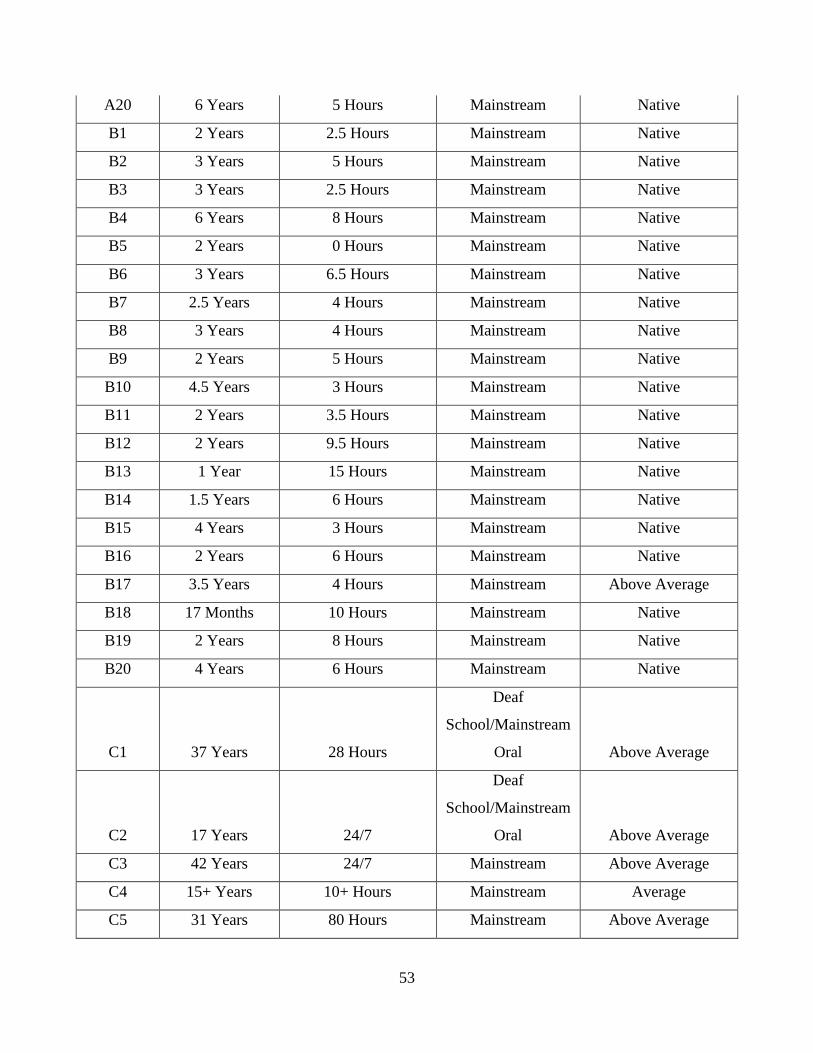
A20 6 Years 5 Hours Mainstream Native
B1 2 Years 2.5 Hours Mainstream Native
B2 3 Years 5 Hours Mainstream Native
B3 3 Years 2.5 Hours Mainstream Native
B4 6 Years 8 Hours Mainstream Native
B5 2 Years 0 Hours Mainstream Native
B6 3 Years 6.5 Hours Mainstream Native
B7 2.5 Years 4 Hours Mainstream Native
B8 3 Years 4 Hours Mainstream Native
B9 2 Years 5 Hours Mainstream Native
B10 4.5 Years 3 Hours Mainstream Native
B11 2 Years 3.5 Hours Mainstream Native
B12 2 Years 9.5 Hours Mainstream Native
B13 1 Year 15 Hours Mainstream Native
B14 1.5 Years 6 Hours Mainstream Native
B15 4 Years 3 Hours Mainstream Native
B16 2 Years 6 Hours Mainstream Native
B17 3.5 Years 4 Hours Mainstream Above Average
B18 17 Months 10 Hours Mainstream Native
B19 2 Years 8 Hours Mainstream Native
B20 4 Years 6 Hours Mainstream Native
C1 37 Years 28 Hours
Deaf
School/Mainstream
Oral Above Average
C2 17 Years 24/7
Deaf
School/Mainstream
Oral Above Average
C3 42 Years 24/7 Mainstream Above Average
C4 15+ Years 10+ Hours Mainstream Average
C5 31 Years 80 Hours Mainstream Above Average
53
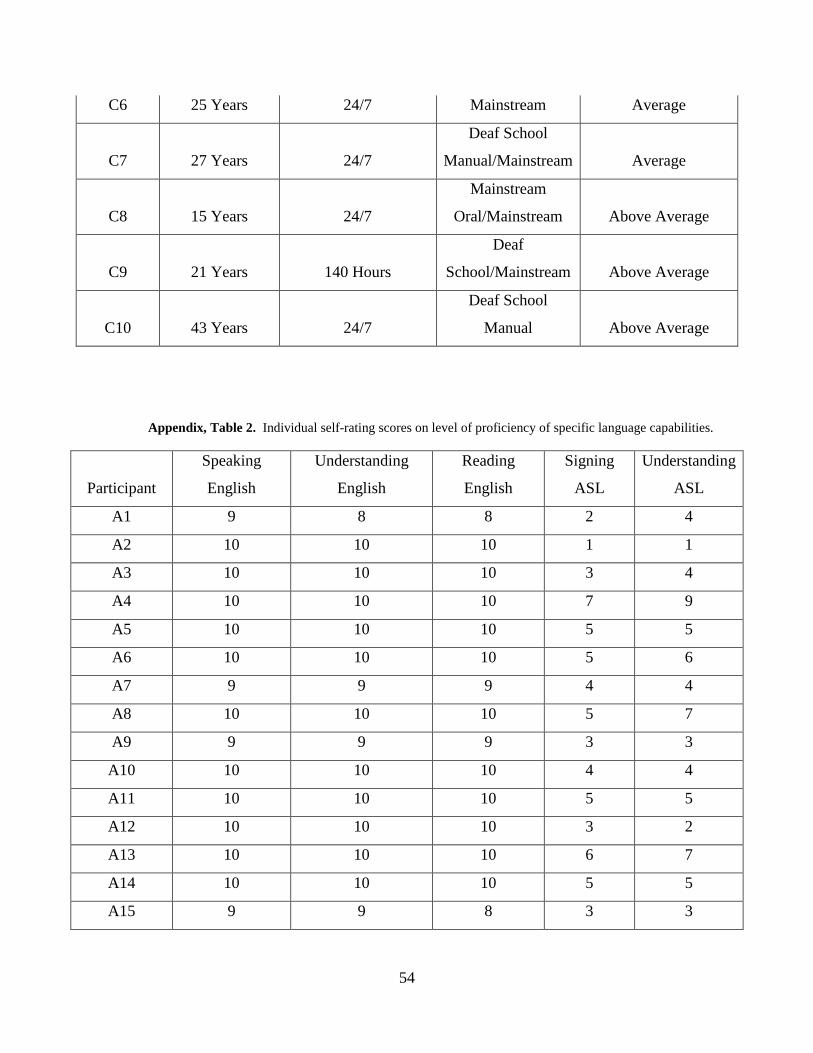
C6 25 Years 24/7 Mainstream Average
C7 27 Years 24/7
Deaf School
Manual/Mainstream Average
C8 15 Years 24/7
Mainstream
Oral/Mainstream Above Average
C9 21 Years 140 Hours
Deaf
School/Mainstream Above Average
C10 43 Years 24/7
Deaf School
Manual Above Average
Appendix, Table 2. Individual self-rating scores on level of proficiency of specific language capabilities.
Participant
Speaking
English
Understanding
English
Reading
English
Signing
ASL
Understanding
ASL
A1 9 8 8 2 4
A2 10 10 10 1 1
A3 10 10 10 3 4
A4 10 10 10 7 9
A5 10 10 10 5 5
A6 10 10 10 5 6
A7 9 9 9 4 4
A8 10 10 10 5 7
A9 9 9 9 3 3
A10 10 10 10 4 4
A11 10 10 10 5 5
A12 10 10 10 3 2
A13 10 10 10 6 7
A14 10 10 10 5 5
A15 9 9 8 3 3
54
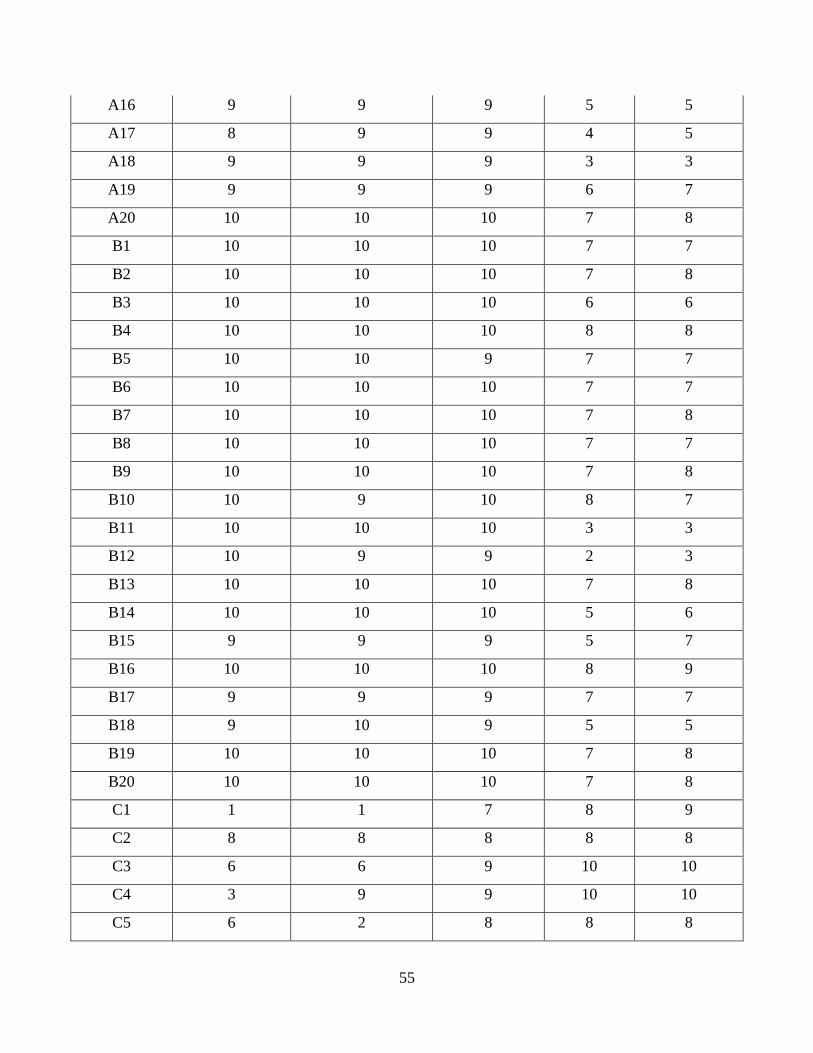
A16 9 9 9 5 5
A17 8 9 9 4 5
A18 9 9 9 3 3
A19 9 9 9 6 7
A20 10 10 10 7 8
B1 10 10 10 7 7
B2 10 10 10 7 8
B3 10 10 10 6 6
B4 10 10 10 8 8
B5 10 10 9 7 7
B6 10 10 10 7 7
B7 10 10 10 7 8
B8 10 10 10 7 7
B9 10 10 10 7 8
B10 10 9 10 8 7
B11 10 10 10 3 3
B12 10 9 9 2 3
B13 10 10 10 7 8
B14 10 10 10 5 6
B15 9 9 9 5 7
B16 10 10 10 8 9
B17 9 9 9 7 7
B18 9 10 9 5 5
B19 10 10 10 7 8
B20 10 10 10 7 8
C1 1 1 7 8 9
C2 8 8 8 8 8
C3 6 6 9 10 10
C4 3 9 9 10 10
C5 6 2 8 8 8
55
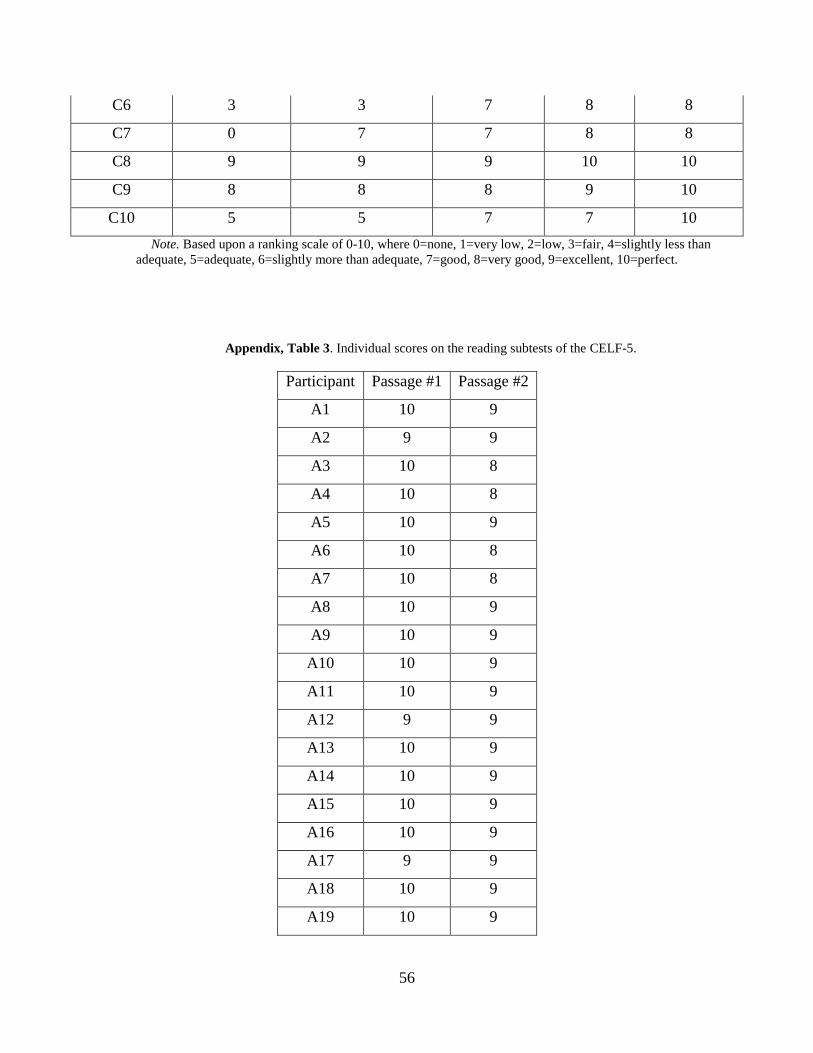
C6 3 3 7 8 8
C7 0 7 7 8 8
C8 9 9 9 10 10
C9 8 8 8 9 10
C10 5 5 7 7 10 Note. Based upon a ranking scale of 0-10, where 0=none, 1=very low, 2=low, 3=fair, 4=slightly less than
adequate, 5=adequate, 6=slightly more than adequate, 7=good, 8=very good, 9=excellent, 10=perfect.
Appendix, Table 3. Individual scores on the reading subtests of the CELF-5.
Participant Passage #1 Passage #2
A1 10 9
A2 9 9
A3 10 8
A4 10 8
A5 10 9
A6 10 8
A7 10 8
A8 10 9
A9 10 9
A10 10 9
A11 10 9
A12 9 9
A13 10 9
A14 10 9
A15 10 9
A16 10 9
A17 9 9
A18 10 9
A19 10 9
56
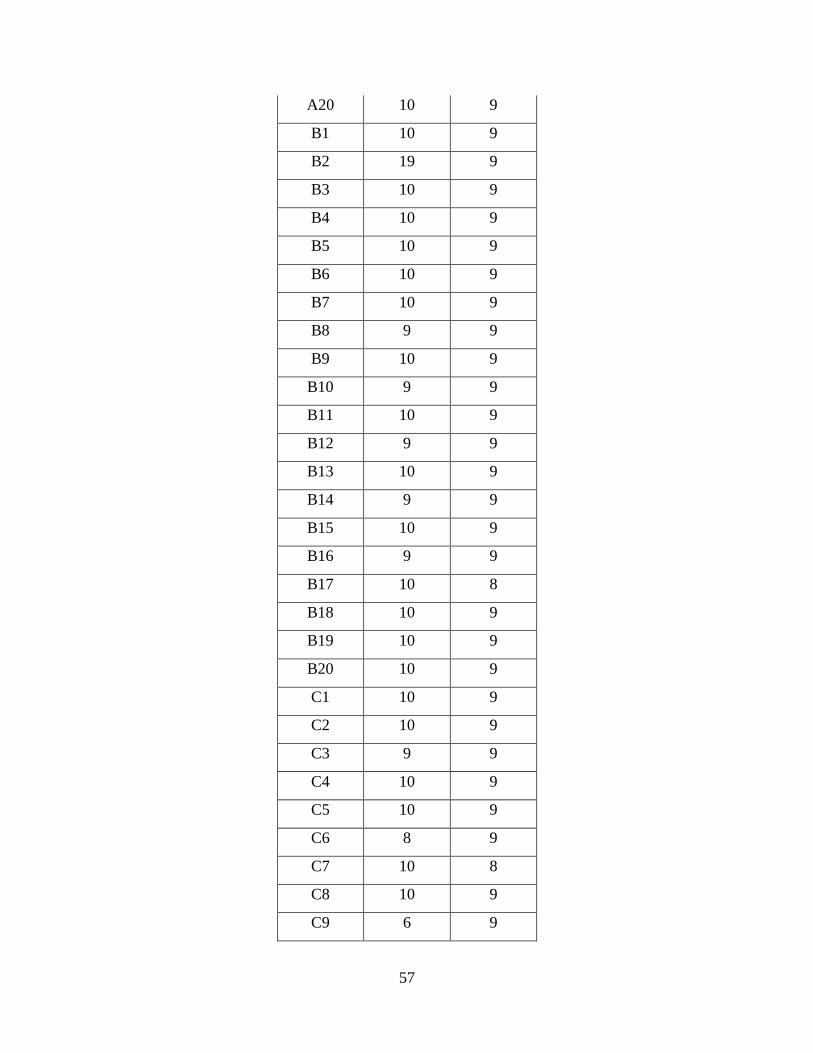
A20 10 9
B1 10 9
B2 19 9
B3 10 9
B4 10 9
B5 10 9
B6 10 9
B7 10 9
B8 9 9
B9 10 9
B10 9 9
B11 10 9
B12 9 9
B13 10 9
B14 9 9
B15 10 9
B16 9 9
B17 10 8
B18 10 9
B19 10 9
B20 10 9
C1 10 9
C2 10 9
C3 9 9
C4 10 9
C5 10 9
C6 8 9
C7 10 8
C8 10 9
C9 6 9
57
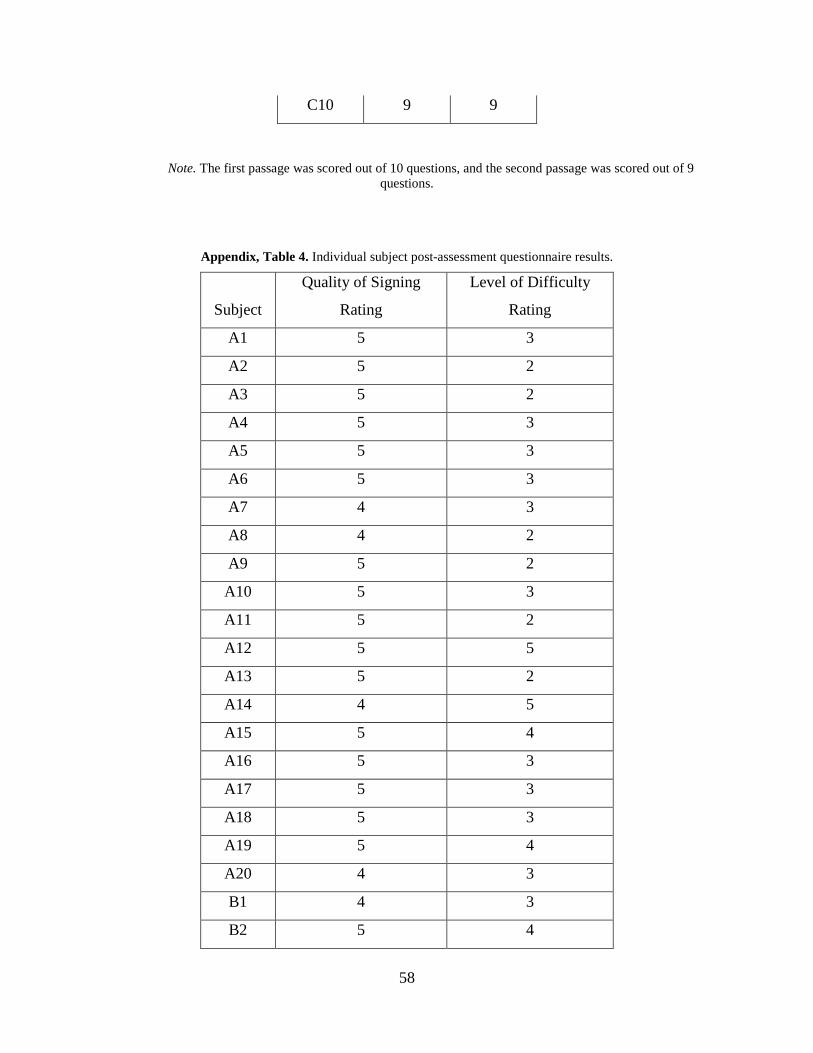
C10 9 9
Note. The first passage was scored out of 10 questions, and the second passage was scored out of 9 questions.
Appendix, Table 4. Individual subject post-assessment questionnaire results.
Subject
Quality of Signing
Rating
Level of Difficulty
Rating
A1 5 3
A2 5 2
A3 5 2
A4 5 3
A5 5 3
A6 5 3
A7 4 3
A8 4 2
A9 5 2
A10 5 3
A11 5 2
A12 5 5
A13 5 2
A14 4 5
A15 5 4
A16 5 3
A17 5 3
A18 5 3
A19 5 4
A20 4 3
B1 4 3
B2 5 4
58
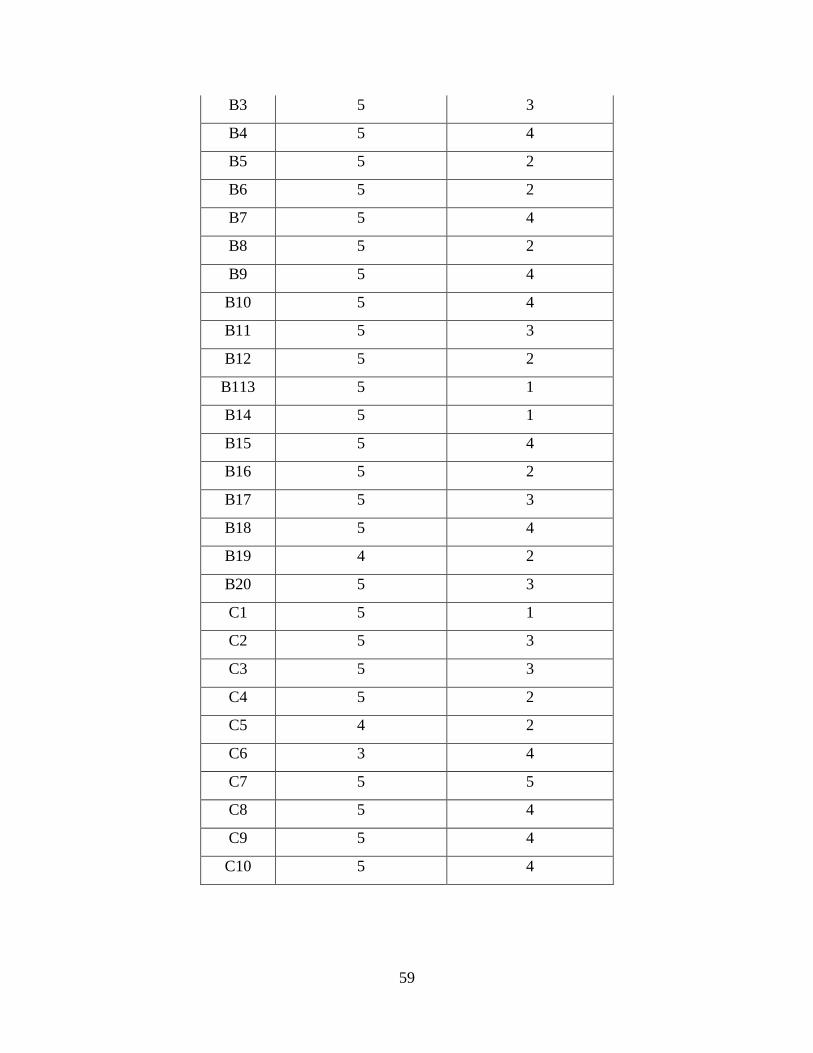
B3 5 3
B4 5 4
B5 5 2
B6 5 2
B7 5 4
B8 5 2
B9 5 4
B10 5 4
B11 5 3
B12 5 2
B113 5 1
B14 5 1
B15 5 4
B16 5 2
B17 5 3
B18 5 4
B19 4 2
B20 5 3
C1 5 1
C2 5 3
C3 5 3
C4 5 2
C5 4 2
C6 3 4
C7 5 5
C8 5 4
C9 5 4
C10 5 4
59
BIBLIOGRAPHY
Baker, C. & Padden, C. (1978). Focusing on the nonmanual component of American Sign Language. Understanding Language Through Sign Language Research, 27-57.
Baker, C. & Cokely, D. (1980). American Sign Language: A teacher’s resource text on grammar
and culture. Silver Spring, MD: T.J. Publishers. Bavelier, D., Dye, M. W. & Hauser, P. C. (2006). Do deaf individuals see better? Trends in
Cognitive Science, 10(11), 512-18. Bavelier, D., Newport, E.L., Hall, M.L., Supalla, T. & Boutla, M. (2006). Persistent differences
in short term memory span between sign and speech: Implications for cross-linguistic comparisons. Psychological Science, 17 (12), 1090-1092.
Belanger, N. N, Slattery, T. J., Mayberry, R. I. & Rayner, K. (2012). Skilled deaf readers have an
enhanced perceptual span in reading. Psychological Science, 23 (7), 816-23. Bellugi, U. & Fischer, S. (1972). A comparison of sign language and spoken language.
Cognition, 1, 173-200. Campbell, R., MacSweeney, M. & Waters, D. Sign Language and the Brain: A Review. Journal
of Deaf Studies and Deaf Education, 13 (1), 3-20. Cawthon, S. W., Winton, S. M., Garberoglio, C. L. & Gobble, Mark. E. (2011) The Effects of
American Sign Language as an Assessment Accommodation for Students Who Are Deaf or Hard of Hearing. Journal of Deaf Studies and Deaf Education, 16 (2), 198-211.
Chen, S. K., McNeil, M. R., Hill, K. & Pratt, S. R. (2013). Translating and validating a mandarin
chinese version of the computerized revised token test. Speech, Language and Hearing, 0, 1-9.
Cormier, K., Schembri, A., Vinson, D. & Orfanidou, E. (2012). First language acquisition differs
from second language acquisition in prelingually deaf signers: evidence from sensitivity to grammaticality judgment in British Sign Language. Cognition, 124 (1), 50-65.
De Renzi, E. & Faglioni, P. (1978). Normative data and screening power of a shortened version
of the Token Test. Cortex, 14 (1), 41-9.
60
Eberwein, C. A., Pratt, S. R., McNeil, M. R., Szuminsky, N. J. & Doyle, P. J. (2008). Auditory
Performance Characteristics of the Computerized Revised Token Test (CRTT). Journal of Speech, Language, and Hearing Research, 50, 865-877.
Emmorey, K. & Corina, D. (1990). Lexical recognition in sign language: Effects of phonetic
structure and morphology. Perceptual and Motor Skills, 71, 1227-1252. Emmorey, K., Mehta, S. & Grabowski, T. J. (2007). The neural correlates of sign versus word
production. Neuromiage, 36 (1), 202-208. Friedman, L. A. (1975). Space, Time, and Person Reference in American Sign Language.
Language, 51 (4), 940-961. Gllardo, G., Gua’rdia, J., Villasenor, T. & McNeil, M. (2011). Psychometric Data for the
Revised Token Test in Normally Developing Mexican Children Ages 4-12 Years. Archives of Clinical Neuropsycholog, 26, 225-234.
Heilman, L. E. (2006). An Examination of the Effects of Mode of Access on the Computerized
Revised Token Test. Retrieved from D-Scholarship @Pitt. (ETD 07222008-151505). Hoffmeister, R. J. & Caldwell-Harris, C. L. (2014). Acquiring English as a second language via
print: the task for Deaf children. Cognition, 132 (2), 229-43. Hoffmeister, R. J., Moores, D. F. & Ellenberger, R. L. (1975). Some Procedural Guidelines for
the Study of the Acquisition of Sign Language. Sign Language Studies, 7, 121-137. Klima, E.S. & Bellugi, E. (1981). The Signs of Langauge. Language in Society, 10 (1), 142-144. Marian, V., Blumenfeld, H.K., & Kaushanskaya. (2003). Developing a language experience and
bilingual status questionnaire. Poster presented at the annual meeting of the Midwestern Psychological Association, Chicago.
Mayberry, R. I., Chen, J. K., Witcher, P. & Klein, D. (2011). Age of acquisition effects on the
functional organization of language in the adult brain. Brain and Language, 119 (1), 16-29.
Mayberry, R. I., Lock, E. & Kazmi, H. (2002). Linguistic ability and early language exposure,
Nature, 417. 38 Mayberry, R.I. (1993). First Language Acquisition After Childhood Differs From Second-
Language Acquisition: The Case of American Sign Language. Journal of Speech and Hearing Research, 36, 1258-1270.
McNeil, M. R., & Prescott, T. E. (1978). The Revised Token Test. Austin, TX: PRO ED.
61
McNeil, M. R., Kim, a., Sung, J. E., Pratt, S. R., Szuminsky, N. & Doyle, P. J. (2009) A comparison of left versus right hand, and mouse versus touchscreen access methods on the Computerized Revised Token Test in normal daults and persons with aphasia. Aphasiology. 39th. Keystone, CO. May 26-30, 2009.
McNeil, M. R., Pratt, S. R., Szuminsky, N., Sung, J. E., Fossett, T. R. D., Fassbinder, W. & Lim,
K. Y. (2015). Reliability and Validity of the Computerized Revised Token Test: Comparison of Reading and Listening Versions in Persons With and Without Aphasia. Journal of Speech, Language, and Hearing Research, 1-14.
McNeil, M., Lim, K., Fassbinder, W., Dickey, M., Kendall, D., Pratt, S. & Kim, H. (2012). Self-
paced reading Stroop-interference effects in Persons With Aphasia. Procedia Social and Behavioral Sciences, 61, 64-65.
Mounty, J. L., Pucci, C. T. & Harmon, K. C. (2014). How deaf American Sign Language/English
bilingual children become proficient readers: an emic perspective. Journal of Deaf Studies and Deaf Education, 19 (3), 333-46.
Morford, J.P. & Carlson, M.L. (2011). Sign perception and recognition in non-native signers of
ASL. Language Learning & Development, 2, 149-168. Penicaud, S., Klein, D., Zatorre, R. J., Chen, J. K., Witcher, P., Hyde, K. & Mayberry, R. I.
(2013). Structural brain changes linked to delayed first language acquisition in congenitally deaf individuals. Neuroimage, 66, 42-9.
Petitto, L. A., Zatorre, R. J., Gauna, K., Nikelski, E. J., Dostie, D. & Evans, A. C. (2000).
Speech-like cerebral activity in profoundly deaf people processing signed languages: Implications for the neural basis of human language. Proceedings of the National Academy of Sciences of the United States, 97 (25), 13961-66.
Premiere Pro (Version 2014.1) [Computer software]. San Jose, CA: Adobe Rutherford, S. D. (1988). The Culture of American Deaf People. Sign Language Studies. 59,
129-147. Stokoe, W. C. (1960). Sign Language Structure: An Outline of the Visual Communication
Systems of the American Deaf. Journal of Deaf Studies and Deaf Education, 10 (1), 3-34.
Supulla, T., Hauser, P.C. & Bavelier, D. (2014). Reproducing American Sign Language
sentences: cognitive scaffolding in working memory. Frontiers in Psychology, 859. Sung, J. E., McNeil, M. R. & Pratt, S. R. (2010). Working Memory and its Relation to Auditory
Comprehension in Native and Nonnative Speakers. Asia Pacific Journal of Speech, Language, and Hearing, 13 (1), 41-50.
62
Sung, J. E., McNeil, M. R., Pratt, S. R., Dickey, M. W., Hula, W., Szuminsky, N. J. & Doyle, P. J. (2009). Verbal working memory and its relationship to sentence-level reading and listening comprehension in persons with aphasia. Aphasiology, 23 (7), 1040-1052.
Weast, T. (2008). Questions in American Sign Language: A quantitative analysis of raised and
lowered eyebrows. Doctoral dissertation. Arlington, USA: University of Texas. Wilbur, R. B. (2009). Effects of Varying Rate of Signing on ASL Manual Signs and Nonmanual
Markers. Language Speech, 52, 245-285.
63