Embed Size (px)
Citation preview
Assessing Supply Chain Risk
Costs, Availability, and Logistics Pressure
Manufacturing Supply Chains
Presented by:
Katherine Lewis
Senior Manager, IHS Global Insight
Andrea Borruso
Director of Middle East Operations, SRIC Consulting
Eric Pratt
Vice President, iSuppli
Chris Pålsson
Director, IHS Fairplay
Copyright © 2011 IHS Global Insight. All Rights Reserved.2011 World Economic Outlook Conference 2
Agenda
• Introductions
• Themes
• Key Inputs to Production
• Labor Markets
• Chemicals & Plastics
• Electronic Components
• Shipping
• Conclusions

Copyright © 2011 IHS Global Insight. All Rights Reserved.2011 World Economic Outlook Conference 3
Where have all the suppliers gone?
Demand is returning, but to new supplier conditions
• Many suppliers have gone out of business, and consolidation means pricing power
The Strong (or Big) Survive
• Vertical integration is the new reality in many markets
Economies of Scale
• Constantly changing technology means some suppliers that were hot when demand flagged haven’t weathered the storm
Staying Relevant
Copyright © 2011 IHS Global Insight. All Rights Reserved.2011 World Economic Outlook Conference 4
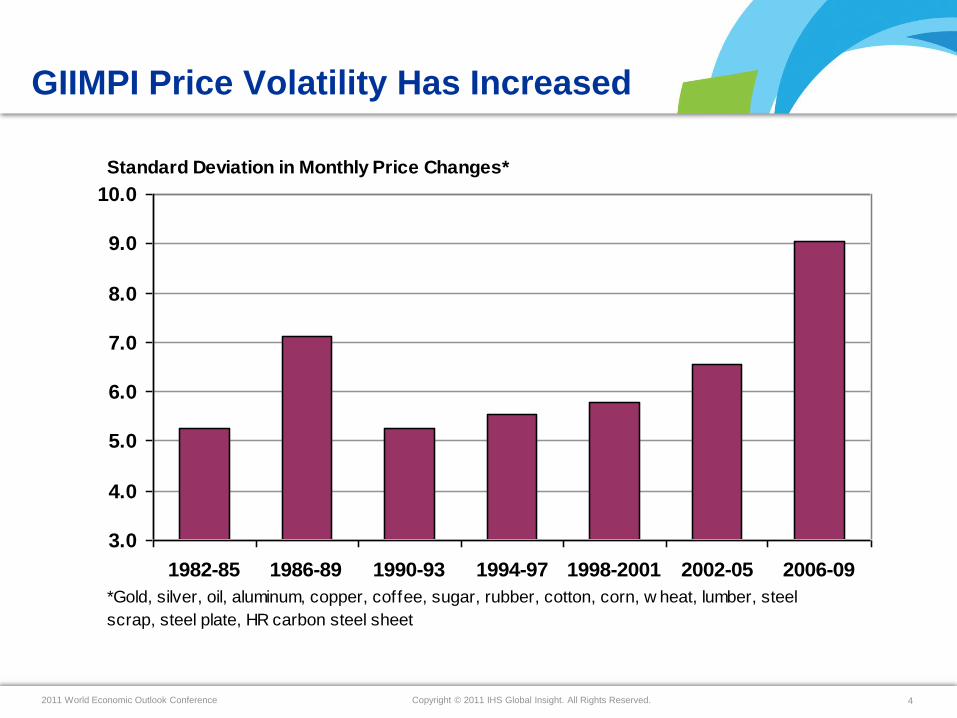
GIIMPI Price Volatility Has Increased
3.0
4.0
5.0
6.0
7.0
8.0
9.0
10.0
1982-85 1986-89 1990-93 1994-97 1998-2001 2002-05 2006-09
Standard Deviation in Monthly Price Changes*
*Gold, silver, oil, aluminum, copper, coffee, sugar, rubber, cotton, corn, w heat, lumber, steel
scrap, steel plate, HR carbon steel sheet
Assessing Supply Chain Risk
Labor Markets
Presented by:
Katherine Lewis
Senior Manager, IHS Global Insight
Pricing and Purchasing
Copyright © 2011 IHS Global Insight. All Rights Reserved.2011 World Economic Outlook Conference 6
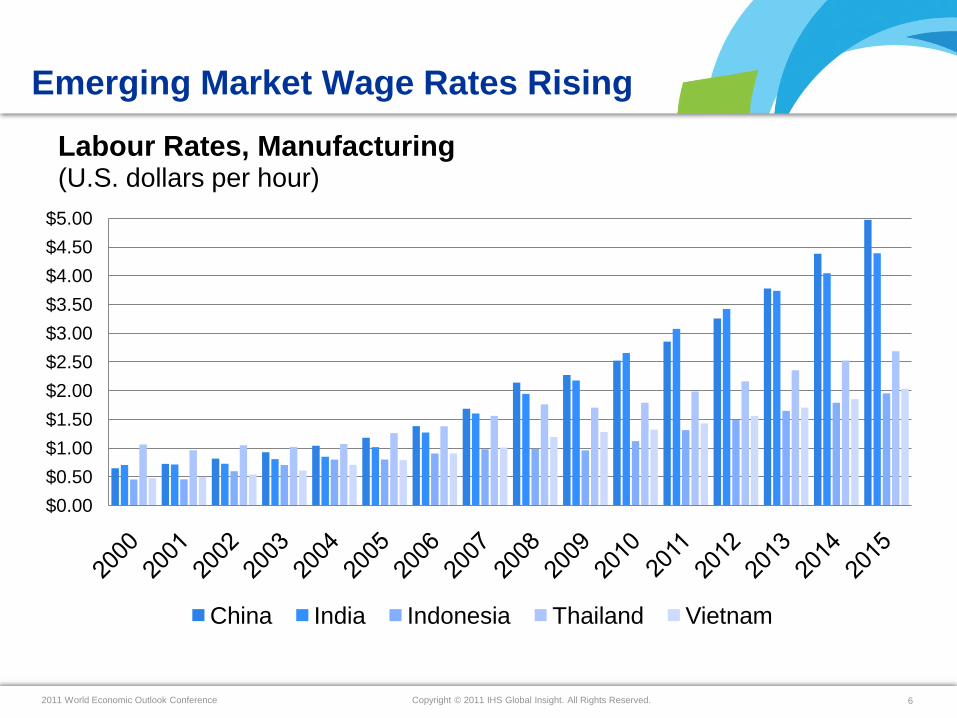
Emerging Market Wage Rates Rising
$0.00
$0.50
$1.00
$1.50
$2.00
$2.50
$3.00
$3.50
$4.00
$4.50
$5.00
Labour Rates, Manufacturing(U.S. dollars per hour)
China India Indonesia Thailand Vietnam
Assessing Supply Chain Risk
Petrochemical Industry
Presented by:
A. Borruso
Director Middle East Operations
IHS – SRI Consulting
Copyright © 2011 IHS Global Insight. All Rights Reserved.2011 World Economic Outlook Conference 8
Agenda
• Overcapacity or time to invest
• Price volatility
• Has the industry model changed
• Elasticity to crude price
Assessing Supply Chain Risk: Electronics
Impact of Japanese Disaster
Presented by:
Eric Pratt
Vice President, iSuppli
Copyright © 2011 IHS Global Insight. All Rights Reserved.2011 World Economic Outlook Conference 101010
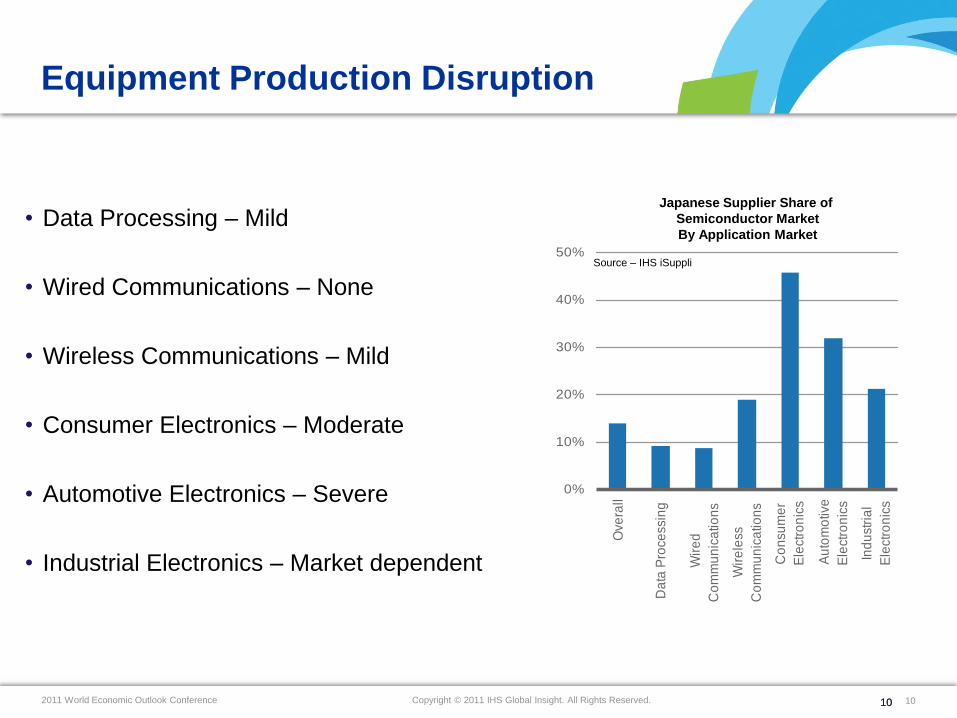
Equipment Production Disruption
• Data Processing – Mild
• Wired Communications – None
• Wireless Communications – Mild
• Consumer Electronics – Moderate
• Automotive Electronics – Severe
• Industrial Electronics – Market dependent
0%
10%
20%
30%
40%
50%
Ove
rall
Da
ta P
roce
ssin
g
Wir
ed
Co
mm
un
ica
tion
s
Wir
ele
ss
Co
mm
un
ica
tion
s
Co
nsu
me
r
Ele
ctro
nic
s
Au
tom
otiv
e
Ele
ctro
nic
s
Ind
ust
ria
l
Ele
ctro
nic
s
Japanese Supplier Share of
Semiconductor Market
By Application Market
Source – IHS iSuppli
Copyright © 2011 IHS Global Insight. All Rights Reserved.2011 World Economic Outlook Conference 11
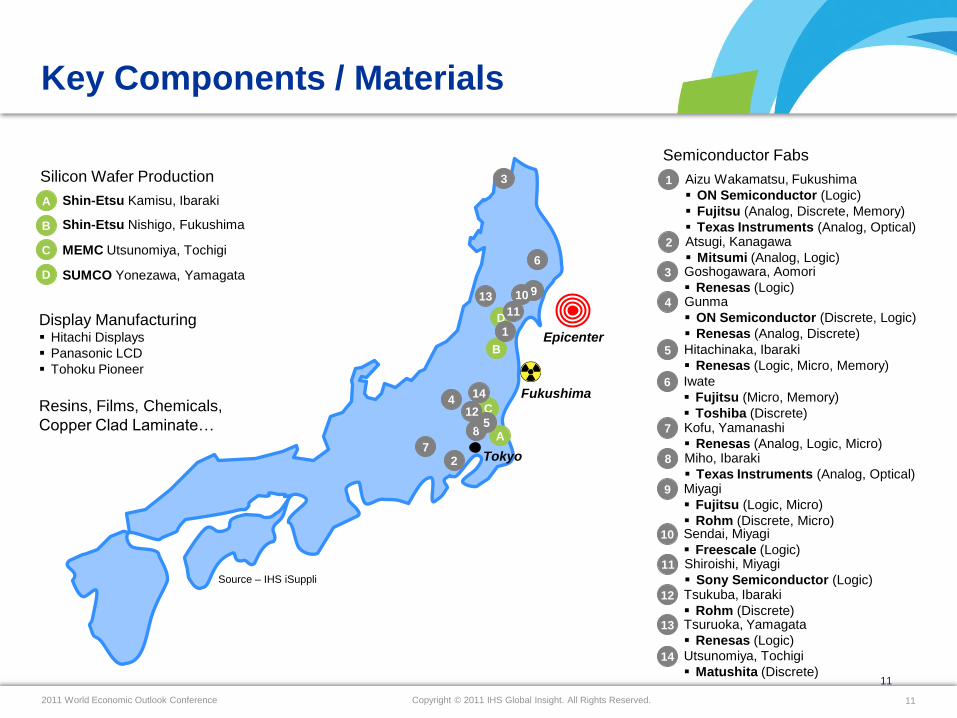
Semiconductor Fabs
1 Aizu Wakamatsu, Fukushima
ON Semiconductor (Logic)
Fujitsu (Analog, Discrete, Memory)
Texas Instruments (Analog, Optical)2 Atsugi, Kanagawa
Mitsumi (Analog, Logic)3 Goshogawara, Aomori
Renesas (Logic)4 Gunma
ON Semiconductor (Discrete, Logic)
Renesas (Analog, Discrete)
5 Hitachinaka, Ibaraki
Renesas (Logic, Micro, Memory)
6 Iwate
Fujitsu (Micro, Memory)
Toshiba (Discrete)7 Kofu, Yamanashi
Renesas (Analog, Logic, Micro)8 Miho, Ibaraki
Texas Instruments (Analog, Optical)9 Miyagi
Fujitsu (Logic, Micro)
Rohm (Discrete, Micro)10 Sendai, Miyagi
Freescale (Logic)11 Shiroishi, Miyagi
Sony Semiconductor (Logic)12 Tsukuba, Ibaraki
Rohm (Discrete)13 Tsuruoka, Yamagata
Renesas (Logic)
14 Utsunomiya, Tochigi
Matushita (Discrete)11
Key Components / Materials
Silicon Wafer Production
A
B
C
D
Shin-Etsu Kamisu, Ibaraki
Shin-Etsu Nishigo, Fukushima
MEMC Utsunomiya, Tochigi
SUMCO Yonezawa, Yamagata
Display Manufacturing Hitachi Displays
Panasonic LCD
Tohoku Pioneer
Resins, Films, Chemicals,
Copper Clad Laminate…
Fukushima
Epicenter
A
B
D
C
1
3
2
4
Tokyo7
6
85
910
11
12
14
13
Source – IHS iSuppli
Copyright © 2011 IHS Global Insight. All Rights Reserved.2011 World Economic Outlook Conference 12
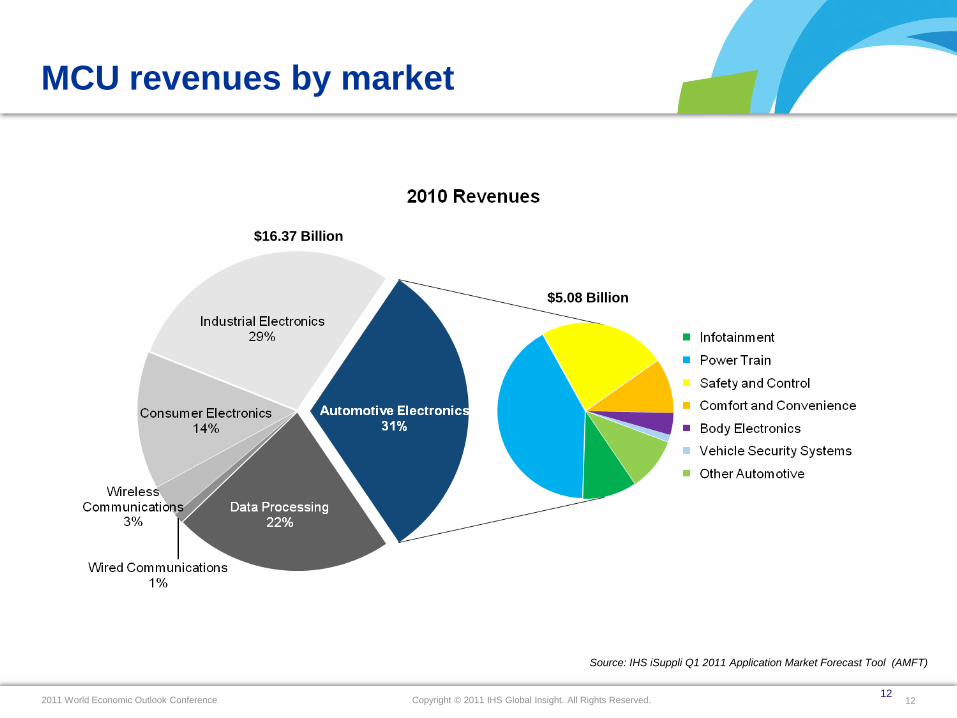
MCU revenues by market
12
Source: IHS iSuppli Q1 2011 Application Market Forecast Tool (AMFT)
$16.37 Billion
$5.08 Billion

Assessing Supply Chain Risk:
Shipping and Logistics
Presented by:
Chris Pålsson
Director, IHS Fairplay
Copyright © 2011 IHS Global Insight. All Rights Reserved.2011 World Economic Outlook Conference 14
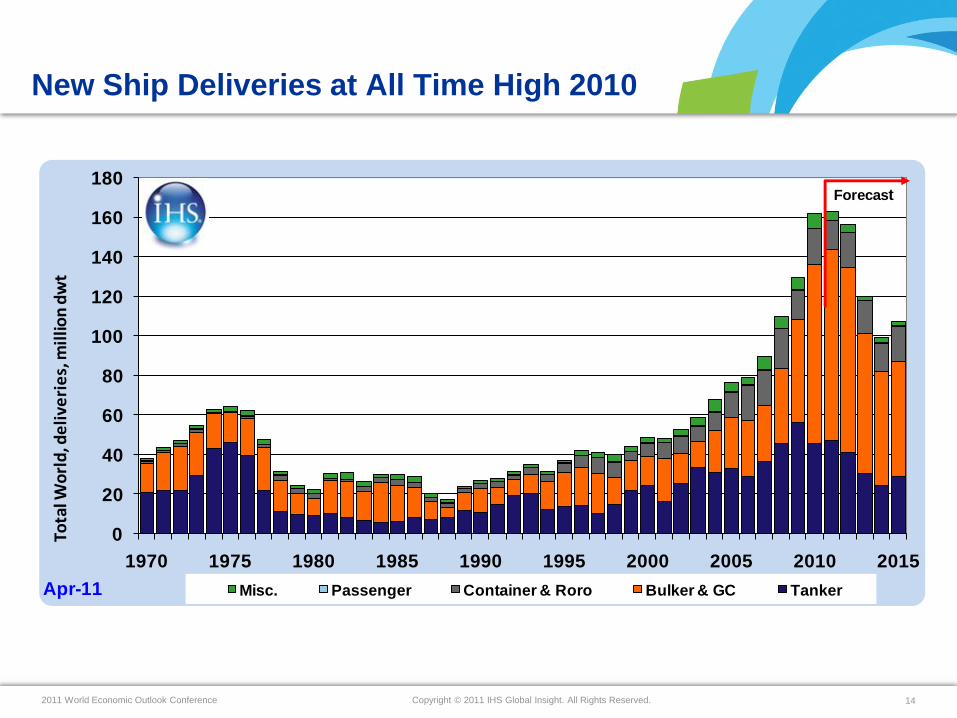
New Ship Deliveries at All Time High 2010
0
20
40
60
80
100
120
140
160
180
1970 1975 1980 1985 1990 1995 2000 2005 2010 2015
Misc. Passenger Container & Roro Bulker & GC Tanker
Forecast
Tota
l Wo
rld
, de
live
rie
s, m
illio
n d
wt
Apr-11
Copyright © 2011 IHS Global Insight. All Rights Reserved.2011 World Economic Outlook Conference 15
Ample supply of shipping capacity
Copyright © 2011 IHS Global Insight. All Rights Reserved.2011 World Economic Outlook Conference 16
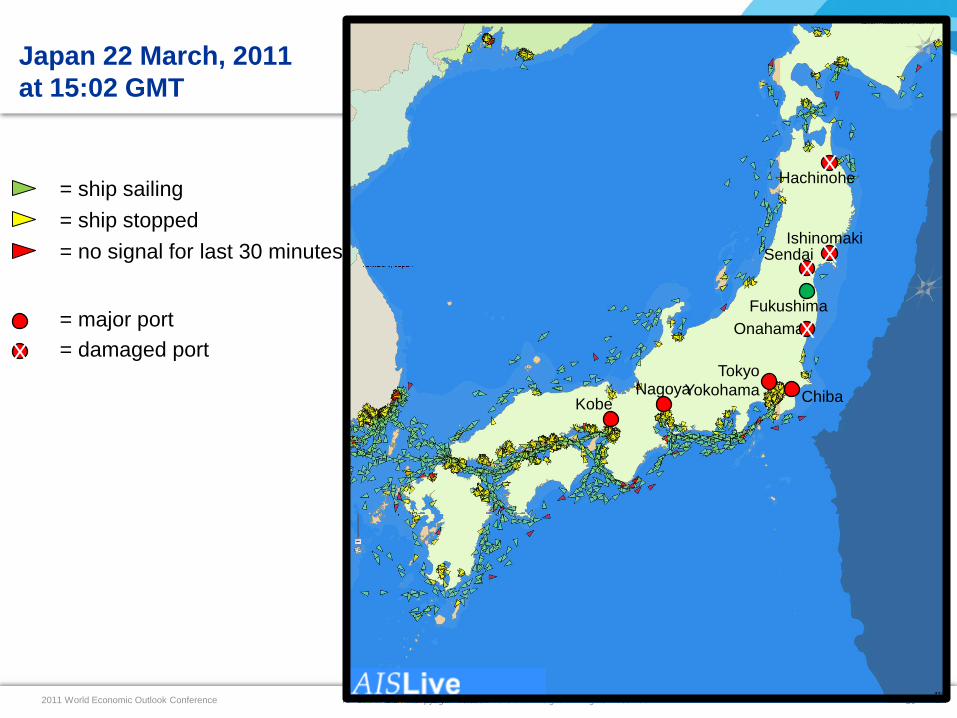
Japan 22 March, 2011
at 15:02 GMT
= ship sailing
= ship stopped
= no signal for last 30 minutes
NagoyaTokyo
Yokohama
Fukushima
ChibaKobe
XSendai
XHachinohe
XIshinomaki
OnahamaXX
= major port
= damaged port
Copyright © 2011 IHS Global Insight. All Rights Reserved.2011 World Economic Outlook Conference 17
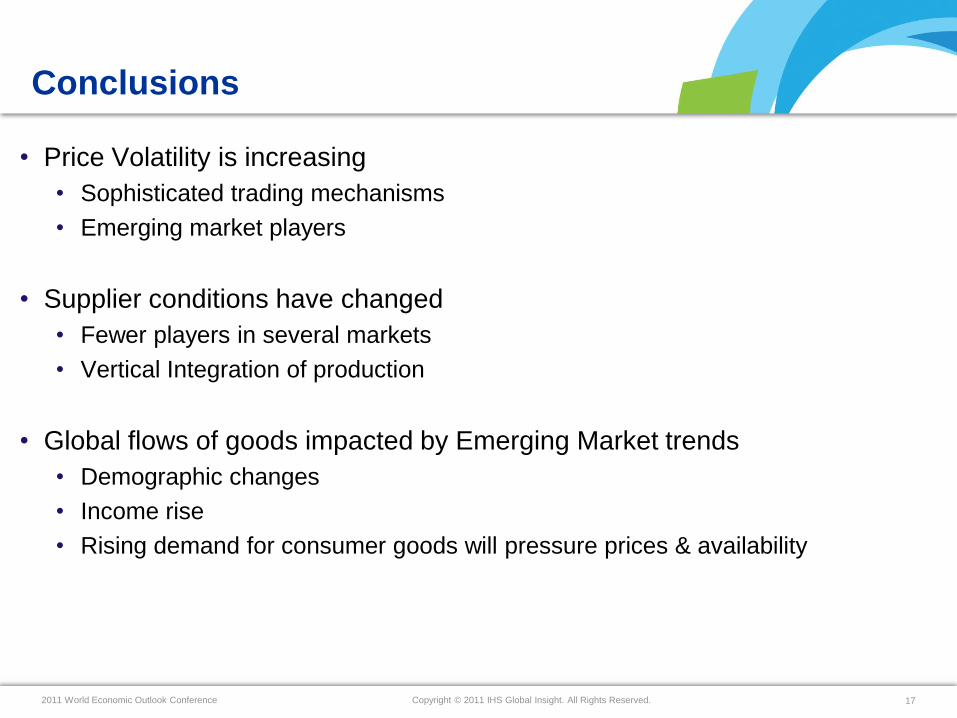
Conclusions
• Price Volatility is increasing
• Sophisticated trading mechanisms
• Emerging market players
• Supplier conditions have changed
• Fewer players in several markets
• Vertical Integration of production
• Global flows of goods impacted by Emerging Market trends
• Demographic changes
• Income rise
• Rising demand for consumer goods will pressure prices & availability
Thank You for Your Participation!
Copyright © 2011 IHS Global Insight. All Rights Reserved.2011 World Economic Outlook Conference 19
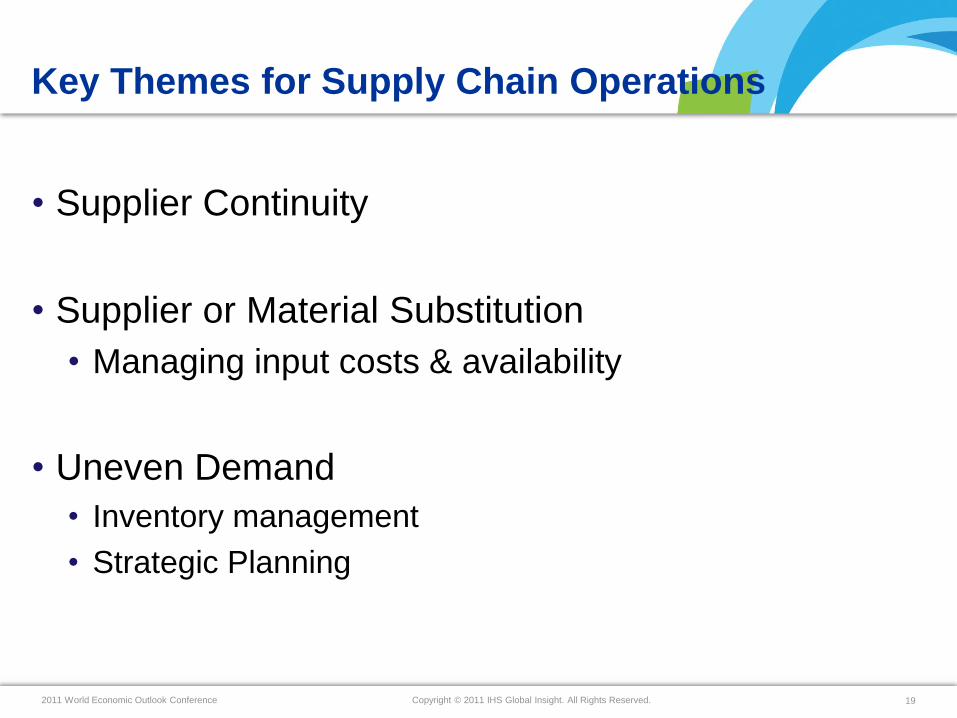
Key Themes for Supply Chain Operations
• Supplier Continuity
• Supplier or Material Substitution
• Managing input costs & availability
• Uneven Demand
• Inventory management
• Strategic Planning
Copyright © 2011 IHS Global Insight. All Rights Reserved.2011 World Economic Outlook Conference 20
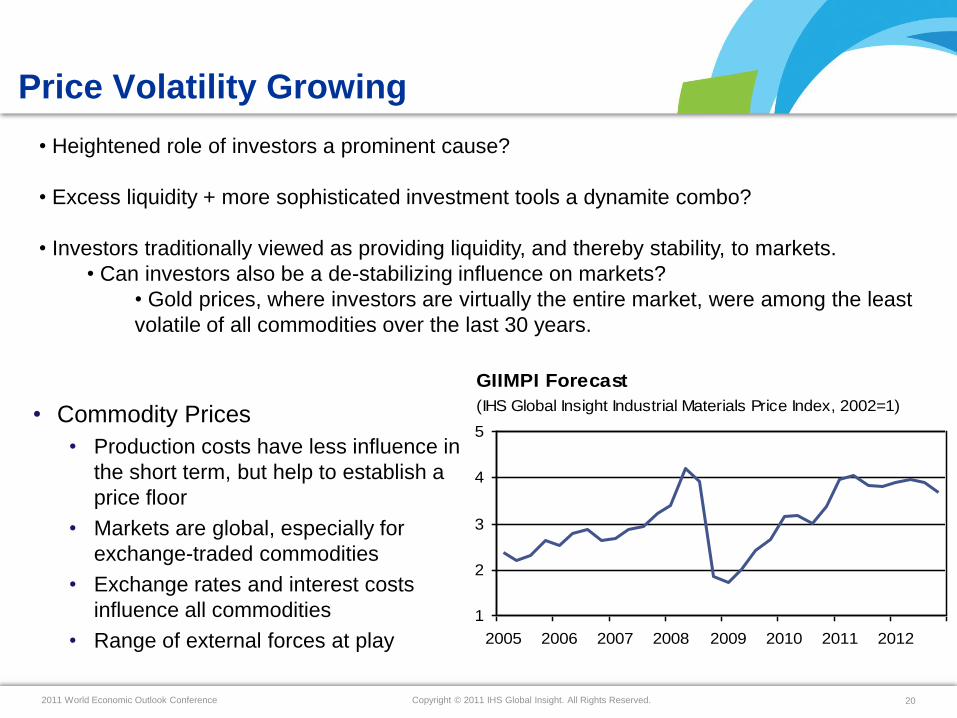
Price Volatility Growing
1
2
3
4
5
2005 2006 2007 2008 2009 2010 2011 2012
GIIMPI Forecast
(IHS Global Insight Industrial Materials Price Index, 2002=1)• Commodity Prices
• Production costs have less influence in
the short term, but help to establish a
price floor
• Markets are global, especially for
exchange-traded commodities
• Exchange rates and interest costs
influence all commodities
• Range of external forces at play
• Heightened role of investors a prominent cause?
• Excess liquidity + more sophisticated investment tools a dynamite combo?
• Investors traditionally viewed as providing liquidity, and thereby stability, to markets.
• Can investors also be a de-stabilizing influence on markets?
• Gold prices, where investors are virtually the entire market, were among the least
volatile of all commodities over the last 30 years.
Copyright © 2011 IHS Global Insight. All Rights Reserved.2011 World Economic Outlook Conference 21
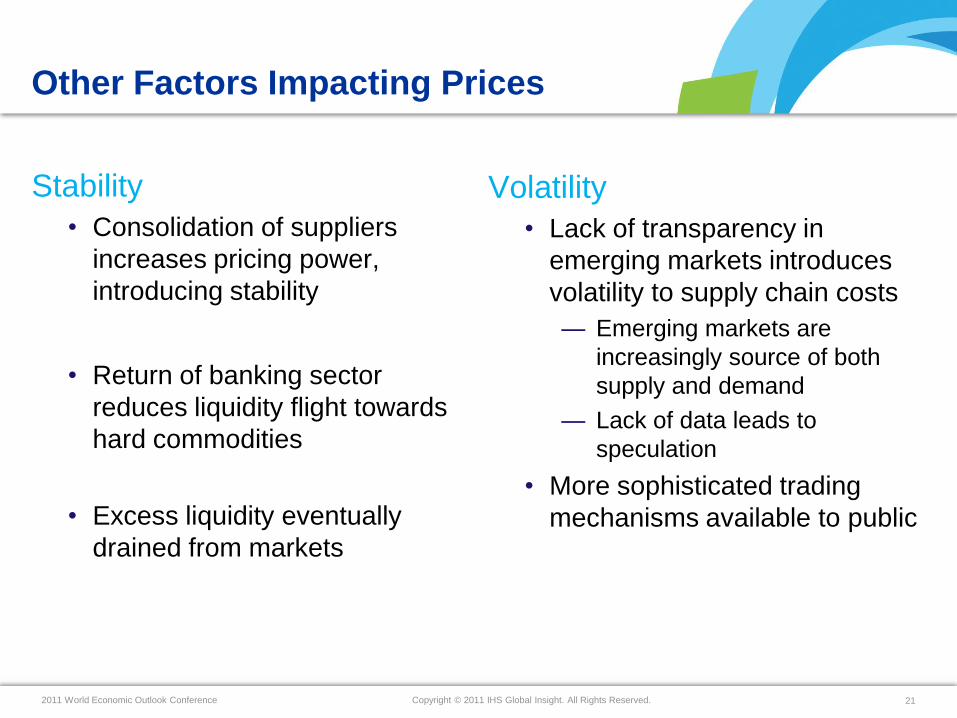
Other Factors Impacting Prices
Stability
• Consolidation of suppliers
increases pricing power,
introducing stability
• Return of banking sector
reduces liquidity flight towards
hard commodities
• Excess liquidity eventually
drained from markets
Volatility
• Lack of transparency in
emerging markets introduces
volatility to supply chain costs
— Emerging markets are
increasingly source of both
supply and demand
— Lack of data leads to
speculation
• More sophisticated trading
mechanisms available to public
Copyright © 2011 IHS Global Insight. All Rights Reserved.2011 World Economic Outlook Conference 22
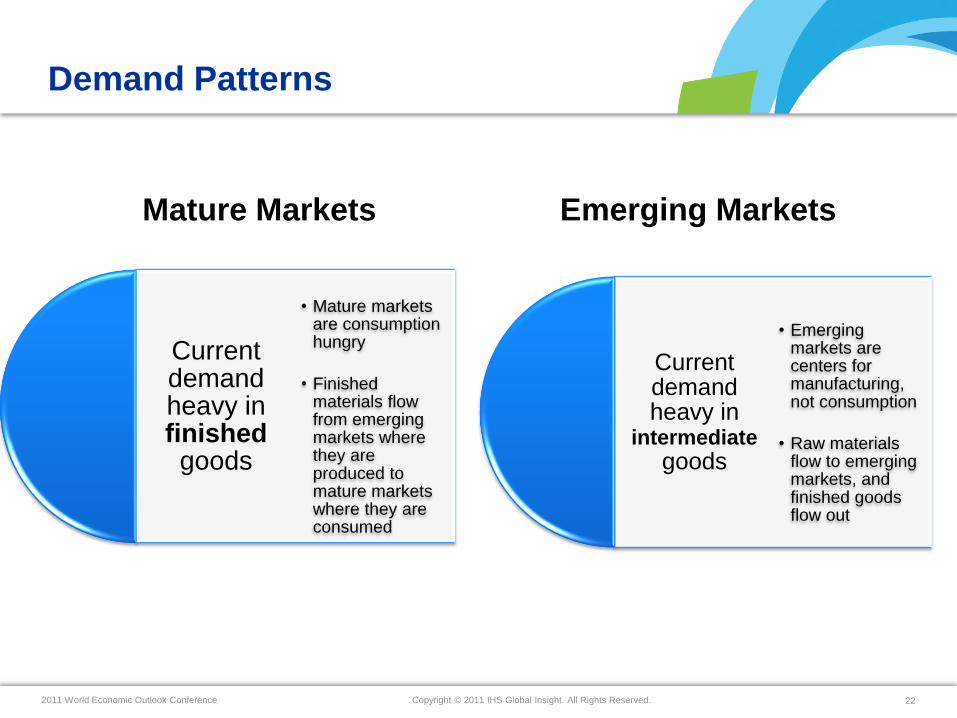
Demand Patterns
Mature Markets Emerging Markets
Current demand heavy in
intermediategoods
• Emerging markets are centers for manufacturing, not consumption
• Raw materials flow to emerging markets, and finished goods flow out
Current demand heavy in finishedgoods
• Mature markets are consumption hungry
• Finished materials flow from emerging markets where they are produced to mature markets where they are consumed
Copyright © 2011 IHS Global Insight. All Rights Reserved.2011 World Economic Outlook Conference 23
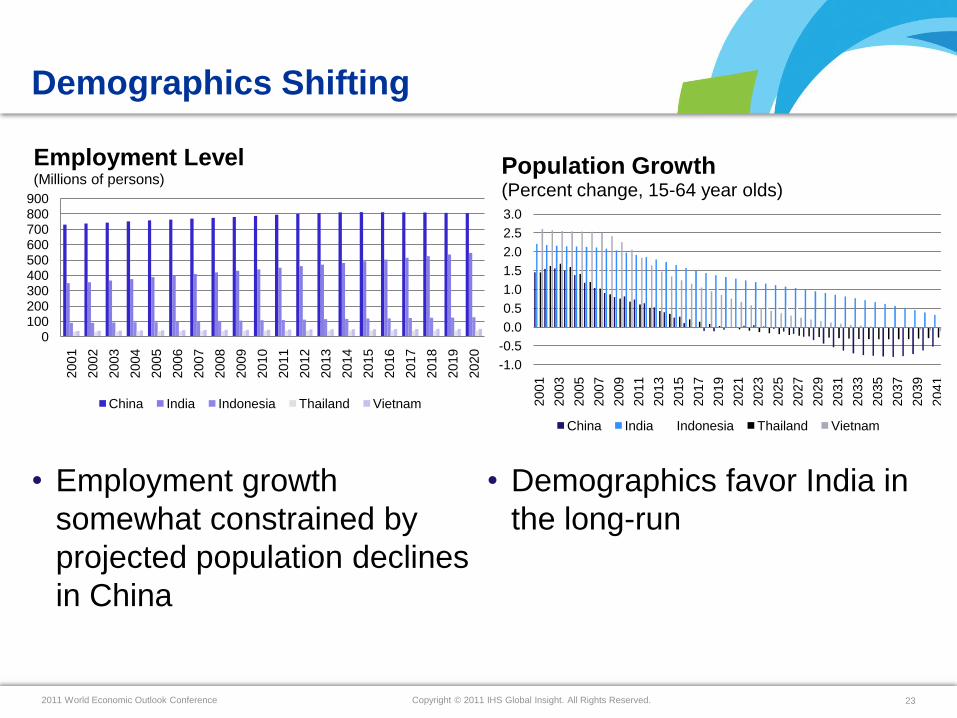
Demographics Shifting
• Demographics favor India in
the long-run
• Employment growth
somewhat constrained by
projected population declines
in China
-1.0
-0.5
0.0
0.5
1.0
1.5
2.0
2.5
3.0
2001
2003
2005
2007
2009
2011
2013
2015
2017
2019
2021
2023
2025
2027
2029
2031
2033
2035
2037
2039
2041
Population Growth(Percent change, 15-64 year olds)
China India Indonesia Thailand Vietnam
0100200300400500600700800900
2001
2002
2003
2004
2005
2006
2007
2008
2009
2010
2011
2012
2013
2014
2015
2016
2017
2018
2019
2020
Employment Level(Millions of persons)
China India Indonesia Thailand Vietnam
Copyright © 2011 IHS Global Insight. All Rights Reserved.2011 World Economic Outlook Conference 24
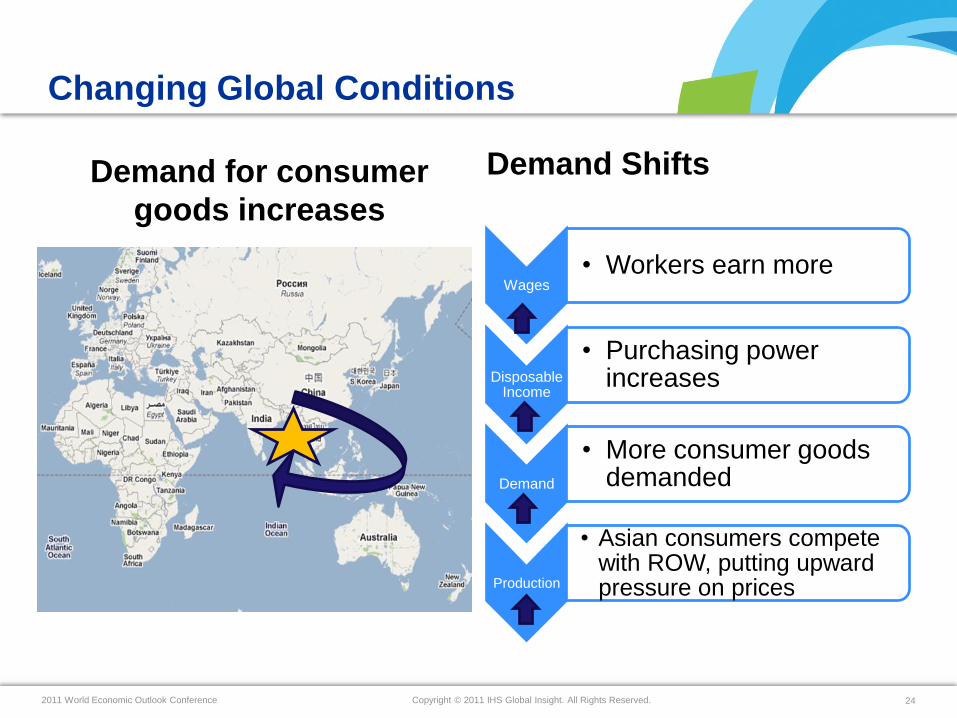
Changing Global Conditions
Demand for consumer
goods increases
Demand Shifts
Wages • Workers earn more
Disposable Income
• Purchasing power increases
Demand
• More consumer goods demanded
Production
• Asian consumers compete with ROW, putting upward pressure on prices
Copyright © 2011 IHS Global Insight. All Rights Reserved.2011 World Economic Outlook Conference 25
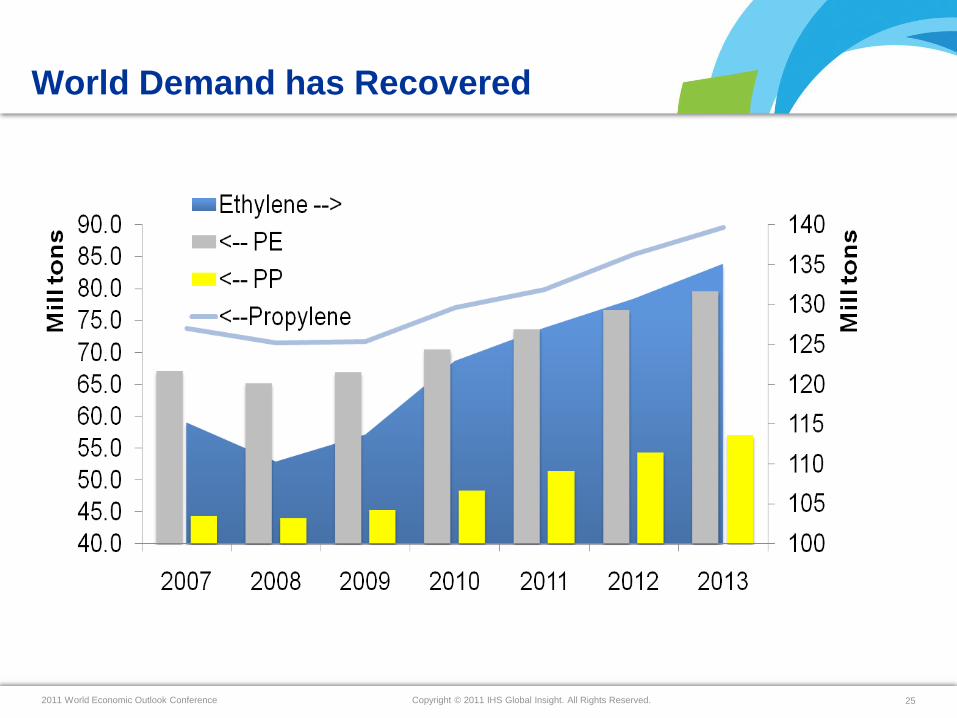
World Demand has Recovered
Copyright © 2011 IHS Global Insight. All Rights Reserved.2011 World Economic Outlook Conference 26
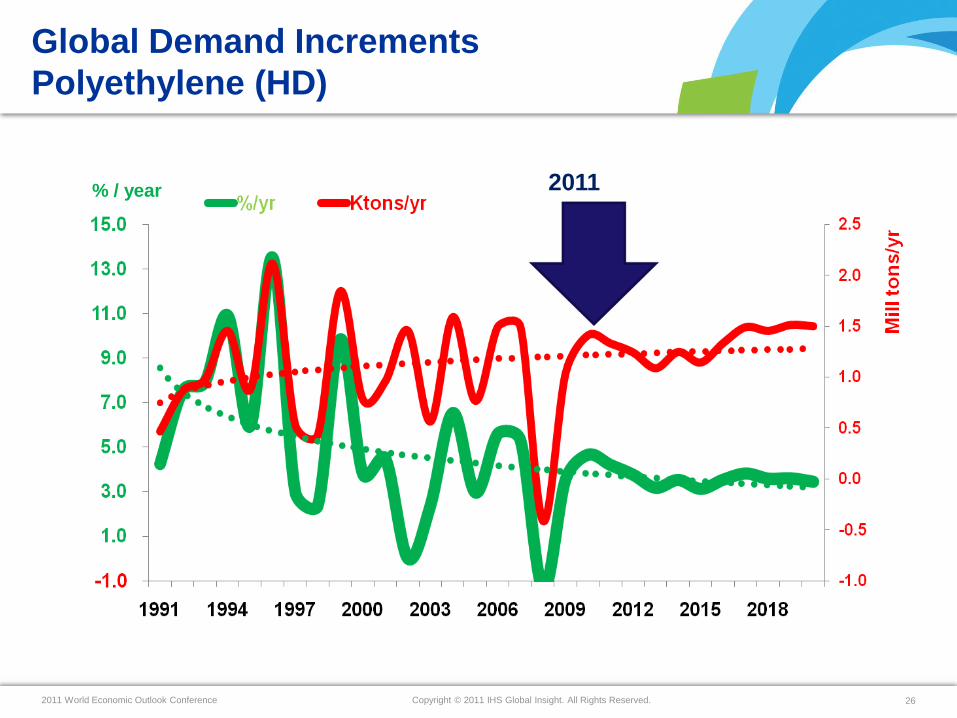
Global Demand Increments
Polyethylene (HD)
% / year 2011
Copyright © 2011 IHS Global Insight. All Rights Reserved.2011 World Economic Outlook Conference 27
0
20
40
60
80
100
120
140
160
180
0.0
2.0
4.0
6.0
8.0
10.0
12.0
1990199219941996199820002002200420062008201020122014201620182020
Mil
lio
n t
on
s
Announced Capacity
% Spare
avg 1990 -12
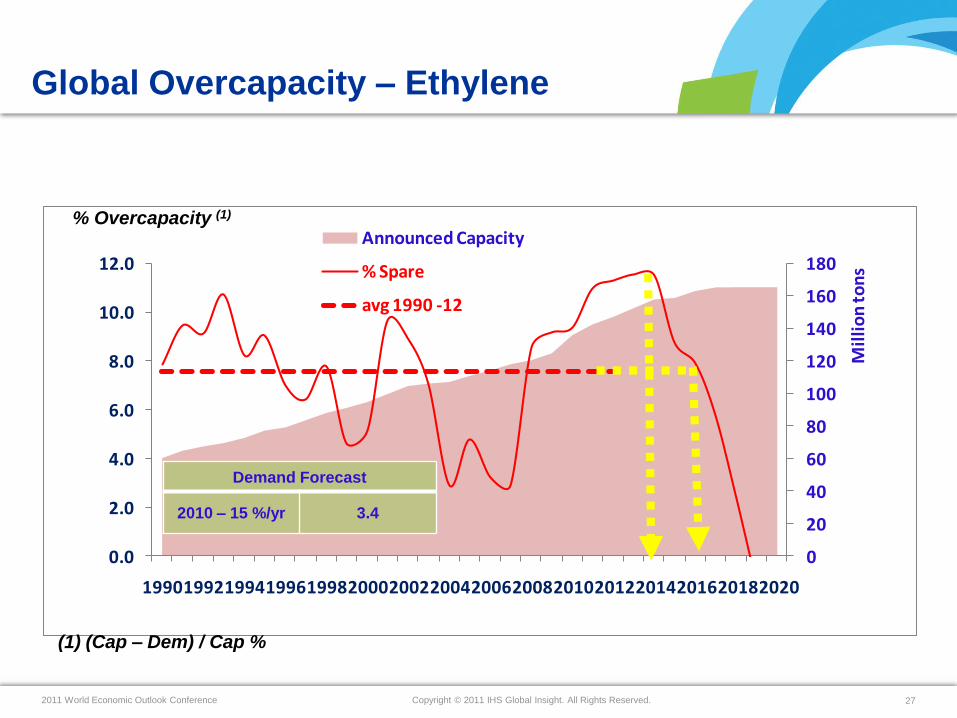
Global Overcapacity – Ethylene
% Overcapacity (1)
(1) (Cap – Dem) / Cap %
Demand Forecast
2010 – 15 %/yr 3.4
Copyright © 2011 IHS Global Insight. All Rights Reserved.2011 World Economic Outlook Conference 28
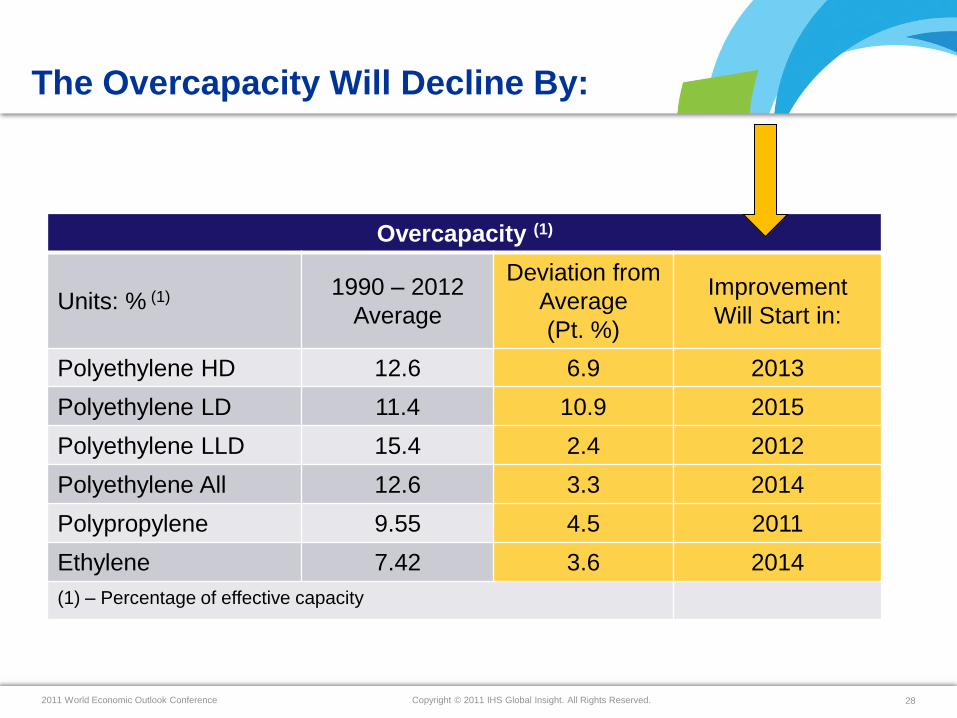
The Overcapacity Will Decline By:
Overcapacity (1)
Units: % (1) 1990 – 2012
Average
Deviation from
Average
(Pt. %)
Improvement
Will Start in:
Polyethylene HD 12.6 6.9 2013
Polyethylene LD 11.4 10.9 2015
Polyethylene LLD 15.4 2.4 2012
Polyethylene All 12.6 3.3 2014
Polypropylene 9.55 4.5 2011
Ethylene 7.42 3.6 2014
(1) – Percentage of effective capacity
Copyright © 2011 IHS Global Insight. All Rights Reserved.2011 World Economic Outlook Conference 29
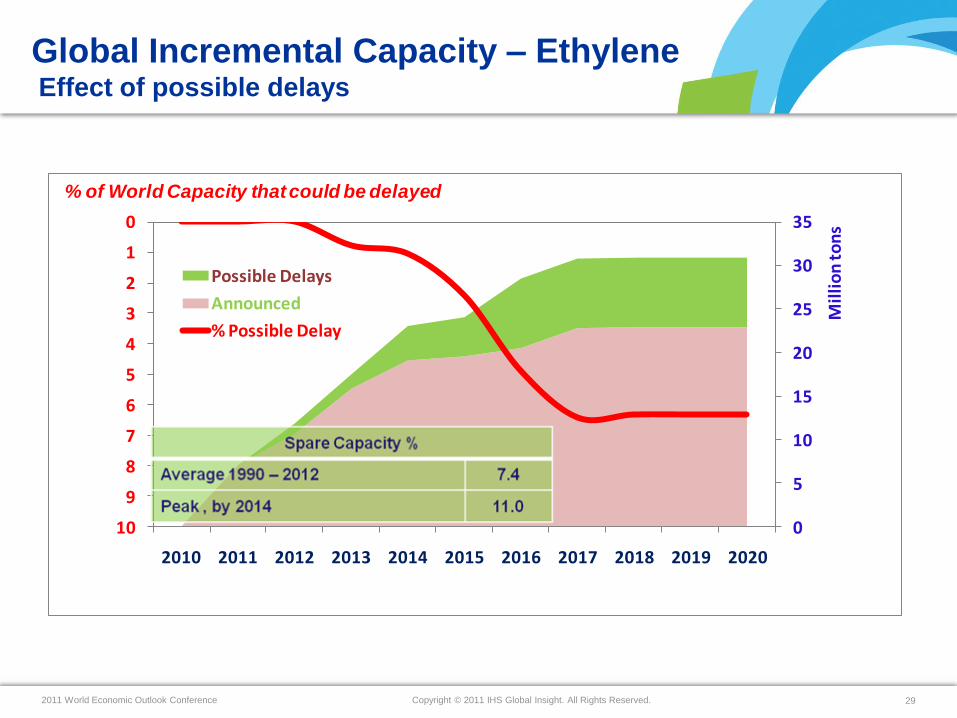
0
5
10
15
20
25
30
350
1
2
3
4
5
6
7
8
9
10
2010 2011 2012 2013 2014 2015 2016 2017 2018 2019 2020
Mil
lio
n t
on
s
Possible Delays
Announced
% Possible Delay
% of World Capacity that could be delayed
Global Incremental Capacity – EthyleneEffect of possible delays
Copyright © 2011 IHS Global Insight. All Rights Reserved.2011 World Economic Outlook Conference 30
What This Means for the Industry
• The predicted oversupply did not materialize as predicted
• Demand recovery appears faster than predicted in Q4 2010
• We need to reconsider when to return to the drawing board
• Accelerators:
• Increasing frequency of plant outages
• Delays of new projects
• Shut down of obsolete capacity
• Risks and mitigating factors
• Side effects of higher crude price
• Slow down of the economic recovery
• Unpredicted impact from Japanese economy
Copyright © 2011 IHS Global Insight. All Rights Reserved.2011 World Economic Outlook Conference 31
PRICE VOLATILITY

Copyright © 2011 IHS Global Insight. All Rights Reserved.2011 World Economic Outlook Conference 32
Price Volatility Has Been Increasing
• Contributing Factors
• Crude price is now dependent on perception rather than actual S/D and
extraction costs
• Increased average plant scale and business Interruptions
• Information is now global –> ripple waves –> uncertainty –> price swings
• The commodity market has lost its traditional price reference
• More frequent plant outages
• On line deliveries across the chain
• Remedies?
• Commodity vs. Specialties
• Producers discipline
• Further Consolidation?
Implications for Buyers
•Difficult to predict
•Transactions terms even shorter
•Increasing difficulty to manage
Copyright © 2011 IHS Global Insight. All Rights Reserved.2011 World Economic Outlook Conference 33
HAS THE INDUSTRY MODEL
CHANGED?
Copyright © 2011 IHS Global Insight. All Rights Reserved.2011 World Economic Outlook Conference 34
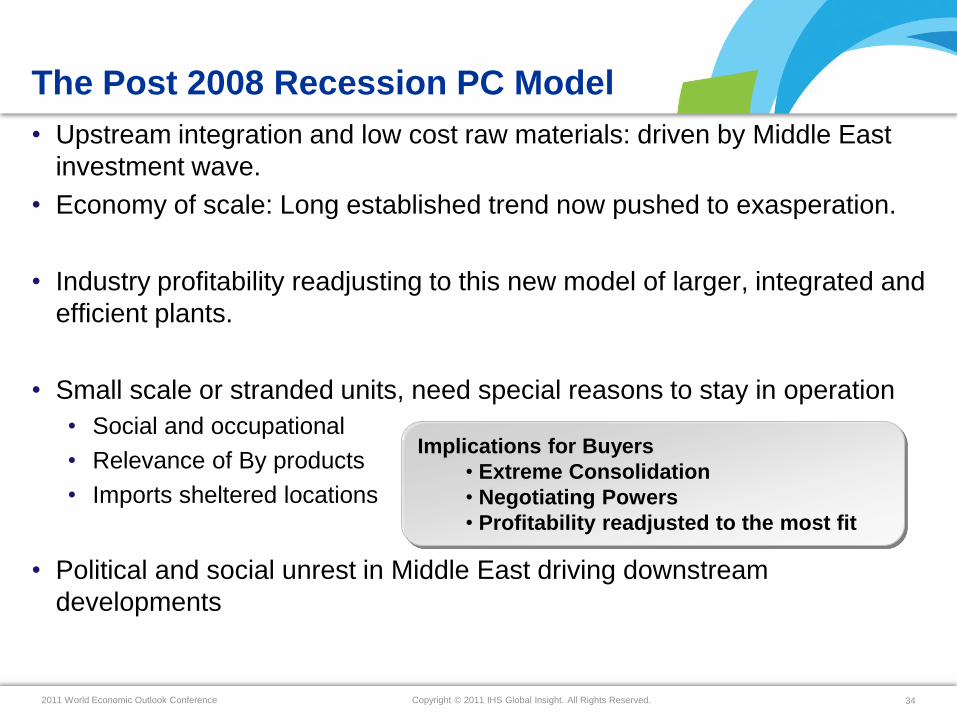
The Post 2008 Recession PC Model
• Upstream integration and low cost raw materials: driven by Middle East
investment wave.
• Economy of scale: Long established trend now pushed to exasperation.
• Industry profitability readjusting to this new model of larger, integrated and
efficient plants.
• Small scale or stranded units, need special reasons to stay in operation
• Social and occupational
• Relevance of By products
• Imports sheltered locations
• Political and social unrest in Middle East driving downstream
developments
Implications for Buyers
• Extreme Consolidation
• Negotiating Powers
• Profitability readjusted to the most fit
Copyright © 2011 IHS Global Insight. All Rights Reserved.2011 World Economic Outlook Conference 35
ELASTICITY TO CRUDE PRICE
Copyright © 2011 IHS Global Insight. All Rights Reserved.2011 World Economic Outlook Conference 36
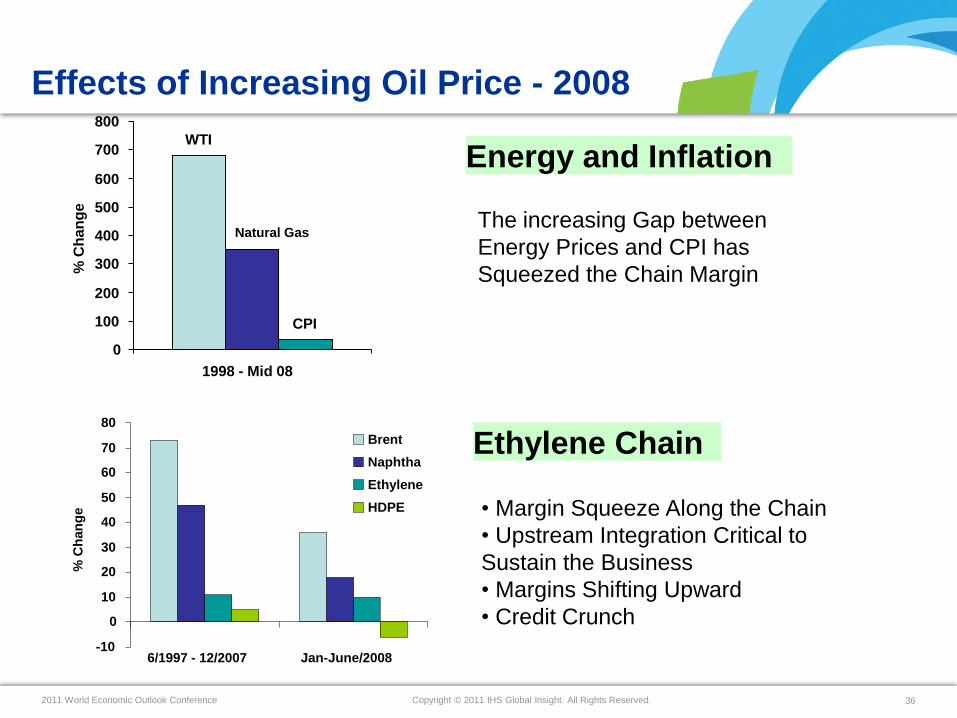
Increasing Oil Price Effects
Energy and Inflation
The increasing Gap between
Energy Prices and CPI has
Squeezed the Chain Margin
WTI
CPI
Natural Gas
0
100
200
300
400
500
600
700
800
1998 - Mid 08
% C
han
ge
Ethylene Chain
• Margin Squeeze Along the Chain
• Upstream Integration Critical to
Sustain the Business
• Margins Shifting Upward
• Credit Crunch
-10
0
10
20
30
40
50
60
70
80
6/1997 - 12/2007 Jan-June/2008
% C
han
ge
Brent
Naphtha
Ethylene
HDPE
Effects of Increasing Oil Price - 2008
Copyright © 2011 IHS Global Insight. All Rights Reserved.2011 World Economic Outlook Conference 37
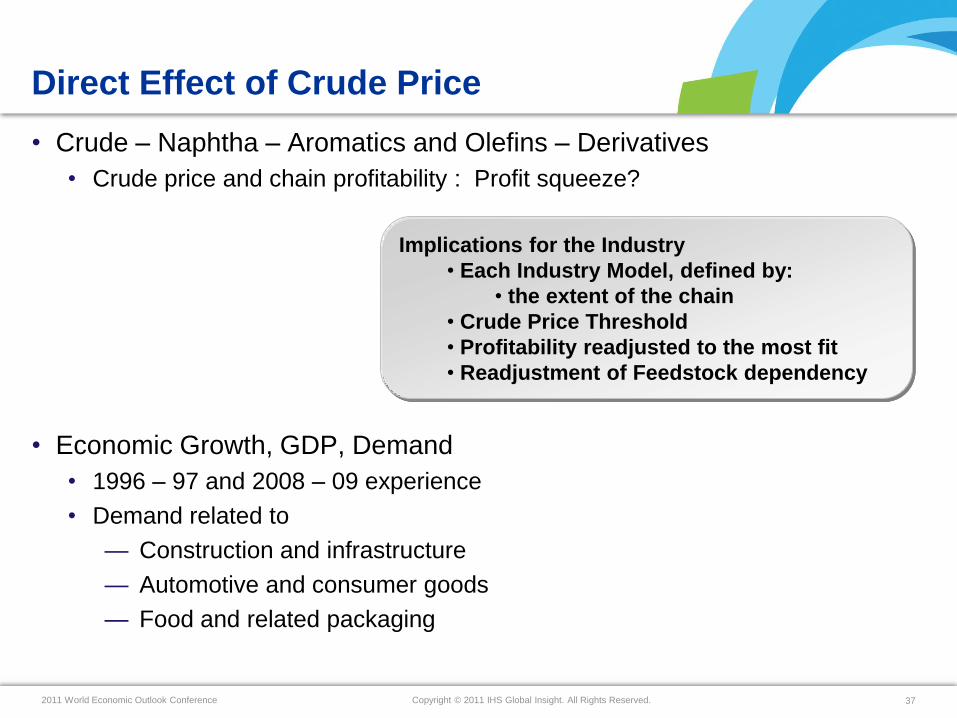
Direct Effect of Crude Price
• Crude – Naphtha – Aromatics and Olefins – Derivatives
• Crude price and chain profitability : Profit squeeze?
• Economic Growth, GDP, Demand
• 1996 – 97 and 2008 – 09 experience
• Demand related to
— Construction and infrastructure
— Automotive and consumer goods
— Food and related packaging
Implications for the Industry
• Each Industry Model, defined by:
• the extent of the chain
• Crude Price Threshold
• Profitability readjusted to the most fit
• Readjustment of Feedstock dependency
Copyright © 2011 IHS Global Insight. All Rights Reserved.2011 World Economic Outlook Conference 38
Summary
• Demand has recovered and we should refocus on
opportunities
• Few factors may quickly turn around the supply demand
outlook
• Still few clouds in the short terms
• Political uncertainty
• Energy outlook
• Economic growth in the West
• Sustainability of Asian growth
• Price Volatility: becoming integral part of industry trends
• Crude and Economic growth appear countercyclical ??
• Crude price and profitability: will drive substantial changes in
the feedstock
Copyright © 2011 IHS Global Insight. All Rights Reserved.2011 World Economic Outlook Conference 393939
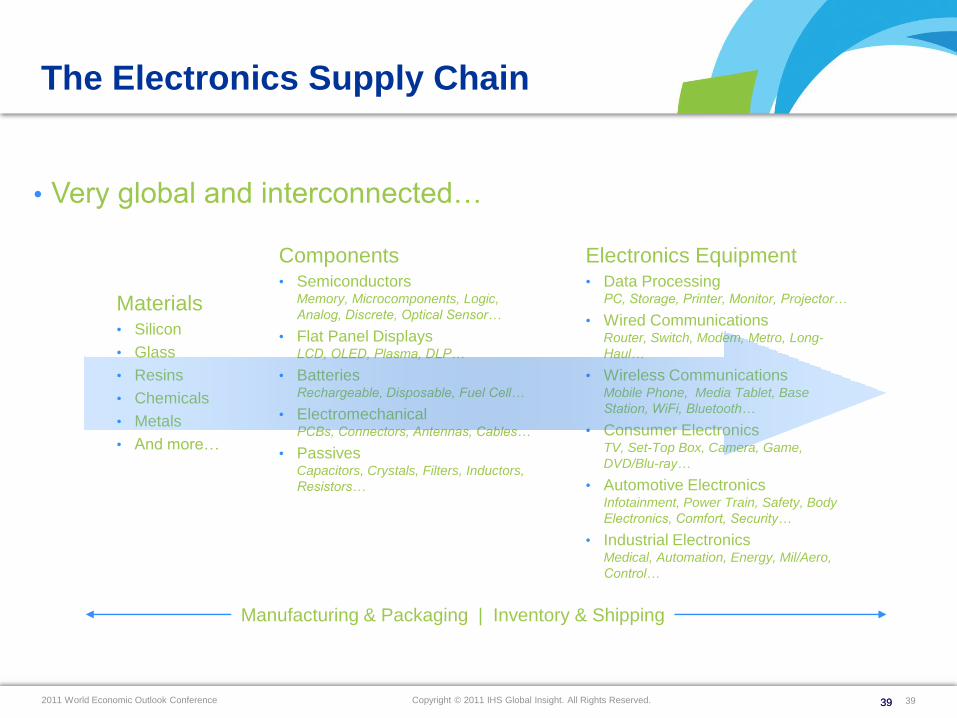
The Electronics Supply Chain
• Very global and interconnected…
Electronics Equipment• Data Processing
PC, Storage, Printer, Monitor, Projector…
• Wired CommunicationsRouter, Switch, Modem, Metro, Long-
Haul…
• Wireless CommunicationsMobile Phone, Media Tablet, Base
Station, WiFi, Bluetooth…
• Consumer ElectronicsTV, Set-Top Box, Camera, Game,
DVD/Blu-ray…
• Automotive ElectronicsInfotainment, Power Train, Safety, Body
Electronics, Comfort, Security…
• Industrial ElectronicsMedical, Automation, Energy, Mil/Aero,
Control…
Components• Semiconductors
Memory, Microcomponents, Logic,
Analog, Discrete, Optical Sensor…
• Flat Panel DisplaysLCD, OLED, Plasma, DLP…
• BatteriesRechargeable, Disposable, Fuel Cell…
• ElectromechanicalPCBs, Connectors, Antennas, Cables…
• PassivesCapacitors, Crystals, Filters, Inductors,
Resistors…
Materials• Silicon
• Glass
• Resins
• Chemicals
• Metals
• And more…
Manufacturing & Packaging | Inventory & Shipping
Copyright © 2011 IHS Global Insight. All Rights Reserved.2011 World Economic Outlook Conference 40
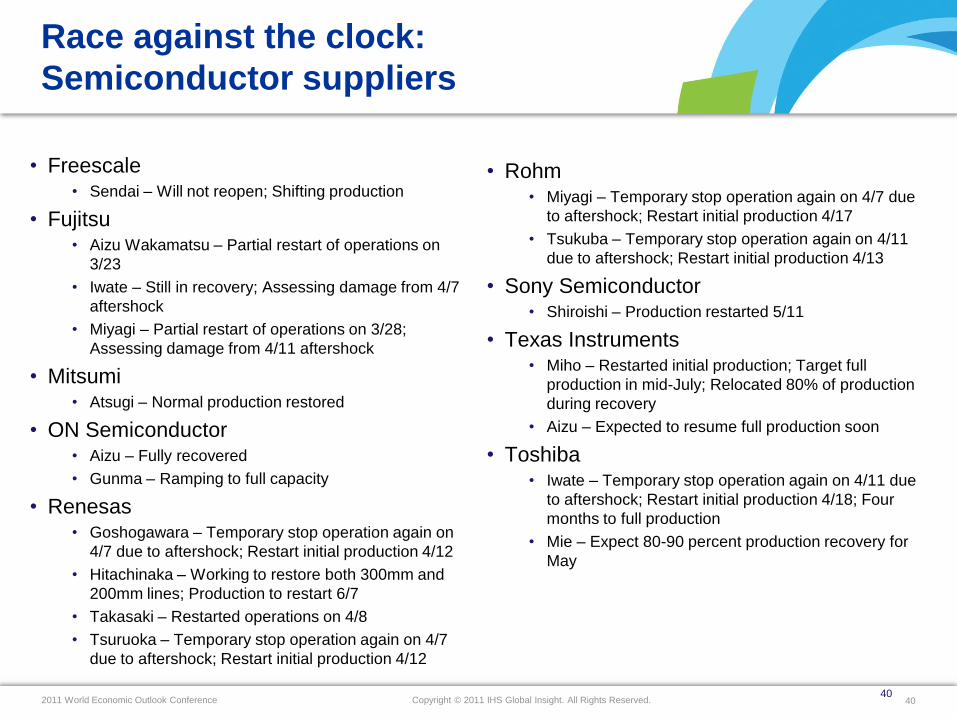
Race against the clock:
Semiconductor suppliers
• Freescale• Sendai – Will not reopen; Shifting production
• Fujitsu• Aizu Wakamatsu – Partial restart of operations on
3/23
• Iwate – Still in recovery; Assessing damage from 4/7
aftershock
• Miyagi – Partial restart of operations on 3/28;
Assessing damage from 4/11 aftershock
• Mitsumi• Atsugi – Normal production restored
• ON Semiconductor• Aizu – Fully recovered
• Gunma – Ramping to full capacity
• Renesas• Goshogawara – Temporary stop operation again on
4/7 due to aftershock; Restart initial production 4/12
• Hitachinaka – Working to restore both 300mm and
200mm lines; Production to restart 6/7
• Takasaki – Restarted operations on 4/8
• Tsuruoka – Temporary stop operation again on 4/7
due to aftershock; Restart initial production 4/12
• Rohm• Miyagi – Temporary stop operation again on 4/7 due
to aftershock; Restart initial production 4/17
• Tsukuba – Temporary stop operation again on 4/11
due to aftershock; Restart initial production 4/13
• Sony Semiconductor• Shiroishi – Production restarted 5/11
• Texas Instruments• Miho – Restarted initial production; Target full
production in mid-July; Relocated 80% of production
during recovery
• Aizu – Expected to resume full production soon
• Toshiba• Iwate – Temporary stop operation again on 4/11 due
to aftershock; Restart initial production 4/18; Four
months to full production
• Mie – Expect 80-90 percent production recovery for
May
40
Copyright © 2011 IHS Global Insight. All Rights Reserved.2011 World Economic Outlook Conference 41
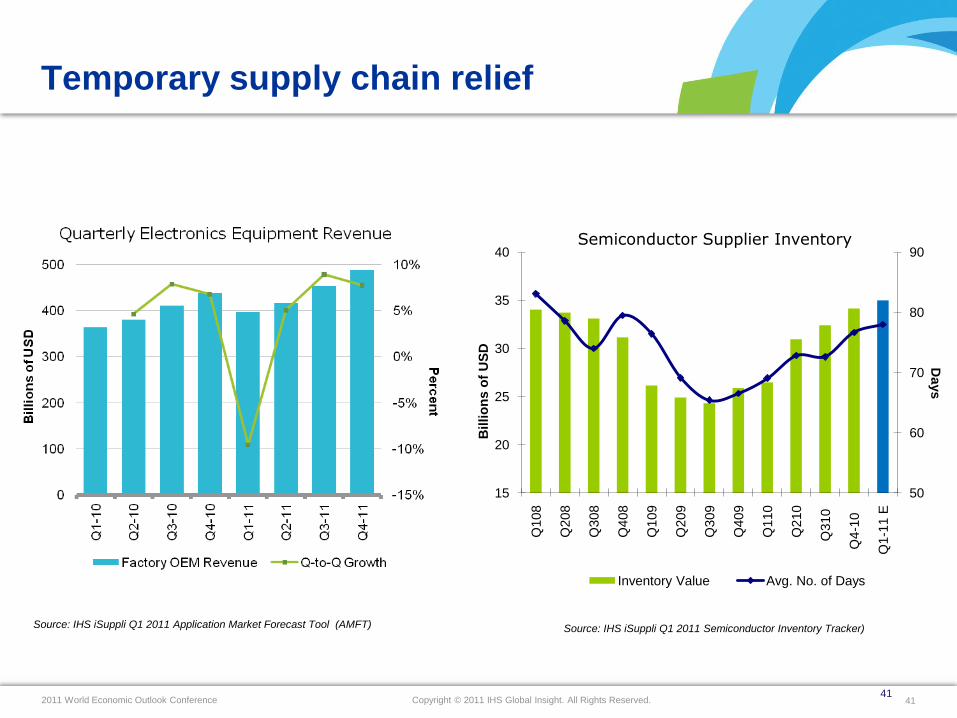
Temporary supply chain relief
50
60
70
80
90
15
20
25
30
35
40
Q108
Q208
Q308
Q408
Q109
Q209
Q309
Q409
Q110
Q210
Q310
Q4
-10
Q1-1
1 E
Days
Billio
ns o
f U
SD
Semiconductor Supplier Inventory
Inventory Value Avg. No. of Days
Source: IHS iSuppli Q1 2011 Application Market Forecast Tool (AMFT) Source: IHS iSuppli Q1 2011 Semiconductor Inventory Tracker)
41
Copyright © 2011 IHS Global Insight. All Rights Reserved.2011 World Economic Outlook Conference 424242
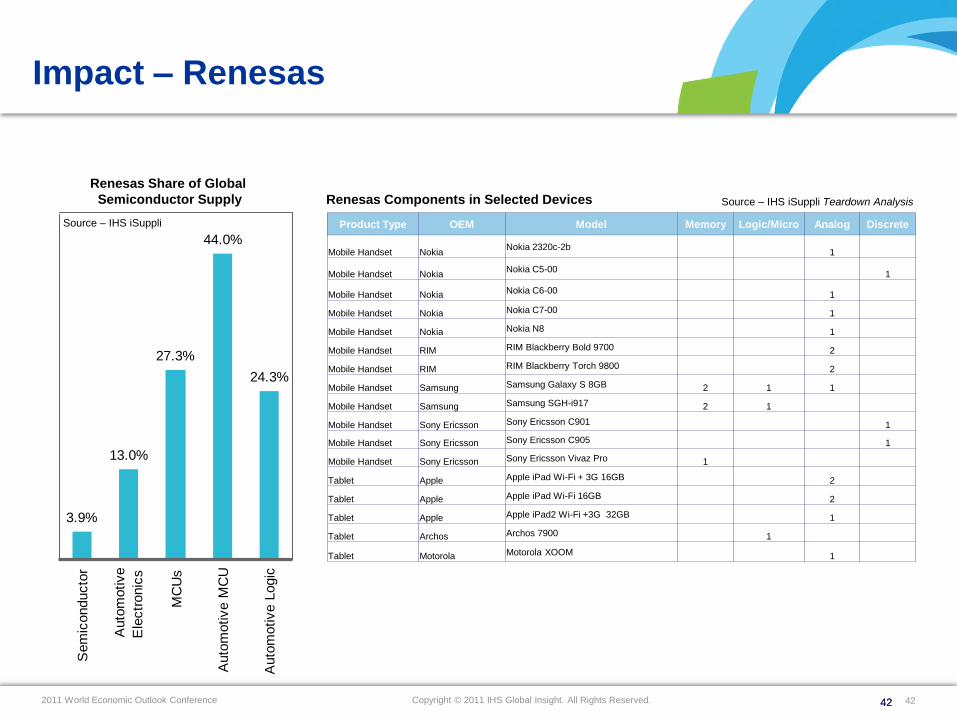
Impact – Renesas
Product Type OEM Model Memory Logic/Micro Analog Discrete
Mobile Handset NokiaNokia 2320c-2b
1
Mobile Handset NokiaNokia C5-00
1
Mobile Handset Nokia Nokia C6-00 1
Mobile Handset Nokia Nokia C7-00 1
Mobile Handset Nokia Nokia N8 1
Mobile Handset RIM RIM Blackberry Bold 9700 2
Mobile Handset RIM RIM Blackberry Torch 9800 2
Mobile Handset Samsung Samsung Galaxy S 8GB 2 1 1
Mobile Handset Samsung Samsung SGH-i917 2 1
Mobile Handset Sony Ericsson Sony Ericsson C901 1
Mobile Handset Sony Ericsson Sony Ericsson C905 1
Mobile Handset Sony Ericsson Sony Ericsson Vivaz Pro 1
Tablet Apple Apple iPad Wi-Fi + 3G 16GB 2
Tablet Apple Apple iPad Wi-Fi 16GB 2
Tablet Apple Apple iPad2 Wi-Fi +3G 32GB 1
Tablet Archos Archos 7900 1
Tablet Motorola Motorola XOOM 1
Renesas Components in Selected Devices Source – IHS iSuppli Teardown Analysis
3.9%
13.0%
27.3%
44.0%
24.3%
Sem
iconducto
r
Auto
motive
Ele
ctr
onic
s
MC
Us
Auto
motive M
CU
Auto
motive L
ogic
Renesas Share of Global
Semiconductor Supply
Source – IHS iSuppli
Copyright © 2011 IHS Global Insight. All Rights Reserved.2011 World Economic Outlook Conference 43
Japan and trade with goods
Container
• Some container ports
damaged
• Negative impact on exports
& imports
• Knock-on effects, e.g.
China’s electronic industry
Vehicles
• Japanese car exports falls
• Need for heavy vehicles
Copyright © 2011 IHS Global Insight. All Rights Reserved.2011 World Economic Outlook Conference 44
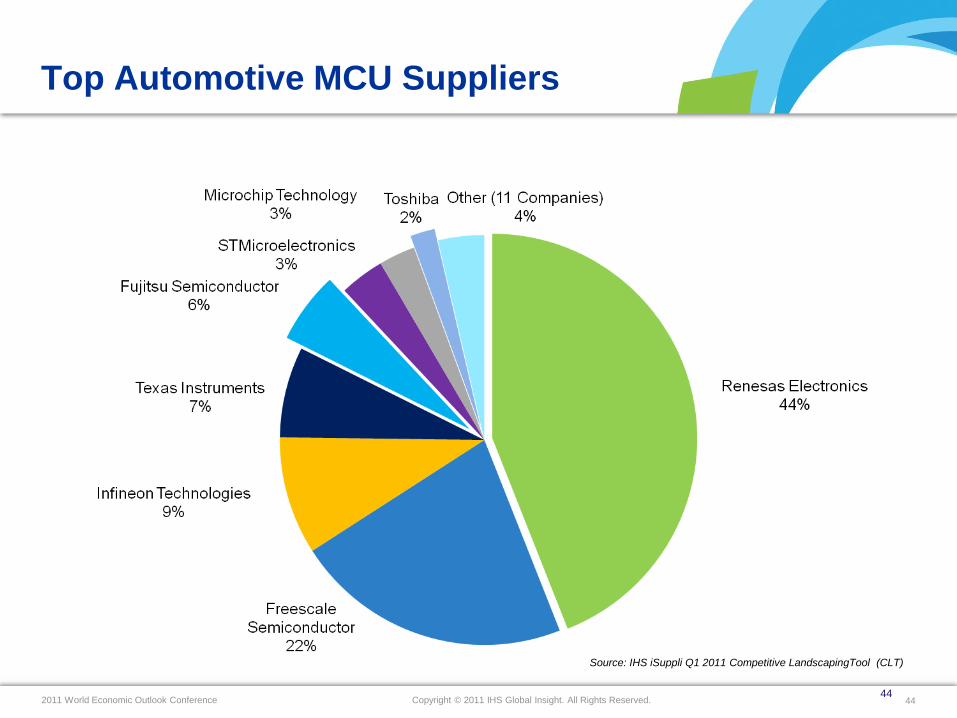
Top Automotive MCU Suppliers
44
Source: IHS iSuppli Q1 2011 Competitive LandscapingTool (CLT)
Copyright © 2011 IHS Global Insight. All Rights Reserved.2011 World Economic Outlook Conference 45
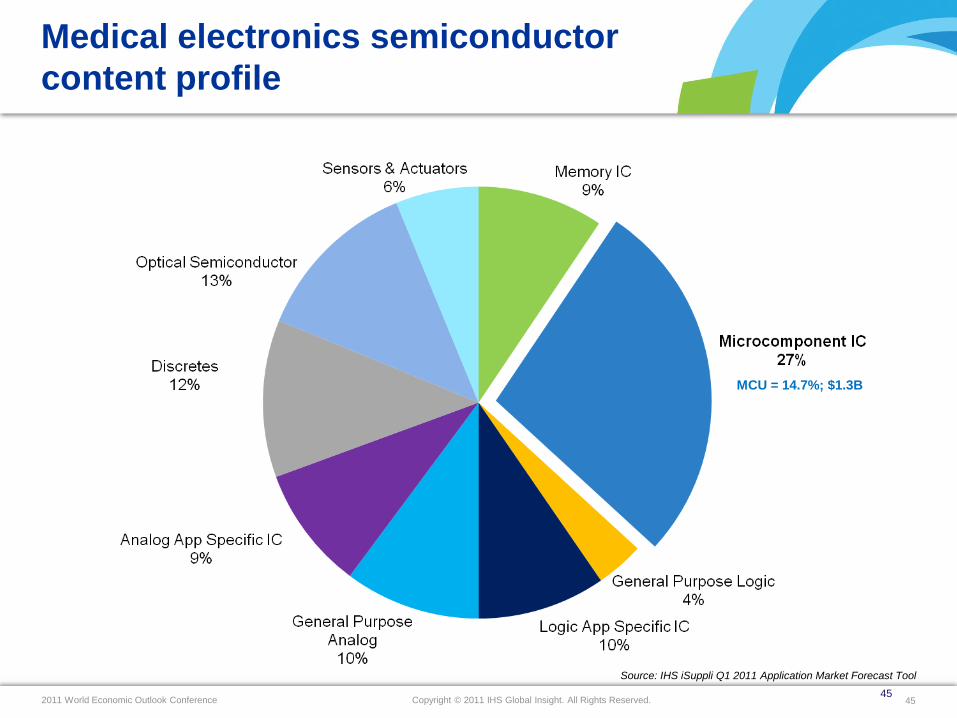
Medical electronics semiconductor
content profile
45
Source: IHS iSuppli Q1 2011 Application Market Forecast Tool
MCU = 14.7%; $1.3B
Copyright © 2011 IHS Global Insight. All Rights Reserved.2011 World Economic Outlook Conference 46
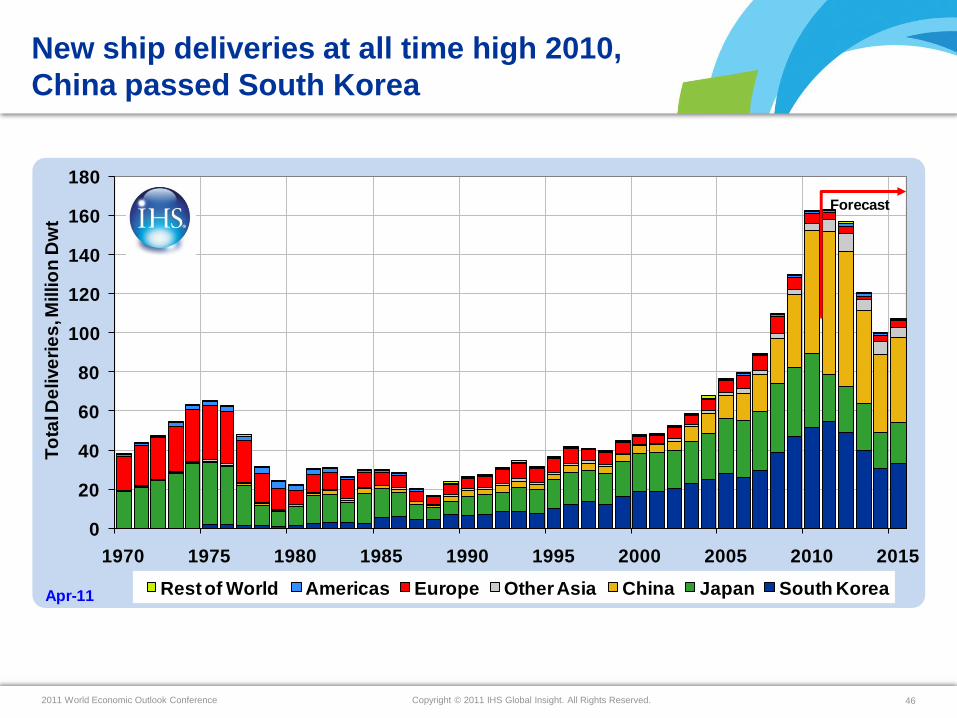
New ship deliveries at all time high 2010,
China passed South Korea
0
20
40
60
80
100
120
140
160
180
1970 1975 1980 1985 1990 1995 2000 2005 2010 2015
To
tal D
elive
rie
s, M
illio
n D
wt
Rest of World Americas Europe Other Asia China Japan South KoreaApr-11
Forecast

Copyright © 2011 IHS Global Insight. All Rights Reserved.2011 World Economic Outlook Conference 47
Demand for shipping capacity grows too…..
80
90
100
110
120
130
140
150
2005 2006 2007 2008 2009 2010 2011
Seab
orn
e tr
ade
, In
de
x b
ase
d o
n to
nn
es,
teu
Crude & ref oil Dry bulk Containers Copyright © IHS, 2011All Rights reserved
Copyright © 2011 IHS Global Insight. All Rights Reserved.2011 World Economic Outlook Conference 48
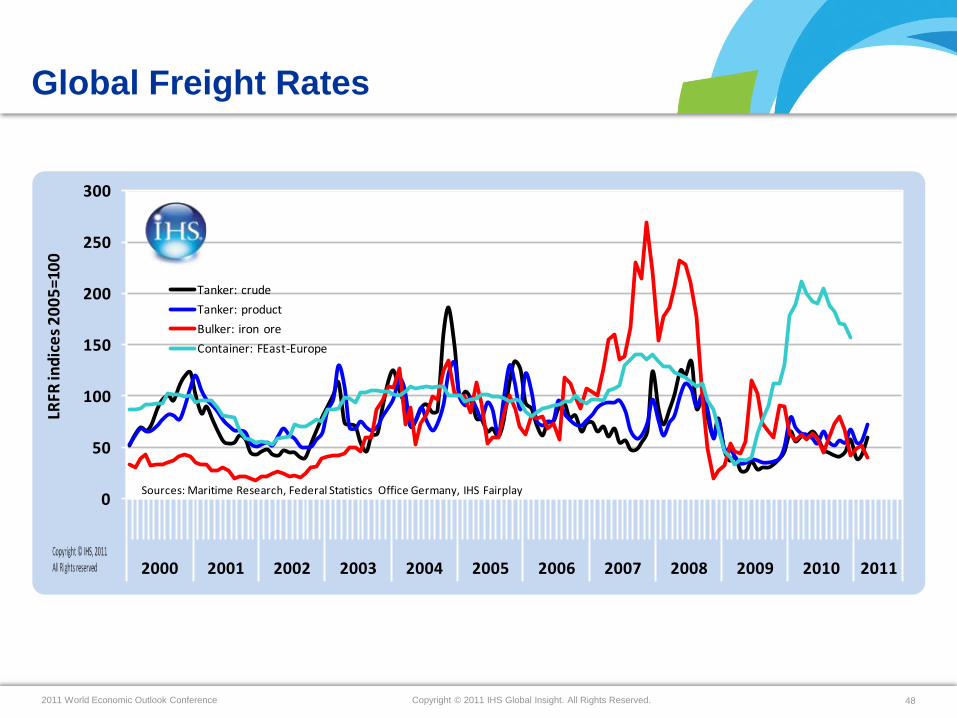
Global Freight Rates
0
50
100
150
200
250
300
2000 2001 2002 2003 2004 2005 2006 2007 2008 2009 2010 2011
LRFR
ind
ice
s 2
00
5=1
00
Tanker: crude
Tanker: product
Bulker: iron ore
Container: FEast-Europe
Sources: Maritime Research, Federal Statistics Office Germany, IHS Fairplay
Copyright © 2011 IHS Global Insight. All Rights Reserved.2011 World Economic Outlook Conference 49
Other factors ……
• Japan
• North Africa & Middle East
• Piracy

Copyright © 2011 IHS Global Insight. All Rights Reserved.2011 World Economic Outlook Conference 50
Japan and trade with commodities
Dry bulk cargo
• Reconstruction of:
• Construction industry
• Infrastructure
• Power plants
• Buildings
• Coal-fired generators at
capacity
• Some import terminals
damaged
Liquid bulk cargo
• 39 of 40 LNG terminals OK
• Substitution of nuclear &
coal shortfall by
• LNG
• Low sulphur fuels
Copyright © 2011 IHS Global Insight. All Rights Reserved.2011 World Economic Outlook Conference 51
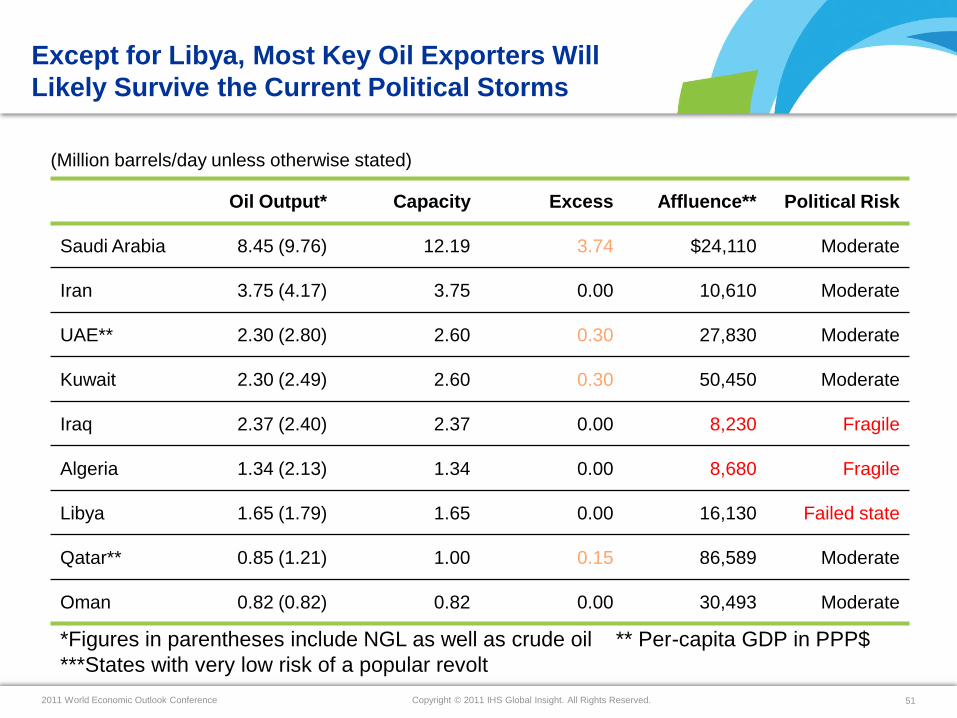
Oil Output* Capacity Excess Affluence** Political Risk
Saudi Arabia 8.45 (9.76) 12.19 3.74 $24,110 Moderate
Iran 3.75 (4.17) 3.75 0.00 10,610 Moderate
UAE** 2.30 (2.80) 2.60 0.30 27,830 Moderate
Kuwait 2.30 (2.49) 2.60 0.30 50,450 Moderate
Iraq 2.37 (2.40) 2.37 0.00 8,230 Fragile
Algeria 1.34 (2.13) 1.34 0.00 8,680 Fragile
Libya 1.65 (1.79) 1.65 0.00 16,130 Failed state
Qatar** 0.85 (1.21) 1.00 0.15 86,589 Moderate
Oman 0.82 (0.82) 0.82 0.00 30,493 Moderate
(Million barrels/day unless otherwise stated)
*Figures in parentheses include NGL as well as crude oil ** Per-capita GDP in PPP$
***States with very low risk of a popular revolt
Except for Libya, Most Key Oil Exporters Will
Likely Survive the Current Political Storms
Copyright © 2011 IHS Global Insight. All Rights Reserved.2011 World Economic Outlook Conference 52
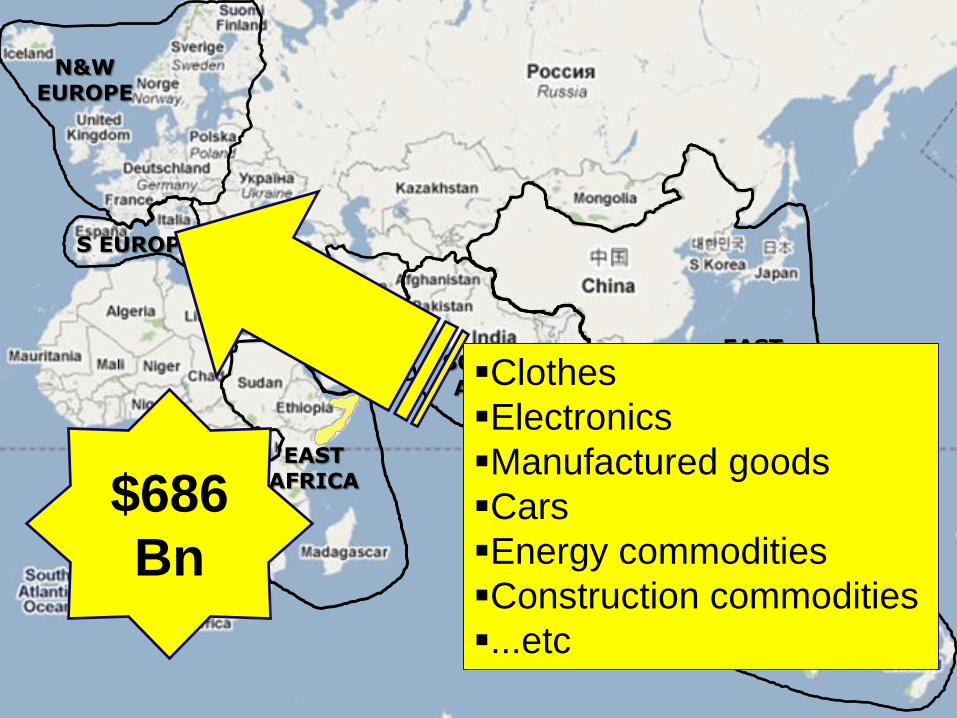
N&WEUROPE
S EUROPE
EASTASIA
SOUTHASIA
SOUTHPACIFIC
EASTMIDDLE
EAST
EASTAFRICA
Clothes
Electronics
Manufactured goods
Cars
Energy commodities
Construction commodities
...etc
$686
Bn
Copyright © 2011 IHS Global Insight. All Rights Reserved.2011 World Economic Outlook Conference 53
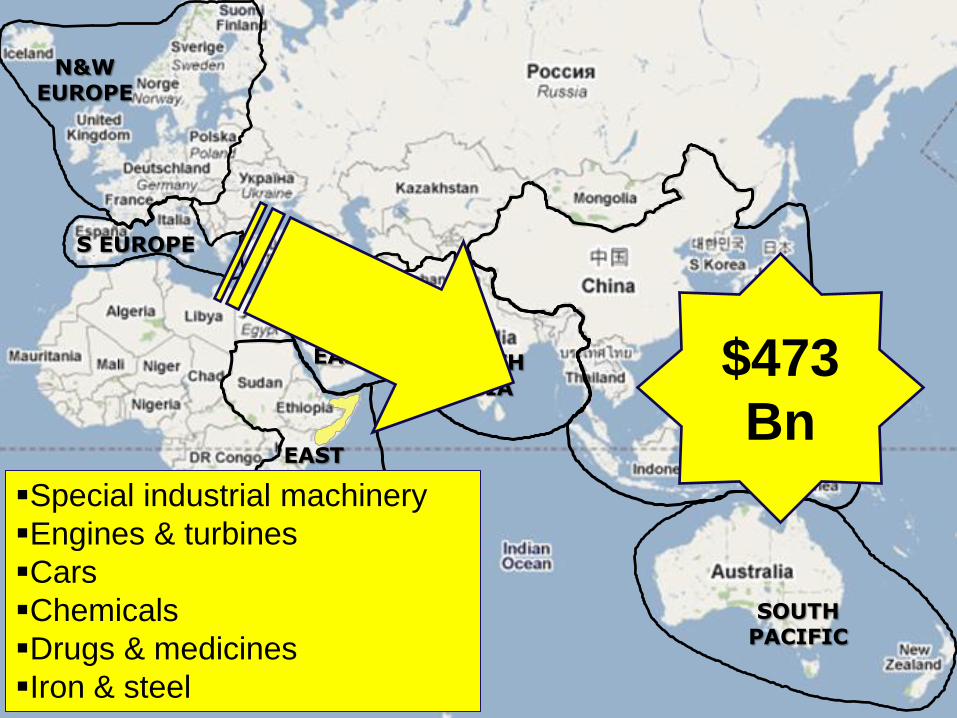
N&WEUROPE
S EUROPE
EASTASIA
SOUTHASIA
SOUTHPACIFIC
EASTMIDDLE
EAST
EASTAFRICA
Special industrial machinery
Engines & turbines
Cars
Chemicals
Drugs & medicines
Iron & steel
$473
Bn
Copyright © 2011 IHS Global Insight. All Rights Reserved.2011 World Economic Outlook Conference 54
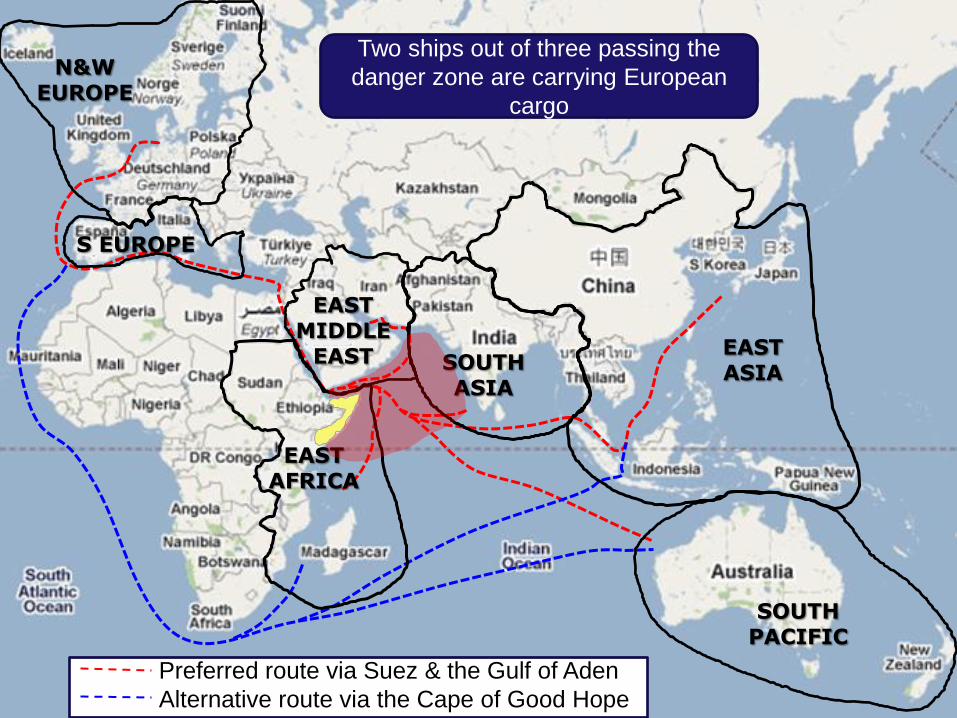
Preferred route via Suez & the Gulf of Aden
Alternative route via the Cape of Good Hope
N&WEUROPE
S EUROPE
EASTASIA
SOUTHASIA
SOUTHPACIFIC
EASTMIDDLE
EAST
EASTAFRICA
Two ships out of three passing the
danger zone are carrying European
cargo


![Assessing and Mapping the Supply Chain of Pineapple Production … · 2016-03-31 · to customers (Christopher, 1998 cited in Peck [11]). Again, Supply chain management seeks to enhance](https://img.pdfslide.us/doc/110x75/5e8fb61dcba4d84b225d6247/assessing-and-mapping-the-supply-chain-of-pineapple-production-2016-03-31-to-customers.jpg)