Embed Size (px)
Citation preview
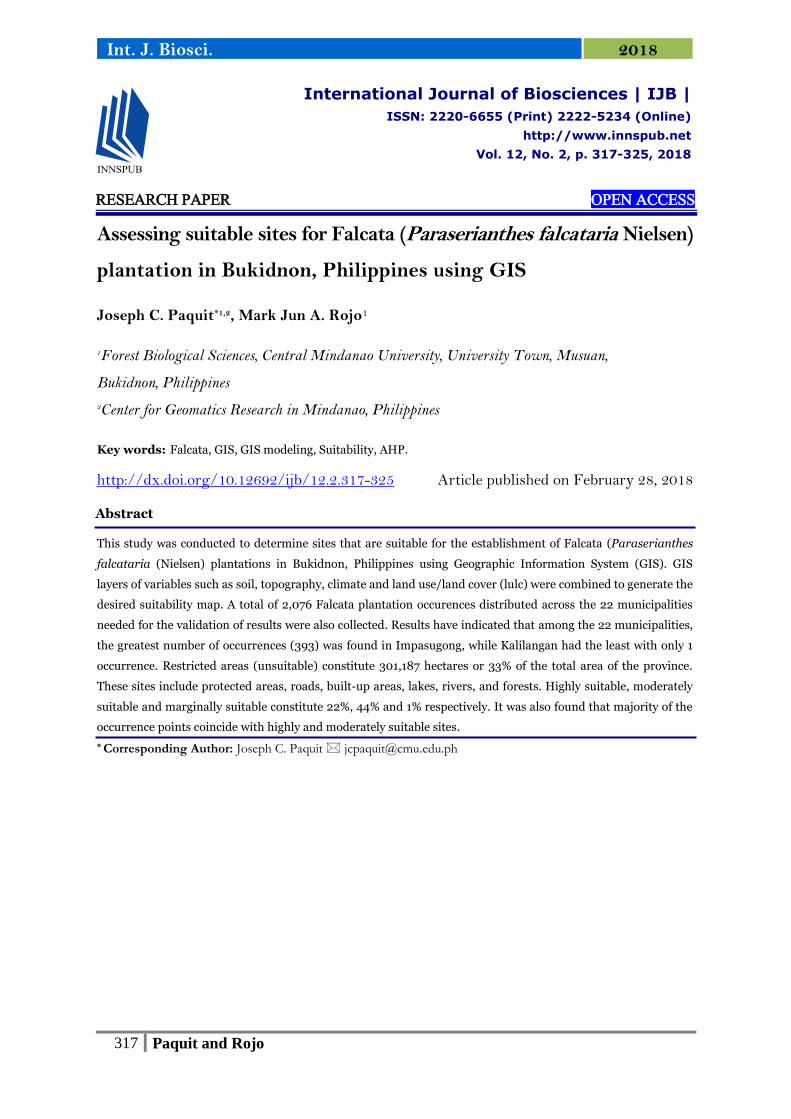
317 Paquit and Rojo
Int. J. Biosci. 2018
RESEARCH PAPER OPEN ACCESS
Assessing suitable sites for Falcata (Paraserianthes falcataria Nielsen)
plantation in Bukidnon, Philippines using GIS
Joseph C. Paquit*1,2, Mark Jun A. Rojo1
1Forest Biological Sciences, Central Mindanao University, University Town, Musuan,
Bukidnon, Philippines
2Center for Geomatics Research in Mindanao, Philippines
Key words: Falcata, GIS, GIS modeling, Suitability, AHP.
http://dx.doi.org/10.12692/ijb/12.2.317-325 Article published on February 28, 2018
Abstract
This study was conducted to determine sites that are suitable for the establishment of Falcata (Paraserianthes
falcataria (Nielsen) plantations in Bukidnon, Philippines using Geographic Information System (GIS). GIS
layers of variables such as soil, topography, climate and land use/land cover (lulc) were combined to generate the
desired suitability map. A total of 2,076 Falcata plantation occurences distributed across the 22 municipalities
needed for the validation of results were also collected. Results have indicated that among the 22 municipalities,
the greatest number of occurrences (393) was found in Impasugong, while Kalilangan had the least with only 1
occurrence. Restricted areas (unsuitable) constitute 301,187 hectares or 33% of the total area of the province.
These sites include protected areas, roads, built-up areas, lakes, rivers, and forests. Highly suitable, moderately
suitable and marginally suitable constitute 22%, 44% and 1% respectively. It was also found that majority of the
occurrence points coincide with highly and moderately suitable sites.
* Corresponding Author: Joseph C. Paquit [email protected]
International Journal of Biosciences | IJB |
ISSN: 2220-6655 (Print) 2222-5234 (Online)
http://www.innspub.net
Vol. 12, No. 2, p. 317-325, 2018
318 Paquit and Rojo
Int. J. Biosci. 2018
Introduction
Forests are a vital resource a country like the
Philippines possesses. It plays an important part in
the different biogeochemical cycle such as nutrient
and water, provides a habitat to different macro and
micro flora and fauna and provides a wide resource
base for the necessities of life such as food, clothing,
shelter, medicine and timber. Forests also provide a
viable option for climate change mitigation through
carbon sequestration (Paquit & Mindaña, 2017). As
population continues to increase, anthropogenic
activities that lead to deforestation and forest
degradation are also being done to clear more lands
for food production and settlement. In industrial
countries, forests are destroyed by air pollution, acid
rain, drought, wind, snow, pests and diseases putting
more demand on the forests as a resource (Chalupa
1990). More have also been used up to support the
need for more forest products beyond its sustainable
capacity. As forests are destroyed wood becomes
scarce, but it remains to be the most economically
important forest product and its demand continues to
increase despite its declining supply. With the
growing demand for wood and the halt of logging in
natural and residual forests in the Philippines, there
is now a need to strengthen the industrial tree
plantation industry in order to meet the growing
demand for wood. Tree plantation establishment is
one of the best options to alleviate the burgeoning
pressures on the remaining natural forests.
Wood from Falcata is one of the prime sources of
pulpwood and plywood. The pulpwood and plywood
industry contributes significantly to the national
economy and in improving the condition of lives of
the Filipino people (Subarudi 2003). Today,
plantation forestry in the Philippines is by far the best
way to legally produce marketable timber. Plantation
forestry satisfies wood demands in the country and
thus reducing resource exploitation in natural forests.
The establishment of plantations also results to
rehabilitation of degraded lands for the benefit of
future generations (Parrotta 1995). In the Philippines,
species such as Gmelina spp., Swietenia spp., and
Paraserianthes spp., are the commonest cultivated
tree plantation species.
The latter is widely cultivated in the CARAGA region
and it is of high demand both in local and
international markets. Mini-sawmills and plywood
processing companies are mainly supplied with logs
of Falcata that is mostly grown by smallholder
farmers. Falcata has a ready market in Caraga and in
Cagayan de Oro, and its low wood density favors
efficient transport and loading. Falcata is cultivated
mainly for pulpwood but in some cases for sawlog.
The economic maturity for pulpwood is relatively
shorter which is at 6-8 years depending on location.
As a result, higher revenue is generated as compared
with other tree crops.
The presence of a ready market for falcata has enticed
many farmers to engage in its establishment.
However, as with other tree species, it has to be
established in its ideal bioclimatic range to attain
optimal growth. The productivity of an area is directly
correlated with climate (Paquit et al., 2017) and
Bukidnon is one of the provinces that have an ideal
climate for Falcata. The province also has ideal
topography and soils that are very well suited for the
species. Moreover, the province being away from the
coast and landlocked is rarely affected by destructive
typhoons. Despite these facts, there are areas in
Bukidnon where conditions are not suitable.
GIS has been used in many studies due to the fact that
it is an effective tool for data visualization, database
management, data analysis, modeling and
cartography. Geographic Information System (GIS) is
an organized collection of computer hardware and
software designed to create, manipulate, analyze
efficiently, and display all types of geographically or
spatially referenced data. A GIS allows complex
spatial operations that ranges from simple to difficult
ones (Chang 2004). A GIS- based site suitability
assessment will therefore help determine whether a
piece of land is suitable or unsuitable for planting tree
species and will aid in the optimal use of land
(Mokarram and Amin- zadeh, 2010).
It is therefore the aim of this study to use GIS
technology in the identification of suitable sites for
the benefit of farmers and policy makers.

319 Paquit and Rojo
Int. J. Biosci. 2018
Materials and mathods
Study Area
This study was conducted in Bukidnon, Philippines. It
is a landlocked province in Northern Mindanao and
the only province that does not have a coast line. It
extends geographically from 7°20’ – 8°40’ N to
124°30–125°30’ E, with land area of 910,462 hectares
(calculated in GIS) representing 2.76% of the
country's total land area.
Fig. 1. Map of the Study Area (source: Paquit &
Rama, 2018).
The province is composed of 20 municipalities and 2
component cities. Although the province has lofty
mountains, the greater part is a gently rolling grassland
plateau cut by deep and wide canyons of the Cagayan,
Pulangui and Tagoloan rivers and their tributaries, and
other rivers. Observations by the Philippine
Atmospheric Geophysical and Astronomical Services
Administration (PAGASA) from 2006 to 2011 have
shown that Bukidnon has two prevailing types of
climatic variations existing between the northern and
southern sections. The northern part falls under the
third or intermediate A type while the southern part
beginning from Malaybalay, falls under the fourth type
or intermediate B type.
Data Collection
The needed data were collected from government
agencies. The coordinates of Falcata plantations were
gathered from the Provincial Environment and
Natural Resources Office (PENRO), Community
Environment and Natural Resources (CENRO) and
various Municipal Environment and Natural
Resources Offices (MENRO). For climate data, the
website www.worldclim.org/bioclim.html was the
source for bioclimatic variables such as mean annual
temperature (bio1) and annual precipitation (bio12)
(Hijmans et al., 2005). IfSAR DEM was acquired
from PhilLiDAR 2 project, and vector datasets of
municipal boundaries, protected areas, and soil of
Bukidnon were gathered from other credible sources.
Finally, the data for land use/land cover (lulc) were
obtained from ESSC.
Suitability Parameters
Topographic, climatic and edaphic factors are known
to influence plant growth, development and survival
(Benner et al. 2010). The topographic factors
considered include aspect, elevation, and slope. Slope
is the rate of change in elevation while aspect is the
direction where slope faces and is generally
categorized as northern, eastern, western, and
southern. Aspect has some implications on the
exposure of plants to solar radiation while slope
relates with soil development. The development of
soils occurs slowly on steeper slopes (Akinci et al.
2013). East facing slopes are known to be more
suitable in terms of solar radiation received by plants
(Paquit et al. 2017). South facing slopes are
considered marginally suitable since they are
generally drier and exposed to sunlight for a longer
period. The three topographic parameters have
corresponding weights that were determined through
pairwise comparison (Saaty 1980). Fig. 2 shows the
topographic parameters used. Soil type has a
corresponding weight equal to 22 (Fig. 3b). Soil type
influences site productivity and are differentiated
based on texture, drainage, fertility, and depth
(Holloway, 2013. Furthermore, soil is categorized into
three groups: sand, silt, and clay. The climate of the
area is classified as shown in Fig. 4 and has an
assigned weight of 24 for mean annual temperature
and 12 for annual precipitation. Land cover is the
observed physical cover including the vegetation

320 Paquit and Rojo
Int. J. Biosci. 2018
(natural, planted and protected areas) and human
constructions (buildings, roads, and the likes) that
cover the earth's surface. This parameter has an
assigned weight of 9 as shown in Fig. 3(a).
The classification and distribution of areas according
to topography, climate, soil type, and land use are
summarized in Tables 1, 2, and 3.
Fig. 2. (a) Elevation, (b) Slope, and (c) Aspect Map of Bukidnon.
Fig. 3. (a) Land use/landcover (lulc) and (b) Soil Map of Bukidnon.
Table 1. Areal and percentile distributions of elevation, slope and aspect.
Elevation Area (ha) Area (%) Source
11 – 300 599,326 66 Prawirohatmodjo (1994) 300 – 500 88,287 10
500 – 2,921 222,850 24 Slope Area (ha) Area (%)
Nguyen (1998)
0 – 10 225,361 25 10 – 18 215,374 25 18 – 79 469,727 50 Aspect Area (ha) Area (%)
Davis et al. (2012) 22.5 – 157.5 513,307 56 157.5 – 360 397,155 44
321 Paquit and Rojo
Int. J. Biosci. 2018
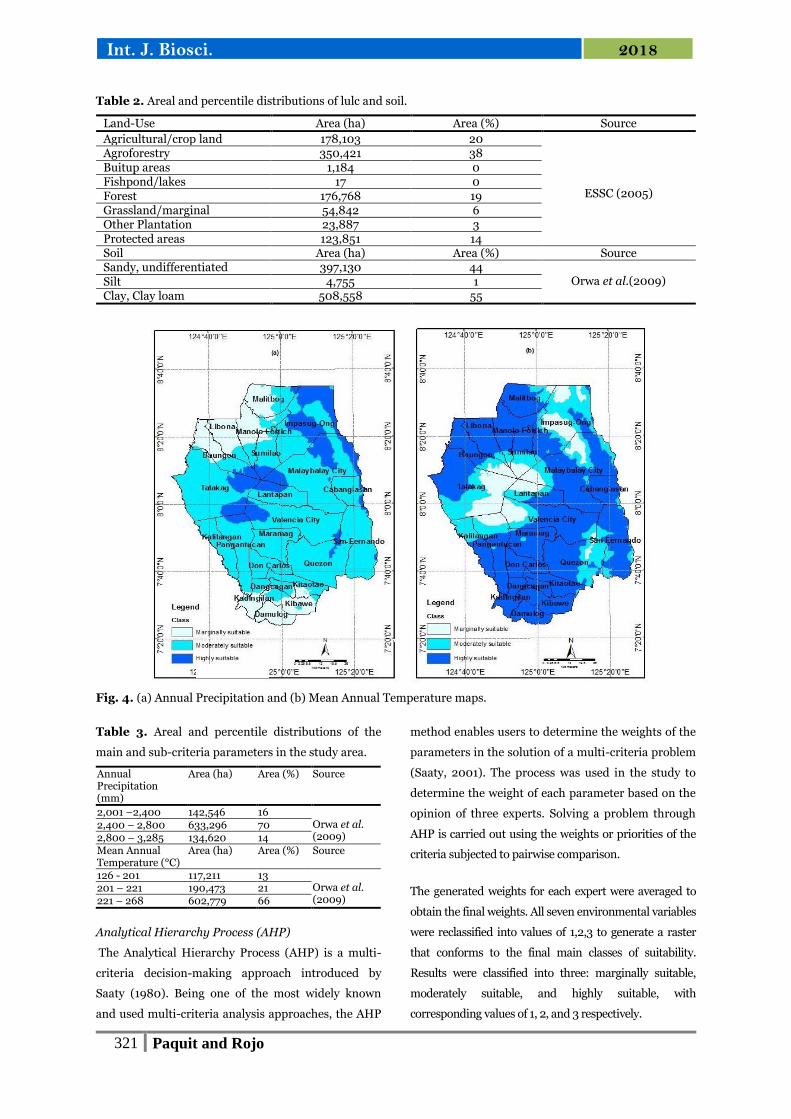
Table 2. Areal and percentile distributions of lulc and soil.
Land-Use Area (ha) Area (%) Source
Agricultural/crop land 178,103 20
ESSC (2005)
Agroforestry 350,421 38 Buitup areas 1,184 0 Fishpond/lakes 17 0 Forest 176,768 19 Grassland/marginal 54,842 6 Other Plantation 23,887 3 Protected areas 123,851 14 Soil Area (ha) Area (%) Source Sandy, undifferentiated 397,130 44
Orwa et al.(2009) Silt 4,755 1 Clay, Clay loam 508,558 55
Fig. 4. (a) Annual Precipitation and (b) Mean Annual Temperature maps.
Table 3. Areal and percentile distributions of the
main and sub-criteria parameters in the study area.
Annual Precipitation (mm)
Area (ha) Area (%) Source
2,001 –2,400 142,546 16 Orwa et al. (2009)
2,400 – 2,800 633,296 70 2,800 – 3,285 134,620 14 Mean Annual Temperature (°C)
Area (ha) Area (%) Source
126 - 201 117,211 13 Orwa et al. (2009)
201 – 221 190,473 21 221 – 268 602,779 66
Analytical Hierarchy Process (AHP)
The Analytical Hierarchy Process (AHP) is a multi-
criteria decision-making approach introduced by
Saaty (1980). Being one of the most widely known
and used multi-criteria analysis approaches, the AHP
method enables users to determine the weights of the
parameters in the solution of a multi-criteria problem
(Saaty, 2001). The process was used in the study to
determine the weight of each parameter based on the
opinion of three experts. Solving a problem through
AHP is carried out using the weights or priorities of the
criteria subjected to pairwise comparison.
The generated weights for each expert were averaged to
obtain the final weights. All seven environmental variables
were reclassified into values of 1,2,3 to generate a raster
that conforms to the final main classes of suitability.
Results were classified into three: marginally suitable,
moderately suitable, and highly suitable, with
corresponding values of 1, 2, and 3 respectively.

322 Paquit and Rojo
Int. J. Biosci. 2018
Data processing
For soil data, clipping and subsequent conversion to
raster was done. The DEM was used to generate slope
and aspect with units that are expressed in degrees.
All environmental variables were made uniform in
terms of cell size and extent. All were then resampled
to 10 x 10 meter spatial resolution and set to uniform
extent. The projection for all environmental variables
was then set to UTM zone 51N.
Weighted Overlay
The Weighted Overlay tool was applied to generate
the final suitability map. Restricted areas were
carefully factored in the map by identifying lulc that
could either be temporarily or permanently restricted
from tree plantation establishment such as Protected
area, water bodies, roads and urban areas. The weight
of each of the criterion in the overlay analysis were
based on the result of the AHP analysis.
Validation of Results
The GPS points of existing Falcata plantations were
used to validate the accuracy of the generated map.
Analysis was done to determine whether the
occurrence points of Falcata coincide with the
location of highly and moderately suitable areas.
Table 4. The fundamental scale of pairwise comparison (Saaty, 1980).
Intensity importance Definition Explanation
1 Equal importance Two activities contribute equally to the objectives 3 Weak importance of one over
another Experience and judgment slightly favor one activity over other
5 Essential or strong importance Experience and judgment strongly favor one activity over another
7 Demonstrated importance An activity is strongly favored and its dominance demonstrated in practice.
9 Absolute importance The evidence favoring one activity over another is of the highest possible order of affirmation.
2, 4, 6, 8 Intermediate values between the two adjuscent judgements
When compromise is needed
Reciprocals If activity i has one of the above number assigned to it when compared with activity j, then j has a reciprocal value when compared with i.
Results and discussion
Actual Location of Paraserianthes Falcataria Nielsen
A total of 2,076 Falcata plantation occurences were
observed in the study area. As shown in Fig. 5., these
points are unevenly distributed across the 22 areas of
interest and where found to occur mostly in the
lowlands. The central part of the province is
blanketed with immense mountain ranges that are
considered area protected areas. As a result
occurences are rarely to be found in this areas.
Among the 22 municipalities, Impasug-ong obtained
the greatest number of plantation points with 393
while Kalilangan had the least with only 1 (Table 5).
20 municipalities have a representative sample which
means that 91% of the study site has at least 1 falcata
plantation. Only Talakag and Lantapan have no
sample points. As observed, the two municipalities
are comprised mainly of elevated areas where the
establishment of Falcata plantation is normally
discouraged because of gall rust disease.
Despite the gap in the science that relates the
occurrence of gall rust and environmental factors,
particularly elevation, many people have been able to
document the increased incidence of the disease with
elevation (Lacandula et al. 2017).
Relation to all Environmental Variables
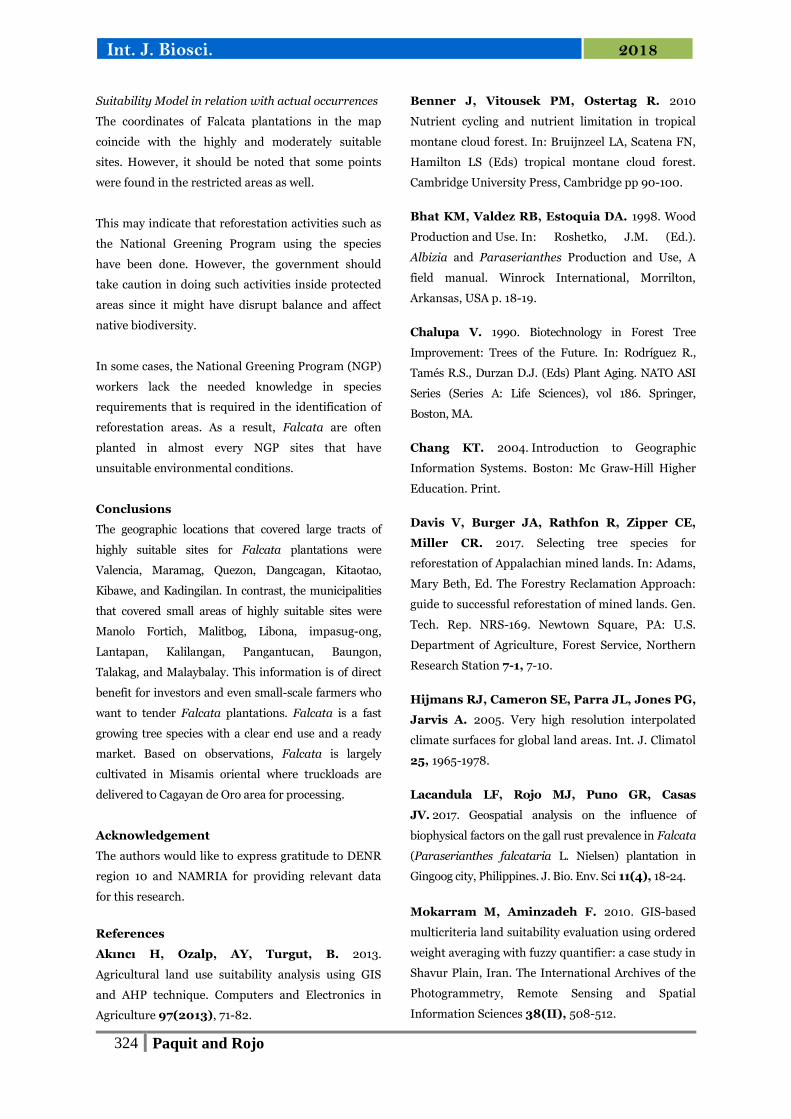
In Fig. 7, the resulting suitability map of the different
(Paraserianthes falcataria Nielsen) plantations in the
study sites is shown. Some of the highly suitable sites
depicted as light green color on the map are mostly
distributed in the Southern part of the provinces. This
areas that cover an area of 20,404 hectares fall mainly
under the municipalities of Maramag, Quezon, Valencia,
Don Carlos, Kitaotao, Dangcagan, and Kadingailan.
These areas cover expansive lands that could fall within
the 300-500 meter elevation class which is still ideal for
the species. All values of environmental variables
considered in this study were satisfied based on the
requirements of the species.
323 Paquit and Rojo
Int. J. Biosci. 2018
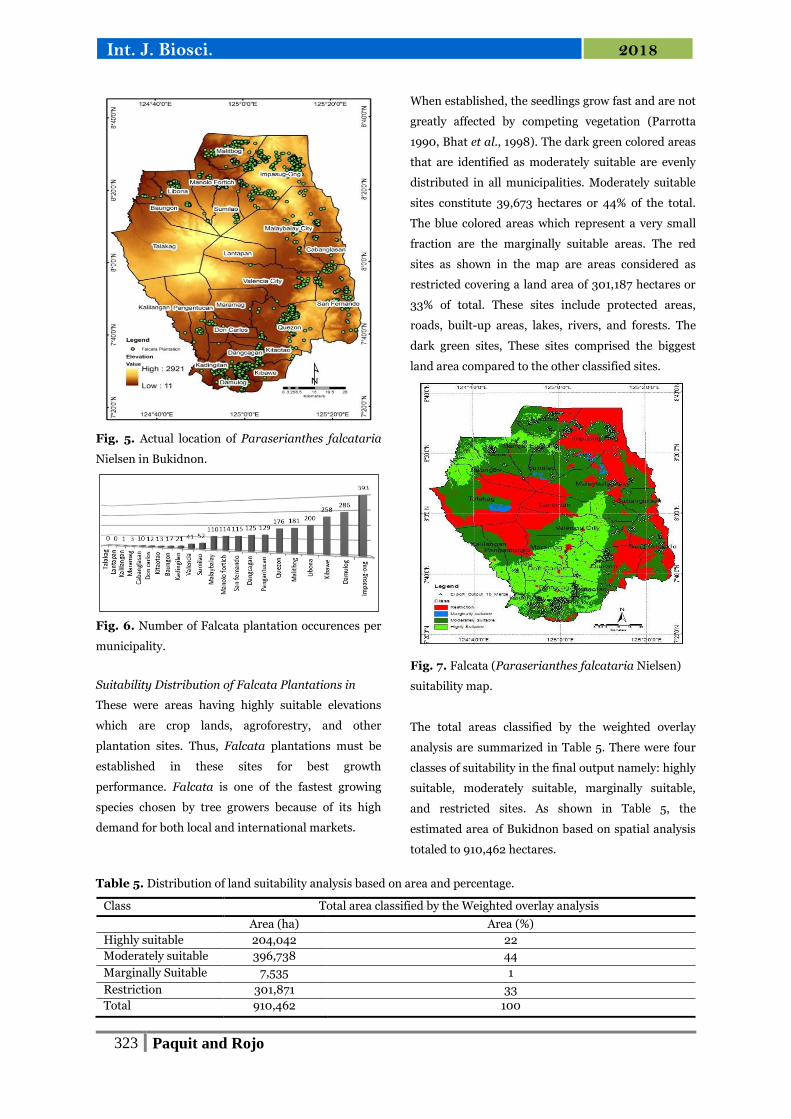
Fig. 5. Actual location of Paraserianthes falcataria
Nielsen in Bukidnon.
Fig. 6. Number of Falcata plantation occurences per
municipality.
Suitability Distribution of Falcata Plantations in
These were areas having highly suitable elevations
which are crop lands, agroforestry, and other
plantation sites. Thus, Falcata plantations must be
established in these sites for best growth
performance. Falcata is one of the fastest growing
species chosen by tree growers because of its high
demand for both local and international markets.
When established, the seedlings grow fast and are not
greatly affected by competing vegetation (Parrotta
1990, Bhat et al., 1998). The dark green colored areas
that are identified as moderately suitable are evenly
distributed in all municipalities. Moderately suitable
sites constitute 39,673 hectares or 44% of the total.
The blue colored areas which represent a very small
fraction are the marginally suitable areas. The red
sites as shown in the map are areas considered as
restricted covering a land area of 301,187 hectares or
33% of total. These sites include protected areas,
roads, built-up areas, lakes, rivers, and forests. The
dark green sites, These sites comprised the biggest
land area compared to the other classified sites.
Fig. 7. Falcata (Paraserianthes falcataria Nielsen)
suitability map.
The total areas classified by the weighted overlay
analysis are summarized in Table 5. There were four
classes of suitability in the final output namely: highly
suitable, moderately suitable, marginally suitable,
and restricted sites. As shown in Table 5, the
estimated area of Bukidnon based on spatial analysis
totaled to 910,462 hectares.
Table 5. Distribution of land suitability analysis based on area and percentage.
Class Total area classified by the Weighted overlay analysis
Area (ha) Area (%)
Highly suitable 204,042 22
Moderately suitable 396,738 44
Marginally Suitable 7,535 1
Restriction 301,871 33
Total 910,462 100
324 Paquit and Rojo
Int. J. Biosci. 2018
Suitability Model in relation with actual occurrences
The coordinates of Falcata plantations in the map
coincide with the highly and moderately suitable
sites. However, it should be noted that some points
were found in the restricted areas as well.
This may indicate that reforestation activities such as
the National Greening Program using the species
have been done. However, the government should
take caution in doing such activities inside protected
areas since it might have disrupt balance and affect
native biodiversity.
In some cases, the National Greening Program (NGP)
workers lack the needed knowledge in species
requirements that is required in the identification of
reforestation areas. As a result, Falcata are often
planted in almost every NGP sites that have
unsuitable environmental conditions.
Conclusions
The geographic locations that covered large tracts of
highly suitable sites for Falcata plantations were
Valencia, Maramag, Quezon, Dangcagan, Kitaotao,
Kibawe, and Kadingilan. In contrast, the municipalities
that covered small areas of highly suitable sites were
Manolo Fortich, Malitbog, Libona, impasug-ong,
Lantapan, Kalilangan, Pangantucan, Baungon,
Talakag, and Malaybalay. This information is of direct
benefit for investors and even small-scale farmers who
want to tender Falcata plantations. Falcata is a fast
growing tree species with a clear end use and a ready
market. Based on observations, Falcata is largely
cultivated in Misamis oriental where truckloads are
delivered to Cagayan de Oro area for processing.
Acknowledgement
The authors would like to express gratitude to DENR
region 10 and NAMRIA for providing relevant data
for this research.
References
Akıncı H, Ozalp, AY, Turgut, B. 2013.
Agricultural land use suitability analysis using GIS
and AHP technique. Computers and Electronics in
Agriculture 97(2013), 71-82.
Benner J, Vitousek PM, Ostertag R. 2010
Nutrient cycling and nutrient limitation in tropical
montane cloud forest. In: Bruijnzeel LA, Scatena FN,
Hamilton LS (Eds) tropical montane cloud forest.
Cambridge University Press, Cambridge pp 90-100.
Bhat KM, Valdez RB, Estoquia DA. 1998. Wood
Production and Use. In: Roshetko, J.M. (Ed.).
Albizia and Paraserianthes Production and Use, A
field manual. Winrock International, Morrilton,
Arkansas, USA p. 18-19.
Chalupa V. 1990. Biotechnology in Forest Tree
Improvement: Trees of the Future. In: Rodríguez R.,
Tamés R.S., Durzan D.J. (Eds) Plant Aging. NATO ASI
Series (Series A: Life Sciences), vol 186. Springer,
Boston, MA.
Chang KT. 2004. Introduction to Geographic
Information Systems. Boston: Mc Graw-Hill Higher
Education. Print.
Davis V, Burger JA, Rathfon R, Zipper CE,
Miller CR. 2017. Selecting tree species for
reforestation of Appalachian mined lands. In: Adams,
Mary Beth, Ed. The Forestry Reclamation Approach:
guide to successful reforestation of mined lands. Gen.
Tech. Rep. NRS-169. Newtown Square, PA: U.S.
Department of Agriculture, Forest Service, Northern
Research Station 7-1, 7-10.
Hijmans RJ, Cameron SE, Parra JL, Jones PG,
Jarvis A. 2005. Very high resolution interpolated
climate surfaces for global land areas. Int. J. Climatol
25, 1965-1978.
Lacandula LF, Rojo MJ, Puno GR, Casas
JV. 2017. Geospatial analysis on the influence of
biophysical factors on the gall rust prevalence in Falcata
(Paraserianthes falcataria L. Nielsen) plantation in
Gingoog city, Philippines. J. Bio. Env. Sci 11(4), 18-24.
Mokarram M, Aminzadeh F. 2010. GIS-based
multicriteria land suitability evaluation using ordered
weight averaging with fuzzy quantifier: a case study in
Shavur Plain, Iran. The International Archives of the
Photogrammetry, Remote Sensing and Spatial
Information Sciences 38(II), 508-512.
325 Paquit and Rojo
Int. J. Biosci. 2018
Nguyen BC. 1998. Research on industrial forest
plantation establishment with Paraserianthes
falcataria (L.) Nielsen and Gmelina arborea Roxb for
wood supply P 1-6.
Orwa C, Mutua A, Kindt R, Jamnadass R,
Simons A. 2009. Agroforestry Database: A tree
reference and selection guide version 4.0. World
Agroforestry Centre, Kenya.
Paquit JC, Mindaña FN. 2017. Modeling the
spatial pattern of carbon stock in Central
Mindanao University using in VEST tool. J. Bio.
Env. Sci 10(4), p.103-113.
Paquit JC, Pampolina NM, Tiburan CL Jr,
Manalo MM. 2017. Maxent Modeling of the Habitat
Distribution of the Critically Endangered Pterocarpus
indicus Willd. Forma indicus in Mindanao,
Philippines. J. Bio. Env. Sci 10(3), p. 112-122.
Paquit JC, Rama RIP. 2018. Modeling the effect
of climate change to the potential invasion range of
Piper aduncum Linnaeus. Global J. Environ. Sci.
Manage 4(1).
Parrotta JA. 1990. Paraserianthes falcataria (L.)
Nielsen, Batai, Moluccan sau, Leguminosae
(Mimosoideae) Legume Family. US Department of
Agriculture, Forest Service, Southern Forest Experiment
Station, Institute of Tropical Forestry. SO-ITF-SM-31.
Prawirohatmodjo S. 1992. Albizia Falcataria
(Paraserianthes falcataria) a newly emerging
export earner in Indonesia. Buletin Fakultas
Kehutanan 24, 41-49.
Saaty TL, Vargas GL. 2001. Models, Methods,
Concepts and Applications of the Analytic Hierarchy
Process, Kluwer Academic Publisher, Boston.
Saaty TL. 1980. The analytic hierarchy process. New
York: McGraw-Hill.
Subarudi D, Erwidodo D, Cacho O. 2003.
Growth and Carbon Sequestration Potential of
Plantation Forestry in Indonesia: Paraserianthes
falcataria and Acacia mangium. Working paper
CC08, 2003, ACIAR project ASEM 1999/093, 15 pp.