Embed Size (px)
Citation preview

The Pennsylvania State University
The Graduate School
Instructional Systems Program
ASSESSING STUDENT EXPECTATIONS AND PREFERENCES
FOR THE DISTANCE LEARNING ENVIRONMENT:
ARE CONGRUENT EXPECTATIONS AND PREFERENCES A
PREDICTOR OF HIGH SATISFACTION?
A Thesis in
Instructional Systems
by
Karen I. Ritter Pollack
© 2007 Karen I. Ritter Pollack
Submitted in Partial Fulfillment of the Requirements
for the Degree of
Doctor of Philosophy
August 2007

ii
The thesis of Karen I. Ritter Pollack was reviewed and approved* by the following:
Francis M. Dwyer Professor of Education Thesis Advisor Chair of Committee
Kyle L. Peck Professor of Education
Melody M. Thompson Assistant Professor of Education
William L. Harkness Professor Emeritus of Statistics
Susan M. Land Associate Professor of Education Professor in Charge of Instructional Systems
* Signatures are on file in the Graduate School.
iii
ABSTRACT
In the last five to ten years, innovations in educational technology and enthusiasm for
perceived gains in cooperative learning behaviors, instructional variation, larger and more
distributed course projects, and learning that occurs through peer tutoring (Duffy and
Cunningham 1996) have caused distance educators to move away from individualistic
forms of study and toward collaborative learning environments. Historically,
independent learning has offered learners “any time, any place” and “own pace,” access
to distance education. Distance education is using new technologies to maximize
collaboration and increase learning, actually resulting in a reduction in the amount of
learner control and flexibility. If these new collaborative environments don’t meet learner
expectations and preferences, what is the impact on learning in general and satisfaction in
particular? This study was designed to assess whether student expectations and
preferences for distance learning environments are associated with high satisfaction. The
independent variables are congruence of expectations for the learning environment
distance learners thought they would be placed in and congruence of preferences with the
learning environment in which they were placed. A single measure of satisfaction was
summed from student responses on five dimensions of learner satisfaction: overall
satisfaction, the meeting of educational goals, degree of difficulty with learning course
ideas and concepts, the promptness of instructor response, and satisfaction with the
course itself. This study tested the hypothesis that students who are placed in a distance
learning environment that is congruent with their expectations and preferences will have
higher satisfaction levels. Although prior research does show that satisfaction with the

iv
course structure and materials does correlate with greater satisfaction and knowledge
gains, no significant differences in satisfaction were found between learners with
congruent preferences and expectations versus incongruent preferences and expectations,
based on the way that students responded in this particular study. The finding of
significance in prior studies may be related to differences in the types of subjects
recruited, the types of courses selected, or differences in the course delivery models.

v
TABLE OF CONTENTS
List of Figures............................................................................................ vii
List of Tables ............................................................................................. viii
Acknowledgements .................................................................................... ix
Chapter 1. Introduction .............................................................................. 1
Background of the Problem ............................................................ 1
Statement of the Problem................................................................ 3
Purpose of the Study....................................................................... 7
Research Questions ........................................................................ 8
Null Hypotheses ............................................................................. 8
Significance of the Study................................................................ 9
Conceptual Framework................................................................... 10
Learner Satisfaction ............................................................ 10
Learner Expectations........................................................... 10
Learner Preferences............................................................. 11
Collaboration ...................................................................... 11
Learning Styles ................................................................... 12
Theoretical Framework................................................................... 12
Keller’s ARCS Model ......................................................... 12
Kirkpatrick’s Four Levels of Evaluation.............................. 13
Definition of Terms ........................................................................ 15

vi
Chapter 2. Review of the Literature............................................................ 18
Keller’s ARCS Model of Motivation .............................................. 18
Kirkpatrick’s Four Levels of Evaluation ......................................... 24
Learner Satisfaction........................................................................ 29
Learner Expectations ...................................................................... 33
Learner Preferences ........................................................................ 35
Collaboration.................................................................................. 37
Learning Styles............................................................................... 39
Summary........................................................................................ 41
Chapter 3. Methodology............................................................................. 43
Subjects.......................................................................................... 43
Self-Report As a Research Methodology ........................................ 44
Procedure ....................................................................................... 44
Experimental Design ...................................................................... 49
Chapter 4. Results ...................................................................................... 50
Chapter 5. Discussion................................................................................. 67
Conclusion ..................................................................................... 75
References ................................................................................................. 78
Appendix A: Code Book, Pre-Course Survey ............................................. 98
Appendix B: Code Book, Post-Course Survey............................................ 103
Vita............................................................................................................ 105

vii
LIST OF FIGURES
Figure 1: Keller’s Model of Motivation,
Performance, and Instructional Influence ................................................... 20
Figure 2: Kirkpatrick’s Four Levels of Evaluation
Modified by Kaufman, Keller and Watkins (1995) ..................................... 26

viii
LIST OF TABLES
Table 1: Number of Subjects by Course ................................................. 47
Table 2: Number of Subjects, Means, and Standard Deviations
of Satisfaction Scores ..................................................................... 52
Table 3: ANOVA Summary Table for the Effects of Congruence of
Expectations and Preferences on Satisfaction.................................. 55
Table 4: Correlation Matrix of All Predictor and Criterion Items................ 58 Table 5: Chi Square Analysis, Distribution of Satisfaction Scores .............. 60-62 Table 6: Chi Square Analysis, Distribution of Satisfaction Scores .............. 64-66 Table 7: Range of Courses Recommended for Future Research.................. 69

ix
ACKNOWLEDGEMENTS
I extend my deepest thanks and gratitude to several individuals – both in front of,
and behind the scenes. Up front, my thanks go to Dr. Frank Dwyer for his
encouragement, guidance and feedback – ever present, always steady. I thank
Dr. Kyle Peck for sharing his scholarly and professional wisdom and for teaching me,
“the truth is usually somewhere in-between.” My thanks go to Dr. Melody Thompson for
serving as a role model and a mentor. Her vast knowledge of the distance education field,
both theoretical and applied has been invaluable. I thank Dr. William Harkness for his
enthusiasm in using statistics to increase knowledge and improve the quality of
instruction. Behind the scenes, I’d like to thank my husband, Dr. Lenny Pollack, for both
his discerning eye and constructive feedback and also for his unfailing support on the
home front. I thank my pre-school-aged sons, Nicholas and Joseph, for their patience,
resilience, and adaptability. Finally, I thank my parents, Dolores and Glenn Ritter, and
my brothers, Charles and Greg for their help and encouragement. Without the collective
support of these individuals, and others, completion of this doctoral study would not have
been possible.

1
Chapter 1
Introduction Background of the Problem
Penn State University’s roots in distance learning extend back to 1892 with its program
of postal mail, correspondence-based study. It offered a flexible environment for
learning. Students could begin study anytime, anywhere, progressing through their
coursework independently and at their own pace. Distance learning gathered momentum
at colleges and universities across the United States with the expansion of the
intercontinental railroad system, which made reliable cross-country postal mail
service possible.
With the advent of the information age, technology began to transform and enhance
distance education: early on, through instructional radio and television; later, through
facsimile communication, interactive video, satellite, electronic mail, and the World
Wide Web. For the first time, a truly collaborative distance education environment
became possible. Students could interact with one another in small groups on projects and
during online chat sessions moderated by the instructor. In the last five to ten years in
particular, these technological innovations have caused colleges and universities, around
the world, to think about instituting more dramatic changes in the distance education
landscape — moving away from individualistic forms of study and toward collaborative
learning communities. Web-based learning, e-mail, and other communications
technologies greatly increase the speed with which students can communicate with their

2
instructor and creates a myriad of opportunities for learners to communicate with each
other (Edelson and Pittman 2001).
In fact, the emphasis on collaboration and interactive learning experiences has so
dominated the distance education landscape that in the United States, where web-based
delivery is the dominant mode, institutions of higher education are on the verge of
eliminating most of their individualistic forms of study altogether (Edelson and Pittman
2001). Eliminating the independent study format from their portfolio eliminates a good
deal of the flexibility that distance learners have come to expect. The movement toward
online collaborative group formats also will effectively prevent educational institutions
from serving certain constituencies in the near term, such as the incarcerated, who lack
Internet access, and those who cannot afford access to technology. Then there are those
who simply don’t have access by virtue of their geographic location, such as rural areas
that may lack broadband service. Ironically, these are the same rural populations that
distance education providers set out to serve 115 years ago. The movement toward
collaborative online instruction presents particular financial risks as well. Independent
study is a less expensive delivery mode, which has, at many institutions, provided the
financial foundation for experimentation with new delivery models and programs. Are
the advantages of collaborative online study sufficient to offset those of independent
study? Will students who are placed in a distance learning environment that is congruent
with their expectations and preferences have higher satisfaction levels? If the learning
environment is incongruent with their expectations and preferences, will they be less
3
satisfied? Are we throwing the baby out with the bath water, or moving toward a higher
pedagogical benchmark?
Statement of the Problem
In addition to the more limited access and the financial implications, in at least the
near-term, in moving from the independent study model of distance education to the
online collaborative model, there may be more serious considerations related to student
values and preferences and student expectations for the distance learning environment.
These considerations may have significant impact on learning and satisfaction with the
learning experience overall. Adult learners, in particular, tend to choose distance
education delivery formats because they offer maximum flexibility. Adult learners
can pursue their educational goals from a distance, without having to interrupt their
careers. Through distance education, they are able to accomplish their educational
goals with minimum disruption to their family or personal lives. Historically,
independent study courses offered adult students in particular the ability to start at any
time, or at several entry points, through out the year; to work at their own pace; to
establish their own timelines for submitting assignments; and to set their own exam dates.
Independent study formats allowed students six months or more to complete their courses
— offering maximum flexibility to schedule course work around family, work, and other
personal responsibilities.
In fact, “any time, any where” was an effective marketing slogan for this mode of
learning for some time. With the migration to new Online Group models of delivery,

4
however, it is a slogan that many institutions are backing away from. Most of today’s
Online Group models incorporate technologies requiring broadband access — video- and
audio-conferencing, phone bridges, and other synchronous activities including on-site
orientation and practicum experiences. They also require collaboration with other
students within a more restrictive time frame.
If learners new to the distance education experience expected an Independent Study
course or preferred an Independent Study course (“any time, any where”), how would
they respond to an Online Group experience? If there was a mismatch between the course
they expected and preferred versus the course they received, would this impact their
overall satisfaction?
The current 2006-07 Penn State World Campus course catalog shows 691 available
courses and five different course delivery types:
• Online Group
• Online Individual Six Months
• Online Individual Semester Based
• Independent Learning Web Optional
• Independent Learning
A legend on page 13 of the 79-page print catalog gives a more detailed explanation:

5
Online Group = Web access is required to complete these courses. These courses are
generally between twelve and fifteen weeks in length but may be shorter during the
summer semester. For the lengths of specific courses, check the online course catalog:
www.worldcampus.psu.edu. Students interact with their instructors and other students.
Group work and/or student-to-student interaction may be required.
Online Individual Six Months = Web access is required to complete these courses.
Though you are encouraged to complete this course within five months, you have up to
six months for course completion. These courses do not have fixed start and end dates.
Students interact one-on-one with their instructors. Group work and student-to-student
interaction are not required.
Online Individual Semester Based = Web access is required to complete these courses.
These courses are generally between twelve and fifteen weeks in length but may be
shorter during the summer semester. For the lengths of specific courses, check the online
course catalog: www.worldcampus.psu.edu. Students interact one-on-one with their
instructors. Group work and student-to-student interaction are not required.
Independent Learning Web Optional = Web access is not required. An optional Web site
and e-mail lesson submission may be included. Optional Web sites are intended to
provide students with additional resources, though using them is not required. Though
you are encouraged to complete this course within five months, you have up to six
months for course completion. These courses do not have fixed start and end dates.

6
Students interact one-on-one with their instructors. Group work and student-to-student
interaction are not required.
Independent Learning = Web access is not required, and there are no optional Web
materials. E-mail lesson submission may be included. Though you are encouraged to
complete this course within five months, you have up to six months for course
completion. These courses do not have fixed start and end dates. Students interact
one-on-one with their instructors. Group work and student-to-student interaction are
not required.
Although the legend and more detailed course descriptions can be found on page 13 of
the 79-page print catalog, the actual courses are labeled as follows:
OnLnGrp, OnLnIn6, OnLnInS, ILWO, or IL
(Online Group, Online Individual Six Months, Online Individual Semester Based,
Independent Learning Web Optional, Independent Learning)
Are new distance education students able to de-code these labels? Even if they find and
read the legend and the more detailed course descriptions, will they really understand
what they signed up for? Even the most casual observers note that the adult learners of
today are speaking up more frequently — and more forcefully — when they experience
frustration with their distance education experience. Will learners be satisfied with their

7
distance education course even if it is not the model they expected or preferred? If the
learners aren’t satisfied, how successful can they be?
A dissatisfied student is more likely to drop the course, leave the program, discontinue
his or her education, and also, potentially cast the program and institution in an
unfavorable light altogether (Quality on the Line: Benchmarks for Success in Internet-
Based Distance Education 2000). Thus, in addition to educational implications of non-
matriculating students, and the financial implications of lost revenue, there is an
additional concern for the damage done to an institution’s name and reputation among
multiple constituencies: other students, alumni, and employers.
Purpose of the Study
The purpose of this study is to gain a better understanding of how learner expectations
and preferences for the distance learning environment impact satisfaction with those
learning environments and learner perceptions of the experience with the course overall.
The Independent Study experience offers the benefit of maximum flexibility and access.
Limiting factors include the lack of a collaborative learning environment and the
requirement that the learner be self-disciplined in establishing his or her own pacing of
assignment completion. The Independent Study experience limits students to interaction
only with the instructor. The Online Group experience offers the benefit of a fully
interactive and collaborative experience and more formally structured pacing. Limiting
factors include less flexibility and more limited access due to technological requirements
and synchronous group activities. If learners new to the distance education experience

8
were expecting or preferring an Independent Study experience (“any time, any where”),
but actually find the course to be an Online Group experience, would this impact their
overall satisfaction with the course itself?
Research Questions
This study was designed to explore two primary research questions.
Research Question 1: Will students who are placed in a distance learning environment
that is congruent with their expectations have higher satisfaction levels?
Research Question 2: Will students who are placed in a distance learning environment
that is congruent with their preferences have higher satisfaction levels?
Null Hypotheses
The null hypotheses for this study were as follows:
Ho1: There will be no significant differences in satisfaction among students when
the distance learning environment is congruent, or not congruent, with their expectations.
Ho2: There will be no significant differences in satisfaction among students when
the distance learning environment is congruent, or not congruent, with their preferences.

9
Ho3: There will be no interaction between congruent expectations and congruent
preferences on satisfaction among students.
Significance of the Study
In our consumer-oriented society, learners increasingly are approaching the education
experience with a higher degree of sophistication and “savvy.” While university
administrators and faculty members eschew the concept of education as a consumer
product, we can no longer discount the expectations and preferences of our learners as
they compare options. In fact, with the rising cost of higher education, outpacing
inflation, students’ consumer-oriented approach seems quite rational and logical. The
rising cost of education and a competitive job market may mean that fewer students will
be able or inclined to leave the workforce in order to pursue their educational goals full
time (U.S. Department of Education 2004). In addition, today’s fast-paced, multi-task-
oriented society results in the learners’ need to find flexible programs that will best help
them meet their educational goals — programs that take into account the competing
interests of work, family, and personal needs. Institutions of higher education would be
well-served by research that attempts to better understand the expectations and
preferences of learners, particularly part-time learners, in order to gain a better
understanding of how satisfied they are with the learning experience overall — with not
just the content, but also the presentation, format, and structure of that content. Closer
examination of these variables need not spur the commodification of education, but can
help ensure better learning outcomes overall. This study represents one modest step in
that direction.

10
Conceptual Framework
This study involves several key instructional design concepts: learner satisfaction, learner
expectations, learner preferences, collaboration, and learning styles.
Learner Satisfaction
Learner satisfaction may be an indicator of several important learning conditions: ability
of the learner to thrive and succeed, learning outcomes, and student retention (Roberts,
Irani, Telg, and Lundy 2005). If a learner is placed in an environment that is congruent
with his or her expectations, will he or she be more satisfied? If a learner is placed in an
environment that is incongruent with his or her expectations, will he or she be less
satisfied? What about congruence with learner preferences? If learner expectations are
clearly established up front, through improved communications about the distance
education environment or through effective orientation practices, does that overcome
possible incongruence between actual and preferred learning environment? The answers
to these questions have important implications for how we select course instructional
design models and the time we spend preparing and orienting both students and
instructors. Student satisfaction with his or her first online course is critical to successful
matriculation through an entire online program (Conrad 2002).
Learner Expectations
Learner expectations play an important role in “setting the stage” for the online student.
In a survey of online learners, subjects reported that two of the most compelling reasons

11
for pursuing this form of study were career advancement and the ability to have
flexibility in balancing family and work issues during week days (Aviv 2004). If the
student signs up for a course expecting an independent study experience with less
structure and maximum flexibility, learner satisfaction will likely be impacted when the
student finds himself/herself in an online asynchronous course that is highly collaborative
and quite structured with limited flexibility.
Learner Preferences
Learner preferences are another important variable, distinct from expectations. A learner
may expect an independent learning experience, but actually prefer an environment that
is more collaborative, fulfilling a preference for social contact with other members of the
learning community. Conversely, a learner may find collaborative experiences
intimidating or unrewarding, instead preferring the relative anonymity and self-directed
environment offered through independent study. Online learners have reported that they
preferred to be more self-directed, as opposed to having structure imposed, tended to be
more independent rather than collaborative, and preferred more flexibility rather than less
(Brown, Kirkpatrick, and Wrisely 2003).
Collaboration
In collaborative learning environments there is a significant correlation between
achievement and helping behaviors (Hooper 1991, 1993) — the idea that two heads are
better than one (Heywood 1546). In a collaborative or cooperative learning environment,

12
there is a positive interdependence among students. Students perceive that they can reach
their learning goals only if others reach their goals too (Deutsch 1949, 1962).
Learning Styles
Learning styles refer to the cognitive strategies that individuals may employ to acquire
knowledge. They are an individual’s preferred strategies for gathering, interpreting,
organizing, and thinking about new information (Gentry and Helgesen 1999).
Gunawardena and Boverie (1992) found that although learning styles did not affect the
way students interact with educational media, their learning styles did correlate with their
satisfaction levels with class discussions and other group interactions.
Theoretical Framework
Keller’s ARCS Model of Motivation
The field of educational communications and technology has tended to focus on the
factors that contribute to well-designed instruction. The assumption has been that well-
designed instruction will result in a motivated learner. In reality, studies have shown that
high-quality, well-designed instruction does increase learning and improve performance
when students successfully complete their coursework (Keller 1983). However, large
numbers of students have also dropped out along the way and failed to meet their
educational goals (Alderman and Mahler 1973; Johnston 1975; Gibson and Graff 1992;
Nash 2005). Beyond the more traditional behavioral and cognitive research into how
people learn, John Keller developed his Attention, Relevance, Confidence, Satisfaction
(ARCS) theory in an attempt to better understand why people learn and the motivational

13
factors that increase the likelihood that they will learn (Keller 1979, 1983, 1987). This
research study will focus on two particular aspects of Keller’s model — expectancy and
satisfaction — and will discuss how a third aspect, relevance, relates to the independent
variable of preference, as explored in this study.
Keller’s model suggests that well-designed instruction increases learning and
performance when the learner is motivated to complete the instruction. The current study
posits that when instruction is consistent with learner preferences, then instruction
matches learner values. Matching instruction with learner preferences and values results
in greater effort and satisfaction. Keller’s model also suggests that if instruction is
consistent with expectations, then instruction is experienced as a positive contingency or
consequence leading to greater satisfaction and effort.
Kirkpatrick’s Four Levels of Evaluation
Just as Keller’s ARCS model provides a theoretical framework for the concepts of
expectations, preferences, and satisfaction and the role they play in educational
environments, Kirkpatrick’s Four Levels of Evaluation provides a framework to
understand and interpret the role of satisfaction in evaluating educational environments,
compared to other metrics for evaluating education and education outcomes (Kirkpatrick
1959a, 1959b, 1960a, 1960b, 1994, 1996).
Again, at a minimum, assessing distance education at Kirkpatrick’s Level One,
satisfaction, assures that students like the Online Group courses. If they like the Online

14
Group courses, even when there are gaps in learner expectations and preferences, it
would be one indicator that the benefits of online collaborative learning environments
outweigh the costs. Though the current study will only examine Level One outcomes,
future distance education studies should look at Level Three, Four, and Five outcomes.

15
Definition of Terms
Adult Student: A student, typically 24 years of age or older, who is returning to school
after four or more years of employment, homemaking, or other activity; assuming
multiple roles such as parent, spouse/partner, employee, and student.
Collaborative Learning: A learning environment that facilitates group activity — a
group of learners working together to explore topics, solve problems, and build meaning.
Congruent Expectations: A situation in which the learner’s expectation for a particular
type of learning environment (collaborative versus independent, structured versus
flexible) is consistent with the type of learning environment he or she is placed in.
Congruent Preferences: A situation in which the learner’s preferences for a particular
type of learning environment (collaborative versus independent, structured versus
flexible) is consistent with the type of learning environment he or she is placed in.
Cooperative Learning: A learning environment that facilitates group activity in a
highly structured and formalized way. Group members have specialized and well-defined
roles and are presented with a task that is highly structured and well defined. There is
formal accountability for group learning.

16
Distance Education Course: A course that is taught from a distance and does not
require the student to travel to a classroom building. The student is not required to meet
with the instructor in the same physical space.
Extrinsic Motivation: Rewards that result from environmental influences on the learner
or external assessments of performance.
Independent Study: A course environment that does not require nor facilitate
collaboration with other students. There is no social context or community of practice.
Individual students are isolated from one another and interact only with the course
instructor. Students set their own schedules with no fixed start or end date.
Intrinsic Motivation: Rewards that result from the learner’s internal emotional response
and self-assessment of performance.
Learning Styles: An instructional strategy that matches instructional materials and the
presentation of those materials with the learner’s needs and preferences.
Locus of Control: A learner’s expectation that rewards are the result of either internally-
or externally-controlled factors.
Motivation: The educational choices learners make and the degree of effort they will
exert in reaching their educational goals.

17
Online Group Instruction: A distance education course that requires web access.
Students interact with their instructors and other students. Group work is required.

18
Chapter 2
Review of the Literature
The literature reviewed in preparation for this study included motivation theory — and
Keller’s ARCS Model in particular — in addition to the body of research pertaining to
learner expectations and learner preferences. Within the broader topic of collaboration,
research in the area of cooperative learning is reviewed. The literature on learner
satisfaction is reviewed also — with specific reference to Kirkpatrick’s Four Levels of
Evaluation model.
Keller’s ARCS Model of Motivation
Keller identified four major dimensions of learner motivation: attention or interest,
relevance, expectancy of value or confidence, and satisfaction (Keller 1979). Attention
refers to the ability of the instruction to arouse curiosity and sustain learner interest over
time. Relevance refers to learner perceptions that the instruction will meet their
educational needs and goals. Expectancy refers to the learner’s perceived likelihood of
success and his or her perception that success is under his or her control. In later
refinements of his model, Keller called this dimension “confidence” (Keller 1987).
Satisfaction refers to the learner’s intrinsic motivation and his or her reaction to
extrinsic rewards.
Keller’s model identifies the primary categories of learner behavior and instructional
design that are related to learner effort and performance. It also leads to predictions about

19
motivation, learning and satisfaction and, at a prescriptive level, enables us to make
predictions about how we can influence these variables by manipulating the instructional
environment, particularly with respect to the types and frequency of interaction.
Keller’s model of motivational design shows that the primary influences on learner effort
are motives and expectancies (see Figure 1).

20
Figure 1
Keller’s Model of Motivation, Performance, and Instructional Influence
(Keller 1979, page 392))
Person Inputs:
Outputs:
Environmental Inputs:
Motives (Values)
Expectancy
Individual Abilities
Skills, and Knowledge
Cognitive Evaluation,
Equity
Performance
Consequences
Effort
Learning Design and
Management
Contingency Design and
Management
Motivational Design and
Management

21
Together, these comprise the components of Keller’s expectancy-value theory (Keller
1979). Keller’s theory holds that learners will approach activities and goals that are
personally satisfying — goals for which the learner has a positive expectancy for success.
Thus, motivation is the product of both expectancies and values. Values encompass
learner dimensions such as curiosity and arousal (Berlyne 1965), needs (Maslow 1954,
McClelland 1976), beliefs and attitudes (Rokeach 1973, Feather 1975). The concept of
learner preferences is closely aligned with Keller’s description of values. Although a
learner might value an instructional tool, such as the feedback they get from a pop quiz,
without necessarily preferring it, it is difficult to imagine an instructional tool that a
learner would prefer, without placing some value on it.
Expectancy, in the ARCS Model, includes learner dimensions such a locus of control,
attribution theory, and self-efficacy (Keller 1979). Each of these theories, in turn,
attempts to explain the development and the effect of learner expectations for success or
failure as they relate to learner behavior and its consequences. Self-efficacy refers to the
learner’s self-evaluation of his or her ability to complete a given task (Bandura 1986).
Attribution theory describes how learners’ expectations are determined, in part, by their
attributional conclusions (Weiner 1980). For example, a learner who attributes his or her
success to personal effort or ability will increase his or her expectations for success. On
the other hand, a learner who attributes his or her success to luck, or some other external
factor, will decrease his or her expectation for success. Locus of control refers to a
learner’s expectations about controlling influences on reinforcement (Rotter 1966, 1972).
An internally oriented learner tends to assume that positive reinforcements, like good

22
grades, are most likely the result of personal effort. An externally oriented learner tends
to assume that, regardless of personal ability or effort, positive reinforcements are most
likely a matter of chance or circumstances.
In Keller’s model, the combined impact of values and expectations determine the
level of effort the learner will put into a task. Expending effort indicates some
degree of motivation on the part of the learner. Effort indicates motivation.
Performance and consequences, however, are measures of actual accomplishment.
Performance is influenced by other personal inputs including individual abilities,
skills and knowledge. Consequences are a measure of learning and satisfaction.
Consequences and satisfaction, in turn, provide the learner with feedback, which
influences learner values and expectations.
Following an instructional activity, the learner will experience an internal, intrinsic
emotional response such as excitement, fear, pride, or embarrassment. The learner may
also receive an external, extrinsic response such as praise, criticism, a good grade, a poor
grade, or a prize. Both categories of responses have an effect on the reinforcement of
motivation — both positive and negative (Deci 1976, Condry 1977). The relationship
between the two is complex. Studies have shown that there are conditions under which an
extrinsic reward actually results in decreased intrinsic motivation (Deci and Porac 1978).
In Keller’s model, the three opportunities to influence the overall instructional design are
through motivational design, getting the learner’s attention; learning design, developing
the instruction that best suits the task and learner abilities, skills and knowledge; and

23
reinforcement contingency design, which focuses on giving the learner the appropriate
kinds of feedback and interaction at the appropriate times.
At a descriptive level, Keller’s model helps instructional designers make predictions
about the relationships between learning, motivation, performance and satisfaction. At a
prescriptive level, it has been used to make predictions about how learner characteristics
can be influenced by manipulating components of the instructional environment —
several of which apply to the current study, including:
1. Intrinsic motivation decreases when locus of control shifts
from internal to external. In the current study, locus of
control for course structure and flexibility shifts from
internal to external as the course design model shifts from
independent study to online group.
2. There will be a decrease in intrinsic motivation if a
person’s feelings of competence and self-determination are
reduced. In the current study, intrinsic motivation might be
expected to decrease as the schedule and pacing of the
course is more externally driven and course assessment
becomes more heavily dependent on collaborative group
activities or cooperative tasks that rely on peer- or
instructor-determined activities and assessments.
24
3. Every reward, including instructor feedback, has two
elements, a controlling element and an informational
element (Keller 1983). If the controlling element is
dominant, it will influence the learner’s perceptions of
locus of control and causality. The controlling influence is
often responsible for the decrease in intrinsic motivation. In
the current study, the online group course design might be
perceived as being more controlling by the learner if the
feedback is more structured, automated and general — a
common strategy for managing large online groups — as
opposed to being more personalized in an independent
study experience.
Kirkpatrick’s Four Levels of Evaluation
Kirkpatrick’s model of evaluation suggests four levels of assessment: reactions, learning,
transfer, and results. According to Kirkpatrick’s model, assessment should always start
with the first level – the reactions of the learners – moving up to higher levels as time and
resources permit. (See Figure 2.)
At Level One, Reactions, the evaluator begins to examine learner perceptions: Did they
like the course? Was the material relevant to their work? Did the delivery format fit their
needs? This level has been referred to as the “smile-sheet”evaluation. Level Two
Evaluation, Learning, focuses on testing. Did the material lead to mastery of learning

25
objectives and enable the learner to score well on a test? Level Three, Transfer, relates to
measurable job improvement. Did the material improve the learner’s job performance?
Level Four, Results, looks at overall organizational improvement. Did the training result
in higher profits, increased customer service, etc.?

26
Figure 2
Kirkpatrick’s Four Levels of Evaluation (Kaufman, Keller, and Watkins 1995, page 91)
5
Societal Benefits
Continuous
Feedback
4
Results
3 Transfer
2 Learning
1
Reaction

27
Kirkpatrick believed that effective course evaluation should always start with the base
level – an assessment of learner satisfaction – to insure continuous improvement in
learning outcomes. As summarized by the Encyclopedia of Educational Technology,
“Although a positive reaction does not guarantee learning, a negative reaction almost
certainly reduces its possibility (Winfrey 1999, page 1).”
It has been estimated that more than 90 percent of companies surveyed have used some
form of the Kirkpatrick Model to evaluate their training and professional development
programs at one time or another (Bassi, Benson, and Cheney 1996). Many attempts have
been made to modify the model or present alternatives since the model was developed in
the late 1950s, including modifications suggested by John Keller (Kaufman and Keller
1994; Holton 1996a, 1996b). An updated Organizational Elements Model (OEM)
proposed by Kaufman, Keller and Watkins suggested the addition of a Level Five to
evaluate contributions made to society and external clients by a given training program
and also incorporated a more proactive emphasis on continuous or formative evaluation,
rather than relying only on summative data as a guide to improving instruction (Kaufman,
Keller, and Watkins 1995). In the current study, Level Five evaluation might encompass
contributions that effective online education conveys to society. These might include:
increased employment, greater productivity, scientific discoveries, and inventions — all
of which contribute to our global economic engine and the betterment of society as a
whole. Original or updated, Kirkpatrick’s Model has remained a standard in business and
industry for almost 50 years (Cascio 1987; Alliger and Janak 1989; Kirkpatrick 1996;
Boyle and Crosby 1997; Naugle, Naugle, and Naugle 2000; Abernathy 2004).

28
As suggested by Boyle and Crosby, numerous benefits may accrue in applying the
Kirkpatrick Model of evaluation to higher education in general (Boyle and Crosby 1997).
At the base, Reactions Level, measuring satisfaction with distance education courses
ensures that students like the courses and programs. If learners like the courses and
programs, distance education providers will be more likely to retain them as students.
Evaluating courses and programs at Level Two, Learning, ensures that students are
learning the material they are supposed to be learning. In Kirkpatrick’s Model, this would
prepare them for success at Level Three, which evaluates Transfer – the students’ ability
to translate the learning into applied settings such as the workplace. For higher education,
this is particularly important. As tuition costs rise and job markets become more
competitive, it is increasingly important for students to master the skills and
competencies that they need to succeed in the job market. The quality of the learning
experience and its application to the world of work are key to justifying its cost, and the
pursuit of higher education as a worthwhile experience overall. Closely related to
Transfer, at Level Three, is the evaluation of Results, at Level Four. Perhaps more so
than in business or industry, education serves a complex group of stakeholders and
constituencies. Beyond results measured from the perspective of the learner are results
measured from the perspectives of faculty, parents, the community, and employers.
Having mastered the skills and competencies they need to succeed and compete in the job
market, results in terms of student performance translates into satisfaction among these
many and diverse constituencies, including alums and donors. Satisfaction among all
29
these constituencies serves to enhance the value and prestige that are attributed to a
particular institution or online education provider.
Learner Satisfaction
A large body of research shows that numerous factors have been associated with distance
education satisfaction. These factors include: learner attitudes toward instructional
technology, prior experience, and skill — which all positively affect learner satisfaction.
A meta-analysis of relevant empirical literature by Allen, Bourhis, Burrell, and Mabry
showed that more experience and orientation also correlate strongly with positive course
evaluations and learning outcomes (Allen, Bourhis, Burrell, and Mabry 2002). In their
study, Allen, Bourhis, Burrell, and Mabry reviewed more than 450 manuscripts and
compared student preferences for distance education versus traditional classroom
formats. They also examined differences in satisfaction between the two delivery
methods. The researchers found a slight preference for traditional classroom formats, but
very little difference in satisfaction levels. Allen, Bourhis, Burrell, and Mabry
hypothesized that learners would be more satisfied with the more collaborative and
interactive communication channels, however, the research did not support that finding.
Results showed that the advantage of face-to-face instruction over distance education on
student satisfaction is actually greatest when the distance instruction is more fully
interactive (Allen, Bourhis, Burrell, and Mabry 2002). This finding suggests the more
collaborative Online Group model may not lead to increased satisfaction.
Other factors that contribute to learner satisfaction include the relative anonymity that
learners enjoy in an online course, which may encourage greater freedom of expression.

30
Moore (2002) has reported that feelings of dissatisfaction in the online course
environment arise from: lack of confidence, fear of failure, lack of experience, lack of
prompt feedback, loneliness, lack of face-to-face contact, and fear of expressing a
minority opinion. Learner dissatisfaction may also arise from: ambiguous course
instructions, too many postings, and excessive time requirements. Ambiguous course
instructions, multiple postings, and excessive time requirements are characteristics that
may by shared by many Online Group course models. Orchestrating collaborative
discussions and cooperative working groups tend to increase the complexity of the course
design and structure — particularly when there are large numbers of students enrolled per
course. Learner control is another factor that impacts learner satisfaction. Moore has
found that, on the whole, online instructional environments tend to support learners who
prefer to have more control and who prefer to have more time to compose their responses
(Moore 2002). In the current study, Online Group course formats would tend to decrease
learner control while Independent Study formats tend to increase learner control.
Research on learner satisfaction has also found that course organization is very important
to online learners. Respondents to Conrad’s 2002 study indicated they would be most
satisfied: if they could access the course web site at least two weeks in advance so they
could familiarize themselves with the navigation of the site, ensure that detailed course
content was in place, and map out a timeline for themselves to complete the coursework.
Seventy-eight percent of the respondents also indicated that they did want to see a
message posted from the instructor on the course web site from one to three weeks before
the start of the course. In contrast, 72-percent did not want to see messages posted by

31
other students before the start of the course and 80-percent did not expect to see messages
posted by other students before the start of the course. Instead, learners indicated that it
was their engagement with the course content and the organization of the course overall
mattered most (Conrad 2002). Toward that end, Conrad found that instructors were
evaluated on the degree of clarity and completeness they demonstrated in preparing that
course content (Conrad 2002).
Interactions between the instructor and learner increase social presence and instructional
immediacy – both of which correlate positively with learner satisfaction (Christopher
1990, Swan 2001). In a study of 1,108 students enrolled in online courses through the
SUNY Learning Network, Swan asked learners 12 questions related to their perceptions
of satisfaction, perceived learning, and course activity and compared this data to course
design factors (Swan 2001). The results showed that learners who perceived high levels
of interaction with their instructor also had high levels of satisfaction and reported higher
levels of learning than students who reported less interaction with the instructor.
Although learners who also perceived high levels of interaction with their classmates
reported higher levels of satisfaction and learning, interaction with instructors seemed to
have a much larger effect on satisfaction and perceived learning than interaction with
peers (Swan 2001).
Other studies have shown that learner satisfaction with the structure and interaction of a
distance education course led to greater satisfaction with perceived knowledge gained
(Gunawardena and Zittle 1997; Gunawardena and Duphorne 2000; Stein, Wanstreet,

32
Calvin, Overtoom, and Wheaton 2005). The Gunawardena and Zittle study was the first
of a two-phase study that attempted to identify the variables related to learner satisfaction
with online conferencing. The study identified social presence as a predictor of overall
learner satisfaction (Gunawardena and Zittle 1997). The Gunawardena and Duphorne
study examined 50 students from five universities who participated in the fall 1993
GlobalEd inter-university online conference. At the conclusion of the conference learners
completed a 61-item questionnaire. The questionnaire was designed to analyze: learners’
self-reported satisfaction levels, learner readiness, online features, and computer-
mediated instructional approaches (Gunawardena and Duphorne 2000). Results showed
that learner readiness, online features, and computer-mediated instructional approaches
were all significantly related to learner satisfaction. Online features showed the strongest
relationship with satisfaction. When learners understood the features of the online
program they were most likely to be satisfied with the experience overall (Gunawardena
and Duphorne 2000).
On the whole, the literature suggests that learner interaction with well-organized and
appropriate-level content is cited as being most important to their overall satisfaction.
The second most important factor, frequently cited, is the level of instructor interaction
and promptness. Online learners tend to cite interactions with classmates as being the
least important of the three interactions. Overall, these findings suggest that the switch
from the Independent Study to the Online Group model may significantly impact
satisfaction. As the levels of learner control and interaction differ substantially under
these two models, so does the potential gap in learner expectations and preferences.

33
Learner Expectations
Although there is not a large body of research on expectations, the studies that have been
conducted indicate that a disconnect between learner expectations and the course
environment may impact learner satisfaction in significant ways. Students new to the
environment tend to approach online learning with a degree of fear and anxiety. In
addition to the role of the instructor and interaction with peers, the overall course design
and organization plays a primary role in learner satisfaction. In a study conducted to gain
a better understanding of how learners’ perceptions of their first online course contributed
to their sense of engagement and satisfaction, Conrad surveyed students in a new online
program and asked them how they felt about their experience logging on to an online
course for the first time (Conrad 2002). Learners were asked to describe their experiences
and expectations for online study through both quantitative and qualitative measures:
how far in advance of the start of the course they expected the web site to be available,
when they expected to find communications from their instructor or classmates, and the
types of introductory instructional events they felt were important. The learners were also
asked to describe their sense of engagement and the instructional events that made for
“good” versus “bad” beginnings. Conrad found that many online learners described
emotions of fear and anxiety, which held true whether they were novice or more
experienced learners. First and foremost, learners expected an online environment that
was well organized and accessible at least two weeks before the start of the course
(Conrad 2002).

34
Studies have consistently shown that online learners expect the instructor to respond to e-
mail messages and return assignments in a timely manner (Caswell 1999, Hara and Kling
2000, Vonderwell 2003, Muirhead 2004, Dahl 2004,). In one study, 87 percent of
students said they expected the instructor to respond to their e-mails within 24 hours
(Jensen, Riley, and Santiago 2004). In the same study, 31 percent of students said they
expected the instructor to respond within 24 hours even on the weekends (Jensen, Riley,
and Santiago 2004).
Learner expectations do appear to be changing over time. As the cost of higher education
has shifted from the government to the student, so has the students’ expectations shifted
from passive recipient to involved consumer (Stevenson and Sander 1998, Davis 2002,
Tricker 2003).
In general, online learners expect convenience and flexibility and want to pursue their
studies independently (Garrison and Anderson 2003). They want interactivity with the
instructor, in particular, along with a sense of community, sufficient direction, and
empowerment (Pallof and Pratt 2003). They want: flexibility and choice, access to the
latest technology, a two-way conversation with the university, full information about
course requirements, quality and professionalism in content delivery, and access to
information about career pathways and employment opportunities (Tricker 2003; Tennet,
Becker, and Kehoe 2005).

35
Learner Preferences
The body of literature on learner preferences is more robust — particularly as it relates to
preferred learning strategies and amount of learner control. Matching students with
preferred amounts, elements, or sequencing of instruction has been shown to yield
significant positive attitudes (Gray 1987; Kinzie, Sullivan, and Berdel 1988; Ross,
Morrison, and O’Dell 1988; Freitag and Sullivan 1995; Hannafin and Sullivan 1996).
However, students’ preferences and judgments often may not be good indicators of how
they learn best (Schnackenberg, Sullivan, Leader, and Jones 1998). A study by
Schnackenberg, Sullivan, Leader, and Jones explored the effect of program mode — a
lean version of an online teacher preparation program with limited practice, versus a
longer version of the same program with more practice. A total of 204 juniors at a large
southwestern university responded to a pre-course questionnaire consisting of 10 items
that asked learners about their preference for amounts of information and practice in
learning new concepts both online and in the physical classroom environment. The
leaner version of the online teacher preparation program contained two practice items per
objective. The longer version of the online teacher preparation program contained four
practice items per objective. Subjects indicating a preference for the low or lean version
were randomly assigned to either the lean version (matched preference) or long version
(unmatched preference) of the course. The results showed that subjects in the longer
version that contained more practice scored significantly higher on a posttest than those
containing less practice. Assigning subjects to their preferred amount of practice did not
show a significant achievement difference over assigning them to their less preferred

36
amount. Learners preferred the shorter version even though the longer version resulted in
higher achievement (Schnackenberg, Sullivan Leader, and Jones 1998). Studies have
found that learners had more positive attitudes toward instructional environments that
allowed them a greater degree of learner control (Hintze, Mohr, and Wenzel 1988; Kinzie
and Sullivan 1989; Igoe 1993). There is also evidence that giving learners partial control
over the learning environment results in more favorable attitudes than giving them full
program control (Schnackenberg, Sullivan, Leader, and Jones 1998). In the current study,
the Online Group model would tend to decrease learner control while the Independent
Study model would tend to increase learner control.
One study found that an unequal distribution of learner expertise within the online
learning environment prevented equal participation in group projects. Technology
novices were learning to use the tools while experts were busy using them. Learners
suggested the need for better training and orientation on not only the use of web tools, but
also on effective collaboration (Murphy and Cifuentes 2001). In this case study, Murphy
and Cifuentes conducted a content analysis of postings in an online discussion forum and
the results of a focus group discussion about collaboration with other students in online
courses. The subjects were 13 graduate students enrolled in an educational technology
course. None of the subjects had participated in an online course before. Results indicate
that learners prefer to get to know each other and need to learn to respect individual
differences, negotiate meaning and self-regulate – imposing their own structure, time
lines, and due dates (Murphy and Cifuentes 2001).

37
On the whole, learners tend to have more positive attitudes toward the instructional
environment if they are given a greater degree of control. In addition to some degree of
control, learners prefer to have some form of advanced training or preparation. This could
take the form of a formalized orientation experience — or be as simple as providing them
full access to the instructional content well in advance of the course start date.
Collaboration
The pedagogical movement away from Independent Study models of course design
toward Online Group models is based largely on empirical research in the field of
educational technology. This research has repeatedly shown that collaborative, computer-
based learning groups, structured in a way that encouraged cooperation and
interdependence among group members, significantly out-performed individuals engaged
in computer-based learning (Johnson and Johnson 1989). In their 1989 study, Johnson
and Johnson did a meta-analysis of more than 750 research studies on collaborative
versus independent learning and found strong positive correlations between cooperation
and achievement and productivity, stronger interpersonal relationships, and psychological
health and well being (Johnson and Johnson 1989). In more recent studies Johnson and
Johnson found that college-level learners engaged in cooperative learning groups —
collaborative learning environments that created positive interdependence between group
members — engaged in significantly more interaction, were more supporting of each
other’s learning, and achieved higher scores on a series of weekly electronic quizzes on
human anatomy and physiology (Johnson and Johnson 2002).

38
Whether the cooperative groups were heterogeneous or homogeneous in terms of ability,
researchers generally found that two — or more — heads were better than one. Students
working in cooperative groups tend to be more supportive of each other’s feelings and
generate more ideas. (Hooper and Hanafin 1988). Studies have shown that low-achieving
students can benefit from working cooperatively with high-achieving students (Hooper
1992, Singhanayak and Hooper 1998). In their 1998 study, Singhanayak and Hooper
assigned 92 sixth-grade students to group or individual learning treatments, stratified by
scores on the Stanford Achievement Test. They found that both low- and high-achieving
students assigned to cooperative work groups performed significantly better and had
more positive attitudes toward collaborative learning than students working individually,
regardless of the amount of learner control. Low achievers showed the greatest
improvement in the program-controlled condition. However, high achievers showed the
greatest improvement in the learner-controlled condition (Singhanayak and Hooper
1998). Other studies have shown that both low- and high-achieving students can benefit
significantly from cooperative learning, when working in teams on a computer-oriented
task (Hooper and Temiyakarn 1993).
The current study will further explore how high levels of interaction with the instructor
and other students, and reduced flexibility — all traits of the collaborative Online Group
model — may impact learner satisfaction.

39
Learning Styles
One of the largest and most significant bodies of literature on learner satisfaction and
achievement relates to learning styles. Studies have found that field-independent learners,
who are accustomed to structuring their learning environment, do not need or want much
social interaction. They tend to be intrinsically motivated and also tended to score higher
on examinations when enrolled in a distance education course (Childress and Overbaugh
2001). Childress and Overbaugh explored the relationship between learning styles and
achievement. The subjects, pre-service teachers, were evaluated and sorted into field
dependent and field independent conditions. The subjects were then enrolled in either a
one-way video or two-way audio course. Childress and Overbaugh found that the field
independent learners, those who could impose their own structure to the learning task, did
not require the same level of interaction, were more intrinsically motivated, and scored
higher on the final exam (Childress and Overbaugh 2001). In the current study, the
Online Group model would tend to be more structured, while the Independent Study
model would tend to be less structured with respect to pacing and level of interaction.
Differences in learning styles and learning preferences may suggest the need for
providing instructional material in multiple formats. However, a learner may erroneously
choose one format over another thinking that it will be easier or more flexible than
another format. Also, developing and maintaining multiple instructional formats would
likely be cost prohibitive (Allen, Bourhis, Burrell, and Mabry 2002).

40
In another study of 92 students enrolled in either satellite-based synchronous study and
73 students enrolled in a combination of synchronous satellite and asynchronous online
instruction, the researchers were surprised to find that both the synchronous satellite and
asynchronous mixed groups rated the interaction components as not very important or
contributing to their overall learning experience. Students chose the synchronous satellite
instruction, but that didn’t mean they wanted to take advantage of the opportunity to
interact with the classmates (Beth-Marom, Saporta, and Caspi 2005). In their study, Beth-
Marom, Saporta, and Caspi administered a learning-habit inclinations questionnaire to
288 subjects enrolled in a synchronous satellite-based research methods course and a
mixed learning group of both synchronous satellite-based and an independent study form
with pre-recorded discussion. Subjects were asked to respond to items related to: rate of
attendance; attitude toward the instructor and the lessons; attitudes toward interacting, or
not interacting, with peers; and their attitudes toward distance delivery compared to face-
to-face delivery. Subjects in the synchronous satellite course were also asked about their
attitudes toward an independent study option. Results showed that: most learners
preferred a face-to-face environment over an online environment and two-thirds preferred
the flexibility of an independent mode of study over a synchronous, group-based satellite
delivery. In both the independent (asynchronous) and satellite group-based (synchronous)
versions, subjects said the interaction components were not highly valued or beneficial
(Beyth-Marom, Saporta, and Caspi 2005).
Results of the Beyth-Marom, Saporta, and Caspi study also seem to indicate that subjects
did not particularly value the interaction with the instructor — at least in the manner in

41
which they were conducted by synchronous satellite delivery or asynchronous tape-based
delivery. However, in moving the content from live, satellite-based delivery to tape-based
delivery, subjects may have viewed their interactions to be learner-content based rather
than learner-instructor based. In this study, subjects reported that the highest interaction
score was between the learner and the content and was also reported as being the most
useful (Beyth-Marom, Saporta, and Caspi 2005).
A study by Gunawardena and Boverie looked at distance education courses that were
delivered via audio-graphic and computer-mediated instruction, compared to a traditional
face-to-face classroom. The interaction of learning styles, media, method of instruction,
group functioning, and support were examined after the Kolb Learning Styles Inventory
(1985). A questionnaire was administered to 74 students in a mix of distance education
and traditional classrooms (Gunawardena and Boverie 1992). The researchers concluded
that learning styles did not impact learners’ interaction with media and methods of
instruction. Learning styles did impact their satisfaction with the collaborative learning
activities, however (Gunawardena and Boverie 1992).
Summary
In summary, the literature shows that learners are motivated by their expectation for
success and the perception that success is under his or her control (Keller 1987). Values
or preferences, and expectations, determine the amount of effort a learner will put forth.
Performance, however, reflects actual accomplishment (Keller 1979). Keller’s model
suggests that performance is measured through an examination of learning and

42
satisfaction —the learner’s intrinsic motivation and his or her reaction to extrinsic
rewards (Keller 1987). Kirkpatrick’s evaluation model, a standard in business and
industry, similarly supports the notion that satisfaction should be the foundation of
program assessment (Kirkpatrick 1959, 1960, 1970, 1994, 1996). The body of research
on learner satisfaction tells us that learner attitudes toward technology, prior experience,
and skill have all been correlated with distance education satisfaction (Allen, Bourhis,
Burrell, and Mabry 2002). Learner interaction with well-organized content is consistently
cited as being most important (Gunawardena and Duphorne 2000; Conrad 2002; Stein,
Wanstreet, Calvin, Overtoom, and Wheaton 2005). Learner interaction with the instructor
correlates positively with satisfaction (Christopher 1990, Swan 2001, Moore 2002). The
literature also suggests that learner interaction with classmates doesn’t always lead to
increased satisfaction (Allen, Bourhis, Burrell, and Mabry 2002), and in fact, can
decrease satisfaction (Conrad 2002). Similarly, learners expect a well-organized course
and expect the instructor to respond in a timely manner (Caswell 1999, Hara and Kling
2000, Conrad 2002, Vonderwell 2003, Dahl 2004, Muirhead 2004). Finally, learners
expect and prefer a high degree of flexibility in their distance education course (Garrison
and Anderson 2003; Tricker 2003; Aviv 2004; Tennet, Becker, and Kehoe 2005). The
body of research on learner preferences suggests that the amount of learner control is
another significant variable (Gray 1987; Kinzie, Sulivan, and Berdel 1988; Ross,
Morrison, and O’Dell 1988; Freitag and Sullivan 1995; Hannafin and Sullivan 1996;
Moore 2002).

43
Chapter 3
Methodology
Subjects
Within the Penn State World Campus, as of June 30 2006, there were approximately
4,000 learners enrolled in independent study courses that are primarily print based. There
were another 3,300 learners enrolled in online group courses that require a high level of
collaboration and interaction with the instructor and with other students in the course.
Subjects for this study were selected from eleven introductory, online group courses:
Adult Education 460, Curriculum and Instruction 550, Educational Psychology 421,
Educational Technology 400, Geography 482, Instructional Systems 415, Information
Sciences and Technology 110, Language and Literacy Education 502, Meteorology 101,
Nursing 390, and Turfgrass 230. The courses selected for the current study were all
Online Group and highly collaborative. They were also introductory courses — the first
course in a program sequence — minimizing the possibility that the learners had previous
exposure to the Online Group environment. Seven courses were graduate level. Four
courses were undergraduate level. Subjects were recruited through e-mail postings in the
eleven Online Group courses.
A total of 106 subjects participated in the study out of a possible 313 enrolled in
introductory, online group courses during the summer 2006 semester. Twenty-four of
those subjects were eliminated from the study due to their previous distance education
experience. Another 19 were eliminated because their pre-course scores were at the

44
median when subjects were assigned to the congruent or incongruent condition of both
variables.
Self-Report As a Research Methodology
Because the population involved in this study did not have the option to select one
delivery format over another (independent study versus online group instruction), it was
not possible to randomly assign subjects to one condition over another. Instead, learners
were sorted into conditions on the basis of their self-reported expectations and
preferences in a pre-course survey. It is the nature of learner “expectations,”
“preferences,” and “satisfaction” to be self-defined (Smith 2005). Berg summarized that
the individual seeks meaning from what he or she observes (Berg 1998). Phenomenology,
as a research methodology, is grounded in the belief that “the relationship between
perception and its objects is not passive” (Holstein and Gubrium 1994, page 263).
Procedure
Subjects were contacted by e-mail and telephone at the beginning of the academic
semester. They were asked to read and sign the consent document and return it by
e-mail or fax. They were assured that their participation in the study was optional,
their responses would be confidential, and they could elect to drop out of the study
at any time. A pre-course survey was developed to explore congruence of learner
expectations and preferences for three dimensions of the distance education course:
amount of interaction with other students, amount of interaction with the instructor,
and flexibility of the course schedule (Appendix A). Based on learner responses to the

45
pre-course survey, subjects were sorted into the following four conditions: congruent
expectations and congruent preferences, congruent expectations and incongruent
preferences, incongruent expectations and congruent preferences, incongruent
expectations and incongruent preferences.
The pre-course, Likert-type survey was administered to approximately 106 subjects who
agreed to participate in eleven Online Group courses during the summer 2006 semester
(Table 1). Fourteen subjects, who did not complete the post-course survey (Appendix B),
were eliminated from the study. Another 24 subjects were eliminated from the study due
to their previous distance education experience.
The final number of valid subjects who participated in the study was 82.
Seven items on the pre-course survey measured student expectations for: level of
interaction with other students, level of interaction with the instructor, and flexibility.
Another seven items on the pre-course survey measured student preferences for: level of
interaction with other students, level of interaction with the instructor, and flexibility.
Items with 5-point Likert-type scales were used to measure both expectations and
preferences. Learner ratings for each group of seven items were added so that the
possible score range was 7 to 35 for each of the two measures. The median score was
calculated for both expectations (24) and preferences (22). Subjects with expectation
scores greater than 24 were assigned to the congruent expectations condition. Subjects
with expectation scores less than 24 were assigned to the incongruent expectations
condition. Subjects with preference scores greater than 22 were assigned to the congruent

46
preferences condition. Subjects with preference scores less than 22 were assigned to the
incongruent preferences condition. Learners with scores at the median were dropped from
the data set.

47
Table 1
Number of Subjects by Course Course Total Enrolled Total Respondents Total Participants (No Previous Distance Education Experience) ADTED 460 16 6 4 CI 550 15 2 2 EDPSY 421 22 13 9 EDTEC 400 19 8 3 GEOG 482 78 33 33 INSYS 415 20 5 2 IST 110 17 4 3 LLED 502 49 13 8 METEO 101 36 15 12 NURS 390 14 5 4 TURF 230 27 2 2 313 106 82

48
At the end of the summer 2006 semester the subjects were contacted by e-mail and
telephone and asked to respond to five Likert scale-type items related to satisfaction. This
post-course survey (Appendix B) measured subjects’ responses on five dimensions of
learner satisfaction: satisfaction with distance learning through the World Campus,
whether the course met the subjects’ educational goals, difficulty in learning course ideas
and concepts, instructor responsiveness, and overall satisfaction. These five ratings were
summed to construct a single dependent measure of satisfaction and analyzed to
determine the impact of learner expectations (congruent versus incongruent) and
preference (congruent versus incongruent).
The post-course survey was based on the Flashlight Program, an award-winning project
sponsored by the non-profit Teaching and Learning with Technology (TLT) Group (TLT
Group 2007, http://www.tltgroup.org/flashlightP.htm). The project, which consists of a
bank of items measuring student satisfaction, won the 2001 Instructional
Telecommunications Council (ITC) Award for Outstanding Innovation in Distance
Education. The five items were chosen were the same five items chosen by the Rochester
Institute of Technology, Online Learning to assess overall course satisfaction. The
Rochester Institute of Technology selected these items from The Flashlight Current
Student Inventory. Because the inventory is an item bank, it can’t have true validity and
reliability — the items may be used by institutions in any order) (TLT Group 2007,
http://www.tltgroup.org/flashlightP.htm). However, the items do have content validity,
having been reviewed by a panel of experts from five pilot institutions. The items were
tested for face validity with more than 40 surveys created by five institutions and used

49
with approximately 2,000 subjects. One of the standard templates created from the bank,
Evaluating Educational Uses of the Web in Nursing, was pilot tested at three Nursing
programs and was tested for validity and internal reliability. Over a three-year period, the
instrument maintained a consistent Cronbach’s alpha of .85 to .90.
Experimental Design
The hypothesis was tested by a 2 x 2 factorial design that crossed two levels of learner
expectations (congruent versus incongruent) with two levels of learner preference
(congruent versus incongruent). The independent variables were congruence of
expectations and congruence of preferences for the distance learning environment. The
dependent measure was satisfaction. The impact of congruence of expectations and
preferences was assessed by a 2 x 2 analysis of variance.
50
Chapter 4
Results
This study used a 2 x 2 factorial design to test the hypothesis that learner satisfaction is
increased when students are in a distance learning environment that is congruent with
their expectations and preferences. The independent variables were congruence of
expectations with the learning environment and congruence of preferences, as measured
by the pre-course survey. The dependent variable in this study was learner satisfaction, as
measured by the post-course survey. This study was piloted in spring 2000. A total of
thirteen students participated out of a possible sixty-six. In the pilot study, however,
students with previous distance education experience were not screened out. In addition,
subjects in the pilot study were contacted only once, toward the end of the course. They
were asked to reflect back and report on their expectations and preferences, rather than
contacting them at two points — at the beginning of the course and the end of the course
— as they were in the current study. In the pilot study previous distance education
experience was the only variable that was significant as a predictor of satisfaction with a
distance education course. Pilot study subjects who reported that they had taken a
distance education course before, in either a collaborative online or an individualistic
print-based format, reported that they learned more in the online course (r = .684). This
may suggest is that those students who had taken distance education courses before may
be highly motivated and predisposed to being high performers in online courses. As a
result, subjects with previous distance education experience were eliminated from the
current study.

51
In the current study, the results of the pre-course survey were used to sort subjects into
two levels (low and high) for both congruence of expectations and congruence of
preferences. More specifically, the median was used to separate low and high groups for
both variables. The median for congruence of expectations was 24, and the median for
congruence of preferences was 22. For both congruence of expectations and preferences,
scores below the median were assigned to the low condition, and scores above the
median were assigned to the high condition. Learners with scores at the median were
dropped from the data set. Nine pre-course scores were at the median for congruence of
expectations, and ten pre-course scores were at the median for congruence of preferences.
After discarding subjects whose pre-course scores were at the median, data for 63
subjects were retained to test the hypotheses of this study.
The five satisfaction items used in this study were selected from The Flashlight Current
Student Inventory. Over a three-year period, the instrument maintained a consistent
Cronbach’s alpha of .85 to .90 (TLT Group 2007,
http://www.tltgroup.org/flashlightP.htm). The five items selected for this study from this
item bank had a Cronbach’s alpha of .73.
Table 2 shows the number of subjects as well as the means and standard deviations of the
satisfaction scores for each of the four conditions of the study.

52
Table 2
Number of Subjects, Means, and Standard Deviations of Satisfaction Scores
Congruence of Preferences
Congruence of Expectations Incongruent Congruent Total Preferences Preferences
[Overall [Overall Congruence of Congruence of
Preferences < 22] Preferences > 22] Incongruent Mean = 21.72 Mean = 20.36 Mean = 21.31 Expectations SD = 2.51 SD = 2.16 SD = 2.46 [Overall (n = 25) (n = 11) (n = 36) Congruence of Expectations < 24] Congruent Mean = 20.00 Mean = 20.82 Mean = 20.67 Expectations SD = 2.94 SD = 3.29 SD = 3.14 [Overall (n = 5) (n = 22) (n = 27) Congruence of Expectations > 24] Total Mean = 21.43 Mean = 20.67 Mean = 21.03 SD = 2.56 SD = 2.93 SD = 2.76 (n = 30) (n = 33) (n = 63)

53
Examination of the means in Table 2 indicates incremental differences. A 2 x 2 analysis
of variance was used to determine whether any of the differences among the means were
significant. The purpose of this analysis was to identify the main and interactive effects
of congruence of expectations and congruence of preferences for a distance learning
environment on satisfaction. Alpha was set at .05. The results of the ANOVA indicated
that none of the differences among the means were significant (F = 1.01, p = 0.40). An
overview of these results is presented in Table 3. Examination of Table 3 indicates:
• Main effect of congruence of expectations: t = 1.35 (p = 0.18)
• Main effect of congruence of preferences: t = 1.46 (p = 0.15)
• Interaction: t = 1.28 (p = 0.20)
These results indicate that the following null hypotheses for this study should be retained.
More specifically:
Ho1: There will be no significant differences in satisfaction among students when the
distance learning environment is congruent, or not congruent, with their expectations.
Ho2: There will be no significant differences in satisfaction among students when
the distance learning environment is congruent, or not congruent, with their preferences.
Ho3: There will be no interaction between congruent expectations and congruent
preferences on satisfaction among students.

54
The absence of an interaction indicates that the impact of congruent expectations on
satisfaction was not significantly different for students with congruent preferences,
relative to students with incongruent preferences.

55
Table 3
ANOVA Summary Table for the Effects of Congruence of
Expectations and Preferences on Satisfaction
Source df Sum Mean F Probability of Squares Square Regression 3 23.08 7.69 1.01 0.40 Residual 59 450.86 7.64 Total 62 473.94 Source t Probability Congruence 1.35 0.18 of Expectations Congruence 1.46 0.15 of Preferences Congruence 1.28 0.20 of Expectations x Congruence of Preferences

56
Since the ANOVA did not reveal any significant differences among the mean satisfaction
scores, a post hoc analysis was conducted to better understand possible relationships
between congruence of expectations and preferences and learner satisfaction. More
specifically, a correlation matrix of all predictor and criterion measures was examined to
identify possible relationships among predictor items that comprised the pre-course
survey and the satisfaction items used in the post-course survey. (See Table 4.)
Examinations of the correlations in Table 4 indicates the following
significant relationships:
a. Congruence of expectations for the amount of instructor interaction is related to
learner ratings that the course met learner goals (r = 0.30).
b. Congruence of expectations for the amount of instructor interaction is related to
learner ratings of satisfaction with the course (r = 0.22).
c. Congruence of expectations for the amount of instructor interaction is related to
learner ratings that they were satisfied with the course experience in total (r =
0.25).
d. Congruence of preferences for the amount of instructor interaction is related to
learner ratings that the course met learner goals (r = 0.22).
e. Congruence of preferences for the ability to complete assignments on the
learner’s own time schedule is related to learner ratings that they were satisfied
with the course overall (r = .30).

57
f. Congruence of preferences for the ability to complete assignments on the
learner’s own time schedule is related to learner ratings that the course met
learner goals (r = 0.26)
g. Congruence of preferences for the ability to complete assignments on the
learner’s own time schedule is related to learner ratings that they were satisfied
with the course experience in total (r = .23).
Considering the number of correlations examined as part of this post hoc analysis, these
findings must be interpreted with caution. That is, with alpha set at 0.05, it might be
expected that six of the 120 correlations shown in Table 3 would be significant simply as
a result of chance. Nevertheless, significant correlations in this matrix may suggest
hypotheses about potential relationships between learner expectations and preferences
and learner satisfaction that may be tested in subsequent controlled studies.

58
Table 4
Correlation Matrix of All Predictor and Criterion Items Satisfaction
Overall Met Difficult Instructor Course Total Experience Goals to Learn Promptness Satisfaction [Dependent
Variable] Expectations Collaborate Group .10 .18 .02 .05 .00 .07
Student Interaction .14 .11 .09 .05 .02 .03
Amount Student .03 .05 .05 .10 .02 .04 Interaction Amount Instructor .12 .30* .20 .00 .22* .25* Interaction My Pace .16 .03 .10 .12 .03 .11 Flexible .14 .18 .10 .12 .14 .12 Assignments Own Time .11 .15 .06 .03 .20 .09 Schedule Overall Student .09 .15 .05 .04 .00 .06 Interaction Overall .07 .02 .11 .02 .02 .04 Flexibility Overall .15 .15 .10 .04 .04 .13 Congruence [Independent Variable No. 1] Preferences Collaborate Group .20 .20 .11 .10 .10 .14
Student Interaction .12 .03 .14 .18 .09 .08
Amount Student .07 .10 .02 .10 .10 .02 Interaction Amount Instructor .10 .22* .21 .05 .17 .18 Interaction My Pace .14 .10 .00 .20 .10 .12 Flexible .13 .07 .06 .10 .10 .10 Assignments Own Time .30* .26* .00 .10 .18 .23* Schedule Overall Student .13 .08 .01 .07 .10 .10 Interaction Overall .04 .10 .02 .01 .02 .03 Flexibility Overall .07 .04 .05 .02 .07 .07 Congruence [Independent Variable No. 2] * p < 0.05

59
After the post hoc analysis was conducted to better understand possible relationships
between congruence of expectations and preferences and learner satisfaction, a series of
ten chi square analyses were performed to better understand the spread of scores for each
of the five individual satisfaction measures that were combined in the dependent variable
for both congruent versus incongruent expectations and congruent versus incongruent
preferences. More specifically, a chi square analysis was performed on the following
post-course survey items: overall satisfaction, met goals, difficult to learn, instructor
promptness, and the course satisfaction rating. (See Table 5.)

60
Table 5 Chi Square Analysis
Distribution of Satisfaction Scores
Overall Satisfaction x Congruence of Expectations 1 2 3 4 5 Overall Congruent 2 1 1 11 12 = 27 Expectations (>24) Overall Incongruent 0 0 1 23 12 = 36 Expectations (<24) X2 = 6.07 p > 0.05 df = 4
Overall Satisfaction x Congruence of Preferences
1 2 3 4 5 Overall Congruent 0 2 1 19 11 = 33 Preferences (>22) Overall Incongruent 1 0 1 15 13 = 30 Preferences (<22) X2 = 3.50 p > 0.05 df = 4
Met Goals x Congruence of Expectations 1 2 3 4 5 Overall Congruent 1 1 0 15 10 = 27 Expectations (>24) Overall Incongruent 0 0 1 23 12 = 36 Expectations (<24) X2 = 3.65 p > 0.05 df = 4
Met Goals x Congruence of Preferences
1 2 3 4 5 Overall Congruent 1 1 1 18 12 = 33 Preferences (>22) Overall Incongruent 0 0 0 20 10 = 30 Preferences (<22) X2 = 3.15 p > 0.05 df = 4

61
Table 5 Chi Square Analysis
Distribution of Satisfaction Scores (continued)
Difficult to Learn x Congruence of Expectations 1 2 3 4 5 Overall Congruent 0 3 0 16 8 = 27 Expectations (>24) Overall Incongruent 0 2 1 22 11 = 36 Expectations (<24) X2 = 1.36 p > 0.05 df = 4
Difficult to Learn x Congruence of Preferences
1 2 3 4 5 Overall Congruent 0 4 1 19 9 = 33 Preferences (>22) Overall Incongruent 0 1 0 19 10 = 30 Preferences (<22) X2 = 2.72 p > 0.05 df = 4
Instructor Promptness x Congruence of Expectations 1 2 3 4 5 Overall Congruent 1 1 2 12 11 = 27 Expectations (>24) Overall Incongruent 1 0 2 17 16 = 36 Expectations (<24) X2 = 1.53 p > 0.05 df = 4
Instructor Promptness x Congruence of Preferences
1 2 3 4 5 Overall Congruent 1 0 2 16 14 = 33 Preferences (>22) Overall Incongruent 1 1 2 13 13 = 30 Preferences (<22) X2 = 1.21 p > 0.05 df = 4

62
Table 5
Chi Square Analysis Distribution of Satisfaction Scores (continued)
Satisfaction Rating x Congruence of Expectations 1 2 3 4 5 Overall Congruent 0 1 3 14 9 = 27 Expectations (>24) Overall Incongruent 0 1 4 17 14 = 36 Expectations (<24) X2 = 0.24 p > 0.05 df = 4
Satisfaction Rating x Congruence of Preferences
1 2 3 4 5 Overall Congruent 0 1 6 16 10 = 33 Preferences (>22) Overall Incongruent 0 1 1 15 13 = 30 Preferences (<22) X2 = 3.86 p > 0.05 df = 4

63
The results of the chi square analysis did not show any significant differences in the
spread of scores between the congruent versus incongruent conditions for either
expectations or preferences. For each of the five items that comprised the dependent
measure, examination of the distribution of ratings indicates that the majority of subjects
tended to have congruent expectations and congruent preferences regardless of whether
they were in the congruent or incongruent conditions.
Examination of the frequencies for each step of the ratings scale for satisfaction revealed
an uneven distribution of scores for all of the items, with relatively few ratings at the low
end of the scale. Consequently, ratings of 1, 2, and 3 were collapsed and an additional
series of 10 chi squares were computed for each item in order to determine whether the
distribution of ratings differed for congruent versus incongruent expectations and
congruent versus incongruent preferences. The results, shown in Table 6, indicate that
none of the chi squares were significant (see Table 6), so the null hypothesis was retained
for all of the 10 pre-course survey items, indicating that the distribution of ratings was not
significantly different for learners with congruent versus incongruent expectations and
congruent versus incongruent preferences.

64
Table 6 Chi Square Analysis
Distribution of Satisfaction Scores
Overall Satisfaction x Congruence of Expectations 1-3 4 5 Overall Congruent 4 11 12 = 27 Expectations (>24) Overall Incongruent 1 23 12 = 36 Expectations (<24) X2 = 4.85 p > 0.05 df = 2
Overall Satisfaction x Congruence of Preferences
1-3 4 5 Overall Congruent 3 19 11 = 33 Preferences (>22) Overall Incongruent 2 15 13 = 30 Preferences (<22) X2 = 0.70 p > 0.05 df = 2
Met Goals x Congruence of Expectations 1-3 4 5 Overall Congruent 2 15 10 = 27 Expectations (>24) Overall Incongruent 1 23 12 = 36 Expectations (<24) X2 = 0.93 p > 0.05 df = 2
Met Goals x Congruence of Preferences
1-3 4 5 Overall Congruent 3 18 12 = 33 Preferences (>22) Overall Incongruent 0 20 10 = 30 Preferences (<22) X2 = 3.15 p > 0.05 df = 2
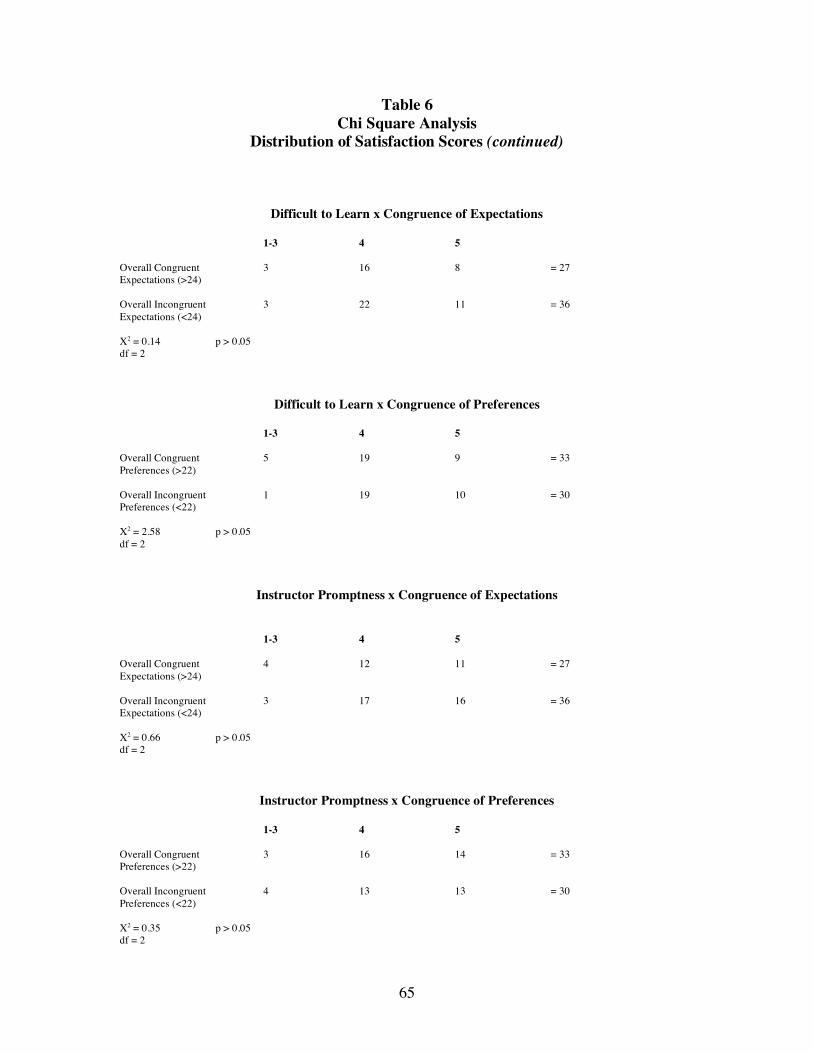
65
Table 6 Chi Square Analysis
Distribution of Satisfaction Scores (continued)
Difficult to Learn x Congruence of Expectations 1-3 4 5 Overall Congruent 3 16 8 = 27 Expectations (>24) Overall Incongruent 3 22 11 = 36 Expectations (<24) X2 = 0.14 p > 0.05 df = 2
Difficult to Learn x Congruence of Preferences
1-3 4 5 Overall Congruent 5 19 9 = 33 Preferences (>22) Overall Incongruent 1 19 10 = 30 Preferences (<22) X2 = 2.58 p > 0.05 df = 2
Instructor Promptness x Congruence of Expectations
1-3 4 5 Overall Congruent 4 12 11 = 27 Expectations (>24) Overall Incongruent 3 17 16 = 36 Expectations (<24) X2 = 0.66 p > 0.05 df = 2
Instructor Promptness x Congruence of Preferences
1-3 4 5 Overall Congruent 3 16 14 = 33 Preferences (>22) Overall Incongruent 4 13 13 = 30 Preferences (<22) X2 = 0.35 p > 0.05 df = 2

66
Table 6 Chi Square Analysis
Distribution of Satisfaction Scores (continued)
Satisfaction Rating x Congruence of Expectations
1-3 4 5 Overall Congruent 4 14 9 = 27 Expectations (>24) Overall Incongruent 5 17 14 = 36 Expectations (<24) X2 = 0.21 p > 0.05 df = 2
Satisfaction Rating x Congruence of Preferences
1-3 4 5 Overall Congruent 7 16 10 = 33 Preferences (>22) Overall Incongruent 2 15 13 = 30 Preferences (<22) X2 = 3.07 p > 0.05 df = 2

67
Chapter 5
Discussion
In this study, no significant differences in learner satisfaction were found for congruence
of expectations or preferences for the online learning environment. These results are not
consistent with prior research exploring the impact of congruent learner expectations and
preferences on satisfaction. For example, in a study that examined learning styles, media,
instructional design models, and collaboration, Gunawardena and Boverie found that
although learning styles did not affect the way students interacted with each other,
learning styles did have an impact on satisfaction. Students with a learning style that was
more congruent with a preference for class discussions and group collaboration were
more satisfied with their distance education course (Gunawardena and Boverie 1992). In
addition, Stein, Wanstreet, Calvin, Overtoom, and Wheaton found that when learners
were satisfied with the course structure, they reported greater satisfaction with the course
overall and with the knowledge gained (Stein, Wanstreet, Overtoom, and Wheaton 2005).
Failure to obtain significance in the current study may be related to several factors
including: design of the experiment, instrumentation, the subjects, instructional content,
and instructional technology. With respect to experimental design, the current study may
have been limited by the homogeneity of courses. That is, courses selected for this study
were uniformly high in terms of learner interaction with both other students and the
instructor. Substantial prior research indicates that learner satisfaction generally increases
with greater interaction with both the instructor and other students (Moore and Kearsley

68
1996; Kanuka, Collett, and Caswell 2002; Stein, Wanstreet, Calvin, Overtoom, and
Wheaton 2005). The high level of interaction found in the courses used in this study may
have had such a large positive impact on learner satisfaction that it masked the effect of
differences in congruence of expectations and preferences. To control for this possible
effect in future research, courses should sample the entire range of possibilities in terms
of interaction with both the instructors and other students. For example, courses should
systematically represent each cell in Table 7.

69
Table 7
Range of Courses Recommended for Future Research
Level of Student Level of Instructor
Interaction Interaction
Low Medium High
Low X X X
Medium X X X High X X X

70
A second shortcoming of the design may have involved the homogeneity of the subjects.
More specifically, subjects assigned to the congruent or incongruent condition were
separated only by the median. As a result, learners with a score just one point below the
median were assigned to the low group while learners one point above the median were
assigned to the high group. So learners just two points apart were in different groups. The
low and high groups for each independent variable were not sufficiently dissimilar. In
future research, to increase sensitivity to independent variable effects, pre-course data
should be gathered from enough students so that they can be separated into about three
equal-sized groups for each independent variable. Then, learners in the middle group
could be discarded. With such a design, the low and high groups would be substantially
different from one another. Presumably, this experimental design would maximize
sensitivity to detecting the differential impact between low and high learner expectations
and preferences on satisfaction.
Failure to obtain significance may also be related to at least three aspects of the
instrumentation used in the current study. First, there may have been a problem with the
construction of the instrument used to measure both the independent and dependent
variables. Perhaps the seven items used to measure congruence of expectations and
congruence of preferences are not additive. Likewise, perhaps learner ratings of the five
items used to assess satisfaction do not sum in an additive fashion to reflect overall
satisfaction as defined in this study. That is, perhaps congruence of expectations and/or
preferences for some aspects of the course had a differential impact on learners’ ratings
for some of the items purported to measure satisfaction, but not others. In order to

71
examine these relationships, the correlations between all items from the pre-course
survey (predictor measures) and the post-course survey (dependent measures) were
computed and examined as part of a post hoc analysis.
Examination of these correlations suggests seven potential relationships: between
congruence of expectations for the amount of instructor interaction and learner ratings
that the course met learner goals (r = 0.30); between congruence of expectations for the
amount of instructor interaction and learner ratings of course satisfaction (r = 0.22);
between congruence of expectations for instructor interaction and learner ratings that they
were satisfied with the course experience in total (r = 0.25); between congruence of
preference for the amount of instructor interaction and learner ratings that the course met
learner goals (r = 0.22); between congruence of preferences for the ability to complete
assignments on the learner’s own time schedule and learner rating that they were satisfied
with the course overall (r = 0.30); between congruence of preferences for the ability to
complete assignments on the learner’s own time schedule and learner ratings that the
course met learner goals (r = 0.26); and between congruence of preferences for the ability
to complete assignments on the learner’s own time schedule and learner ratings that they
were satisfied with the course experience in total (r = 0.23).
Four of these seven significant correlations suggest that future studies might focus on the
effect of learner expectations and preferences for amount of instructor interaction on
satisfaction with meeting learner goals. These correlations are consistent with extensive
prior research showing that higher levels of instructor interaction are positively correlated

72
with learner satisfaction and learning outcomes (Moore and Kearsley 1996; Kanuka,
Collett, and Caswell 2002; Stein, Wanstreet, Calvin, Overtoom, and Wheaton 2005).
Likewise, future studies might also explore the impact of preferences for completing
assignments on the learner’s own time schedule on satisfaction in general, and more
specifically, on learner ratings that the course met their goals. Three correlations in the
current study suggest relationships that are consistent with several prior studies that show
course flexibility and convenience is highly correlated with learner satisfaction and with
learner goals (Conrad 2002; Brown, Kirkpatrick, and Wrisley 2003; Aviv 2004; Beyth-
Marom, Saporta, and Caspi 2005).
A second problem with the instrumentation in the current study may involve the
sensitivity of the items on the pre-course survey. More specifically, failure to achieve
significance may also have occurred because the pre-course expectations and preferences
items were not sensitive enough to tease out subtle differences in expectations and
preferences for the types of interaction with the instructor and fellow students and the
amounts of flexibility in the online course. For example, learners may have an
expectation or preference for certain types of interaction, perhaps related to the
instructional content, but not other types such as social or administrative (Conrad 2002).
Future studies might explore more dimensions of learner expectations and preferences for
the amount of instructor interaction as they relate to learner satisfaction. How frequently
do learners expect or prefer to interact with their instructor? How lengthy or detailed

73
should those interactions be? Should the quantity and quality of the instructor interaction
be the same at the beginning, middle, and end of the course?
A third concern about instrumentation involves questions about the reliability of the
expectation and preference measures used in the current study. The Gunawardena and
Boverie study (1992) selected measures from existing, validated research on learning
styles. Childress and Overbaugh (2001) selected measures from the research on field
dependence, which is also well established in the literature. Stein, Wanstreet, Calvin,
Overtoom, and Wheaton (2005) established content validity on their measures through a
field test. All three studies chose independent measures, with established reliabilities
based on a review of the literature. The pre-course survey used for this study was
developed rather than selected because existing instruments were not available due to the
very limited body of prior research on congruence of expectations and preferences.
In addition to design and instrumentation concerns, failure to achieve significance may
also have occurred due to differences in the types of subjects recruited. Subjects in the
Childress and Overbaugh (2001) study were pre-service teachers who had completed, or
nearly completed, undergraduate degree programs. These subjects were more
homogeneous in terms of academic discipline and education level than the subjects in the
current study. Subjects in the Childress and Overbaugh (2001) study also may have been
more experienced learners, better able to discern and articulate their expectations and
preferences for distance learning. Twenty-six percent of the subjects in the current study
were undergraduate students. The subjects for the Stein, Wanstreet, Calvin, Overtoom,

74
and Wheaton (2005) study were a mix of undergraduate and graduate students, as were
the subjects in the current study. However, the attrition rate for the Stein, Wantreet,
Calvin, Overtoom, and Wheaton (2005) study was high with only 34 subjects completing
the survey instrument out of a possible 201 (17 percent response rate). The response rate
for the current study was twice as high, with 106 respondents out of 313 – a 34 percent
response rate – although 24 subjects were later dropped from the current study due to
their previous distance education experience and 19 subjects were dropped whose pre-
course scores were at the median. It is possible that students whose learning styles were
not congruent with the course format also chose not to participate in or complete the
Stein, Wanstreet, Calvin, Overtoom, and Wheaton (2005) study. If fewer incongruent or
dissatisfied students participated in the Stein, Wanstreet, Calvin, Overtoom, and Wheaton
(2005) study, the likelihood of obtaining significance might have been increased.
A final possible explanation for the failure to obtain significance in the current study may
involve differences in instructional content and/or instructional technology. The
Gunawardena and Boverie (1992) study examined the relationship between learning
styles, media, method of instruction, and group functioning for the same material in an
audio-conference format. The Childress and Overbaugh (2001) study compared subjects
in different versions of the same course: one-way video versus two-way audio computer
literacy course. In contrast, the present study featured several different courses. As a
result, by holding instructional content constant, the two prior studies might have better
controlled for variance attributed to differences in the instructional content itself.

75
It is also possible that the learners’ familiarity or comfort-level with instructional
technology may have been a factor. Learners with better technology skills may have
more easily overcome any gaps in their expectations and preferences for the online
learning environment. Numerous studies have shown that learners with a high degree
of apprehension or negative experiences or attitudes toward instructional technology
report lower levels of satisfaction levels (Beyth-Marom, Saporta, and Caspi 2005;
Allen, Bourhis, Burrell, and Mabry 2002). Familiarity or comfort-level with technology
was not a variable that was controlled in this study. Future research might examine the
impact of learner technology skills in bridging any possible gaps in congruent
expectations or preferences.
Conclusion
Key studies have shown that students with a learning style that was congruent with group
collaboration strategies were more satisfied with their distance education course
(Gunawardena and Boverie 1992) and that satisfaction with course structure was related
to overall satisfaction and knowledge gained (Stein, Wanstreet, Overtoom, and Wheaton
2005). Despite these findings, in the current study, no significant differences in learner
satisfaction were found for congruence of expectations or preferences for the online
learning environment. Failure to obtain significance in the current study may be related to
the design of the experiment, instrumentation, the selection of subjects, and differences in
the types of instructional content and technology.

76
A post hoc analysis of the correlations between the predictor and dependent measures did
suggest seven potential relationships. Four of these correlations suggest that there is a
relationship between learner expectations and preferences for the amount of instructor
interaction and learner ratings of satisfaction and met learner goals. These correlations
are consistent with prior research that shows that high levels of instructor interaction
correlate positively with satisfaction and learning outcomes (Moore and Kearsley 1996;
Kanuka, Collett, and Caswell 2002; Stein, Wanstreet, Calvin, Overtoom, and Wheaton
2005). Another three correlations in the current study suggest a relationship between
learner preferences for completing assignments on their own time schedule and learner
ratings of satisfaction and met learner goals. These correlations are also consistent with
previous studies (Conrad 2002; Brown, Kirkpatrick, and Wrisely 2003; Aviv 2004;
Beyth-Marom, Saporta, and Caspi 2005).
Keller’s ARCS Model (Keller 1979, 1983, 1987) suggests that well-designed
instruction increases learning and performance when the learner is motivated to
complete the instruction. Keller’s model also suggests that if instruction is consistent
with learner expectations, is relevant, and learners have confidence in their ability to
succeed — they will put forth more effort and will be more satisfied with the outcome.
Although the current study did not find significant differences in learner satisfaction
when learner expectations or preferences were congruent, these findings do not
necessarily invalidate Keller’s model.

77
Future studies might further explore motivation as it relates to various learner
demographics: adult learners versus traditional-age students, undergraduate students
versus graduate students, full-time students versus part-time students. Are there a set of
characteristics related to any of these groups that might reliably measure expectations,
preferences, or motivation and predict effort or satisfaction? It is possible that adult
learners, for instance, may be so innately motivated that any gap in learner expectations
or preferences has a marginal effect on effort? Future studies might also probe the
constancy of expectations and preferences. To what extent might they change over time
for various learners? The body of established research on expectations, overall, is very
slim. The current study is one modest step in that direction.

78
References
Abernathy, D.J. (2004). Thinking outside the evaluation box. Eli Jones & Associates.
Alderman, D.L. and Mahler, W.A. (1973). The evaluation of PLATO and TICCIT:
Educational analysis of the community college components. Princeton
Educational Testing Services.
Allen, M., Bourhis, J., Burrell, N., and Mabry, E. (2003). Comparing student satisfaction
with distance education to traditional classrooms in higher education: A meta-
analysis. The American Journal of Distance Education, 16 (2): 83-97. Lawrence
Erlbaum Associates, Inc.
Alliger, G. and Janak, E. (1989). Kirkpatrick’s levels of training criteria: Thirty years
later. Personnel Psychology, 42 (3): 331-342.
Anderson, Reynolds, Schallert, and Goetz. (1977). Frameworks for comprehending
discourse. The American Educational Research Journal, 14, 367-381.
Aviv, R. (2004). Why do students take online courses? Sloan-C View 3 (10): 5.
Sloan Consortium.
Bandura, A. (1986). The explanatory and predictive scope of self-efficacy theory.
Journal of Social and Clinical Psychology, 4: 359-373.

79
Bartlett, F.C. (1932). Remembering: A Study in Experimental and Social Psychology.
London: Cambridge University Press.
Bassi, L.J., Benson, G., and Cheney, S. (1996). The top ten trends. Training and
Development, 50 (11): 28-42.
Beatty, M.J. (1987). Communication apprehension as a determinant of avoidance,
withdrawal, and performance anxiety. Communication Quarterly, 35: 202-207.
Beatty, M.J. (1988). Situational and pre-dispositional correlates of public speaking
anxiety. Communication Education, 37: 28-39.
Berg, B.L. (1998). Qualitative Research Methods for the Social Sciences. (Third edition).
Boston, MA: Allyn and Bacon.
Berlyne, D. E. (1965). Motivational problems raised by exploratory and epistemic
behavior. In S. Koch (Ed.), Psychology: A Study of Science, (5). New York:
McGraw-Hill.
Beyth-Marom, R., Saporta, K., and Caspi, A. (2005). Synchronous vs. asynchronous
tutorials: Factors affecting students’ preferences and choices. Journal of Research
on Technology in Education. Spring 2005, 37 (3): 245-262.

80
Blignaut, S. and Trollip, S.R. (2003). Developing a taxonomy of faculty participation in
asynchronous learning environments – An exploratory investigation. Computers
& Education, 41 (2): 149-172. Elsevier, Ltd.
Boring, E.G. (1950.) A History of Experimental Psychology. New York:
Appleton-Century-Crofts.
Boyle, M.A. and Crosby, R. (1997). Academic program evaluation: Lessons from
business and industry. Journal of Industrial Teacher Education, 34 (3).
Bransford, J.D. and Johnson, M.K. (1972). Contextual prerequisites for understanding:
some investigations of comprehension and recall. Journal of Verbal Learning and
Verbal Behavior, 11, 717-726.
Brown, S.T., Kirkpatrick, M.K., and Wrisely, C. (2003). Evaluative parameters of a web-
based nursing course from the learners’ perspectives. Journal of Nursing
Education, 42 (3): 134-137. Thorofare.
Bruner, J. (1990). Acts of Meaning. Cambridge, MA: Harvard University Press.

81
Burgoon, J.K. and Le Poire, B.A. (1993). Effects of communication expectancies, actual
communication, and expectancy disconfirmation on evaluations of
communicators and their communication behavior. Human Communication
Research, 20: 67-96.
Cascio, W. (1987). Applied Psychology in Personnel Management (Third Edition).
Englewood Cliffs: Prentice-Hall.
Childress, M.D. and Overbaugh, R.C. (2001). The relationship between learning style and
achievement in a one-way video, two-way audio pre-service teacher education
computer literacy course. International Journal of Educational
Telecommunications, 7 (1): 57-71.
Christopher, C. (1990). The relationship among teacher immediacy behaviors, student
motivation, and learning. Communication Education, 39 (4): 223-240.
Cobb, P. (1994). Where is the mind? Constructivist and socio-cultural perspectives on
mathematical development. Educational Researcher, 23: 13-20.
Condry, J. (1977). Enemies of exploration:Self-initiated versus other-initiated learning.
Journal of Personality and Social Psychology, 35: 459-477.

82
Conrad, D.L. (2002). Engagement, excitement, anxiety, and fear: Learners’ experiences
of starting an online course. The American Journal of Distance Education, 16 (4):
205-226. Lawrence Erlbaum Associates, Inc.
Davies, S. (2002). Marketing in higher education: Matching promises and reality to
expectations. Responding to Student Expectations, OECD Report: 103-114.
Dahl, J. (2004). Strategies for 100 percent retention: Feedback, interaction. Distance
Education Report, 8 (16): 1-4. Retrieved July 16, 2005, from Gallileo.
Deci, E.L. (1975). Intrinsic Motivation. New York: Plenum Press.
Deci, E.L. and Porac, J. (1978). Cognitive evaluation theory and the study of human
emotion. In M.R. Lepper and D. Greene (Eds.) The Hidden Costs of Reward.
Hillsdale, N.J.: Lawrence Erlbaum Associates.
Deutsch, W. (1949). A Theory of cooperation and competition. Human Relations,
2: 129-159.
Deutsch, W. (1962). Cooperation and trust: Some theoretical notes. In M.R. Jones, (Ed.)
Nebraska Symposium on Motivation: 275-319. Lincoln, NE: University of
Nebraska Press.

83
Dobos, J.A. (1992). Collaborative learning: Effects of student expectations and
communication apprehension on student motivation. Communication Education,
45 (April): 118-134.
Duffy, T.M. and Cunningham, D.J. (1996). Constructivism: Implications for the design
and delivery of instruction. In D.H. Johnassen (Ed.) Handbook of Research for
Educational Communications and Technology: 186-187. Simon & Schuster
Macmillan: New York.
Edelson, P.J. and Pittman, V.V. (2001). E-learning in the United States: New directions
and opportunities for university continuing education. Professional Development
Research Center at the State University of New York at Stony Brook. February
2001, from http://www.sunysb.edu/spd/dean_papers/newdelhi.rtf
Erickson, K.A. and Simon, H.A. (1984). Protocol Analysis: Verbal Reports as Data.
Cambridge, MA: MIT Press.
Feather, N.T. (1975). Values in Education and Society. New York: The Free Press.
Freitag, E.T. and Sullivan, H.J. (1995). Matching learner preference for amount of
instruction: An alternative form of learner control. Educational Technology
Research and Development, 43 (2): 5-12.

84
Garrison, D.R. and Anderson, T. (2003). E-learning in the 21st Century: A Framework for
Research and Practice. London, UK: RoutledgeFarmer.
Garrison, J.W. (1994). Realism, Deweyan pragmatism, and educational research.
Educational Researcher, 23 (1): 5-14.
Gentry, J. and Helgesen, M. (1999). Using learning style information to improve the core
financial management course. Financial Practice and Education,
(Spring/Summer): 59-69.
Gibson, C. C. and Graff, A. O. (1992). Impact of adults’ preferred learning styles and
perception of barriers on completion of external baccalaureate degree programs.
Journal of Distance Education, 7 (1).
Gray, S.H. (1987). The effect of sequence control on computer assisted learning. Journal
of Computer-Based Instruction, 14 (2): 54-56.
Gunawardena, C.N. and Boverie, P.E. (1992). Interaction of learning style and media,
method of instruction, and group functioning in distance learning. Proceedings of
the Eighth Annual Conference on Distance Teaching and Learning: 65-69.
Madison, WI: University of Wisconsin, Madison.
85
Gunawardena, C.N. and Zittle, F.J. (1997). Social presence as a predictor of satisfaction
within a computer-mediated conferencing environment. The American Journal of
Distance Education, 11 (3): 8-25.
Gunawardena, C.N. and Duphorne, P.L. (2000). Predictors of learner satisfaction in an
academic computer conference. Distance Education, 21 (1): 101-117.
Hannafin, R.D. and Sullivan, H.J. (1996). Preferences and learner control over amount of
instruction. Journal of Educational Psychology, 88 (1): 12-173.
Hara, N. and Kling, K. (2002). Student distress with a web-based distance learning
course: An ethnographic study of participants’ experiences. Available:
http://www.slis.indiana.edu/CSI/WP/wp00-01B.html
Heywood, J. (1546). The proverbs of John Heywood. Julian Sharman (Ed.).
Hintze, H., Mohr, H., and Wenzel, A. (1988). Students’ attitudes towards control
methods in computer-assisted instruction. Journal of Computer-Assisted
Learning, 4 (1): 3-10.
Holstein, J.A. and Gubrium, J.F. (1994). Phenomenology, ethnomethodology, and
interpretive practice. In N.K. Denzin and Y.S. Lincoln (Eds.), Handbook of
Qualitative Research: 262-272. Thousand Oaks, CA.: Sage Publications, Inc.

86
Holton III, E. (1996a). The flawed four-level evaluation model. Human Resource
Development Quarterly, 7 (1): 15-21.
Holton III, E. (1996b). Final word: Response to reaction to Holton article. Human
Resource Development Quarterly, 7 (1): 27-29.
Hooper, S. and Hanafin, M.J. (1988). Cooperative CBI: The effects of heterogeneous
versus homogeneous grouping on the learning of progressively complex concepts.
Educational Computing Research, 4 (4): 413-424.
Hooper, S. (1991). The effects of group composition on achievement, interaction, and
learning efficiency during computer-based cooperative instruction. Educational
Technology Research and Development, 39 (3): 27-40.
Hooper, S. (1992). Cooperation, learning and computer-based instruction. Educational
Technology Research and Development, 40 (3): 21-38.
Hooper, S. and Temiyakarn, C. (1993). The effects of cooperative learning and learner
control on high- and average-ability students. Educational Technology Research
and Development, 41 (2): 5-12.
87
Igoe, A.R. (1993). Learner control over instruction and achievement goals in
computer-assisted instruction. Unpublished doctoral dissertation, Arizona State
University, Tempe.
Jensen, M., Johnson, D.W., and Johnson, R.T. (2002). Impact of positive interdependence
during electronic quizzes on discourse and achievement. The Journal of
Educational Research, 95 (3): 161-166.
Jensen, T., Riley, E., and Santiago, J. (2005). Student expectations of instructor
availability in the online classroom. Available:
http://sscel.maconstate.edu/proceedings_2005/proceedings_05/student_expectatio
ns.pdf
Johnson, D.W. and Johnson, R.T. (1994). Effects of cooperative versus individualized
instruction on student pro-social behavior, attitudes toward learning, and
achievement. Journal of Educational Psychology, 64 (4): 446-452.
Johnston, J.E. (1975). Behavior Research and Technology in Higher Education. Charles
C. Thomas (Ed.). Springfield, Ill.
Kanuka, H., Collett, D., and Caswell, C. (2002). University instructor perceptions of the
use of asynchronous text-based discussion in distance courses. The American
Journal of Distance Education, 16 (3): 151-167.

88
Kaufman, R. and Keller, J. (1994). Levels of evaluation: Beyond Kirkpatrick. Human
Resource Development Quarterly, 5 (4): 371-380.
Kaufman, R., Keller, J., and Watkins, R. (1995). What works and what doesn’t:
Evaluation beyond Kirkpatrick. Performance and Instruction, 35 (2): 8-12.
Keller, J. M. (1979). Motivation and instructional design: A theoretical perspective.
Journal of Instructional Development, 2 (4): 26-34.
Keller, J.M. (1983). Motivational design of instruction, in C. Reigeluth (Ed.),
Instructional Design Theories and Models: An Overview of the Current Status,
383-434. New Jersey: Lawrence Erlbaum Associates, Inc.
Keller, J.M. (1987a). Development and use of the ARCS model of instructional design.
Journal of Instructional Development, 10 (3): 2-10.
Keller, J.M. (1987b). Strategies for stimulating the motivation to learn. Performance and
Instruction, 26 (8): 1-7.
Keller, J.M. (1987c). The systematic process of motivational design. Performance and
Instruction, 26 (9): 1-8.

89
Keller, J.M. and Kopp, T. (1987). An application of the ARCS model of motivational
design. In C.M. Reigeluth (Ed.) Instructional Theories in Action: Lessons
Illustrating Selected Theories and Models, 289-320. Hillsdale, N.J.: Lawrence
Erlbaum Associates, Inc.
Keller, J.M. and Suzuki, K. (1987). Use of the ARCS motivation model in courseware
design. In D.H. Jonassen (Ed.) Instructional Designs for Microcomputer
Courseware, 409-434. Hillsdale, N.J.: Lawrence Erlbaum Associates, Inc.
Kinzie, M.B. and Sullivan, H.J. (1989). Continuing motivation, learner control, and CAI.
Educational Technology Research and Development, 37 (2): 5-14.
Kinzie, M.B., Sullivan, H.J., and Berdel, R.L. (1988). Continuing motivation, learner
control, and CAI. Educational Technology Research and Development,
37 (2): 5-14.
Kirkpatrick, D.L. (1959a). Techniques for evaluating training programs. Journal of
ASTD, 13 (11): 3-9.
Kirkpatrick, D.L. (1959b). Techniques for evaluating training programs: Part 2 –
Learning. Journal of ASTD, 13 (12): 21-26.

90
Kirkpatrick, D.L. (1960a). Techniques for evaluating training programs: Part 3 –
Behavior. Journal of ASTD, 14 (1): 13-18.
Kirkpatrick, D.L. (1970b). Techniques for evaluating training programs: Part 4 – Results.
Journal of ASTD, 14 (2): 28-32.
Kirkpatrick, D.L. (1994). Evaluating Training Programs: The Four Levels. Berrett-
Koehler Publishers.
Kirkpatrick, D.L. (1996). Evaluation. In R.L. Craig and L.R. Bittel (Eds.), Training &
Development Handbook. American Society for Training and Development, New
York: McGraw-Hill.
Lave, J. and Wenger, E. (1991). Situated Learning: Legitimate Peripheral Participation.
Cambridge University Press.
Magnusson, D. (1998). The logic and implications of a person-oriented approach. In R.
Cairns, L. Bergman and J. Kagan (Eds.), Methods and Models for Studying the
Individual: Essays in Honor of Marian Radke-Yarrow: 33-64. Thousand Oaks,
CA: Sage.

91
Magnusson, D. and Stattin, H. (1998). Person-context interaction theories. In W. Damon
(Series Ed.) and R. M. Lerner, Handbook of Child Psychology, Vol. 1,
Theoretical Models of Human Development (Fifth Edition): 685-759.
New York: Wiley.
Maslow, A.H. (1954). Motivation and Personality. New York: Harper & Row.
McClelland, D.C. (1976). The Achieving Society. New York: Irvington Publishers.
McCroskey, J.C. (1984). The communication apprehension perspective. In J.A. Daly
(Eds.), Avoiding Communication: Shyness, Reticence, and Communication
Apprehension: 13-38. Beverly Hills, CA: Sage.
McCroskey, J.C. and Beatty, M.J. (1984). Communication apprehension and accumulated
communication state anxiety experiences: A research note. Communication
Monographs, 51: 79-84.
Moore, M. G. and Kearsley, G. (1996). Distance Education: A Systems View. Belmont,
CA: Wadsworth.
Moore, M.G. (2002). What does research say about the learners using computer-mediated
communication in distance learning? The American Journal of Distance
Education 16 (2): 61-64. Lawrence Erlbaum Associates, Inc.

92
Murphy, K.L. and Cifuentes, L. (2001). Using web tools, collaborating, and learning
online. Distance Education, 22 (2): 285-306. Melbourne.
Muirhead, B. (2004). Research insights into interactivity. Available:
http://www.itdl.org/Journal/Mar_04/article05.htm
Nash, R. D. (2005). Course completion rates among distance learners: Identifying
possible methods to improve retention. Online Journal of Distance Learning
Administration, 8 (4): Winter 2005. University of West Georgia, Distance
Education Center.
Naugle, K.A., Naugle, L.B., and Naugle, R.J. (2000). Kirkpatrick’s evaluation model as a
means of evaluating teacher performance. Education, 121 (1): 135-144.
Neisser, U. (1976). Cognition and Reality. San Francisco, CA: Freedman.
Palloff, R.M. and Pratt, K. (2003). Virtual Student: A Profile and Guide to Working with
Online Learners. San Francisco, CA: Jossey-Bass.
Palmgreen, P. and Rayburn, J.D. (1985). A comparison of gratification models of media
satisfaction. Communication Monographs, 52: 334-346.

93
Pavio, A. (1974). Language and knowledge of the world. Educational Researcher,
3 (9): 5-12.
Piaget, J. (1968). The role of the concept of equilibrium. In D. Elkind (Ed.), Six
Psychological Studies by Jean Piaget. New York: Vintage.
Piaget, J. (1977). The Development of Thought: Equilibrium of Cognitive Structures.
New York: Viking.
Pintrich, P. (2000). Journal of Educational Psychology. American Psychological
Association, Inc. 92 (3), Sept. 2000: 544-555.
Pittman, V.V. (2002). Interview: Speaking personally with Von Pittman. The American
Journal of Distance Education, 16 (2): 115-123. Lawrence Erlbaum
Associates, Inc.
Quality on the Line: Benchmarks for Success in Internet-Based Distance Education.
(2000). A Report by The Institute for Higher Education Policy. Supported by
Blackboard and the National Education Association, April 2000.
Richmond, V.P. and McCroskey, J.C. (1989). Communication: Apprehension,
Avoidance, and Effectiveness (Second Edition). Scottsdale: AZ.
Gorsuch Scarisbrick.

94
Roberts, T.G., Irani, T.A., Telg, R.W., and Lundy, L.K. (2005). The development of an
instrument to evaluate distance education courses using student attitudes.
The American Journal of Distance Education, 19 (1): 51-64.
Rokeach, M. (1973). The Nature of Human Values. New York: The Free Press.
Ross, S.M., Morrison, G.R. and O’Dell, J.K., (1989). Uses and effects of learner control
of context and instructional support in computer-based instruction. Educational
Technology Research and Development, 37(4): 29-39.
Rotter, J.B. (1966). Generalized expectancies for internal versus external control of
reinforcement. Psychological Monographs.
Rotter, J.B. (1972). An introduction to social learning theory. In J.B. Rotter, J.E. Chance,
and E.J. Phares (Eds.) Applications of a Social Learning Theory of Personality.
New York: Holt, Rinehart and Winston.
Rubin, A.M. and Rubin, R.B. (1985.) Communication apprehension and satisfaction in
interpersonal relationships. Communication Research Reports, 6: 13-20.

95
Schnackenberg, H.L., Sullivan, H.J., Leader, L.F., and Jones, E.K. (1998). Learner
preferences and achievement under differing amounts of learner practice.
Educational Technology, Research and Development, 46 (2): 5-15. Washington.
Singhanayak, C. and Hooper, S. (1998). The effects of cooperative learning and learner
control on students’ achievement, option selections, and attitudes. Educational
Technology, Research and Development, 46 (2): 17-33.
Smith, D.W. (2005). Phenomenology. The Stanford Encyclopedia of Philosophy.
E.N. Zalta (Ed.)
Stein, D.S., Wanstreet, C.E., Calvin, J., Overtoom, C., and Wheaton, J.E. (2005).
Bridging the transactional distance gap in online learning environments. The
American Journal of Distance Education, 19 (2): 105-118. Lawrence Erlbaum
Associates, Inc.
Stevenson, K. and Sander, P. (1998). Improving service quality in distance education.
Available: http://www.eurodl.org/materials/contrib/1998/stevenson/index.html
Swan, K. (2001). Building learning communities in online courses: The importance of
interaction. Paper presented at the 7th Sloan-C International Conference on Online
Learning, Orlando, FL.
96
Teaching and Learning with Technology (TLT) Group, (2001). Flashlight Program.
Available: http://www.tltgroup.org/flashlightP.htm
Tennent, B., Becker, K., and Kehoe, J. (2005). Technology-enabled delivery and
assessment methods: Are we addressing student expectations and learning
preferences? Available:
http://www.ascilite.org.au/conferences/brisbane05/blogs/proceedings/75_Tennent.
Thorndyke, P.E. and Hayes-Roth, B. (1979). The use of schemata in the acquisition and
transfer of knowledge. Cognitive Psychology, 11: 82-106.
Tricker, T. (2003). Student expectations – How do we measure up? Available:
http://www.inter-disciplinary.net/tricker%20paper.pdf
U.S. Department of Education (2004). Part-Time Undergraduates in Postsecondary
Education: 2003-04. Postsecondary Education Descriptive Analysis Report.
National Center for Education Statistics, Institute of Education Sciences.
Vonderwoll, S. (2003). An examination of asynchronous communication experiences and
perspectives of students in an online course: A case study. Internet and Higher
Education, 6: 77-90. Retrieved August 2, 2005 from
http://faculty.washington.edu/jcstone/vonderwell_asynchronous.pdf
97
Vygotsky, L. (1962). Thought and Language. Cambridge, MA: MIT Press.
Weiner, B. (1974). An attributional interpretation of expectancy-value theory. In B.
Weiser (Ed.) Cognitive Views of Human Motivation, 51-69. New York:
Academic Press.
Winfrey, E.C. (1999). Kirkpatrick’s four levels of evaluation. In B. Hoffman (Ed.),
Encyclopedia of Educational Technology. Retrieved April 5, 2007, from
http://coe.sdsu.edu/eet/Articles/k4levels/start.htm

98
Appendix A Code Book
Pre-Course Survey
Assessing Students’ Expectations and Preferences for Distance Learning Environments
Student code: ––––––––––––––––––––––––––––––––––––––
Use the following definition to respond to the items below: Distance education course — a course that is taught from a distance and does not require the student to travel to a classroom building. The student is not required to meet with the instructor in the same physical space. Part I 1. (Q1) Which distance education course(s) are you currently enrolled in? 2. (Q2) When did you enroll in the distance education course you are currently taking? ____ Spring 2006 ____ Summer 2006 ____ Fall 2006 3. (Q3) Is this your first distance education course? _____ Yes _____ No

99
Part II Respond to the next three items to describe your expectations for the distance education course(s) in which you are currently enrolled: 4. (Q4) I expect to collaborate with other students on group projects. (Independent 1: Collaborate Students)
__1__ Strongly disagree __2__ Disagree __3__ Undecided __4__ Agree __5__ Strongly agree
5. (Q5) I expect to interact with other students enrolled in the course. (Independent 2: Interact Students)
__1__ Strongly disagree __2__ Disagree __3__ Undecided __4__ Agree __5__ Strongly agree
6. (Q6) The amount of interaction I expect to have with other students is (Independent 3: Interact Amount)
__1__ Very low __2__ Low __3__ Moderate __4__ High __5__ Very high
7. (Q7) The amount of interaction I expect to have with the instructor is (Independent 4: Interact Instruct)
__1__ Very low __2__ Low __3__ Moderate __4__ High __5__ Very high

100
8. (Q8) The amount of flexibility I expect to have to complete the course at my own pace (as opposed to a fixed schedule) is (Independent 5: Flexibility)
__5__ Very low __4__ Low __3__ Moderate __2__ High __1__ Very high
9. (Q9) I expect to turn my assignments in whenever I want. (Independent 6: Assignments)
__5__ Strongly disagree __4__ Disagree __3__ Undecided __2__ Agree __1__ Strongly agree
10. (Q10) I expect to complete the course on my own time schedule. (Independent 7: Own Schedule)
__5__ Strongly disagree __4__ Disagree __3__ Undecided __2__ Agree __1__ Strongly agree
Part II Respond to the next three items to describe your preference for the distance education course(s) in which you are currently enrolled: 11. (Q11) I prefer to collaborate with other students on group projects. (Independent 8: Collaborate Students)
__1__ Strongly disagree __2__ Disagree __3__ Undecided __4__ Agree __5__ Strongly agree

101
12. (Q12) I prefer to interact with other students enrolled in the course. (Independent 9: Interact Students)
__1__ Strongly disagree __2__ Disagree __3__ Undecided __4__ Agree __5__ Strongly agree
13. (Q13) The amount of interaction I prefer to have with other students is (Independent 10: Interact Amount)
__1__ Very low __2__ Low __3__ Moderate __4__ High __5__ Very high
14. (Q14) Amount of interaction I prefer to have with the instructor is (Independent 11: Interact Instruct)
__1__ Very low __2__ Low __3__ Moderate __4__ High __5__ Very high
15. (Q15) The amount of flexibility I prefer to have to complete the course at my own pace (as opposed to a fixed schedule) is (Independent 12: Flexibility)
__5__ Very low __4__ Low __3__ Moderate __2__ High __1__ Very high

102
16. (Q16) I prefer to turn my assignments in whenever I want. (Independent 13: Assignments)
__5__ Strongly disagree __4__ Disagree __3__ Undecided __2__ Agree __1__ Strongly agree
17. (Q17) I prefer to complete the course on my own time schedule. (Independent 14: Own Schedule)
__5__ Strongly disagree __4__ Disagree __3__ Undecided __2__ Agree __1__ Strongly agree
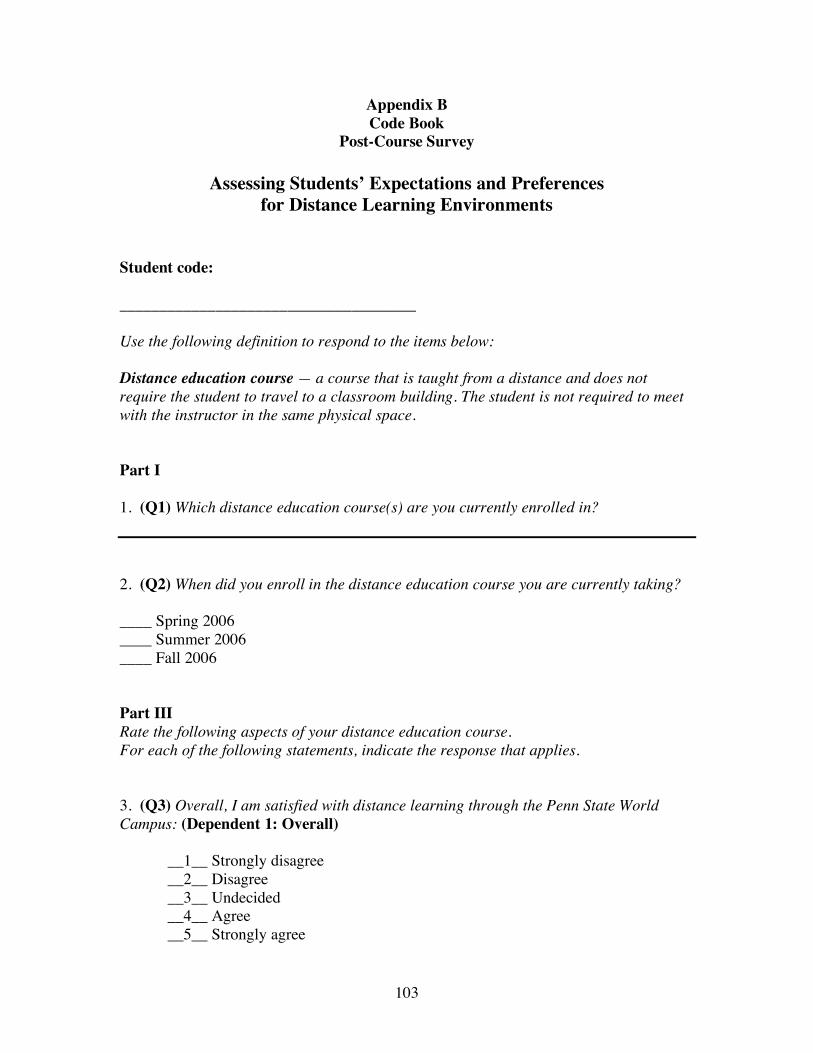
103
Appendix B Code Book
Post-Course Survey
Assessing Students’ Expectations and Preferences for Distance Learning Environments
Student code: _____________________________________ Use the following definition to respond to the items below: Distance education course — a course that is taught from a distance and does not require the student to travel to a classroom building. The student is not required to meet with the instructor in the same physical space. Part I 1. (Q1) Which distance education course(s) are you currently enrolled in? 2. (Q2) When did you enroll in the distance education course you are currently taking? ____ Spring 2006 ____ Summer 2006 ____ Fall 2006 Part III Rate the following aspects of your distance education course. For each of the following statements, indicate the response that applies. 3. (Q3) Overall, I am satisfied with distance learning through the Penn State World Campus: (Dependent 1: Overall)
__1__ Strongly disagree __2__ Disagree __3__ Undecided __4__ Agree __5__ Strongly agree

104
4. (Q4) The distance education course has met my educational goals so far. (Dependent 2: Goals)
__1__ Strongly disagree __2__ Disagree __3__ Undecided __4__ Agree __5__ Strongly agree
5. (Q5) I have found it difficult to learn the course ideas and concepts in the distance education environment. (Dependent 3: Learned) __5__ Strongly disagree __4__ Disagree __3__ Undecided __2__ Agree __1__ Strongly agree 6. (Q6) The distance education instructor has responded promptly to my questions and concerns. (Dependent 4: Instructor)
__1__ Strongly disagree __2__ Disagree __3__ Undecided __4__ Agree __5__ Strongly agree
7. (Q7) How would you rate your satisfaction with this distance education course? (Dependent 5: Satisfaction) __5__ Very satisfied __4__ Satisfied __3__ Neutral __2__ Dissatisfied __1__ Very dissatisfied 8. (Q 8) Do you have any other feedback that you would like to share with me on your overall experiences as a distance education student in this course?
105
VITA
Karen I. Pollack
EDUCATION 2007 Ph.D. The Pennsylvania State University Instructional Systems 1996 M.A. The Pennsylvania State University Telecommunications Studies 1987 B.A. The Pennsylvania State University Journalism
HIGHER EDUCATION EXPERIENCE
2005-Present Associate Director, Inter-Campus Relationships and Blended Learning Program Planning and Management, World Campus Continuing and Distance Education The Pennsylvania State University 1998-2005 Senior Program Manager
Program Planning and Management, World Campus Continuing and Distance Education The Pennsylvania State University
1997-1998 Public Information Office Office of the President University Relations The Pennsylvania State University
1991-1997 Manager of Marketing and Customer Service Office of Business Services The Pennsylvania State University
PUBLICATIONS
1998 Intellectual Property: Copyright Implications for Higher Education The Journal of Academic Librarianship, Vol. 22, No. 5: 11-19.