Embed Size (px)
Citation preview
2015-2016 Academy of Research Excellence
Assessing Stroke Disparities Using a Spatial
Epidemiologic Investigation, 1992-2012
Shamarial Roberson, MPH, DrPH(c)Section Administrator
Chronic Disease Epidemiologist
Bureau of Chronic Disease Prevention
Florida Department of Health

Overview2
Background Methods ResultsPublic Health Implications

What is a stroke?
A stroke occurs when
blood supply to the
brain is blocked or
when a blood vessel
in the brain ruptures,
causing brain tissue
to die

Background: Conditions that
increase risk for stroke4
Previous Stroke or Transient Ischemic
Attack
High Blood Pressure
High Cholesterol
Heart Disease
Diabetes

Background: Behaviors that
increase risk for stroke5
Unhealthy Diet
Physical Inactivity
Unhealthy Weight
Too Much Alcohol
Tobacco Use

Stroke Symptoms6
Sudden numbness or
weakness
Sudden confusion
Trouble seeing
Trouble walking
Severe headache

Stroke AHA/ASA Promotion7

Background: Treatment8
Ischemic (~85% of strokes)
Thrombolytic therapy provided within
3-4.5 hours from onset of symptoms
Limits long-term disability and prevents death
Hemorrhagic (~15% of strokes)
Endovascular procedures
Depends on cause and severity of bleeding
Surgical treatment
9
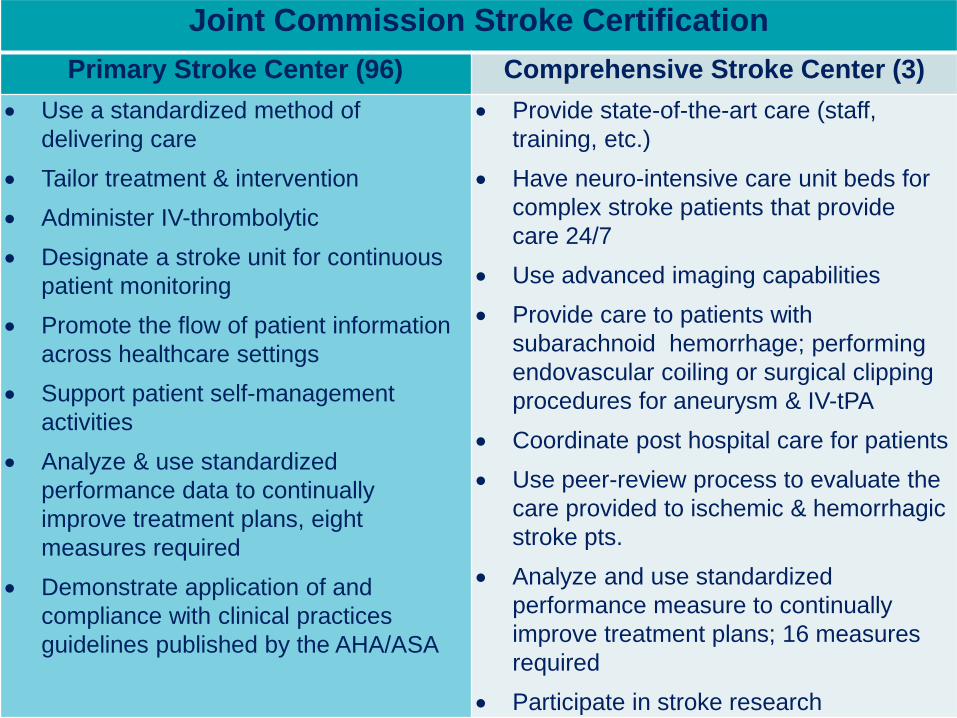
Background: Treatment
Joint Commission Stroke Certification
Primary Stroke Center (96) Comprehensive Stroke Center (3)
Use a standardized method of
delivering care
Tailor treatment & intervention
Administer IV-thrombolytic
Designate a stroke unit for continuous
patient monitoring
Promote the flow of patient information
across healthcare settings
Support patient self-management
activities
Analyze & use standardized
performance data to continually
improve treatment plans, eight
measures required
Demonstrate application of and
compliance with clinical practices
guidelines published by the AHA/ASA
Provide state-of-the-art care (staff,
training, etc.)
Have neuro-intensive care unit beds for
complex stroke patients that provide
care 24/7
Use advanced imaging capabilities
Provide care to patients with
subarachnoid hemorrhage; performing
endovascular coiling or surgical clipping
procedures for aneurysm & IV-tPA
Coordinate post hospital care for patients
Use peer-review process to evaluate the
care provided to ischemic & hemorrhagic
stroke pts.
Analyze and use standardized
performance measure to continually
improve treatment plans; 16 measures
required
Participate in stroke research

Background: Geographic Disparities
Highest burden of stroke found in
southeastern US- “stroke belt”
It is questionable if counties in north
Florida are part of the national stroke belt
Disparities in hospitalization and mortality
rates
Access to care
10

Background: Economic Burden11
• Stroke costs exceeds 73 billion annually in US
• Stroke costs exceed 5.5 billion annually in Florida
Stroke
Expenditures

Traditionally Spatial Epidemiology
Age-adjusted stroke
mortality/Hospitalization
rates have been
mapped in Florida
Rigorous statistical
analyses to
determine if there
are significant
differences in
stroke burden is
lacking in the
literature
Applied Application of Spatial Epidemiology

Research Objective13
The objectives of this study were to investigate geographic disparities of stroke deaths and hospitalizations in Florida 1992-2012

Research Goal
Investigate county-level geographical disparities associated with stroke in FL
Objective 1
Investigate the geographical distribution of age-adjusted hospitalization rates and determine clusters of disease
Objective 2
Investigate the geographical distribution of age-adjusted mortality rates and determine clusters of disease
14

Methods: Study Area15

Methods: Data Sources
Agency for Health Care Administration
Hospital discharge data (1992-2012)
ICD-9–CM codes 430-438
Florida Department of Health (FDOH) Office
of Vital Statistics
Mortality data (1992-2012)
ICD-10 codes I60-I69
16

Methods: Data Analysis17
ArcGIS 10.3
SAS 9.4
GeoDa
Global Moran’s I
Local Moran’s I

Methods: Data Sources
US Census Bureau
County cartographic boundary files
FL Legislature's Office of Economic and
Demographic Research
Population estimates
18
19
Results: Hospitalizations

20

Stroke Age-Adjusted Hospitalization Rates, 1992-2012
21

Hospitalization Clusters,1992-2014
22

23
Results: Mortality

24

Stroke Age-Adjusted Mortality Rates, 1992-2012
25
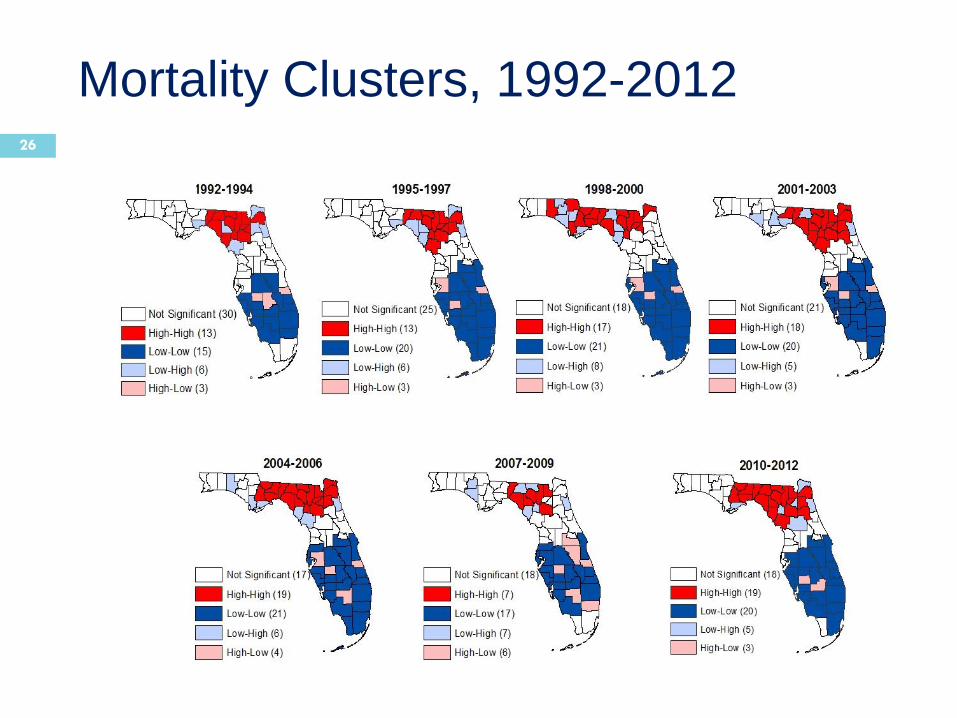
Mortality Clusters, 1992-201226

Discussion
Statistically significant high-rate mortality hotspots consistently
appeared in the proposed stroke belt
region of Florida
27

Discussion
Despite the decrease in stroke mortality
rates over the past 20 years, geographic
disparities continue to exist
Higher rates in the North
Lower rates in the South
These tools need to be added to the
epidemiologist’s tool box to differentiate
significant from non-significant disease
clusters
28

Conclusion
Findings from this study are useful for
informing public health efforts/policies
These county-level GIS cluster maps of
stroke hospitalizations and mortality rates
to:
Better understand the burden of stroke
Inform data-driven decisions, ultimately
leading to interventions aimed at
reducing disparities
29

Health Systems Implications
Increase certification (Joint Commission) of Primary and Comprehensive stroke centers in areas with increased disparities to provide a better system of stroke care
Promote the new certification (2015) of Acute Stroke Ready Hospital in rural and underserved areas in Florida
Use Telestroke networks in medical deserts to administer timely stroke care to close disparity gaps
Provide data to inform policy/systems changes to have specific stroke protocols as suggested by the ASA/AHA for EMS providers, Emergency departments and Hospitals statewide
30

Acknowledgements31
Megan Macdonald, MPH Asthma Epidemiologist
Florida Department of Health
Shamarial Roberson, MPHChronic Disease Epidemiologist
Florida Department of Health
Agricola Odoi, BVM, MSc, PhD, FAHAUniversity of Tennessee, Knoxville

Questions
Shamarial Roberson, MPH DrPH(c)
Section Administrator
Bureau of Chronic Disease Prevention
Division of Community Health Promotion
Florida Department of Health
(850) 245-4444 x3851
32