Embed Size (px)
Citation preview
Assessing resident selection criteria and
performance outcomes in an orthodontic
residency – a retrospective study
A THESIS SUBMITTED TO THE FACULTY OF
UNIVERSITY OF MINNESOTA BY
Natalia S.Menjivar
IN PARTIAL FULFILLMENT OF THE REQUIREMENTS
FOR THE DEGREE OF MASTER OF SCIENCE
Nanci De Felippe, Advisor
June 2014

© Natalia S. Menjivar
June 2014
i
Acknowledgements
I wish to acknowledge my advisor, Dr. Nanci De Felippe, for all her support, guidance,
and encouragement from the creation of this project to its successful completion.
Thank you to the other members of my thesis committee – Drs. Brent Larson, Kim
Mansky, and David Born for their willingness to serve as advisors.
Thank you to my statistician Philippe Gaillard and his research assistants Andrew Wey
and Jun Young Park from the Biostatistical Design and Analysis Center for their
statistical contributions and hard work.
Last, but certainly not least, a special thanks to Wendy Johnson, Diane Anderson, Diane
Parker, Lynn Erickson, and dental student Ejike Ezeja and his colleagues for their
assistance with my project. I am truly grateful!

ii
Dedication
I dedicate this publication to my wonderfully supportive and loving husband, Walter
Menjivar, and to my family who has always encouraged and believed in me.
iii
Abstract
Aims: The purpose of this study was to assess the relationship between resident selection
criteria and performance outcomes in an orthodontic residency.
Methods: A retrospective, cross-sectional review of applications and residency
performance of thirty orthodontists who graduated from 2007 to 2011 was conducted.
Subjective and objective resident selection criteria were compared with measurable
outcomes of resident performance.
Results: Both undergraduate GPA and the quantitative Graduate Record Exam score were
inversely associated with the orthodontic residency GPA. The National Board Dental
Exam part I microbiology/pathology subscore was negatively associated with financial
productivity from two years of patient treatment. Dental school class rank was positively
associated with both the first year exam and faculty evaluation at the end of the program.
Dental school GPA was positively associated with scores on the outcome case
presentation but negatively associated with the mean change in faculty evaluations from
the beginning to the end of the program.
Conclusions: While some significant associations may exist between objective resident
selection criteria and orthodontic resident performance criteria, the predictive value of
many of the subjective criteria (i.e. letters of recommendation, personal statements, etc.)
was largely undetermined by our small sample.
Key words: Orthodontic Residency; Postgraduate admission; Selection criteria;
Residency success; Performance Outcomes
iv
Table of Contents
Acknowledgements…………………………………………………………… i
Dedication………………………………………………………………........... ii
Abstract……………………………………………………………………....... iii
Table of Contents……………………………………………………………… iv
List of Tables………………………………………………………………….. v
List of Figures…………………………………………………………………. vi
Introduction and Literature Review…………………………………………… 1
Materials and Methods………………………………………………………... 6
Results………………………………………………………………………… 15
Discussion……………………………………………………………………... 28
Conclusions..………………………………………………………………….. 35
References…………………………………………………………………. 38-40
Appendix A……………………………………………………………………. 41
Appendix B……………………………………………………………………. 42
Appendix C……………………………………………………………………. 43
Appendix D……………………………………………………………………. 44
Appendix E……………………………………………………………………. 45
Appendix F……………………………………………………………………. 46
v
List of Tables
Table 1: Resident Selection Criteria………………………………………...... 8
Table 2:
Resident Characteristics...……………………………………….......
10
Table 3:
Resident Performance Criteria..……………………………………..
11
Table 4:
Resident Demographics, 2005-2011…………………………….......
15
Table 5:
Resident Continuous Characteristics, 2005-2011……………….......
15
Table 6:
Resident Performance Characteristics, 2005-2011………………….
16
Table 7:
Simple Linear Regression Summary, Objective Resident
Selection and Resident Performance Criteria……………………
18-19
Table 8:
Simple Linear Regression Summary, Objective Resident
Selection and Subjective Resident Performance Criteria………..
21-23
Table 9:
Summary of Odds Ratios for Faculty Regrets Variable and
Objective Resident Selection Criteria……………………………
25
Table 10:
Simple Linear Regression Summary, Subjective Resident
Selection and Objective Resident Performance Criteria………...
26
Table 11:
Simple Linear Regression Summary, Subjective Resident
Selection and Objective Resident Performance Criteria………...
27
Table 12:
Summary of Odds Ratios for Faculty Regrets Variable and
Subjective Resident Selection Criteria………………………………
28
Table 13:
Faculty Ranking Correlation to Objective Resident Selection
Criteria……………………………………………………………….
30
vi
List of Figures
Figure 1: Hypotheses……………………………………………………………. 6
Figure 2: Bland-Altman Plot: Recommendation Letters……………………….. 17
Figure 3: Bland-Altman Plot: Personal Statement……………………………… 17
Figure 4: Linear regression plots, Objective Resident Selection Criteria and
Resident Performance…………………………………………………
20
Figure 5: Linear regression plots, Objective Resident Selection Criteria and
Subjective Resident Performance……………………………………..
24
1
Introduction and Literature Review
Admission to postgraduate dental specialty programs is highly competitive. The
number of applications to orthodontic residency programs has soared to more than
10,600, an estimated increase of 8%, while first-year enrollment has remained constant at
355.1 At the University of Minnesota, Division of Orthodontics, the number of applicants
increased approximately 12% between 2005-2008 (Wendy Johnson, personal
communication, December 2013). Upon joining the American Dental Education
Association’s Postdoctoral Application Support Service in 2013, the Division of
Orthodontics experienced an 82% jump in the number of applicants compared with the
previous year. All the while, the number of resident positions available each year has
remained unchanged. With increasing competition, postgraduate dental programs tend to
focus more heavily on academic achievements to screen applicants.2
Galang et al3 surveyed postgraduate orthodontic program directors and found that
the top three criteria used to evaluate orthodontic applicants include interview ratings,
dental school class rank, and dental school clinical grades. Before interviews can be
granted, however, the applicant pool is narrowed considerably with high importance
placed on academic achievement.
To date, much of the research related to postgraduate dental admissions has
focused on which criteria best predict acceptance into residency. The intent of this study
is to expand past research to evaluate the significance of resident selection criteria on
ultimate performance in a residency. After all, residency program directors and selection
committees invest considerable resources – time, departmental funds, and labor – to
2
review hundreds of applications and interview top candidates. For instance, in 2012, the
University of Minnesota, Division of Orthodontics, invested over thirty-two hours per
residency position as part of its admission process (Admissions selection committee,
personal communication, December 2012). Beyond attracting the most highly qualified
applicants, it is in the best interest of the program to also select residents who are going to
succeed in its particular program. This study seeks to identify factors which help predict
successful performance in orthodontic residency, in particular, the orthodontic residency
program at the University of Minnesota.
Much of the research on the relationship of admissions criteria to subsequent
performance in residency has occurred in medicine, for example, in surgical, orthopedic,
and anesthesiology residencies. A retrospective study of the Medical University of South
Carolina surgical residency program found that medical school grade point average
(GPA) and standardized board scores had a negative correlation with clinical
performance in residency as measured by faculty ratings in core competency areas.4
“The ‘best’ students do not always make the ‘best’ residents, and sometimes the
‘average’ students excel as residents”.5(p.1094)
A study by Fine and Hayward6 of
University of Michigan internal medicine residents found no correlation between the
National Board of Medical Examiners (NBME) Part I score and subsequent residency
performance as measured by evaluations by attending physicians and a residency
committee. In a retrospective study of obstetrics and gynecology residents, objective
components of medical student applications such as the United States Medical Licensing
3
Exam (USMLE) score and grades on clinical rotations had no predictable influence on
residency performance.7
Therefore, the current evidence which originates mostly from the medical
literature, suggests limited association between the criteria used to select residents and
resident performance outcomes. “Resident success is a complex outcome, and other
unmeasured and unexamined characteristics can provide additional insight into choosing
successful residents”.8(p.654)
Though the comparison of objective data such as GPA,
standardized exams, or class ranking would seem to create a level playing field among
candidates, they do not necessarily provide selection committees with a complete profile
to identify future high-performing residents. “The utility of these data as a means of
identifying those medical students who will be successful residents is based on the
unproven assumption that performance during medical school is a good predictor of
performance during residency”.9(p.259)
While success in residency may be interpreted differently based on the program or
the specialty, there are certainly many shared ideals of resident performance. Patient
care, professionalism, knowledge, work ethic, communication skills, leadership, and
teachability are presumably valued by medical and dental residencies alike. Apart from
the objective criterion of knowledge, many of these attributes are challenging to measure
or assess from an application or interview.
Almost certainly character, motivation, affective attitudes, and interpersonal skills
have a very significant role in candidates’ success. Equally certain is that these
aptitudes and abilities are not well reflected in the admission information as are
the cognitive abilities. Although resident interviews are often meant to close the
gap, they are hindered by the time commitment required and the differences
among faculty in their ability to perceive nonacademic attributes.10(p.328)
4
Without standardized evaluation tools, i.e. rubrics, designed to guide the interview
or to calibrate faculty interviewers, it can be difficult to consistently use the interview to
make admissions decisions. The utility of the interview process to compare and contrast
candidates can be drastically influenced by the mood or affect of the interviewer, the
ability of the applicant to make a positively memorable first impression, and of course,
each interviewer’s personal and professional biases. In addition, faculty interviews
provide only a glimpse or snapshot of the applicant. Due to the challenge of adequately
assessing the non-cognitive attributes of applicants, more weight is often given to the
objective, numerical indicators of achievement – grades, class rank, and board
scores.10(p.328)
With a strong focus on objective achievement, specialty programs have relied
heavily, if not erroneously, for many years, on the National Board Dental Examination
(NBDE) to stratify competitive applicants. A major focus in postgraduate dental
education is the admissions process and subsequent selection of exceptional candidates to
enhance the dental profession. Despite the fact that the “National Board Exam results are
not intended to compare individuals…or to show gradients of academic achievement or
ability”11(p.1289)
, the exam scores have continued to be used for such a purpose. In its
2011 newsletter, the Joint Commission on National Dental Examinations asserted that
“there is no evidence that there is a significant difference between candidates who receive
scores of 89, 90 or 91. The use of National Board scores for any purpose other than as
part of the licensure process has not been validated”.12(p.4)
5
The conversion to pass-fail underscores the mission of the board exam and returns
it to its fundamental purpose: to determine whether “the candidate has acquired the
minimum theoretical knowledge and problem solving skills to practice safely”.13(p.3)
The
NBDE’s change to a pass-fail scoring system in January 2012 eliminates an objective
measure traditionally used to screen applicants to orthodontic residency and other dental
specialties. For those applicants from dental schools without grades or class ranks, the
NBDE may have been the only objective indicator of academic achievement.
In light of the recent change of the NBDE scoring to pass-fail, review of the
postgraduate dental admissions process to identify meaningful selection criteria is
critical. To the author’s knowledge, there is no published study to date that has
considered whether resident selection criteria used in postgraduate orthodontic
admissions are predictive of a student’s performance in an orthodontic residency
program. Based on previous studies in other fields, the interpretation of residency
success in this study was determined by a combination of objective and subjective
assessments. Most of these criteria were unique to the orthodontic residency program at
the University of Minnesota but are also conceptually similar to assessments used in
other residency programs.
This study retrospectively reported on application data and residency performance
outcomes for a limited group of orthodontic residents who graduated from the University
of Minnesota, Division of Orthodontics, over a five year period. Its objective was to
assess the relationship between objective and subjective resident selection criteria and
measureable performance outcomes in an orthodontic residency. In order to achieve this
6
goal, a program-specific definition of successful performance in orthodontic residency,
incorporating both objective and subjective outcomes, was created. In addition,
evaluative rubrics to standardize the analysis of qualitative data were customized.
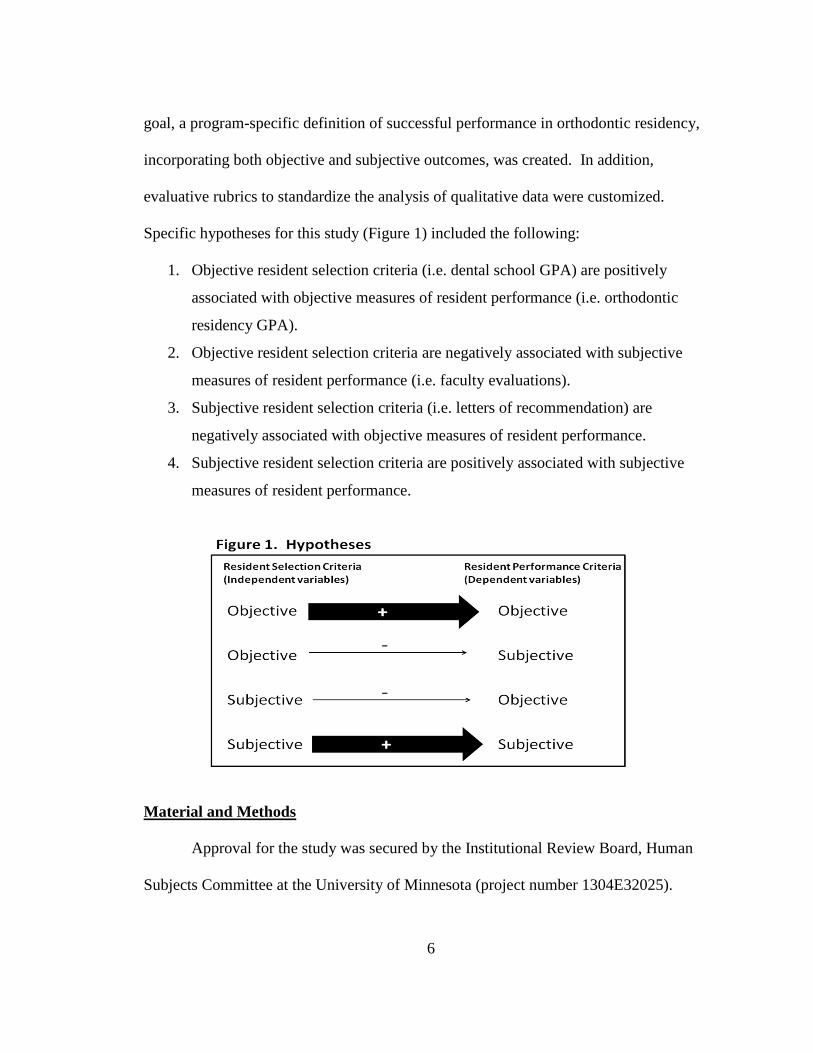
Specific hypotheses for this study (Figure 1) included the following:
1. Objective resident selection criteria (i.e. dental school GPA) are positively
associated with objective measures of resident performance (i.e. orthodontic
residency GPA).
2. Objective resident selection criteria are negatively associated with subjective
measures of resident performance (i.e. faculty evaluations).
3. Subjective resident selection criteria (i.e. letters of recommendation) are
negatively associated with objective measures of resident performance.
4. Subjective resident selection criteria are positively associated with subjective
measures of resident performance.
Material and Methods
Approval for the study was secured by the Institutional Review Board, Human
Subjects Committee at the University of Minnesota (project number 1304E32025).
7
Study Design
A retrospective study of applications and residency performance of thirty (N=30)
orthodontic residents who graduated from the University of Minnesota, Division of
Orthodontics, from 2007 to 2011 was performed. The applications for admission for
thirty orthodontic residents were copied and made available to the investigator in a
deidentified format. Additional documents in the residents’ files used to assess
performance in residency were also duplicated and deidentified. The residents from 2005
until 2011 (i.e. 5 graduating classes, 2007-2011) were given subject identification
numbers, and their accompanying photocopied application and residency documents were
similarly labeled. Data was entered into a password-protected Microsoft Excel (2007)
file. A master list of residents’ names linked with subject identifications was securely
maintained by a staff member, not affiliated with the study.
A preliminary power analysis using data from a pilot group of an earlier
graduating class (2006) estimated the sample size needed to achieve 80% power at 5%.
The results estimated that a sample of thirty subjects would achieve 82.7% power while
maintaining a type-1 error rate of 5%.
Admissions Process
Late every summer, a new application cycle to orthodontic specialty programs
begins. At the University of Minnesota, Division of Orthodontics, the task of reviewing
applications is shared by members of an admissions selection committee, consisting of
six full-time faculty. Each application is read by two members of the committee which
meets to discuss all candidates once applications have been preliminarily reviewed. The
8
original applicant pool of over one-hundred is narrowed to approximately twenty-five
candidates invited to interview in the fall. Following the interview process, members of
the committee submit their own individualized rankings of the interviewees, the average
of which is used to create a master ranking. Once again, the committee meets to debate
the formal ordered ranking. The final rank order list is submitted to the postdoctoral
dental matching program (the “Match”) which uses an algorithm to pair candidates with
their preferred programs based on the rank order lists. This complex matching system is
mutually beneficial for candidates and programs, allowing candidates to attend their most
preferred programs while simultaneously matching programs with their top candidates.
Resident Selection Criteria
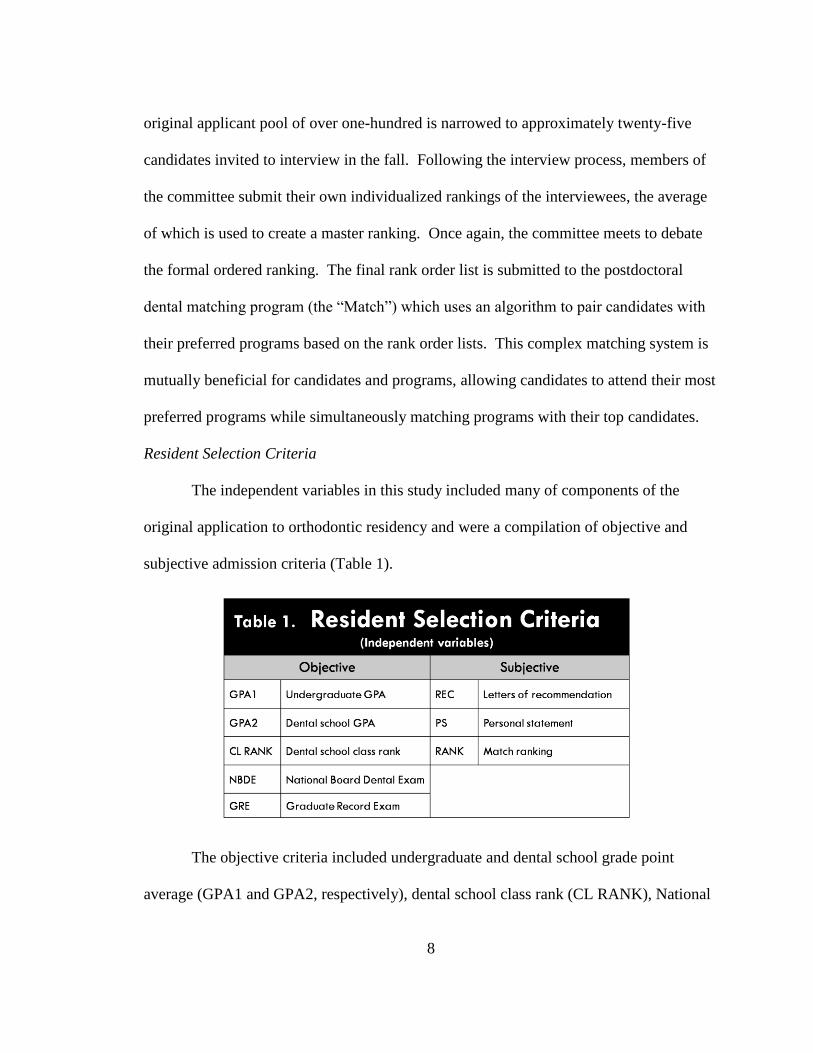
The independent variables in this study included many of components of the
original application to orthodontic residency and were a compilation of objective and
subjective admission criteria (Table 1).
The objective criteria included undergraduate and dental school grade point
average (GPA1 and GPA2, respectively), dental school class rank (CL RANK), National
9
Board Dental Examination (NBDE) Part I score, and finally, the Graduate Record
Examination (GRE). Subscores of the NBDE exam including Anatomic Sciences
(NBDEa), Biochemistry/Physiology (NBDEb), Microbiology/Pathology (NBDEc), and
Dental Anatomy and Occlusion (NBDEd) also considered. Verbal and quantitative
sections of the GRE (GREv and GREq, respectively), were also evaluated.
As part of the application to orthodontic residency at the University of Minnesota,
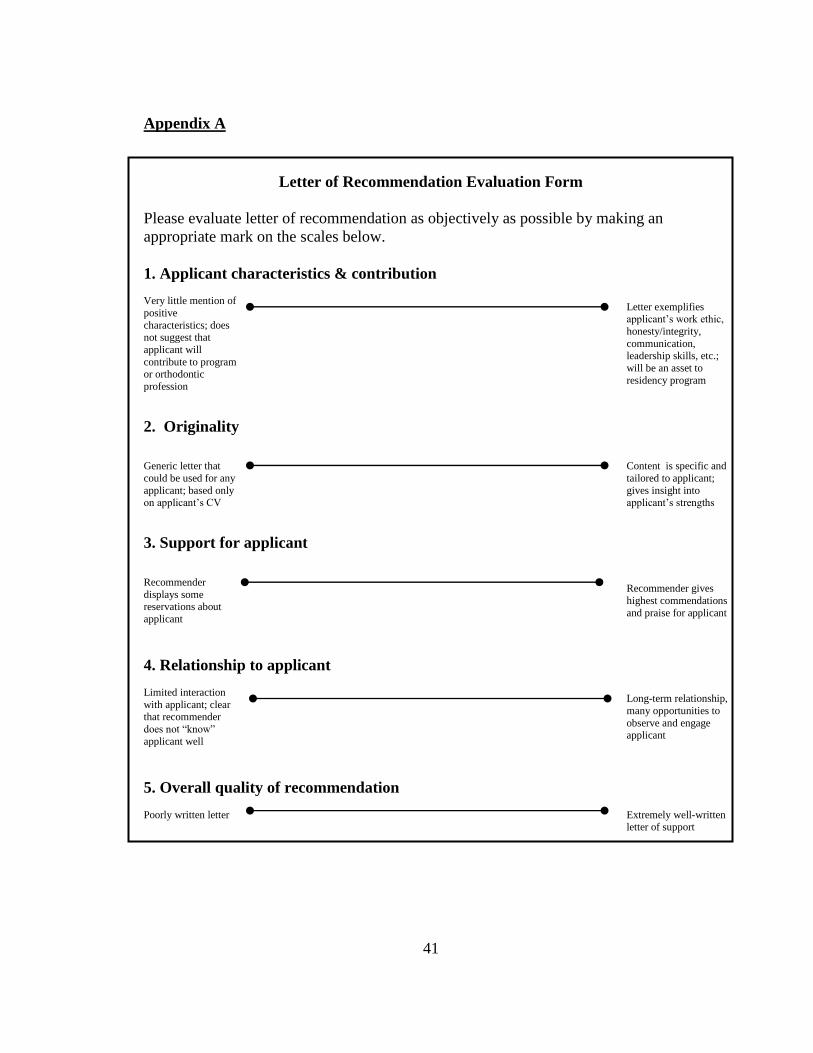
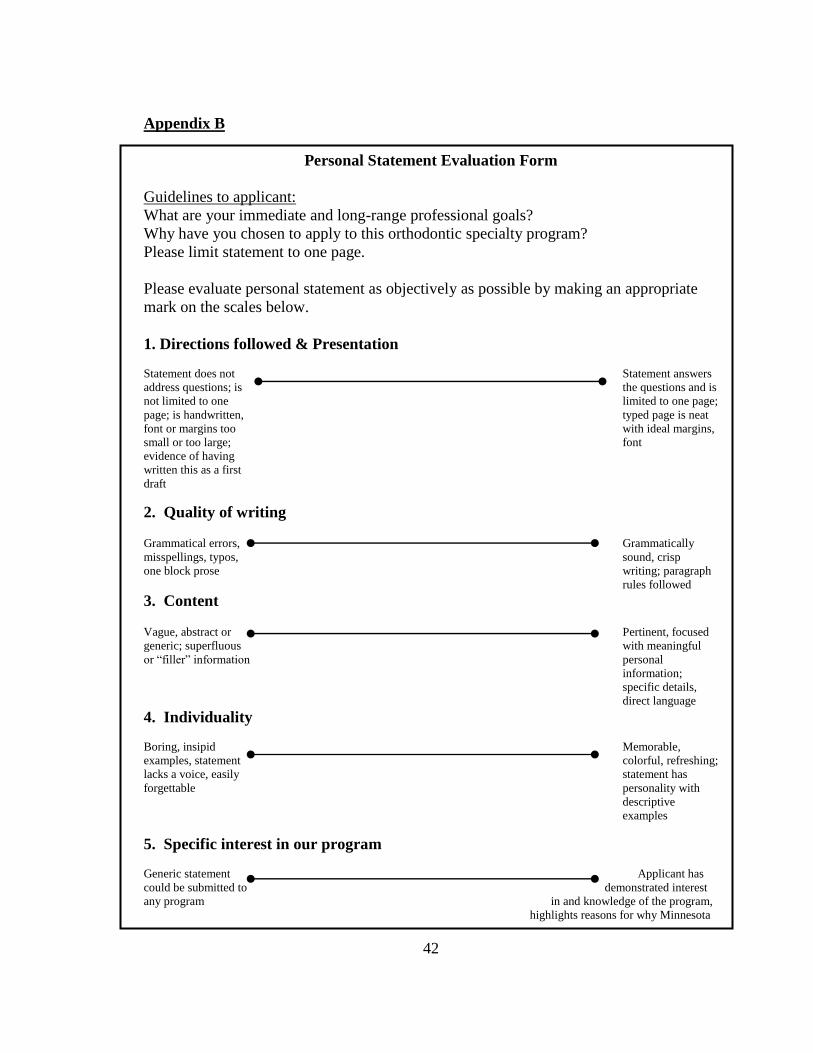
three letters of recommendation (REC) and a personal statement (PS) are required. For
the purpose of this study, original rubrics were developed to rate both the letters of
recommendation and personal statements retrospectively (Appendices A and B,
respectively). The concept to design our own tool for analyzing the qualitative aspects of
an application stemmed from interview evaluation forms created by the Medical
University of South Carolina surgical residency program to assess reference letters and
personal characteristics.4(p.379)
Our letter of recommendation evaluation form assessed
the following: applicant characteristics and contribution, originality, support for the
applicant, relationship of recommender to applicant, and overall quality of the
recommendation. The personal statement evaluation form included the following five
equally-weighted categories: directions followed and presentation, quality of the writing,
content, individuality, and specific interest in our program. Both evaluation forms
utilized a visual analog scale (VAS) to mark the appropriate rating.
For consistency, one member of the research team (N.M.) read and rated all letters
of recommendation and applicant personal statements. To test intrarater reliability,
letters of recommendations and personal statements were rated a second time by the same
10
independent rater at least one month after the initial rating. In addition, letters of
recommendation and personal statements were read separately from the remainder of the
application so as not to introduce bias from other variables such as grades or test scores.
The final subjective criterion was the selection committee’s rank order list of
applicants following their interviews (RANK). To rank interviewees, each faculty judged
the written application and interview performance of candidates based on his/her own
beliefs. The simple average of all faculty rankings resulted in a preliminary rank; faculty
met to discuss and debate the final rank order list which was submitted to the Match
program.
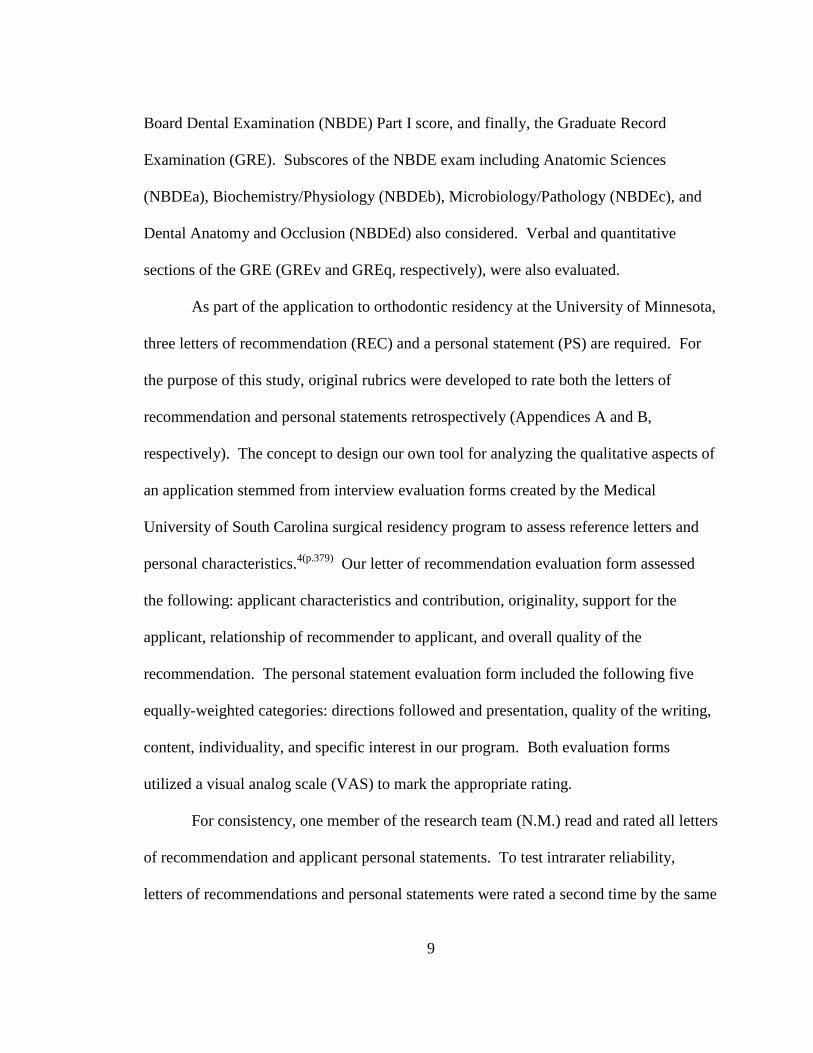
Additional descriptive characteristics of the sample were collected (Table 2).
Resident demographic information including gender, age, ethnicity, date of application
submission, and public versus private educational institutions were recorded. Marital
status, dentist in the family, and work experience, including private practice or other
residency experience, was noted when mentioned in the application.
11
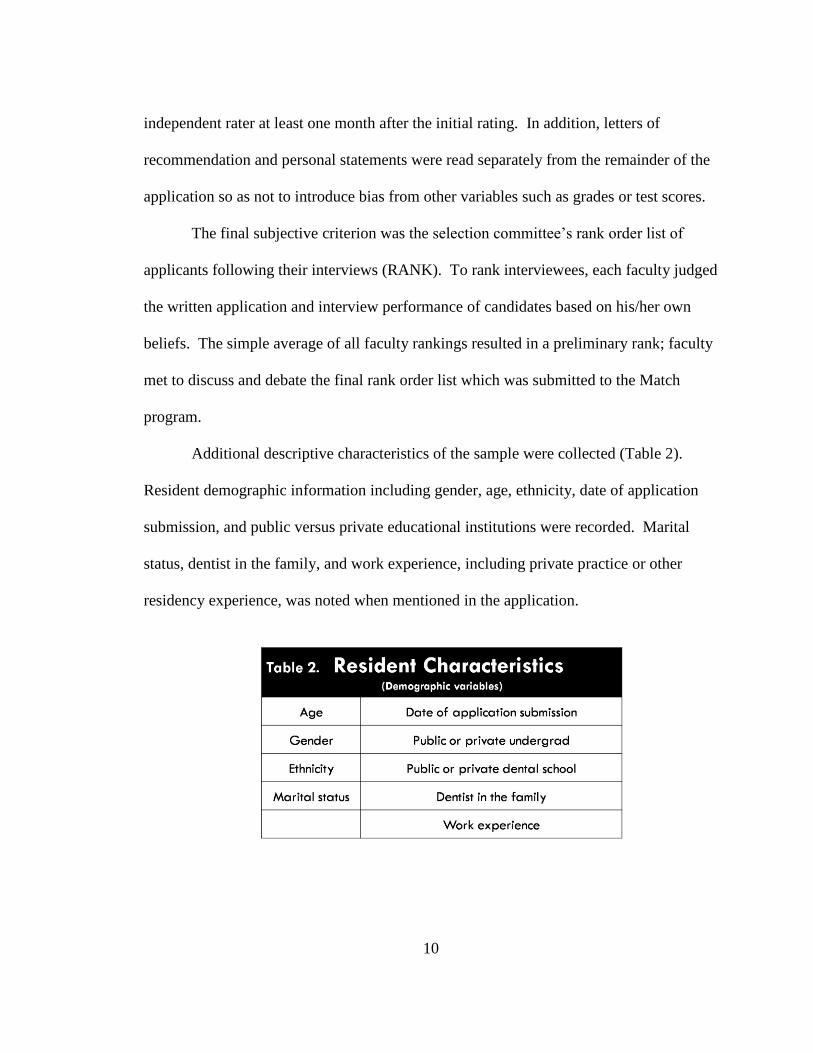
Resident Performance
The dependent variables in this study were the measureable factors of success
during residency; they consisted of both objective and subjective criteria (Table 3).
Objective factors included a written examination (EX1) taken by residents at the
end of their first year to assess orthodontic knowledge acquired and critical thinking
skills. Grade point average from the two year orthodontic residency (GPA3) and the
American Board of Orthodontics standardized examination (ABOE), which is a
component of board certification, were two more objective assessments. Finally,
financial productivity (FP) represented the dollar amount generated by each resident for
orthodontic services over two years.
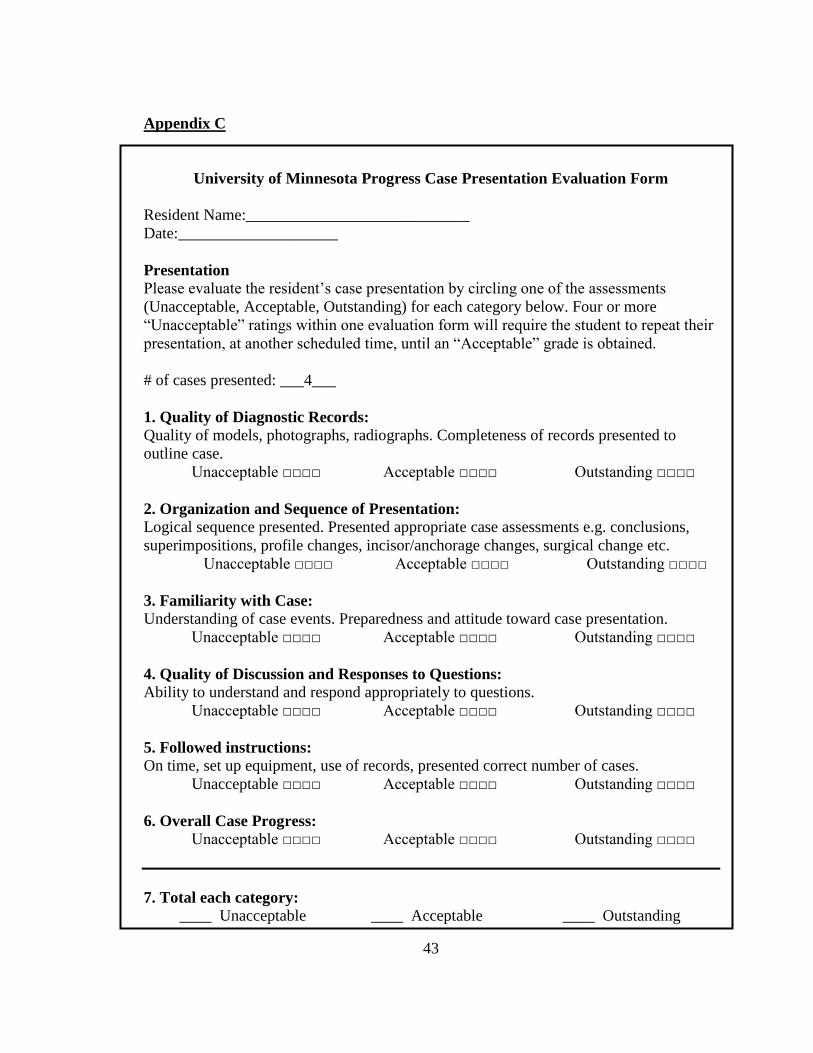
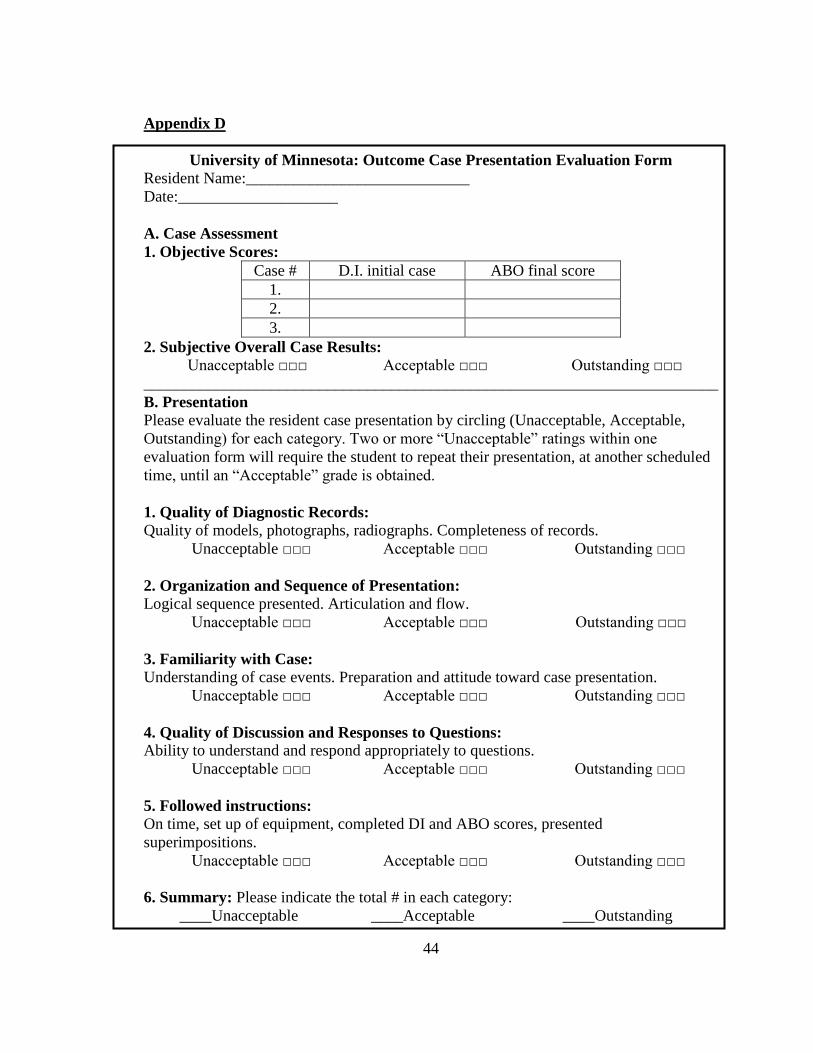
The subjective factors describing performance in residency consisted of scores
from orthodontic progress case presentations (PCP) and orthodontic outcome case
presentations (OCP). These presentations are designed to evaluate residents’ diagnostic
and treatment planning skills, clinical progress, and the ability to finish a case meeting
board certification criteria. Residents presented cases in mid-treatment (PCP) or cases
12
that had been completed (OCP), highlighting aspects such as diagnosis, treatment
options, and overall knowledge of the case. Faculty who attended the PCPs or OCPs
graded residents in multiple categories using a 3-point Likert, checking off unacceptable,
acceptable, or outstanding based on the quality of the presentation (Appendices C and D,
respectively).
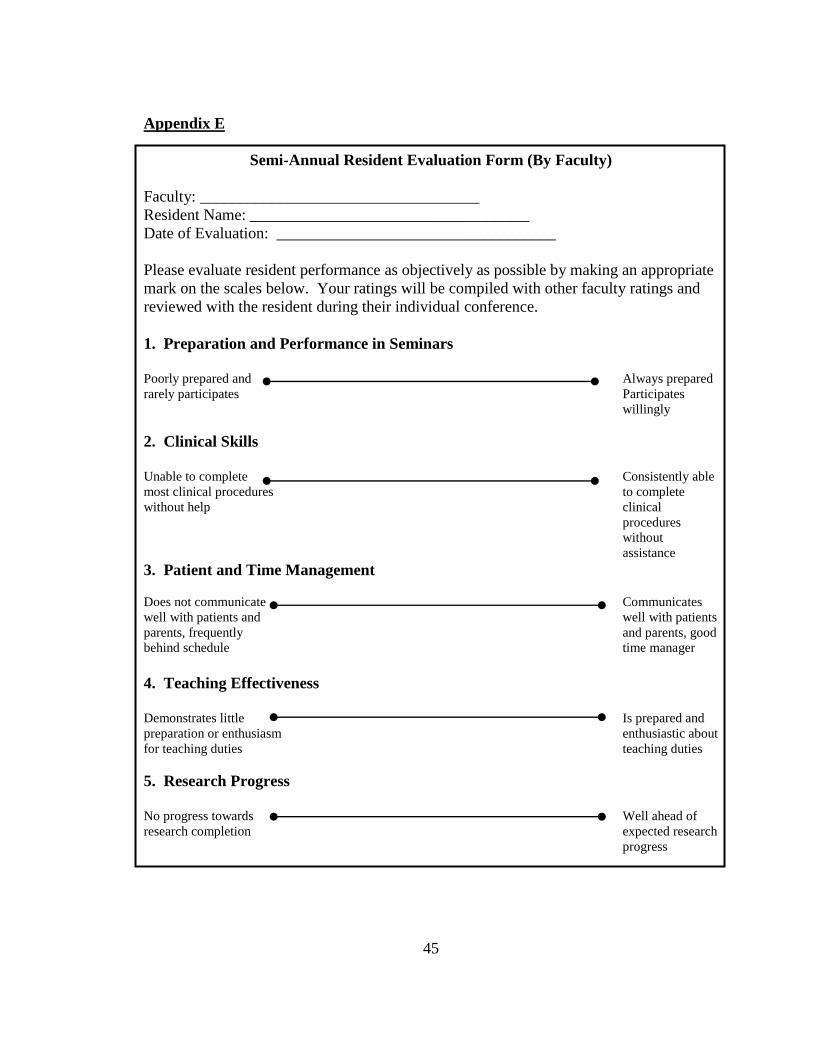
Another subjective component of the resident performance criteria included bi-
annual evaluations (EVAL) in which faculty used a visual analog scale to assess residents
in five core areas (Appendix E). For each evaluation, full-time faculty rated residents on
five competencies including preparation and performance in seminars, clinical skills,
patient and time management, teaching effectiveness, and research progress. While the
original faculty evaluations included an open response section for comments, we chose
not to analyze this data.
Finally, four full-time and six part-time faculty from 2005-2011were asked to
provide a subjective ranking (FRANK) of past residents. According to Stohl et al,
“faculty ranking of residents is the most commonly used method for assessing
‘success’”.7(p.324)
The faculty had significant interaction with the residents both in clinical
and didactic settings and thus were able to use their own personal experiences to make
subjective rankings of the residents by class. Through a secure and anonymous online
survey (http://www.surveymonkey.com), the faculty were asked to provide a rank score
from one through six for each class where one was the highest score for a resident and six
was the lowest. To reduce the potential for recall bias, photos of residents were placed
alongside their names. Similar to the studies of Daly et al and Gunderman and Jackson,
13
no set criteria were provided as guidelines in the faculty rankings.8(p.650), 18
Faculty evaluations of residents were completed every six months during the two-
year residency program. During the period from 2005-2011, seven different faculty
completed evaluations of residents. On average, between two and three evaluations were
completed for each resident at each time period (T1-T4). The first and third evaluations
(T1 and T3, respectively) were completed six months into each academic year.
Significantly fewer evaluations were completed during T4. Due to the considerable
amount of missing data, it was decided to take the mean of the faculty evaluations.
Averaging across criteria, faculty evaluators, and time points created a one-dimensional
variable for faculty evaluations (EVAL). Here we made the assumption that inter-rater
reliability was strong enough. It was found that the data from T3 was the most complete
so the mean of faculty evaluations from T3 was considered as a separate dependent
variable (EVAL:T3). In addition, we were interested in measuring the significance of the
change in faculty evaluation from T1 to T3 which created another variable (EVAL: T3-
1).
In addition to ranking past residents, faculty were also asked how they felt about
each resident’s admittance to the program. Galang et al asked postgraduate program
directors “Would you select all of your current and/or former residents from the last 5
years again?”3(p.827e.4)
We designed a similar question using descriptive categories (Likert
scale), permitting faculty to choose: strongly readmit, consider readmitting with
hesitation, or regret admitting to describe how they felt about each resident’s admittance
to the program. This determination represented variable FRANK-r.
14
Statistics
Several measures, both independent and dependent, were averaged together to
simplify the overall analysis. For the resident selection criteria, the subscales for each
recommendation and personal statement and personal statement were averaged together.
As such, there is an overall rating for each recommendation (three total
recommendations) and personal statement. The three recommendations were averaged
together to assess the average quality of an applicant’s recommendations. A similar
approach was taken for faculty evaluations (EVAL), faculty rankings (FRANK), and
progress/outcome presentations (PCP/OCP).
Averaging together multiple ratings to obtain a “composite” score is a simple idea
that is easy to implement. However, it implicitly assumes that the missing data is missing
completely at random. For example, if poor faculty evaluations were, on average, more
likely to be missing, then the assumption of missing completely at random is violated. If
this assumption, which cannot be tested, is violated, then the resulting analyses are
biased.
Bland-Altman plots were constructed to show variability in repeated measurements.
Simple linear regression models were used to estimate the relations between independent
and dependent variables with the exception of the variable FRANK-r.
A generalized estimating equation (GEE)14
was utilized to evaluate FRANK-r. In
statistics, GEE is a method that accounts for the correlated nature of the outcome, which
is robust against structure of the working correlation. In our case, we used exchangeable
working correlation and investigated the effects of objective independent variables on
15
FRANK-r. A p-value value of less than 0.05 was considered statistically significant.
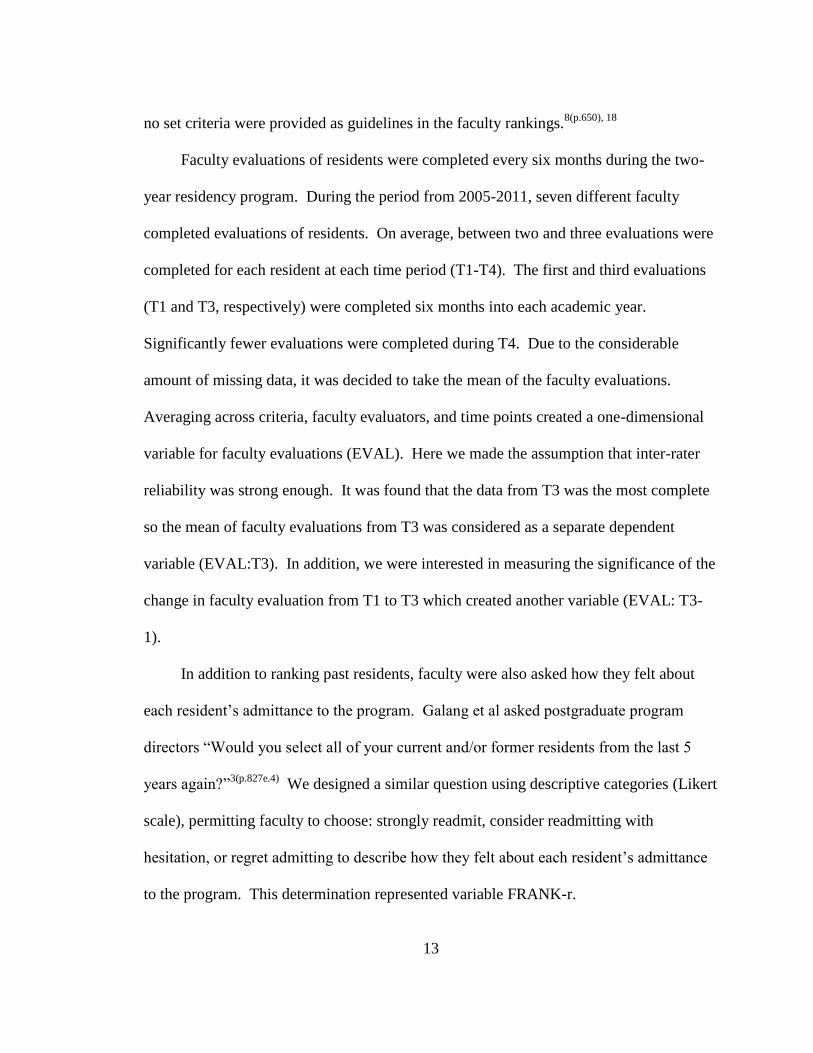
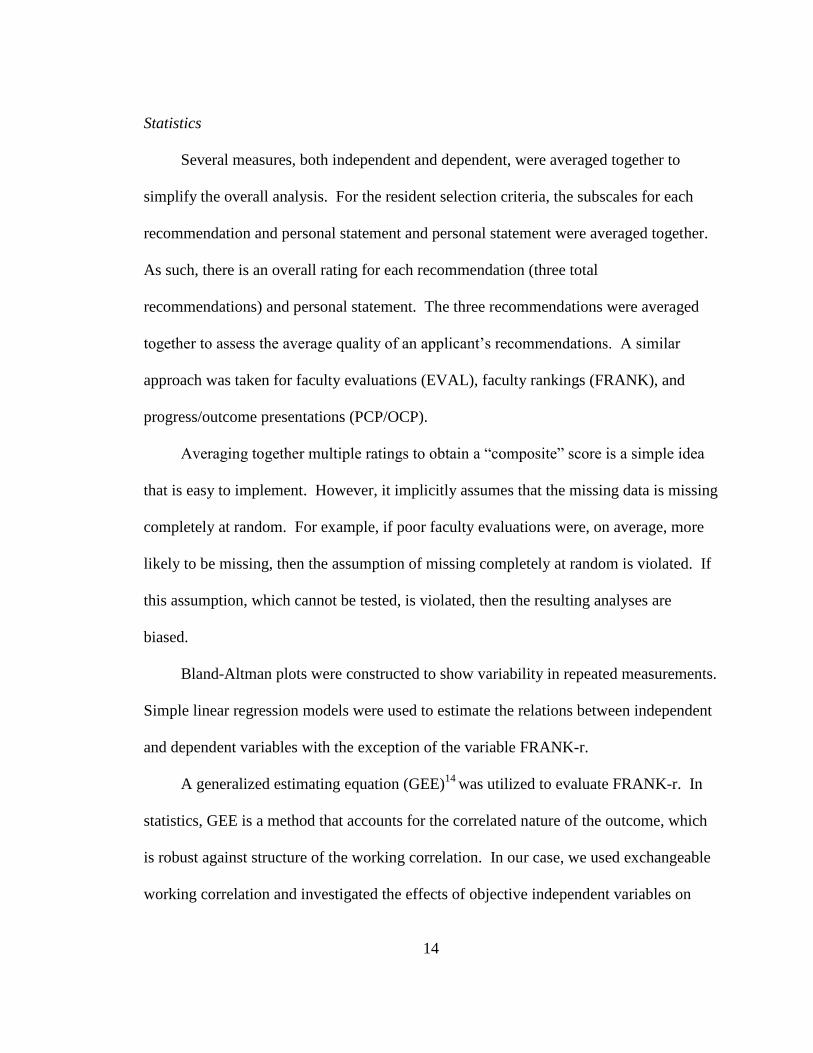
Results
Descriptive statistics for the thirty
residents, including demographics,
continuous variables, and performance
characteristics are included in Tables 4, 5,
and 6, respectively. Fifty-seven percent
were men (n=17). The mean age of the
orthodontic residents upon enrollment was
27 years (range: 24-43). Most residents
attended public institutions for
undergraduate (n=21) and
dental school (n=22). Mean
GPAs for undergraduate and
dental school were 3.7 and
3.8, respectively. The sample
mean for the NBDE part I
score was 92 while the mean
for the GRE was 1259 out of
1600. Class rank was listed as
a percentile (1- (rank/# of
students)).
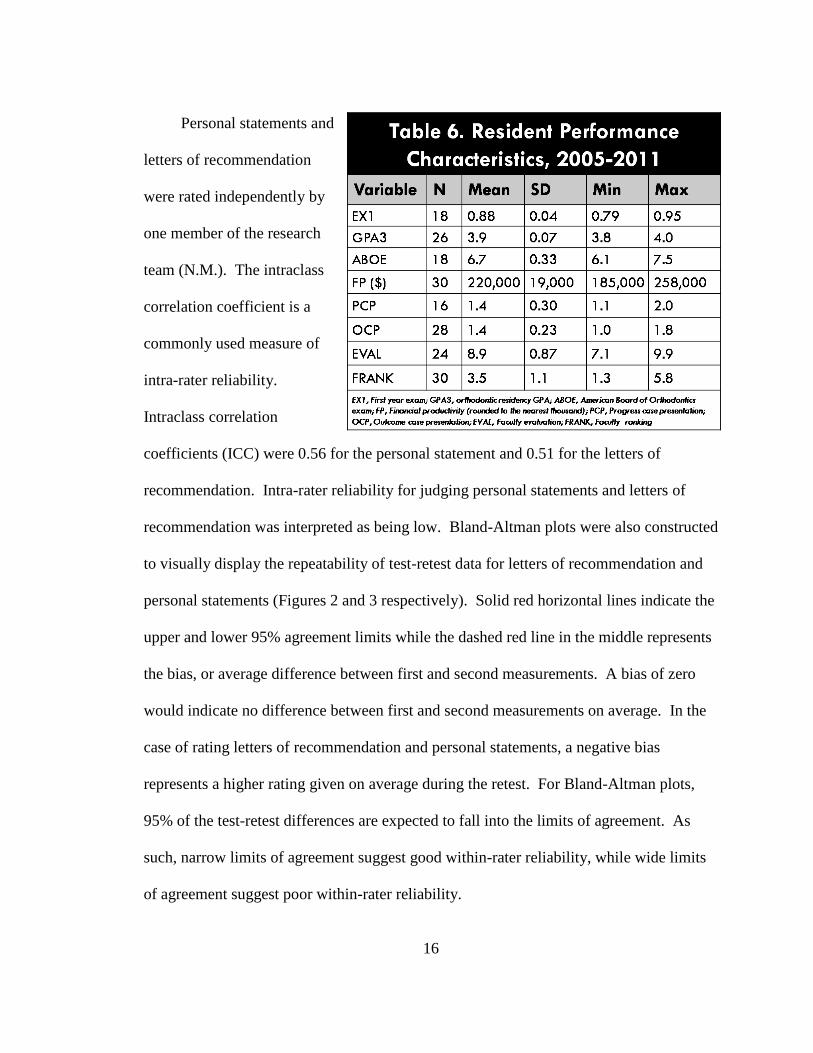
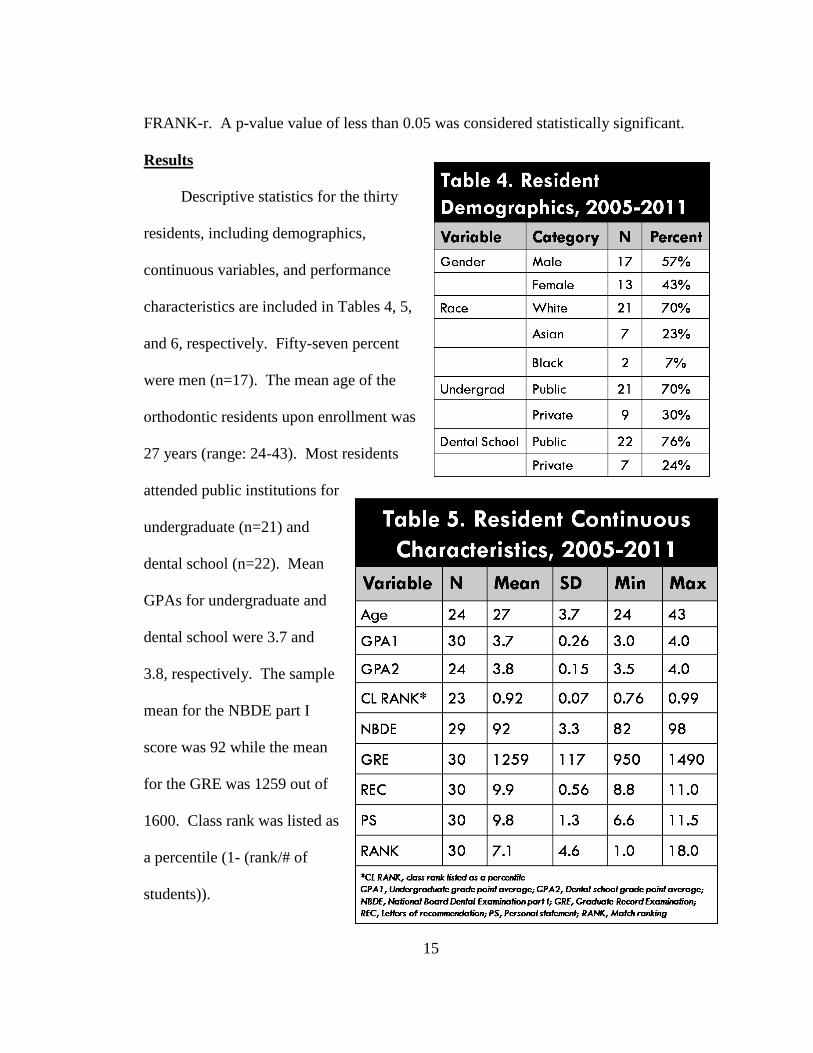
16
Personal statements and
letters of recommendation
were rated independently by
one member of the research
team (N.M.). The intraclass
correlation coefficient is a
commonly used measure of
intra-rater reliability.
Intraclass correlation
coefficients (ICC) were 0.56 for the personal statement and 0.51 for the letters of
recommendation. Intra-rater reliability for judging personal statements and letters of
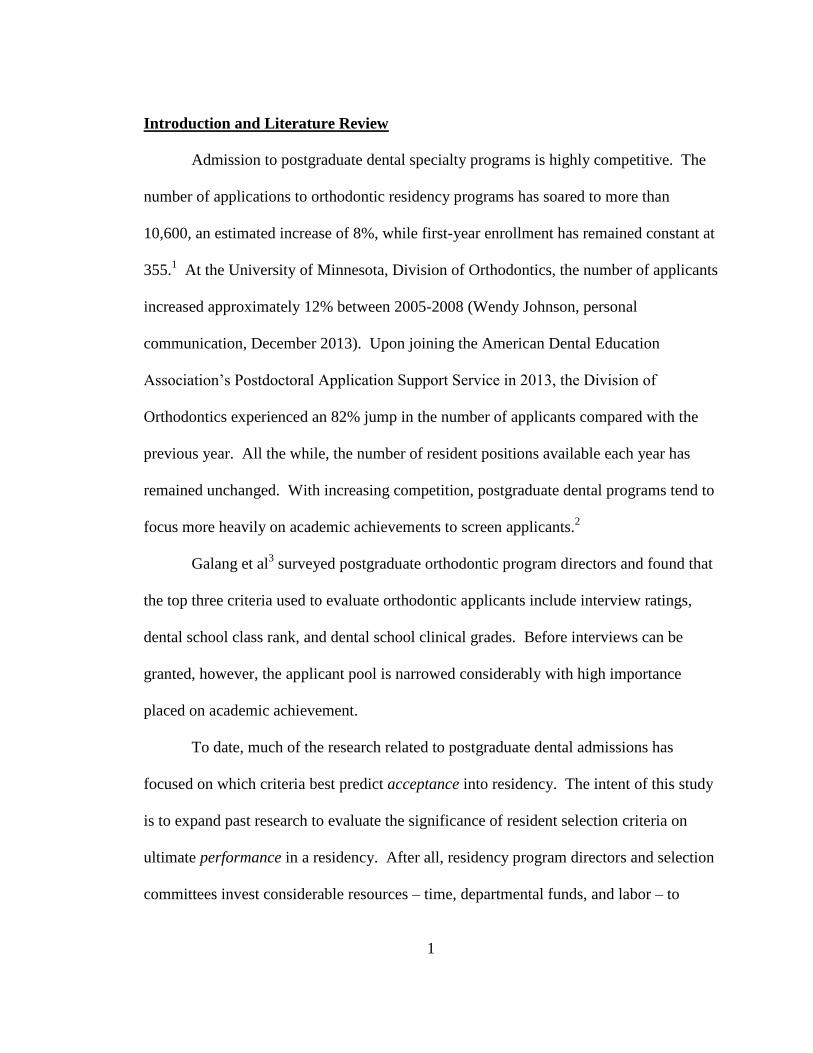
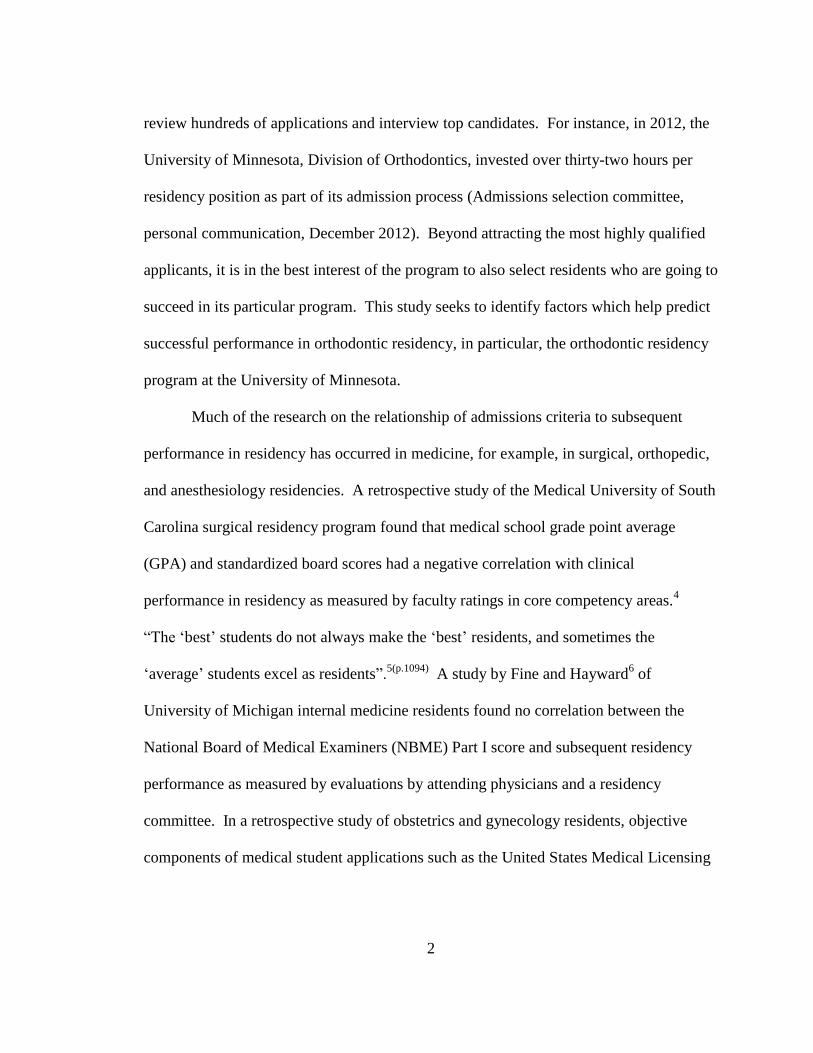
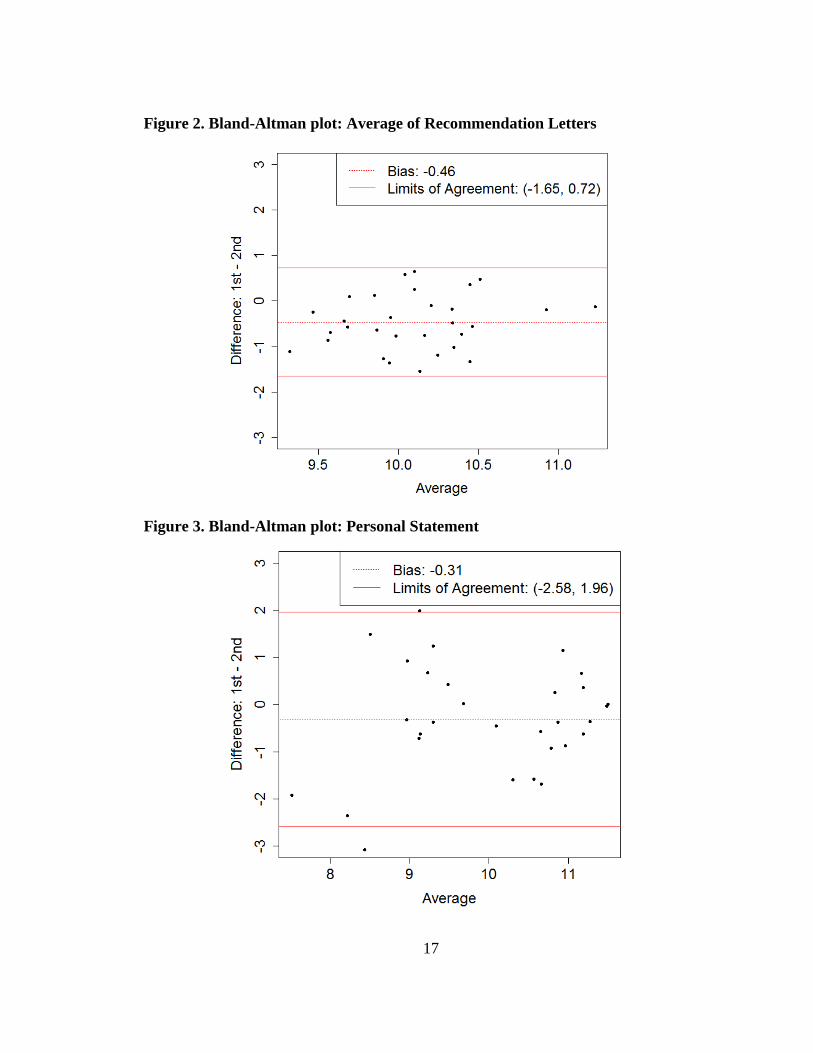
recommendation was interpreted as being low. Bland-Altman plots were also constructed
to visually display the repeatability of test-retest data for letters of recommendation and
personal statements (Figures 2 and 3 respectively). Solid red horizontal lines indicate the
upper and lower 95% agreement limits while the dashed red line in the middle represents
the bias, or average difference between first and second measurements. A bias of zero
would indicate no difference between first and second measurements on average. In the
case of rating letters of recommendation and personal statements, a negative bias
represents a higher rating given on average during the retest. For Bland-Altman plots,
95% of the test-retest differences are expected to fall into the limits of agreement. As
such, narrow limits of agreement suggest good within-rater reliability, while wide limits
of agreement suggest poor within-rater reliability.
17
Figure 2. Bland-Altman plot: Average of Recommendation Letters
Figure 3. Bland-Altman plot: Personal Statement
18
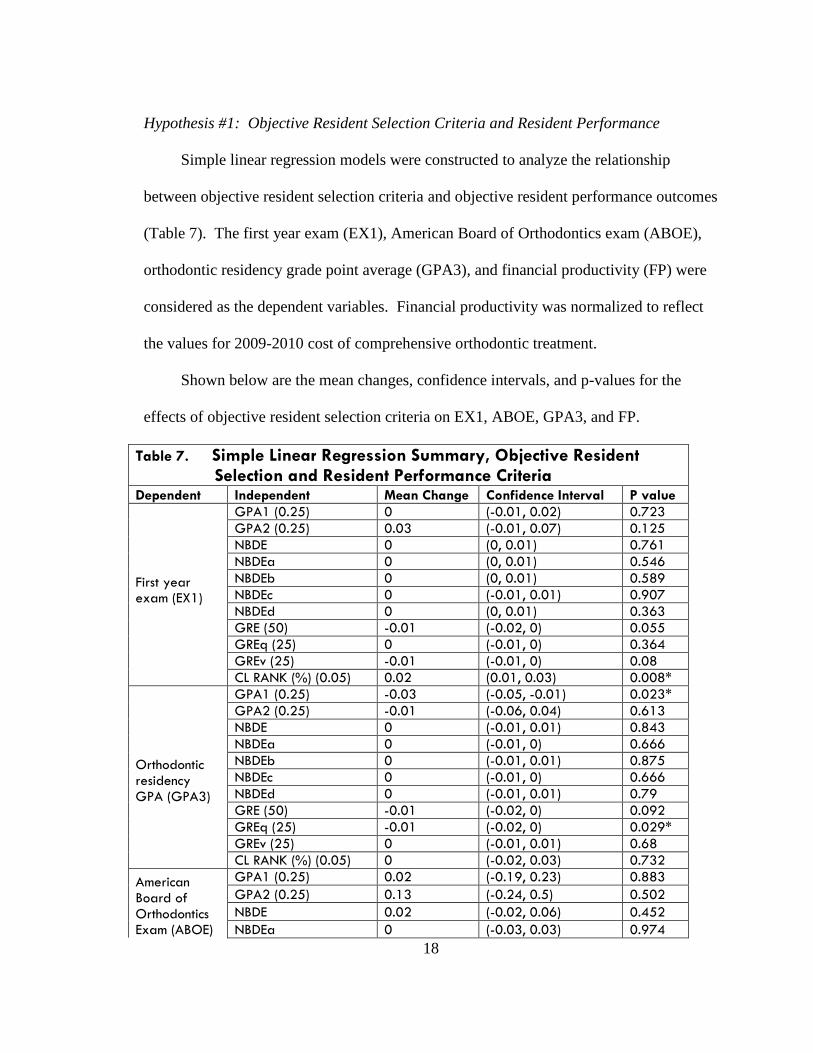
Hypothesis #1: Objective Resident Selection Criteria and Resident Performance
Simple linear regression models were constructed to analyze the relationship
between objective resident selection criteria and objective resident performance outcomes
(Table 7). The first year exam (EX1), American Board of Orthodontics exam (ABOE),
orthodontic residency grade point average (GPA3), and financial productivity (FP) were
considered as the dependent variables. Financial productivity was normalized to reflect
the values for 2009-2010 cost of comprehensive orthodontic treatment.
Shown below are the mean changes, confidence intervals, and p-values for the
effects of objective resident selection criteria on EX1, ABOE, GPA3, and FP.
Table 7. Simple Linear Regression Summary, Objective Resident Selection and Resident Performance Criteria Dependent Independent Mean Change Confidence Interval P value
First year exam (EX1)
GPA1 (0.25) 0 (-0.01, 0.02) 0.723
GPA2 (0.25) 0.03 (-0.01, 0.07) 0.125
NBDE 0 (0, 0.01) 0.761
NBDEa 0 (0, 0.01) 0.546
NBDEb 0 (0, 0.01) 0.589
NBDEc 0 (-0.01, 0.01) 0.907
NBDEd 0 (0, 0.01) 0.363
GRE (50) -0.01 (-0.02, 0) 0.055
GREq (25) 0 (-0.01, 0) 0.364
GREv (25) -0.01 (-0.01, 0) 0.08
CL RANK (%) (0.05) 0.02 (0.01, 0.03) 0.008*
Orthodontic residency GPA (GPA3)
GPA1 (0.25) -0.03 (-0.05, -0.01) 0.023*
GPA2 (0.25) -0.01 (-0.06, 0.04) 0.613
NBDE 0 (-0.01, 0.01) 0.843
NBDEa 0 (-0.01, 0) 0.666
NBDEb 0 (-0.01, 0.01) 0.875
NBDEc 0 (-0.01, 0) 0.666
NBDEd 0 (-0.01, 0.01) 0.79
GRE (50) -0.01 (-0.02, 0) 0.092
GREq (25) -0.01 (-0.02, 0) 0.029*
GREv (25) 0 (-0.01, 0.01) 0.68
CL RANK (%) (0.05) 0 (-0.02, 0.03) 0.732
American Board of Orthodontics Exam (ABOE)
GPA1 (0.25) 0.02 (-0.19, 0.23) 0.883
GPA2 (0.25) 0.13 (-0.24, 0.5) 0.502
NBDE 0.02 (-0.02, 0.06) 0.452
NBDEa 0 (-0.03, 0.03) 0.974
19
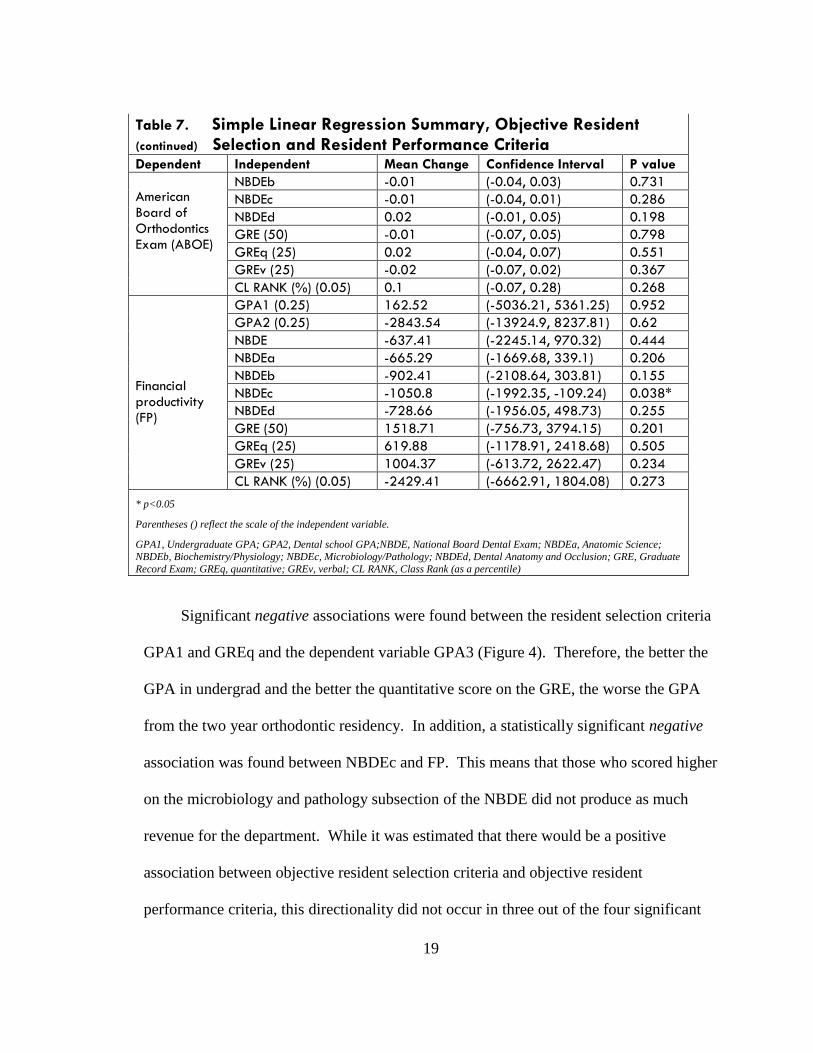
Table 7. Simple Linear Regression Summary, Objective Resident (continued) Selection and Resident Performance Criteria
Dependent Independent Mean Change Confidence Interval P value
American Board of Orthodontics Exam (ABOE)
NBDEb -0.01 (-0.04, 0.03) 0.731
NBDEc -0.01 (-0.04, 0.01) 0.286
NBDEd 0.02 (-0.01, 0.05) 0.198
GRE (50) -0.01 (-0.07, 0.05) 0.798
GREq (25) 0.02 (-0.04, 0.07) 0.551
GREv (25) -0.02 (-0.07, 0.02) 0.367
CL RANK (%) (0.05) 0.1 (-0.07, 0.28) 0.268
Financial productivity (FP)
GPA1 (0.25) 162.52 (-5036.21, 5361.25) 0.952
GPA2 (0.25) -2843.54 (-13924.9, 8237.81) 0.62
NBDE -637.41 (-2245.14, 970.32) 0.444
NBDEa -665.29 (-1669.68, 339.1) 0.206
NBDEb -902.41 (-2108.64, 303.81) 0.155
NBDEc -1050.8 (-1992.35, -109.24) 0.038*
NBDEd -728.66 (-1956.05, 498.73) 0.255
GRE (50) 1518.71 (-756.73, 3794.15) 0.201
GREq (25) 619.88 (-1178.91, 2418.68) 0.505
GREv (25) 1004.37 (-613.72, 2622.47) 0.234
CL RANK (%) (0.05) -2429.41 (-6662.91, 1804.08) 0.273
* p<0.05
Parentheses () reflect the scale of the independent variable.
GPA1, Undergraduate GPA; GPA2, Dental school GPA;NBDE, National Board Dental Exam; NBDEa, Anatomic Science;
NBDEb, Biochemistry/Physiology; NBDEc, Microbiology/Pathology; NBDEd, Dental Anatomy and Occlusion; GRE, Graduate
Record Exam; GREq, quantitative; GREv, verbal; CL RANK, Class Rank (as a percentile)
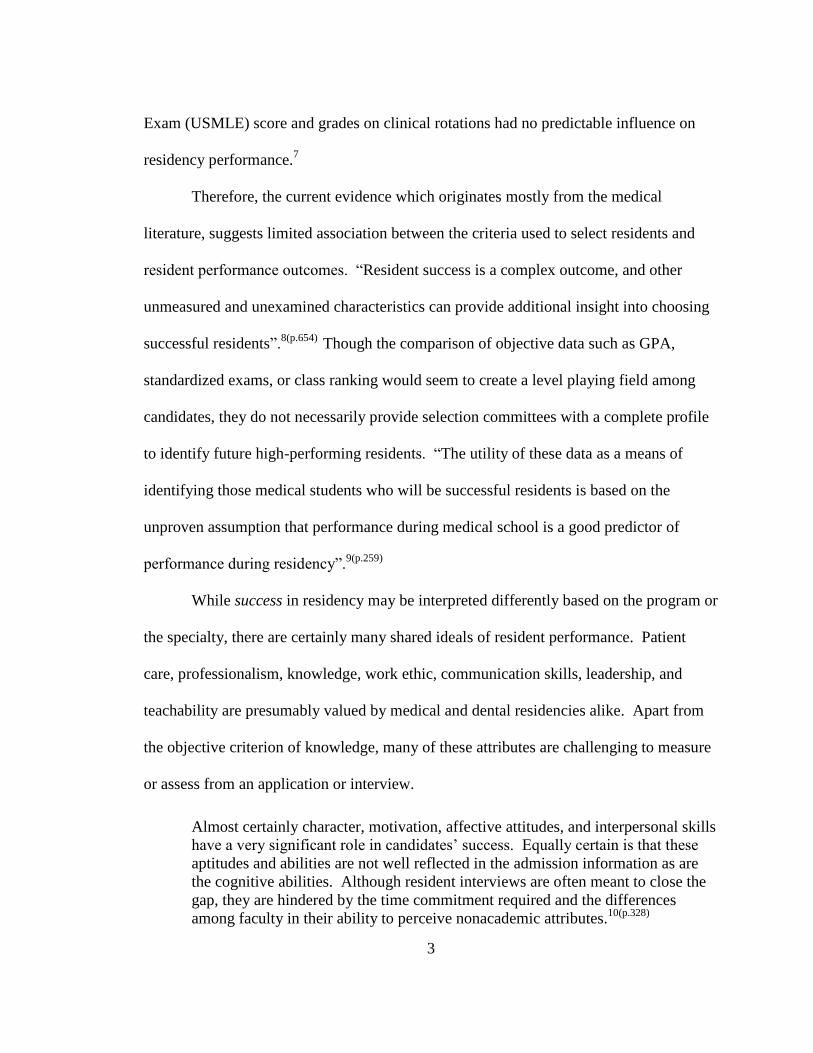
Significant negative associations were found between the resident selection criteria
GPA1 and GREq and the dependent variable GPA3 (Figure 4). Therefore, the better the
GPA in undergrad and the better the quantitative score on the GRE, the worse the GPA
from the two year orthodontic residency. In addition, a statistically significant negative
association was found between NBDEc and FP. This means that those who scored higher
on the microbiology and pathology subsection of the NBDE did not produce as much
revenue for the department. While it was estimated that there would be a positive
association between objective resident selection criteria and objective resident
performance criteria, this directionality did not occur in three out of the four significant
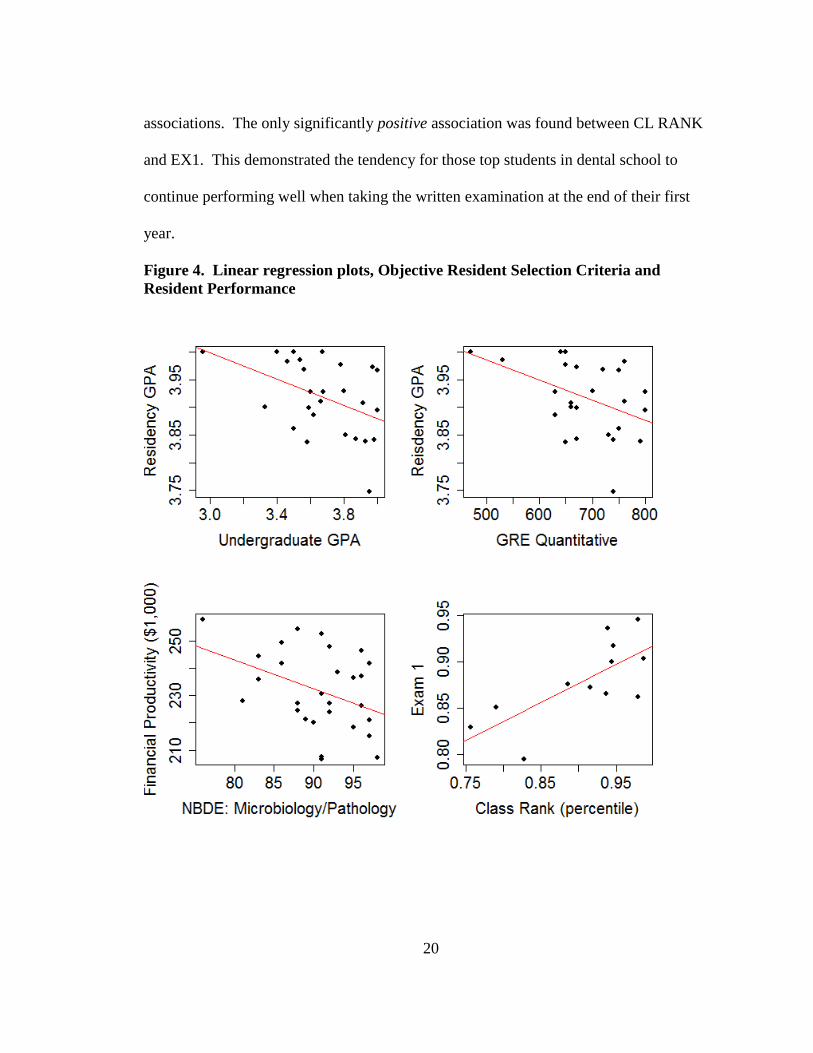
20
associations. The only significantly positive association was found between CL RANK
and EX1. This demonstrated the tendency for those top students in dental school to
continue performing well when taking the written examination at the end of their first
year.
Figure 4. Linear regression plots, Objective Resident Selection Criteria and
Resident Performance
21
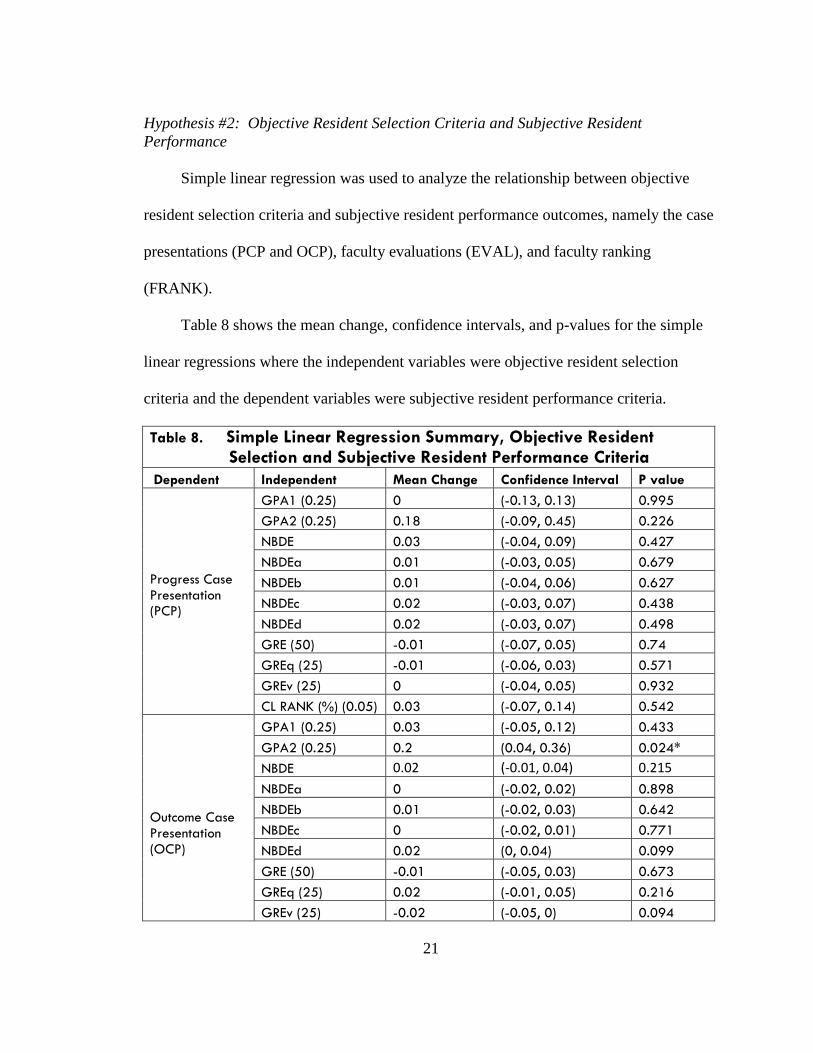
Hypothesis #2: Objective Resident Selection Criteria and Subjective Resident
Performance
Simple linear regression was used to analyze the relationship between objective
resident selection criteria and subjective resident performance outcomes, namely the case
presentations (PCP and OCP), faculty evaluations (EVAL), and faculty ranking
(FRANK).
Table 8 shows the mean change, confidence intervals, and p-values for the simple
linear regressions where the independent variables were objective resident selection
criteria and the dependent variables were subjective resident performance criteria.
Table 8. Simple Linear Regression Summary, Objective Resident Selection and Subjective Resident Performance Criteria
Dependent Independent Mean Change Confidence Interval P value
Progress Case Presentation (PCP)
GPA1 (0.25) 0 (-0.13, 0.13) 0.995
GPA2 (0.25) 0.18 (-0.09, 0.45) 0.226
NBDE 0.03 (-0.04, 0.09) 0.427
NBDEa 0.01 (-0.03, 0.05) 0.679
NBDEb 0.01 (-0.04, 0.06) 0.627
NBDEc 0.02 (-0.03, 0.07) 0.438
NBDEd 0.02 (-0.03, 0.07) 0.498
GRE (50) -0.01 (-0.07, 0.05) 0.74
GREq (25) -0.01 (-0.06, 0.03) 0.571
GREv (25) 0 (-0.04, 0.05) 0.932
CL RANK (%) (0.05) 0.03 (-0.07, 0.14) 0.542
Outcome Case Presentation (OCP)
GPA1 (0.25) 0.03 (-0.05, 0.12) 0.433
GPA2 (0.25) 0.2 (0.04, 0.36) 0.024*
NBDE 0.02 (-0.01, 0.04) 0.215
NBDEa 0 (-0.02, 0.02) 0.898
NBDEb 0.01 (-0.02, 0.03) 0.642
NBDEc 0 (-0.02, 0.01) 0.771
NBDEd 0.02 (0, 0.04) 0.099
GRE (50) -0.01 (-0.05, 0.03) 0.673
GREq (25) 0.02 (-0.01, 0.05) 0.216
GREv (25) -0.02 (-0.05, 0) 0.094
22
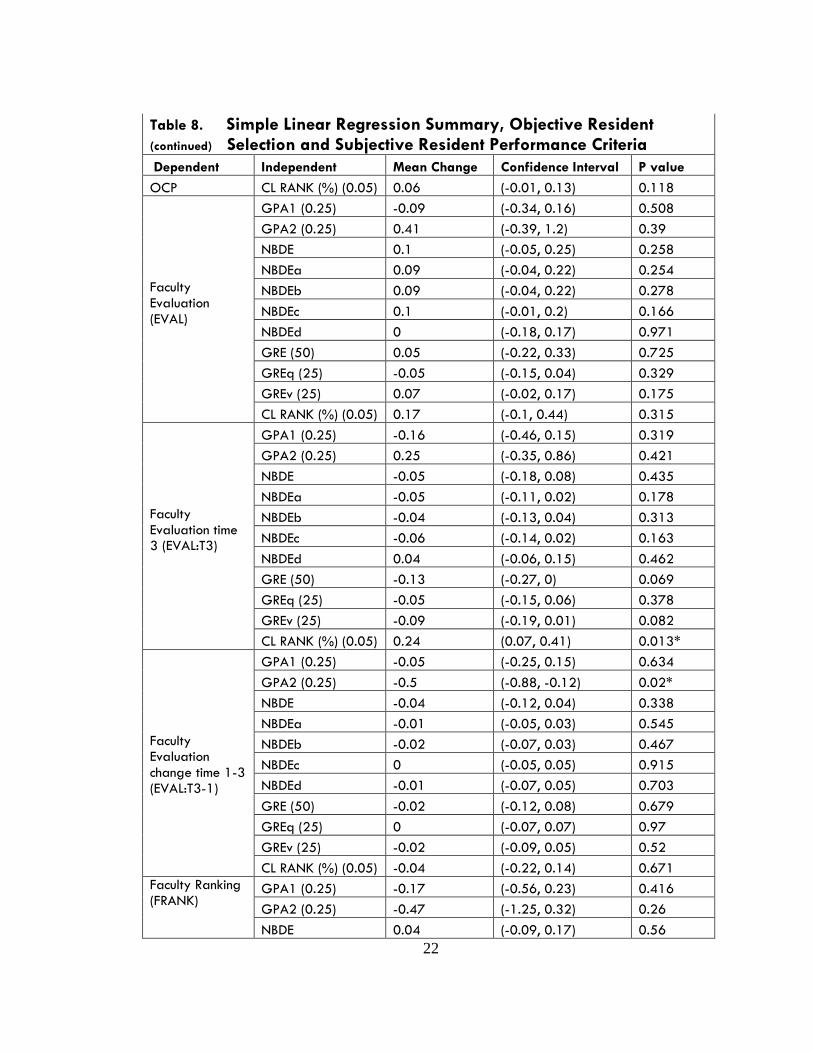
Table 8. Simple Linear Regression Summary, Objective Resident (continued) Selection and Subjective Resident Performance Criteria
Dependent Independent Mean Change Confidence Interval P value
OCP CL RANK (%) (0.05) 0.06 (-0.01, 0.13) 0.118
Faculty Evaluation (EVAL)
GPA1 (0.25) -0.09 (-0.34, 0.16) 0.508
GPA2 (0.25) 0.41 (-0.39, 1.2) 0.39
NBDE 0.1 (-0.05, 0.25) 0.258
NBDEa 0.09 (-0.04, 0.22) 0.254
NBDEb 0.09 (-0.04, 0.22) 0.278
NBDEc 0.1 (-0.01, 0.2) 0.166
NBDEd 0 (-0.18, 0.17) 0.971
GRE (50) 0.05 (-0.22, 0.33) 0.725
GREq (25) -0.05 (-0.15, 0.04) 0.329
GREv (25) 0.07 (-0.02, 0.17) 0.175
CL RANK (%) (0.05) 0.17 (-0.1, 0.44) 0.315
Faculty Evaluation time 3 (EVAL:T3)
GPA1 (0.25) -0.16 (-0.46, 0.15) 0.319
GPA2 (0.25) 0.25 (-0.35, 0.86) 0.421
NBDE -0.05 (-0.18, 0.08) 0.435
NBDEa -0.05 (-0.11, 0.02) 0.178
NBDEb -0.04 (-0.13, 0.04) 0.313
NBDEc -0.06 (-0.14, 0.02) 0.163
NBDEd 0.04 (-0.06, 0.15) 0.462
GRE (50) -0.13 (-0.27, 0) 0.069
GREq (25) -0.05 (-0.15, 0.06) 0.378
GREv (25) -0.09 (-0.19, 0.01) 0.082
CL RANK (%) (0.05) 0.24 (0.07, 0.41) 0.013*
Faculty Evaluation change time 1-3 (EVAL:T3-1)
GPA1 (0.25) -0.05 (-0.25, 0.15) 0.634
GPA2 (0.25) -0.5 (-0.88, -0.12) 0.02*
NBDE -0.04 (-0.12, 0.04) 0.338
NBDEa -0.01 (-0.05, 0.03) 0.545
NBDEb -0.02 (-0.07, 0.03) 0.467
NBDEc 0 (-0.05, 0.05) 0.915
NBDEd -0.01 (-0.07, 0.05) 0.703
GRE (50) -0.02 (-0.12, 0.08) 0.679
GREq (25) 0 (-0.07, 0.07) 0.97
GREv (25) -0.02 (-0.09, 0.05) 0.52
CL RANK (%) (0.05) -0.04 (-0.22, 0.14) 0.671
Faculty Ranking (FRANK)
GPA1 (0.25) -0.17 (-0.56, 0.23) 0.416
GPA2 (0.25) -0.47 (-1.25, 0.32) 0.26
NBDE 0.04 (-0.09, 0.17) 0.56
23
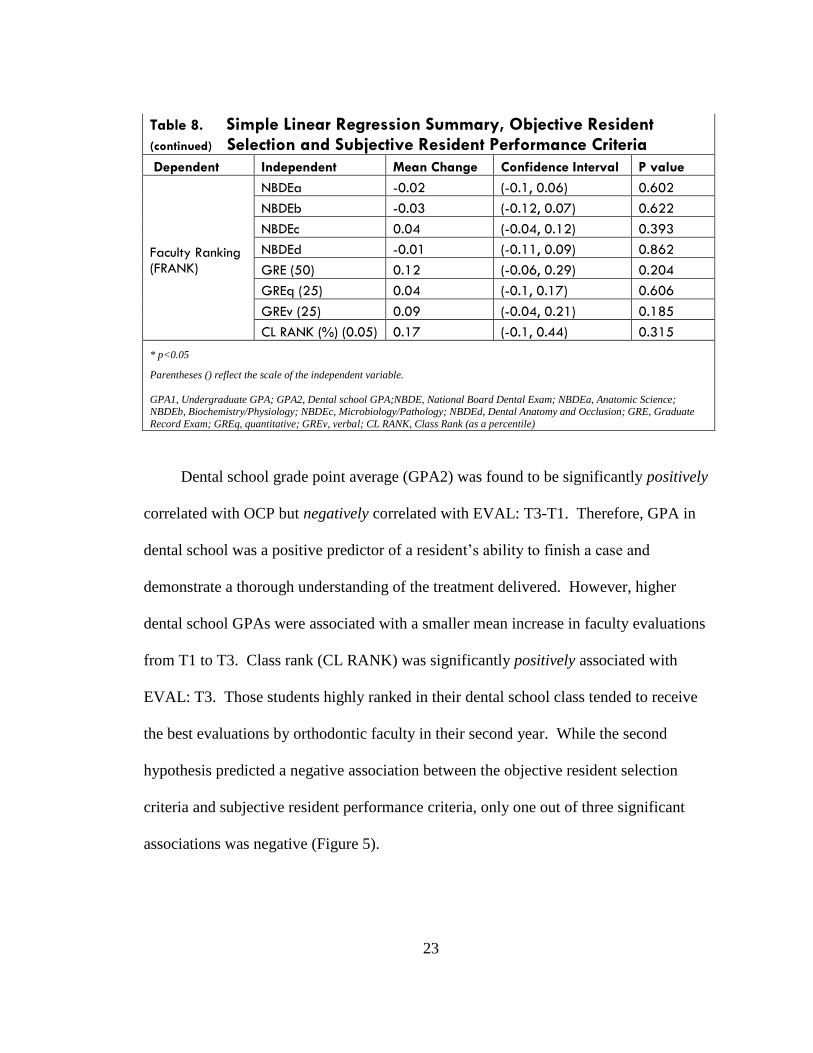
Table 8. Simple Linear Regression Summary, Objective Resident (continued) Selection and Subjective Resident Performance Criteria
Dependent Independent Mean Change Confidence Interval P value
Faculty Ranking (FRANK)
NBDEa -0.02 (-0.1, 0.06) 0.602
NBDEb -0.03 (-0.12, 0.07) 0.622
NBDEc 0.04 (-0.04, 0.12) 0.393
NBDEd -0.01 (-0.11, 0.09) 0.862
GRE (50) 0.12 (-0.06, 0.29) 0.204
GREq (25) 0.04 (-0.1, 0.17) 0.606
GREv (25) 0.09 (-0.04, 0.21) 0.185
CL RANK (%) (0.05) 0.17 (-0.1, 0.44) 0.315
* p<0.05
Parentheses () reflect the scale of the independent variable.
GPA1, Undergraduate GPA; GPA2, Dental school GPA;NBDE, National Board Dental Exam; NBDEa, Anatomic Science; NBDEb, Biochemistry/Physiology; NBDEc, Microbiology/Pathology; NBDEd, Dental Anatomy and Occlusion; GRE, Graduate
Record Exam; GREq, quantitative; GREv, verbal; CL RANK, Class Rank (as a percentile)
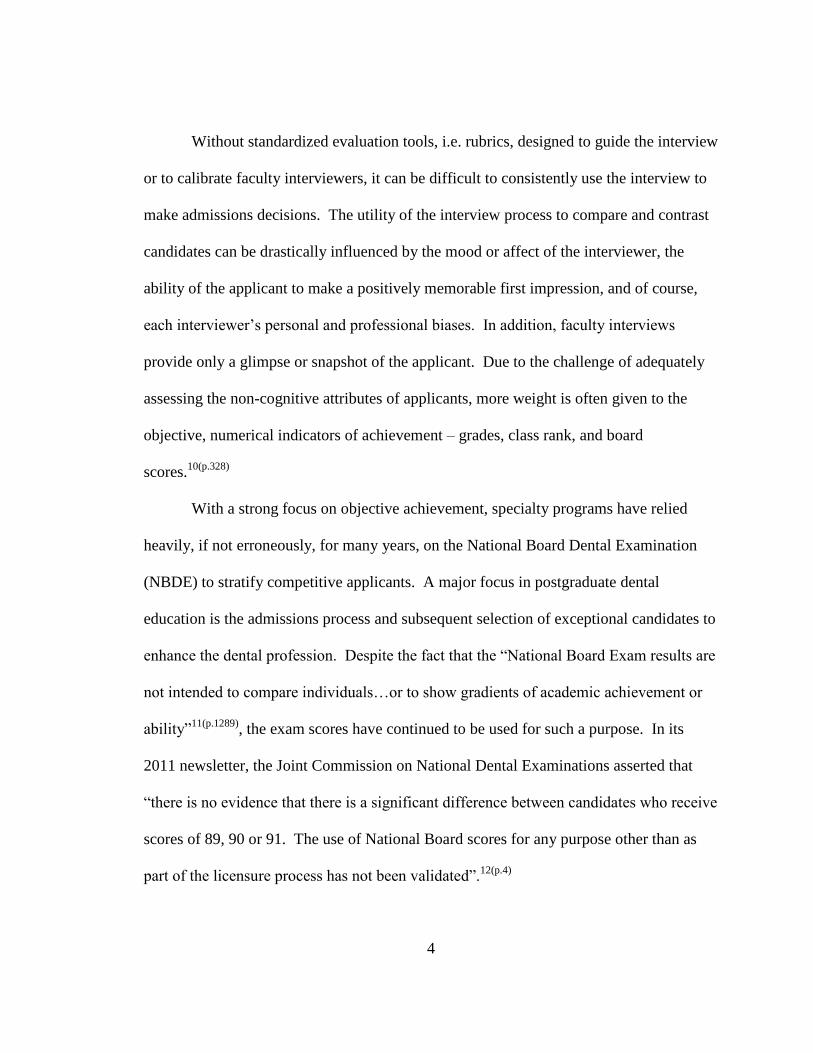
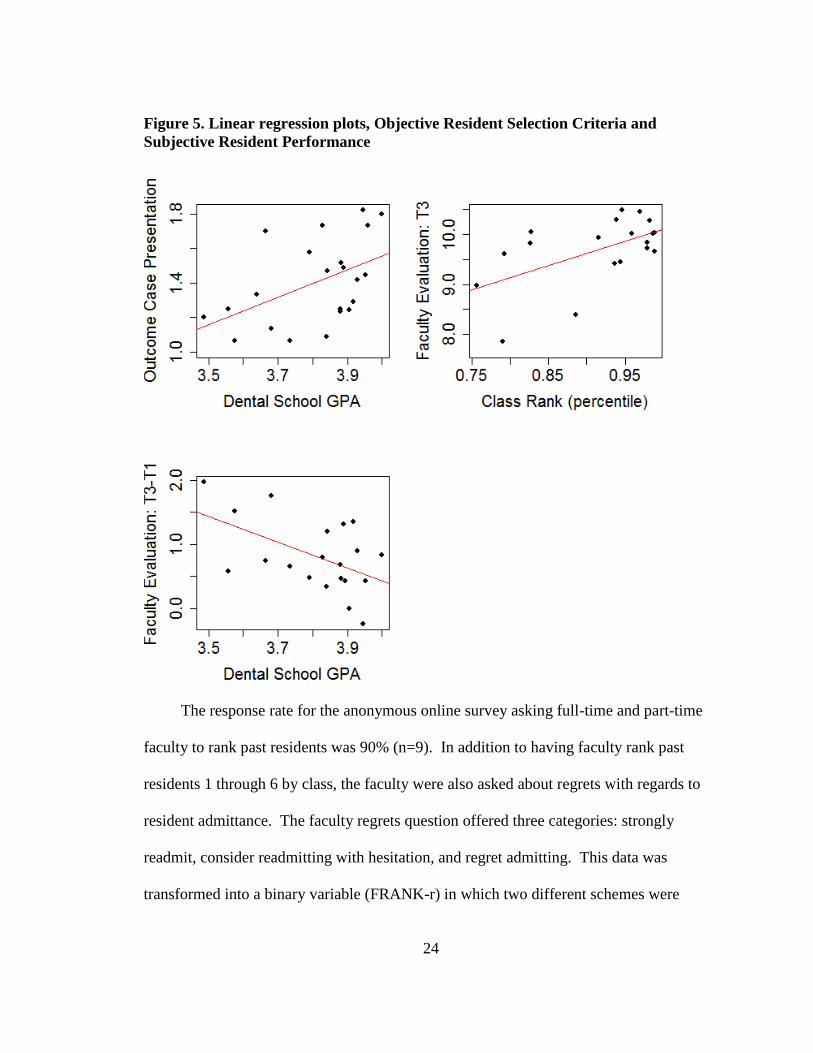
Dental school grade point average (GPA2) was found to be significantly positively
correlated with OCP but negatively correlated with EVAL: T3-T1. Therefore, GPA in
dental school was a positive predictor of a resident’s ability to finish a case and
demonstrate a thorough understanding of the treatment delivered. However, higher
dental school GPAs were associated with a smaller mean increase in faculty evaluations
from T1 to T3. Class rank (CL RANK) was significantly positively associated with
EVAL: T3. Those students highly ranked in their dental school class tended to receive
the best evaluations by orthodontic faculty in their second year. While the second
hypothesis predicted a negative association between the objective resident selection
criteria and subjective resident performance criteria, only one out of three significant
associations was negative (Figure 5).
24
Figure 5. Linear regression plots, Objective Resident Selection Criteria and
Subjective Resident Performance
The response rate for the anonymous online survey asking full-time and part-time
faculty to rank past residents was 90% (n=9). In addition to having faculty rank past
residents 1 through 6 by class, the faculty were also asked about regrets with regards to
resident admittance. The faculty regrets question offered three categories: strongly
readmit, consider readmitting with hesitation, and regret admitting. This data was
transformed into a binary variable (FRANK-r) in which two different schemes were
25
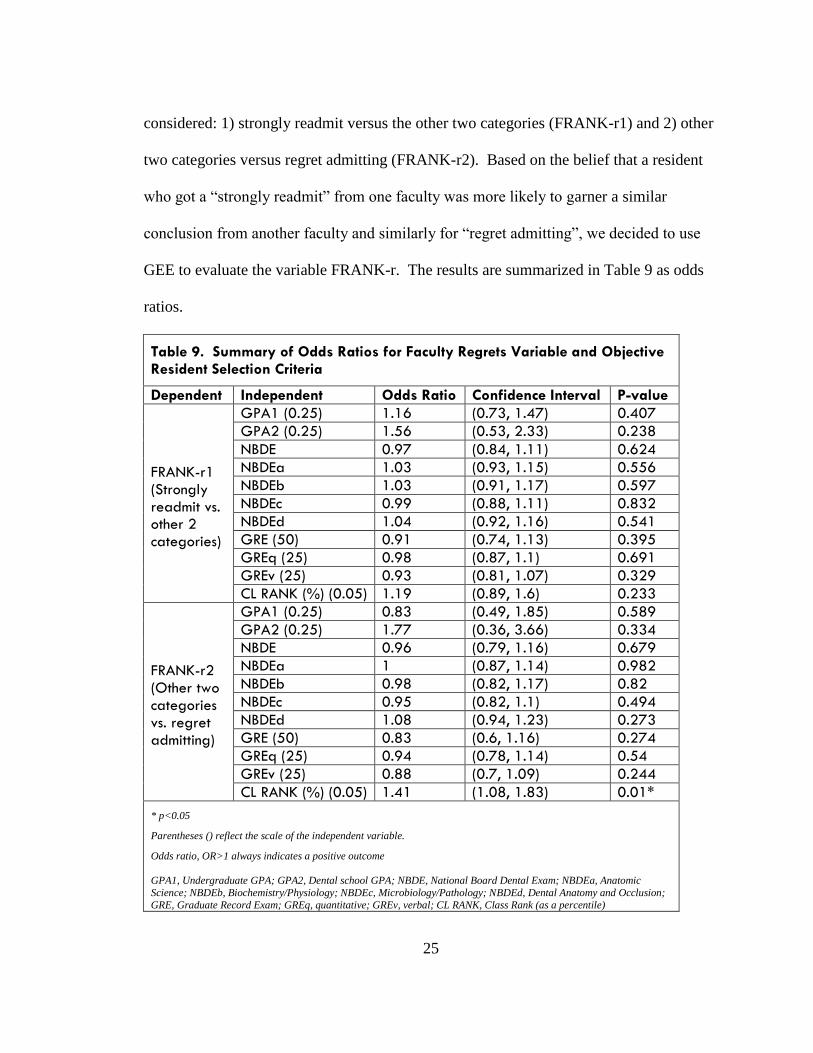
considered: 1) strongly readmit versus the other two categories (FRANK-r1) and 2) other
two categories versus regret admitting (FRANK-r2). Based on the belief that a resident
who got a “strongly readmit” from one faculty was more likely to garner a similar
conclusion from another faculty and similarly for “regret admitting”, we decided to use
GEE to evaluate the variable FRANK-r. The results are summarized in Table 9 as odds
ratios.
Table 9. Summary of Odds Ratios for Faculty Regrets Variable and Objective Resident Selection Criteria
Dependent Independent Odds Ratio Confidence Interval P-value
FRANK-r1 (Strongly readmit vs. other 2 categories)
GPA1 (0.25) 1.16 (0.73, 1.47) 0.407
GPA2 (0.25) 1.56 (0.53, 2.33) 0.238
NBDE 0.97 (0.84, 1.11) 0.624
NBDEa 1.03 (0.93, 1.15) 0.556
NBDEb 1.03 (0.91, 1.17) 0.597
NBDEc 0.99 (0.88, 1.11) 0.832
NBDEd 1.04 (0.92, 1.16) 0.541
GRE (50) 0.91 (0.74, 1.13) 0.395
GREq (25) 0.98 (0.87, 1.1) 0.691
GREv (25) 0.93 (0.81, 1.07) 0.329
CL RANK (%) (0.05) 1.19 (0.89, 1.6) 0.233
FRANK-r2 (Other two categories vs. regret admitting)
GPA1 (0.25) 0.83 (0.49, 1.85) 0.589
GPA2 (0.25) 1.77 (0.36, 3.66) 0.334
NBDE 0.96 (0.79, 1.16) 0.679
NBDEa 1 (0.87, 1.14) 0.982
NBDEb 0.98 (0.82, 1.17) 0.82
NBDEc 0.95 (0.82, 1.1) 0.494
NBDEd 1.08 (0.94, 1.23) 0.273
GRE (50) 0.83 (0.6, 1.16) 0.274
GREq (25) 0.94 (0.78, 1.14) 0.54
GREv (25) 0.88 (0.7, 1.09) 0.244
CL RANK (%) (0.05) 1.41 (1.08, 1.83) 0.01*
* p<0.05
Parentheses () reflect the scale of the independent variable.
Odds ratio, OR>1 always indicates a positive outcome
GPA1, Undergraduate GPA; GPA2, Dental school GPA; NBDE, National Board Dental Exam; NBDEa, Anatomic
Science; NBDEb, Biochemistry/Physiology; NBDEc, Microbiology/Pathology; NBDEd, Dental Anatomy and Occlusion;
GRE, Graduate Record Exam; GREq, quantitative; GREv, verbal; CL RANK, Class Rank (as a percentile)
26
As can be seen in Table 9, a significant association was found between CL RANK
and FRANK-r2 suggesting that a higher class percentile is associated with higher odds of
getting “readmit or consider readmitting with hesitation” from faculty.
Hypothesis #3: Subjective Resident Selection Criteria and Objective Resident
Performance
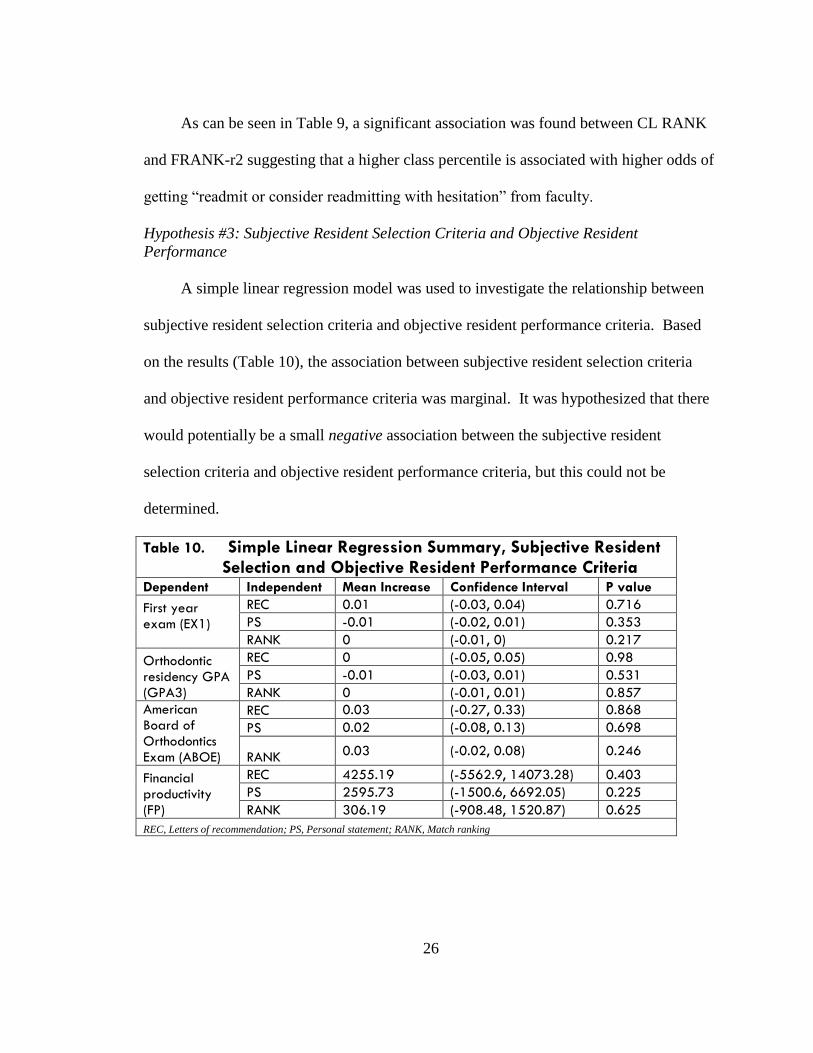
A simple linear regression model was used to investigate the relationship between
subjective resident selection criteria and objective resident performance criteria. Based
on the results (Table 10), the association between subjective resident selection criteria
and objective resident performance criteria was marginal. It was hypothesized that there
would potentially be a small negative association between the subjective resident
selection criteria and objective resident performance criteria, but this could not be
determined.
Table 10. Simple Linear Regression Summary, Subjective Resident Selection and Objective Resident Performance Criteria
Dependent Independent Mean Increase Confidence Interval P value
First year exam (EX1)
REC 0.01 (-0.03, 0.04) 0.716
PS -0.01 (-0.02, 0.01) 0.353
RANK 0 (-0.01, 0) 0.217
Orthodontic residency GPA (GPA3)
REC 0 (-0.05, 0.05) 0.98
PS -0.01 (-0.03, 0.01) 0.531
RANK 0 (-0.01, 0.01) 0.857
American Board of Orthodontics Exam (ABOE)
REC 0.03 (-0.27, 0.33) 0.868
PS 0.02 (-0.08, 0.13) 0.698
RANK 0.03 (-0.02, 0.08) 0.246
Financial productivity (FP)
REC 4255.19 (-5562.9, 14073.28) 0.403
PS 2595.73 (-1500.6, 6692.05) 0.225
RANK 306.19 (-908.48, 1520.87) 0.625
REC, Letters of recommendation; PS, Personal statement; RANK, Match ranking
27
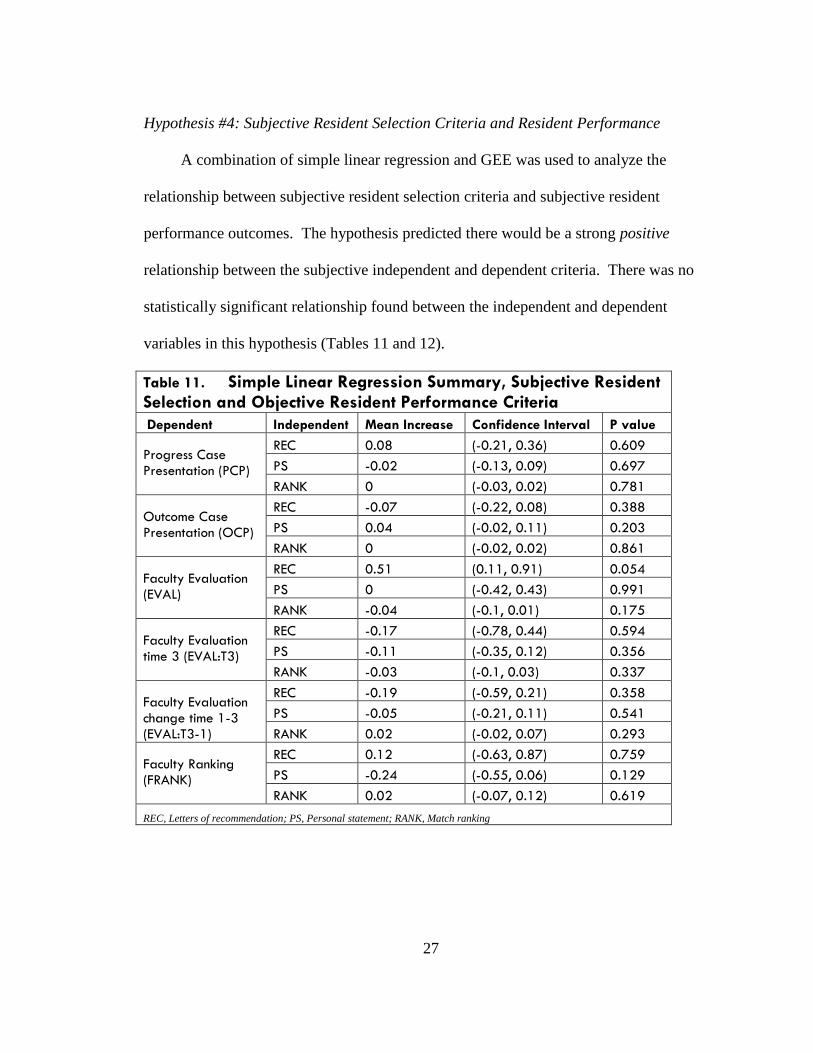
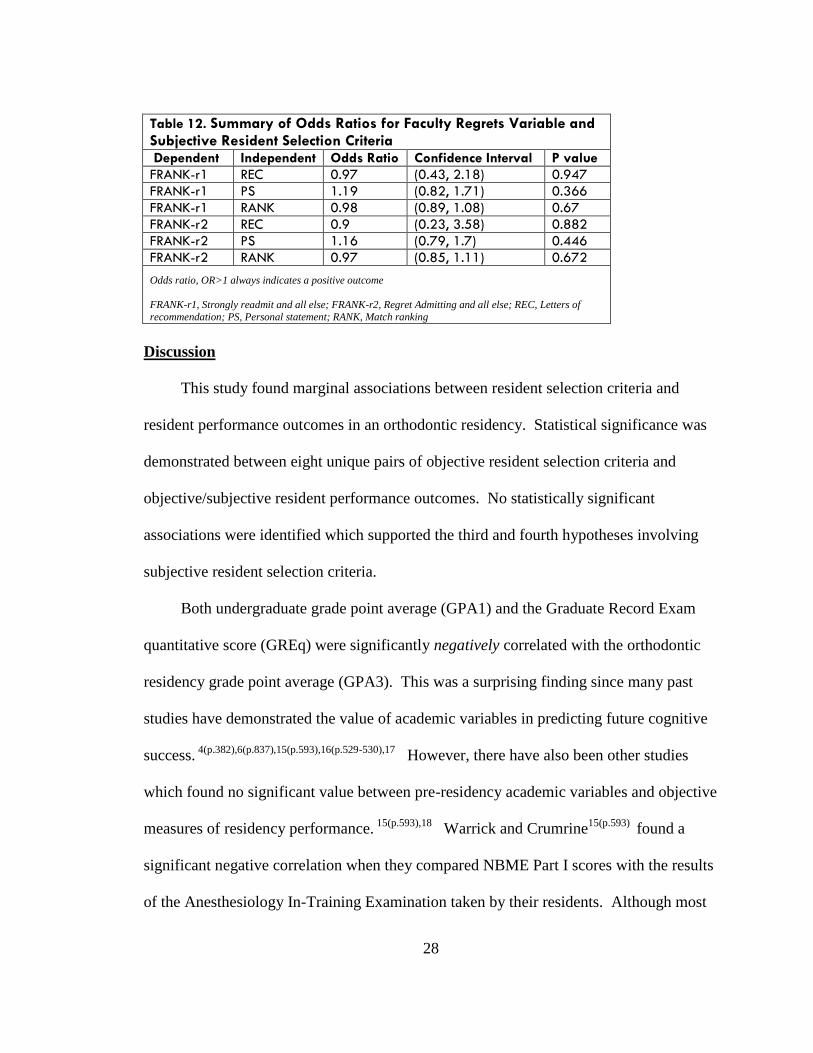
Hypothesis #4: Subjective Resident Selection Criteria and Resident Performance
A combination of simple linear regression and GEE was used to analyze the
relationship between subjective resident selection criteria and subjective resident
performance outcomes. The hypothesis predicted there would be a strong positive
relationship between the subjective independent and dependent criteria. There was no
statistically significant relationship found between the independent and dependent
variables in this hypothesis (Tables 11 and 12).
Table 11. Simple Linear Regression Summary, Subjective Resident Selection and Objective Resident Performance Criteria
Dependent Independent Mean Increase Confidence Interval P value
Progress Case Presentation (PCP)
REC 0.08 (-0.21, 0.36) 0.609
PS -0.02 (-0.13, 0.09) 0.697
RANK 0 (-0.03, 0.02) 0.781
Outcome Case Presentation (OCP)
REC -0.07 (-0.22, 0.08) 0.388
PS 0.04 (-0.02, 0.11) 0.203
RANK 0 (-0.02, 0.02) 0.861
Faculty Evaluation (EVAL)
REC 0.51 (0.11, 0.91) 0.054
PS 0 (-0.42, 0.43) 0.991
RANK -0.04 (-0.1, 0.01) 0.175
Faculty Evaluation time 3 (EVAL:T3)
REC -0.17 (-0.78, 0.44) 0.594
PS -0.11 (-0.35, 0.12) 0.356
RANK -0.03 (-0.1, 0.03) 0.337
Faculty Evaluation change time 1-3 (EVAL:T3-1)
REC -0.19 (-0.59, 0.21) 0.358
PS -0.05 (-0.21, 0.11) 0.541
RANK 0.02 (-0.02, 0.07) 0.293
Faculty Ranking (FRANK)
REC 0.12 (-0.63, 0.87) 0.759
PS -0.24 (-0.55, 0.06) 0.129
RANK 0.02 (-0.07, 0.12) 0.619
REC, Letters of recommendation; PS, Personal statement; RANK, Match ranking
28
Table 12. Summary of Odds Ratios for Faculty Regrets Variable and Subjective Resident Selection Criteria
Dependent Independent Odds Ratio Confidence Interval P value
FRANK-r1 REC 0.97 (0.43, 2.18) 0.947
FRANK-r1 PS 1.19 (0.82, 1.71) 0.366
FRANK-r1 RANK 0.98 (0.89, 1.08) 0.67
FRANK-r2 REC 0.9 (0.23, 3.58) 0.882
FRANK-r2 PS 1.16 (0.79, 1.7) 0.446
FRANK-r2 RANK 0.97 (0.85, 1.11) 0.672
Odds ratio, OR>1 always indicates a positive outcome
FRANK-r1, Strongly readmit and all else; FRANK-r2, Regret Admitting and all else; REC, Letters of
recommendation; PS, Personal statement; RANK, Match ranking
Discussion
This study found marginal associations between resident selection criteria and
resident performance outcomes in an orthodontic residency. Statistical significance was
demonstrated between eight unique pairs of objective resident selection criteria and
objective/subjective resident performance outcomes. No statistically significant
associations were identified which supported the third and fourth hypotheses involving
subjective resident selection criteria.
Both undergraduate grade point average (GPA1) and the Graduate Record Exam
quantitative score (GREq) were significantly negatively correlated with the orthodontic
residency grade point average (GPA3). This was a surprising finding since many past
studies have demonstrated the value of academic variables in predicting future cognitive
success. 4(p.382),6(p.837),15(p.593),16(p.529-530),17
However, there have also been other studies
which found no significant value between pre-residency academic variables and objective
measures of residency performance. 15(p.593),18
Warrick and Crumrine15(p.593)
found a
significant negative correlation when they compared NBME Part I scores with the results
of the Anesthesiology In-Training Examination taken by their residents. Although most
29
objective resident selection criteria were not positively associated with objective resident
performance outcomes in this study, the findings could be understood in light of the fact
that high achieving students have reached the peak of their education. Perhaps the
incentive for maintaining the highest grades does not exist simply because there is no
additional educational program which would require the residency GPA for admission.
Finally, statistical significance is harder to reach with a small sample size which could
have also been an explanation for unexpected results.
The microbiology/pathology subsection of the National Board Dental Exam
(NBDEc) was also significantly negatively correlated with financial productivity (FP).
According to Wood et al, “NBME scores…were intended to measure performance on
content taught in medical school; they were never intended to be used to assess
preparation for residency”.19(p.858)
To the author’s knowledge, this is the only study of its
kind to employ the variable financial productivity. While it could be argued that the
dollar-amount generated by each resident is dependent on patient distribution and
subsequent differing costs of treatment, the use of this variable assumes that cases and
costs will be balanced across residents. Financial productivity, therefore, can be
interpreted in this study as representing both clinical efficiency and effective time and
patient management.
The only positive association to support the first hypothesis was the association
between class rank (CL RANK) and the first year exam (EX1). Class rank in dental
school was also significantly positively correlated with faculty evaluation in the second
year (EVAL:T3). Although class rank was not significantly associated with subjective
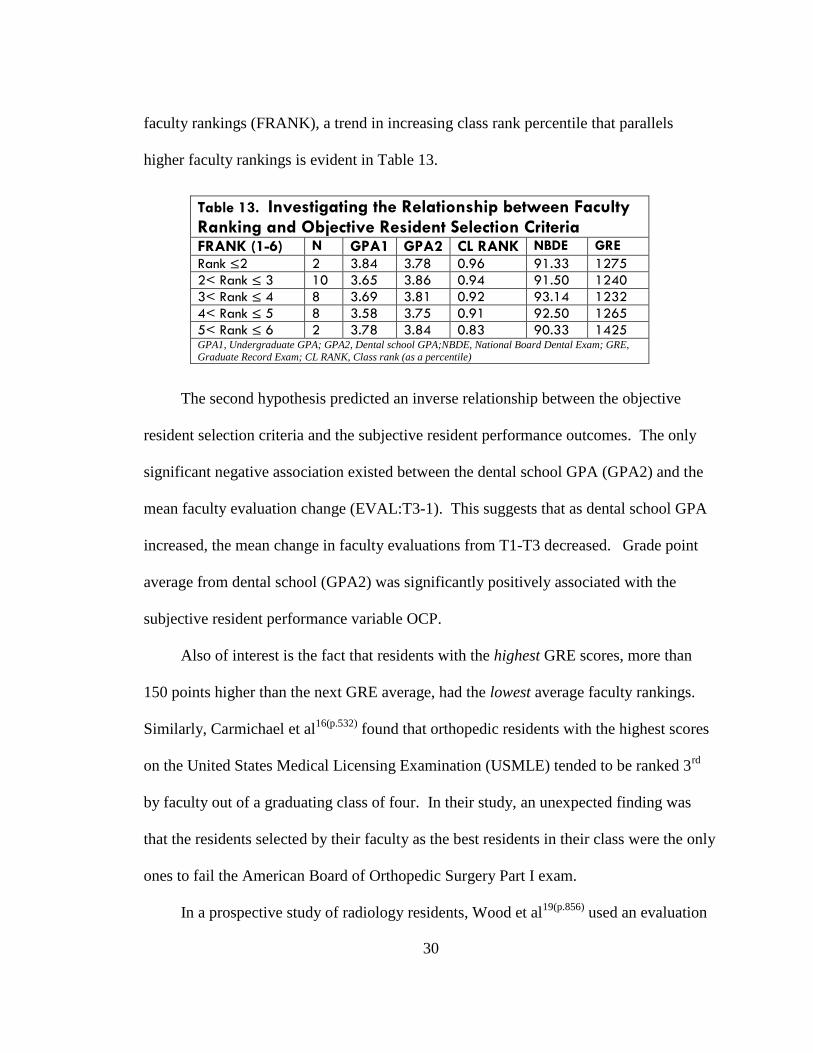
30
faculty rankings (FRANK), a trend in increasing class rank percentile that parallels
higher faculty rankings is evident in Table 13.
The second hypothesis predicted an inverse relationship between the objective
resident selection criteria and the subjective resident performance outcomes. The only
significant negative association existed between the dental school GPA (GPA2) and the
mean faculty evaluation change (EVAL:T3-1). This suggests that as dental school GPA
increased, the mean change in faculty evaluations from T1-T3 decreased. Grade point
average from dental school (GPA2) was significantly positively associated with the
subjective resident performance variable OCP.
Also of interest is the fact that residents with the highest GRE scores, more than
150 points higher than the next GRE average, had the lowest average faculty rankings.
Similarly, Carmichael et al16(p.532)
found that orthopedic residents with the highest scores
on the United States Medical Licensing Examination (USMLE) tended to be ranked 3rd
by faculty out of a graduating class of four. In their study, an unexpected finding was
that the residents selected by their faculty as the best residents in their class were the only
ones to fail the American Board of Orthopedic Surgery Part I exam.
In a prospective study of radiology residents, Wood et al19(p.856)
used an evaluation
Table 13. Investigating the Relationship between Faculty Ranking and Objective Resident Selection Criteria
FRANK (1-6) N GPA1 GPA2 CL RANK NBDE GRE
Rank ≤2 2 3.84 3.78 0.96 91.33 1275
2< Rank ≤ 3 10 3.65 3.86 0.94 91.50 1240
3< Rank ≤ 4 8 3.69 3.81 0.92 93.14 1232
4< Rank ≤ 5 8 3.58 3.75 0.91 92.50 1265
5< Rank ≤ 6 2 3.78 3.84 0.83 90.33 1425 GPA1, Undergraduate GPA; GPA2, Dental school GPA;NBDE, National Board Dental Exam; GRE,
Graduate Record Exam; CL RANK, Class rank (as a percentile)
31
form called a Behavioral Observation Scale (BOS) to assess behaviors considered by
radiologists to be vital in residency for competent performance. The results showed
negative correlations between the NBME and interpersonal skills and confidence
measured by the BOS. Conversely, Dirschl et al20
found no difference in faculty ratings
of resident performance based on academic score. In their study, academic score was
comprised of medical school grades, USMLE score, membership in the honor society
Alpha Omega Alpha, number of publications and research projects, in addition to medical
school notoriety.
The third hypothesis which predicted a negative relationship between subjective
resident selection criteria and objective resident performance criteria was not supported
by the data. Similarly, the fourth hypothesis was not supported by statistical evidence
linking subjective resident selection criteria with subjective outcomes of resident
performance.
Brothers et al4(p.382)
found a significant positive relationship between reference letter
evaluation scores and clinical performance of surgical residents. An original rubric was
designed to rate reference letters in multiple categories such as technical skill of the
applicant, quality of the medical school, work ethic, and honesty, among others. At the
completion of each clinical rotation, residents were evaluated on core competencies by
surgical faculty. Their study also found a positive correlation between the final rank list,
similar to the RANK variable in our study, and clinical performance in residency.
Furthermore, a study of residents in an obstetrics and gynecology program found a
positive correlation between the National Resident Matching Program rank list percentile
32
and first year clinical performance evaluation score.21
This study did not find any significant associations involving the subjective resident
selection criteria, a finding that is likely attributable to a small sample size and low
intrarater reliability. Rather than conclude that letters of recommendation and personal
statements are not important in resident selection, I would rather stress that a more robust
study is needed to fully understand the impact of these variables on the selection and
ultimate performance of orthodontic residents. Perhaps other programs have instituted
rubrics to evaluate the subjective components of the residency application and interview.
If the validity of these instruments could be tested and made available, then the process of
postgraduate dental resident selection could be improved. With the elimination of the
NBDE numerical score and prevalence of pass-fail dental curriculums, there is an even
greater need to explore the significance of the subjective components of a candidate’s
application.
As of December 2012, twelve-percent of dental schools maintain a pass-fail
curriculum where it has been suggested that the benefits of learning in a pass-fail
environment outweigh the costs. Robbins et al22
found that the absence of grades or class
rank fosters collaboration and reduces unnecessary competition. A study by Rohe et al23
showed that students in a pass-fail environment had less perceived stress and
demonstrated increased group cohesion. Learning is perpetuated by one’s intellectual
drive and curiosity rather than being influenced by the external motivation of higher
grades.24
But for those students planning to pursue advanced training in a dental
specialty, grades, class standing, and the NBDE are essential for admissions.
33
A survey of postgraduate orthodontic program directors found that the top five
factors of importance included integrity, interpersonal communication skills, maturity,
critical thinking skills, and assuming responsibility.25
Apart from the interview, there has
not been another way to assess these traits in the admission process until recently. In
2009, the Educational Testing Service (ETS), which administers a host of standardized
exams such as the GRE, created a new tool called the personal potential index (PPI).26
The American Dental Education Association implemented the PPI in 2013 into its
postgraduate dental application. Now with this standardized tool that assesses personal
attributes of applicants, there is another avenue for measuring an applicant’s noncognitive
abilities. The PPI has recommenders comment on six core areas including knowledge
and creativity, resilience, communication skills, planning and organization, teamwork,
and ethics and integrity. The ETS purports that the PPI can be used to make objective
comparisons among candidates and predict their potential for success.27
In the future, it
would be very interesting to evaluate the predictive nature of the PPI in identifying
successful residents in orthodontics.
Limitations
Significant limitations of the study included a small sample size and a considerable
amount of missing data. A small sample size could explain the statistical outcomes found
in this study; in addition, the observational nature of the study was a major limitation. In
addition, the sample could be described as a high-achieving homogenous sample. To
have a greater possibility of achieving significance and increasing our confidence in the
results, a larger sample size would be needed. Although a multi-program study would
34
increase the sample size, it would be very difficult to standardize since objective
assessments and performance outcomes differ widely across residency programs. In
addition, a program that has remained consistent with respect to leadership and program
assessments would also be necessary to limit missing data. Some variables in our study
had 40-50% missing data (i.e. EX1, ABOE, and PCP).
Since this was an observational, retrospective study with a small sample size, we
were unable to adequately control for potential confounding effects. For faculty
evaluations (EVAL) for example, we implicitly assumed that faculty members were
similar between the years despite faculty turnover. Therefore, the faculty evaluation
analysis was subject to potential, untestable bias. In addition, the faculty did not receive
formal training to evaluate residents and clearly brought different biases and judgments to
these evaluations. A handout of general guidelines describing the evaluation categories,
however, was provided each faculty member at the time of evaluation (Appendix F).
Using multiple linear regression models could help control for potential
confounders at the analysis stage. Admission to residency programs is holistic, and there
are students who offset their deficiencies in one criterion (i.e. dental school GPA, letters
of recommendation, etc.) by having good records on other criteria (i.e. NBDE scores,
personal statement). Thus, one possible way to examine the effect of one admission
criterion on residency performance would be to control for confounders using multiple
linear regression models. This method was not used in this study due to the spread of
missing data and low sample size.
With regards to the faculty rankings (FRANK), attempts were made to limit recall
35
bias by providing photos alongside resident names. No specific guidelines with respect
to the basis for the ranking were provided. Instead, it was expected that faculty would
have their own subjective criteria when ranking each resident. It was impossible,
however, to control for experiences the faculty may have had with residents since their
graduation. While all residents became orthodontic colleagues of the faculty, some even
went on to become associates in their practices or join the department as part-time
faculty. Had this been a prospective study, the ranking would have ideally occurred on or
close to the time of graduation.
Due to study constraints, only one rater read, rated, and rerated all personal
statements and letters of recommendation. The low intrarater reliability found in this
study exemplifies the difficulty in attempting to measure qualitative data or even use it
constructively to make an admissions decision. Even after blinding observers to
applicant, author, and institution identity, Dirschl et al20(p.45)
found an extremely low
interobserver variability after faculty read and evaluated one-hundred seventy four letters
of recommendation. It is suspected that the weak intrarater reliability could occur with
any human rater, certainly members of an admissions committee. One might consider
exploring the use of qualitative data analysis software to achieve exact and reproducible
content analysis from letters of recommendation and personal statements.
Conclusions
Despite program directors reporting a high level of satisfaction with the admissions
process, there has been a, surprisingly, low percentage who would select all current and
recent residents again.3(p.824),28
This investigation serves as one of the only studies that
36
relates resident selection criteria to resident performance outcomes in an orthodontic
residency. The study created a program-specific definition of success in residency which
incorporated both objective and subjective outcomes and analyzed qualitative data using
original, evaluative rubrics. This study was designed with the ultimate goal of enhancing
current models of postgraduate orthodontic admissions as well as potentiating the
development of standardized protocols for admission and resident evaluation. The
research in the area of postgraduate orthodontic admissions is lacking, and more studies
are needed to investigate the predictive value of selection criteria used to identify
candidates who will become successful residents. Residency programs may choose to
restructure their admissions process if future studies elucidate more reliable indicators of
success than many of the selection criteria currently employed.
For the sample analyzed, the conclusions were as follows:
1. Undergraduate GPA: the undergraduate GPA was negatively associated with the
average GPA in the orthodontic residency program
2. Dental school GPA: an increasing dental school GPA was positively associated
with the average outcome case presentation. An increase in dental school GPA,
however, was also associated with having a lower average faculty evaluation in
the second year as compared with ratings from the first evaluation.
3. GREq: the higher the quantitative score on the GRE, the lower the average GPA in
the orthodontic residency program
4. NBDEc: the higher the microbiology/pathology subscore of the National Board
Dental Exam part I, the less revenue generated by the orthodontic resident from
37
their two years of patient treatment
5. Class rank: the higher the class ranking in dental school, the higher the average
performance on the first year written exam; top ranked students also were more
likely to have higher average faculty evaluations in the second year; finally, top
ranked students had higher odds of not having faculty regret admitting them.
38
References
1. American Dental Association. 2010-2011 Survey of advanced dental education.
2012:1-133.
2. Wagoner NE, Suriano JR. Factors used by program directors to select residents. J Med
Educ. 1986;61:10-21.
3. Galang MTS, Yuan JC, Lee DJ, Sukotjo C. Applicant selection procedures for
orthodontic specialty programs in the united states: Survey of program directors. Am J
Orthod and Dentofacial Orthoped. 2011;140(6):822-827.
4. Brothers TE, Wetherholt S. Importance of the faculty interview during the resident
application process. J Surg Educ. 2007;64(6):378-385.
5. Bell J, Kannelitsas I, Shaffer L. Selection of obstetrics and gynecology residents on the
basis of medical school performance. Am J Obstet Gynecol. 2002;186(5):1091.
6. Fine PL, Hayward RA. Do the criteria of resident selection committees predict
residents' performances? Acad Med. 1995;70(9):834-838.
7. Stohl H, Hueppchen N, Bienstock J. Can medical school performance predict
residency performance? Resident selection and predictors of successful performance in
obstetrics and gynecology. J Grad Med Educ. 2010:322.
8. Daly K, Levine S, Adams G. Predictors for resident success in otolarygnology. J Am
Coll Surg. 2006;202(4):649-654.
9. Borowitz S, Saulsbury F, Wilson W. Information collected during the residency match
process does not predict clinical performance. Arch Pediatr Adolesc Med. 2000;54:256.
10. Papp K, Polk H, Richardson J. The relationship between criteria used to select
residents and performance during residency. Am J Surg. 1997;173:326-329.
11. Neumann LM, MacNeil RL. Revisiting the national board dental examination. J Dent
Educ. 2007;71(10):1281-1292.
12. Spielman, AJ. Pass/Fail Score Reporting Effective January 1, 2012. Joint Commission
on National Dental Examinations: News from the Chair. 2011;4(1):1-6. Available at
http://www.ada.org/sections/educationAndCareers/pdfs/vol_4_nbr_1.PDF. Accessed
February 13, 2014
39
13. Kramer, GA. Reporting Examination Results Only as Pass-Fail. Joint Commission
on National Dental Examinations: e-Newsletter. 2008;1(1):1-5. Available at
http://www.ada.org/sections/educationAndCareers/pdfs/jcnde_enewsletter_april_08.pdf.
Accessed February 20, 2014
14. Diggle P, Heagerty P, Liang K, Zeger S. Analysis of longitudinal data. 2nd ed. USA:
Oxford University Press; 2013:400.
15. Warrick S, Crumrine R. Predictors of success in an anesthesiology residency. J Med
Educ. 1986;61:591-595.
16. Carmichael K, Westmoreland J, Thomas J, Patterson R. Relation of residency
selection factors to subsequent orthopaedic in-training examination performance. South
Med J. 2005;98(5):528-532.
17. Stacey D, Whittaker J. Predicting academic performance and clinical competency for
international dental students: Seeking the most efficient and effective measures. J Dent
Educ. 2005;69(2):270.
18. Gunderman R, Jackson V. Are NBME examination scores useful in selecting
radiology residency candidates? Acad Radiol. 2000;7(8):603.
19. Wood P, Smith W, Altmaier E, Tarico V, Franken E. A prospective study of
cognitive and noncognitive selection criteria as predictors of resident performance. Invest
Radiol. 1990;25(7):855.
20. Dirschl D, Campion E, Gilliam K. Resident selection and predictors of performance.
Can we be evidence based? Clin Orthop Relat Res. 2006(449):44.
21. Olawaiye A, Yeh J, Withiam-Leitch M. Resident selection process and prediction of
clinical performance in an obstetrics and gynecology program. Teach Learn Med.
2006;18(4):310-315.
22. Robins L, Fantone J, Oh M, Alexander G, Shlafer M, Davis W. The effect of pass/fail
grading and weekly quizzes on first-year students' performances and satisfaction. Acad
Med. 1995;70:327-329.
23. Rohe D, Barrier P, Clark M, Cook D, Vickers K, Decker P. The benefits of pass-fail
rating on stress, mood, and group cohesion in medical students. Mayo Clinic Proc.
2006;81(11):1443-1448.
24. Forsyth D, ed. The professor's guide to teaching: Psychological principles and
practices. Washington, DC: American Psychological Association; 2002.
40
25. Anderson E. Findings from survey of advanced dental education program directors.
FADEA Findings March 2011 Web site.
http://www.adea.org/publications/library/2011annualsession/documents/fadea-findings-
mar-2011-as.pdf
26. ETS personal potential index (ETS PPI). Educational Testing Service. Web site.
http://www.ets.org/ppi. Published 2014. Updated 2014. Accessed January 13, 2014.
27. ETS Personal Potential Index (ETS PPI). Educational Testing Service. Web site.
http://www.ets.org/ppi/schools/why. Published 2014. Updated 2014. Accessed January
24, 2014.
28. Yuan J, Lee D, Knoernschild K, Campbell S, Sukotjo C. Resident selection criteria
for advanced education in prosthodontic programs: Program directors’ perspective. J
Prosthodont. 2010;19:307.
41
Appendix A
Letter of Recommendation Evaluation Form
Please evaluate letter of recommendation as objectively as possible by making an
appropriate mark on the scales below.
1. Applicant characteristics & contribution Very little mention of
positive
characteristics; does not suggest that
applicant will
contribute to program or orthodontic
profession
Letter exemplifies applicant’s work ethic,
honesty/integrity,
communication, leadership skills, etc.;
will be an asset to
residency program
2. Originality
Generic letter that
could be used for any
applicant; based only on applicant’s CV
Content is specific and
tailored to applicant;
gives insight into applicant’s strengths
3. Support for applicant
Recommender
displays some reservations about
applicant
Recommender gives
highest commendations
and praise for applicant
4. Relationship to applicant
Limited interaction
with applicant; clear that recommender
does not “know”
applicant well
Long-term relationship,
many opportunities to
observe and engage applicant
5. Overall quality of recommendation
Poorly written letter
Extremely well-written letter of support
42
Appendix B
Personal Statement Evaluation Form
Guidelines to applicant:
What are your immediate and long-range professional goals?
Why have you chosen to apply to this orthodontic specialty program?
Please limit statement to one page.
Please evaluate personal statement as objectively as possible by making an appropriate
mark on the scales below.
1. Directions followed & Presentation
Statement does not Statement answers
address questions; is the questions and is
not limited to one limited to one page;
page; is handwritten, typed page is neat
font or margins too with ideal margins,
small or too large; font
evidence of having
written this as a first
draft
2. Quality of writing Grammatical errors, Grammatically
misspellings, typos, sound, crisp
one block prose writing; paragraph
rules followed
3. Content Vague, abstract or Pertinent, focused
generic; superfluous with meaningful
or “filler” information personal
information;
specific details,
direct language
4. Individuality
Boring, insipid Memorable,
examples, statement colorful, refreshing;
lacks a voice, easily statement has
forgettable personality with
descriptive
examples
5. Specific interest in our program
Generic statement Applicant has
could be submitted to demonstrated interest
any program in and knowledge of the program,
highlights reasons for why Minnesota
43
Appendix C
University of Minnesota Progress Case Presentation Evaluation Form
Resident Name:____________________________
Date:____________________
Presentation
Please evaluate the resident’s case presentation by circling one of the assessments
(Unacceptable, Acceptable, Outstanding) for each category below. Four or more
“Unacceptable” ratings within one evaluation form will require the student to repeat their
presentation, at another scheduled time, until an “Acceptable” grade is obtained.
# of cases presented: ___4___
1. Quality of Diagnostic Records:
Quality of models, photographs, radiographs. Completeness of records presented to
outline case.
Unacceptable □□□□ Acceptable □□□□ Outstanding □□□□
2. Organization and Sequence of Presentation:
Logical sequence presented. Presented appropriate case assessments e.g. conclusions,
superimpositions, profile changes, incisor/anchorage changes, surgical change etc.
Unacceptable □□□□ Acceptable □□□□ Outstanding □□□□
3. Familiarity with Case:
Understanding of case events. Preparedness and attitude toward case presentation.
Unacceptable □□□□ Acceptable □□□□ Outstanding □□□□
4. Quality of Discussion and Responses to Questions:
Ability to understand and respond appropriately to questions.
Unacceptable □□□□ Acceptable □□□□ Outstanding □□□□
5. Followed instructions:
On time, set up equipment, use of records, presented correct number of cases.
Unacceptable □□□□ Acceptable □□□□ Outstanding □□□□
6. Overall Case Progress:
Unacceptable □□□□ Acceptable □□□□ Outstanding □□□□
7. Total each category: ____ Unacceptable ____ Acceptable ____ Outstanding
44
Appendix D
University of Minnesota: Outcome Case Presentation Evaluation Form
Resident Name:____________________________
Date:____________________
A. Case Assessment
1. Objective Scores:
Case # D.I. initial case ABO final score
1.
2.
3.
2. Subjective Overall Case Results:
Unacceptable □□□ Acceptable □□□ Outstanding □□□
________________________________________________________________________
B. Presentation
Please evaluate the resident case presentation by circling (Unacceptable, Acceptable,
Outstanding) for each category. Two or more “Unacceptable” ratings within one
evaluation form will require the student to repeat their presentation, at another scheduled
time, until an “Acceptable” grade is obtained.
1. Quality of Diagnostic Records:
Quality of models, photographs, radiographs. Completeness of records.
Unacceptable □□□ Acceptable □□□ Outstanding □□□
2. Organization and Sequence of Presentation:
Logical sequence presented. Articulation and flow.
Unacceptable □□□ Acceptable □□□ Outstanding □□□
3. Familiarity with Case:
Understanding of case events. Preparation and attitude toward case presentation.
Unacceptable □□□ Acceptable □□□ Outstanding □□□
4. Quality of Discussion and Responses to Questions:
Ability to understand and respond appropriately to questions.
Unacceptable □□□ Acceptable □□□ Outstanding □□□
5. Followed instructions:
On time, set up of equipment, completed DI and ABO scores, presented
superimpositions.
Unacceptable □□□ Acceptable □□□ Outstanding □□□
6. Summary: Please indicate the total # in each category:
____Unacceptable ____Acceptable ____Outstanding
45
Appendix E
Semi-Annual Resident Evaluation Form (By Faculty)
Faculty: ___________________________________
Resident Name: ___________________________________
Date of Evaluation: ___________________________________
Please evaluate resident performance as objectively as possible by making an appropriate
mark on the scales below. Your ratings will be compiled with other faculty ratings and
reviewed with the resident during their individual conference.
1. Preparation and Performance in Seminars
Poorly prepared and Always prepared
rarely participates Participates
willingly
2. Clinical Skills
Unable to complete Consistently able
most clinical procedures to complete
without help clinical
procedures
without
assistance
3. Patient and Time Management
Does not communicate Communicates
well with patients and well with patients
parents, frequently and parents, good
behind schedule time manager
4. Teaching Effectiveness
Demonstrates little Is prepared and
preparation or enthusiasm enthusiastic about
for teaching duties teaching duties
5. Research Progress
No progress towards Well ahead of
research completion expected research
progress
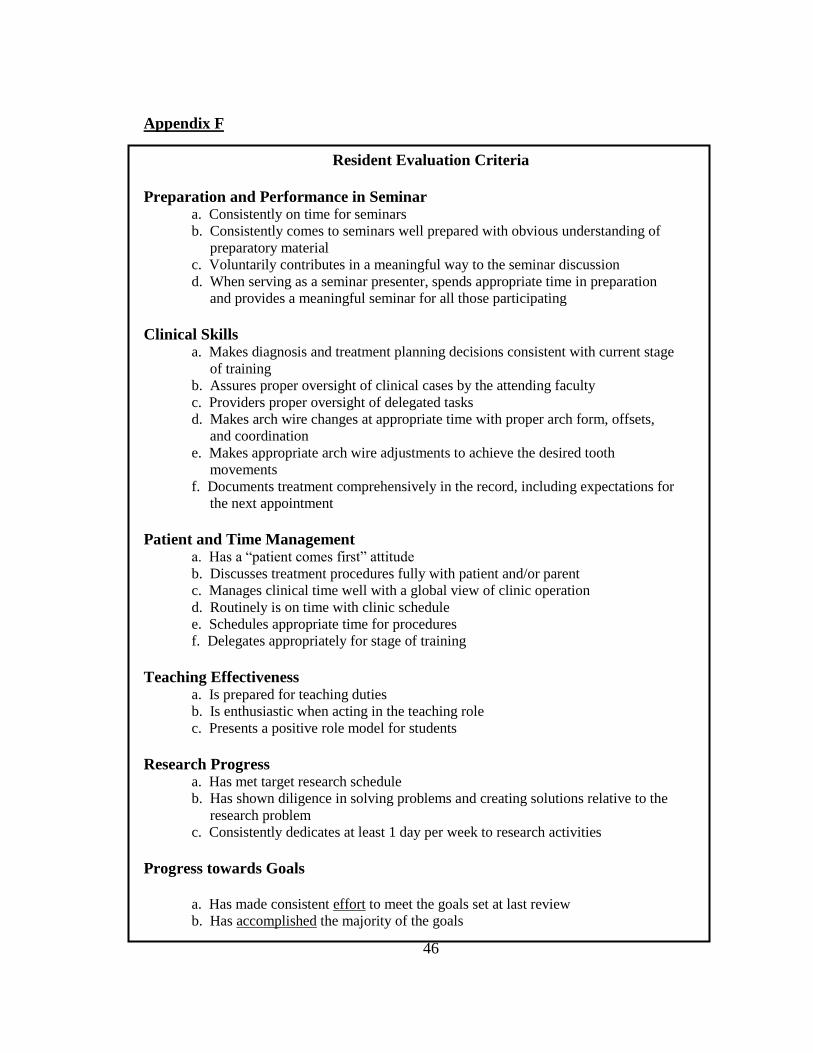
46
Appendix F
Resident Evaluation Criteria
Preparation and Performance in Seminar a. Consistently on time for seminars
b. Consistently comes to seminars well prepared with obvious understanding of
preparatory material
c. Voluntarily contributes in a meaningful way to the seminar discussion
d. When serving as a seminar presenter, spends appropriate time in preparation
and provides a meaningful seminar for all those participating
Clinical Skills a. Makes diagnosis and treatment planning decisions consistent with current stage
of training
b. Assures proper oversight of clinical cases by the attending faculty
c. Providers proper oversight of delegated tasks
d. Makes arch wire changes at appropriate time with proper arch form, offsets,
and coordination
e. Makes appropriate arch wire adjustments to achieve the desired tooth
movements
f. Documents treatment comprehensively in the record, including expectations for
the next appointment
Patient and Time Management a. Has a “patient comes first” attitude
b. Discusses treatment procedures fully with patient and/or parent
c. Manages clinical time well with a global view of clinic operation
d. Routinely is on time with clinic schedule
e. Schedules appropriate time for procedures
f. Delegates appropriately for stage of training
Teaching Effectiveness a. Is prepared for teaching duties
b. Is enthusiastic when acting in the teaching role
c. Presents a positive role model for students
Research Progress a. Has met target research schedule
b. Has shown diligence in solving problems and creating solutions relative to the
research problem
c. Consistently dedicates at least 1 day per week to research activities
Progress towards Goals
a. Has made consistent effort to meet the goals set at last review
b. Has accomplished the majority of the goals