Embed Size (px)
Citation preview
March 2009 This publication was produced for review by the United States Agency for International Development. It was prepared by Tran Thi Mai Oanh, Tran Van Tien, Duong Huy Luong, Khuong Anh Tuan, Nguyen Khanh Phuong, Le Quang Cuong, Amy Taye, Gilbert Kombe, and Saul Helfenbein for Health Systems 20/20 Project.
ASSESSING PROVINCIAL HEALTH SYSTEMS IN VIETNAM: LESSONS FROM TWO PROVINCES
Mission
The Health Systems 20/20 cooperative agreement, funded by the U.S. Agency for International Development (USAID) for the period 2006-2011, helps USAID-supported countries address health system barriers to the use of life-saving priority health services. Health Systems 20/20 works to strengthen health systems through integrated approaches to improving financing, governance, and operations, and building sustainable capacity of local institutions.
March 2009
For additional copies of this report, please email [email protected] or visit our Web site at www.healthsystems2020.org
Cooperative Agreement No.: GHS-A-00-06-00010-00
Submitted to: Karen Cavanaugh, CTO Yogesh Rajkotia, co-CTO Health Systems Division Office of Health, Infectious Disease and Nutrition Bureau for Global Health United States Agency for International Development
Recommended Citation: Tran Thi Mai Oanh, Tran Van Tien, Duong Huy Luong, Khuong Anh Tuan, Nguyen Khanh Phuong, Le Quang Cuong, Amy Taye, Gilbert Kombe, and Saul Helfenbein. March 2009. Assessing Provincial Health Systems in Vietnam: Lessons from Two Provinces. Bethesda, MD: Health Systems 20/20 project, Abt Associates Inc.
Abt Associates Inc. I 4550 Montgomery Avenue I Suite 800 North I Bethesda, Maryland 20814 I P: 301.347.5000 I F: 301.913.9061 I www.healthsystems2020.org I www.abtassociates.com
In collaboration with:
I Aga Khan Foundation I BearingPoint I Bitrán y Asociados I BRAC University I Broad Branch Associates I Forum One Communications I RTI International I Training Resources Group I Tulane University School of Public Health and Tropical Medicine
DISCLAIMER The author’s views expressed in this publication do not necessarily reflect the views of the United States Agency for International Development (USAID) or the United States Government
ASSESSING PROVINCIAL HEALTH SYSTEMS IN VIETNAM: LESSONS FROM TWO PROVINCES

V
CONTENTS
Acronyms ...................................................................................... ix
Acknowledgments........................................................................ xi
Executive Summary ................................................................... xiii
1. Background ................................................................................ 1
1.1 Issues of concern ....................................................................................2 1.2 Overview of the Current Public Health System Structure ..........5 1.3 Financing the National health care system .......................................8 1.4 Major Policy and Legislative Actions ..................................................8 1.5 The Private Sector................................................................................11
2. Introduction ............................................................................. 13
2.1 Ninh Binh and Can Tho Provinces ...................................................13
3. Methodology ............................................................................ 15
3.1 Objectives of the provincial assessment .........................................15 3.2 The Assessment Approach.................................................................15
4. Findings .................................................................................... 17
4.1 Governance............................................................................................17 4.2 Health Financing ....................................................................................24 4.3 Health Service Delivery.......................................................................30 4.4 Human Resources ................................................................................35 4.5 Pharmaceutical management..............................................................42 4.6 Health Information Systems...............................................................51
5. Discussion................................................................................. 55
5.1 Equity .......................................................................................................55 5.2 Efficiency .................................................................................................56 5.3 Access......................................................................................................58 5.4 Quality .....................................................................................................59 5.5 Sustainability...........................................................................................60
6. Conclusions .............................................................................. 63
Annex A: List of Main Respondents by Module ........................ 64
Annex B: Scoring Instruments ................................................... 67
Annex C: Health Systems Evaluation Criteria Tables............. 81
Annex D: References .................................................................. 97

VI
LIST OF TABLES
Research group List of Individuals Involved in conducting the study......xii Table 1: Major Socioeconomic and Health Indicators for Vietnam........... 2 Table 2. HIV/AIDS and Demographic Statistics. .........................................13 Table 3: Governance Summary Scoring .........................................................18 Table 4: Financing Summary Scoring ...............................................................24 Table 5: Budget Allocation From Government Health Budget
By Levels (%) ................................................................................................28 Table 6: Percentage of government health budget spent on curative/
preventive care in two provinces, 2005-07 ..........................................28 Table 7: Service Delivery Summary Scoring..................................................30 Table 8. Number of Public health facilities and beds in Ninh Binh and
Can Tho provinces......................................................................................30 Table 9. Number of CHS in Ninh Binh and Can Tho provinces..............31 Table 10. Key indicators nationwide...............................................................32 Table 11: HIV/AIDS indicators in Ninh Binh and Can Tho provinces ....33 Table 12: Basic components of human resources for health in Ninh
Binh and Can Tho provinces ....................................................................35 Table 13. Distribution of health workforce in two provinces by levels .36 Table 14. Distribution of health workforce by field of works (excluded
commune level)............................................................................................37 Table 15. Pharmaceutical Management...........................................................42 Table 16: Health Information Systems............................................................51 Table 17. Indicators selected for equity .........................................................55 Table 18. Indicators selected for accessibility of the health
care system ...................................................................................................58 Table 19. Score for Sustainability.....................................................................60 Table B1. Summary score for governance indicators and governance
components from Ninh Binh and Can Tho Province. ........................67 Table B2. Result of Governance scoring indicators and component at
the national level..........................................................................................69 Table B3. Indicator and Component rating for Health Financing ............71 Table B4. Indicator and Component rating for Service Delivery.............72 Table B5. Indicator and Component rating for human resources...........74 Table B6: Indicator and component scoring for Pharmaceutical
management at national and two investigated provinces ..................75 Table B7 Indicator and Component rating for Health Information
system ............................................................................................................78
LIST OF FIGURES
Figure 1: Average Life Expectancy across Socioeconomic Regions 2002 .................................................................................................. 3
Figure 2: Structure of public health care system in Vietnam....................... 6 Figure 3. Health Governance Framework .....................................................17

VII
Figure 4. Total health spending per capita, 2000 to 2006 (Unit: US$ (2006 prices).................................................................................................25
Figure 5. Ratio of health professional cadres in Two provinces compareD to whole country and regions (per 10,000 populations) ..................................................................................................35
Figure 6: Expenditure on drugs by government compared to private .......................................................................................................43
Figure 7: Average population per drug retailers nationwide, in Can Tho and in Ninh Binh, 2007 ........................................................48
Figure 8: Trend of average population per licensed pharmacist and doctor at national level, 2001-2006........................................................49
Figure 9: Average annual spending for self-medication per household......................................................................................................50

IX
ACRONYMS
ADB Asian Development Bank
ADR Adverse Drug Reactions
AIDS Acquired Immune Deficiency Syndrome
ARV Anti Retroviral
CHC Commune Health Center
CHS Commune Health Station
CIF Cost Insurance and Freight
DAV Drug Administration of Vietnam
DHO District Health Offices
DOH Department of Health
DPC District People’s Committee
EPI Expanded Program on Immunization
GDP Gross Domestic Product
GSO General Statistic Office
HCFP Health Care Fund for the Poor
HCMC Ho Chi Minh City
HDI Human Development Index
HI Health Insurance
HIDS Health Statistics Information Division
HIV Human Immunodeficiency Virus
HIS Health Information System
HMIS Health Management Information System
HRH Human Resources for Health
HSA Health Systems Assessment
HSPI Health Strategy and Policy Institute
ICT Information and Communications Technology
IEC Information, Education, Communication
IMR Infant Mortality Rate
IT Information Technology
JAHR Joint Annual Health Sector Review
X
MMR Maternal Mortality Ratio
MOF Ministry of Finance
MOH Ministry of Health
MPI Ministry of Planning and Investment
NEML National Essential Medicines List
NGO Non-governmental Organization
NHA National Health Accounts
NHP National Health Programs
NMP National Essential Medicines Policy
OOP Out of Pocket
PHB Provincial Health Bureau
PHD Provincial Health Department
PPC Provincial People’s Committee
SARS Severe Acute Respiratory Syndrome
SOP Standard Operating Procedures
TB Tuberculosis
TOT Training of Trainers
U5MR Under 5 Mortality Rate
UNDP United Nations Development Program
USD US Dollars
VHW Village Health Workers
VND Vietnamese Dong
WB World Bank
WHO World Health Organization
WHR World Health Report

XI
ACKNOWLEDGMENTS
This study, which tests a health system assessment instrument in two provinces of Vietnam was carried out by the Health Strategy and Policy Institute (HSPI) in collaboration with Health Systems 20/20 project between March 2008 and December 2008. The study was conducted with financial assistance from the United States Agency for International Development.
We highly appreciate the contributions of Ministry of Health experts from different but related departments, for their inputs in adjusting the instrument prior to conducting the study: Prof. Truong Viet Dzung, PhD; Nguyen Hoang Long, MSc; Nguyen Quang An, PhD; Pham Duc Muc, MSc; Hoang Thanh Huong, PhD; and Truong Quoc Cuong.
Our special thanks to Dr. Gilbert Kombe, Dr. Saul Helfenbein and Mrs. Amy Taye for their great contributions in terms of providing technical support. The authors are grateful for the support provided by the U.S. Agency for International Development (USAID)/Washington, especially Dr. Estelle Quain of the Office of HIV/AIDS, and Ms. Karen Cavanaugh and Mr. Yogesh Rajkotia of the Bureau of Global Health, Office of Health, Infectious Disease and Nutrition. Additionally, we are grateful for the support of USAID/Vietnam including Ms. Ellen Lynch.
We would like to thank our MOH colleagues who were involved in conducting this study and who provided comments for the instrument and the report. We would also like to thank the Ninh Binh and Can Tho provincial health bureaus, selected general provincial and district hospitals, and commune health stations for their collaboration and support.
Last but not least, we would like to extend our sincere thanks to other experts and individuals for their assistance without which we would not have completed this study.
Research Team

XII
RESEARCH GROUP LIST OF INDIVIDUALS INVOLVED IN CONDUCTING THE STUDY
Implementing Institution: Health Strategy and Policy Institute Team leader: Le Quang Cuong Asst. Prof. MD,PhD
Team members: Tran Thi Mai Oanh* MD, MPH
Tran Van Tien MD, PhD
Duong Huy Luong MD, MPH
Khuong Anh Tuan MD, PhD
Nguyen Khanh Phuong Phar. Msc
Technical assistance: Gilbert Kombe MD, MPH
Saul Helfenbein MD, PhD
Amy Taye MPH
Research assistants: Hoang Thu Thuy MD
Nguyen Thi Thang MPH
Nguyen Tuan Anh MD, MPH
Hoang Phuong MSc
Nguyen Minh Hieu MSc
Vuong Lan Mai MPH
Vu Van Hoan MSc
Vu Mai Anh MD, MPH
Nguyen Thi Thuy BA
Tuong Duy Trinh BA
Correspondence: [email protected]; [email protected]
+ 84 438 463 803
XIII
EXECUTIVE SUMMARY
Over the past decade, Vietnam has made important achievements in both the economic and social sectors, including health. The economic growth rate has increased rapidly at an average rate of 7 percent per year. Though the per capita gross domestic product (GDP) of Vietnam in 2006 was US$722, poverty (the percentage of poor households below the new poverty standard set in 2006 is 19 percent) is still significant. The Human Development Index (HDI) has continued to increase over the past ten years from 0.618 in 1990 to 0.709 in 2004, demonstrating progress in education, health care and living standards. In 2005, Vietnam was upgraded to 105 among 177 countries according to HDI, compared with 120 out of 177 in 1995 (UNDP, 2007).
Compared to countries with the same GDP per capita, Vietnam is considered to have fairly good health outcomes. For example, life expectancy at birth has increased dramatically. In 2006 it was 71.3 years; the infant mortality rate reduced from 36.7 per 1000 live births in 2000 to 16.0 in 2006; under 5 mortality rate fell from 42 per 1000 live births in 2000 to 26 in 2006 (GSO 2006; MOH 2006b). Key reasons for these achievements include: economic growth; a stable socio-political environment; strong commitments by the government to achieve development and socioeconomic goals, including health goals, and the strategy on poverty reduction and hunger eradication. Vietnam has a low economic inequity index (under 10 times); high rate of adult literacy (91 percent, [UNDP Vietnam 2007]); and availability of health care facilities at the community level. By the end of 2006, 100 percent of communes and precincts had health staff; 71 percent of communes had doctors; 94 percent of communes had nurses or midwives; nearly 90 percent of hamlets had health community workers; and 45 percent of all communes in the country had met the national standards of communal health (Chien 2007) and issued health finance supportive policies for the poor.
Although significant progress has been made, many health-related issues remain to be addressed. The country is currently facing a double burden of disease. In the past few years, disease patterns have seen important shifts, with declines in the share of morbidity from communicable diseases and an increase from non-communicable diseases, accidents and injuries. Some communicable diseases such as dengue fever, continue to have high prevalence rates in endemic regions in the Mekong Delta. Malaria is prevalent in the northern mountains and Central Highlands, while tuberculosis (TB) is making a comeback in the country.
To address many of the past and emerging health challenges, the government has implemented several policies including decentralization of the health sector. This policy has focused on devolving autonomy and accountability to provincial and district social service institutions in terms of organization, rearrangement of administrative apparatus, and the use of labor and financial resources. Another major initiative is the user-fee exemption policy for the poor, near poor, children under 6, and elderly over 85. Provinces are also implementing the exemption policy to provide free treatment for HIV/AIDS patients.
This report presents data from the first two provincial health system assessments conducted in Vietnam. The assessments were conducted by the Health Strategy and Policy Institute (HSPI) in collaboration with the USAID Health Systems 20/20 project. The objective of the provincial health system assessment was fourfold: (1) to pilot the application of the health systems assessment tool at provincial level; (2) to provide empirical evidence to policymakers at the national, provincial and local levels about the strengths and weaknesses of the provincial health system and to allow them to target weaknesses in the
XIV
health system; (3) to provide targeted recommendations to local and international partners on specific health systems components that need to be strengthened; and (4) to refine the tools for the roll-out of assessments to other provinces.
Six major conclusions can be drawn from this assessment. First, the provincial health systems in both Ninh Binh and Can Tho provinces are highly functional. Specifically, the role of government is well identified. Mechanisms are in place to encourage civil society participation in policy making. The decentralization process, including budget allocations, appears to be reaching all levels of care.
Second, health information systems (HIS) received the lowest score of all the health system functions. Nearly every component received a score of less than adequate. In both provinces, the provincial/local government does not provide equipment, forms or training regarding health information management. The HIS in the two provinces are funded mostly by central budgets and projects. Statistical and computer staff are few and their technical qualifications are limited, especially at the grassroots level.
Third, from the health financing aspect, out-of-pocket (OOP) health expenditure patterns and increases in per capita health expenditure suggest that finances may act as a barrier to accessing health services. The central government has tried to mitigate the effects of high OOP expenditure with its exemption policies for the poor and near poor. Budget allocation mechanisms for health are not based on outputs.
Fourth, the public health facilities in Ninh Binh and Can Tho have wide service coverage. The service delivery access and coverage component received high scores. At the provincial level, there are provincial general hospitals and provincial specialized hospitals, such as TB and lung diseases, and traditional medicine. At the district level, there are district hospitals that treat inpatients using basic techniques for emergency care of common diseases. At the commune level, the commune health station (CHS) mainly focuses on preventive care and provision of outpatient care services.
Fifth, Vietnam has a relatively adequate number of human resources for health. In two provinces, there are mild shortages of certain specialist cadres at grassroots level due in part to the change in health system structures at that level in recent years (new structures were established at the district level). New managers at various levels of care have come from among the most senior health facility staff, particularly specialists. The organizational changes have also contributed to the staffing shifts within provinces towards higher levels of care. The performance management component indicates a weakness in the area of salary and merit awards. Job descriptions are available and regularly updated, but only for certain positions. There is also no formal mechanism for individual performance planning.
Finally, in two provinces, the pharmaceuticals management function generally scored well. The procurement component appeared to be the only weak area of pharmaceutical management. The other components of pharmaceutical management, including budget, financing for drugs, pharmaceutical policies and accessibility to good quality products and services, all had fairly good profiles. The weaker profiles were for rational use of drugs, and storage and distribution aspects. Mechanisms to improve the use of medicines in hospitals and treatment guidelines for common health problems existed but did not function well in both public and private health facilities. Standardized quantification methods for drug procurement were not applied in these two provinces. Different hospitals used different methods to estimate drug quantity for procurement.

XV
The health systems assessment tool was modified by the HSPI team and MOH experts Vietnam to reflect the different levels of care and the Vietnam context. (Initial and suggested indicators are shown in Annex C).

1
1. BACKGROUND
Over the past decade, Vietnam has made important achievements in both the economic and social sectors, including health. The economic growth rate has increased rapidly at an average rate of 7 percent per year. Though the per capita gross domestic product (GDP) of Vietnam in 2006 was US$722, poverty (the percentage of poor households below the new poverty standard set in 2006 is 19 percent) is still significant1. The Human Development Index (HDI) has continued to increase over the past 10 years from 0.618 in 1990 to 0.709 in 2004, demonstrating progress in education, health care and living standards. In 2007, Vietnam was upgraded to 105 among 177 countries according to HDI, compared with 120 out of 177 in 1995 (UNDP).
Compared with countries with the same GDP per capita, Vietnam is considered to have fairly good health outcomes. For example, life expectancy at birth has increased dramatically, and in 2006 it was 71.3 years; the infant mortality rate (IMR) was reduced from 36.7 per 1,000 live births in 2000 to 16.0 in 2006; the under-5 mortality rate (U5MR) fell from 42 per 1,000 live births in 2000 down to 26 in 2006 (Table 1) (GSO 2006, MOH 2006b). Key reasons for these achievements include: economic growth; stable socio-political environment; strong commitments by the government to achieve development and socioeconomic goals, including health goals; and the strategy on poverty reduction and hunger eradication. Vietnam has a low economic inequity index (under 10 times)2, a high rate of adult literacy (91 percent, UNDP Vietnam 2007); and availability of health care facilities at community level. By the end of 2006, 100 percent of communes and precincts had health staff; 71 percent of communes had doctors; 94 percent of communes had nurses or midwives; nearly 90 percent of hamlets had community health workers; and 45 percent of all communes around the country had met the national standards of communal health and issued health finance supportive policies for the poor (MOH 2007).
1 Report by Prime Minister Nguyen Tan Dung at the 11th session of the XI Legislature of the National Assembly. http://www.cpv.org.vn/details.asp/id=BT2030738972
2 In terms of monthly income per head in 2003-2004, that of urban areas was 2.2 times greater than that of rural areas; that of the highest-income quintile was 8.3 times greater than that of the lowest-income quintile. Average expenditure per head in urban areas was 2.2 times greater than that of rural areas; that of the highest-income quintile was 4.5 times more than that of the lowest-income quintile (GSO 2006)
2
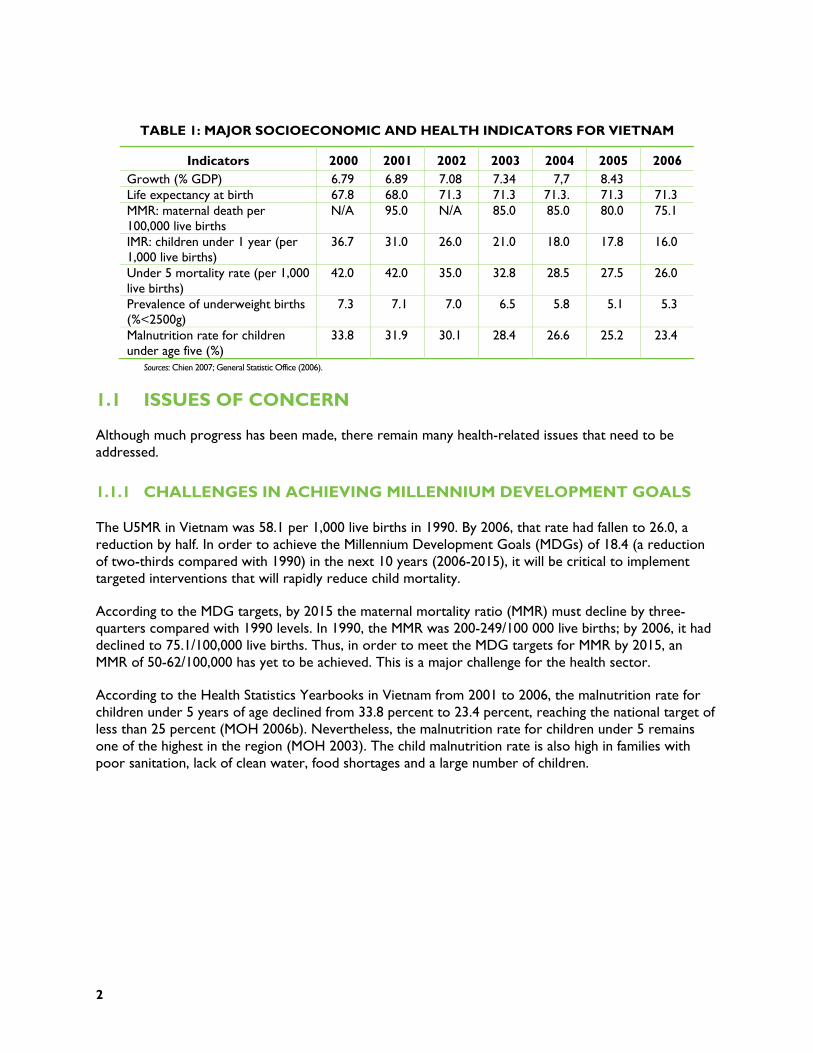
TABLE 1: MAJOR SOCIOECONOMIC AND HEALTH INDICATORS FOR VIETNAM
Indicators 2000 2001 2002 2003 2004 2005 2006 Growth (% GDP) 6.79 6.89 7.08 7.34 7,7 8.43 Life expectancy at birth 67.8 68.0 71.3 71.3 71.3. 71.3 71.3 MMR: maternal death per 100,000 live births
N/A 95.0 N/A 85.0 85.0 80.0 75.1
IMR: children under 1 year (per 1,000 live births)
36.7 31.0 26.0 21.0 18.0 17.8 16.0
Under 5 mortality rate (per 1,000 live births)
42.0 42.0 35.0 32.8 28.5 27.5 26.0
Prevalence of underweight births (%<2500g)
7.3 7.1 7.0 6.5 5.8 5.1 5.3
Malnutrition rate for children under age five (%)
33.8 31.9 30.1 28.4 26.6 25.2 23.4
Sources: Chien 2007; General Statistic Office (2006).
1.1 ISSUES OF CONCERN
Although much progress has been made, there remain many health-related issues that need to be addressed.
1.1.1 CHALLENGES IN ACHIEVING MILLENNIUM DEVELOPMENT GOALS
The U5MR in Vietnam was 58.1 per 1,000 live births in 1990. By 2006, that rate had fallen to 26.0, a reduction by half. In order to achieve the Millennium Development Goals (MDGs) of 18.4 (a reduction of two-thirds compared with 1990) in the next 10 years (2006-2015), it will be critical to implement targeted interventions that will rapidly reduce child mortality.
According to the MDG targets, by 2015 the maternal mortality ratio (MMR) must decline by three-quarters compared with 1990 levels. In 1990, the MMR was 200-249/100 000 live births; by 2006, it had declined to 75.1/100,000 live births. Thus, in order to meet the MDG targets for MMR by 2015, an MMR of 50-62/100,000 has yet to be achieved. This is a major challenge for the health sector.
According to the Health Statistics Yearbooks in Vietnam from 2001 to 2006, the malnutrition rate for children under 5 years of age declined from 33.8 percent to 23.4 percent, reaching the national target of less than 25 percent (MOH 2006b). Nevertheless, the malnutrition rate for children under 5 remains one of the highest in the region (MOH 2003). The child malnutrition rate is also high in families with poor sanitation, lack of clean water, food shortages and a large number of children.
3
1.1.2 REGIONAL DISPARITIES IN HEALTH STATUS
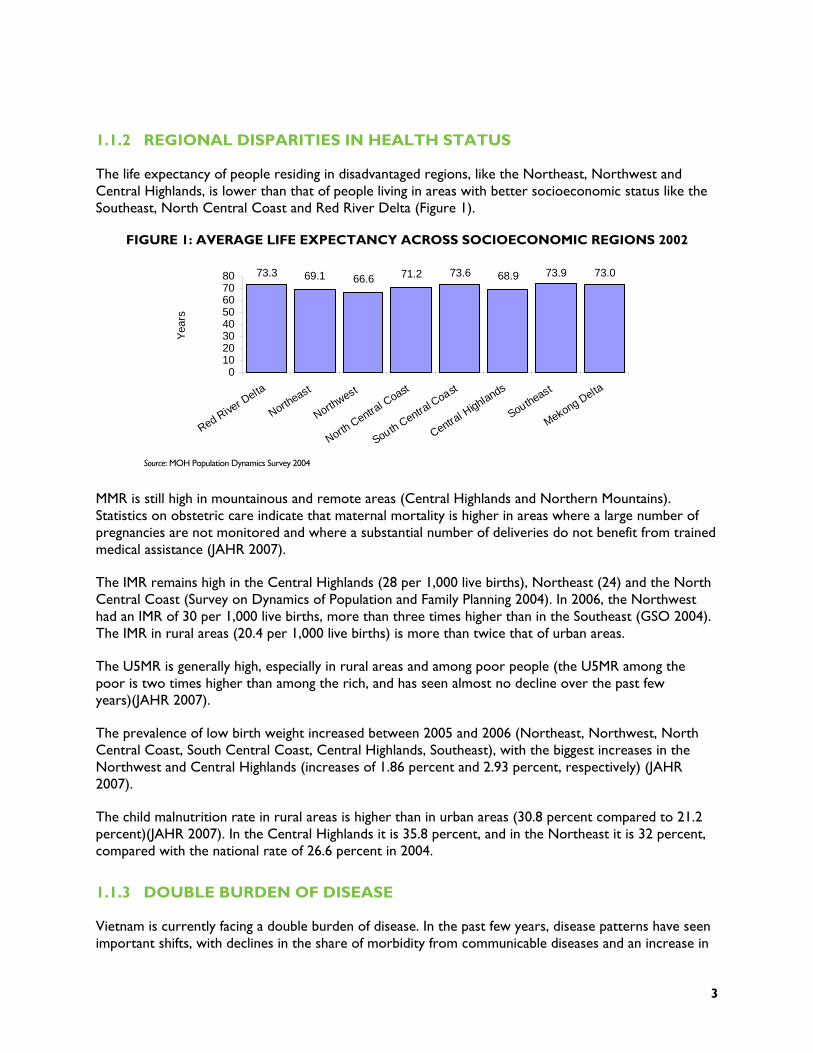
The life expectancy of people residing in disadvantaged regions, like the Northeast, Northwest and Central Highlands, is lower than that of people living in areas with better socioeconomic status like the Southeast, North Central Coast and Red River Delta (Figure 1).
FIGURE 1: AVERAGE LIFE EXPECTANCY ACROSS SOCIOECONOMIC REGIONS 2002
Source: MOH Population Dynamics Survey 2004
MMR is still high in mountainous and remote areas (Central Highlands and Northern Mountains). Statistics on obstetric care indicate that maternal mortality is higher in areas where a large number of pregnancies are not monitored and where a substantial number of deliveries do not benefit from trained medical assistance (JAHR 2007).
The IMR remains high in the Central Highlands (28 per 1,000 live births), Northeast (24) and the North Central Coast (Survey on Dynamics of Population and Family Planning 2004). In 2006, the Northwest had an IMR of 30 per 1,000 live births, more than three times higher than in the Southeast (GSO 2004). The IMR in rural areas (20.4 per 1,000 live births) is more than twice that of urban areas.
The U5MR is generally high, especially in rural areas and among poor people (the U5MR among the poor is two times higher than among the rich, and has seen almost no decline over the past few years)(JAHR 2007).
The prevalence of low birth weight increased between 2005 and 2006 (Northeast, Northwest, North Central Coast, South Central Coast, Central Highlands, Southeast), with the biggest increases in the Northwest and Central Highlands (increases of 1.86 percent and 2.93 percent, respectively) (JAHR 2007).
The child malnutrition rate in rural areas is higher than in urban areas (30.8 percent compared to 21.2 percent)(JAHR 2007). In the Central Highlands it is 35.8 percent, and in the Northeast it is 32 percent, compared with the national rate of 26.6 percent in 2004.
1.1.3 DOUBLE BURDEN OF DISEASE
Vietnam is currently facing a double burden of disease. In the past few years, disease patterns have seen important shifts, with declines in the share of morbidity from communicable diseases and an increase in
73.3 69.1 66.6 71.2 73.6 68.9 73.9 73.0
01020304050607080
Red River D
elta
Northeast
Northwest
North Centra
l Coast
South Central C
oast
Central H
ighlands
Southeast
Mekong Delta
Yea
rs

4
non-communicable diseases, accidents and injuries. Nevertheless, some communicable diseases continue to have high prevalence rates in endemic regions, such as dengue fever in the Mekong Delta, malaria in the Northern Mountains and Central Highlands, and TB in the South. Some diseases are making a comeback and are spreading rapidly over a wide area.
Dengue fever: Although dengue fever epidemics have been controlled, incidence in 2006 showed an increase compared with the same period in 2005 and there is a risk of the disease spreading to provinces in the South and Central regions. In 2006, there were 68,532 reported cases, from which 53 patients died (MOH 2006b).
Malaria: Incidence and mortality from malaria declined over the period 2000-2006. However, prevalence remains high in mountainous and remote provinces. In 2006, 91,635 cases of malaria were reported, with 41 deaths. Migration from malaria-endemic provinces to provinces without malaria makes it difficult to control the disease. Malaria prevalence rates are highest in the Northern Mountains (30 percent of all cases) and border provinces of the Central Coast and Central Highlands regions (20 percent of all cases). Low educational attainment, lack of fluency in the national language, and dependence on natural resources in the forests make it difficult to fight against malaria.
TB persists as a widespread health problem in Vietnam, with prevalence rates highest in the South. New challenges for the TB control program include multidrug-resistant strains of TB (an estimated 2.5 percent of all new cases and 23 percent of retreatment cases are due to multidrug-resistant TB). TB/HIV co-infection also increases the challenges for TB management (MOH 2006b).
HIV/AIDS: HIV infection rates continue to increase. By December 31, 2006, the cumulative number of people infected with HIV in the whole country was 116,565, among whom 20 195 cases had developed into AIDS, and 11,802 patients had died from AIDS-related causes. Ho Chi Minh City (HCMC) has the highest number of HIV/AIDS cases in the country (16,946 cases, equivalent to 15 percent of all cases in the country) and prevalence rates are highest in Quang Ninh with 672.9 cases per 100 000 population (MOH 2006b).
Besides traditional communicable diseases, new emerging diseases, such as severe acute respiratory syndrome (SARS) and avian influenza A(H5N1), are creating additional burden for the health sector. For example, in recent years, cases of highly pathogenic avian influenza A(H5N1) have occurred in humans. Up to November 12, 2007, the country has seen 100 cases of avian influenza A(H5N1) in humans, of whom 46 have died, the second highest incidence and mortality in the world after Indonesia. Although the number of human cases in Vietnam remains low (only seven cases in 2007), epidemics of avian influenza in poultry continue to be widespread with complicated developments threatening a pandemic in humans.
Non-communicable diseases, such as cancer, cardio-vascular disease, diabetes and hypertension are on the rise.
Cancer: The incidence of cancer in Vietnam increased from 1990 to 2002. It is estimated that approximately 75 000 people are diagnosed with cancer each year, and fatality rates are high, accounting for 12 percent of total deaths in the country each year (MOH 2006b).
Cardio-vascular disease: Results of the National Health Survey 2001-2002 indicate that 15.1 percent of men and 13.5 percent of women have high blood pressure. In the working age group (20-59), men have a higher risk of high blood pressure than women. However, only 28 percent of men and 42 percent women with high blood pressure have been diagnosed with the condition (MOH 2006b).

5
Stroke: Statistics on stroke in Vietnam are incomplete. Nevertheless, estimates for some localities indicate that incidence and mortality from stroke are on the increase. In Ba Vi district of Ha Tay province, mortality from stroke is estimated at 73/100,000 population. In Ha Noi and HCMC, mortality rates are much higher, at around 130-131/100,000 population. Some 60 percent of people suffering strokes are below 60 years of age, and 80 percent of those suffering a stroke die within 24 hours (MOH 2006b).
Diabetes prevalence is highest in cities (4.4 percent), with lower rates in delta areas (2.7 percent) and mountainous areas (2.1 percent). Prevalence increases with age. Many diabetics are unaware that they have the disease. Although information on the trends in diabetes incidence is inadequate, risk factors, such as being overweight and aging, indicate that there will continue to be increases in the disease in the future (MOH 2006b).
Accidents, injuries and food safety have become prominent issues in recent years due to their complicated nature and the consternation caused in society by their increasing trends. Accidents and injuries are a leading cause of death in Vietnam. According to the National Health Survey 2001-2002 (MOH 2003), accidents rank fourth in all causes of death. Statistics indicate that in 2006, 11,103 people were injured and 12,155 died due to road traffic accidents. Ha Noi and HCMC have the highest number of traffic-related injuries and deaths (730 and 915 injuries, respectively, with 500 and 977 deaths, respectively).
Food poisoning in Vietnam is very widespread. Currently there are many cases of food poisoning in factory and business cafeterias, or other public eating-places. According to statistics reported from the provinces, in 2006 there were 2504 cases of pesticide poisoning, with 4943 people affected and 155 deaths, accounting for 3 percent of all people poisoned (MOH 2006b). Since the data on food poisoning are not accurate, it is likely that the true figures are much higher. Pesticide poisoning is also an area of concern.
According to MOH, violations of food hygiene and safety regulations occur at all stages, from the growing and raising of agricultural products, to processing, distribution and consumption. The main causes of street-food contamination are: inadequate hygiene and safety practices in food processing (49.1 percent to 91.6 percent); inadequate hygiene and safety in transporting and storing food (85.9 percent to 99.2 percent); the use of unhygienic and unsafe sites, equipment and utensils in food processing (37 percent to 88 percent); and vendors and food processing workers not complying with regulations on food hygiene and safety (43.8 percent to 88 percent) (MOH 2006b).
1.2 OVERVIEW OF THE CURRENT PUBLIC HEALTH SYSTEM STRUCTURE
Administratively, the health system is divided into three levels: central (MOH); provincial (provincial health departments [PHDs], sometimes referred to as provincial health offices or provincial health bureaus); and district level (district health offices, or DHOs). With respect to service delivery, four levels of organization officially exist: (1) central level (central and regional hospitals) managed directly by the MOH; (2) provincial-level providers, managed by the PHDs; (3) district-level providers, also managed by the PHDs; and (4) commune-level providers, managed by the DHOs (Figure 2).
6
FIGURE 2: STRUCTURE OF PUBLIC HEALTH CARE SYSTEM IN VIETNAM
5
District P.C
MOH
Prov. People
Committee
Gov.
Commune P.C
64 Provincial
Health Bureaus
District health administrative
Unit
CHS (commune/ward)
VHWs
- MOH’s departments
- Institutions under management of MOH (NIHE, Pasteur Institutes etc)
-Medical Colleges
- 31 Central Hospitals (general and Specialized
- Provincial General/Specialized Hospitals
- Centers for Preventive Medicine
- Provincial Secondary Medical School
- Pharmaceutical company
- District Health Centers
- Region polyclinics
Health facilities of other ministries and sectors
The service delivery network is quite well organized and has wide coverage. Health facilities are established at all four levels: central, provincial, district and commune. The most common issue facing the service delivery system’s organization is an excessive patient load at the provincial and central levels, and small patient loads at district and commune level. Although the overload at the higher level is well recognized, people continue to bypass appropriate health services at lower levels that are “under-loaded.” Patients are free to choose which level of care they want to access health services. The following reasons explain why patients might choose to access higher levels of care directly: the absence of specialties and adequate equipment at the lower levels; the small differential in user fees in hospitals at the upper levels compared with the lower ones; and increasingly convenient transport, facilitating access to health facilities at the upper levels.
Furthermore, bypassing is quite common due to the poor quality of services at the lower level, causing overload in provincial and central hospitals. The rate of the patients referred from district or provincial to central hospitals having been correctly diagnosed by the lower level was modest. There is some anecdotal evidence that the percentage of incorrect diagnoses in hospitals at the lower level is still high.
Central level: The MOH is the government agency that carries out the functions for state management of people’s health. This includes health protection and promotion, curative care, rehabilitation, traditional medicine, pharmaceutical supplies, food safety and medical equipment.
The administrative apparatus of the MOH includes the Ministry’s Cabinet, departments and inspectorate. Following the recent Decision of the 1st Session of the 12th National Party Congress to dissolve and
7
merge some ministries and ministerial-level agencies, a unit of the former Committee for Population, Family Planning and Child Health was incorporated into the MOH. In addition, the MOH has 70 subordinate institutions in three major areas: (1) hospitals; (2) preventive medicine and professional institutes; and (3) medical colleges and universities.
Provincial level: The PHD, a professional agency under the management of the Provincial People’s Committee (PPC), works to advise the PPC on state management of local people’s health care, protection and promotion, and performs tasks and obligations as authorized by the PPC and standing regulations. The PHD works under the control of the PPC in terms of direction, organizational management, payroll and operations, but is also under the control of the MOH in terms of technical direction, guidance, monitoring and inspection.
The PHD’s administrative structure includes a Cabinet, an inspectorate, professional and technical divisions, health care facilities and centers of preventive medicine. It is responsible for health audits, training, and information, education and communication (IEC).
District level: The DHO, a professional agency under the management of the District People’s Committee (DPC), works to advise the DPC on state management of local people’s health care, protection and promotion, and performs designated tasks and obligations as authorized by the DPC and the PHD. The DHO works under the control of the DPC in terms of direction, organizational management, payroll, and operations, but is also under the control of the PHD for technical direction, guidance, monitoring and inspection. The district level also has district hospitals (including polyclinics) and district centers for preventive medicine, which were split from district health centers by Decree 172, and are now under the stewardship and management of the PHD.
From 1998 to 2004, the government designated the district health center as the sole unified public health unit with both preventive and curative missions at the district level. The centers were also responsible for managing the commune health services. District health centers play the leading role for all medical activities in the area, from preventive to curative care. Most people perceive the district health centers as the same as a district hospital. Each district with a population varying from 30,000 to 80,000 inhabitants has one district hospital.
Regional polyclinics under the district hospitals provide health services within certain communes in the district. Polyclinics make it easier for people to seek health care, and facilitate diagnosis and timely treatment without visiting a hospital. Regional polyclinics also assisted the Commune/Ward Health Station (CHS) to improve their professional capabilities and take on many of the responsibilities of a district hospital.
Commune level: The CHS, the first formal point of health care contact in the government health care system, is designated to provide primary health care services. They carry out early detection of epidemics, provide care and treatment for common diseases and deliveries, mobilize people to use birth control, practice preventive hygiene, and carry out health promotion at the village level. The CHS has a responsibility to the DHO and the Commune People’s Committee for local people’s health care, protection and promotion, and receives technical guidance from the district hospitals. However, this support has been reduced since the promulgation of Decree 172 . The CHS also supervises the voluntary health workers (VHWs) who operate in the communes where people live and work. Every village has a VHW (with 3 to 9 months of training).
The primary care facilities network is considered a grassroots-level network and covers all districts and communes. By the end of 2006, Vietnam had 671 districts and 10,876 communes/wards serving a

8
population of more than 83 million people. The CHS is the primary unit for delivery of health care in the public health system. The number of CHS continues to increase annually to guarantee that newly established communes have primary health care facilities. Currently, 98 percent of communes have a CHS. Each commune has an average of 3,000 to 10,000 inhabitants. Therefore, for every 10,000 inhabitants 1 to 3 primary health care facilities are available. Sixty-five percent of CHS have a medical doctor. Apart from public health facilities, the private health sector is also involved in delivering primary care (e.g., school health programs and civilian-military collaborations).
1.3 FINANCING THE NATIONAL HEALTH CARE SYSTEM
The health financing system of Vietnam is a multi-source system, involving funding from the government budget, foreign aid, social health insurance (compulsory and voluntary), Official Development Assistance, household direct payments for health services and “social mobilization.” In 2006, public financial resources (including government budget, social insurance and foreign aid [loans and grants coordinated by the government]) accounted for only 31.1 percent of the total health expenditure for the whole country. Despite efforts to increase public financing for health (government budget, external assistance and health insurance), household out-of-pocket (OOP) spending on health as a proportion of the total health expenditure of the entire society is still high, 60.8 percent (MOH 2006a), which is negatively affecting the goals of equity and efficiency. OOP spending is mainly for drugs, which accounts for 70 percent of total OOP spending; 18 percent is paid to private providers, and 12 percent is paid to public providers.
In recent years, the government has taken an important step toward improving equity and efficiency in the health care system by allocating funds to cover free health services for the poor (since 2003) and children under 6 years of age (since 2005). With such policies, government health spending should increase. According to MOH estimates, the share of government spending for health as a proportion of total health expenditure increased from 27.3 percent in 2003 to 28.8 percent in 2006. However, the share of the government budget for health as a proportion of total government expenditure declined, from 4.0 percent in 2003 to 3.6 percent in 2006.
Health insurance coverage has continued to expand in the last few years. However, revenue collection from health insurance schemes still has major challenges: (1) only a small share of those insured are contributing members of compulsory insurance; (2) low health insurance contribution levels; (3) adverse selection in the voluntary health insurance scheme. As a consequence, there is now a funding deficit from health insurance sources.
1.4 MAJOR POLICY AND LEGISLATIVE ACTIONS
The process of making health policy in Vietnam by law includes soliciting inputs from technical experts, civil society organizations, and health service users on legislation concerning health. Before implementation of any health policy, health strategy or health plan, implementation meetings are conducted at the national level, provincial level and, in many cases, also at district level, thus enabling people to have a voice not only at the policy development stage, but also immediately prior to implementation.
Policies and strategies are not synchronized; there is the lack of an overall policy framework to serve as a base for the development of specific health strategies and polices. The policy-making process has not been fully supported with adequate information and sound scientific evidence.
9
There is a shortage of policy experts within and outside the sector, essential for the policy-making process. Similarly, there are limited systems for the collection and analysis of information in a timely manner for the policy-making. There is, therefore, a lack of coordination between policy researchers and policymakers. Experience has shown that some policies are in need of immediate revision, as they no longer reflect the realities of implementation.
1.4.1 DECENTRALIZATION
Decentralization of management, one aspect of state management innovation, is taking place in personnel management, financial management and planning. Within decentralization of management, local authorities have been empowered with financial autonomy. The Law on the Budget of 2002 allows provinces to control their own budget allocations to the district and commune levels. Increased government spending for lower levels is deemed an outcome of the decentralization of management.
Devolving autonomy and accountability to social service institutions in terms of organization, rearrangement of administrative apparatus, and use of labor and financial resources was implemented by Government Decree 43, dated 25/04/2006, and is an important management decentralization measure. However, difficulties and limitations of the decentralization process include: (1) insufficient factors to ensure effectiveness of management decentralization in many localities, especially as regards organizational structure, management capacity and personnel. There are great challenges, particularly in poorer provinces; (2) autonomy has led to difficulties in most health facilities due to limitations in management capacity, accountability in management, and the management information system.
1.4.2 USER FEE EXEMPTIONS
The transition from a health system in which the Vietnamese government provided free health care to a system increasingly relying on OOP expenditures at the point of treatment has resulted in financial barriers that are preventing the poor and near poor from accessing health care. To strengthen the government’s response to this issue, Decision 139 of the Prime Minister of Vietnam in October 2002 established the Health Care Fund for the Poor (HCFP). The decision consolidated previous schemes for the poor, such as free health care cards, into one single scheme. The purpose of the HCFP is to provide free access to services and financial protection to all poor people who cannot afford to pay user fees at health facilities. Coverage includes drugs on the essential drug list, but not non-prescription drugs bought from vendors. Services offered by private providers were also not included in the scheme. Other health services such as TB Direct Observation Therapy, Short Course (DOTS) and antiretroviral drugs (ARVs) for treatment of HIV/AIDS cases are also provided free.
Both Ninh Binh and Can Tho provinces reported implementation of the fee exemption policies for the poor, near poor, children under 6, and elderly over 85. Provinces also implemented the exemption policy to provide free treatment for HIV/AIDS patients.
A recent World Bank evaluation of the impact of Decision 139 showed that it has increased the use of public provider services and reduced the risk of catastrophic spending, but has not had any significant impact on OOP spending (Wagstaff 2007).
Decree 46, issued by the Party Polit Buro in 2005, further mandated an increase in government expenditure on health care for the poor. It provides for the development of a universal insurance scheme by 2010. In order to achieve this objective, the decree has led to a series of other policy decisions such as a policy on the development of grassroots health care.
10
Decree 63, issued in 2006, consolidated beneficiaries covered by the HCFP (Decision 139) and expanded the scope of those who qualified for compulsory insurance. In addition, it increased their health benefits to include better coverage of high technology services, voluntary procedures, and coverage of health care services provided at private medical units (JAHR 2007).
1.4.3 LEGAL FRAMEWORK FOR PHARMACEUTICALS
Vietnam has a legal framework for pharmaceuticals. The National Drug Policy was issued under Government Resolution 37/CP in 1996 to ensure regular and sufficient supply of quality drugs for the population and rational and safe use of drugs. In 2002, the strategy for development of the pharmaceutical sector up to 2010 was approved by the Prime Minister. The overall objective of the strategy is to develop the pharmaceutical sector to become a leading economic-technology sector oriented toward industrialization and modernization. The National Assembly approved the Law on Pharmacy on June 14, 2005, establishing a legal framework for implementing given targets in the national policy on drugs. The Law contains stipulations on:
Pharmaceutical business
Registration and distribution of drugs
Traditional herbal medicines and drugs from pharmaceutical materials
Prescriptions and use of drugs
Drug information and advertisement of drugs
Provision of drugs in health facilities
Drug trials in clinical settings
Management of addictive drugs, mental health medications, radioactive materials
Standards for quality of drugs and drug quality assurance.
Under this legal framework, regulations on specific issues were formulated and issued. As a result of this framework, important references on pharmaceuticals have been developed and published. The Vietnamese Pharmacopoeia regulates national criteria for quality of drug and methods for drug quality assurance. This document has been updated regularly since 1971, and the latest version was printed in 2006. In 2002, the Vietnamese National Drug Formulary, an official document of guidelines for rational and safe use of drugs issued by the MOH, was published for the first time. The document provides important and accurate reference information on drugs for doctors before deciding on prescriptions and indications. The Major Drug List, a list of therapeutic drugs appropriate to the disease patterns in Vietnam, was developed by the Department of Therapy and disseminated by the MOH. The list has been revised and updated four times, with the 4th edition published in 2005. Hospitals use the list as a basis for choosing drugs to include in drug lists for different hospital departments and units. Also, the list is used as a reference for insurance reimbursement of health services. The Essential Drug List is the list of drugs that meet essential health care needs of the general population. This list is developed by the Drug Administration of Vietnam (DAV), approved by the Minister of Health, and supported by guidelines and recommendations of the World Health Organization (WHO). The list has been updated five times, with the 5th Edition published in July 2005. Essential drugs are drugs that must be available in each specific health facility, even in facilities without doctors. The essential drug list covers drugs used in the national target health programs, e.g., leprosy and TB treatment.

11
1.5 THE PRIVATE SECTOR
Development of the private health sector has been uneven. Private health clinics, which officially started operating in 1989, provide easier access to health services for those who can afford to pay. But in general, these facilities are small and have many issues that need to be addressed. By the end of 2006, there were 30,000 private clinics, 5 semi-public hospitals, 300 private regional general clinics and 87 maternity wards throughout the country. There are 49 private hospitals including 36 general hospitals (13 specialized hospitals) with 4,050 sick-beds (which is a low rate of 0.48 sick-beds per 10,000 people, and represents only 3 percent of all hospital beds).
The contribution of the private health sector to the provision of health services, especially for inpatient treatment, is very limited. In 2003, private health clinics provided up to 60 percent of outpatient services, but only 4 percent of inpatient services and about 10 percent of preventive health care services. Public health facilities provided 40 percent of outpatient services, 96 percent of inpatient services and 90 percent of preventive health care services (MOH 2003).
There is a serious imbalance in the distribution of private practitioners, with a large concentration in urban areas with higher living standards. There are also a large number of private practitioners without licenses, and up to 70 percent of the total number of private clinics are run by doctors who are also running the public health clinics. Only 26 percent of private clinics participate in primary health care activities when mobilized. Most private consulting rooms violate regulations that ban practitioners from selling drugs on their clinic premises. A phenomenon often seen at private clinics is the overuse or inappropriate use of drugs and advanced technologies, probably for financial benefit of the practitioners (MOH 2003). However, it must be noted that, unlike public facilities, private medical and pharmaceutical facilities are not entitled to benefit from the preferential treatment policy on capital loans, land and taxes.


13
2. INTRODUCTION
This is the first provincial health systems assessment to be conducted by a local organization with minimal external technical assistance. The HSPI collaborated with the USAID Health Systems 20/20 project to conduct a comprehensive assessment of two provincial health systems. The local team modified Health Systems 20/20 data collection instruments to suit the Vietnamese context. They organized and led all data collection efforts. An analysis framework was developed by the Health Systems 20/20 team, and the HSPI team conducted the data interpretation, analysis and report writing. The assessment activities performed by the HSPI allowed pilot testing of both the health system assessment tool in the Vietnamese context, as well as whether the tool is clear enough to be used by country teams, with minimal technical assistance.
2.1 NINH BINH AND CAN THO PROVINCES
As described in the methodology section, Ninh Binh and Can Tho provinces were selected for the assessment by the Advisory Committee based on predeterrmined criteria. Ninh Binh represents a more rural provincial area in the northern part of Vietnam, while Can Tho is an urbanized province in the south. Table 2 provides a brief overview of the two provinces.
TABLE 2. HIV/AIDS AND DEMOGRAPHIC STATISTICS.
Population GDP per capita
Percent of population
living in urban areas
Number of people living
with HIV
Ninh Binh 928,500 $1,409 13.6% 1,529 Can Tho 1,154,900 $1,122 49.8% 5,504 Vietnam 86,116,560 (total pop.) $2,600 (2007 est.) 27% 116, 565
Source: http://www.gso.gov.vn ; https://www.cia.gov/library/publications/the-world-factbook/geos/vm.html
14
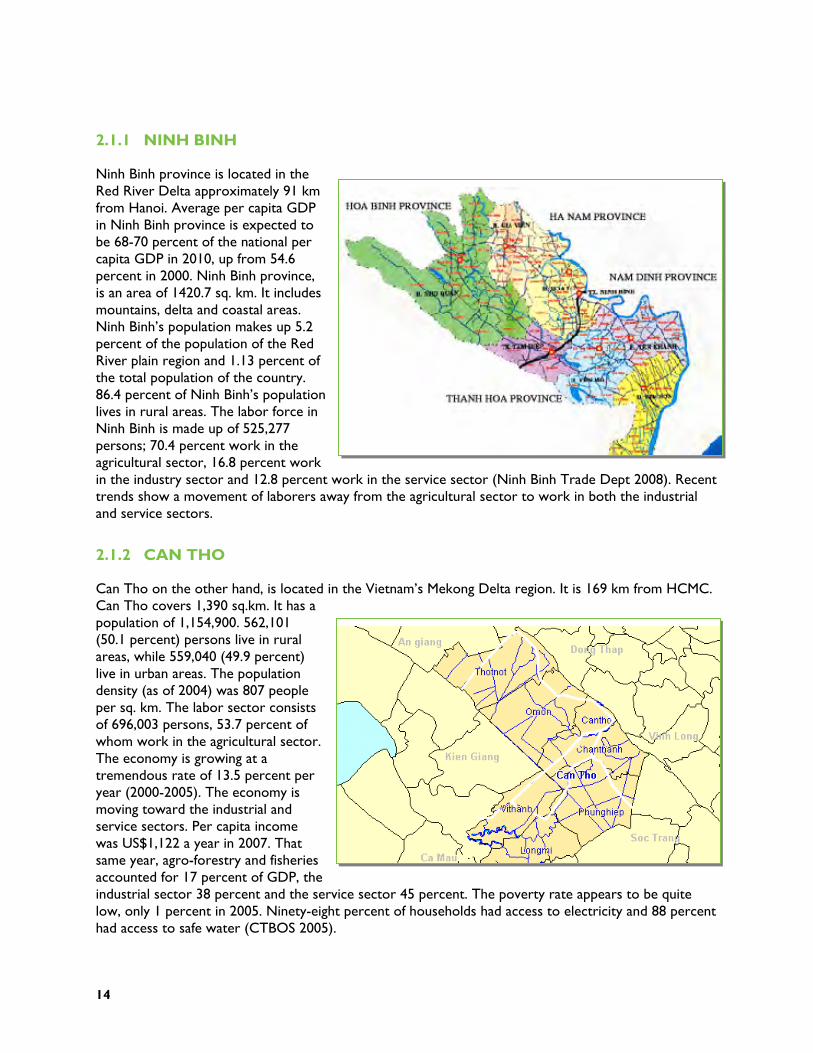
2.1.1 NINH BINH
Ninh Binh province is located in the Red River Delta approximately 91 km from Hanoi. Average per capita GDP in Ninh Binh province is expected to be 68-70 percent of the national per capita GDP in 2010, up from 54.6 percent in 2000. Ninh Binh province, is an area of 1420.7 sq. km. It includes mountains, delta and coastal areas. Ninh Binh’s population makes up 5.2 percent of the population of the Red River plain region and 1.13 percent of the total population of the country. 86.4 percent of Ninh Binh’s population lives in rural areas. The labor force in Ninh Binh is made up of 525,277 persons; 70.4 percent work in the agricultural sector, 16.8 percent work in the industry sector and 12.8 percent work in the service sector (Ninh Binh Trade Dept 2008). Recent trends show a movement of laborers away from the agricultural sector to work in both the industrial and service sectors.
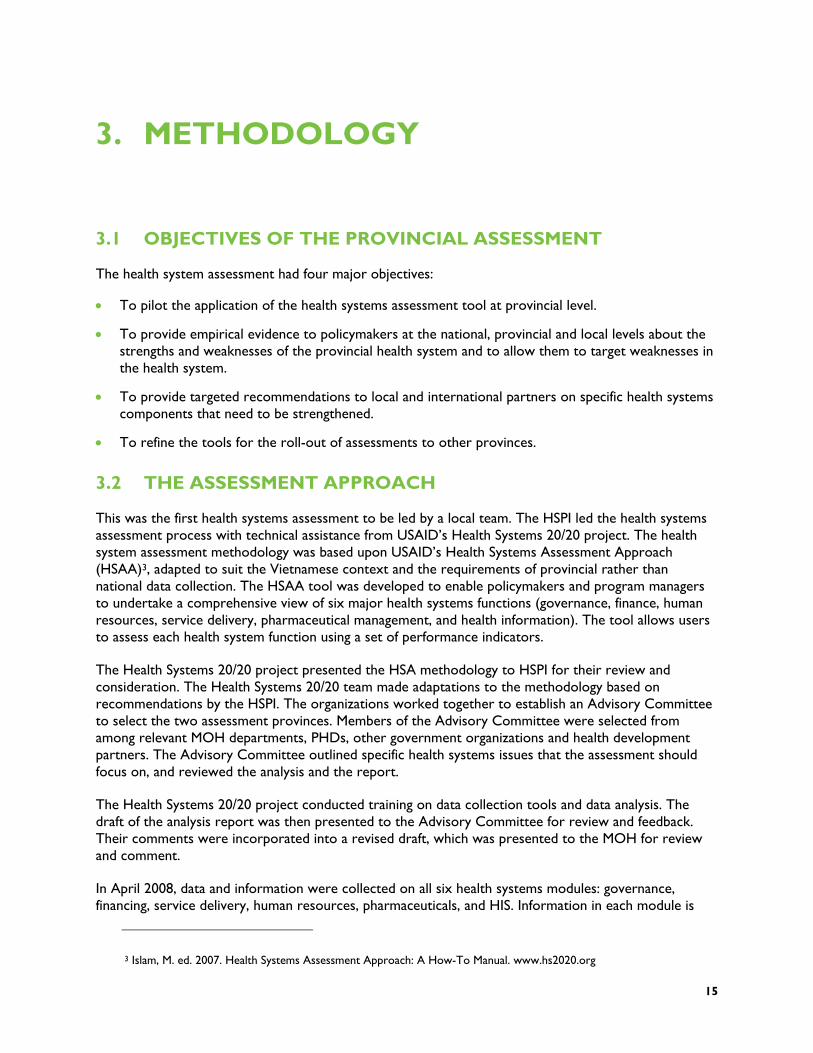
2.1.2 CAN THO
Can Tho on the other hand, is located in the Vietnam’s Mekong Delta region. It is 169 km from HCMC. Can Tho covers 1,390 sq.km. It has a population of 1,154,900. 562,101 (50.1 percent) persons live in rural areas, while 559,040 (49.9 percent) live in urban areas. The population density (as of 2004) was 807 people per sq. km. The labor sector consists of 696,003 persons, 53.7 percent of whom work in the agricultural sector. The economy is growing at a tremendous rate of 13.5 percent per year (2000-2005). The economy is moving toward the industrial and service sectors. Per capita income was US$1,122 a year in 2007. That same year, agro-forestry and fisheries accounted for 17 percent of GDP, the industrial sector 38 percent and the service sector 45 percent. The poverty rate appears to be quite low, only 1 percent in 2005. Ninety-eight percent of households had access to electricity and 88 percent had access to safe water (CTBOS 2005).
15
3. METHODOLOGY
3.1 OBJECTIVES OF THE PROVINCIAL ASSESSMENT
The health system assessment had four major objectives:
To pilot the application of the health systems assessment tool at provincial level.
To provide empirical evidence to policymakers at the national, provincial and local levels about the strengths and weaknesses of the provincial health system and to allow them to target weaknesses in the health system.
To provide targeted recommendations to local and international partners on specific health systems components that need to be strengthened.
To refine the tools for the roll-out of assessments to other provinces.
3.2 THE ASSESSMENT APPROACH
This was the first health systems assessment to be led by a local team. The HSPI led the health systems assessment process with technical assistance from USAID’s Health Systems 20/20 project. The health system assessment methodology was based upon USAID’s Health Systems Assessment Approach (HSAA)3, adapted to suit the Vietnamese context and the requirements of provincial rather than national data collection. The HSAA tool was developed to enable policymakers and program managers to undertake a comprehensive view of six major health systems functions (governance, finance, human resources, service delivery, pharmaceutical management, and health information). The tool allows users to assess each health system function using a set of performance indicators.
The Health Systems 20/20 project presented the HSA methodology to HSPI for their review and consideration. The Health Systems 20/20 team made adaptations to the methodology based on recommendations by the HSPI. The organizations worked together to establish an Advisory Committee to select the two assessment provinces. Members of the Advisory Committee were selected from among relevant MOH departments, PHDs, other government organizations and health development partners. The Advisory Committee outlined specific health systems issues that the assessment should focus on, and reviewed the analysis and the report.
The Health Systems 20/20 project conducted training on data collection tools and data analysis. The draft of the analysis report was then presented to the Advisory Committee for review and feedback. Their comments were incorporated into a revised draft, which was presented to the MOH for review and comment.
In April 2008, data and information were collected on all six health systems modules: governance, financing, service delivery, human resources, pharmaceuticals, and HIS. Information in each module is
3 Islam, M. ed. 2007. Health Systems Assessment Approach: A How-To Manual. www.hs2020.org
16
divided into system components and then subdivided by indicators within those components. The indicators were scored on a scale of 1-3, with 1 being “not adequate”, 2 being “adequate” and 3 being “highly adequate.” Scoring is based on a defined set of criteria for each indicator. Definitions of what is not adequate, adequate, or highly adequate varied by indicator. Scoring sheets and indicator definitions are included in Annex B and C.
The HSPI completed the analysis in four stages.
1. Tabulation of data from interviews with key respondents and review of documents was completed using Microsoft Excel-based data entry sheets . The purpose of this step was to organize the data in ways that would facilitate rapid access and analysis.
2. The performance of each health system indicator was scored using the 3-point scale of pre-defined criteria (see Annex B). System function scores were disaggregated by level of care (central, provincial, district, community). The purpose of this step was to provide an analysis of the strengths and weaknesses of each system function. Scores for each health system function were summarized and averaged to show trends (for detailed tables refer to Annex B).
3. The strengths and weaknesses of each systems function (governance, financing, human resources, etc.) were reviewed based on the combined scores for each component.
4. Next the analysis looked at the system as a whole based on WHO’s five health system performance criteria: equity, access, efficiency, quality, and sustainability. The purpose of this step was to show how the various health system functions operate in relation to one another vis a vis the goals of the health sector as a whole. Select indicators from each functional area (governance, human resources, financing, etc.) were combined to score each performance criteria across the system as a whole.
There were several limitations to the assessment methodology. First, this was the first pilot test of the HSA tool in Vietnam. Second, local circumstances were not always clearly measured or represented by universal indicators. The analysis was conducted based on the existing health systems assessment indicators. Third, the analysis ends with an evaluation of the system based on WHO’s five system performance criteria. The indicators used to represent each of the performance criteria were selected based on the assessment team’s best judgment. The current tool does not prescribe which indicators from the health systems functions should be used to represent each of the five performance criteria. The analysis should be expanded further to include a health outcome-based evaluation. Other assessment limitations include: the limited number of facilities sampled within each province; the potential for respondent bias; limited data availability; and the newness of methodology.
17
4. FINDINGS
The findings are organized and presented in six sections according to the health system functions: governance, health financing, health service delivery, human resources, pharmaceutical management and HIS. Each section provides a brief description of the components, followed by a brief description of strengths and weaknesses of individual components, and how they impact the performance of the sub-health system within the two provinces studied, Ninh Binh and Can Tho.
4.1 GOVERNANCE
4.1.1 COMPONENTS AND INDICATORS
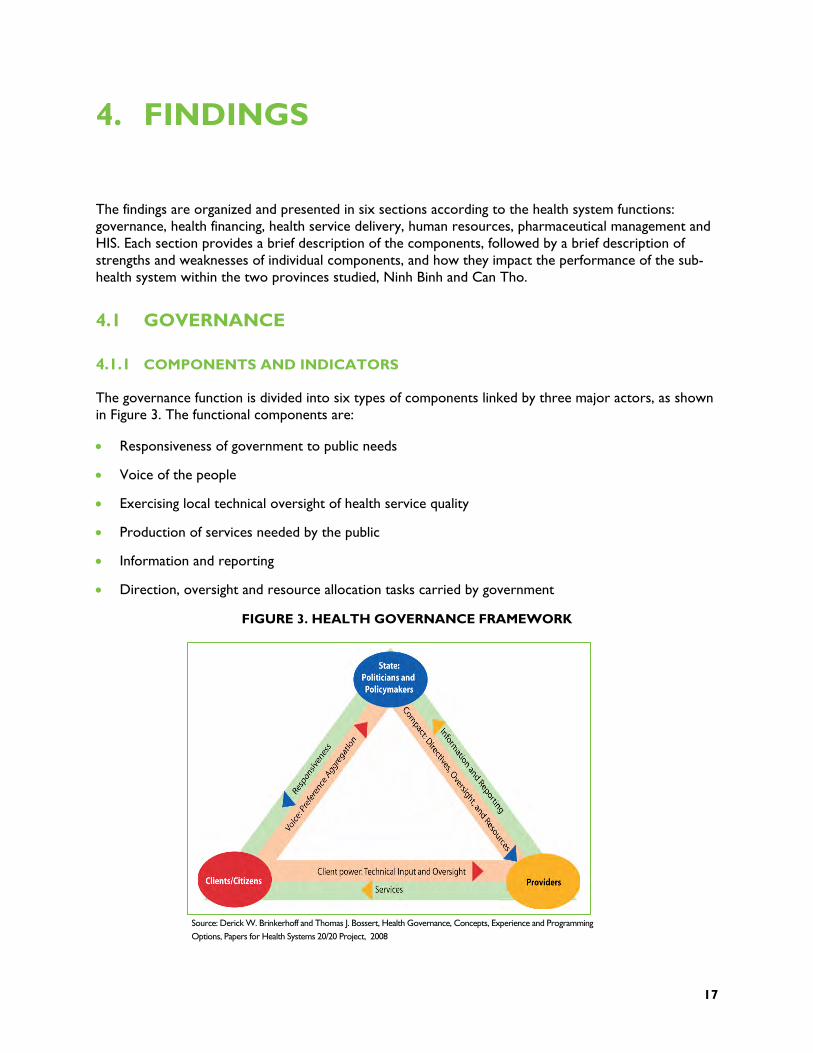
The governance function is divided into six types of components linked by three major actors, as shown in Figure 3. The functional components are:
Responsiveness of government to public needs
Voice of the people
Exercising local technical oversight of health service quality
Production of services needed by the public
Information and reporting
Direction, oversight and resource allocation tasks carried by government
FIGURE 3. HEALTH GOVERNANCE FRAMEWORK
Source: Derick W. Brinkerhoff and Thomas J. Bossert, Health Governance, Concepts, Experience and Programming Options, Papers for Health Systems 20/20 Project, 2008
18
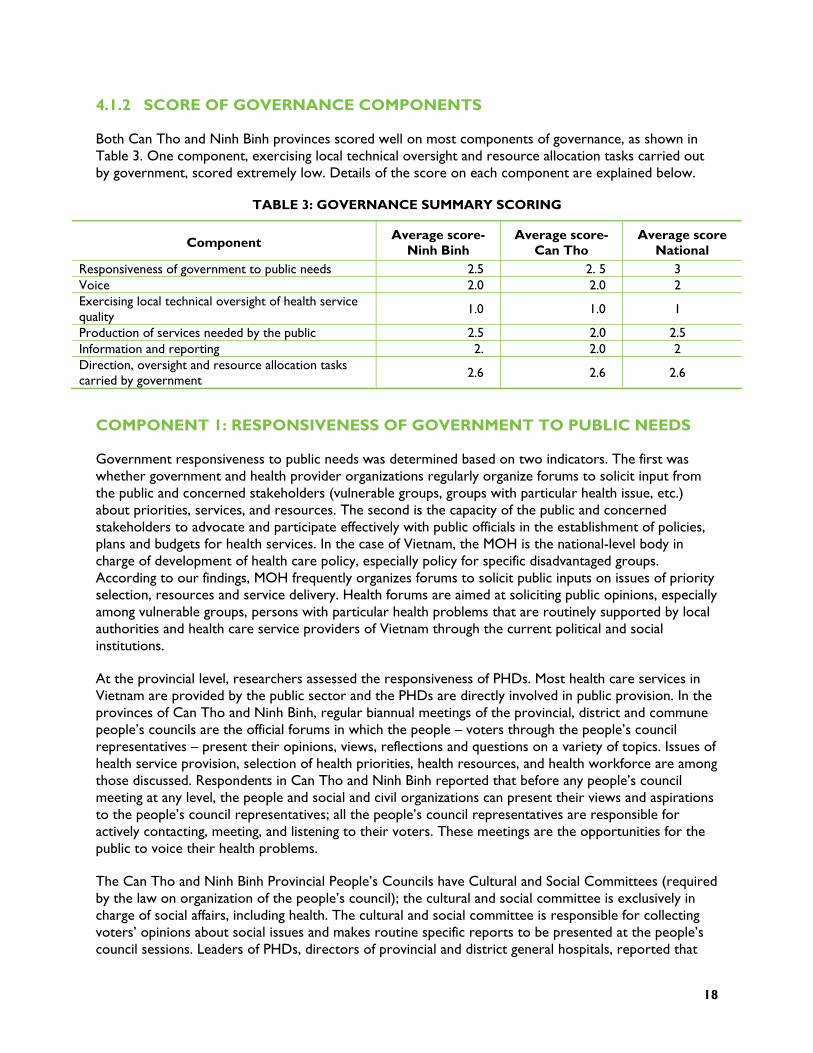
4.1.2 SCORE OF GOVERNANCE COMPONENTS
Both Can Tho and Ninh Binh provinces scored well on most components of governance, as shown in Table 3. One component, exercising local technical oversight and resource allocation tasks carried out by government, scored extremely low. Details of the score on each component are explained below.
TABLE 3: GOVERNANCE SUMMARY SCORING
Component Average score- Ninh Binh
Average score- Can Tho
Average score National
Responsiveness of government to public needs 2.5 2. 5 3 Voice 2.0 2.0 2 Exercising local technical oversight of health service quality
1.0 1.0 1
Production of services needed by the public 2.5 2.0 2.5 Information and reporting 2. 2.0 2 Direction, oversight and resource allocation tasks carried by government 2.6 2.6 2.6
COMPONENT 1: RESPONSIVENESS OF GOVERNMENT TO PUBLIC NEEDS
Government responsiveness to public needs was determined based on two indicators. The first was whether government and health provider organizations regularly organize forums to solicit input from the public and concerned stakeholders (vulnerable groups, groups with particular health issue, etc.) about priorities, services, and resources. The second is the capacity of the public and concerned stakeholders to advocate and participate effectively with public officials in the establishment of policies, plans and budgets for health services. In the case of Vietnam, the MOH is the national-level body in charge of development of health care policy, especially policy for specific disadvantaged groups. According to our findings, MOH frequently organizes forums to solicit public inputs on issues of priority selection, resources and service delivery. Health forums are aimed at soliciting public opinions, especially among vulnerable groups, persons with particular health problems that are routinely supported by local authorities and health care service providers of Vietnam through the current political and social institutions.
At the provincial level, researchers assessed the responsiveness of PHDs. Most health care services in Vietnam are provided by the public sector and the PHDs are directly involved in public provision. In the provinces of Can Tho and Ninh Binh, regular biannual meetings of the provincial, district and commune people’s councils are the official forums in which the people – voters through the people’s council representatives – present their opinions, views, reflections and questions on a variety of topics. Issues of health service provision, selection of health priorities, health resources, and health workforce are among those discussed. Respondents in Can Tho and Ninh Binh reported that before any people’s council meeting at any level, the people and social and civil organizations can present their views and aspirations to the people’s council representatives; all the people’s council representatives are responsible for actively contacting, meeting, and listening to their voters. These meetings are the opportunities for the public to voice their health problems.
The Can Tho and Ninh Binh Provincial People’s Councils have Cultural and Social Committees (required by the law on organization of the people’s council); the cultural and social committee is exclusively in charge of social affairs, including health. The cultural and social committee is responsible for collecting voters’ opinions about social issues and makes routine specific reports to be presented at the people’s council sessions. Leaders of PHDs, directors of provincial and district general hospitals, reported that
19
they were invited to attend sessions of the provincial and district people’s councils meetings to listen to people’s opinions regarding health problems. Local authorities responded to proposals from the people and health service providers as much as possible.
Provincial- and district-level hospitals in Can Tho and Ninh Binh also hold discussion forums between patients, patient’s families and leaders of clinical departments to solicit client feedback. Meetings of department-specific patient committees occur once a week and of the entire-hospital patient committee once a month. During the meetings, issues of quality of care, attitudes of patients, and proposals of patients are discussed with leaders of the department and hospital. According to the hospital directors interviewed, opinions from the patients help them understand the situation and issues to be addressed, as well as services to be supplemented and developed.
Apart from the above institutions, the people and local health service providers also have opportunities to discuss and prioritize health issues through other social organizations (meetings of the Farmer’s Association, Women’s Union, Youth Union) and other health events (the Vietnamese Physician Day). There are many forums where local authority and health care providers discuss and absorb opinions on the development of a health care system with a view to attaining the objective of equity and efficiency. In fact, these types of forum are done very well in Can Tho city and Ninh Binh province.
COMPONENT 2: VOICE
The voice component of governance was measured in two ways. First, the team looked at the influence of technical experts, civil society organizations and health service users on legislation concerning health. Second, they observed the opportunities of the public, technical experts, and local communities to provide inputs into the development of priorities, strategies, plans and budgets.
Annual review meetings of the health plan and health budgets are held at different levels of care and act as forums for the public, technical experts, specific groups and other key stakeholders to express their opinions. The annual planning of the health budget at the national and provincial levels involves many stakeholders. Selection of priorities and health strategy development is largely a central government responsibility and local communities have only limited participation.
In-depth interviews and group discussions in Can Tho and Ninh Binh indicated that community-level opinions and expertise are mainly solicited during policy implementation. Development of policy is actually concentrated at the provincial-level people’s councils, which discuss the allocation of budget for local health.
One of the prominent health policies aimed at improving health care for the people in Vietnam is the policy on subsidized (free) health care for the poor and free health care for children under 6 years old. The provincial health care fund for the Poor Management Board is responsible for monitoring and supervising health care provision for the poor and eliminating any form of discrimination in health care for the poor. Consultations and discussions with people from the eight districts of Can Tho and Ninh Binh indicated that the process of selecting and reviewing the poor for eligibility for the policy, including health insurance, has been implemented with active involvement of communities and the public.
It is important to note that these policy development processes fit with the characteristics of decentralization in Vietnam. Human resources management is decentralized to the provincial level, but the development of national policy is the responsibility of central agencies. Health policies, strategies and guiding documents are developed at central level, after obtaining opinions from central or regional forums and comments from local people’s committees and leaders of PHDs. The procedure of
20
development, implementation and amendment of policies in a decentralized system such as Vietnam ensures the consistency of the policy development within a country. On the other hand, it also slows the pace of policy adjustment; as a consequence, policy adjustment could be delayed and affect the performance of the health system.
COMPONENT 3. EXERCISING LOCAL TECHNICAL OVERSIGHT OF HEALTH SERVICE QUALITY
The capacity of clients/the public to oversee the health service quality component of governance examined whether there are government, voluntary and private organizations that oversee the way provider organizations follow protocols, standards and codes of conduct in regard to medical malpractice, unfair pricing patterns, discrimination against clients etc.
The findings showed that while there is a strong government system that monitors and supervises provider organizations, responsibility and practice of community institutions and civil society are not clear in oversight of health service quality. Therefore, according to the scoring criteria, this component was given a score of not adequate, meaning that “only government institutions and organizations provide oversight for quality of service delivery.”
Supervision of the performance of health care facilities in terms of the clinical or care pathway is the responsibility of the PHDs of Can Tho and Ninh Binh. Interviews showed that each PHD has functional divisions such as the Medical Professional Affairs Division, Pharmaceutical Professional Affairs Division, Finance and Accounting Division and Health Inspectorate; their tasks are to ensure that all health care facilities (public and private) follow the rules and procedures of medical ethics. These divisions take regular and unplanned supervisory trips to health facilities. However, they have limited staff and financing sources for supervision. As discussed in the service delivery section, the department of health (DOH) budgets for supervisory visits and monitors quality of care four times per year. The DOH also receives monthly quality reports from the district hospitals.
All hospital directors interviewed during data collection mentioned a meeting of hospital managers with representatives of the Council of Patients.4 The meetings with hospital managers, held regularly in all hospitals, create opportunities for patients to raise issues about service efficiency and quality. Council meetings, along with other activities (semi-annual meeting of hospital directors with People Councils) contribute to improvement of performance and quality of health care according to the needs of the public.
COMPONENT 4: PROVISION OF SERVICES NEEDED BY THE PUBLIC
The health system’s ability to produce services needed by the public was examined using two indicators. The first was whether health services are organized and financed in ways that offer incentives to public, NGO, and private providers to improve performance in the delivery of health services; second, whether the public or concerned stakeholders have regular opportunities to meet with managers (directors) of health service organizations (hospitals, health centers, clinics) to raise issues about service efficiency or quality.
4 The Council of Patients is an organization, established in all public hospitals, consisting of patients who represent hospitalized patients.
21
This component scored quite well, receiving a score of better than adequate. This is largely due to the recent hospital autonomy policy (Government Decree 43/2005) being implemented in all public hospitals. The policy aims to improve public hospital performance.
COMPONENT 5: INFORMATION AND REPORTING
The information and reporting segment of the governance function looked at issues such as whether policies and plans were evidence based, the impact of using evidence to improve program results, and the availability of information on allocation and utilization of resources. Results showed that this component is functioning “adequately” at both national and provincial levels of the health system. Formulation of evidence-based health care policies has gradually been implemented in Vietnam. The use of background research as evidence for policy formulation is compulsory.
Vital statistics, disease patterns and health care service provision data are collected from individual health facilities and reported quarterly (for most health indicators) or monthly (for some indicators in the national target programs). Important epidemiological statistics are collected and processed to produce weekly reports and even daily reports (such as SARS pandemics). Every year, the health statistical yearbook is produced and distributed to relevant stakeholders and organizations, especially to agencies responsible for planning, budgeting, management, and research. NHA and data of the Vietnam National Health Survey are also available. All of these documents have become important tools for the formulation of health care policies and plans.
In Can Tho and Ninh Binh, annual health planning and budgeting relies on the local epidemiological reports, population, and socioeconomic conditions. Hospital leaders adjust their plans for hospital development and service provision according to the statistics. For instance, based on the number of head injury cases in the province, Ninh Binh general hospitals decided to procure CT scanners and train neurology surgeons to diagnose and treat patients right in the province, not send them to Hanoi as they had done in the past. The result was that in 2007, only 200 cases of head injuries were transferred to Hanoi, while over 2,000 cases per year had been sent to Hanoi in previous years.
While the public sector has standardized reporting requirements and data usage, private health sector data in Can Tho and Ninh Binh are insufficient. Vital statistics, especially data on causes of death in the community, are not complete. In addition, there is a lack of well-trained staff in health statistics, particularly in Can Tho. The MOH and leaders of the PHD also expressed their wish to better organize the health information system (HIS), investing more to strengthen the system capacity, especially the development of information technology (IT) applications. In the provision of health services in the private sector, there is no report of expenditure analysis.
Results from in-depth interviews with leaders of the PHD and People’s Council of Can Tho and Ninh Binh indicated that the annual financial report is prepared by the health sector and sent to the PPC; the provincial people’s council can access this report as needed. The PPC and council of these two provinces are mainly interested in hospital autonomy, level of hospital user fees charged, and health care for the poor. There was no interest in analysis of other aspects of health financing issues. Audits of health care expenditure in the public system are conducted regularly in these two provinces but audit reports are not made available to the public for discussion and comment.
22
COMPONENT 6: DIRECTION, OVERSIGHT AND RESOURCE ALLOCATION TASKS CARRIED BY GOVERNMENT
Component 6 examined the governance relationship, including direction, oversight and resource allocation tasks, between the government and health providers. Specifically, the assessment collected information on standardized protocols for certification, issues of non-compliance with protocols, procedures for investigating possible misuse of resources, procedures to address inequities and bias within the system, and oversight of health providers by non-government organizations (NGOs). In general, the system appeared highly adequate. Only the oversight of health providers by NGOs was evaluated as “not adequate.”
There are a number of government regulations on conditions and criteria for health care practice, one of which is the law governing private medical and pharmaceutical practice. In both Can Tho and Ninh Binh, the PHD is responsible for licensing new health professionals, accreditation of health facilities, and renewing licenses. Licensing and accreditation procedures are enforced according to regulations. The division of health inspection, division of medical practice and pharmaceutical practice of the PHD5 are responsible for monitoring and supervision of health professionals in terms of compliance with regulations, protocols, standards and codes. Lack of adequate human and financial resources is one of the constraints with monitoring and supervision of activities.
There is a comprehensive mechanism to help providers and clients when regulations, standards and codes of conduct are not complied with from the national level to provincial level. The organizations are mainly governmental, due to the political system of Vietnam. At the national level, as well as in Ninh Binh and Can Tho provinces, inspection bodies (sector inspection bodies, such as health inspection, finance inspection and central, provincial, governmental inspection organizations) and provincial procurator’s offices investigate any misallocation or misuse of resources for health care. Those bodies follow procedures for reporting and investigation. The public is aware of their rights to use these procedures.
The most important political organization that the public, social organizations, service providers and relevant organizations can access to reflect the actual implementation of the policy and propose measures for improvement is the Committee for Social Affairs of the National Assembly. This committee actively supervises implementation of pro-poor health policies and policy on health care for vulnerable groups. One of the most recent activities of the committee was the supervision of the implementation of new Health Insurance Regulations (Decision 63, in 2006), including conducting a series of forums to exchange information with social organizations and technical experts on the Health Insurance Bill.
Apart from the Committee for Social Affairs of the National Assembly, the Provincial People’s Council in Can Tho and Ninh Binh and the PHD are the institutions that facilitate the public, mass organizations (such as Farmer’s Association, Veteran Association and Women’s Union, etc.) to reflect and suggest measures to ensure equity in accessing health care. National mass media as well as local television, radio and printed press of Can Tho and Ninh Binh are the important channel of communication for related agencies to raise their voice over the better implementation of equity in health care.
The media in Vietnam play an active role in the oversight of provider organizations. Enabled by the Law of Media, national and local newspaper, television and radio have access to health facilities and they provide the public with information, comments and suggestions on issues related to quality of health
5 In Vietnamese: Thanh tra y tế, Phòng Nghiệp vụ y và Phòng nghiệp vụ Dược

23
services as well as allocation and usage of financial resources. In the Vietnam context, the media are of course governmental.
There are a number of civil society organizations in Vietnam, such as the Vietnam Medical Association, Vietnam Pharmaceutical Association, and Vietnam Association of Cardiologists, but none of these organizations are actively involved in oversight of health care providers. Red Cross Associations are in a similar situation. Other mass organizations such as the Women’s Association, Vietnam Farmers Association, and Youth Union, are also not involved directly in oversight of health providers.
24
4.2 HEALTH FINANCING
This section presents three components of the health financing system: revenue collection, pooling and allocation of financial resources, and purchasing. Each component is measured by a number of indicators. Overall, the health financing function was found to be relatively adequate. The purchasing and provide payments component of health financing in particular, appeared slightly below adequate. The summary scoring information is presented by component in Table 4 and details of the scoring are presented in Annex B.
TABLE 4: FINANCING SUMMARY SCORING
Component Average score-
Ninh Binh
Average score-
Can Tho
Average score-
National Revenue collection: amount and sources of financial resources
2.5 2.25 2.42
Pooling and allocation of financial resources: government budget formulation and allocation
1.83 2.0 2.0
Purchasing and provider payments 1.8 1.8 2.0
COMPONENT 1: REVENUE COLLECTION
Revenue collection for health is the basic and most important function of the health financing system, to guarantee adequate fiscal conditions in which to perform basic functions of health service provision. Revenue collection was examined using indicators including total expenditure on health as a percentage of GDP, per capita total health expenditure, government expenditure on health as a percentage of total government expenditure, government spending on health as a percentage of total health expenditure, donor spending on health as a percentage of total health spending, and OOP spending as a percentage of total expenditure on health. Overall, this component scored slightly better than “adequate.”
Total expenditure on health as a proportion of GDP nationally has increased moderately, from $524 (2000) to $644 (2006).6 Resources are available at the national level to ensure access to basic health care for the entire population and increase access to health care services for vulnerable groups. In Ninh Binh, total expenditure on health as a proportion of GDP has been decreasing since 2005, from 13.4 percent in that year to 9.8 percent in 2007.7 In Can Tho, total expenditure on health as a proportion of GDP seems to have been more stable than in Ninh Binh but the proportions are lower.
In terms of total health sector resources per capita, the national health financing system of Vietnam has grown rapidly, from a very low level of health financing (US$26 per capita in 2003 to US$45 per capita in 2006 (MOH 2006a). However, a major share of total resources continues to come from household OOP payments (accounts for 60.8 percent).
6 5,24 (2000); 5,58 (2001); 5,13 (2002); 5,22 (2003); 5,52 (2004); 5,91 (2005); 6,44 (2006) – NHA, 2000-2006 7 13,4 (2005); 9,6 (2006); 9,8 (2007) – Financial report of Ninh Binh province, 2007

25
FIGURE 4. TOTAL HEALTH SPENDING PER CAPITA, 2000 TO 2006 (UNIT: US$ (2006 PRICES)
Source: MOH, National Health Accounts 2000-2003 and estimated data for 2004- 2006
Comparing this figure with the expenditure level suggested in the scoring tool, per capita expenditures are more than US$30 and spending trends are closing the gap to meet the US$34 target, we can say that total health expenditure per capita in Vietnam is highly adequate. Reliable data on household OOP payment at provincial level is unavailable.
Government expenditure on health as percentage of total government expenditure is decreasing, dropping from 3.2 percent in 2000 to 2.81 percent in 2004.8 However, in absolute terms, government expenditure on health is increasing in comparison with previous years.9 In addition, there is a high commitment from the government in terms of increasing the budget for the health sector (according to Resolution 18/2008/NQ-QH12), providing free health care for the poor as well as other vulnerable groups, and providing financial support for the near poor to buy health insurance. The percentage of government spending on health compared to total government expenditure has changed little over the past three years in Ninh Binh and Can Tho provinces .10
Government spending is 40 percent of the total health expenditure.11 OOP expenditure remains high. In Ninh Binh, government expenditures on health compared to total health expenditure are above 40 percent,12 OOP expenditures are moderate and coverage is high (including for preventive care as well as for vulnerable groups). Similar to Ninh Binh, government expenditures on health in Can Tho are above 40 percent13; OOP expenditures are moderate. However, coverage is also moderate. Percentage of OOP expenses is lower in Ninh Binh than Can Tho province. This is understandable because the
8 3,2 percent in 2000, 3,77 percent in 2001, 3,78 percent in 2002, 2,96 percent in 2003 and 2,81 percent in 2004. NHA, 2000-2006 9 4,37 percent (2000); 6,60 percent (2001); 7,30 percent (2002); 8,40 percent (2003); 9,40 percent (2004). NHA, 2000-2006 10 In Ninh Binh: 2,6 percent (2005), 2,5 percent (2006), 2,8 percent (2007); In Can Tho: 3,6 percent (2005), 2,5 percent (2006), 2,8 percent (2007). Provincial financial reports, 2007. 11 25,43 percent (2000); 27,28 percent (2001); 25,60 percent (2002); 27,25 percent (2003); 23,14 percent (2004); 21,74 percent (2005); 28,77 percent (2006). NHA, 2000-2006 12 58,9 percent (2005); 57,5 percent (2006); 58,9 percent (2007). Province Financial report of Ninh Binh. 2007 13 44,3 percent (2005); 50,3 percent (2006); 50,3 percent (2007). Province Financial report of Ninh Binh. 2007
2832 31 31 33
39
46
0
10
20
30
40
50
2000 2001 2002 2003 2004 2005 2006
US$
26
proportion of the poor in Ninh Binh is higher than in Can Tho and they are eligible for the national health insurance scheme.
Despite the increase in the number of development partners in Vietnam, the percentage of donor spending on health compared to total national health spending is moderately declining and government dependence on donor funds for health services is declining as well, down from 2.67 percent in 2000 to 2.33 percent in 2006.14 In Ninh Binh, the percentage of donor spending on health is very small (only .33 percent in 2007) and local government does not depend on donor funds for health services15.
COMPONENT 2: POOLING AND ALLOCATION OF FINANCIAL RESOURCES
Risk pooling is another basic function of the health financing system. Risk pooling is the collection and management of financial resources so that large unpredictable individual financial risks become predictable and are distributed among all members of the pool. Risk pooling in Vietnam is implemented primarily through pooling of tax revenues to provide government subsidies for health care and social health insurance, which together account for 90 percent of public health spending [NHA, 2004-2006]. A large number of indicators were used to examine the pooling and allocation component of public health financing. An example of the indicators used (see Annex B for full listing) are: MOH budget trends, the process of MOH and province budget formulation, central and local government budget allocations for health in decentralized systems, percentage of government health budget spent on health worker salaries, training, medicines and supplies, other recurrent costs, and percentage of government health budget spent on curative/ preventive care. Overall, pooling and allocation of resources were found to be “adequate” in both assessment provinces.
HEALTH INSURANCE
As discussed in the background section, 14.6 million poor people were given centrally funded compulsory health insurance in 2006. In addition, non-commercial voluntary health insurance schemes organized by the VSS cover many additional target groups. Around 41 percent of the population are covered by these two types of health insurance (JAHR 2007). The health insurance schemes have encountered several challenges. Of the 34 million people with insurance only 6.2 percent are paying a health insurance premium. In addition, the premiums are set too low (US$8) to cover average health expenditure per capita of US$45. The national insurance schemes also suffer from adverse selection. Near-poor persons with illnesses are more likely to enroll than healthy individuals. The National Health Insurance scheme, as of 2006, was overspent by US$75 million (JAHR 2007). If overspending is not brought under control, it threatens the sustainability of national health insurance scheme.
Commercial private insurance coverage is growing in Vietnam, with 5.6 million life insurance contracts started in 2006 (JAHR 2007). However, formal data on the commercial health insurance situation are not yet available.
BUDGETARY PROCESS IN VIETNAM
Proper coordination between the Ministry of Planning and Investment (MPI) and Ministry of Finance (MOF) is central to the efficiency of planning the budgeting process. The 2002 State Budget Law outlines
14 2,67 percent (2000); 2,74 percent (2001); 3,43 percent (2002); 2,72 percent (2003); 2,23 percent (2004); 2,43 percent (2005); 2,33 percent (2006). NHA, 2000-2006 15 0,20 percent (2005); 0,16 percent (2006); 0,33 percent (2007). Province Financial report of Ninh Binh. 2007

27
the duality inherited in the two institutions in central planning. Therefore, provincial governments and line ministries send their financing requests to both MPI and MOF. The MPI is responsible for the allocation of the investment budget whereas the MOF is in charge of budget allocation for recurrent expenditures. The two ministries also support each other in their responsibilities.
Budgets are created from the district level up. In June every year, health facilities/units draft budgets based on the previous year’s expenses and submit them to their local finance unit. After being aggregated, these budget estimates are sent to the local People’s Council for approval. Budget estimates are aggregated up through the levels of the health system, by each finance unit. At the central level, the MOF receives estimates from specific ministries and provinces then synthesizes them. Synthesized expense estimates are compared with revenue collection estimates in order to balance budgets with the available financial resources.
Although the budgeting process is completed from the district-level facilities up, requested budgets are rarely approved by MOF because of limited revenues available for allocation. In addition, the budgets are not developed based on estimates of resources required to meet the population’s health needs. Rather, they are based on the size of the health workforce and population. Vietnam is applying per capita-based budget allocation with prioritized coefficient for mountainous and island areas as stated in the Decision 151/2006/QD-TTg of the Prime Minister on expenditure norm for health. Hospital budgets rely on a bed-based budget allocation system. Provinces receive funds according to population size and then allocate them among provincial facilities according to their number of planned beds. For outpatient facilities, the budget allocations are based on the number of staff.
At the national level, budgets are mainly historically based and centrally formulated, taking into account health priority areas as well as availability of revenue. Government subsidies to health budgets are not performance based. Central government allocations may also be earmarked for specific health programs.
In both Ninh Binh and Can Tho, budgets are historically based and include local service delivery requirements as well as availability of revenue. Within the decentralized system, local governments are responsible for securing and allocating a portion of their finances. Local governments have an incentive to add somewhat to their resources, but this is not feasible in all regions and districts. The budget approval process is not based on transparent criteria, but depends largely on availability of revenue that year. At the local level, the local government (People’s Council, People’s Committee) has some discretion in the allocation of funds for preventive and curative care and to each facility, although normally funds are allocated based on the number of beds or number of staff members, using line-item budgets and the annual plan.
Ninh Binh and Can Tho provinces differ significantly in the way their funding is allocated. In Ninh Binh, the local government does not allocate funds proportional to local needs (not adjusted for differing disease patterns or abilities to absorb funds) and has no means to obtain additional resources. Health officers in Ninh Binh explained that: “Revenue for health in Ninh Binh is limited, it is mainly from the government budget. The province has no mechanism to mobilize financial resources for health.” In Can Tho, on the other hand, the local government allocates funds proportional to local needs (disadvantaged areas receive a higher proportion of the budget) as well as ability to absorb funds and they have means to add resources.
There are disparities in health budget allocations for different levels of the health care system. Out of the government health budget, the budget allocation for the commune level accounts for only about 2.8-5 percent (see Table 5.)
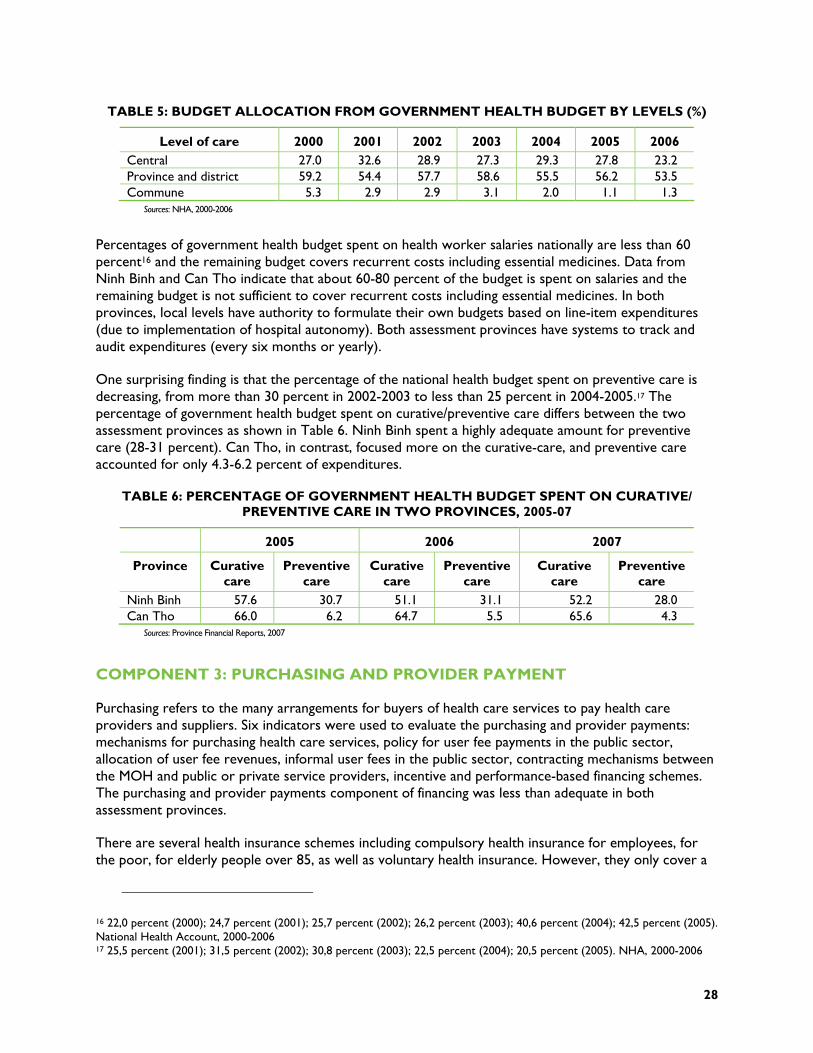
28
TABLE 5: BUDGET ALLOCATION FROM GOVERNMENT HEALTH BUDGET BY LEVELS (%)
Level of care 2000 2001 2002 2003 2004 2005 2006 Central 27.0 32.6 28.9 27.3 29.3 27.8 23.2 Province and district 59.2 54.4 57.7 58.6 55.5 56.2 53.5 Commune 5.3 2.9 2.9 3.1 2.0 1.1 1.3
Sources: NHA, 2000-2006
Percentages of government health budget spent on health worker salaries nationally are less than 60 percent16 and the remaining budget covers recurrent costs including essential medicines. Data from Ninh Binh and Can Tho indicate that about 60-80 percent of the budget is spent on salaries and the remaining budget is not sufficient to cover recurrent costs including essential medicines. In both provinces, local levels have authority to formulate their own budgets based on line-item expenditures (due to implementation of hospital autonomy). Both assessment provinces have systems to track and audit expenditures (every six months or yearly).
One surprising finding is that the percentage of the national health budget spent on preventive care is decreasing, from more than 30 percent in 2002-2003 to less than 25 percent in 2004-2005.17 The percentage of government health budget spent on curative/preventive care differs between the two assessment provinces as shown in Table 6. Ninh Binh spent a highly adequate amount for preventive care (28-31 percent). Can Tho, in contrast, focused more on the curative-care, and preventive care accounted for only 4.3-6.2 percent of expenditures.
TABLE 6: PERCENTAGE OF GOVERNMENT HEALTH BUDGET SPENT ON CURATIVE/ PREVENTIVE CARE IN TWO PROVINCES, 2005-07
2005 2006 2007
Province Curative care
Preventive care
Curative care
Preventive care
Curative care
Preventive care
Ninh Binh 57.6 30.7 51.1 31.1 52.2 28.0 Can Tho 66.0 6.2 64.7 5.5 65.6 4.3
Sources: Province Financial Reports, 2007
COMPONENT 3: PURCHASING AND PROVIDER PAYMENT
Purchasing refers to the many arrangements for buyers of health care services to pay health care providers and suppliers. Six indicators were used to evaluate the purchasing and provider payments: mechanisms for purchasing health care services, policy for user fee payments in the public sector, allocation of user fee revenues, informal user fees in the public sector, contracting mechanisms between the MOH and public or private service providers, incentive and performance-based financing schemes. The purchasing and provider payments component of financing was less than adequate in both assessment provinces.
There are several health insurance schemes including compulsory health insurance for employees, for the poor, for elderly people over 85, as well as voluntary health insurance. However, they only cover a
16 22,0 percent (2000); 24,7 percent (2001); 25,7 percent (2002); 26,2 percent (2003); 40,6 percent (2004); 42,5 percent (2005). National Health Account, 2000-2006 17 25,5 percent (2001); 31,5 percent (2002); 30,8 percent (2003); 22,5 percent (2004); 20,5 percent (2005). NHA, 2000-2006
29
few target groups in the population. Total health insurance coverage in Vietnam is 42 percent. Compulsory and voluntary health insurance schemes operate in both Ninh Binh and Can Tho provinces. Findings from the field survey in the two provinces show that with the current user-fee payment method, financial resources from the health insurance fund are not being used efficiently. Another concern is that the current government insurance schemes are facing a deficit . Monitoring of service provision reimbursements by the health insurance schemes is inadequate due to a lack of managerial capacity in hospitals.
User fee policies have been in place since 1989. User fee policies allow fees to be retained at the health facility and used to fill budget funding gaps. After implementing Decree 43/2004/TTg-CP on hospital autonomy, hospital revenue dramatically increased and revenue from user fees accounted for a high percentage of that increase. Results from interviews with financial officers in Ninh Binh reveal that revenue from user fees accounts for about 50 percent of total revenue of the provincial hospital and about 20-30 percent of total revenue of the district hospital. Before the implementation of Decree 43/2004/TTg-CP, hospitals had to submit 5 percent of revenue from user fees to the Department of Health. However, this regulation no longer exists.
Researchers found that informal user fees represent a significant portion of OOP expenditures, including extra payment for medicines and payment for indirect costs (travel, foods, etc.) in both Can Tho and Ninh Binh. For some services, user fees constitute a financial barrier to accessing health care services. Since the implementation of hospital autonomy, the problem of informal user fees has become more serious. There is a tendency to overuse medical equipment for diagnosis and treatment in order to collect additional funds.
The public sector does not have a policy of contracting with the private sector to expand or improve services. At the present, there is no mechanism to monitor the quality of health services at private facilities. At provincial level, the public sector uses contracts to agree with public hospitals on providing health care services for insured card holders.
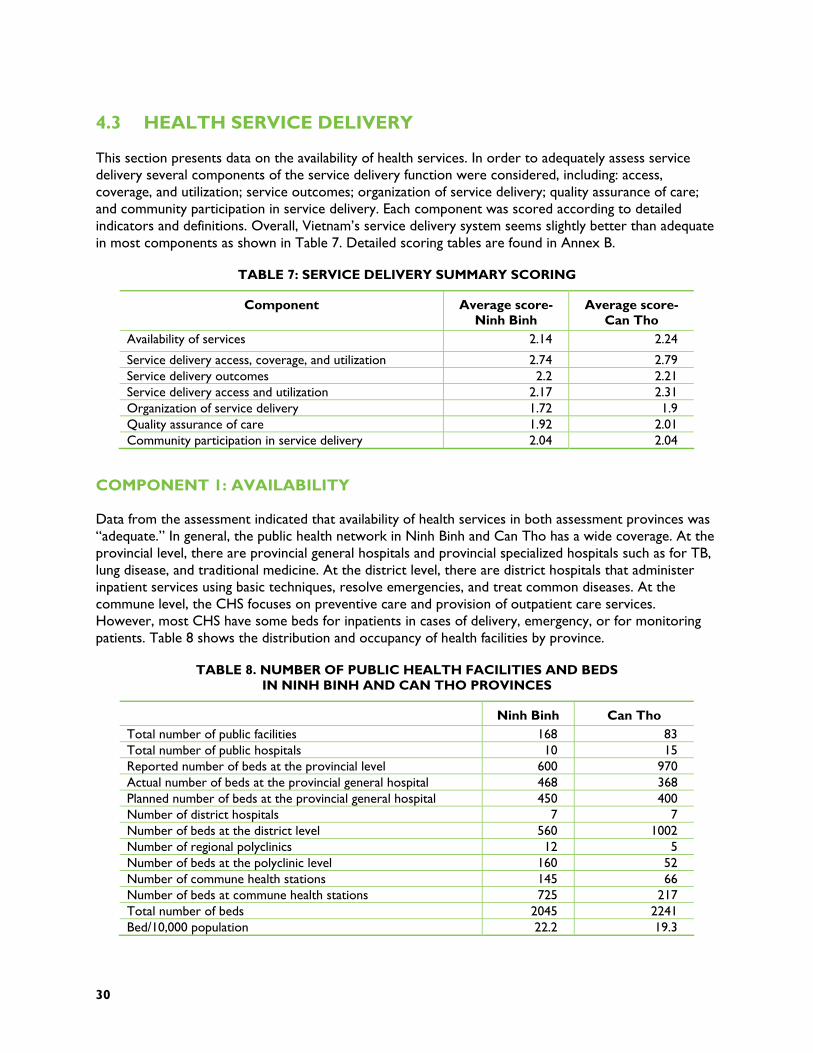
30
4.3 HEALTH SERVICE DELIVERY
This section presents data on the availability of health services. In order to adequately assess service delivery several components of the service delivery function were considered, including: access, coverage, and utilization; service outcomes; organization of service delivery; quality assurance of care; and community participation in service delivery. Each component was scored according to detailed indicators and definitions. Overall, Vietnam’s service delivery system seems slightly better than adequate in most components as shown in Table 7. Detailed scoring tables are found in Annex B.
TABLE 7: SERVICE DELIVERY SUMMARY SCORING
Component Average score- Ninh Binh
Average score- Can Tho
Availability of services 2.14 2.24
Service delivery access, coverage, and utilization 2.74 2.79 Service delivery outcomes 2.2 2.21 Service delivery access and utilization 2.17 2.31 Organization of service delivery 1.72 1.9 Quality assurance of care 1.92 2.01 Community participation in service delivery 2.04 2.04
COMPONENT 1: AVAILABILITY
Data from the assessment indicated that availability of health services in both assessment provinces was “adequate.” In general, the public health network in Ninh Binh and Can Tho has a wide coverage. At the provincial level, there are provincial general hospitals and provincial specialized hospitals such as for TB, lung disease, and traditional medicine. At the district level, there are district hospitals that administer inpatient services using basic techniques, resolve emergencies, and treat common diseases. At the commune level, the CHS focuses on preventive care and provision of outpatient care services. However, most CHS have some beds for inpatients in cases of delivery, emergency, or for monitoring patients. Table 8 shows the distribution and occupancy of health facilities by province.
TABLE 8. NUMBER OF PUBLIC HEALTH FACILITIES AND BEDS IN NINH BINH AND CAN THO PROVINCES
Ninh Binh Can Tho Total number of public facilities 168 83 Total number of public hospitals 10 15 Reported number of beds at the provincial level 600 970 Actual number of beds at the provincial general hospital 468 368 Planned number of beds at the provincial general hospital 450 400 Number of district hospitals 7 7 Number of beds at the district level 560 1002 Number of regional polyclinics 12 5 Number of beds at the polyclinic level 160 52 Number of commune health stations 145 66 Number of beds at commune health stations 725 217 Total number of beds 2045 2241 Bed/10,000 population 22.2 19.3
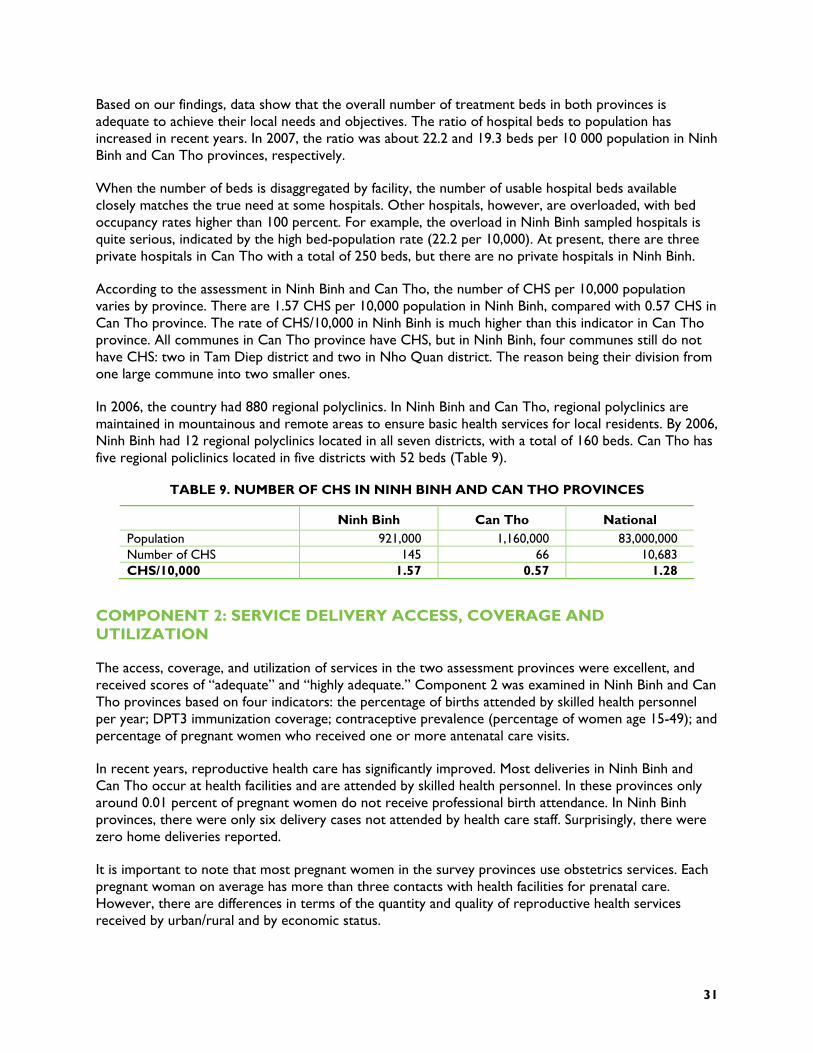
31
Based on our findings, data show that the overall number of treatment beds in both provinces is adequate to achieve their local needs and objectives. The ratio of hospital beds to population has increased in recent years. In 2007, the ratio was about 22.2 and 19.3 beds per 10 000 population in Ninh Binh and Can Tho provinces, respectively.
When the number of beds is disaggregated by facility, the number of usable hospital beds available closely matches the true need at some hospitals. Other hospitals, however, are overloaded, with bed occupancy rates higher than 100 percent. For example, the overload in Ninh Binh sampled hospitals is quite serious, indicated by the high bed-population rate (22.2 per 10,000). At present, there are three private hospitals in Can Tho with a total of 250 beds, but there are no private hospitals in Ninh Binh.
According to the assessment in Ninh Binh and Can Tho, the number of CHS per 10,000 population varies by province. There are 1.57 CHS per 10,000 population in Ninh Binh, compared with 0.57 CHS in Can Tho province. The rate of CHS/10,000 in Ninh Binh is much higher than this indicator in Can Tho province. All communes in Can Tho province have CHS, but in Ninh Binh, four communes still do not have CHS: two in Tam Diep district and two in Nho Quan district. The reason being their division from one large commune into two smaller ones.
In 2006, the country had 880 regional polyclinics. In Ninh Binh and Can Tho, regional polyclinics are maintained in mountainous and remote areas to ensure basic health services for local residents. By 2006, Ninh Binh had 12 regional polyclinics located in all seven districts, with a total of 160 beds. Can Tho has five regional policlinics located in five districts with 52 beds (Table 9).
TABLE 9. NUMBER OF CHS IN NINH BINH AND CAN THO PROVINCES
Ninh Binh Can Tho National Population 921,000 1,160,000 83,000,000 Number of CHS 145 66 10,683 CHS/10,000 1.57 0.57 1.28
COMPONENT 2: SERVICE DELIVERY ACCESS, COVERAGE AND UTILIZATION
The access, coverage, and utilization of services in the two assessment provinces were excellent, and received scores of “adequate” and “highly adequate.” Component 2 was examined in Ninh Binh and Can Tho provinces based on four indicators: the percentage of births attended by skilled health personnel per year; DPT3 immunization coverage; contraceptive prevalence (percentage of women age 15-49); and percentage of pregnant women who received one or more antenatal care visits.
In recent years, reproductive health care has significantly improved. Most deliveries in Ninh Binh and Can Tho occur at health facilities and are attended by skilled health personnel. In these provinces only around 0.01 percent of pregnant women do not receive professional birth attendance. In Ninh Binh provinces, there were only six delivery cases not attended by health care staff. Surprisingly, there were zero home deliveries reported.
It is important to note that most pregnant women in the survey provinces use obstetrics services. Each pregnant woman on average has more than three contacts with health facilities for prenatal care. However, there are differences in terms of the quantity and quality of reproductive health services received by urban/rural and by economic status.
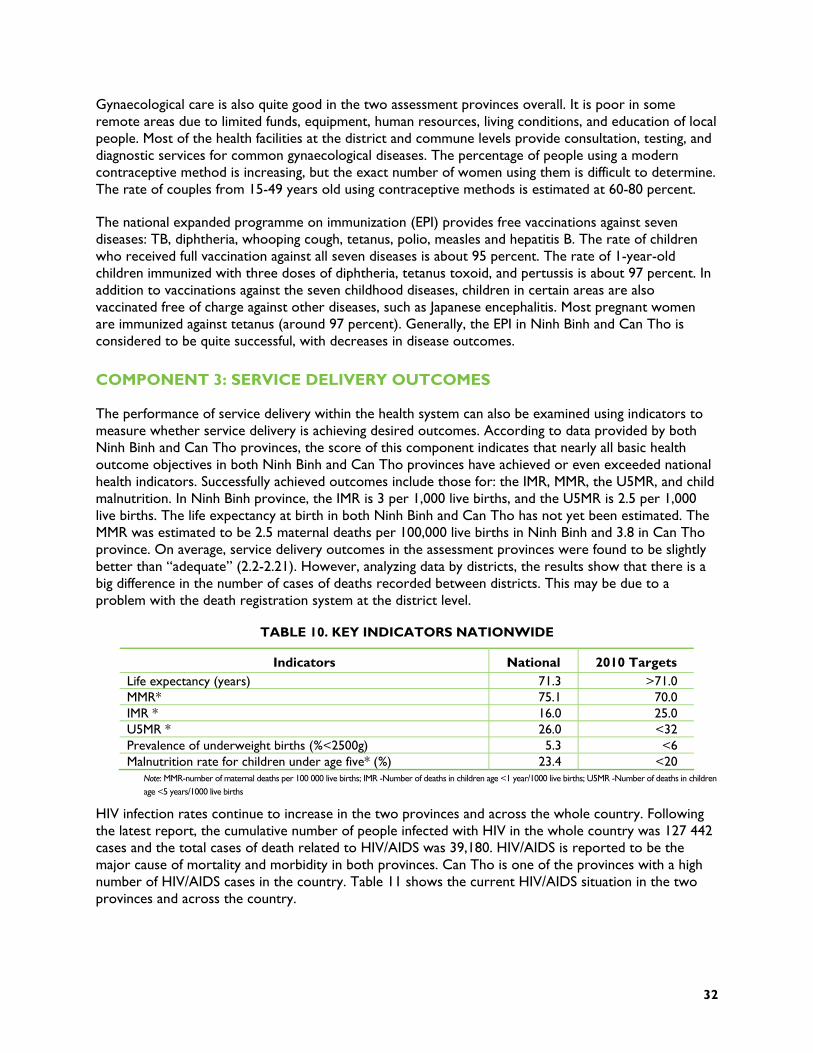
32
Gynaecological care is also quite good in the two assessment provinces overall. It is poor in some remote areas due to limited funds, equipment, human resources, living conditions, and education of local people. Most of the health facilities at the district and commune levels provide consultation, testing, and diagnostic services for common gynaecological diseases. The percentage of people using a modern contraceptive method is increasing, but the exact number of women using them is difficult to determine. The rate of couples from 15-49 years old using contraceptive methods is estimated at 60-80 percent.
The national expanded programme on immunization (EPI) provides free vaccinations against seven diseases: TB, diphtheria, whooping cough, tetanus, polio, measles and hepatitis B. The rate of children who received full vaccination against all seven diseases is about 95 percent. The rate of 1-year-old children immunized with three doses of diphtheria, tetanus toxoid, and pertussis is about 97 percent. In addition to vaccinations against the seven childhood diseases, children in certain areas are also vaccinated free of charge against other diseases, such as Japanese encephalitis. Most pregnant women are immunized against tetanus (around 97 percent). Generally, the EPI in Ninh Binh and Can Tho is considered to be quite successful, with decreases in disease outcomes.
COMPONENT 3: SERVICE DELIVERY OUTCOMES
The performance of service delivery within the health system can also be examined using indicators to measure whether service delivery is achieving desired outcomes. According to data provided by both Ninh Binh and Can Tho provinces, the score of this component indicates that nearly all basic health outcome objectives in both Ninh Binh and Can Tho provinces have achieved or even exceeded national health indicators. Successfully achieved outcomes include those for: the IMR, MMR, the U5MR, and child malnutrition. In Ninh Binh province, the IMR is 3 per 1,000 live births, and the U5MR is 2.5 per 1,000 live births. The life expectancy at birth in both Ninh Binh and Can Tho has not yet been estimated. The MMR was estimated to be 2.5 maternal deaths per 100,000 live births in Ninh Binh and 3.8 in Can Tho province. On average, service delivery outcomes in the assessment provinces were found to be slightly better than “adequate” (2.2-2.21). However, analyzing data by districts, the results show that there is a big difference in the number of cases of deaths recorded between districts. This may be due to a problem with the death registration system at the district level.
TABLE 10. KEY INDICATORS NATIONWIDE
Indicators National 2010 Targets Life expectancy (years) 71.3 >71.0 MMR* 75.1 70.0 IMR * 16.0 25.0 U5MR * 26.0 <32 Prevalence of underweight births (%<2500g) 5.3 <6 Malnutrition rate for children under age five* (%) 23.4 <20
Note: MMR-number of maternal deaths per 100 000 live births; IMR -Number of deaths in children age <1 year/1000 live births; U5MR -Number of deaths in children age <5 years/1000 live births
HIV infection rates continue to increase in the two provinces and across the whole country. Following the latest report, the cumulative number of people infected with HIV in the whole country was 127 442 cases and the total cases of death related to HIV/AIDS was 39,180. HIV/AIDS is reported to be the major cause of mortality and morbidity in both provinces. Can Tho is one of the provinces with a high number of HIV/AIDS cases in the country. Table 11 shows the current HIV/AIDS situation in the two provinces and across the country.

33
TABLE 11: HIV/AIDS INDICATORS IN NINH BINH AND CAN THO PROVINCES
Indicators Ninh Binh Can Tho National Cumulative cases of HIV 1,529 5,504 127,442 Number of deaths 311 1150 39,180
COMPONENT 4: SERVICE DELIVERY ACCESS AND UTILIZATION
Utilization and access to health services in Vietnam is quite “adequate” (2.17-2.31). The access and utilization component of service delivery was examined based on three indicators: percentage of people living within standard distance from a health facility; household expenditures on health care and financial access; and the existence of user fee exemptions and waivers.
Household health expenditure constitutes an important indicator for assessing equity of a health system. Household expenditure data were not available at the provincial level. At the national level, according to some estimates and different sources of data, household expenditures constitute from 60 percent to 66 percent of total health expenditure. Decision No. 139 sought to address the resulting inequities by allowing poor people to receive health care. As of 2007, 17.2 percent of the total population have received a health insurance card for the poor.
COMPONENT 5: ORGANIZATION OF PUBLIC SERVICE DELIVERY
The organization of public service delivery is important to allow for a functional health system. For purposes of the provincial health system assessment, the availability of integrated primary health care services (immunizations, TB, prenatal care, family planning, malaria, nutritional services) and the existence of referral mechanisms between different levels of health care were used as indicators of the organization of service delivery. Due to concerns over the distribution of patient loads as well as the ineffectiveness of the referral system, both provinces received scores of less than adequate for the organization of the health system component.
In Ninh Binh and Can Tho, based on MOH regulations for treatment capacity, each facility develops a list of technical treatments and submits it to the DOH. The DOH then examines capacity as well as equipment, human resources available, etc. and approves the list of technical treatments that a particular facility can provide. If a facility encounters difficult cases beyond their capacity, they refer the cases to a higher level. Each health facility has a notebook that keeps a record of patients referred. If a hospital wants to refer a patient, a certificate of technical meeting with the director as well as his signature is required. At least one health care staff accompanies the patient to the referral facility. Most of the district hospitals in Ninh Binh and Can Tho have ambulances.
COMPONENT 6: QUALITY ASSURANCE OF CARE
Quality of care is a major concern in many health facilities. In general, it is not easy to measure quality of care directly. In many health facilities, quality of care was impacted by low economic development, poor investment in infrastructure and a shortage of human resources in terms of both quantity and quality, especially a shortage of doctors in district hospitals and in mountainous provinces. According to the findings, despite the challenges, quality of care in the two assessment provinces appeared “adequate” (1.92-2.01). Five indicators were used to examine this component of service delivery function in Vietnam, including: the existence of national policies for promoting quality of care; the existence of quality standards adapted to local-level situations; the existence of clinical supervision by a
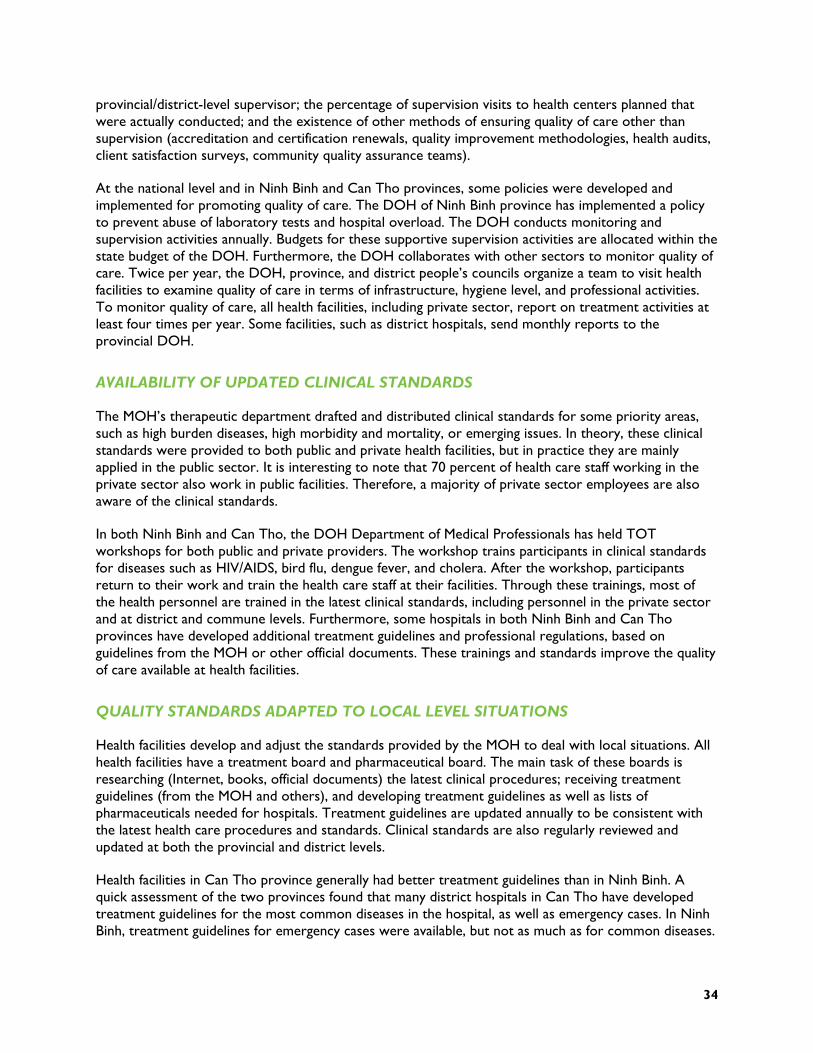
34
provincial/district-level supervisor; the percentage of supervision visits to health centers planned that were actually conducted; and the existence of other methods of ensuring quality of care other than supervision (accreditation and certification renewals, quality improvement methodologies, health audits, client satisfaction surveys, community quality assurance teams).
At the national level and in Ninh Binh and Can Tho provinces, some policies were developed and implemented for promoting quality of care. The DOH of Ninh Binh province has implemented a policy to prevent abuse of laboratory tests and hospital overload. The DOH conducts monitoring and supervision activities annually. Budgets for these supportive supervision activities are allocated within the state budget of the DOH. Furthermore, the DOH collaborates with other sectors to monitor quality of care. Twice per year, the DOH, province, and district people’s councils organize a team to visit health facilities to examine quality of care in terms of infrastructure, hygiene level, and professional activities. To monitor quality of care, all health facilities, including private sector, report on treatment activities at least four times per year. Some facilities, such as district hospitals, send monthly reports to the provincial DOH.
AVAILABILITY OF UPDATED CLINICAL STANDARDS
The MOH’s therapeutic department drafted and distributed clinical standards for some priority areas, such as high burden diseases, high morbidity and mortality, or emerging issues. In theory, these clinical standards were provided to both public and private health facilities, but in practice they are mainly applied in the public sector. It is interesting to note that 70 percent of health care staff working in the private sector also work in public facilities. Therefore, a majority of private sector employees are also aware of the clinical standards.
In both Ninh Binh and Can Tho, the DOH Department of Medical Professionals has held TOT workshops for both public and private providers. The workshop trains participants in clinical standards for diseases such as HIV/AIDS, bird flu, dengue fever, and cholera. After the workshop, participants return to their work and train the health care staff at their facilities. Through these trainings, most of the health personnel are trained in the latest clinical standards, including personnel in the private sector and at district and commune levels. Furthermore, some hospitals in both Ninh Binh and Can Tho provinces have developed additional treatment guidelines and professional regulations, based on guidelines from the MOH or other official documents. These trainings and standards improve the quality of care available at health facilities.
QUALITY STANDARDS ADAPTED TO LOCAL LEVEL SITUATIONS
Health facilities develop and adjust the standards provided by the MOH to deal with local situations. All health facilities have a treatment board and pharmaceutical board. The main task of these boards is researching (Internet, books, official documents) the latest clinical procedures; receiving treatment guidelines (from the MOH and others), and developing treatment guidelines as well as lists of pharmaceuticals needed for hospitals. Treatment guidelines are updated annually to be consistent with the latest health care procedures and standards. Clinical standards are also regularly reviewed and updated at both the provincial and district levels.
Health facilities in Can Tho province generally had better treatment guidelines than in Ninh Binh. A quick assessment of the two provinces found that many district hospitals in Can Tho have developed treatment guidelines for the most common diseases in the hospital, as well as emergency cases. In Ninh Binh, treatment guidelines for emergency cases were available, but not as much as for common diseases.
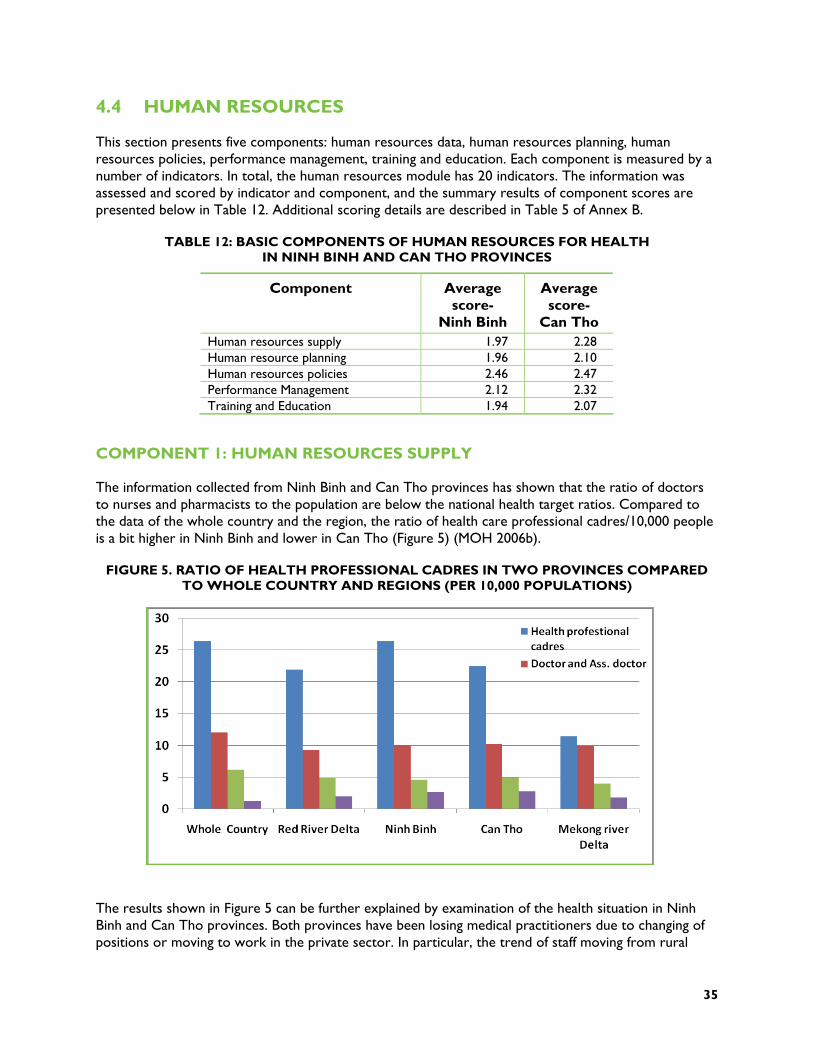
35
4.4 HUMAN RESOURCES
This section presents five components: human resources data, human resources planning, human resources policies, performance management, training and education. Each component is measured by a number of indicators. In total, the human resources module has 20 indicators. The information was assessed and scored by indicator and component, and the summary results of component scores are presented below in Table 12. Additional scoring details are described in Table 5 of Annex B.
TABLE 12: BASIC COMPONENTS OF HUMAN RESOURCES FOR HEALTH IN NINH BINH AND CAN THO PROVINCES
Component Average score-
Ninh Binh
Average score-
Can Tho Human resources supply 1.97 2.28 Human resource planning 1.96 2.10 Human resources policies 2.46 2.47 Performance Management 2.12 2.32 Training and Education 1.94 2.07
COMPONENT 1: HUMAN RESOURCES SUPPLY
The information collected from Ninh Binh and Can Tho provinces has shown that the ratio of doctors to nurses and pharmacists to the population are below the national health target ratios. Compared to the data of the whole country and the region, the ratio of health care professional cadres/10,000 people is a bit higher in Ninh Binh and lower in Can Tho (Figure 5) (MOH 2006b).
FIGURE 5. RATIO OF HEALTH PROFESSIONAL CADRES IN TWO PROVINCES COMPARED TO WHOLE COUNTRY AND REGIONS (PER 10,000 POPULATIONS)
The results shown in Figure 5 can be further explained by examination of the health situation in Ninh Binh and Can Tho provinces. Both provinces have been losing medical practitioners due to changing of positions or moving to work in the private sector. In particular, the trend of staff moving from rural

36
areas to urban areas is increasing. However, the rate of health staff leaving the health sector is minor and has less of an effect on the health workforce of the provinces. In Can Tho, the loss of health personnel to new positions or the private sector is more severe than in Ninh Binh.
In both provinces, the changing structure of the health system at the district level according to Decree 172/2004/NĐ-CP has resulted in staff shifting towards higher-level health facilities. This situation has made it difficult for PHDs to manage their health workforce, while provinces have shortages of human resources. Based on the assessment and score of this component, we found that the ratio of cadres of health care professionals to the population in the two provinces is adequate, but that Can Tho was slightly better overall.
COMPONENT 2: HUMAN RESOURCES PLANNING
Human resources planning is an important component of the HRH function within the health system. Ninh Binh and Can Tho received “adequate” (1.96-2.10) scores for this component. For purposes of assessing the HRH planning system, four indicators were used: the distribution of health care professionals by level of care in urban and rural areas; the presence of a HRH data system; the existence of a functioning HRH planning system; and the percentage of the health budget dedicated to HRH.
The distribution of health workers by level of care is available at any level of the health system in Vietnam. The distribution of the professional health workforce at upper levels is higher than at lower levels, and is lowest at commune level with 17-31.1 percent (Table 13). Based on the collected data, Can Tho has a lower proportion of health care professionals working at commune level (17 percent), but they have an excellent village health worker program as well as a health care volunteers network that contributes to health care activities in Can Tho. Therefore, Can Tho province scored somewhat better on the appropriateness of health worker distribution.
TABLE 13. DISTRIBUTION OF HEALTH WORKFORCE IN TWO PROVINCES BY LEVELS
Ninh Binh Can Tho National level
n % n % n % Provincial level 766 35.4 1.135 44.3 83.693 37.8 District level 726 33.5 993 38.7 67.343 30.4 Commune level18 673 31.1 433 17 51.158 23.1 Total 2.165 100 2.561 100 221.365 100
Source: Health Statistics Year Book 2006
18 Supplemented by village health workers and volunteer network
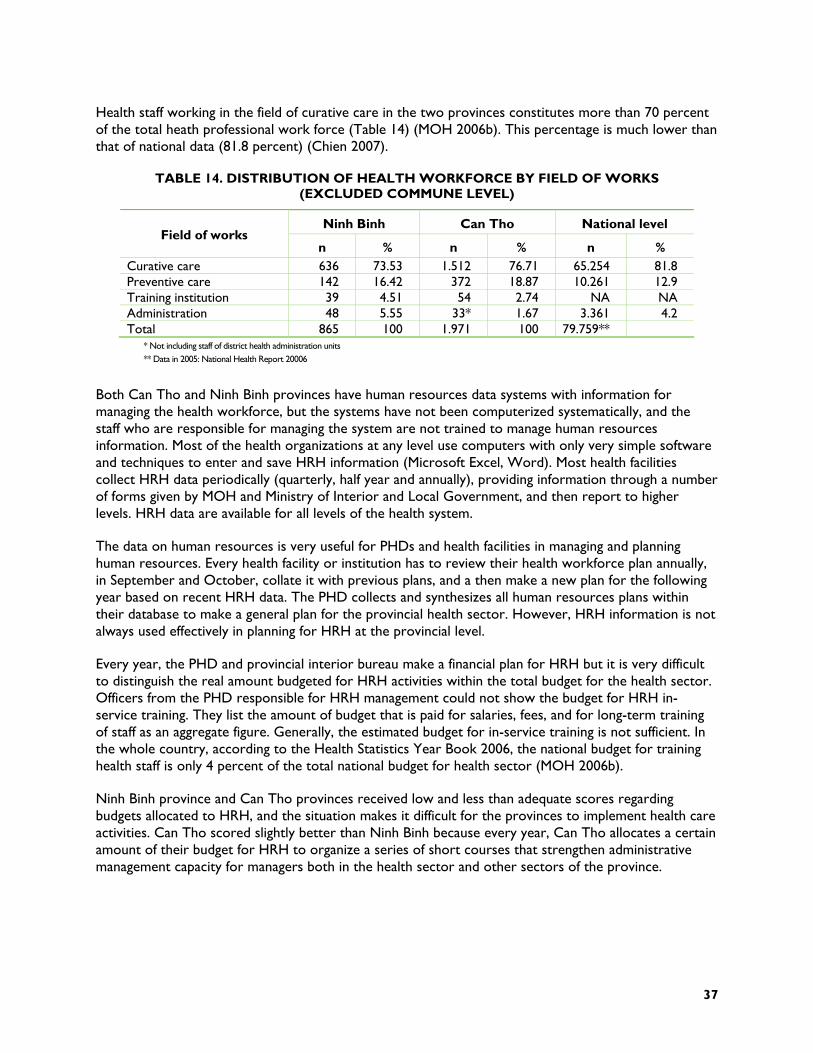
37
Health staff working in the field of curative care in the two provinces constitutes more than 70 percent of the total heath professional work force (Table 14) (MOH 2006b). This percentage is much lower than that of national data (81.8 percent) (Chien 2007).
TABLE 14. DISTRIBUTION OF HEALTH WORKFORCE BY FIELD OF WORKS (EXCLUDED COMMUNE LEVEL)
Ninh Binh Can Tho National level Field of works
n % n % n % Curative care 636 73.53 1.512 76.71 65.254 81.8 Preventive care 142 16.42 372 18.87 10.261 12.9 Training institution 39 4.51 54 2.74 NA NA Administration 48 5.55 33* 1.67 3.361 4.2 Total 865 100 1.971 100 79.759**
* Not including staff of district health administration units ** Data in 2005: National Health Report 20006
Both Can Tho and Ninh Binh provinces have human resources data systems with information for managing the health workforce, but the systems have not been computerized systematically, and the staff who are responsible for managing the system are not trained to manage human resources information. Most of the health organizations at any level use computers with only very simple software and techniques to enter and save HRH information (Microsoft Excel, Word). Most health facilities collect HRH data periodically (quarterly, half year and annually), providing information through a number of forms given by MOH and Ministry of Interior and Local Government, and then report to higher levels. HRH data are available for all levels of the health system.
The data on human resources is very useful for PHDs and health facilities in managing and planning human resources. Every health facility or institution has to review their health workforce plan annually, in September and October, collate it with previous plans, and a then make a new plan for the following year based on recent HRH data. The PHD collects and synthesizes all human resources plans within their database to make a general plan for the provincial health sector. However, HRH information is not always used effectively in planning for HRH at the provincial level.
Every year, the PHD and provincial interior bureau make a financial plan for HRH but it is very difficult to distinguish the real amount budgeted for HRH activities within the total budget for the health sector. Officers from the PHD responsible for HRH management could not show the budget for HRH in-service training. They list the amount of budget that is paid for salaries, fees, and for long-term training of staff as an aggregate figure. Generally, the estimated budget for in-service training is not sufficient. In the whole country, according to the Health Statistics Year Book 2006, the national budget for training health staff is only 4 percent of the total national budget for health sector (MOH 2006b).
Ninh Binh province and Can Tho provinces received low and less than adequate scores regarding budgets allocated to HRH, and the situation makes it difficult for the provinces to implement health care activities. Can Tho scored slightly better than Ninh Binh because every year, Can Tho allocates a certain amount of their budget for HRH to organize a series of short courses that strengthen administrative management capacity for managers both in the health sector and other sectors of the province.
38
COMPONENT 3: HUMAN RESOURCES POLICIES
National human resources policies are applied at the provincial levels with some degree of flexibility for the local context and with varying degrees of success depending on local challenges. The score for the human resources policy component is high (2.48-2.49) in both Ninh Binh and Can Tho provinces. The scoring is based on the following indicators: the availability of a functioning job classification system; the availability of a functioning compensation and benefits system that is used in a consistent manner to determine salary upgrades and merit awards; the availability of a formal process for recruitment, hiring, transfer, and promotion; the availability of employee conditions of service documentation (e.g., policy manual); the presence of a formal relationship with the union; whether registration, certification, or licensing is required for categories of staff in order to practice; and the availability of a salary scale.
There is a national regulation mandating a functioning job classification system. Each government sector (including the health sector) has had to develop its own job classification systems at each level. The government has issued a national rule for compensation and benefits. The national ruling is used in a consistent manner to determine salary upgrades and merit awards for staff who work in the public health sector. The national ruling on compensation and benefits has been available since 2002; however Decree 43/2006/ NĐ-CP was recently launched and allows health care facilities more independence in developing their own systems to determine salary upgrades and merit awards for their staff. In Ninh Binh and Can Tho provinces, a job classification system was available in all health care facilities at all levels of care. Ninh Binh and Can Tho provinces have not changed much within the original system for provincial benefits and compensation. The salary and merit awards system in the provinces lacked consistency between levels and facilities.
In these two provinces, the process for recruitment, hiring, transfer, and promotion in the health sector is governed by the National Labor Law and regulations. The process has been running smoothly and seems highly adequate in both provinces. Employee conditions of service documentation is available at both national and provincial level (including the two assessment provinces). The procedure for HR benefits, discipline etc. must follow National Labor Law. However, only certain positions have clear conditions of service documentation. The conditions are updated only when changes of health staff occur. On the other hand, some organizations do not follow up and supervise the implementation of employee conditions of service documents.
In Vietnam, each sector has its own trade union and the National Trade Union represents all labor unions throughout the nation. The health sector also has a trade union that represents all laborers working in the health sector. The relationship between the health sector and the trade union is very close and membership is not restricted. All health care staff can join the union and participate freely in union activities. Health staff also benefit from the protection of the union. In both provinces, there are strong relationships between the trade union and the health sector. This segment of civil society participation is highly adequate.
The registration, certification, and licensing system mainly apply to the private health sector. In the public sector, only certain departments require certification of technical skills (X-ray, nuclear treatment, etc.). In contrast, in the private sector, all health care professionals (traditional practitioner, physicians, pharmacists, technicians, etc.) have to follow the National Law for Private Health Practice. The law describes procedures for registration, certification, and licensing. The PHD department of private health management is responsible for registration, certification, and licensing of private health practitioners and facilities. In reality, the department struggles to manage the private sector activities of the health sector. This was confirmed in both assessment provinces.
39
According to the national salary regulations, the government has already assigned the salary scale, time of salary disbursements, period of salary promotion, etc. Every health care facility has to follow national salary regulations. To date, neither of the two assessment provinces reports any delays in receiving timely salary payments. However, the commune-level facilities sometimes experience delays in salary payments because of administrative procedures at the district level (money transfer from district to commune level).
Public sector salaries are low. Health care staff can earn additional income from working extra hours. Health staff usually have to take a second job to achieve a basic standard of living. However, health care staff at the commune level, especially village health workers, usually have a second job such as farming, trading service, etc. Such situations were found to be very common in the rural areas of Ninh Binh and Can Tho provinces.
COMPONENT 4: PERFORMANCE MANAGEMENT
The performance management component of the human resources function scored “adequate” (2.12-2.32) as measured using indicators, including: the availability of job descriptions; the existence of a supervision plan (clinical and administrative supervision); the percentage of supervision visits to health centers planned that were actually conducted; the availability of a formal mechanism for individual performance planning and review; and the availability of a functioning incentive program where needed.
In Ninh Binh and Can Tho provinces, job descriptions are available and regularly updated at all levels of care, but only for certain positions. Most employees are aware of what their job description entails. However, at all levels in the provinces, because of human resources limitations, most health staff are responsible for a variety of roles at any one time. Thus, job descriptions for these health staff are not always clear and may be adapted according to local circumstances.
The lack of a formal mechanism for individual performance planning and review is a weakness of the HRH performance management system. At all levels of care, performance reviews are implemented periodically, but only for certain key staff members. Staff members under review write a report describing activities they were responsible for in the past, but they neglect to review the individual’s performance planning and goals for the future.
Because of shortages of HRH at some levels (district and CHS) or facilities (preventive facilities), health staff have to be responsible for multiple activities simultaneously, each with supervision from different leaders (e.g., one staff member at the district center for preventive medicine or CHS usually has to manage 3-4 national health programs). This makes it difficult to plan for performance improvement. The individual performance reports are not frequently documented, but usually brought to monthly, quarterly or annually meetings for sharing of information and progression of activities with others.
The performance management system includes supervision of both clinical and administrative performance. Each health facility has clinical and administrative supervisors. They are usually heads of departments, team leaders, or directors of health facilities. Performance management and surveillance are mostly based on paper reports or weekly progress meetings. The performance manager’s roles are not only inspection and surveillance, but also supportive and problem solving focused. The supervision plan is available but not enforced or regularly implemented in both provinces.
Planned supervisory visits to health centers were regularly conducted but the frequency of visits varied according to the levels of care. The district supervision visits to CHS were more frequent than those at the provincial level. Every year, the PHD, the Provincial Center for Preventive Medicine, Centers for
40
Social Diseases Prevention (sexually transmitted infections, TB, HIV/AIDS, leprosy, etc.), plans to visit health facilities responsible for implementing health care activities (curative care, preventive care, and national health programs). The district health center, district center for preventive medicine, and district health administrative unit also make a certain number of visits to the CHS to supervise health care activities. In fact, the two assessment provinces reported that 100 percent of planned visits were conducted.
Another weakness of HRH performance management is the lack of meaningful incentive payments. Incentive packages are available at all levels of care and types of health facilities. The incentive amounts are not significant enough to have an impact on the behavior of health staff. The government has launched policies for commending and rewarding government staff and employers who work in the public sector. These reward schemes only include commendation with a present or a small amount of money. Currently, due to economic transition as well as hospital reform, some progressive health facilities may choose to use their own resources to offer incentive packages to their staff. Ninh Binh did not perform as well as Can Tho province on this indicator since Can Tho has an economic advantage and more opportunities to arrange incentives for health staff.
COMPONENT 5: TRAINING AND EDUCATION
The effectiveness of the training and education component of human resources for health was examined using three key indicators: the availability of a formal in-service training component for all levels of staff; the availability of a functioning management and leadership development program; and the availability of links and “feedback loops” between the organization and pre-service training institutions. Overall scores for the two assessment provinces were “adequate” (1.94-2.07).
According to the assessment findings in both provinces, formal in-service training is available but not relevant for all levels of staff. MOH departments or national health programs usually plan training programs that extend more than three months. All provinces send their staff to attend the training courses, based on the needs of province. The training courses are held at either the central or provincial level depending on time period required, the type of training, and the course curriculum. In-service training can also be included through TOT. In that case, provincial staff are trained at the central level and then return to their province to train other staff. One weakness of this component is that there is no policy indicating the mandatory amount of in-service training that public or private health practitioners need to complete. Can Tho province has the advantage of a provincial medical school, Can Tho University and a teaching hospital in which health staff can receive in-service training courses.
Leadership and management development opportunities are also lacking in the two provinces. Management and leadership training is offered, but not regularly or systematically for every level of care. There are no formal management and leadership training programs consistently applied for all levels and types of staff. In Can Tho and Ninh Binh provinces, some training courses on strengthening management capacity for leaders from health facilities have been organized but only in a short period of time and with a limited focus on management skill for health projects, national health programs, hospital management, etc. Since 2006, Can Tho has made some progress in strengthening the leadership capacity of its provincial health system by signing a contract with a university to organize two-week training courses in Can Tho city.
As for the links and “feedback loops” between the health care system and pre-service training institutions, both Can Tho and Ninh Binh provinces have established relationships with training institutions such as Hanoi Medical College, National Institute of Epidemiology and Hygiene, and Can Tho University as well as local primary or secondary medical colleges. The relationship is generally only a

41
one-way interaction in which the provincial health bureau sends staff to attend training courses, but does not actively follow-up by asking for feedback from the training institution.
In general, the training and education component has not fully met the needs of HRH development in Can Tho and Ninh Binh. Can Tho province has a distinct advantage due to the availability of training institutions such as Can Tho University that provide training services to support the local health system to strengthen the capacity of HR.
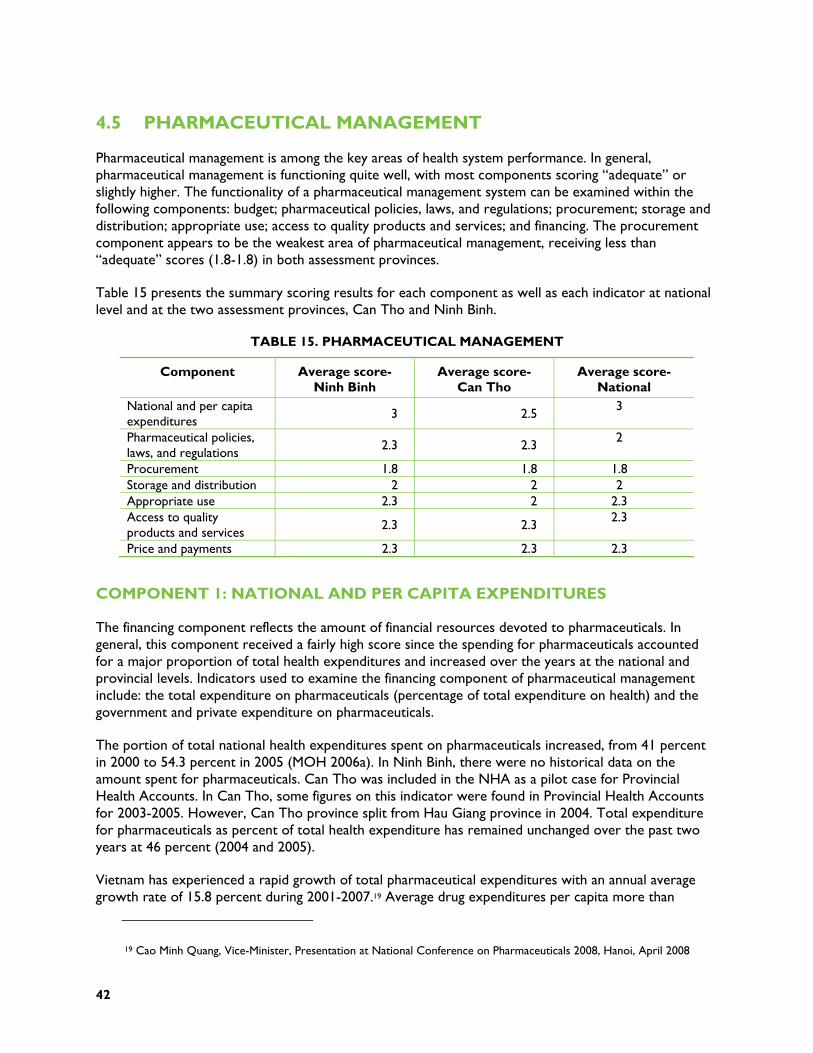
42
4.5 PHARMACEUTICAL MANAGEMENT
Pharmaceutical management is among the key areas of health system performance. In general, pharmaceutical management is functioning quite well, with most components scoring “adequate” or slightly higher. The functionality of a pharmaceutical management system can be examined within the following components: budget; pharmaceutical policies, laws, and regulations; procurement; storage and distribution; appropriate use; access to quality products and services; and financing. The procurement component appears to be the weakest area of pharmaceutical management, receiving less than “adequate” scores (1.8-1.8) in both assessment provinces.
Table 15 presents the summary scoring results for each component as well as each indicator at national level and at the two assessment provinces, Can Tho and Ninh Binh.
TABLE 15. PHARMACEUTICAL MANAGEMENT
Component Average score- Ninh Binh
Average score- Can Tho
Average score- National
National and per capita expenditures 3 2.5
3
Pharmaceutical policies, laws, and regulations
2.3 2.3 2
Procurement 1.8 1.8 1.8 Storage and distribution 2 2 2 Appropriate use 2.3 2 2.3 Access to quality products and services 2.3 2.3
2.3
Price and payments 2.3 2.3 2.3
COMPONENT 1: NATIONAL AND PER CAPITA EXPENDITURES
The financing component reflects the amount of financial resources devoted to pharmaceuticals. In general, this component received a fairly high score since the spending for pharmaceuticals accounted for a major proportion of total health expenditures and increased over the years at the national and provincial levels. Indicators used to examine the financing component of pharmaceutical management include: the total expenditure on pharmaceuticals (percentage of total expenditure on health) and the government and private expenditure on pharmaceuticals.
The portion of total national health expenditures spent on pharmaceuticals increased, from 41 percent in 2000 to 54.3 percent in 2005 (MOH 2006a). In Ninh Binh, there were no historical data on the amount spent for pharmaceuticals. Can Tho was included in the NHA as a pilot case for Provincial Health Accounts. In Can Tho, some figures on this indicator were found in Provincial Health Accounts for 2003-2005. However, Can Tho province split from Hau Giang province in 2004. Total expenditure for pharmaceuticals as percent of total health expenditure has remained unchanged over the past two years at 46 percent (2004 and 2005).
Vietnam has experienced a rapid growth of total pharmaceutical expenditures with an annual average growth rate of 15.8 percent during 2001-2007.19 Average drug expenditures per capita more than
19 Cao Minh Quang, Vice-Minister, Presentation at National Conference on Pharmaceuticals 2008, Hanoi, April 2008
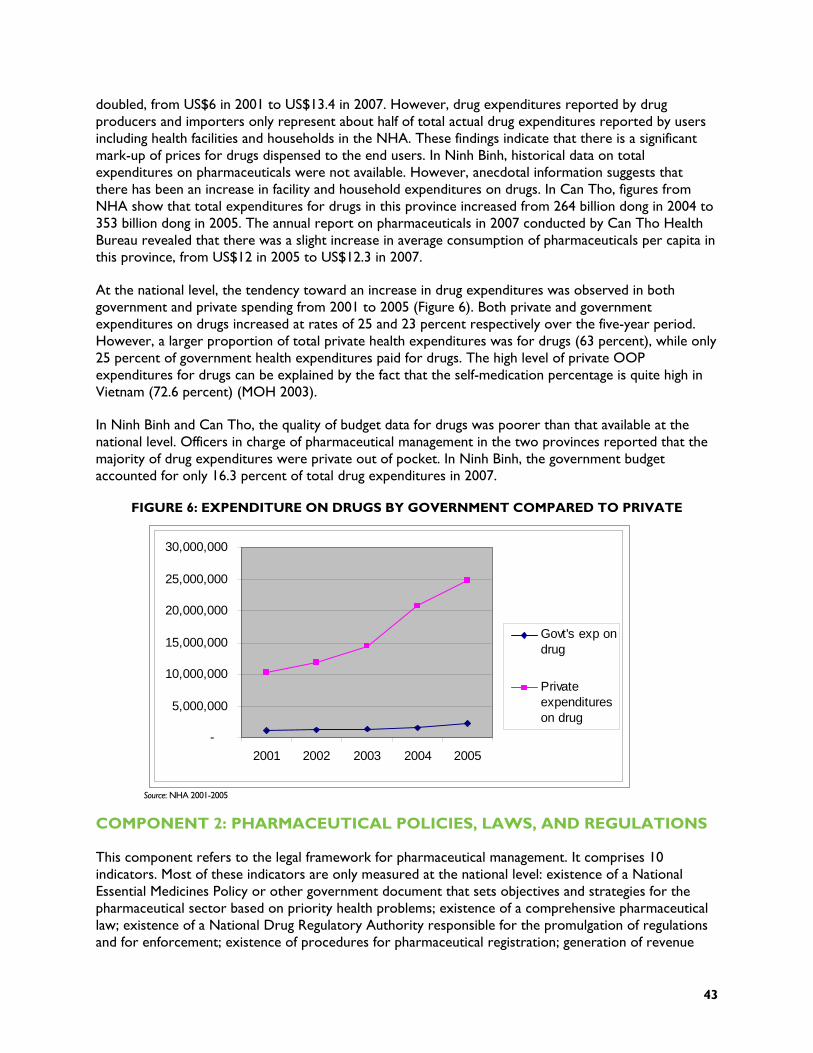
43
doubled, from US$6 in 2001 to US$13.4 in 2007. However, drug expenditures reported by drug producers and importers only represent about half of total actual drug expenditures reported by users including health facilities and households in the NHA. These findings indicate that there is a significant mark-up of prices for drugs dispensed to the end users. In Ninh Binh, historical data on total expenditures on pharmaceuticals were not available. However, anecdotal information suggests that there has been an increase in facility and household expenditures on drugs. In Can Tho, figures from NHA show that total expenditures for drugs in this province increased from 264 billion dong in 2004 to 353 billion dong in 2005. The annual report on pharmaceuticals in 2007 conducted by Can Tho Health Bureau revealed that there was a slight increase in average consumption of pharmaceuticals per capita in this province, from US$12 in 2005 to US$12.3 in 2007.
At the national level, the tendency toward an increase in drug expenditures was observed in both government and private spending from 2001 to 2005 (Figure 6). Both private and government expenditures on drugs increased at rates of 25 and 23 percent respectively over the five-year period. However, a larger proportion of total private health expenditures was for drugs (63 percent), while only 25 percent of government health expenditures paid for drugs. The high level of private OOP expenditures for drugs can be explained by the fact that the self-medication percentage is quite high in Vietnam (72.6 percent) (MOH 2003).
In Ninh Binh and Can Tho, the quality of budget data for drugs was poorer than that available at the national level. Officers in charge of pharmaceutical management in the two provinces reported that the majority of drug expenditures were private out of pocket. In Ninh Binh, the government budget accounted for only 16.3 percent of total drug expenditures in 2007.
FIGURE 6: EXPENDITURE ON DRUGS BY GOVERNMENT COMPARED TO PRIVATE
Source: NHA 2001-2005
COMPONENT 2: PHARMACEUTICAL POLICIES, LAWS, AND REGULATIONS
This component refers to the legal framework for pharmaceutical management. It comprises 10 indicators. Most of these indicators are only measured at the national level: existence of a National Essential Medicines Policy or other government document that sets objectives and strategies for the pharmaceutical sector based on priority health problems; existence of a comprehensive pharmaceutical law; existence of a National Drug Regulatory Authority responsible for the promulgation of regulations and for enforcement; existence of procedures for pharmaceutical registration; generation of revenue
-
5,000,000
10,000,000
15,000,000
20,000,000
25,000,000
30,000,000
2001 2002 2003 2004 2005
Govt's exp ondrug
Privateexpenditureson drug

44
from the pharmaceutical registration procedures for the MOH; existence of a system for the collection of data regarding the efficacy, quality, and/or safety of marketed pharmaceutical products (post-marketing surveillance); mechanisms for the licensing, inspection, and control of pharmaceutical personnel, manufacturers, distributors/importers, and pharmacies/drug retail stores; and the existence, management, and organization of a national essential medicines list (NEML).
The National Drug Policy was issued under Government Resolution 37/CP in 1996 to ensure regular and sufficient supply of quality drugs for the population and rational and safe use of drugs. However, this policy has not been updated since 1996. In 2002, the strategy for development of the pharmaceutical sector up to 2010 was approved by the Prime Minister. The overall objective of the strategy is to develop the pharmaceutical sector to become a leading technology sector, to integrate into the global pharmaceutical market, to ensure regular and sufficient supply of quality drugs, and to ensure safe and rational use of drugs to serve the people’s health care.
The Law on Pharmacy was approved by the National Assembly on June 14, 2005, establishing a legal framework for implementing given targets in the national policy on drugs. However, the Pharmaceutical Law does not cover issues such as financial and economic mechanisms, monitoring and evaluation mechanisms, or roles of the health professional.
The DAV, established in 1994, is in charge of government management of pharmaceuticals. Its main tasks include developing regulations related to quality assurance and registration of drugs, and ensuring good manufacturing practices, storage, drug quality assurance, and administrative reform in import and export of pharmaceutical products. At the provincial level, the drug administration division of the Provincial Health Bureau is responsible for pharmaceutical management in the province, especially for promulgation of guidelines for regulations issued by DAV as well as for enforcing these regulations.
Concrete regulations on procedures for drug registration are regularly updated. However, drug registration faces several challenges such as lack of tests for bio-equivalence and bio-availability of drugs resulting in difficulty with scientific assessment of drug efficacy. Fees are collected for pharmaceutical registration in accordance with national regulations. However, revenues from drug registration fees contribute to the general government revenues instead of MOH revenues.
A system for collecting data regarding the efficacy, quality, and/or safety of pharmaceutical products (post-marketing surveillance) does not exist yet. However, there is a drug information unit in public hospitals, which tracks adverse drug reactions (ADR). The situation in Can Tho and Ninh Bin provinces was the same as the national one. Can Tho reported that ADR monitoring has been done regularly in a systematic manner.
The licensing, inspection, and control of pharmaceutical personnel, manufacturers, distributors/importers, and pharmacies/drug retail stores follows specific regulations. These regulations are regularly applied and enforced. Pharmaceutical inspection can be either regular or unscheduled. A report on inspection is to be delivered after each inspection. Annual reports on pharmaceutical inspections are available. Ninh Binh and Can Tho provinces receive pharmaceutical inspections every six months. Unscheduled inspections raised some critical issues regarding drug quality and price. Annual reports on provincial pharmaceutical inspections are sent to the MOH.
The NEML was developed by the DAV, approved by the Minister of Health, and supported by guidelines and recommendations of the WHO. The list has been updated five times, with the last edition published in July 2005. Essential drugs are drugs that must be available in each health facility, even in facilities without doctors. The NEML covers drugs used in the national target health programs, for example,
45
leprosy and TB treatment. The NEML is available at all health facilities from the province down to commune level.
COMPONENT 3: PROCUREMENT
Of the seven components of pharmaceutical management, procurement received the lowest score overall. The indicators included in this aspect of pharmaceutical management focus on the procedures, operations, and processes required to procure pharmaceuticals in Vietnam. They include: the existence of formal standard operating procedures (SOPs) for conducting procurement in the public sector; the use of generic non-propriety names (INN) for MOH procurement; procurement operations (number of procurement operations per year); the percentage of MOH pharmaceuticals procured through competitive bidding; the existence of a pre-or post-qualification process related to product safety, efficacy, and quality; and the drug samples requested and tested.
Circular 20/2006 on bidding for public procurement provides general guidelines for drug procurement and is consistently applied at all health facility levels. Can Tho and Ninh Binh provinces confirmed the use of the general guidelines of Circular 20/2006. However, hospitals at all levels indicated that there was no specific standard procedures for drug procurement. This fact has created difficulties for hospitals in conducting drug procurement.
A key informant interview with an officer from the DAV revealed that generic names are used for constructing lists of drugs for bidding but brand names are used for the actual bidding process. Generic drugs are not regularly or consistently procured at all levels in routine and emergency procurements. Findings from Ninh Binh and Can Tho reflected the situation at the central level. Data from the assessment reported that the list of drugs for bidding was constructed using generic names but there was another column for brand names included. In the bidding results sent from the Provincial Health Bureau to hospitals, there were two drug columns for the winning bid. This is very problematic because it is difficult to know if the contract is awarded on a generic or brand name basis.
Key respondents at the central level indicated that emergency procurements are rarely required and only for a few categories of drugs. In Ninh Binh, most drugs were purchased through a bidding process which has been centrally organized by the Provincial Health Bureau since 2007. However, bidding hospitals still procure a few categories of drugs through direct phone orders 2-3 times per month. In Can Tho, purchasing drugs outside drug procurement bidding by the Provincial Health Bureau was very rare. In addition, the value of drugs purchased by hospitals separately was quite small. One reason associated with this fact was that there are difficulties concerning payment procedures at Treasury Department made for purchasing drugs not purchased through bidding.
According to national respondents, a product safety, efficacy, and quality evaluation process exists. However, there is no information on how this process is applied in reality. Both provinces reported that a pre-or post-qualification process related to product safety, efficacy, and quality does not exist. Purchased drugs are usually checked for lot number, registration number, and expiration date only. Assessments on drug quality were mainly subjective.
A key informant interview with a DAV respondent indicated that regulation of drug sampling was largely theoretical and not implemented. Provincial authorities reported that hospitals in the two provinces did not conduct sampling tests. In Ninh Binh, they explained that there are several reasons why hospitals do not conduct drug sampling. Firstly, hospitals do not have the capability to do drug sampling tests. This job can only be done by the Province Center for Drug Tests. Secondly, hospitals have to pay a considerable amount for sampling tests (350,000 VND in Ninh Binh). In Can Tho, sampling tests were
46
only conducted for drugs suspected of poor quality. Therefore, this indicator scored “not adequate” in both provinces.
COMPONENT 4: STORAGE AND DISTRIBUTION
The evaluation of the storage and distribution component of pharmaceutical management was based on five indicators: pharmaceuticals procured based on reliable estimates; existence of procedures to manage distribution of pharmaceuticals; existence of independent supply systems for vertical programs; and existence of refrigeration units with functional temperature control at each level of the distribution system. For both provincial and national levels, these indicators received an average score of “adequate” (2-2-2).
According to the DAV representative, drug procurement is estimated using the previous year’s figures. However, it cannot be said that a standardized quantification method for drug procurement is applied consistently at all levels of the health care system. None of the standardized quantification methods for drug procurement is applied in Ninh Binh and Can Tho provinces. Different hospitals use different methods to estimate drug quantity for procurement. In Ninh Binh, drug procurement estimates are based on the number of patients and quantity of drugs consumed in the previous month in Yen Mo hospital, while in Yen Khanh hospital they are based only on the quantity of drugs used in the previous month. In Can Tho, the estimates are made based on the quantity of drugs used in the previous year and morbidity patterns in the hospital. However, according to representatives from the assessment hospitals, these estimates are not very accurate or reliable.
The distribution of pharmaceuticals is implemented by pharmaceutical companies and retail drug outlets, including pharmacies and drug agents. However, there are no standard operating procedures for ordering, distribution and storage, and withdrawal of drugs for application nationally. According to representatives of the Provincial Health Bureau, distribution of pharmaceuticals is the pharmaceutical companies’ responsibility. The Provincial Health Bureau is responsible only for overseeing the process.
Since 1991, the country has implemented National Health Programs (NHP). These NHPs have focused on the most urgent and important issues in preventive and curative care including: malaria prevention, TB control, leprosy prevention, child malnutrition prevention, EPI, mental health, HIV/AIDS prevention, cancer prevention, reproductive health, and civil and military health collaboration. In most of the NHPs, there is provision of drugs specifically for each program. In these programs, drug procurement followed the common regulations on drug purchase in the public sector, but there are separate drug procurement plans and budgets. However, all plans for drug procurement of separate NHPs need MOH approval. This means that NHP plans are part of the common drug planning and budgeting.
The DAV respondent indicated that the value of inventory loss is not significant, usually less than 5 percent. Major reasons for inventory loss were expiration of drugs that are not commonly used but must be available in storage. Another reason for lost inventory was damage to packaging during transportation.
According to regulations on drug storage, not all drugs require refrigeration equipment. Refrigerators are usually available in public health facilities from the district level upward, but not at the commune level. Cold chain systems are available for vaccinations. Refrigeration units with functional temperature controls were not available in the provincial health facilities. Even at the district level there were no refrigerators available in the pharmacy department at most district hospitals in Ninh Binh and Can Tho province. At some district hospitals, drug storage units had an air-conditioner and ventilator.
47
COMPONENT 5: APPROPRIATE USE OF DRUG
The appropriate use of drugs was measured using three indicators: the existence of functioning mechanisms/tools to improve the use of medicines in hospitals and health facilities; the existence of national therapeutic guides with standardized treatments for common health problems; and the existence of treatment guidelines used for basic and in-service training of health personnel. Both provinces received “adequate” scores for this indicator, with Ninh Binh scoring slightly better than Can Tho (2.3–2.0).
Procedures for oversight of drug prescription practices in hospitals are established. The Drug and Therapy Committee plays an important role in selecting drugs and improving rational use of drugs in a hospital. Evaluations of the Drug and Therapy Committee’s performance and medical record reviews are included in the annual hospital assessments conducted by the MOH. However, these precautions work differently among health facilities depending on perceptiveness and professional capacity of hospital staff, especially hospital leaders. In Ninh Binh, the Drug and Therapy Committees in studied hospitals were quite active and effective. However, there was variation in the performance of these committees in different hospitals. In Ninh Binh General Hospital, the committee conducted medical record reviews every week while medical record reviews occur every month in Yen Khanh District Hospital. Oversight of drug prescribing practices was usually implemented for inpatient care but only rarely for outpatient care. However, in Co Do District Hospital in Can Tho province, copies of outpatient prescriptions were kept for subsequent prescription reviews. This practice was not replicated in Thot Not District Hospital.
Treatment guidelines for most diseases have been developed by the Department of Therapy but these documents were not always available in public health facilities and rarely available at private health facilities. These guidelines are not regularly updated or relevant for practical contexts. They are recommended, but not enforced. As a result, prescribers rarely comply with them. In Ninh Binh and Can Tho, treatment guidelines for most common diseases were available in all public health facilities, but not at private facilities. In each hospital, treatment guidelines were applied based on national therapeutic guidelines adapted in accordance with the availability of drugs.
Interviews with key respondents indicated that treatment guidelines are used for training, but they are not used consistently as supervision tools. In Ninh Binh and Can Tho, key respondents indicated that the treatment guidelines were used during hospital supervision and monitoring.
COMPONENT 6: ACCESS TO QUALITY PRODUCTS AND SERVICES
Access to quality products and services as a component of the pharmaceuticals management system examines whether the population has access to pharmaceuticals and whether there are mechanisms in place to ensure that the quantity and quality of prescription drugs issued are acceptable. Several indicators were used to examine this component including: the percentage of a set of unexpired tracer items available; the percentage of the population having access to a public or private health facility/pharmacy that dispenses pharmaceuticals; the existence of licensing provisions or incentives that increase geographic access by consumers/patients to quality products and services through private wholesalers and retailers; the population per licensed pharmacist or pharmacy technician; the population per authorized prescriber.
Thanks to the liberalization of the pharmaceutical sector in Vietnam, shortages of drugs have been largely eliminated. In addition, the implementation of an essential drug policy improves the availability of essential drugs at different levels of public facilities in the health system. Stock-outs for drugs on the
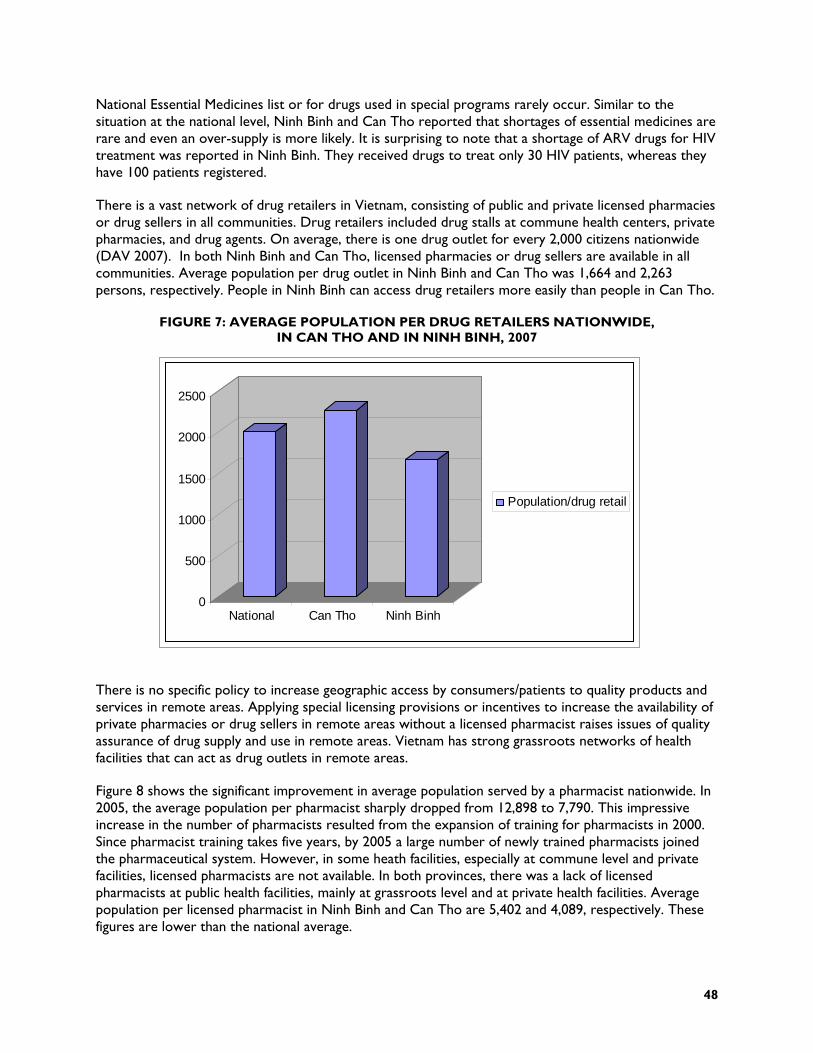
48
National Essential Medicines list or for drugs used in special programs rarely occur. Similar to the situation at the national level, Ninh Binh and Can Tho reported that shortages of essential medicines are rare and even an over-supply is more likely. It is surprising to note that a shortage of ARV drugs for HIV treatment was reported in Ninh Binh. They received drugs to treat only 30 HIV patients, whereas they have 100 patients registered.
There is a vast network of drug retailers in Vietnam, consisting of public and private licensed pharmacies or drug sellers in all communities. Drug retailers included drug stalls at commune health centers, private pharmacies, and drug agents. On average, there is one drug outlet for every 2,000 citizens nationwide (DAV 2007). In both Ninh Binh and Can Tho, licensed pharmacies or drug sellers are available in all communities. Average population per drug outlet in Ninh Binh and Can Tho was 1,664 and 2,263 persons, respectively. People in Ninh Binh can access drug retailers more easily than people in Can Tho.
FIGURE 7: AVERAGE POPULATION PER DRUG RETAILERS NATIONWIDE, IN CAN THO AND IN NINH BINH, 2007
There is no specific policy to increase geographic access by consumers/patients to quality products and services in remote areas. Applying special licensing provisions or incentives to increase the availability of private pharmacies or drug sellers in remote areas without a licensed pharmacist raises issues of quality assurance of drug supply and use in remote areas. Vietnam has strong grassroots networks of health facilities that can act as drug outlets in remote areas.
Figure 8 shows the significant improvement in average population served by a pharmacist nationwide. In 2005, the average population per pharmacist sharply dropped from 12,898 to 7,790. This impressive increase in the number of pharmacists resulted from the expansion of training for pharmacists in 2000. Since pharmacist training takes five years, by 2005 a large number of newly trained pharmacists joined the pharmaceutical system. However, in some heath facilities, especially at commune level and private facilities, licensed pharmacists are not available. In both provinces, there was a lack of licensed pharmacists at public health facilities, mainly at grassroots level and at private health facilities. Average population per licensed pharmacist in Ninh Binh and Can Tho are 5,402 and 4,089, respectively. These figures are lower than the national average.
0
500
1000
1500
2000
2500
National Can Tho Ninh Binh
Population/drug retail
49
FIGURE 8: TREND OF AVERAGE POPULATION PER LICENSED PHARMACIST AND DOCTOR AT NATIONAL LEVEL, 2001-2006
According to government regulations, more than one licensed prescriber is available in public health facilities. In addition, licensed private prescribers exist in most areas. The national average ratio of a prescriber per population is 1:7,865. No corresponding figures for Ninh Binh and Can Tho were available.
COMPONENT 7: PRICE AND PAYMENT
The financing component of pharmaceutical management was measured using the following indicators: the population per drug retail outlet in the private sector; the respective proportions of the annual national expenditure on medicines by the government budget, donors, charities, and private patients; the existence of mechanisms to recover the cost of pharmaceuticals; the existence of price control mechanisms for pharmaceuticals in the private sector.
The National Health Survey in 2002 revealed that there was considerable variation among income groups for OOP spending for self-medication (Figure 9). On average, rich households spent 2.2 times as much for medicines as poor households.
-
2,000
4,000
6,000
8,000
10,000
12,000
14,000
2001 2002 2003 2004 2005 2006
Population/licensedpharmacist
Population/doctor

50
FIGURE 9: AVERAGE ANNUAL SPENDING FOR SELF-MEDICATION PER HOUSEHOLD
0
10
20
30
40
50
60
70
80
90
Poor Nearpoor
Average Betteroff
Rich
Avg. annualspending for self-medication perhousehold
Source: Vietnam National Health Survey 2002
Pharmaceutical law emphasizes the role of the state as only to regulate prices using policy instruments appropriate with the market, without imposing subjective opinions of regulators. Control of drug prices was for drugs listed in the essential drug list and drugs used in health facilities. In 2003, there was a dramatic rise in drug prices (20 percent) [Medical price index of the GSO]. The drug prices continued to increase in the following years. Measures were taken to stabilize drug prices. These measures included: publishing (on the Vietnam DAV Web site) the import prices (Cost Insurance and Freight [CIF]); tentative wholesale and retail prices in Vietnam of registered and imported drugs as a reference price for users; allowing parallel imports of drugs with high prices in the Vietnamese market; and enforcement of posting prices at drug retailers. However, there is still lack of a sustainable strategy for controlling drug prices in a free pharmaceutical market. In two provinces, the control of drug prices was mainly concentrated on the enforcement of regulations making drug prices public and displaying them.
51
4.6 HEALTH INFORMATION SYSTEMS
The HIS function of the health system was examined in four components: Resources, Policies and Regulation; Data Collection and Quality; Data Analysis; and Use of Information for Management. Each component was further disaggregated into a number of indicators. Altogether, the HIS system module has 19 indicators. The summary scoring information for HIS is found in the following table, while detailed scores are presented in Table 6 of Annex B.
TABLE 16: HEALTH INFORMATION SYSTEMS
Component Average score-
Ninh Binh
Average score-
Can Tho
Average score-
National Resources, policies, and regulations 1 1 1.7 Data collection and quality 1.12 1.12 1.42 Data analysis 1.42 1.58 2 Use of information for management, policy making, governance, and accountability
1 1 1.5
COMPONENT 1: RESOURCES, POLICIES, AND REGULATION
Resources, policies, and regulations govern the status and availability of health information. Five indicators were used to measure the impact of resources, regulations, and policies on HIS functioning in Vietnam’s Ninh Binh and Can Tho provinces. The indicators include: the availability of financial and/or physical resources to support HIS-related items within MOH/central budget, regional, and/or district budgets; the presence of international donors providing specific assistance to support strengthening the entire HIS or its individual and/or vertical components in more than one region; the existence of policies, laws, and regulations mandating public and private health facilities/providers to report indicators determined by the national HIS; the presence of clear procedures for allocating resources and planning in the health system based on the information products of HIS; and the presence of mechanisms to review the utility of current HIS indicators for the planning, management, and evaluation process, and to adapt and modify them accordingly.
The national government is responsible for providing the equipment, forms, training and ICT, and operational costs to run HIS, but there is no specific line item in the budget for HIS operations. Provincial Bureaus of Finance receive funds from the MOH, and the funds are allocated by the Provincial Health Service to provincial health facilities. Funding for HIS is typically a low priority and allocations for it are irregular, particularly in poor areas (HMN 2006).
All health facilities have paper record books, forms, and instruments for data collection and regular reporting. However, these forms only allow data to be collected manually. Documents are stored as hard copies only. The policy of hospital autonomy has challenged them to improve their information management capacity. Better management capacity helps hospitals increase their revenue and use resources more effectively. After the policy on hospital autonomy was implemented most hospital managers, particularly provincial hospitals, have recognized the need for HIS in management and they themselves have allocated money for buying computers and software for data management. The MOH also developed a software program called Medisoft for hospital management and introduced it to hospitals nationwide. However, the software application is not well implemented because hospitals at lower levels lack computers as well as skills to deal with the software application. Limited investment in the HIS and lack of equipment characterize electronic HIS in Vietnam.
52
In Can Tho and Ninh Binh, the province does not provide the equipment, forms, training and ICT for HIS management. There is no specific line item in the health budget for HIS operations in the province. Some hospitals do it through 112 Project (Informative and Technology project) or finance HIS themselves. Financing for HIS is also sometimes available from donors (such as the Asian Development Bank [ADB], UNICEF project) to support some hospitals with better HIS management. Results from onsite interviews revealed that there is a need among district hospitals for hospital management software programs, but they cannot afford to buy them. The district hospitals in Can Tho have received hospital management software from ADB, but they cannot apply it due to a shortage of computers.
Funding for HIS is provided by some donors such as the World Bank, GTZ, WHO, ADB, and others. This support focuses only on certain provinces providing particular priority services. In Ninh Binh, there is donor funding for specific areas of HIS activities, but equipment was provided only to Kim Son District Hospital in order to monitor the ADB Rural Health Support project. The information collected assists the ADB project, but it was not used for provincial health planning. In Can Tho, the ADB provides IT support for health information to Omon district. Omon district received a server, nine computers, and training support. However, training and electronic data collection is only being used for the clinical department.
The MOH requires all public and private health facilities/providers to report to a State administrative agency. There is no legislation on HIS per se, but general procedures exist for collecting and collating data at national level. The MOH Health Statistics and Information Division (HIDS), within the Planning and Finance Department, determines which health indicators are required. The main responsibility of HIDS Division is updating the indicators list and supplying the list to the MOH. In Ninh Binh and Can Tho, a planning department is responsible for collecting the required data from both the private and public facilities.
One issue currently facing HIS is the lack of an organised systematic approach to collect HIS data. According to a recent HMN assessment, certain indicators are repeatedly collected, creating overlaps among institutions and extra workload. Other indicators are completely overlooked, and not collected by anyone (2006). In addition, a standard mechanism to review and update HIS data for planning and management is lacking at both the national and provincial levels. HIS indicators are used for planning and management, but data are not frequently updated. Furthermore, data on private sector activities is lacking. Laws and regulation governing data collection in the public sector are not easily applied in the private sector. Large private facilities submit regular reports to a State administrative agency, while smaller private facilities go unsupervised.
In Vietnam, the MOH has procedures for planning resource allocation based on health outcome data. For example, mortality indicators such as IMR, U5MR, MMR were used to allocate budget for maternal and child health programs. Despite provincial and local planner’s priorities, however, they must not exceed their budget allocations. Due to limited resources, many funding requests were cut during the allocation procedures. Ninh Binh and Can Tho provinces both reported insufficient funds for HIS and other health priorities. Thus, clear procedures exist for using HIS data in planning, but budgets are often too tight to adjust according to need.
COMPONENT 2: DATA QUALITY
Data quality is critical to health planning and information systems. It can be difficult to verify. For the purposes of this assessment the following indicators were used to examine data quality: the percentage of districts represented in reported information; Percentage of private health facility data included in reported data; Availability of clear standards and guidelines for data collection and reporting procedures;

53
Number of reports a typical health facility submits monthly, quarterly, or annually; Presence of procedures to verify the quality of data reported, such as data accuracy checklists prior to report acceptance, international data quality audit visits; and the availability of a national summary report which contains HIS information, analysis, and interpretation (most recent year).
In Vietnam, annual, bi-annual, and monthly reporting is strictly regulated. Every province and district is responsible for timely report submission. MOH has clear reporting procedures which are applied at the provincial, district and commune levels. For example, in both Can Tho and Ninh Binh, all districts must submit annual and monthly reports to the PHD. The information is then aggregated and reported to the central level. It is difficult to verify the accuracy of district and provincial reports. Information on data quality in Can Tho and Ninh Binh’s provincial and district reports was sparse. Currently, there is no defined mechanism in Vietnam for reviewing and verifying the quality of data. HMN findings showed that the data reaching the national level for certain indicators was inconsistent across various sources. This is not surprising considering that the sampling methods are not uniform. Separate reporting forms and activities are conducted at all levels of the health system (2006).
Other factors that contributed to the low quality of data are the lack of consistency of data forms throughout the system, and lack of harmonisation with MOH official software (Medisoft). All the staff who are responsible for data management in different levels always have difficulties in entering data from data forms into software or analysing/exporting data to report forms. Collecting and reviewing private sector data poses significant challenges in Vietnam. In both Ninh Binh and Can Tho, most private facilities obey monthly and annual reporting requirements. Data collected from the private sector is included in national reports. However, as with public sector data, it is difficult to verify the accuracy of the information provided by the private sector. There is a lack of information sharing among the private sector and State management agencies.
The MOH has created national guidelines for data collection and reporting. The guidelines include things like formulas for calculating percentages, etc. The MOH sends the guidelines to the provincial department of health. At the provincial level, the occupational medicine division then organizes training workshops for health facilities of Ninh Binh and Can Tho provinces on how to collect, calculate, and report on data. In theory, these clinical standards are provided for both public and private health facilities. However, standards and guidelines are not available in the private health facilities. Furthermore, although guidelines are available at the provincial level, they are often stored on a bookshelf and not readily available at the district level. Therefore, the issue of available reporting guidelines can be considered a weakness of HIS in Vietnam.
COMPONENT 3: DATA ANALYSIS
Data analysis was examined in terms of availability of qualified personnel and infrastructure to conduct analyses. At the central level, the different formats in which different data sources provide information is challenging. In recent years, the MOH has published the health statistics year book annually. Data from this book is available and could be used for analysis however, the central level lacks the personnel required to conduct data analysis.
The health system assessment team found similar constraints in Ninh Binh and Can Tho provinces. Most data collected at the local level is stored in books or printed reports. They lack the physical infrastructure and human resources needed to publish the data in more usable formats.
54
COMPONENT 4: USE OF INFORMATION FOR MANAGEMENT, POLICY MAKING, GOVERNANCE AND ACCOUNTABILITY
Component four of the health information system received the lowest score among the HIS components. The indicators that were used to measure this component included whether the data was used for planning, budgeting, or fundraising activities in the past year and whether feedback was given to data providers to inform them of program performance.
The health information system lacks data, especially on private sector performance. Dissemination of existing data is limited, and is mostly kept among internal users. Some existing data sources are used by management and for policy making.
The assessment findings show that national, provincial, and district officials do not provide feedback on reports that they receive from lower levels. One staff member working at a general provincial hospital, told the assessment team that they never receive feedback on the reports from authorized departments even when it is specifically requested.
There is a lack of collaboration and information sharing within the health sector and with other sectors. Overlaps in information collection, variations in data reported across ministries, and information that fails to meet the needs of users, are all common concerns with the national information systems.
55
5. DISCUSSION
The six health system functions (governance, financing, service delivery, human resources, health information systems, and pharmaceutical management) are examined discretely in the findings section, whereas, in reality all health system functions overlap and interact with one another. Using findings from across the six health system functions, the following sections discuss health system performance in Ninh Binh and Can Tho provinces. The WHO health systems performance criteria: equity, efficiency, access, quality, and sustainability served as a framework to examine the provincial health system performance. A few indicators from each functional area were chosen to provide insight into these criteria across the provincial health systems.
5.1 EQUITY
Equity refers to the absence of systematic disparities in health between social groups who have different levels of underlying social advantage or disadvantage – that is different positions in a social hierarchy20. From a literature review, equity in health implies ideally everyone should have a fair opportunity to attain their full health potential and more pragmatically that none should be disadvantaged from achieving this potential, if it can be avoided21. According to this, equity in health should include: (i) equal access to available care for equal need; (ii) equal utilization for equal need and; (iii) equal quality of care for all.
Performance of the health care system in terms of equity was assessed based on a number of indicators. Table 17 summarizes the indicators used to examine equity across the health system.
TABLE 17. INDICATORS SELECTED FOR EQUITY
Health Systems Function
Indicators selected for equity analysis
Can Tho Ninh Binh
Finance Indicator 6. OOP health expenditure as % of total health expenditure
2 2
Subsidy Suggested Indicator for Vietnam: Coverage of vulnerable groups subsidized from government budget for health care
3 3
Service provision Indicator 16. Existence of user fee exemptions and waivers 2.6 2.4 Human resources Indicator 2: The distribution of health care professionals by
level of care in urban and rural areas Distribution of health care professionals by curative care, preventive care, and pharmaceutical service
1.87 2
In Vietnam, at both provincial and national levels equity in the health system is influenced by several different circumstances: government regulations, out of pocket spending, pro-poor health insurance, human resource distribution at CHS level, and data availability on finance and demographics.
20 WHO’s definition 21 Margaret Whitehead, 1993. Conceptualizing equity in health and health care.
56
In Vietnam, OOP22 health expenditure accounts for a high percentage of total health expenditure (about 60 percent) at the national level and similar amounts in Ninh Binh and Can Tho provinces. This high proportion of OOP indicates a potential for significant inequality in health care.
Equity also implies equal quality of care. Providers must strive to deliver quality services for all sections of the community, so that everyone can expect the same standard of professional care. Equitable distribution of health care workers at all levels of care will ensure that the entire population at different levels can receive equal quality of care. In both assessment provinces, the health system at the district level is faced with shortages of health staff, especially medical doctors. This is due to the tendency of medical doctors to move from public health facilities to private health facilities or from rural to urban areas. Another indicator that can demonstrate the inequitable distribution of health care professionals at the lower level is the percentage of CHSs with medical doctors. According to the national benchmark, each commune health station should have at least one medical doctor.
However, at the national level, results show that the proportion of CHSs with a medical doctor was 61.2 percent only (MOH 2006b). In the two assessment provinces, Ninh Binh and Can Tho, these proportions are 53.1 percent and 62.7 percent respectively. These results reflect moderate success in providing equal quality of services at the commune level.
The imbalance of human resource distribution by levels and by field of works (curative and preventive) is still a problem in Vietnam. The distribution of the professional health workforce at upper levels is higher than that at lower levels, with distributions at commune level being the lowest at 17 - 31.1 percent; The percent of health staff working in the field of curatives are more than 70 percent of the total heath professional work force (MOH 2006b). This ratio is much lower than that of national data (81.8 percent) (Chien 2007); Thus, the local team suggests adding an indicator to evaluate the equity of the health system in terms of human resource dollars: “Distribution of health care professionals by curative care, preventive care, and pharmaceutical service”.
5.2 EFFICIENCY
The term “efficiency” of the health system is used in the sense of how well resources are used to produce the desired outcomes and could be defined as obtaining the best possible value for the resources used. Technical efficiency means producing the maximum possible sustained output from a given set of inputs. Allocative efficiency is when resources are allocated in such a way that any change to the amounts or types of outputs currently being produced (which might make someone better off) would make someone worse off.
Efficiency can be estimated in terms of health alone, the defining goal of the health system. From this perspective, Vietnam achieved better health indicators (such as life expectancy at birth, mortality rate of children under 5, etc) than a number of countries with the same level of per-capita total health expenditure. Measurement of efficiency by health attainment alone cannot provide the basis for health policymakers to improve the health system.
Efficiency of the health care system in Vietnam was influenced by several different national and local situations, which can be summarized as follows. First, current fee-for-service arrangements are not efficient. The integration of various programs at primary care level has promoted efficiency among
22 According to the WHO, OOP health expenditure as percentage of total health expenditure as well as ratio of total health spending to total non-food spending
57
vertical programs. Finally, generic pharmaceuticals are not well known, but procurement of pharmaceuticals occurs through competitive bidding.
Total expenditure on health as proportion of GDP has increased moderately from $524 (2000) to $644 (2006) 23. Resources are available at the national level to increase access to basic health care for the population including the specific needs of vulnerable groups. In Ninh Binh, total expenditure on health as proportion of GDP has been decreasing since 2005, from 13.4 to 9.8 percent in 2007.24 In Can Tho, total expenditure on health as proportion of GDP seems to have been more stable than in Ninh Binh but the proportions are lower.
In terms of total health sector resources per capita, the national health financing system of Vietnam has grown rapidly, from a very low level of health financing (26 US$/capita in 2003 [NHA 2003] to 45 US$/capita in 2006 [NHA 2006]. However, a major share of total resources continues to come from household OOP payments (accounts for 60.8 percent).
Achievements in preventive health in Vietnam demonstrates the level of efficiency of the health system. Service provision indicators showed that the availability of integrated primary health care services (immunizations, TB, prenatal care, family planning, malaria, nutritional services were “adequate” for both provinces and national level). In Vietnam many programs are implemented at grassroots level (such as immunizations, TB, HIV/AIDS, prenatal care, family planning, malaria, etc). Even though they are separate national vertical programs, most of them are integrated at the commune level. However, they are not fully integrated. For instance, reporting systems for each program are separately executed at the commune level.
Positive health outcomes have also demonstrated the efficiency of the health care system in Vietnam. Results from the assessment indicate that nearly all basic health outcome objectives in both Ninh Binh and Can Tho provinces have been achieved. Successfully achieved outcomes include: the infant mortality rate, the maternal mortality rate, the under-5 mortality rate, and child malnutrition. In Ninh Binh province, the IMR is 3 per 1,000 live births, and the U5MR is 2.5 per 1,000 live births. The MMR was estimated to be 2.5 maternal deaths per 100,000 live births in Ninh Binh and 3.8 in Can Tho province. These maternal mortality outcomes in Ninh Binh and Can Tho provinces are much better than the national average of 75.1.
The inefficiency of drug procurement is impacted by the use of brand names as opposed to generic drugs. Provincial data showed that brand names are nearly always prescribed. The concept of generic drugs is new for many physicians. On the other hand, it is very encouraging that most of the drugs used in public hospitals were procured through competitive bidding. Some drugs, such as drugs for national vertical health programs were procured through competitive bidding at the national level. Competitive bidding allows hospitals to purchase good quality drugs for the most competitive price. The “Collective bidding procurement” or central procurement also indicate efficiency of the pharmaceutical system at the national level.
Vietnam has several functional mechanisms to improve the rational use of drugs at hospitals such as: Committee for drugs and therapeutics; regulations for medical record review; and improvement of clinical pharmacies in hospitals. Vietnam also has a routine data collection system for efficacy, quality and safety of marketed pharmaceutical products through the hospital’s drug information unit. There was a
23 5,24 (2000); 5,58 (2001); 5,13 (2002); 5,22 (2003); 5,52 (2004); 5,91 (2005); 6,44 (2006) – National Health Account, 2000-2006 24 13,4 (2005); 9,6 (2006); 9,8 (2007) – Financial report of Ninh Binh province, 2007
58
difference in the concept of quality in pharmaceutical management in this HSAA as opposed to the regular report delivered by DAV. From the DAV perspective, quality assurance is aimed at providing quality drugs for people based on standards and guidelines for drug production, quality control, storage, and distribution. The HSA focuses mainly on outcome quality while DAV is more interested in process quality.
5.3 ACCESS
Access is a measure of the extent to which a population can reach the health services it needs. It relates to the presence or absence of economic, physical, cultural or other barriers that people might face in using health services. In general, access to health services implies that both ill and healthy persons can have access to the health services they need. Access to health services depends on availability of health services, geographic and cultural characteristics, financial ability, and availability of health care staff. Table 18 shows indicators used to examine the six health system functions in terms of accessibility. Access to health care services was influenced by governance policies promoting financial access. The distribution of health facilities and human resources across geographic areas allowed for access to most areas, including rural areas. However, for ethnic minority groups living in mountainous areas, access was impeded by transportation, linguistic, and cultural barriers. Data for policy making and planning was more accessible at the national level. The provinces assessed lacked resources for adequate infrastructure and personnel.
TABLE 18. INDICATORS SELECTED FOR ACCESSIBILITY OF THE HEALTH CARE SYSTEM
Health Systems Function
Indicators selected for access analysis
Can Tho Ninh Binh
Finance Indicator 6. OOP spending as % of private expenditure on health (fees for service, medicines, co-payments, deductibles)
2.5 2.5
Service provision Indicator 10. Number of primary care facilities in health system per 10,000 population
3 3
Human resources Indicator 1. The ratio of cadres of health care professionals to the population
2.28 1.97
Major policies that ensure financial access to health care services and have created a platform for health care accessibility are: the policy on development of grassroots health care, the health care fund for the poor, Government Decree 63 on health insurance, and the policy on free health care for children under 6 years old. As discussed with regard to equity, the 2002 government decree on health care for the poor has reduced financial barriers to access such that by 2007, 17.2 percent of total population had received a Health Insurance card for the poor. Furthermore, to increase accessibility of other vulnerable groups, the State budgets also covered health care for near-poor, children under six, and elderly. Vietnam is the only country in the region to have a policy regarding health care for vulnerable groups to ensure equity and accessibility in health care. However, some beneficiaries still had to face financial difficulty in seeking health care because of payments for medicines or payments for indirect costs such as food and transportation. Indirect costs are a barrier for poor people to get the necessary health care services, especially inpatient services.
Physical or geographic access measures the extent to which health services are available and reachable by people. At the national level as well as in Ninh Binh and Can Tho provinces, availability of health services is fairly good in terms of quantity of health facilities. Most communes have health workers. The proportion of communes which had commune health stations (CHS) was 98 percent (10.683/ 10.881 communes). On average, each commune has 3,000 to 10,000 inhabitants. Therefore, each 10,000 population has at least 1 to 3 primary care facilities.
59
However, this does not guarantee equal access to health services in different areas. According to data from MOH, there is a remarkable difference in the availability of health services between urban and rural areas and by regions. The proportion of residents living within easy access to hospitals was much higher in urban areas than in rural ones. On the contrary, access to health facilities at lower levels such as regional polyclinic (RPC) and CHS, is similar between urban and rural areas. In recent years, the Government has made a significant investment in the health network at grassroots level to make it easier for people to have access to public health facilities. In our assessment, all communes in Can Tho province have CHS, but in Ninh Binh there are four communes that still do not have CHS, two in Tam Diep district, and two in Nho Quan district. However, this is due to the recent split of each of those communes into two smaller ones.
Distance to a health facility affects access to health and it is one of the indicators that reflect physical access to health. However, it is not enough to measure physical access by distance. With the same distance, it takes more time to go to health facilities in mountainous areas than in urban or plain areas due to poor quality roads and inconvenient types of transportation. In recent years, people’s physical access to health facilities has improved remarkably due to the development of transportation infrastructure. However, access to health facilities for people in mountainous areas is impeded by both transportation and ethnic barriers. Most ethnic minorities live in the mountains or other difficult terrain. Language and customs prevent them from freely accessing health services.
Accessibility in terms of human resources is expressed in terms of availability of health care staff, or the ratio of cadres of health care professionals to the population. The two assessment provinces have a shortage of health workers compared with national averages. The ratio of doctor to 10,000 population of both Ninh Binh and Can Tho are lower than the ratio for the whole country. Other types of health professionals such as pharmacists, nurses, asst. doctors, etc. are also in the same situation. Unfortunately, due to shortages of administrative management staff, a number of highly skilled health professionals have moved to higher positions of administration. In addition, the loss of skilled professionals from the public to the private sector was also raised as a concern by the provinces. Private health clinics can offer much higher salaries and there is a tendency for more and higher quality health workers to leave the public sector to work in the private sector. This issue is more serious in big cities including Can Tho. Furthermore, it is becoming very difficult to recruit well-trained new health care staff. In Ninh Binh province, no new medical doctors are available to work at the district level. If the present workforce imbalances persist, the shortage of health workers will be more serious in the coming year. In two provinces, the ratio of health professionals per population is not high enough to ensure accessibility of human resources.
5.4 QUALITY
According to WHO, quality is defined as the characteristic of a product or service that influences its ability to satisfy stated or implied needs. Quality can be assessed from different perspectives including: (1) patient quality; (2) technical quality; (3) management quality; and (4) human resource quality. Quality can be observed in terms of the individual’s perceived needs or in terms of the society’s perceived needs. With regard to the health system, we seek to achieve quality at the population level that may be different from the individual level quality. Improving quality contributes to enhancement of the outcomes of health care services, which are valued by individuals and populations. Quality strategies strengthen health systems by increasing the contribution of health services and health systems to the highest attainable level of health of individuals and populations.
Quality is reflected through the availability of updated clinical standards for MOH priority areas, high burden diseases areas, and/or areas responsible for high morbidity and mortality. In Vietnam, the
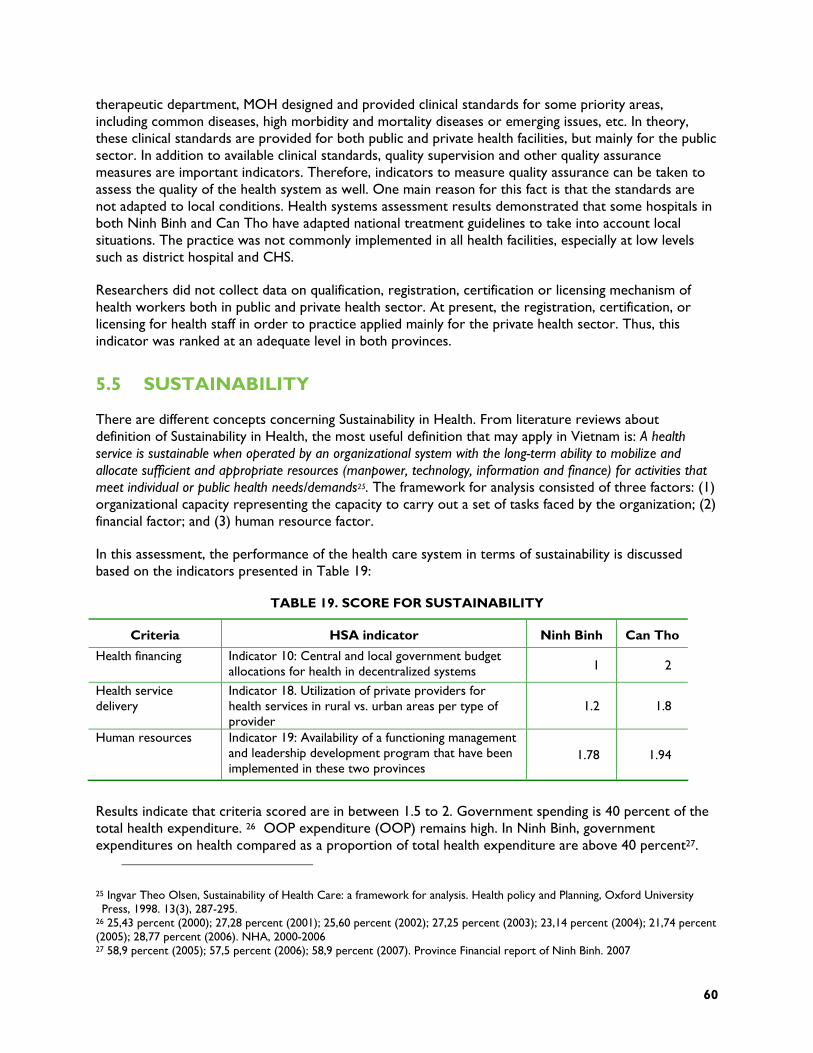
60
therapeutic department, MOH designed and provided clinical standards for some priority areas, including common diseases, high morbidity and mortality diseases or emerging issues, etc. In theory, these clinical standards are provided for both public and private health facilities, but mainly for the public sector. In addition to available clinical standards, quality supervision and other quality assurance measures are important indicators. Therefore, indicators to measure quality assurance can be taken to assess the quality of the health system as well. One main reason for this fact is that the standards are not adapted to local conditions. Health systems assessment results demonstrated that some hospitals in both Ninh Binh and Can Tho have adapted national treatment guidelines to take into account local situations. The practice was not commonly implemented in all health facilities, especially at low levels such as district hospital and CHS.
Researchers did not collect data on qualification, registration, certification or licensing mechanism of health workers both in public and private health sector. At present, the registration, certification, or licensing for health staff in order to practice applied mainly for the private health sector. Thus, this indicator was ranked at an adequate level in both provinces.
5.5 SUSTAINABILITY
There are different concepts concerning Sustainability in Health. From literature reviews about definition of Sustainability in Health, the most useful definition that may apply in Vietnam is: A health service is sustainable when operated by an organizational system with the long-term ability to mobilize and allocate sufficient and appropriate resources (manpower, technology, information and finance) for activities that meet individual or public health needs/demands25. The framework for analysis consisted of three factors: (1) organizational capacity representing the capacity to carry out a set of tasks faced by the organization; (2) financial factor; and (3) human resource factor.
In this assessment, the performance of the health care system in terms of sustainability is discussed based on the indicators presented in Table 19:
TABLE 19. SCORE FOR SUSTAINABILITY
Criteria HSA indicator Ninh Binh Can Tho
Health financing Indicator 10: Central and local government budget allocations for health in decentralized systems 1 2
Health service delivery
Indicator 18. Utilization of private providers for health services in rural vs. urban areas per type of provider
1.2 1.8
Human resources Indicator 19: Availability of a functioning management and leadership development program that have been implemented in these two provinces
1.78 1.94
Results indicate that criteria scored are in between 1.5 to 2. Government spending is 40 percent of the total health expenditure. 26 OOP expenditure (OOP) remains high. In Ninh Binh, government expenditures on health compared as a proportion of total health expenditure are above 40 percent27. 25 Ingvar Theo Olsen, Sustainability of Health Care: a framework for analysis. Health policy and Planning, Oxford University Press, 1998. 13(3), 287-295.
26 25,43 percent (2000); 27,28 percent (2001); 25,60 percent (2002); 27,25 percent (2003); 23,14 percent (2004); 21,74 percent (2005); 28,77 percent (2006). NHA, 2000-2006 27 58,9 percent (2005); 57,5 percent (2006); 58,9 percent (2007). Province Financial report of Ninh Binh. 2007
61
Out of pocket expenditures are moderate and coverage is high (including for preventive care as well as for vulnerable groups). Similar to Ninh Binh, government expenditures on health in Can Tho were also above 40 percent28; out of pocket expenditures are moderate. However, coverage is moderate. Percentage of OOP expenses is lower in Ninh Binh than Can Tho province. This is understandable because the proportion of the poor in Ninh Binh is higher than in Can Tho and they are eligible for the national health insurance scheme.
Despite the increase in the number of development partners in Vietnam, the percentage of donor spending on health compared to total national health spending is moderately declining and government dependence on donor funds for health services is declining as well, down from 2.67 percent in 2000 to 2.33 percent in 200629. In Ninh Binh, the percentage of donor spending on health is very small (only .33 percent in 2007) and local government does not depend on donor funds for health services30.
The sustainability of health financing at national and provincial levels is a weakness that should be addressed. National and provincial level health systems lack adequate funds to maintain their activities due to the realities of health system development and the health care situation of the provinces. Local governments are responsible for health financing according to the decentralized system, therefore, local governments have responsibility for additional resources for health. This responsibility increases commitment from local government to make their budget allocations sustainable within the decentralized system.
Institutional capacity in the 2 provinces is weak. According to the activities in terms of program development and management strengthening capacity of the leaders, PHB in the provinces have already organized some short courses as well as sent their staff to attend the training courses at central level. However, neither of the assessment provinces have established a long term program for management and leadership development. There is no standard national program or courses for developing and strengthening management capacity in health. Courses for this objective are usually organized in a non-systematic way by some National health programs/projects or some departments from MOH. In addition, most of the courses are usually for a short period and only focus on certain aspects of the health management. In the training institutions (both for health sector and other sectors), the curriculum and training program for long term training in health management are not formally available, therefore most of the leaders in the health sector have not been specialized and qualified in health management skills. Thus, the health managers have difficulty managing health facilities in the current transition economy. This problem is particularly acute at provincial levels. Under the circumstance of Vietnam, the leaders/heads of health facilities do not have appropriate management training. In order to address the sustainability of the health system in terms of human resources, the local situation could be better measured with an additional indicator such as: “Percentage of health facilities managers trained in Leadership/Management: “
28 44,3 percent (2005); 50,3 percent (2006); 50,3 percent (2007). Province Financial report of Ninh Binh. 2007 29 2,67 percent (2000); 2,74 percent (2001); 3,43 percent (2002); 2,72 percent (2003); 2,23 percent (2004); 2,43 percent (2005); 2,33 percent (2006). NHA, 2000-2006 30 0,20 percent (2005); 0,16 percent (2006); 0,33 percent (2007). Province Financial report of Ninh Binh. 2007

63
6. CONCLUSIONS
Six major conclusions can be drawn from this assessment. First, the provincial health systems in both Ninh Binh and Can Tho provinces are highly functional. Specifically, the role of government is well identified. Mechanisms are in place to encourage civil society participation in policy making. The decentralization process, including budget allocations appears to be reaching all levels of care.
Second, Health information systems received the lowest score of all the health system functions. Nearly every component received a score of less than adequate. In both provinces, the provincial/local government does not provide the equipment, forms or training regarding health information management. The HMIS in the two provinces are funded mostly by central budget and projects; statistical and computer staff are few and their technical qualifications are limited, especially at the grassroots level.
Third, from the health financing aspect, out of pocket health expenditure patterns and increases in per capita health expenditure suggest that finances may act as a barrier to accessing health services. The central government has tried to mitigate the effects of high OOP expenditure with its exemption policies for the poor and near poor. Budget allocation mechanisms for health are not based on outputs.
Fourth, the public health facilities in Ninh Binh and Can Tho have wide service coverage. The service delivery access and coverage component received high scores. At the provincial level, there are provincial general hospitals and provincial specialized hospitals such as TB and lung diseases, and traditional medicine. At the district level, there are district hospitals that treat inpatients using basic techniques for emergency care and common diseases. At the commune level, the commune health station (CHS) mainly focuses on preventive care and provision of outpatient care services.
Fifth, Vietnam has a relatively adequate number of human resources for health. In two provinces, there are shortages of certain specialist cadres at grass roots level due in part to the change in health system structures at that level in recent years (new structure was established at district level). New managers at varying levels of care have come from among the most senior health facility staff, particularly specialists. The organizational changes have also contributed to the staffing shifts within provinces towards higher levels of care. The performance management component shows a weakness in the area of salary and merit awards. Job descriptions are available and regularly updated, but only for certain positions. There is also no formal mechanism for individual performance planning.
Finally, in the two provinces, the pharmaceuticals management function generally scored well. The procurement component appeared to be the only serious weakness in pharmaceutical management. The other seven components of pharmaceutical management, including budgeting, financing for drugs, pharmaceutical policies and accessibility to good quality products and services, had good profiles. The weaker profiles were for rational use of drug and storage and distribution aspects. Mechanisms to improve the use of medicines in hospitals and treatment guidelines for common health problems existed but did not function very well in both public and private facilities. Standardized quantification methods for drug procurement were not applied in these two provinces. Different hospitals used different methods to estimate drug quantity needs for procurement.
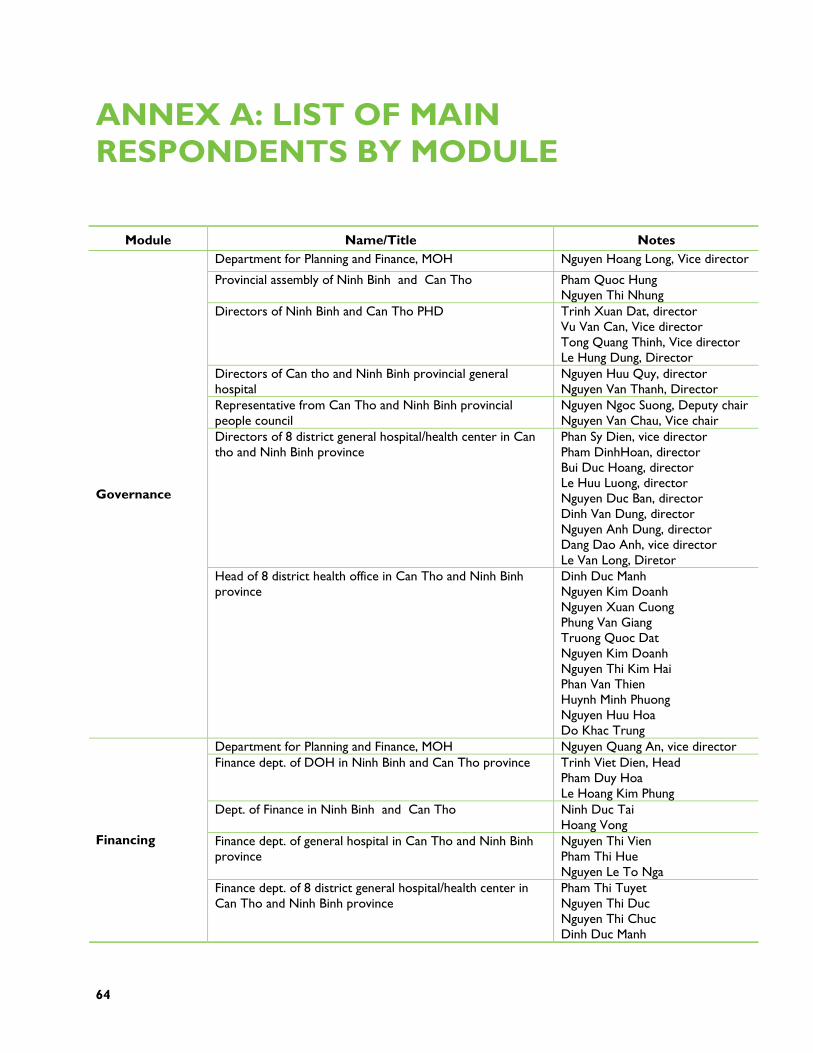
64
ANNEX A: LIST OF MAIN RESPONDENTS BY MODULE
Module Name/Title Notes Department for Planning and Finance, MOH Nguyen Hoang Long, Vice director
Provincial assembly of Ninh Binh and Can Tho Pham Quoc Hung Nguyen Thi Nhung
Directors of Ninh Binh and Can Tho PHD Trinh Xuan Dat, director Vu Van Can, Vice director Tong Quang Thinh, Vice director Le Hung Dung, Director
Directors of Can tho and Ninh Binh provincial general hospital
Nguyen Huu Quy, director Nguyen Van Thanh, Director
Representative from Can Tho and Ninh Binh provincial people council
Nguyen Ngoc Suong, Deputy chair Nguyen Van Chau, Vice chair
Directors of 8 district general hospital/health center in Can tho and Ninh Binh province
Phan Sy Dien, vice director Pham DinhHoan, director Bui Duc Hoang, director Le Huu Luong, director Nguyen Duc Ban, director Dinh Van Dung, director Nguyen Anh Dung, director Dang Dao Anh, vice director Le Van Long, Diretor
Governance
Head of 8 district health office in Can Tho and Ninh Binh province
Dinh Duc Manh Nguyen Kim Doanh Nguyen Xuan Cuong Phung Van Giang Truong Quoc Dat Nguyen Kim Doanh Nguyen Thi Kim Hai Phan Van Thien Huynh Minh Phuong Nguyen Huu Hoa Do Khac Trung
Department for Planning and Finance, MOH Nguyen Quang An, vice director Finance dept. of DOH in Ninh Binh and Can Tho province Trinh Viet Dien, Head
Pham Duy Hoa Le Hoang Kim Phung
Dept. of Finance in Ninh Binh and Can Tho Ninh Duc Tai Hoang Vong
Finance dept. of general hospital in Can Tho and Ninh Binh province
Nguyen Thi Vien Pham Thi Hue Nguyen Le To Nga
Financing
Finance dept. of 8 district general hospital/health center in Can Tho and Ninh Binh province
Pham Thi Tuyet Nguyen Thi Duc Nguyen Thi Chuc Dinh Duc Manh
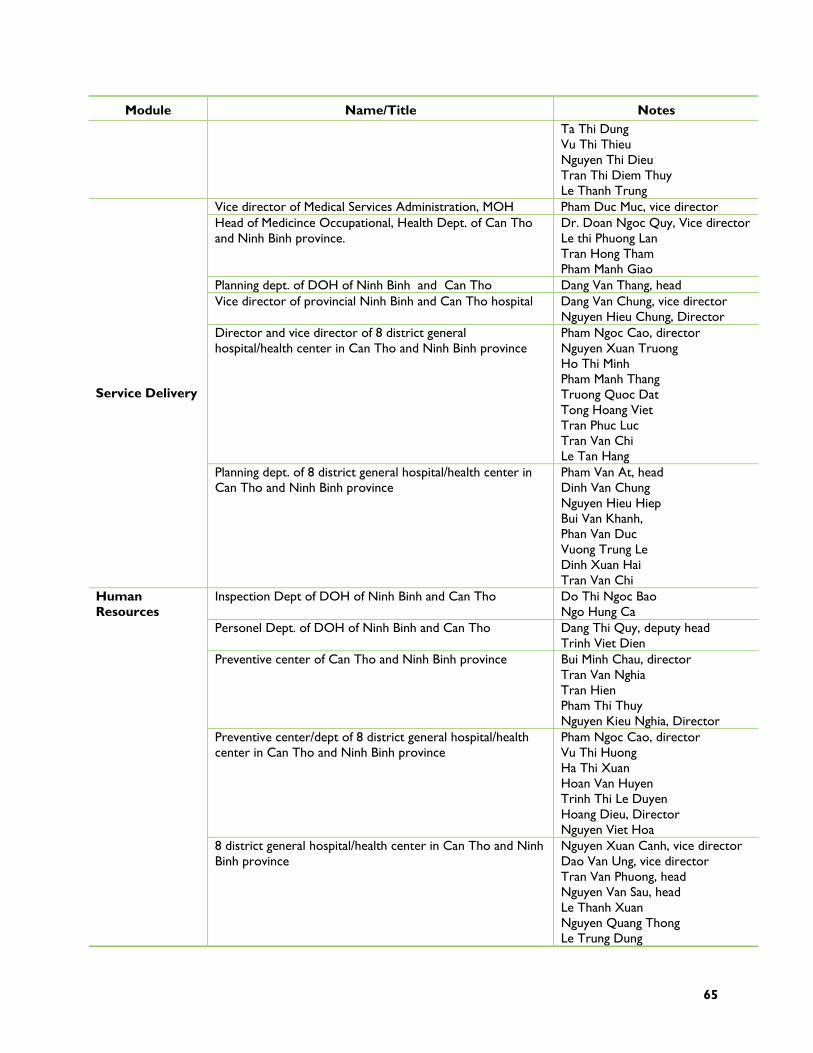
65
Module Name/Title Notes Ta Thi Dung Vu Thi Thieu Nguyen Thi Dieu Tran Thi Diem Thuy Le Thanh Trung
Vice director of Medical Services Administration, MOH Pham Duc Muc, vice director Head of Medicince Occupational, Health Dept. of Can Tho and Ninh Binh province.
Dr. Doan Ngoc Quy, Vice director Le thi Phuong Lan Tran Hong Tham Pham Manh Giao
Planning dept. of DOH of Ninh Binh and Can Tho Dang Van Thang, head Vice director of provincial Ninh Binh and Can Tho hospital Dang Van Chung, vice director
Nguyen Hieu Chung, Director Director and vice director of 8 district general hospital/health center in Can Tho and Ninh Binh province
Pham Ngoc Cao, director Nguyen Xuan Truong Ho Thi Minh Pham Manh Thang Truong Quoc Dat Tong Hoang Viet Tran Phuc Luc Tran Van Chi Le Tan Hang
Service Delivery
Planning dept. of 8 district general hospital/health center in Can Tho and Ninh Binh province
Pham Van At, head Dinh Van Chung Nguyen Hieu Hiep Bui Van Khanh, Phan Van Duc Vuong Trung Le Dinh Xuan Hai Tran Van Chi
Inspection Dept of DOH of Ninh Binh and Can Tho Do Thi Ngoc Bao Ngo Hung Ca
Personel Dept. of DOH of Ninh Binh and Can Tho Dang Thi Quy, deputy head Trinh Viet Dien
Preventive center of Can Tho and Ninh Binh province Bui Minh Chau, director Tran Van Nghia Tran Hien Pham Thi Thuy Nguyen Kieu Nghia, Director
Preventive center/dept of 8 district general hospital/health center in Can Tho and Ninh Binh province
Pham Ngoc Cao, director Vu Thi Huong Ha Thi Xuan Hoan Van Huyen Trinh Thi Le Duyen Hoang Dieu, Director Nguyen Viet Hoa
Human Resources
8 district general hospital/health center in Can Tho and Ninh Binh province
Nguyen Xuan Canh, vice director Dao Van Ung, vice director Tran Van Phuong, head Nguyen Van Sau, head Le Thanh Xuan Nguyen Quang Thong Le Trung Dung
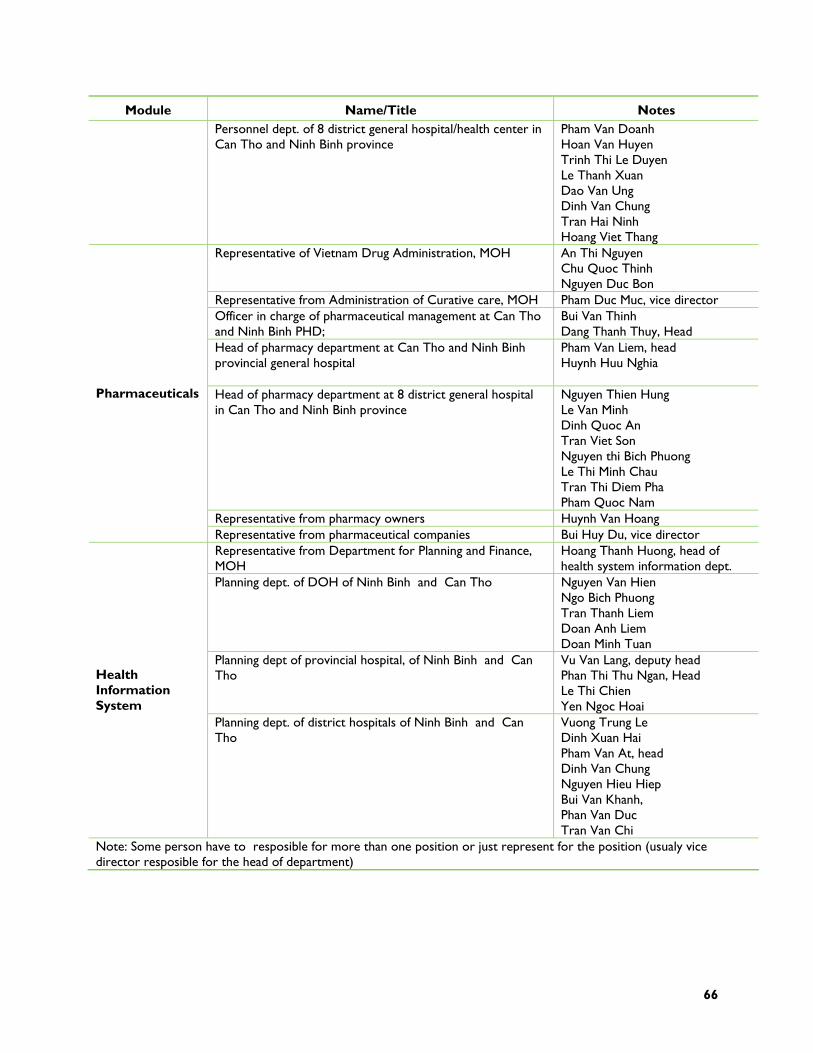
66
Module Name/Title Notes Personnel dept. of 8 district general hospital/health center in Can Tho and Ninh Binh province
Pham Van Doanh Hoan Van Huyen Trinh Thi Le Duyen Le Thanh Xuan Dao Van Ung Dinh Van Chung Tran Hai Ninh Hoang Viet Thang
Representative of Vietnam Drug Administration, MOH An Thi Nguyen Chu Quoc Thinh Nguyen Duc Bon
Representative from Administration of Curative care, MOH Pham Duc Muc, vice director Officer in charge of pharmaceutical management at Can Tho and Ninh Binh PHD;
Bui Van Thinh Dang Thanh Thuy, Head
Head of pharmacy department at Can Tho and Ninh Binh provincial general hospital
Pham Van Liem, head Huynh Huu Nghia
Head of pharmacy department at 8 district general hospital in Can Tho and Ninh Binh province
Nguyen Thien Hung Le Van Minh Dinh Quoc An Tran Viet Son Nguyen thi Bich Phuong Le Thi Minh Chau Tran Thi Diem Pha Pham Quoc Nam
Representative from pharmacy owners Huynh Van Hoang
Pharmaceuticals
Representative from pharmaceutical companies Bui Huy Du, vice director Representative from Department for Planning and Finance, MOH
Hoang Thanh Huong, head of health system information dept.
Planning dept. of DOH of Ninh Binh and Can Tho Nguyen Van Hien Ngo Bich Phuong Tran Thanh Liem Doan Anh Liem Doan Minh Tuan
Planning dept of provincial hospital, of Ninh Binh and Can Tho
Vu Van Lang, deputy head Phan Thi Thu Ngan, Head Le Thi Chien Yen Ngoc Hoai
Health Information System
Planning dept. of district hospitals of Ninh Binh and Can Tho
Vuong Trung Le Dinh Xuan Hai Pham Van At, head Dinh Van Chung Nguyen Hieu Hiep Bui Van Khanh, Phan Van Duc Tran Van Chi
Note: Some person have to resposible for more than one position or just represent for the position (usualy vice director resposible for the head of department)
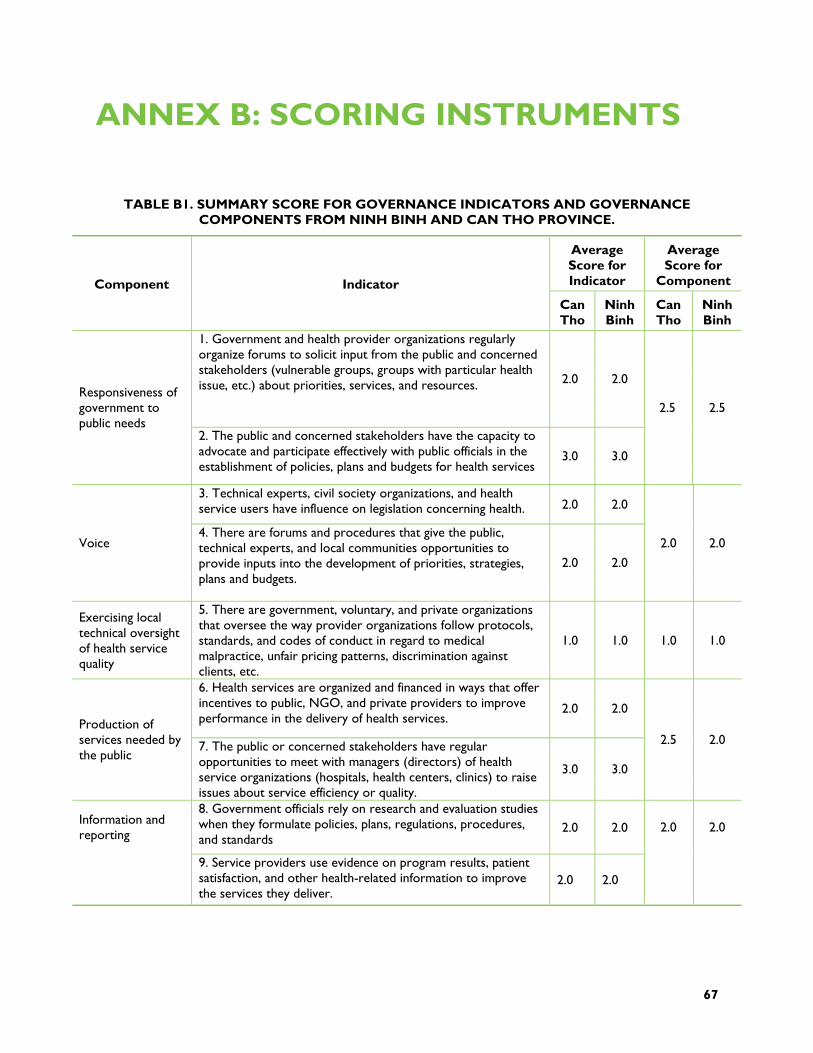
67
ANNEX B: SCORING INSTRUMENTS
TABLE B1. SUMMARY SCORE FOR GOVERNANCE INDICATORS AND GOVERNANCE COMPONENTS FROM NINH BINH AND CAN THO PROVINCE.
Average Score for Indicator
Average Score for
Component Component Indicator
Can Tho
Ninh Binh
Can Tho
Ninh Binh
1. Government and health provider organizations regularly organize forums to solicit input from the public and concerned stakeholders (vulnerable groups, groups with particular health issue, etc.) about priorities, services, and resources. 2.0 2.0
Responsiveness of government to public needs
2. The public and concerned stakeholders have the capacity to advocate and participate effectively with public officials in the establishment of policies, plans and budgets for health services
3.0 3.0
2.5 2.5
3. Technical experts, civil society organizations, and health service users have influence on legislation concerning health. 2.0 2.0
Voice 4. There are forums and procedures that give the public, technical experts, and local communities opportunities to provide inputs into the development of priorities, strategies, plans and budgets.
2.0 2.0
2.0 2.0
Exercising local technical oversight of health service quality
5. There are government, voluntary, and private organizations that oversee the way provider organizations follow protocols, standards, and codes of conduct in regard to medical malpractice, unfair pricing patterns, discrimination against clients, etc.
1.0 1.0 1.0 1.0
6. Health services are organized and financed in ways that offer incentives to public, NGO, and private providers to improve performance in the delivery of health services.
2.0 2.0 Production of services needed by the public
7. The public or concerned stakeholders have regular opportunities to meet with managers (directors) of health service organizations (hospitals, health centers, clinics) to raise issues about service efficiency or quality.
3.0 3.0
2.5 2.0
8. Government officials rely on research and evaluation studies when they formulate policies, plans, regulations, procedures, and standards
2.0 2.0 Information and reporting
9. Service providers use evidence on program results, patient satisfaction, and other health-related information to improve the services they deliver.
2.0 2.0
2.0 2.0
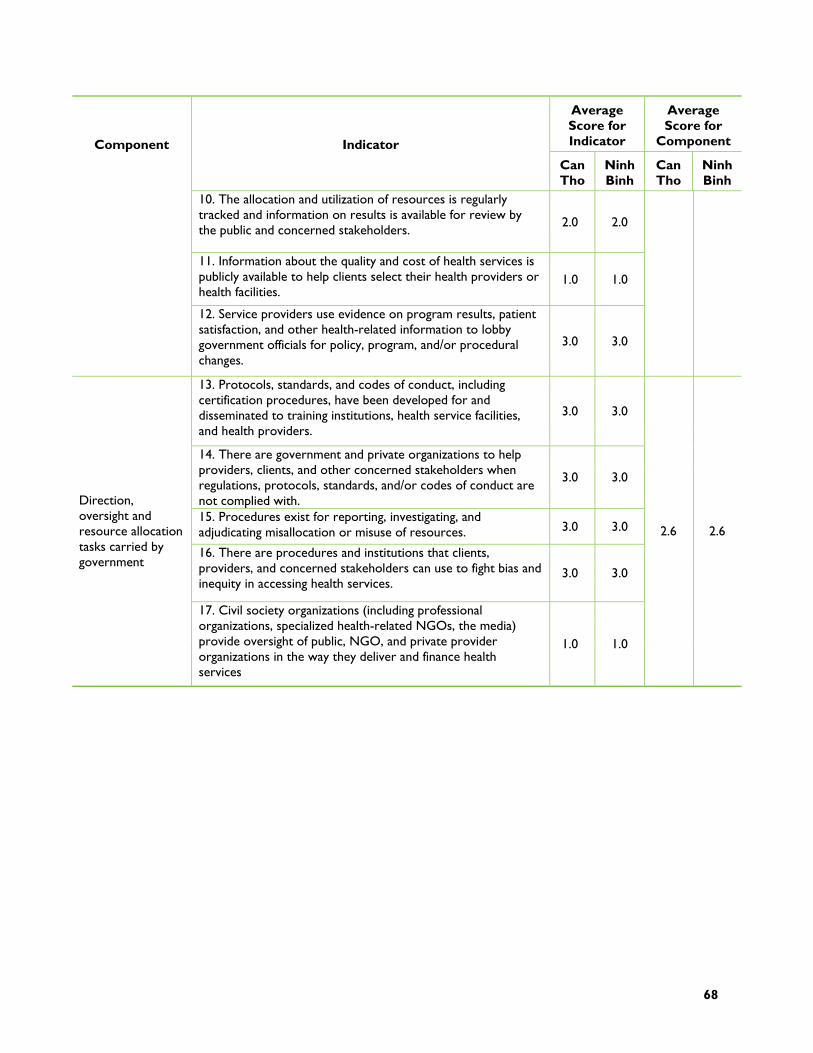
68
Average Score for Indicator
Average Score for
Component Component Indicator
Can Tho
Ninh Binh
Can Tho
Ninh Binh
10. The allocation and utilization of resources is regularly tracked and information on results is available for review by the public and concerned stakeholders.
2.0 2.0
11. Information about the quality and cost of health services is publicly available to help clients select their health providers or health facilities.
1.0 1.0
12. Service providers use evidence on program results, patient satisfaction, and other health-related information to lobby government officials for policy, program, and/or procedural changes.
3.0 3.0
13. Protocols, standards, and codes of conduct, including certification procedures, have been developed for and disseminated to training institutions, health service facilities, and health providers.
3.0 3.0
14. There are government and private organizations to help providers, clients, and other concerned stakeholders when regulations, protocols, standards, and/or codes of conduct are not complied with.
3.0 3.0
15. Procedures exist for reporting, investigating, and adjudicating misallocation or misuse of resources. 3.0 3.0
16. There are procedures and institutions that clients, providers, and concerned stakeholders can use to fight bias and inequity in accessing health services.
3.0 3.0
Direction, oversight and resource allocation tasks carried by government
17. Civil society organizations (including professional organizations, specialized health-related NGOs, the media) provide oversight of public, NGO, and private provider organizations in the way they deliver and finance health services
1.0 1.0
2.6 2.6
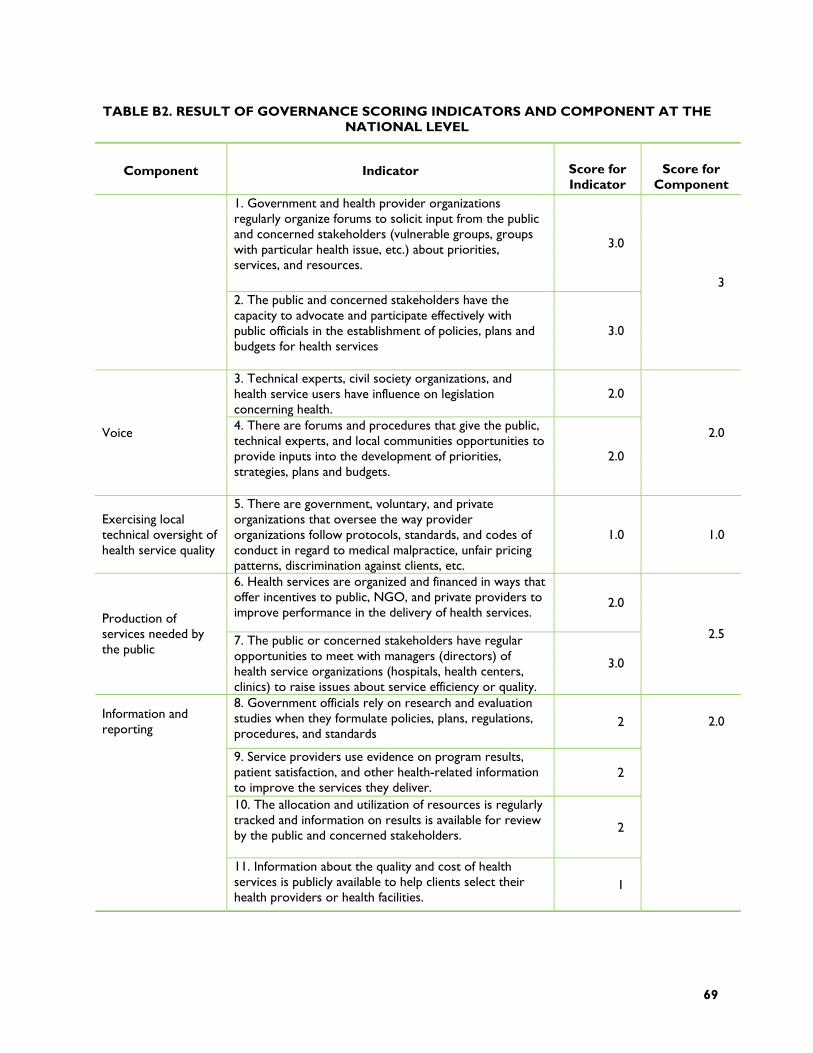
69
TABLE B2. RESULT OF GOVERNANCE SCORING INDICATORS AND COMPONENT AT THE NATIONAL LEVEL
Component Indicator Score for Indicator
Score for Component
1. Government and health provider organizations regularly organize forums to solicit input from the public and concerned stakeholders (vulnerable groups, groups with particular health issue, etc.) about priorities, services, and resources.
3.0
2. The public and concerned stakeholders have the capacity to advocate and participate effectively with public officials in the establishment of policies, plans and budgets for health services
3.0
3
3. Technical experts, civil society organizations, and health service users have influence on legislation concerning health.
2.0
Voice 4. There are forums and procedures that give the public, technical experts, and local communities opportunities to provide inputs into the development of priorities, strategies, plans and budgets.
2.0
2.0
Exercising local technical oversight of health service quality
5. There are government, voluntary, and private organizations that oversee the way provider organizations follow protocols, standards, and codes of conduct in regard to medical malpractice, unfair pricing patterns, discrimination against clients, etc.
1.0 1.0
6. Health services are organized and financed in ways that offer incentives to public, NGO, and private providers to improve performance in the delivery of health services.
2.0 Production of services needed by the public
7. The public or concerned stakeholders have regular opportunities to meet with managers (directors) of health service organizations (hospitals, health centers, clinics) to raise issues about service efficiency or quality.
3.0
2.5
8. Government officials rely on research and evaluation studies when they formulate policies, plans, regulations, procedures, and standards
2
9. Service providers use evidence on program results, patient satisfaction, and other health-related information to improve the services they deliver.
2
10. The allocation and utilization of resources is regularly tracked and information on results is available for review by the public and concerned stakeholders.
2
Information and reporting
11. Information about the quality and cost of health services is publicly available to help clients select their health providers or health facilities.
1
2.0
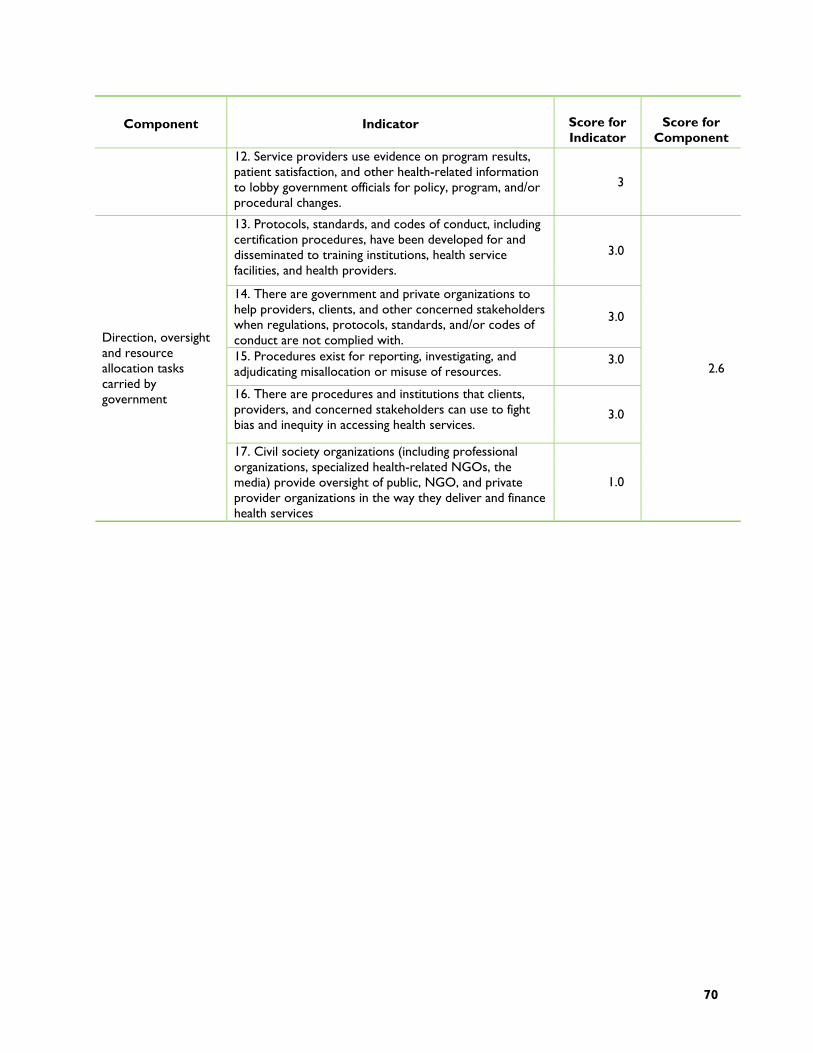
70
Component Indicator Score for Indicator
Score for Component
12. Service providers use evidence on program results, patient satisfaction, and other health-related information to lobby government officials for policy, program, and/or procedural changes.
3
13. Protocols, standards, and codes of conduct, including certification procedures, have been developed for and disseminated to training institutions, health service facilities, and health providers.
3.0
14. There are government and private organizations to help providers, clients, and other concerned stakeholders when regulations, protocols, standards, and/or codes of conduct are not complied with.
3.0
15. Procedures exist for reporting, investigating, and adjudicating misallocation or misuse of resources.
3.0
16. There are procedures and institutions that clients, providers, and concerned stakeholders can use to fight bias and inequity in accessing health services.
3.0
Direction, oversight and resource allocation tasks carried by government
17. Civil society organizations (including professional organizations, specialized health-related NGOs, the media) provide oversight of public, NGO, and private provider organizations in the way they deliver and finance health services
1.0
2.6
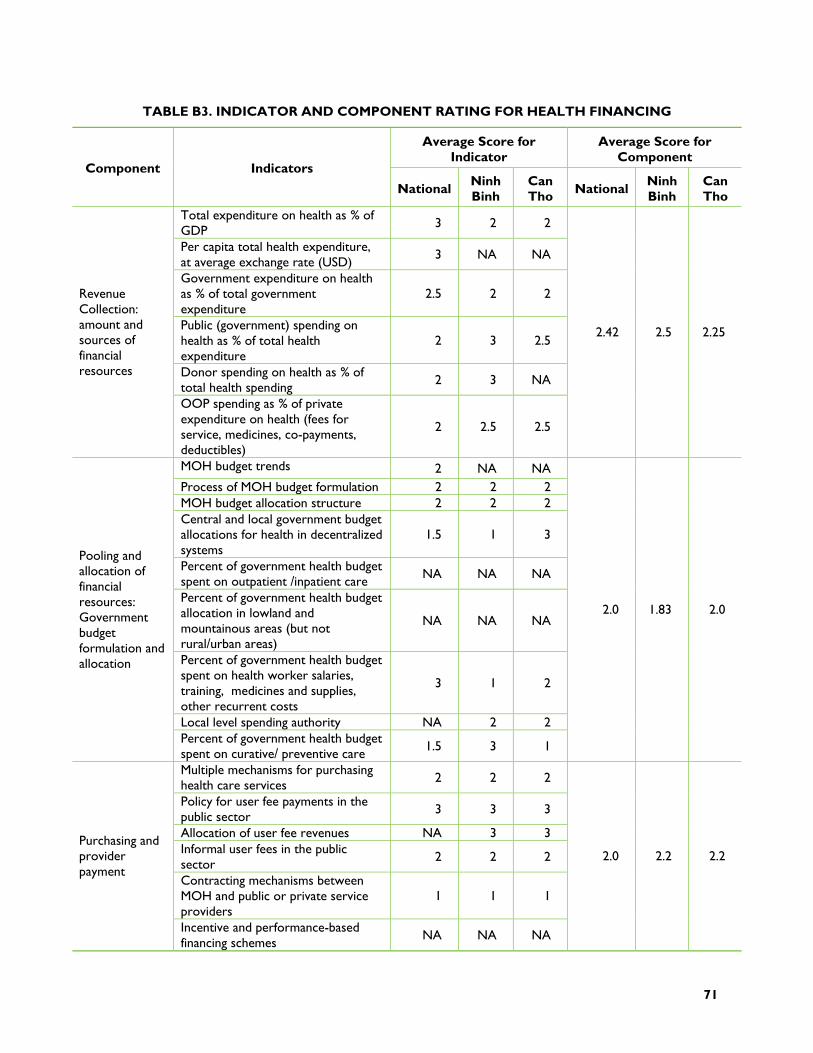
71
TABLE B3. INDICATOR AND COMPONENT RATING FOR HEALTH FINANCING
Average Score for Indicator
Average Score for Component
Component Indicators
National Ninh Binh
Can Tho National Ninh
Binh Can Tho
Total expenditure on health as % of GDP
3 2 2
Per capita total health expenditure, at average exchange rate (USD)
3 NA NA
Government expenditure on health as % of total government expenditure
2.5 2 2
Public (government) spending on health as % of total health expenditure
2 3 2.5
Donor spending on health as % of total health spending 2 3 NA
Revenue Collection: amount and sources of financial resources
OOP spending as % of private expenditure on health (fees for service, medicines, co-payments, deductibles)
2 2.5 2.5
2.42 2.5 2.25
MOH budget trends 2 NA NA Process of MOH budget formulation 2 2 2 MOH budget allocation structure 2 2 2 Central and local government budget allocations for health in decentralized systems
1.5 1 3
Percent of government health budget spent on outpatient /inpatient care NA NA NA
Percent of government health budget allocation in lowland and mountainous areas (but not rural/urban areas)
NA NA NA
Percent of government health budget spent on health worker salaries, training, medicines and supplies, other recurrent costs
3 1 2
Local level spending authority NA 2 2
Pooling and allocation of financial resources: Government budget formulation and allocation
Percent of government health budget spent on curative/ preventive care 1.5 3 1
2.0 1.83 2.0
Multiple mechanisms for purchasing health care services 2 2 2
Policy for user fee payments in the public sector 3 3 3
Allocation of user fee revenues NA 3 3 Informal user fees in the public sector
2 2 2
Contracting mechanisms between MOH and public or private service providers
1 1 1
Purchasing and provider payment
Incentive and performance-based financing schemes
NA NA NA
2.0 2.2 2.2
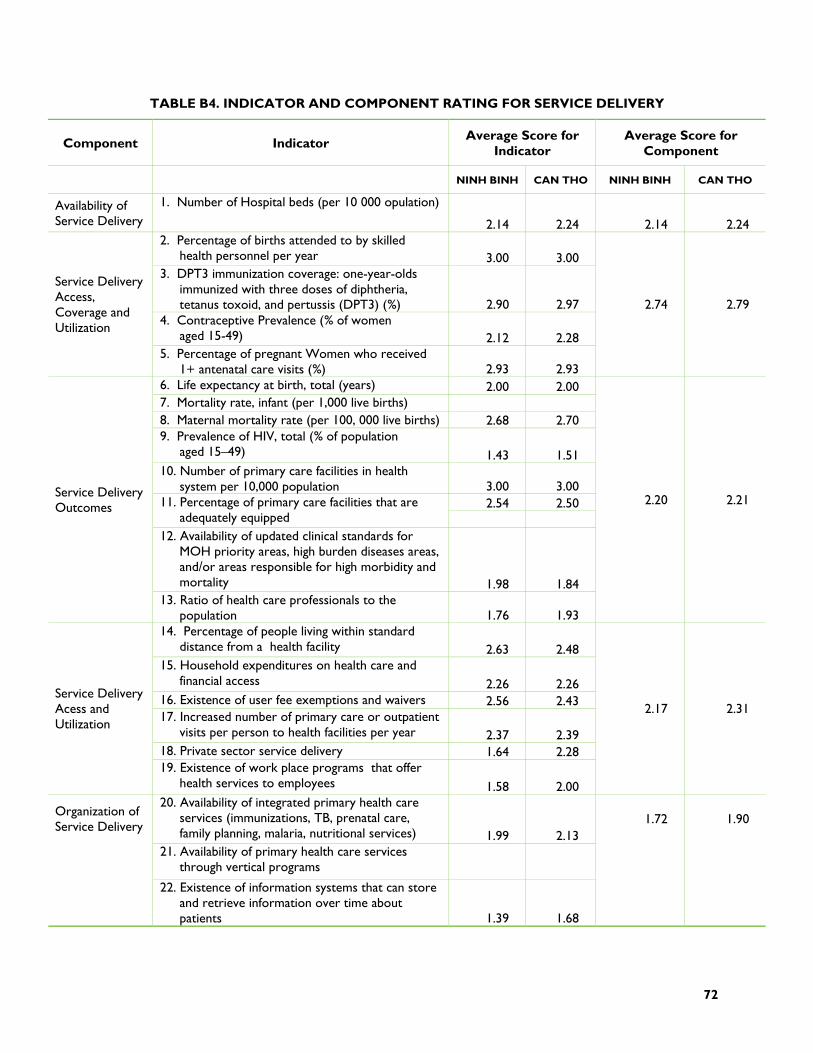
72
TABLE B4. INDICATOR AND COMPONENT RATING FOR SERVICE DELIVERY
Component Indicator Average Score for
Indicator Average Score for
Component
NINH BINH CAN THO NINH BINH CAN THO
Availability of Service Delivery
1. Number of Hospital beds (per 10 000 opulation)
2.14 2.24 2.14 2.24 2. Percentage of births attended to by skilled
health personnel per year 3.00 3.00 3. DPT3 immunization coverage: one-year-olds
immunized with three doses of diphtheria, tetanus toxoid, and pertussis (DPT3) (%) 2.90 2.97
4. Contraceptive Prevalence (% of women aged 15-49) 2.12 2.28
Service Delivery Access, Coverage and Utilization
5. Percentage of pregnant Women who received 1+ antenatal care visits (%) 2.93 2.93
2.74 2.79
6. Life expectancy at birth, total (years) 2.00 2.00 7. Mortality rate, infant (per 1,000 live births) 8. Maternal mortality rate (per 100, 000 live births) 2.68 2.70 9. Prevalence of HIV, total (% of population
aged 15–49) 1.43 1.51 10. Number of primary care facilities in health
system per 10,000 population 3.00 3.00 2.54 2.50 11. Percentage of primary care facilities that are
adequately equipped 12. Availability of updated clinical standards for
MOH priority areas, high burden diseases areas, and/or areas responsible for high morbidity and mortality 1.98 1.84
Service Delivery Outcomes
13. Ratio of health care professionals to the population 1.76 1.93
2.20 2.21
14. Percentage of people living within standard distance from a health facility 2.63 2.48
15. Household expenditures on health care and financial access 2.26 2.26
16. Existence of user fee exemptions and waivers 2.56 2.43 17. Increased number of primary care or outpatient
visits per person to health facilities per year 2.37 2.39 18. Private sector service delivery 1.64 2.28
Service Delivery Acess and Utilization
19. Existence of work place programs that offer health services to employees 1.58 2.00
2.17 2.31
20. Availability of integrated primary health care services (immunizations, TB, prenatal care, family planning, malaria, nutritional services) 1.99 2.13
21. Availability of primary health care services through vertical programs
Organization of Service Delivery
22. Existence of information systems that can store and retrieve information over time about patients 1.39 1.68
1.72 1.90
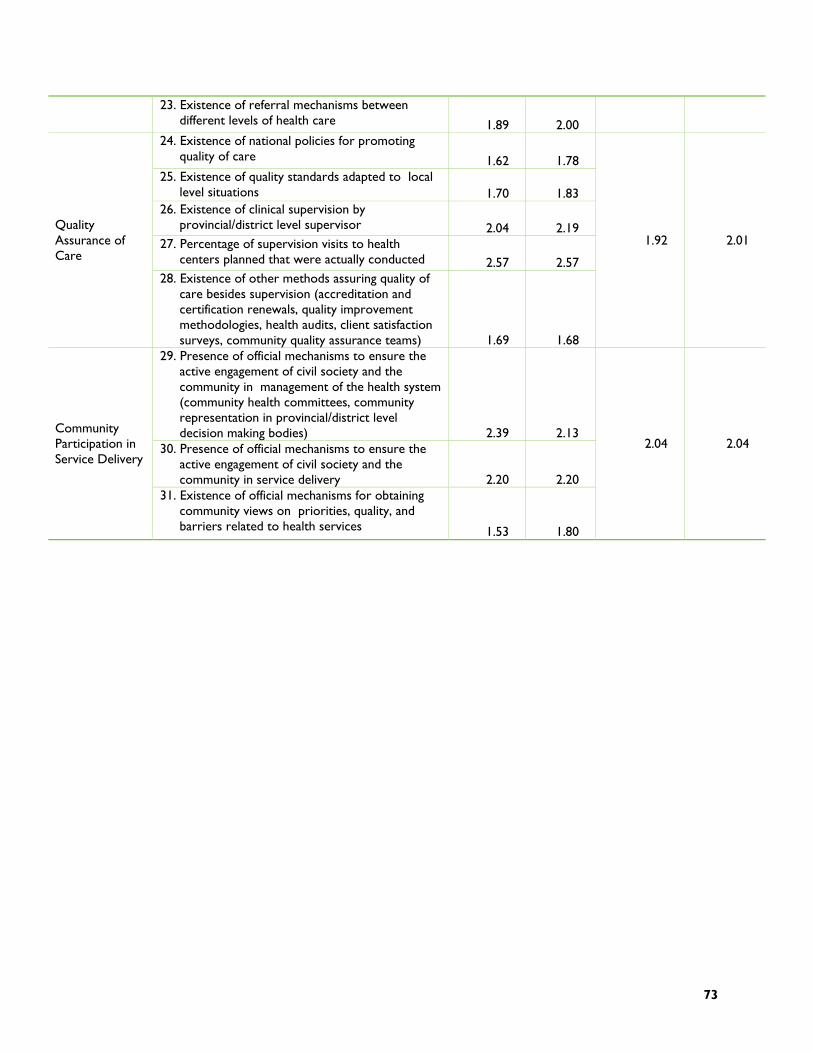
73
23. Existence of referral mechanisms between different levels of health care 1.89 2.00
24. Existence of national policies for promoting quality of care 1.62 1.78
25. Existence of quality standards adapted to local level situations 1.70 1.83
26. Existence of clinical supervision by provincial/district level supervisor 2.04 2.19
27. Percentage of supervision visits to health centers planned that were actually conducted 2.57 2.57
Quality Assurance of Care
28. Existence of other methods assuring quality of care besides supervision (accreditation and certification renewals, quality improvement methodologies, health audits, client satisfaction surveys, community quality assurance teams) 1.69 1.68
1.92 2.01
29. Presence of official mechanisms to ensure the active engagement of civil society and the community in management of the health system (community health committees, community representation in provincial/district level decision making bodies) 2.39 2.13
30. Presence of official mechanisms to ensure the active engagement of civil society and the community in service delivery 2.20 2.20
Community Participation in Service Delivery
31. Existence of official mechanisms for obtaining community views on priorities, quality, and barriers related to health services 1.53 1.80
2.04 2.04
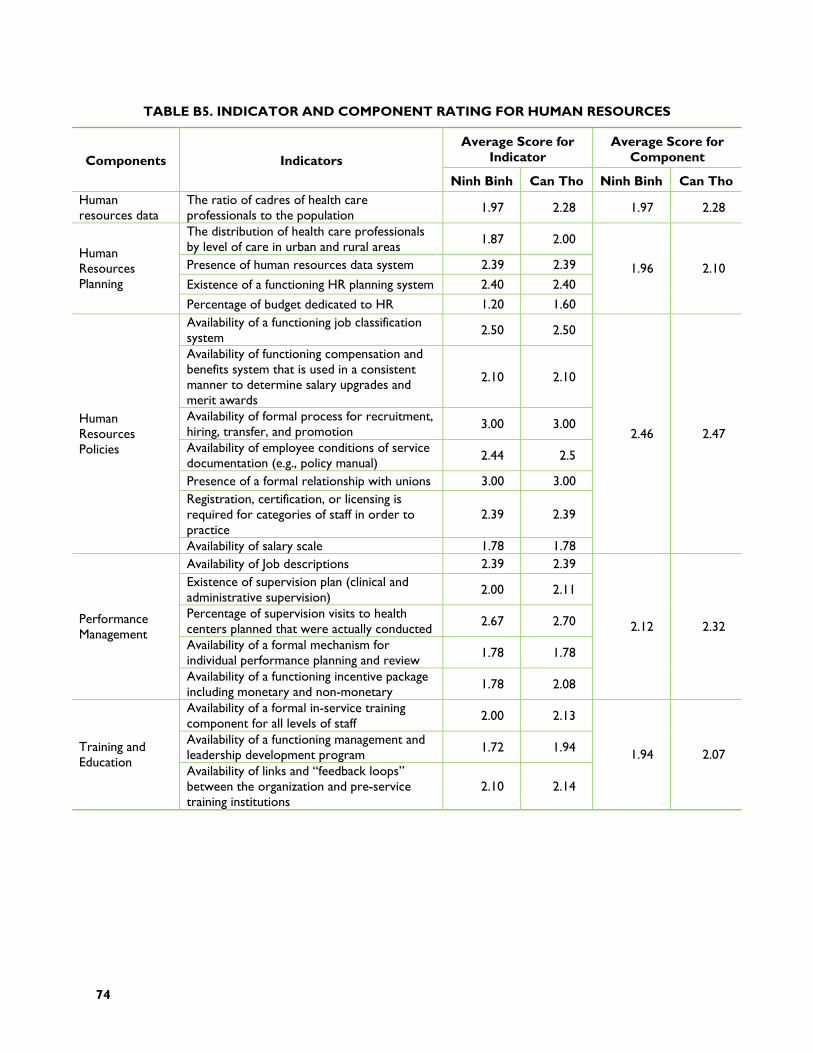
74
TABLE B5. INDICATOR AND COMPONENT RATING FOR HUMAN RESOURCES
Average Score for Indicator
Average Score for Component Components Indicators
Ninh Binh Can Tho Ninh Binh Can Tho Human resources data
The ratio of cadres of health care professionals to the population 1.97 2.28 1.97 2.28
The distribution of health care professionals by level of care in urban and rural areas 1.87 2.00
Presence of human resources data system 2.39 2.39
Existence of a functioning HR planning system 2.40 2.40
Human Resources Planning
Percentage of budget dedicated to HR 1.20 1.60
1.96 2.10
Availability of a functioning job classification system 2.50 2.50
Availability of functioning compensation and benefits system that is used in a consistent manner to determine salary upgrades and merit awards
2.10 2.10
Availability of formal process for recruitment, hiring, transfer, and promotion 3.00 3.00
Availability of employee conditions of service documentation (e.g., policy manual) 2.44 2.5
Presence of a formal relationship with unions 3.00 3.00 Registration, certification, or licensing is required for categories of staff in order to practice
2.39 2.39
Human Resources Policies
Availability of salary scale 1.78 1.78
2.46 2.47
Availability of Job descriptions 2.39 2.39 Existence of supervision plan (clinical and administrative supervision)
2.00 2.11
Percentage of supervision visits to health centers planned that were actually conducted
2.67 2.70
Availability of a formal mechanism for individual performance planning and review 1.78 1.78
Performance Management
Availability of a functioning incentive package including monetary and non-monetary 1.78 2.08
2.12 2.32
Availability of a formal in-service training component for all levels of staff 2.00 2.13
Availability of a functioning management and leadership development program 1.72 1.94 Training and
Education Availability of links and “feedback loops” between the organization and pre-service training institutions
2.10 2.14
1.94 2.07
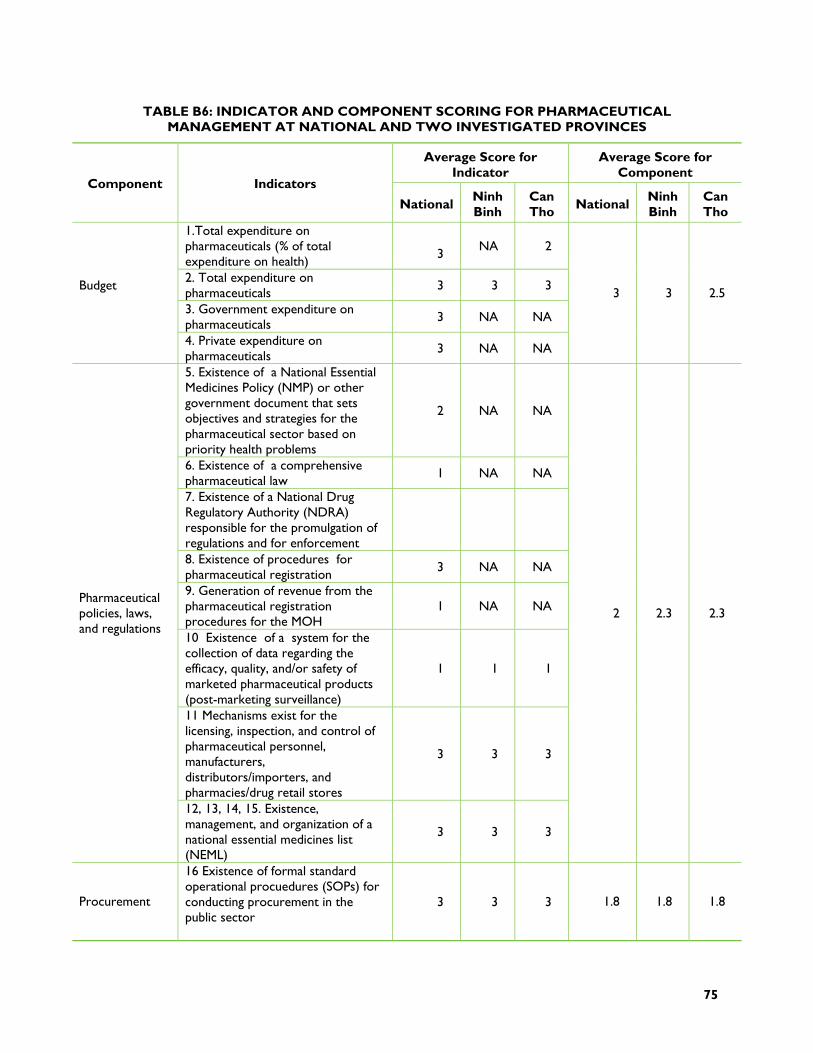
75
TABLE B6: INDICATOR AND COMPONENT SCORING FOR PHARMACEUTICAL MANAGEMENT AT NATIONAL AND TWO INVESTIGATED PROVINCES
Average Score for Indicator
Average Score for Component
Component Indicators
National Ninh Binh
Can Tho National Ninh
Binh Can Tho
1.Total expenditure on pharmaceuticals (% of total expenditure on health)
3 NA 2
2. Total expenditure on pharmaceuticals 3 3 3
3. Government expenditure on pharmaceuticals 3 NA NA
Budget
4. Private expenditure on pharmaceuticals 3 NA NA
3 3 2.5
5. Existence of a National Essential Medicines Policy (NMP) or other government document that sets objectives and strategies for the pharmaceutical sector based on priority health problems
2 NA NA
6. Existence of a comprehensive pharmaceutical law 1 NA NA
7. Existence of a National Drug Regulatory Authority (NDRA) responsible for the promulgation of regulations and for enforcement
8. Existence of procedures for pharmaceutical registration 3 NA NA
9. Generation of revenue from the pharmaceutical registration procedures for the MOH
1 NA NA
10 Existence of a system for the collection of data regarding the efficacy, quality, and/or safety of marketed pharmaceutical products (post-marketing surveillance)
1 1 1
11 Mechanisms exist for the licensing, inspection, and control of pharmaceutical personnel, manufacturers, distributors/importers, and pharmacies/drug retail stores
3 3 3
Pharmaceutical policies, laws, and regulations
12, 13, 14, 15. Existence, management, and organization of a national essential medicines list (NEML)
3 3 3
2 2.3 2.3
Procurement
16 Existence of formal standard operational procuedures (SOPs) for conducting procurement in the public sector
3 3 3 1.8 1.8 1.8

76
Average Score for Indicator
Average Score for Component
Component Indicators
National Ninh Binh
Can Tho National Ninh
Binh Can Tho
17. Use of generic of nonpropriety names (INN) for MOH procurements
1 1 1
18. Procurement Operations (number of procurement operations per year)
2 2 2
19. Percentage of MOH pharmaceuticals procured through competitive bid
3 3 3
20. Existence of a pre-or post-qualification process related to product safety, efficacy, and quality
1 1 1
21. Samples requested and tested 1 1 1 22. Pharmaceuticals procured based on reliable estimates
1 1 1
23.Existence of procedures to manage distribution of pharmaceuticals
1 1 1
24. Existence of independent supply systems for vertical programs
3 3 3
25. Value of inventory loss 3 3 3
Storage and Distribution
26. Existence of refrigeration units with functional termperature control at each level of the distribution system
2 2 2
2 2 2
27. Existence of functioning mechanisms/tools to improve the use of medicines in hospitals and health facilities
3 3 2
28. Existence of national therapeutic guides with standardized treatments for common health problems
2 2 2
Appropriate Use
29. Existence of treatment guidelines used for basic and inservice training of health personnel
2 2 2
2.3 2.3 2
30. Percentage of a set of unexpired tracer items available 3 3 3
31. Percentage of the population having access to a public or private health facility/pharmacy that dispenses pharmaceuticals
2 2 2
32. Existence of licensing provisions or incentives that increase geographic access by consumers/patients to quality products and services through private wholesalers and retailers
1 1 1
Access to Quality Products and Services
33. Population per licensed pharmacist or pharmacy technician 2 2 2
2.3 2.3 2.3
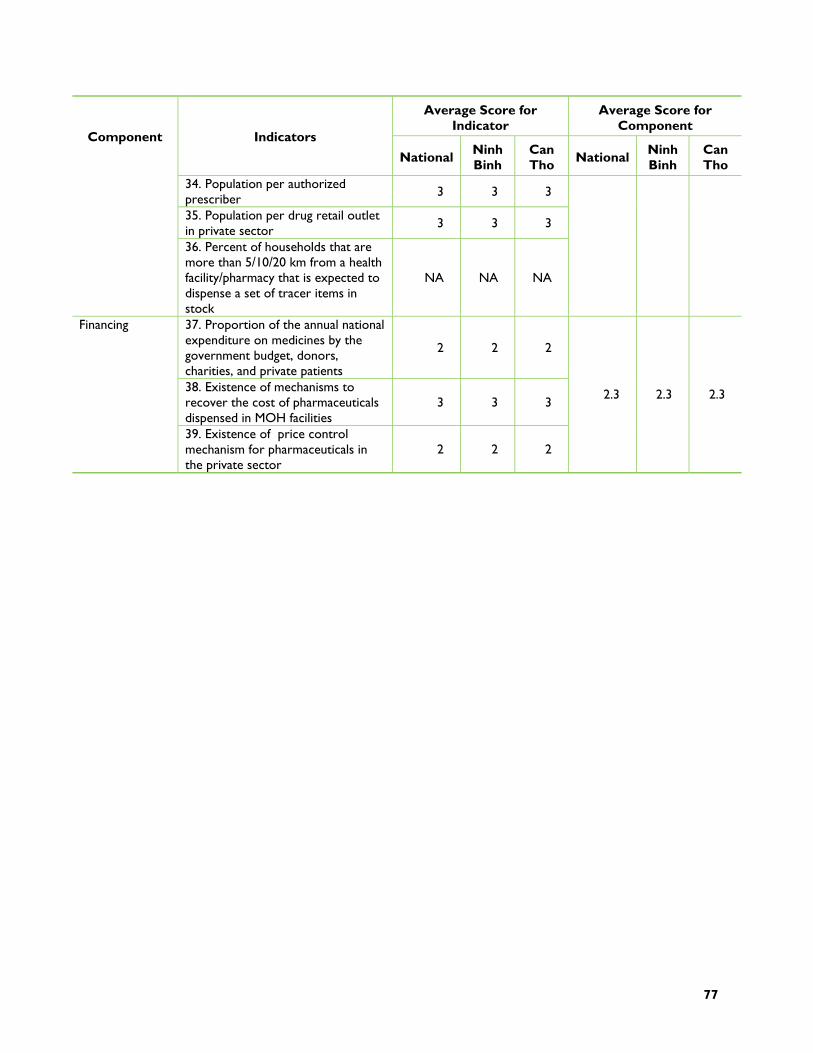
77
Average Score for Indicator
Average Score for Component
Component Indicators
National Ninh Binh
Can Tho National Ninh
Binh Can Tho
34. Population per authorized prescriber 3 3 3
35. Population per drug retail outlet in private sector 3 3 3
36. Percent of households that are more than 5/10/20 km from a health facility/pharmacy that is expected to dispense a set of tracer items in stock
NA NA NA
37. Proportion of the annual national expenditure on medicines by the government budget, donors, charities, and private patients
2 2 2
38. Existence of mechanisms to recover the cost of pharmaceuticals dispensed in MOH facilities
3 3 3
Financing
39. Existence of price control mechanism for pharmaceuticals in the private sector
2 2 2
2.3 2.3 2.3

78
TABLE B7 INDICATOR AND COMPONENT RATING FOR HEALTH INFORMATION SYSTEM
Average Score for Indicator
Average Score for Component Compone
nt Indicators
VN Ninh Binh
Can Tho VN Ninh
Binh Can Tho
Availability of financial and/or physical resources to support HIS-related items within MOH/central budget, regional, and/or district budgets
2 1.5 1
Presence of international donors providing specific assistance to support strengthening the entire HIS or its individual and/or vertical components in more than one region
2 1 1.5
Existence of policies, laws, and regulations mandating public and private health facilities/providers to report indicators determined by the national HIS
1 1 1
Presence of clear procedures for allocating resources and planning in the health system based on the information products of HIS
2.5 1 1
Resources, Policies, and Regulation
Presence of mechanisms to review the utility of current HIS indiciators for the planning, management, and evaluation process, and to adapt and modify accordingly
1 1 1
1.7 1 1
Percentage of districts represented in reported information 2 2 2
Percentage of private health facility data included in reported data 1 1 1
Availability of clear standards and guidelines for data collection and reporting procedures 2 1 1
Number of reports a typical health facility submits monthly, quarterly, or annually 1 1 1
Presence of procedures to verify the quality of data reported, such as data accuracy checklists prior to report acceptance, international data quality audit vists
1 1 1
Data Collection and Quality
Availability of a national summary report which contains HIS information, analysis, and interpretation (most recent year) 2 2 2
1.42 1.12 1.12
Availability at each level of a sufficinet number of qualified personnel and infrastructure to compile and analyze information
2 1.5 1.5
Evidence of ongoing training activities related to HIS data collection and analysis 2 1 2
Presence of written guidelines specifying the methods and products of data analysis to be performed 1 1 1
The data derived from different health programs documents are widely available 2 1 1
Availability of appropriate and accurate denominators (such as population by age groups, by facility catchment area, by sex, number of pregnant women) for analysis
3 3 3
Data Analysis
Availability of timely data analysis to meet the needs of stakeholders and users 2 1 1
2 1.42 1.58
Use of Information for
Use of data for planning, budgeting, or fundraising activities in the past year 2 1.5 1.5 1.5 1 1
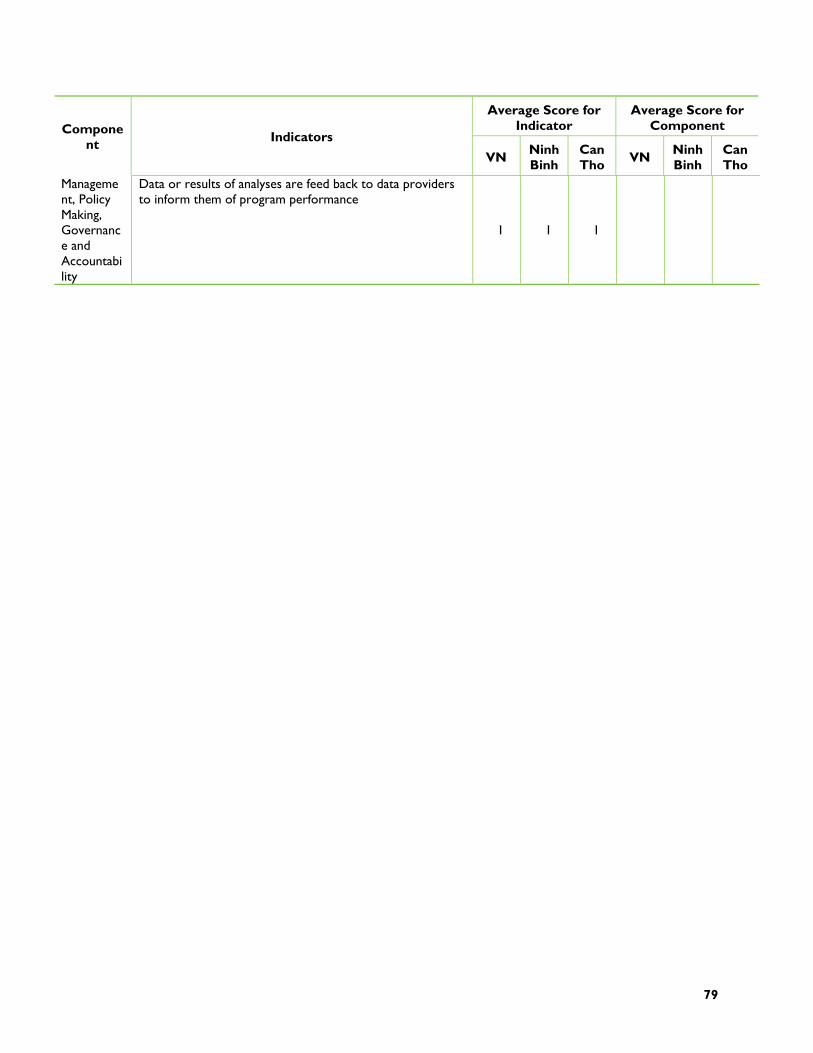
79
Average Score for Indicator
Average Score for Component Compone
nt Indicators
VN Ninh Binh
Can Tho VN Ninh
Binh Can Tho
Management, Policy Making, Governance and Accountability
Data or results of analyses are feed back to data providers to inform them of program performance
1 1 1


81
ANNEX C: HEALTH SYSTEMS EVALUATION CRITERIA TABLES
MODULE I. GOVERNANCE
Criteria HSA indicator Suggested indicator for VN
Discussion
Indicator. 1. Government and health provider organizations regularly organize forums to solicit input from the public and concerned stakeholders (vulnerable groups, groups with particular health issue, etc.) about priorities, services, and resources.
Score: 3 points for national level, 2 for provincial level; At central level: Central Party Committees, MOH, MoLISA, MOF, Commission for social affairs of the national assemble frequently organized forums to solicit input from public about services and resources for health care; At provincial level: Provincial People Counsel (committee for culture and social affairs), DOH, DOLISA, DOF also have frequent meeting and forum on health care for the poor, children under 6 etc.
Indicator 5. There are government, voluntary, and private organizations that oversee the way provider organizations follow protocols, standards, and codes of conduct in regard to medical malpractice, unfair pricing patterns, discrimination against clients, etc.
This indicator is not a good indicator for assessment of equity in health care in Vietnam, as NGOs are not involved actively in supervision of health care protocol, standards and codes of conduct. The supervision is function of the government bodies. The fact that Vietnam has not developed a civil society should be taken into account, when assessing the function of NGOs in term of supervision or licensing of health personnel. Better indicators for assessment of equity should be taken from health financing and/or health care delivery section.
Equity
Indicator 17. Civil society organizations (including professional organizations, specialized health-related NGOs, the media) provide oversight of public, NGO, and private provider organizations in the way they deliver and finance health services
According scoring criteria, this component has been given only 1 point (not adequate, correspondent to “only government institutions and organizations provide oversight for quality of service delivery”). Relevance of the indicator for Vietnam context: +
Efficiency Indicator 4. There are forums and procedures that give the public, technical experts, and local communities opportunities to
This indicator got 3 points for national level as well as provincial level. Those forums are very diverse from communities to ministries and national assemble. Regulations and
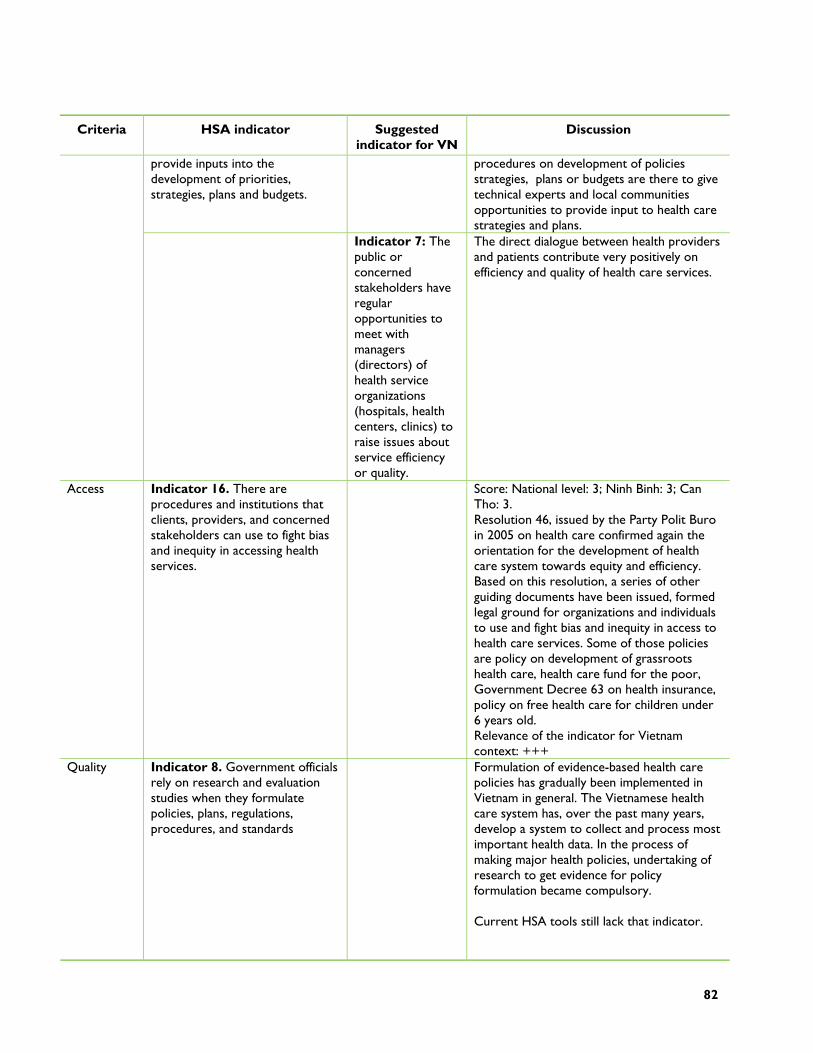
82
Criteria HSA indicator Suggested indicator for VN
Discussion
provide inputs into the development of priorities, strategies, plans and budgets.
procedures on development of policies strategies, plans or budgets are there to give technical experts and local communities opportunities to provide input to health care strategies and plans.
Indicator 7: The public or concerned stakeholders have regular opportunities to meet with managers (directors) of health service organizations (hospitals, health centers, clinics) to raise issues about service efficiency or quality.
The direct dialogue between health providers and patients contribute very positively on efficiency and quality of health care services.
Access
Indicator 16. There are procedures and institutions that clients, providers, and concerned stakeholders can use to fight bias and inequity in accessing health services.
Score: National level: 3; Ninh Binh: 3; Can Tho: 3. Resolution 46, issued by the Party Polit Buro in 2005 on health care confirmed again the orientation for the development of health care system towards equity and efficiency. Based on this resolution, a series of other guiding documents have been issued, formed legal ground for organizations and individuals to use and fight bias and inequity in access to health care services. Some of those policies are policy on development of grassroots health care, health care fund for the poor, Government Decree 63 on health insurance, policy on free health care for children under 6 years old. Relevance of the indicator for Vietnam context: +++
Quality
Indicator 8. Government officials rely on research and evaluation studies when they formulate policies, plans, regulations, procedures, and standards
Formulation of evidence-based health care policies has gradually been implemented in Vietnam in general. The Vietnamese health care system has, over the past many years, develop a system to collect and process most important health data. In the process of making major health policies, undertaking of research to get evidence for policy formulation became compulsory. Current HSA tools still lack that indicator.
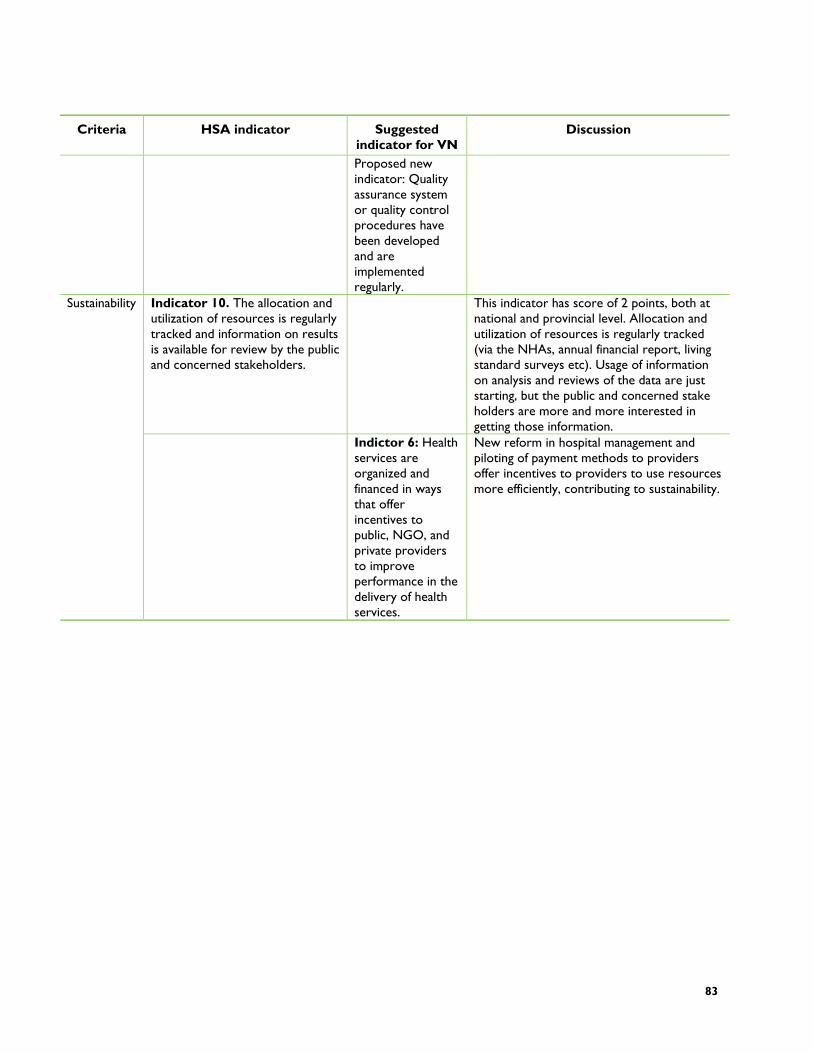
83
Criteria HSA indicator Suggested indicator for VN
Discussion
Proposed new indicator: Quality assurance system or quality control procedures have been developed and are implemented regularly.
Indicator 10. The allocation and utilization of resources is regularly tracked and information on results is available for review by the public and concerned stakeholders.
This indicator has score of 2 points, both at national and provincial level. Allocation and utilization of resources is regularly tracked (via the NHAs, annual financial report, living standard surveys etc). Usage of information on analysis and reviews of the data are just starting, but the public and concerned stake holders are more and more interested in getting those information.
Sustainability
Indictor 6: Health services are organized and financed in ways that offer incentives to public, NGO, and private providers to improve performance in the delivery of health services.
New reform in hospital management and piloting of payment methods to providers offer incentives to providers to use resources more efficiently, contributing to sustainability.
84
MODULE 2. HEALTH FINANCING
Criteria HSA indicator Suggested indicator for VN
Discussion
Percent of governmenhealth budget spent onoutpatient/inpatient care
Percent of governmenhealth budget allocation in rural/urban areas
According to HAS indicators: there is no datavailable in Vietnam for these two indicators
Percent of government health budget spent on curative/ preventive care
There is difference in terms of percentage ofgovernment health budget spent on curative/preventive care between two provinces. Ninh Binh spent with high adequate amount for preventive care (accounts for 28-31%). In contrast, the allocation of funds for health in Can Tho province focuses more on the curative-care and the proportion allocated to preventive care is typically low, which accounts for 4.3-6.2% only. Preventive care is a vital part of the health care system. Therefore, in order to ensure that every people is able to access preventive care, the health budget allocation for preventive care should accounts for at least 30% according to the Resolusion 18.
Percent of government health budget allocation by levels: central, province, district, and commune
There is big difference in terms of allocating government health budget by levels. Out of government health budget, budget allocating for commune level accounts for about 2.8-5%only. In Vietnam, Commune Health Stations are mainly responsible for primary health care. In addition, this the first contact for people to seek health care especially in the disadvantaged areas. In order to make qualityhealth services are accessible for every people, it is necessary to increase budget for the operations of the commune health stations.
Equity Percents of vulnerable groups are covered by government health budget
In Vietnam, this indicator is assessed as a good policy which ensure that every poor people and other vulnerable groups are provided free health care services in order toachieve equity in health care for people.
Efficiency Incentive and performance-based financing scheme
The assessment guideline is not in line with questions and indicator. Therefore, it is impossible to fill the information for this indicator at both national and provincial
85
Criteria HSA indicator Suggested indicator for VN
Discussion
levels. Due to that, we can not have discussion on this criteria.
Access OOP spending as % of total expenditure on health
At national level as well as in both two provinces, OOP expenses account for high proportion and represent a barrier to health care for certain groups such as the poor and near poor in terms of indirect costs. It can be seen that the accessibility to health care services of certain groups in the society is still low due to financial difficulties.
Quality Local level spending authority
??? In both two provinces, local levels have authority to formulate their own budgets based on line-item expenditure which is due to implementation of hospital autonomy. Both of them have systems to track and audit expenditures in every 6 month or yearly. This will make sure health financing function of the health system is improved.
Sustainability Central and local government budget allocations for health in decentrilized systems
??? Local governments have responsibilities for health financing according to the decentralized system, therefore, local governments have to find the means to add resources for health. This will help to have commitment from local government so that it will make the budget allocation is sustainable in decentrilized systems.
86
MODULE 3. HEALTH SERVICE DELIVERY
Criteria HSA indicator Suggested indicator for VN
Discussion
Indicator 16. Existence of user fee exemptions and waivers
It is a very good indicator for assessment of equity in health care in Vietnam. Score: 2.7 points for national level, 2.6 for Ninh Binh and 2.4 for Can Tho province. One of the priorities of the Vietnam Government is to ensure equity in health care. There is strong evidence that poverty is a barrier to utilization of health services in Vietnam. In order to support the poor in an active, comprehensive and effective manner, in 2002 the Prime Minister issued Decision No. 139/2002/Q�-TTg on health care for the poor. The Decision clearly identified eligible target population, which included: Poor people; People living in communes under especially difficult socio-economic conditions and People of ethnic minorities. In 2007, 17.2% of total population has received Health Insurance card for the poor. Consequently, every poor people and other vulnerable groups are provided free health care services. Vietnam is in process to achieve equity in health care for people.
Equity
Indicator 15. Household expenditures on health care and financial access
Score: 2 points for national level, 2.3 for Ninh Binh and 2.3 for Can Tho province. Household health expenditure constitutes an important indicator for assessing equity of a health system. It is not easy to estimate Household expenditures on health care at provincial level. At national level, according to some estimates and different sources of data, it ranges from 60% to 66% of total health expenditure. Reports of the MOH introduce that household health expenditure accounts for a large proportion of the total health expenditure. As assessed by WHO, this percentage indicates inequity in health care.

87
Criteria HSA indicator Suggested indicator for VN
Discussion
However, after decision 139 TTg, most of poor people in Vietnam has received health care for the poor card. Therefore, they can access to health care service much easier, compared with the period before 2002. Following results of several surveys recently, financial is not the main barrier of the poor people when they need to seek health care service. In conclusion, with the support of Health care for the poor program, Equity in health in Vietnam is much better than the indicator of household expenditures on health care. This indicator is a basic indicator for assessment of equity in health care in Vietnam, but need to included health care expenditure of poor people.
Indicator ##. Rate of poor people having health insurance card
This indicator will assess real situation of financial access and equity in health care. In order to ensure that every people are able to access health care service, Government should support for vulnerable group.
Indicator ##. Household expenditures on health care of poor and near poor people
This indicator will evaluate burden of health expenditures of poor people, so the equity indicator will be reflected deeply.
Efficiency Indicator 20. Availability of integrated primary health care services (immunizations, TB, prenatal care, family planning, malaria, nutritional services)
Score: 2 points for national level, 2 for Ninh Binh and 2.1 for Can Tho province. This is good indicator to evaluate efficiency of health care system. In Vietnam, there are 10 national target programs for health. Most program are implementing at grass-root level, such as immunizations, TB, HIV/AIDS, prenatal care, family planning, malaria.v.v. Some programs are integrating, such as TB and HIV/AIDS, EPI and nutrition program.v.v. However, in general context, these programs are not really close integrated.
Access Indicator 10. Number of primary care facilities in health system per 10,000 population
Score: 3 points for national level, 3 for Ninh Binh and 3 for Can Tho province. It is a good indicator to evaluate accessibility of health care system. In Vietnam, primary care facilities network is considered as grass root level included all districts and communes. By the end of 2006, Vietnam had 671 districts and 10 876 communes/wards serving a population of more than 83 million people. Up to now, 98% of communes had a CHS. In the average, each commune has 3,000 to 10,000 inhabitants. Therefore, each 10,000 population has at least 1 to 3 primary care facilities.
88
Criteria HSA indicator Suggested indicator for VN
Discussion
So people can access to health care service nearby their household.
Indicator ##. Number of primary care facilities in health system has medical doctor and enough basic equipments per 10,000 population
In Vietnam there are 65% of CHS have medical doctor. The rate of CHS have enough basic equipments is about 60-70%. It should be included this indicator to evaluate accessibility, because the assessment will be more comprehensive, in term of both quantity and quality of primary care facilities.
Indicator ##. Number of primary care facilities in health system has reached National Benchmark
Rate of CHS reach 10 National Benchmarks for CHS is 39%. This indicator should apply for Vietnam only.
Indicator 12. Availability of updated clinical standards for MOH priority areas, high burden diseases areas, and/or areas responsible for high morbidity and mortality
Score: 2 points for national level, 2 for Ninh Binh and 1.8 for Can Tho province. In Vietnam, Therapeutic department, MOH designed and provided clinical standards for some priority areas, such as high burden diseases, high morbidity and mortality or emerging issues.v.v. In theory, these clinical standards provided for both public and private health facilities, but mainly for public sector. Furthermore, some hospitals in both Ninh Binh and Can Tho have developed treatment guideline, based on guideline of MOH or others official documents. This activity will improve quality of care of health facilities. However, clinical standards is not very well designed and updated frequently. This indicator is appropriate indicator for assessment of quality of health care in Vietnam.
Quality
Indicator ##. Availability of standard treatment guideline for common diseases at certain treatment level.
It should be included this indicator: Availability of standard treatment guideline for common diseases.
Sustainability Indicator 18. Utilization of private providers for health services in rural vs. urban areas per type of provider
Score: 1.8 points for national level, 1.6 for Ninh Binh and 2.3 for Can Tho province. This indicator is not a good indicator for assessment of sustainability in health care in Vietnam. In Vietnam, the private health sector has seen strong and diversified development. The total number of beds in private hospitals was 4547, accounting for 3% of the number of public hospital beds. There are 65 000 private health facilities had been recognized nationwide. However, it is the fact that in Vietnam, the private health sector generally performs strongly in better-off regions. According to
89
Criteria HSA indicator Suggested indicator for VN
Discussion
VNHS 2002 report, private health sector were responsible for 60% out patient care and only 4% of in patient care. However, it mainly focuses investment in outpatient care and performance of simple and easy-to-recover-cost techniques. Moreover, there is an evident imbalance in the distribution of private practitioners; they are concentrated mainly in better-off areas. Therefore, this indicator is not good enough to evaluate the sustainability of health system at this time of period. Any way, in the future, when private health sectors are more develop as well as the ability of Government in management and supervision of service quality are better, this indicator will be useful and appropriate for Vietnam situation.
Better indicators for assessment of sustainability should be taken from health financing and/or human resource section.
90
MODULE 4. HUMAN RESOURCE
Criteria HSA indicator Suggested indicator for VN
Discussion
Equity The distribution of health care professionals by level of care in urban and rural areas
Should add more: Distribution of health care professionals by curative care, preventive care, and pharmaceutical service
The equality of HR in provinces is not relevance both by level of health care and by urban/rural areas.
For distribution by level of care, the data shown that the distribution of health care professionals in commune level is always lower than the distribution at district level (usually 17-31.1% total health workforce). In other hand, we can say that there have lest health professionals working at commune level and most of health staff who have higher knowledge and skill working at district and provincial level. The data shown that distribution of health care professionals in Can Tho at commune level is much lower than that compare to the national data (17% vs. 23.1%), that mean Can Tho have to face with serious situation of inequality of HR at commune level.
This data also indirectly shown the inequality of health care professional distribution between rural and urban areas, in which the rural areas have lest health care professionals both in quantity and quality of health staffs. Due to of both two provinces are located in delta regions and only have very few communes in remote areas, not in mountainous areas, so district and provincial levels are may considered as urban areas, therefore, most of health care professionals working at district and provincial are considered as working at urban areas.
The issue of inequality of RH by level of care and by rural/urban areas not only occur in two provinces particularity but also present in most of provinces throughout the country and much acute at provinces in mountainous areas.
Efficiency Linkages of links and “feedback loops” between the organization and pre-service training institutions
Every year, Provincial health Bureau have to make a plan for health insurance training base on the need of province in HR and the plan of training of MOH or medical colleges. The fact that the plans of training from MOH or medical college are not always sent to provinces on time and in detail with training subject, program, curriculum as well as the fee for each courses. On the other hand, provinces also not actively establish a good links with training institution in order to exchange information of training plan or program. Thus there is a difficulty in
91
Criteria HSA indicator Suggested indicator for VN
Discussion
harmonizing both the training plan of MOH/medical colleges and the provincial HR demand.
Another weakness is lack of relevance mechanism to determine the real situation of HR training both for number of health professionals and type of staff in whole country as well as in provinces. It lead to MOH, pre-service training institution and provinces do not have necessary information or data base for making plan of training that fit the need of country and provinces.
In Can Tho, Provincial health Bureau (PHB) have a better relationship with local health training institutions both for two sides compare to Ninh Binh. Every year, PHB review the HR demand of the local health system and actively make a plan for training health staff both the content of trainings, numbers of staff and training budget, then PHB sign a contract with Can Tho Institute or University of medicine and pharmacy in Ho Chi Minh city to organize training courses or send staff to attend the available training courses. Ninh Binh also have a good relationship with local Primary medical college but only for short training courses and lower level staffs. For the training coursed at higher level, Ninh Binh still have irrelevance linkage with higher education institution such as Hanoi Medical colleges, Thai Binh medical college etc.
In the overall, in order to ensure the efficiency of HR management in both national and local levels, both MOH and PHB need to have a plan to strengthen and improve the linkage between health organization and training institutions in order to exchange the information of HR training demand, content and plan of training courses etc.
Access The ratio of cadres of health care professionals to the population
Consider to this indicator, two provinces still have a shortage of health workers, the present workforce is not reasonably structured and the shortage of health workers will be more serious in the coming year. This phenomenon is being presented in both the ratio per population, distribution and the loosing of high skill health staff.
In two provinces, the ratio of health professional per populations is not high enough
92
Criteria HSA indicator Suggested indicator for VN
Discussion
to ensure the accessibility of NR, although the ratio of health workers to 10,000 people in two provinces is equal to the data in whole country and the ratio of doctor to 10,000 population of both Ninh Binh and Can Tho are equal ratio to those in their regions but this ratio is still lower than the ratio of whole country (Figure 1). Other type of health professional staff such as pharmacist, nurse, asst. doctor etc. also in the same situation. In another hand, There have the fact that the under-utilization of high skill professional in provinces, because of the shortage of HR in field of administrative management, a number of staff, who are very good skill the clinical work, have to move to administrative work at higher position, thus they don’t have chance to dedicate or provide good quality of service to the community. This problem is not only available in the provinces but also very common in whole country and need to have a reasonable measure to solve that problem. In addition, loss of skilled professionals from the public sector is also being a hot issue of provinces. In the progression of private health sector development, private health clinics can offer much higher salaries, there is a tendency for more and higher quality health workers to leave the public sector to work in private, serving the wealthier people in society. This issue is more serious in big cities including Can Tho.
Another importance indicator is the existence of a functioning HR planning system. In nationwide, the functioning HR planning system is available for all levels including a system of data collection forms, recording sheets, format of report and the procedure of HR planning etc. Periodically, each level of health system have to collect the information, data and report on HR in order to review the HR situation as well as using as a database for HR planning. The weakness of the system are lack of applying high tech in HR management systematically (computer and software); lack of resources for implementation of HR development.
In conclusion, the accessibility of HR is still limited not only for local health sectors but also for whole country and need to have both relevance national and local strategy and policy to improve.
93
Criteria HSA indicator Suggested indicator for VN
Discussion
Quality Registration, certification, or licensing is required for categories of staff in order to practice
Add more: Availability of a formal in-service training component for all levels of staff
As well as the national situation of health quality management, the limitation of health workers quality, as related to their formal qualifications, has not improved due to lack of relevance policy and mechanism in qualification, registration, certification or licensing for categories of staff both in public and private health sector even the qualification, registration and certification/ licensing system have been already available for many years.
Up to now, the system for ensuring the quality of reach staff has been evaluated that inadequate because of many reasons such as: distribution of high educated staffs (university graduated, post graduated) is not appropriate for rural and urban areas, curative and preventive fields; In-training service system is not strong enough; lack of budget for training; weaknesses of examination supervision in training institutions; Limitation of training methods and documents, and the quality of training staffs.31 There are differences in the professional quality of health workers, which is closely related to the differences in the economic development of different regions and areas, manifesting the risk of inequality in the distribution of high quality human resources for health. Right now, many district hospitals could not conduct some essential medical techniques or services that assigned by technical level due to the lack of quality doctors. There are a certain numbers of doctor who trained to upgrade their knowledge and skill but they still could not conduct some of technical services as expected after comeback to work at their hospitals.
Limited quality of health workers not only due to lack of official training but also lack of skill-based re-training. In two provinces, there have the situation that the hospitals at lower level (district, inter – district hospitals) become lack of high skill staff and also lack of staff for skill-based re-training so the hospital could not provide many essential services that assigned to the hospital lead to wasting the resource at lower levels. In public sector, there have no relevance policy to force health staff to have re-
31 National Health Report 2006, MOH –Vietnam. 32 Circular No 07/2008/TT-BYT, dated 28/05/2008 by Minister of MOH -Vietnam
94
Criteria HSA indicator Suggested indicator for VN
Discussion
training or skill upgrade at certain time. The new policy on re-training health staff have just launched since May 2008 by MOH.32
Sustainability Availability of a functioning management and leadership development program that have been implementing in this two provinces
According to the activities in term of program for developing and strengthening management capacity of health organization leaders, PHB in the provinces have already organized some short courses as well as sent their staff to attend the training courses at central level. However, both two provinces have not been established a long term program as well as plan for management and leadership development.
In nationwide, there is no National program or specific courses for developing and strengthening management capacity in health. Most of the courses for this objective are usually organized not systematically by some National health programs/projects or some departments from MOH. In addition, most of the courses are usually in short period of time and the content only focus on certain aspects of the health management.
In the training institutions (both for health sector and other sectors), the curriculum and training program for long term training in health management are also not formally available, therefore most of leaders in health sector have not been specialized and qualified in health management skill, thus they have many difficulty in managing the health facilities in the recent situation of social–economy transition. This problem is especially more acute in provincial levels.
In the future, in order to adopt the demands of health system in the context of social – economic development of the country, it is necessary to develop a consistence program for management and leadership development of health sector, and this program should be applied through out health system at all levels.

95
MODULE 5. PHARMACEUTICAL MANAGEMENT
Criteria HSA indicator Suggested indicator for VN
Discussion
Equity Existence of licensing provisions or incentives that increase geographic access by consumers/patients to quality products and services through private wholesalers and retailers
Out of pocket expenses for medicines by income groups for all drugs
HAS indicators is not appropriate in Vietnam context: there is no data available in Vietnam for these two indicators There is a considerable disparity in drug consumption across income groups in Vietnam.
Use of generic of nonpropriety names (INN) for MOH procurements
It was found that in drug procurement generic names were not consistently used but trade names.
Percentage of MOH pharmaceuticals procured through competitive bid
This indicator got high adequate as almost drugs are purchased through competitive bidding
Efficiency
Value of loss inventory This indicator got high adequate with very low value of inventory loss reported at national as well as province level.
Population per licensed pharmacist or pharmacy technician
There is decreasing tendency in average number of population per licensed pharmacist.
Access
Average population per licensed retail outlet
Quality Existence of functioning mechanisms/tools to improve the use of medicines in hospitals and health facilities
There is difference in concept of quality in pharmaceutical management presented in this health system assessment approach and in regular report delivered by DAV. From DAV perspective, quality assurance is aiming at providing good drug for people based on standards and guidelines for drug production, quality control, storage, and distribution. Meanwhile, from HSA guidelines, quality is associated with two key indicators including: (1) Existence of functional mechanism/tools to improve the use of medicines in hospitals and health facilities; and (2) existence of system for the collection of data regarding the efficacy, quality and safety marketed pharmaceutical products. Vietnam has several functional mechanism to improve rational use of drugs at hospitals such as: Committee for drug and therapeutic, regulation for medical record review, improving clinical pharmacy in hospital...
96
Criteria HSA indicator Suggested indicator for VN
Discussion
Existence of a system for the collection of data regarding the efficacy, quality, and/or safety of marketed pharmaceutical products (post-marketing surveillance)
Vietnam has got routine system for data collection regarding the efficacy, quality and safety marketed pharmaceutical products
Sustainability Existence of a National Essential Medicines Policy (NMP) or other government document that sets objectives and strategies for the pharmaceutical sector based on priority health problems
Promoting the use of essential drug through existence of a National Essential Medicines Policy indicated sustainability of pharmaceutical management. In Vietnam, this policy has been adopted quite early. The list of ED has been updated regularly. However, the implementation of this policy is facing challenges due to impacts of market forces, especially from trading and producing companies.

97
ANNEX D: REFERENCES
Chien T.T.T. .ed. .2003., Vietnam Health Report 2002, Hanoi: Medical Publishing House
Chien T.T.T.. ed.. 2007., Vietnam Health Report 2006, Hanoi: Medical Publishing House
Can Tho Bureau of Statistics (CTBOS) 2005. Accessed via: www.cantho.gov.vn/wps/portal/en/; [MAP-- http://vietnam.sawadee.com/cantho/prov_map.gif]
Drug Administration Department of MOH Vietnam (DAV) 2007. Review report on pharmaceutical sector.
GSO 2004 Survey on Dynamics of Population and Family Planning
GSO .General Statistical Office, 2006. Vietnam Household Living Standards Survey, Hanoi.
GSO .General Statistical Office, 2008. http://www.gso.gov.vn
Health Metrics Network (HMN), 2006. Vietnam Report.
Ingvar Theo Olsen, Sustainability of Health Care: a framework for analysis. Health policy and Planning, Oxford University Press, 1998. 13(3), 287-295.
Joint Annual Health Review DRAFT (JAHR) 2007. Ministry of Health Vietnam and the Health Partnership Group. Hanoi, Vietnam.
National Assembly XI, Approved 16/11/2002 Law on the Budget of 2002 related to State budgets
MOH 2003. VNHS 2001/02: Vietnam National Health Survey, Main report, MOH, Hanoi.
MOH 2004a. NHA- the process of implementation and development in Vietnam. Hanoi: Statistical Publishing House.
MOH 2006a. NHA 1998-2003. Hanoi: Statistical Publishing House.
MOH 2006b. Health Statistics Yearbooks 2001-2006. Hanoi: Statistical Publishing House.
MoH 2007. Chien T.T.T and Dr. Hans Troedsson. Policy Options for Renovation of the Vietnam Health System towards Equity, Efficiency, and Development; funded by WHO.
98
Ninh Binh Trade Dept website, accessed 2008. http://www.ninhbinhtrade.gov.vn/ninhbinhen.asp?Subid=18&LangID=2&MenuID=0; [MAP-- http://www.ninhbinhtrade.gov.vn/images/bandohanhchinh_en.jpg]
Wagstaff, Adam, 2007. "Health insurance for the poor: initial impacts of Vietnam's health care fund for the poor," Policy Research Working Paper Series 4134, The World Bank.
United Nations (UNDP) 2007. Human Development Report; http://hdrstats.undp.org/countries/country_fact_sheets/cty_fs_VNM.html
United Nations (UNDP) 2003. Millenium Development Goals- Closing the Millenium gaps. Hanoi.
World Bank .2006. “Good Practice” in Expanding Health Care Coverage: Lessons from Reforms in Low- and Middle-Income Countries: Concept Note, HNP Unit, HDN, The World Bank, Washington, D.C