Embed Size (px)
Citation preview
Assessing non-inferiority to an aggregateresponse with an application to developmentof pneumococcal conjugate vaccinesYi Pan,a� Guanghan F. Liu,b and Michael J. Dallasb
The development of a new pneumococcal conjugate vaccine involves assessing the responses of the new serotypesincluded in the vaccine. The World Health Organization guidance states that the response from each new serotype in thenew vaccine should be compared with the aggregate response from the existing vaccine to evaluate non-inferiority.However, no details are provided on how to define and estimate the aggregate response and what methods to use for non-inferiority comparisons. We investigate several methods to estimate the aggregate response based on binary dataincluding simple average, model-based, and lowest response methods. The response of each new serotype is thencompared with the estimated aggregate response for non-inferiority. The non-inferiority test p-value and confidenceinterval are obtained from Miettinen and Nurminen’s method, using an effective sample size. The methods are evaluatedusing simulations and demonstrated with a real clinical trial example. Copyright r 2010 John Wiley & Sons, Ltd.
Keywords: aggregate response; conjugate vaccine; non-inferiority; serotype
1. INTRODUCTION
A statistical issue arises regarding how to evaluate the responsesof the new serotypes included in a new pneumococcalconjugate vaccine in a clinical trial setting. The World HealthOrganization (WHO) guidance [1–3] states that the responsefrom each new serotype in the new vaccine be compared withthe aggregate response from the existing vaccine to evaluatenon-inferiority. However, no details are provided on how todefine and estimate the aggregate response and what methodsto use for non-inferiority comparisons.
Pneumococcal disease is a major cause of morbidity andmortality worldwide, especially, among young children and theelderly. There has been a long history on the development ofpneumococcal vaccines. The first polysaccharide vaccine target-ing the 14 most common serotypes of Streptococcus pneumo-niae became available in 1977. Another 23-valent polysaccharidevaccine was launched in 1983. However, the polysaccharidevaccine did not show good immunogenicity in children youngerthan 2 years. In 2000, a 7-valent pneumococcal conjugatevaccine, PrevnarTM (PCV7), was licensed for use in infants andyoung children. Although this solved the problem for use inyoung children, there are limitations in serotype coverage withPCV7 in certain regions of the world, and there is some evidenceof certain emerging serotypes in the US [4]. This suggests theneed to develop new pneumococcal conjugate vaccines withbroader serotype coverage.
An important question is how to evaluate the effectiveness ofa new vaccine that contains new serotypes compared with theexisting vaccine. An efficacy trial against the active controlwould be infeasible because the disease rate among twovaccinated groups would be very low. WHO recommended the
following serological criteria for evaluation and licensure ofnew pneumococcal conjugate vaccine formulations for use ininfants [1–3]:
(1) The primary endpoint is the post-immunization IgGantibody concentration exceeding a single threshold of0.35 mg/ml for all pneumococcal serotypes. This threshold isderived from the relationship between the point estimate ofclinical efficacy against invasive disease and the protectiveantibody concentration from pooled data across 7 serotypesin PCV7.
(2) For the serotypes present in a registered vaccine, thepercentage of responders to each of those serotypes in thenew vaccine should be compared with the percentage ofresponders to the same serotype in the registered vaccine inthe same population. Non-inferiority to antibody response foreach of these serotypes is desirable, but not an absoluterequirement. Registration of products in which one or more ofthese serotypes do not meet non-inferiority criteria would haveto be decided on an individual basis.
(3) Serotypes not contained in a registered formulation may beevaluated for non-inferiority to the aggregate responseto the serotypes in the registered vaccine. Failure of oneor more new serotypes to meet this criterion may beconsidered on an individual basis.
33
2
MAIN PAPER
Published online 9 November 2010 in Wiley Online Library(wileyonlinelibrary.com) DOI: 10.1002/pst.470
Pharmaceut. Statist. 2011, 10 332–340 Copyright r 2010 John Wiley & Sons, Ltd.
aEmory University, Atlanta, GA, USA
bMerck Research Laboratories, North Wales, PA, USA
*Correspondence to: Yi Pan, Emory University, 1518 Clifton Road, Atlanta, GA30322, USA.E-mail: [email protected]
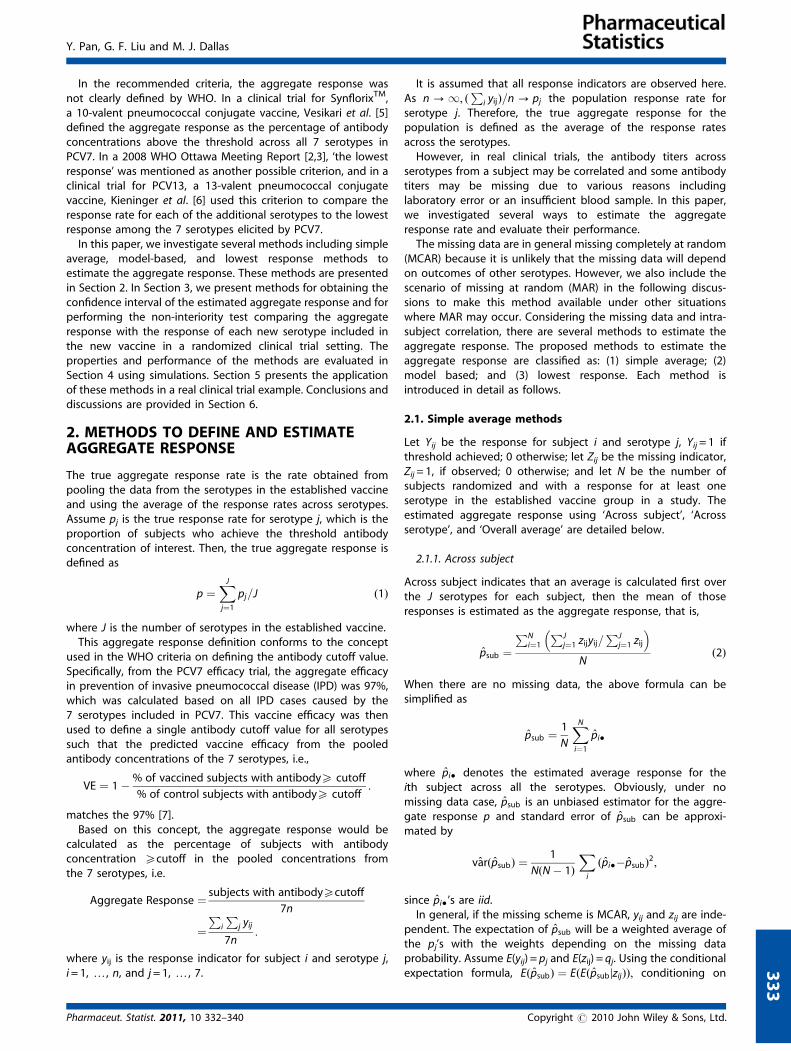
In the recommended criteria, the aggregate response wasnot clearly defined by WHO. In a clinical trial for SynflorixTM,a 10-valent pneumococcal conjugate vaccine, Vesikari et al. [5]defined the aggregate response as the percentage of antibodyconcentrations above the threshold across all 7 serotypes inPCV7. In a 2008 WHO Ottawa Meeting Report [2,3], ‘the lowestresponse’ was mentioned as another possible criterion, and in aclinical trial for PCV13, a 13-valent pneumococcal conjugatevaccine, Kieninger et al. [6] used this criterion to compare theresponse rate for each of the additional serotypes to the lowestresponse among the 7 serotypes elicited by PCV7.
In this paper, we investigate several methods including simpleaverage, model-based, and lowest response methods toestimate the aggregate response. These methods are presentedin Section 2. In Section 3, we present methods for obtaining theconfidence interval of the estimated aggregate response and forperforming the non-interiority test comparing the aggregateresponse with the response of each new serotype included inthe new vaccine in a randomized clinical trial setting. Theproperties and performance of the methods are evaluated inSection 4 using simulations. Section 5 presents the applicationof these methods in a real clinical trial example. Conclusions anddiscussions are provided in Section 6.
2. METHODS TO DEFINE AND ESTIMATEAGGREGATE RESPONSE
The true aggregate response rate is the rate obtained frompooling the data from the serotypes in the established vaccineand using the average of the response rates across serotypes.Assume pj is the true response rate for serotype j, which is theproportion of subjects who achieve the threshold antibodyconcentration of interest. Then, the true aggregate response isdefined as
p ¼XJ
j¼1
pj=J ð1Þ
where J is the number of serotypes in the established vaccine.This aggregate response definition conforms to the concept
used in the WHO criteria on defining the antibody cutoff value.Specifically, from the PCV7 efficacy trial, the aggregate efficacyin prevention of invasive pneumococcal disease (IPD) was 97%,which was calculated based on all IPD cases caused by the7 serotypes included in PCV7. This vaccine efficacy was thenused to define a single antibody cutoff value for all serotypessuch that the predicted vaccine efficacy from the pooledantibody concentrations of the 7 serotypes, i.e.,
VE ¼ 1�% of vaccined subjects with antibodyX cutoff
% of control subjects with antibodyX cutoff:
matches the 97% [7].Based on this concept, the aggregate response would be
calculated as the percentage of subjects with antibodyconcentration Xcutoff in the pooled concentrations fromthe 7 serotypes, i.e.
Aggregate Response ¼subjects with antibodyXcutoff
7n
¼
Pi
Pj yij
7n:
where yij is the response indicator for subject i and serotype j,i = 1, y, n, and j = 1, y, 7.
It is assumed that all response indicators are observed here.As n!1; ð
Pi yijÞ=n! pj the population response rate for
serotype j. Therefore, the true aggregate response for thepopulation is defined as the average of the response ratesacross the serotypes.
However, in real clinical trials, the antibody titers acrossserotypes from a subject may be correlated and some antibodytiters may be missing due to various reasons includinglaboratory error or an insufficient blood sample. In this paper,we investigated several ways to estimate the aggregateresponse rate and evaluate their performance.
The missing data are in general missing completely at random(MCAR) because it is unlikely that the missing data will dependon outcomes of other serotypes. However, we also include thescenario of missing at random (MAR) in the following discus-sions to make this method available under other situationswhere MAR may occur. Considering the missing data and intra-subject correlation, there are several methods to estimate theaggregate response. The proposed methods to estimate theaggregate response are classified as: (1) simple average; (2)model based; and (3) lowest response. Each method isintroduced in detail as follows.
2.1. Simple average methods
Let Yij be the response for subject i and serotype j, Yij = 1 ifthreshold achieved; 0 otherwise; let Zij be the missing indicator,Zij = 1, if observed; 0 otherwise; and let N be the number ofsubjects randomized and with a response for at least oneserotype in the established vaccine group in a study. Theestimated aggregate response using ‘Across subject’, ‘Acrossserotype’, and ‘Overall average’ are detailed below.
2.1.1. Across subject
Across subject indicates that an average is calculated first overthe J serotypes for each subject, then the mean of thoseresponses is estimated as the aggregate response, that is,
psub ¼
PNi¼1
PJj¼1 zijyij=
PJj¼1 zij
� �N
ð2Þ
When there are no missing data, the above formula can besimplified as
psub ¼1
N
XN
i¼1
pi�
where pi� denotes the estimated average response for theith subject across all the serotypes. Obviously, under nomissing data case, psub is an unbiased estimator for the aggre-gate response p and standard error of psub can be approxi-mated by
^varðpsubÞ ¼1
NðN� 1Þ
Xi
ðpi��psubÞ2;
since pi�’s are iid.In general, if the missing scheme is MCAR, yij and zij are inde-
pendent. The expectation of psub will be a weighted average ofthe pj’s with the weights depending on the missing dataprobability. Assume E(yij) = pj and E(zij) = qj. Using the conditionalexpectation formula, EðpsubÞ ¼ EðEðpsubjzijÞÞ; conditioning on 3
33
Y. Pan, G. F. Liu and M. J. Dallas
Pharmaceut. Statist. 2011, 10 332–340 Copyright r 2010 John Wiley & Sons, Ltd.

zij, we have
EðpsubÞ ¼ EX
i
Pj zijpjP
j zij
�N
!
First when pj = p is the same for each serotype, it is easy to seethat psub is an unbiased estimator. When the missing proportionis the same across serotypes, i.e. qj = q, then zij would be i.i.dunder MCAR. Therefore, the ratio zij=
Pj zij follows the same
distribution, and Eðzij=P
j zijÞ ¼ 1=J because EðP
j zij=P
j zijÞ ¼ 1.So psub is also an unbiased estimator when qj = q.
In addition, if the missing scheme is MAR, the expectation ofpsub cannot be simplified. Also, whenever there are missing data,there does not exist a closed form estimate for SE of psub.Therefore, we used the bootstrap method to obtain the SE ifthere are missing data.
2.1.2. Across serotype
Similar to the across subject method, the aggregate responsecan also be estimated as the mean across serotypes on theaverages calculated across subjects first, that is,
psero ¼
PJj¼1
PNi¼1 zijyij=
PNi¼1 zij
� �J
ð3Þ
When there are no missing data, the above formula can besimplified as
psero ¼1
J
XJ
j¼1
p�j;
where p�j denotes the estimated average response for the jthserotype across all the subjects. If the missing scheme is MCAR,yij and zij are independent. Using the conditional expectationformula, we can show
EðpseroÞ ¼XJ
j¼1
pj=J:
Therefore, the above estimation is unbiased under non-missingand MCAR conditions. This unbiasness may not be held underMAR because of the correlation between yij and zij. Due to thecorrelation among different serotypes, the bootstrap methodwas used to obtain the SE of psero regardless of whether thereare missing data.
2.1.3. Overall average
By overall average, each data point is treated independently andthe aggregate response is estimated as
poverall ¼
PNi¼1
PJj¼1 zijyijPN
i¼1
PJj¼1 zij
ð4Þ
When there are no missing data, the above formula can besimplified as
poverall ¼PN
i¼1 pi�
N¼
PJj¼1 p�j
J
Therefore, this estimate is unbiased when there is no missingdata. However, this may not be true when there are missing dataeven under MCAR conditions. For the variability, the bootstrapwas used to estimate the SE due to the correlation amongserotypes. This estimation method was used in a clinical trial forSynflorixTM [5].
Under the non-missing data condition, the above three simpleaverage methods yield the same estimation of aggregateresponse, but they experience different performances underMCAR and MAR.
2.2. Model-based methods
In addition to the definitions given above, generalized estimat-ing equations (GEE) and generalized linear mixed models(GLMM) can also be used to estimate the aggregate response,in which the intra-subject correlation for the response variablesacross serotypes can be accounted for.
The GEE method was originally proposed by Liang and Zegerin 1986 [8]. It does not require specification of a multivariatejoint distribution; instead, only the first two moments arerequired. Therefore, GEE is considered to be a semi-parametricmethod. Furthermore, GEE methodology requires missing datato be MCAR. A consistent and asymptotically normal estimatorof b, a vector of P regression parameters, is the solution to theestimating equations:
UðbÞ ¼Xn
i¼1
Di
X�1
iðYi � miÞ ¼ 0;
where n is the number of observations, Yi is the dependentresponse variable, and Di ¼ DiðbÞ ¼ ð@mi=@bÞ0 is a P� J matrix.The first two moments are mi ¼ miðbÞ ¼ g�1ðXibÞ, and�i ¼ VarðYi jXiÞ ¼ fAiðbÞ
1=2CiðaÞAiðbÞ1=2, where Xi are explanatory
regressor variables, Ai(b) is a J� J diagonal variance matrix, Ci(a)is a working correlation matrix, and g( � ) is the link function. f isa possibly unknown scale parameter related to the covariancematrix Si, which will be estimated as part of the variance butmay not directly impact the estimating equation U(b).
The working correlation matrix is usually unknown and mustbe estimated. In this paper, only compound symmetry andunstructured working correlations are considered. It is knownthat when a sandwich variance estimate is used, the estimatesand inferences for b are robust against the mis-specification ofthe working correlation matrix.
To estimate the aggregate response rate, an intercept-onlymodel and a serotype-specific model were considered. Theintercept model contains only one parameter that correspondsto Xi = 1 and b=x. The mean model for the intercept model islogit(pij) = x, where pij = p = E(yij). The response rate is assumed tobe the same across all serotypes and subjects, and is treated as theaggregate response. Let x ¼ logitðpÞ, then p ¼ expðxÞ=11expðxÞ.By the delta method, VarðpÞ ¼ ½pð1� pÞ�2 VarðxÞ.
In a second model, called a serotype-specific model, theresponse rates are assumed to be different across serotypes,that is, pij ¼ pj ¼ EðyijÞ. The aggregate response is calculated asthe average of pj. This model, using an identity link, can bewritten as follows:
EðYijÞ ¼ p1X11p2X21� � �1pJXJ ð5Þ
where Xj is an indicator variable for the jth serotype. Theestimated aggregate response is p ¼ p01p11. . .1pJ=J and itsstandard error can be obtained from the SAS GENMODprocedure [9] using (5) and a binary distribution for Yij. Thereare two reasons why we choose the identity link for theserotype-specific model. One is that to get the appropriatestandard error estimate for the estimated aggregate responseusing the usual logit link, the delta method, and transformationon the covariance would be required, which is computationally3
34
Y. Pan, G. F. Liu and M. J. Dallas
Copyright r 2010 John Wiley & Sons, Ltd. Pharmaceut. Statist. 2011, 10 332–340

complicated. Two is that from the simulated studies, weobserved that the point estimates of the aggregate responsefrom the model with an identity link are similar to that from themodel with the logit link. In fact, the estimates from these twomodels are exactly the same when there are no missing data.
Due to the restriction of GEE to MCAR scenario, GLMM is alsoconsidered for MAR scenarios. The general mean model forGLMM is EðY jbÞ ¼ g�1ðXTb1ZTbÞ, where Y is a vector ofdependent response variables, g is a differentiable monotoniclink function, X is the design matrix for fixed effects, Z denotesthe design matrix for random effects, b is the fixed effect modelparameter while b�N(0,G), which represents the random effectvariables. In our study, we used the SAS GLIMMIX procedure [9]with the identity link without random effect terms (i.e., G = 0 andthe variance Var(Y) = R). This corresponds to a marginal modelbut using a pseudo-likelihood method to approximate themodel with a Taylor expansion (linearization) [9]. Therefore, theparameters have the same population average interpretation asthat obtained from the GEE models. Because the parameters areestimated by pseudo-likelihood-based techniques, they may bemore robust under MAR cases.
2.3. The lowest response
The lowest response among all serotypes in the registeredvaccine has also been proposed for assessing the non-interiorityof a new serotype included in the experimental vaccine [6]. Thiscriterion in general is different from the criterion based on theaggregate response. It is clear that the lowest response will notestimate the aggregate response as defined in the beginning ofthis section. Because there are multiple serotypes in theregistered control group, a non-inferiority comparison to thelowest response rate may inflate the type-I error rate. In general,this method only controls the type I error if the lowest serotyperesponse is pre-specified.
3. CONFIDENCE INTERVAL ESTIMATION FORTHE AGGREGATE RESPONSE ANDNONINFERIORITY COMPARISONS OF THE NEWSEROTYPES TO THE AGGREGATE RESPONSE
3.1. Confidence interval estimation for aggregate response
Three methods are considered for constructing the confidenceinterval for the aggregate response. They are (1) estimatedaggregate response rate pC and its variance varðpCÞ from any ofthe methods described in the previous section and constructingthe CI using normal approximation, i.e. pC � z0:975
ffiffiffiffiffiffiffiffiffiffiffiffiffiffiffi^varðpCÞ
pwhere z0.975 is the 97.5% standard normal percentile; (2)bootstrap percentile CIs with and without bias-corrected (BCa);and (3) Wilson’s CI with effective sample size as described below.
For Wilson’s method [10,11], suppose a random sample of sizen is taken from a binomial distribution with a success rate of p,and p is the estimated success rate. Then, the Wilson’s 95%confidence interval for p is given as
2np1z2� zffiffiffiffiffiffiffiffiffiffiffiffiffiffiffiffiffiffiffiffiffiffiffiffiffiffiffiffiffiffiz214npð1� pÞ
p� �=½2ðn1z2Þ�
where z is the standard normal quantile at 0.975.For the estimated aggregate response rate pC and its variance
varðpCÞ obtained from any of the methods described in the
previous section, we first calculate an effective sample size
nC ¼ INT½pCð1� pCÞ
varðpCÞ� � 1;
which is a modified version from the definition proposed by Liet al. [12]. This effective sample size represents the amount ofinformation we have on estimating the aggregate response.Then, the confidence interval for pc is obtained using theWilson’s score method with nC and pC .
It should be noted that the total sample size is N�J instead ofonly N for estimating the aggregate response across J serotypes,where N represents the total number of subjects. As the serotyperesponses within a subject are correlated, the effective sample size,a measure of the independent pieces of information for estimatingthe aggregate response, would be between N and N�J.
3.2. Non-inferiority comparisons of the new serotypes to theaggregate response
After defining the aggregate response, a non-inferiority test isused to assess the effectiveness of each new serotype. Let PT bethe response rate of a new serotype in the treatment groupwhile PC denotes the aggregate response rate in the controlgroup. The non-inferiority test is as follows.
H0 : PC � PTXd0
H1 : PC � PTod0;
where d0 is the non-inferiority margin.The non-inferiority criterion is met if the upper 95% CI of the
difference is smaller than d0.Similar to the aggregate response, several different methods
were used to construct the confidence interval for the differencebetween the aggregate response and the response for a newserotype. Among them, Miettinen & Nurminen’s (M&N’s)method [13] using the effective sample size gave the bestresult (through simulations), and is thus considered in whatfollows. Specifically, suppose nT and nC are the sample size for anew serotype response in the treatment group and the effectivesample size for the aggregate response for the control group,respectively. Using M&N’s method, the 95% confidence intervalfor the proportion difference is the solution of d= pC�pT fromthe following equation:
w20:95 ¼
ðpC � pT � dÞ2
~V
where pT and pC are estimated response rates for the treatmentand control groups, w2
0:95 is a chi-square quantile at 0.95 with 1degree of freedom, and
~V ¼~pT ð1� ~pT Þ
nT1~pCð1� ~pCÞ
nC
� �N
ðN� 1Þ
where ~pC is the maximum likelihood estimate for pC as afunction of d and under constraint ~pC ¼ ~pT1d, N ¼ nT 1nC . Theabove equation is solved using numerical iterations since noexplicit solution is available [13]. Detailed expression of ~pC canbe found in Appendix I of Miettinen and Nurminen [13].
For the non-inferiority test, the p-value is calculated as theprobability of a standard normal random variable being greaterthan or equal to the following statistic
Z ¼pC � pT � d0ffiffiffi
~Vp ;
where ~V is defined as above with d= d0. 33
5
Y. Pan, G. F. Liu and M. J. Dallas
Pharmaceut. Statist. 2011, 10 332–340 Copyright r 2010 John Wiley & Sons, Ltd.

4. SIMULATION STUDY
Simulations were conducted to compare the performance ofdifferent definitions of the aggregate response. In Section 4.1we describe the approach to simulate correlated binary dataunder non-missing, MCAR, and MAR cases. Details of simulationscenarios are shown in Section 4.2. Results are then discussed inSection 4.3.
4.1. Methods for simulating correlated binary data
Correlated binary data in the simulation study was generatedby Emrich and Piedmonte’s method (1991), which is basedon the specifications of the marginal means and correlationmatrix of the binary responses. The Emrich and Piedmonte’smethod [14] was implemented using an R package called‘mvtBinaryEP’ [15]. Let Fðx1; x2; rÞ denote the cumulativedistribution function for a standard bivariate normal distributionwith correlation coefficient r. The algorithm first solvesthe equations F½zðpiÞ; zðpjÞ; rij� ¼ rijðpijqipjqjÞ
1=21pipj forrijði ¼ 1; . . .; k � 1; j ¼ i11; . . .; kÞ, where rij denotes the pair-wise correlation coefficient, i.e. rij = corr[Yi, Yj], qi = 1�pi and z(p)denotes the pth quantile of the standard normal distribution.In the next step, a k-dimensional multivariate normalrandom vector X = (X1,y,Xk)0 is generated with zero means,unit variances, and correlation matrix R = [rij]. The desired binaryvariables, which represent the across subject responses for eachof k-1 ( = J) serotypes in the registered vaccine, are obtained bysetting Yi = 1 if Xipz(pi) and Yi = 0 otherwise.
4.2. Simulation scenarios
Five scenarios were considered in the simulation study (Table I).Overall, 5 serotypes were used for the control vaccine, while 1new serotype was considered for the treatment vaccine.Therefore, the 5 serotypes in the control vaccine were usedto define the aggregate response. Except for scenario 2, theresponse rates for the 5 serotypes ranged from 0.78 to 0.98, witha mean of 0.90. In scenario 2, the response rates for all 5serotypes in the control vaccine were set to be equal to 0.9. Theresponse rate for the new serotype was set to 0.8 to assess thetype I error rate and set to 0.9 to assess the power, as the non-inferiority margin, d0, was set to 0.1. The correlation structure is
shown in Table II, where the pair-wise correlations ranged from0.08 to 0.5.
Three missing schemes were considered including non-missing, MCAR, and MAR. In scenarios 2 and 3, a constantmissing proportion of data (40%) was used for all 5 serotypes,under MCAR. However, in scenario 4, under MCAR, the missingproportions of data for 5 serotypes were q1 = q2 = 0.05,q3 = q4 = q5 = 0.3. In scenario 5, under MAR, a clustered missingdata generation strategy and a non-severe MAR was used. Themissing proportions of data were q1 = 0.05, q2 = 0.065, q3 = 0.3,q4 = 0.256, and q5 = 0.291. In this case, the missingness of y2 wasdependent on y1, while the missingness of y4 and y5 weredependent on y3. In scenario 3, different sample sizes (50, 100,and 200) were considered. In other scenarios, the sample sizewas fixed as 200. For all scenarios, 5000 simulation runs wereperformed. The ‘Runs’ shown in Tables III–V denoted thenumber of simulations that converged.
4.3. Methods for the comparisons
Methods described in Section 2 were investigated in thesimulation study. Specifically, for the simple average methods,the ‘Across subject’, ‘Across serotype’, and ‘Overall average’approaches were included. Among model-based methods, the‘GEE, CS’, ‘GEE, CS, serotype’, ‘GEE, UN, serotype’, and ‘Glimmix,CS, serotype’ approaches were considered. The ‘GEE, CS’approach is an intercept only model with the logit link andcompound symmetry correlation structure. The ‘GEE, CS, sero-type’ and ‘GEE, UN, serotype’ approaches estimated separateresponse rates for each of the serotypes, and then the averagewas taken as the estimated aggregate response; compoundsymmetry and unstructured correlation structure were used,
33
6
Table II. Correlation structure in data generation.
y1 y2 y3 y4 y5
y1 1.00 0.25 0.20 0.15 0.20y2 0.25 1.00 0.30 0.35 0.08y3 0.20 0.30 1.00 0.50 0.20y4 0.15 0.35 0.50 1.00 0.35y5 0.20 0.08 0.20 0.35 1.00
Table I. Simulation framework.
Response rates for common serotypesin the control
Response rate forthe new serotype
Scenario Missing Sample size p1 p2 p3 p4 p5 pT�
1 No 200 0.78 0.87 0.92 0.95 0.98 0.9/0.82 MCAR 40% 200 0.9 0.9 0.9 0.9 0.9 0.9/0.83 MCAR 40% 50 0.78 0.87 0.92 0.95 0.98 0.8
100 0.78 0.87 0.92 0.95 0.98 0.8200 0.78 0.87 0.92 0.95 0.98 0.8
4 MCARy 200 0.78 0.87 0.92 0.95 0.98 0.9/0.85 MARz 200 0.78 0.87 0.92 0.95 0.98 0.9/0.8
�Under null the response rate = 0.8, under alternative the response rate = 0.9 which is the true aggregate response rate forcommon serotypes in the control.yThe missing proportions are 5, 5, 30, 30, and 30% across serotypes, respectively.zThe missing proportions are about 5, 6.5, 30, 25.6, and 29.1% across serotypes, respectively.
Y. Pan, G. F. Liu and M. J. Dallas
Copyright r 2010 John Wiley & Sons, Ltd. Pharmaceut. Statist. 2011, 10 332–340
respectively. When missing data are under MAR, the ‘Glimmix,CS, serotype’ approach was also used, in which separateresponse rate was estimated for each of the serotypesusing an identity link and compound symmetry structure.In SAS, GEE is implemented in the GENMOD procedurewhile the GLMM is implemented by the Glimmix procedure(SAS 9.2). Finally, the ‘Lowest’ response was also considered forcomparison.
Three methods described in Section 3.1 are evaluated forconstructing the confidence interval of aggregate response. Theresults (not shown) indicated that Wilson’s method witheffective sample size performs the best. Therefore, we onlyincluded the results from Wilson’s method for the CI ofaggregate response in the following simulation results. Similarly,
M&N’s method was used to estimate the confidence interval forthe difference between the aggregate response and theresponse for a new serotype.
4.4. Simulation results
Through the simulation study, both bias and coverage prob-ability were assessed for the estimated aggregate response.Also, for the difference between the aggregate response rateand the response rate of a new serotype in the new vaccine, itsbias, coverage, and type-I error or power for the non-inferioritytest were assessed.
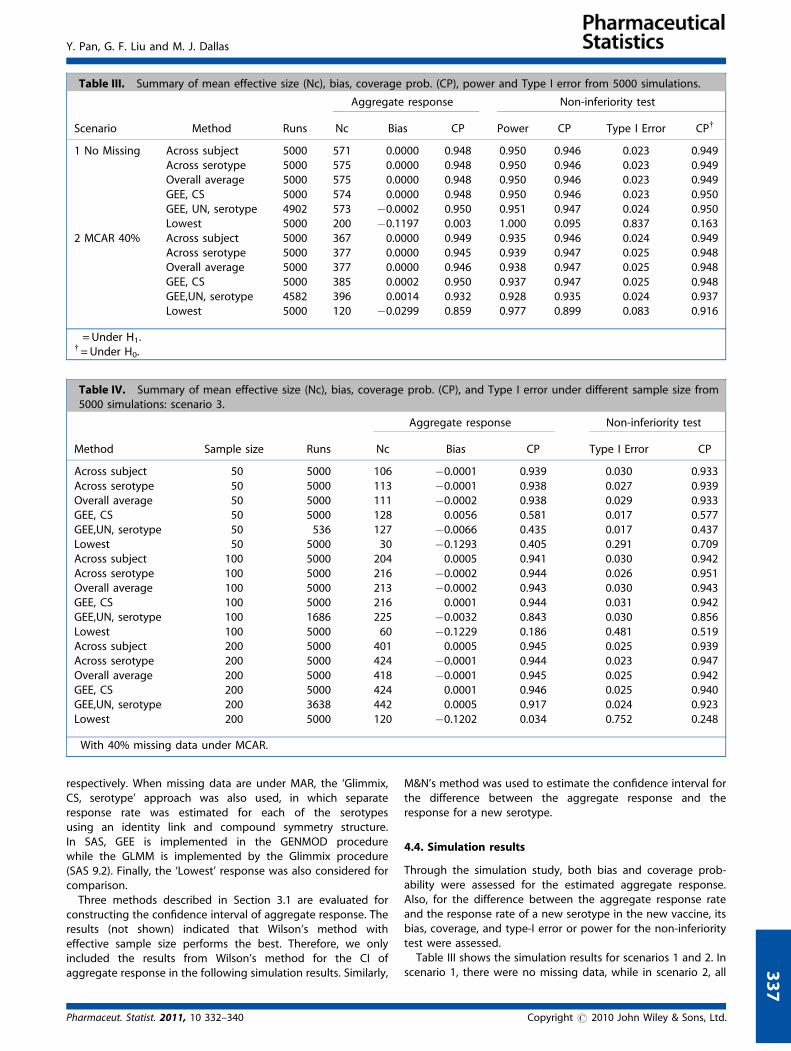
Table III shows the simulation results for scenarios 1 and 2. Inscenario 1, there were no missing data, while in scenario 2, all 3
37
Table IV. Summary of mean effective size (Nc), bias, coverage prob. (CP), and Type I error under different sample size from5000 simulations: scenario 3.�
Aggregate response Non-inferiority test
Method Sample size Runs Nc Bias CP Type I Error CP
Across subject 50 5000 106 �0.0001 0.939 0.030 0.933Across serotype 50 5000 113 �0.0001 0.938 0.027 0.939Overall average 50 5000 111 �0.0002 0.938 0.029 0.933GEE, CS 50 5000 128 0.0056 0.581 0.017 0.577GEE,UN, serotype 50 536 127 �0.0066 0.435 0.017 0.437Lowest 50 5000 30 �0.1293 0.405 0.291 0.709Across subject 100 5000 204 0.0005 0.941 0.030 0.942Across serotype 100 5000 216 �0.0002 0.944 0.026 0.951Overall average 100 5000 213 �0.0002 0.943 0.030 0.943GEE, CS 100 5000 216 0.0001 0.944 0.031 0.942GEE,UN, serotype 100 1686 225 �0.0032 0.843 0.030 0.856Lowest 100 5000 60 �0.1229 0.186 0.481 0.519Across subject 200 5000 401 0.0005 0.945 0.025 0.939Across serotype 200 5000 424 �0.0001 0.944 0.023 0.947Overall average 200 5000 418 �0.0001 0.945 0.025 0.942GEE, CS 200 5000 424 0.0001 0.946 0.025 0.940GEE,UN, serotype 200 3638 442 0.0005 0.917 0.024 0.923Lowest 200 5000 120 �0.1202 0.034 0.752 0.248
�With 40% missing data under MCAR.
Table III. Summary of mean effective size (Nc), bias, coverage prob. (CP), power and Type I error from 5000 simulations.
Aggregate response Non-inferiority test
Scenario Method Runs Nc Bias CP Power CP� Type I Error CPy
1 No Missing Across subject 5000 571 0.0000 0.948 0.950 0.946 0.023 0.949Across serotype 5000 575 0.0000 0.948 0.950 0.946 0.023 0.949Overall average 5000 575 0.0000 0.948 0.950 0.946 0.023 0.949GEE, CS 5000 574 0.0000 0.948 0.950 0.946 0.023 0.950GEE, UN, serotype 4902 573 �0.0002 0.950 0.951 0.947 0.024 0.950Lowest 5000 200 �0.1197 0.003 1.000 0.095 0.837 0.163
2 MCAR 40% Across subject 5000 367 0.0000 0.949 0.935 0.946 0.024 0.949Across serotype 5000 377 0.0000 0.945 0.939 0.947 0.025 0.948Overall average 5000 377 0.0000 0.946 0.938 0.947 0.025 0.948GEE, CS 5000 385 0.0002 0.950 0.937 0.947 0.025 0.948GEE,UN, serotype 4582 396 0.0014 0.932 0.928 0.935 0.024 0.937Lowest 5000 120 �0.0299 0.859 0.977 0.899 0.083 0.916
�= Under H1.y= Under H0.
Y. Pan, G. F. Liu and M. J. Dallas
Pharmaceut. Statist. 2011, 10 332–340 Copyright r 2010 John Wiley & Sons, Ltd.

the response rates were identical with 40% as the commonmissing proportion. Under both scenarios, all methods exceptthe ‘Lowest’ performed similarly, and the coverage probability,power, and type I error rate were very close to the nominal level.For the ‘GEE, UN, serotype’ approach, approximately 2 and 8%non-convergence cases were observed for scenarios 1 and 2,respectively. Except for the ‘Lowest’ response, the effectivesample sizes in scenario 1 were similar; while in scenario 2, the‘GEE, UN, serotype’ approach was observed to have a largereffective sample size than the other methods considered. The‘GEE, CS, serotype’ approach was not included since it wouldprovide similar results as the ‘GEE, CS’ under both scenarios.
The lowest response method does not control the type-I errorrate in either scenario. In scenario 2, when all the true responserates were 0.9, only the multiplicity issue needs to be handled inorder to control the type I error and improve the coverageprobabilities. But in scenario 1, where the true lowest responsewas 0.78, the coverage probabilities and powers were very low.The implication of the non-inferiority hypothesis under scenario1 is different. In fact, if the true lowest response rate is 0.78, thesimulated case with a response rate of 0.80 in the treatmentgroup is not in the null space for non-inferiority. Therefore, thetype I error rate calculation for this scenario should beinterpreted differently.
In scenario 3, different sample sizes with 40% MCAR missingproportion were considered (Table IV), as the interest for thisscenario was to study Type I error and how it may be affected bysample size. The biases for the simple average methods wereminimal even when there were only 50 samples. However,model-based methods were observed to have low coverageprobabilities and failed to control the type I error when thesample size was small. The performance was much better whenthe sample size was 200. However, the ‘GEE, UN, serotype’approach faces a severe non-convergence issue even when thesample size was 200 (27% cases failed to converge). Also, the
‘GEE, CS, serotype’ approach was not included in scenario 3since it would provide similar results as that of the ‘GEE, CS’.Again, the ‘Lowest’ method failed to control the type I error anddid not have a satisfactory performance regarding the coverageprobability of the estimated aggregate response.
Table V presents the simulation results of different missingdata schemes – MCAR and MAR, respectively. In scenario 4,MCAR with different missing proportions per serotype wereconsidered. Among the simple average methods, the ‘Acrosssubject’ and ‘Overall average’ methods had much larger biasesand lower coverage probability for the estimated aggregateresponse. Furthermore, they failed to control the type I error forthe non-inferiority test. But the ‘Across serotype’ methodperformed well. Among the model-based methods, the ‘GEE,CS, serotype’ and ‘GEE, UN, serotype’ approaches workedsimilarly well. However, the ‘GEE, UN, serotype’ method hadmore convergence issues than did the ‘GEE, CS, serotype’. Theintercept-only model ‘GEE, CS’ had more bias and showedinflation of type-I error.
In scenario 5, the MAR missing scheme was investigated.As mentioned in Section 4.2 under missing data generation, themissingness of y2 was dependent on y1, while the missingness ofy4 and y5 were dependent on y3 and it was only non-severe MARdue to the weak dependence. Similar to Scenario 4, the ‘Acrosssubject’ and ‘Overall average’ methods failed to achieve asatisfactory coverage probability or type I error for the non-inferiority test. On the other hand, both the ‘GEE UN, serotype’and ‘GEE, CS, serotype’ approaches worked well. The ‘Glimmix, CS,serotype’ approach was added in this scenario and it performedsimilarly well as the ‘GEE, CS, serotype’ and ‘GEE, UN, serotype’approaches. Here we only considered the serotype-specific casefor the GLMM model because the intercept only model would notperform well based on what was observed in the GEE CS modelunder scenario 4. The convergence problem was better for theGLMM methods in scenario 5 compared to the GEE-type models.
33
8
Table V. Summary of mean effective size (Nc), bias, coverage prob. (CP), power and Type I error with MCAR and MAR from5000 simulations.
Aggregate response Non-inferiority test
Scenario Method Runs Nc Bias CP Power CP� Type I Error CPy
4 MCARz Across subject 5000 495 �0.0118 0.854 0.975 0.926 0.052 0.937Across serotype 5000 528 0.0000 0.944 0.949 0.947 0.025 0.947Overall average 5000 512 �0.0094 0.883 0.971 0.932 0.043 0.942GEE, CS 5000 513 �0.0103 0.87 0.973 0.932 0.047 0.94GEE, CS, serotype 4701 530 �0.0006 0.951 0.953 0.949 0.026 0.949GEE,UN, seortype 4502 539 �0.0001 0.938 0.942 0.937 0.025 0.937Lowest 5000 190 �0.1197 0.003 1.000 0.102 0.829 0.171
5 MARy Across subject 5000 496 �0.0113 0.865 0.975 0.933 0.05 0.937Across serotype 5000 554 0.0017 0.946 0.941 0.942 0.021 0.947Overall average 5000 529 �0.0069 0.913 0.967 0.942 0.037 0.944GEE, CS 5000 520 �0.0087 0.897 0.969 0.938 0.041 0.944GEE, CS, serotype 4660 545 0.0000 0.952 0.948 0.946 0.025 0.947GEE, UN, serotype 4569 558 0.0006 0.943 0.939 0.939 0.022 0.943Glimmix, CS, serotype 4891 558 0.0003 0.943 0.947 0.945 0.024 0.948Lowest 5000 190 �0.1197 0.005 1.000 0.101 0.83 0.170
�= Under H1.y= Under H0.zThe missing proportions are 5, 5, 30, 30, and 30% across serotypes, respectively.yThe missing proportions are about 5, 6.5, 30, 25.6, and 29.1% across serotypes, respectively.
Y. Pan, G. F. Liu and M. J. Dallas
Copyright r 2010 John Wiley & Sons, Ltd. Pharmaceut. Statist. 2011, 10 332–340
The ‘Across serotype’ approach was still observed to have asatisfactory performance under non-severe MAR.
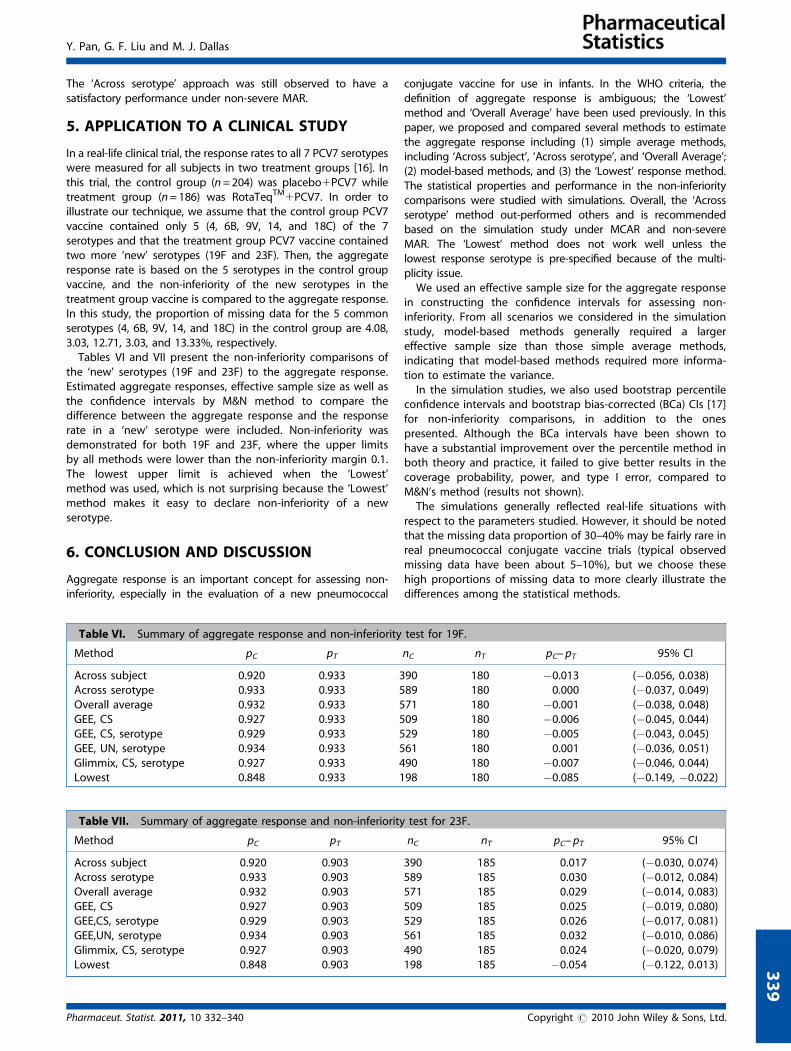
5. APPLICATION TO A CLINICAL STUDY
In a real-life clinical trial, the response rates to all 7 PCV7 serotypeswere measured for all subjects in two treatment groups [16]. Inthis trial, the control group (n = 204) was placebo1PCV7 whiletreatment group (n = 186) was RotaTeqTM
1PCV7. In order toillustrate our technique, we assume that the control group PCV7vaccine contained only 5 (4, 6B, 9V, 14, and 18C) of the 7serotypes and that the treatment group PCV7 vaccine containedtwo more ‘new’ serotypes (19F and 23F). Then, the aggregateresponse rate is based on the 5 serotypes in the control groupvaccine, and the non-inferiority of the new serotypes in thetreatment group vaccine is compared to the aggregate response.In this study, the proportion of missing data for the 5 commonserotypes (4, 6B, 9V, 14, and 18C) in the control group are 4.08,3.03, 12.71, 3.03, and 13.33%, respectively.
Tables VI and VII present the non-inferiority comparisons ofthe ‘new’ serotypes (19F and 23F) to the aggregate response.Estimated aggregate responses, effective sample size as well asthe confidence intervals by M&N method to compare thedifference between the aggregate response and the responserate in a ‘new’ serotype were included. Non-inferiority wasdemonstrated for both 19F and 23F, where the upper limitsby all methods were lower than the non-inferiority margin 0.1.The lowest upper limit is achieved when the ‘Lowest’method was used, which is not surprising because the ‘Lowest’method makes it easy to declare non-inferiority of a newserotype.
6. CONCLUSION AND DISCUSSION
Aggregate response is an important concept for assessing non-inferiority, especially in the evaluation of a new pneumococcal
conjugate vaccine for use in infants. In the WHO criteria, thedefinition of aggregate response is ambiguous; the ‘Lowest’method and ‘Overall Average’ have been used previously. In thispaper, we proposed and compared several methods to estimatethe aggregate response including (1) simple average methods,including ‘Across subject’, ‘Across serotype’, and ‘Overall Average’;(2) model-based methods, and (3) the ‘Lowest’ response method.The statistical properties and performance in the non-inferioritycomparisons were studied with simulations. Overall, the ‘Acrossserotype’ method out-performed others and is recommendedbased on the simulation study under MCAR and non-severeMAR. The ‘Lowest’ method does not work well unless thelowest response serotype is pre-specified because of the multi-plicity issue.
We used an effective sample size for the aggregate responsein constructing the confidence intervals for assessing non-inferiority. From all scenarios we considered in the simulationstudy, model-based methods generally required a largereffective sample size than those simple average methods,indicating that model-based methods required more informa-tion to estimate the variance.
In the simulation studies, we also used bootstrap percentileconfidence intervals and bootstrap bias-corrected (BCa) CIs [17]for non-inferiority comparisons, in addition to the onespresented. Although the BCa intervals have been shown tohave a substantial improvement over the percentile method inboth theory and practice, it failed to give better results in thecoverage probability, power, and type I error, compared toM&N’s method (results not shown).
The simulations generally reflected real-life situations withrespect to the parameters studied. However, it should be notedthat the missing data proportion of 30–40% may be fairly rare inreal pneumococcal conjugate vaccine trials (typical observedmissing data have been about 5–10%), but we choose thesehigh proportions of missing data to more clearly illustrate thedifferences among the statistical methods.
33
9
Table VI. Summary of aggregate response and non-inferiority test for 19F.
Method pC pT nC nT pC– pT 95% CI
Across subject 0.920 0.933 390 180 �0.013 (�0.056, 0.038)Across serotype 0.933 0.933 589 180 0.000 (�0.037, 0.049)Overall average 0.932 0.933 571 180 �0.001 (�0.038, 0.048)GEE, CS 0.927 0.933 509 180 �0.006 (�0.045, 0.044)GEE, CS, serotype 0.929 0.933 529 180 �0.005 (�0.043, 0.045)GEE, UN, serotype 0.934 0.933 561 180 0.001 (�0.036, 0.051)Glimmix, CS, serotype 0.927 0.933 490 180 �0.007 (�0.046, 0.044)Lowest 0.848 0.933 198 180 �0.085 (�0.149, �0.022)
Table VII. Summary of aggregate response and non-inferiority test for 23F.
Method pC pT nC nT pC– pT 95% CI
Across subject 0.920 0.903 390 185 0.017 (�0.030, 0.074)Across serotype 0.933 0.903 589 185 0.030 (�0.012, 0.084)Overall average 0.932 0.903 571 185 0.029 (�0.014, 0.083)GEE, CS 0.927 0.903 509 185 0.025 (�0.019, 0.080)GEE,CS, serotype 0.929 0.903 529 185 0.026 (�0.017, 0.081)GEE,UN, serotype 0.934 0.903 561 185 0.032 (�0.010, 0.086)Glimmix, CS, serotype 0.927 0.903 490 185 0.024 (�0.020, 0.079)Lowest 0.848 0.903 198 185 �0.054 (�0.122, 0.013)
Y. Pan, G. F. Liu and M. J. Dallas
Pharmaceut. Statist. 2011, 10 332–340 Copyright r 2010 John Wiley & Sons, Ltd.

Data generation was based on Emrich and Piedmonte’smethod as described in Section 4.1. We also looked at datagenerated from a random effects model in which the intra-subject correlation among the responses was generated froma random intercept. Similar and consistent results were observedin terms of the performance of the considered methods (resultsnot shown).
Finally, although the application described in this manuscriptis for pneumococcal vaccines, the statistical technique can beused more generally. In other applications, it may be possiblethat the missing data will be MAR. Therefore, it will also beinteresting to evaluate the performance of ‘Across serotype’under more severe MAR, at least theoretically.
Acknowledgement
The authors thank Christine Vanderlinden and Ilse Dieussaertfrom GlaxoSmithKline Biologicals, Rixensart, Belgium for theirclarification and discussion on the aggregate response in ref. [5].
References
[1] World Health Organization. Recommendations for the productionand control of pneumococcal conjugate vaccines. WHO TechnicalReport Series, No. 927, 2005.
[2] Feavers I et al., Challenges in the evaluation and licensing of newpneumococcal vaccines, 7–8 July 2008, Ottawa, Canada. Vaccine2009;27(28):3681–3688.
[3] World Health Organization. WHO/Health Canada consultation onserological criteria for evaluation and licensing of new pneumo-coccal vaccines. Executive summary. 2008.
[4] Hicks LA, Harrison LH, Flannery B, Hadler JL, Schaffner W,Craig AS et al. Incidence of pneumococcal disease due to non-pneumococcal conjugate vaccine (PCV7) serotypes in the UnitedStates during the Era of widespread PCV7 vaccination, 1998–2004.Journal of Infectious Disease 2007;196:1346–1354.
[5] Vesikari T, Wysocki J, Chevallier B, Karvonen A, Czajka H, Arsene JP,Lommel P, Dieussaert I, Schuerman L. Immunogenicity of the10-valent pneumococcal non-typeable haemophlius influenzaeprotein D conjugate vaccine (PHiD-CV) compared to the licensed7vCRM vaccine. The Pediatric Infectious Disease Journal 2009;28(4):S66–SS76.
[6] Kieninger DM, Kueper K, Steul K, Juergens C, Ahlers N, Baker S,Giardina P, Gruber W, Scott D. Safety and immunologicnon-inferiority of 13-valent pneumococcal conjugate vaccinecompared to 7-valent pneumococcal conjugate vaccine given asa 4-does series with routine vaccines in healthy infants andtoddlers. Poster Presented in 48th ICAAC/IDSA 46th AnnualMeeting, Washington, DC, Oct. 25–28, 2008.
[7] Jodar L, Butler J, Carlone G et al. Serological criteria for evaluationand licensure of new pneumococcal conjugate vaccine formula-tions for use in infants. Vaccine 2003; 21:3265–3272.
[8] Liang KY, Zager SL. Longitudinal data analysis using generalizedlinear models. Biometrika 1986; 73:13–22.
[9] SAS/STAT 9.2 User’s Guide, SAS Institute Inc., Cary, USA, February2009.
[10] Wilson EB. Probable inference, the law of succession, and statisticalinference. Journal of the American Statistical Association 1927;22:209–212.
[11] Newcombe RG. Two-sided confidence intervals for the singleproportion: comparison of seven methods. Statistics in Medicine1998; 17:857–872.
[12] Li X, Mehrotra DV, Barnard J. Analysis of incomplete longitudinalbinary data using multiple imputation. Statistics in Medicine 2006;25:2107–2124.
[13] Miettinen OS, Nurminen M. Comparative analysis of two rates.Statistics in Medicine 1985; 4:213–226.
[14] Erich LJ, Piedmonte MR. A method for generating high-dimen-sional mulivariate binary variables. The American Statistician 1991;45:302–304.
[15] Kunthel B, Bahjat Q. mvtBinaryEP: Generates Correlated Binary Data.http://cran.r-project.org/web/packages/mvtBinaryEP/index.html. 2009.
[16] Rodriguez ZM, Goveia MG, Stek JE et al. Concomitant use of anoral live pentavalent human-bovine reassortant rotavirus vaccinewith licensed parenteral pediatric vaccines in the United States.The Pediatric Infectious Disease Journal 2007; 26:221–227.
[17] Efron B, Tibshirani RJ. An introduction to the bootstrap. Chapman &Hall: New York, NY, 1993.
34
0
Y. Pan, G. F. Liu and M. J. Dallas
Copyright r 2010 John Wiley & Sons, Ltd. Pharmaceut. Statist. 2011, 10 332–340


![ars.els-cdn.com€¦ · Web view"Pneumococcal Vaccines"[Mesh] OR pneumococcal conjugate vaccin*[tw] OR 10-valent[all] OR PHiD-CV[all] OR PCV10[all] OR PCV-10[all] OR Synflorix[all]](https://img.pdfslide.us/doc/110x75/5ff53f25d4cfc62b5c52e111/arsels-cdncom-web-view-pneumococcal-vaccinesmesh-or-pneumococcal.jpg)