Embed Size (px)
Citation preview
Assessing Multiple Data Sources to Understand Frac Property Evolution Over Time: Do Early-Time Operations
Impact Long-Term Performance?
Jesse D. Williams-Kovacs, University of Calgary and TAQA North Ltd.
CANADIAN BUSINESS CONFERENCES ARTIFICIAL LIFT & HORIZONTAL PRODUCTION COST REDUCTION INITIATIVE 2015 29-30 APRIL 2015 • CALGARY, ALBERTA
Slide 2
OUTLINE
Assessing the Impact of Early-Time Operations • Williams-Kovacs
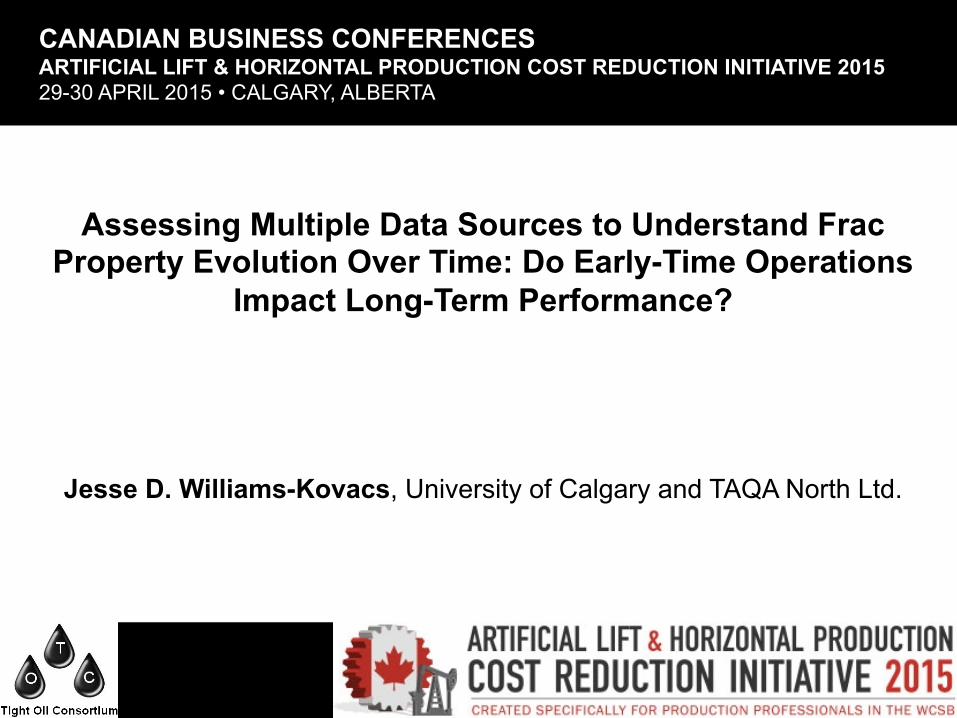
1. Unconventional Reservoir Analysis Workflow 2. Conceptual Model of Flowback and Analysis Procedure 3. Case Study: Tight Oil Well
Ø Commingled Flowback Ø Microseismic Ø Frac Modelling Ø Online Production Data Analysis
4. Key Takeaways 5. Discussion Points 6. Flowback Data Gathering and Assessment 7. Impact of HC Breakthrough and Shut-Ins During Flowback
Assessing the Impact of Early-Time Operations • Williams-Kovacs
UNCONVENTIONAL RESERVOIR ANALYSIS
Slide 3
Slide 4
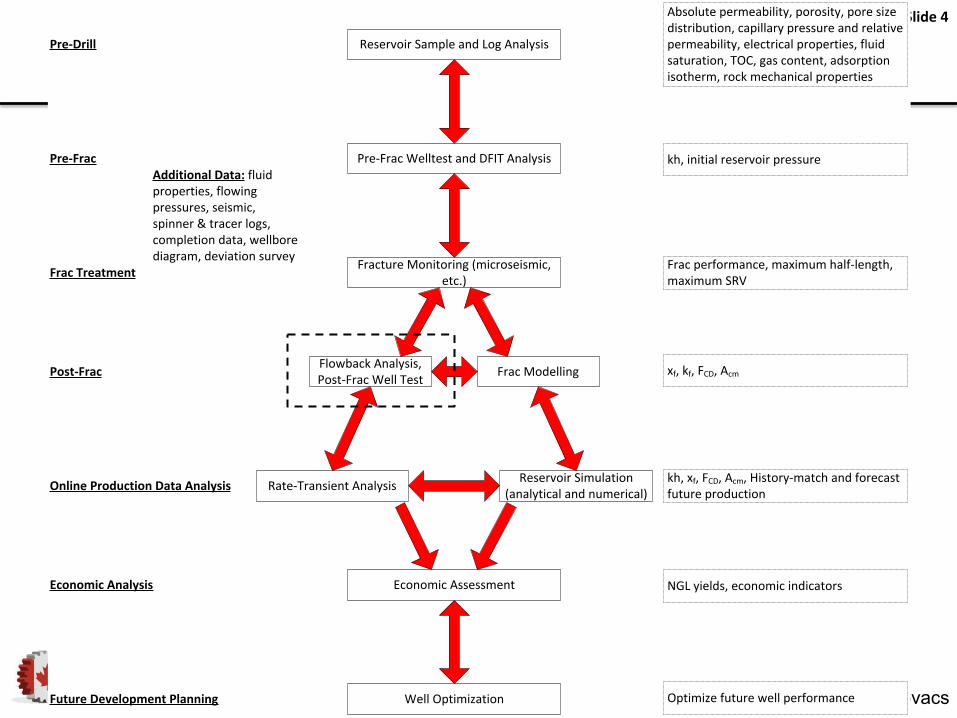
UNCONVENTIONAL RESERVOIR ANALYSIS
Assessing the Impact of Early-Time Operations • Williams-Kovacs
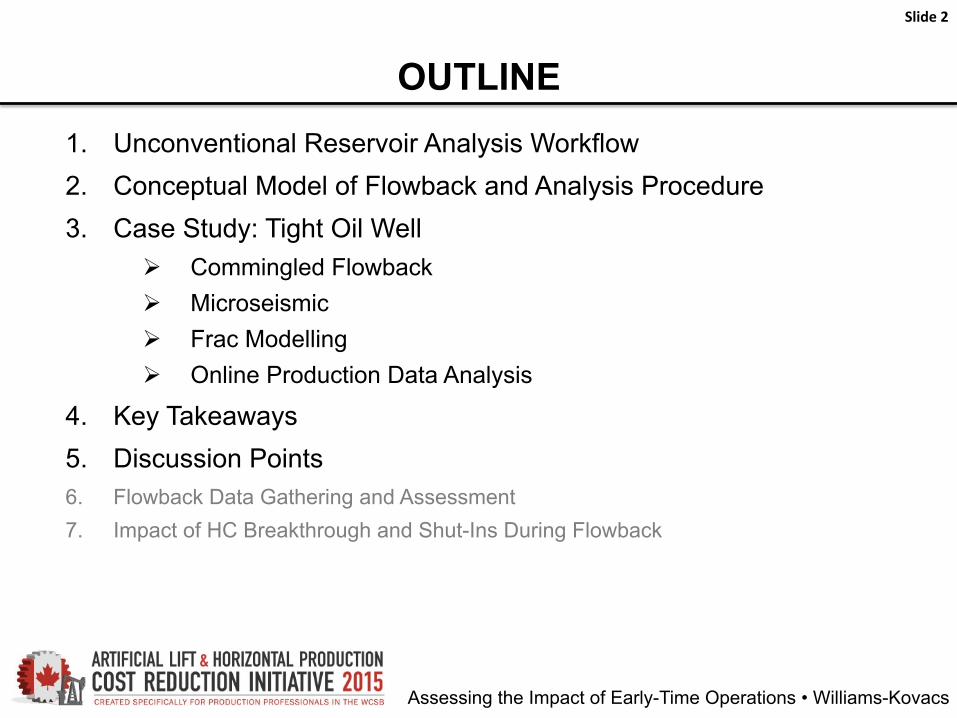
Pre-‐Drill Reservoir Sample and Log Analysis
Pre-‐Frac Welltest and DFIT Analysis
Fracture Monitoring (microseismic, etc.)
Pre-‐Frac
Frac Treatment
Post-‐Frac Frac ModellingFlowback Analysis, Post-‐Frac Well Test
Online Production Data Analysis Reservoir Simulation (analytical and numerical)Rate-‐Transient Analysis
Well Optimization
Economic AssessmentEconomic Analysis
Future Development Planning
Absolute permeability, porosity, pore size distribution, capillary pressure and relative permeability, electrical properties, fluid saturation, TOC, gas content, adsorption isotherm, rock mechanical properties
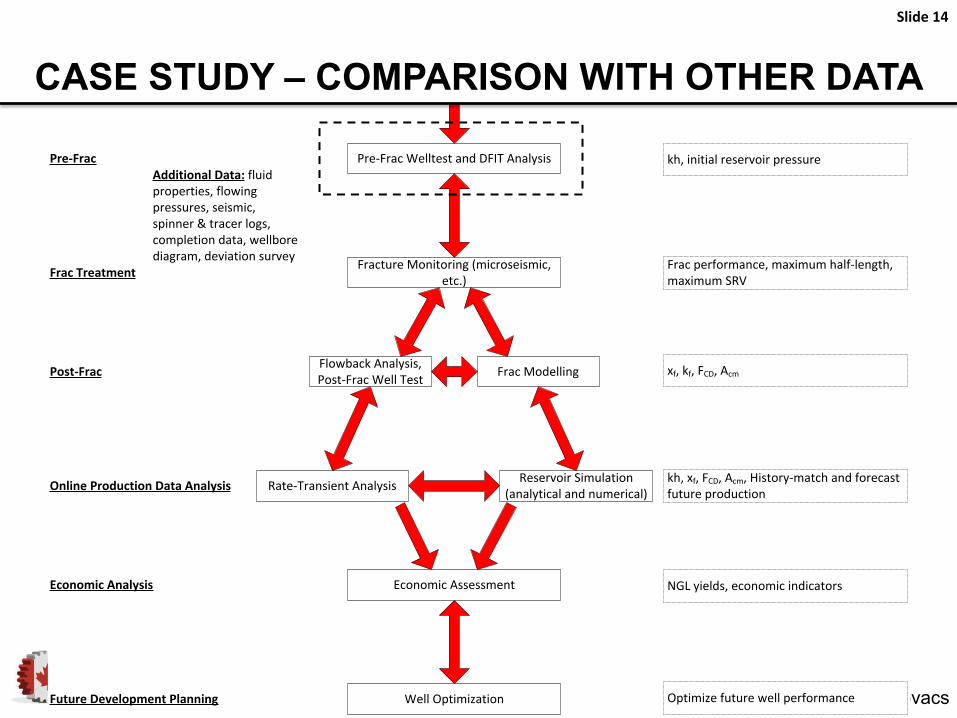
kh, initial reservoir pressure
Frac performance, maximum half-‐length, maximum SRV
xf, kf, FCD, Acm
kh, xf, FCD, Acm, History-‐match and forecast future production
NGL yields, economic indicators
Optimize future well performance
Additional Data: fluid properties, flowing pressures, seismic, spinner & tracer logs, completion data, wellbore diagram, deviation survey
Assessing the Impact of Early-Time Operations • Williams-Kovacs
Slide 5
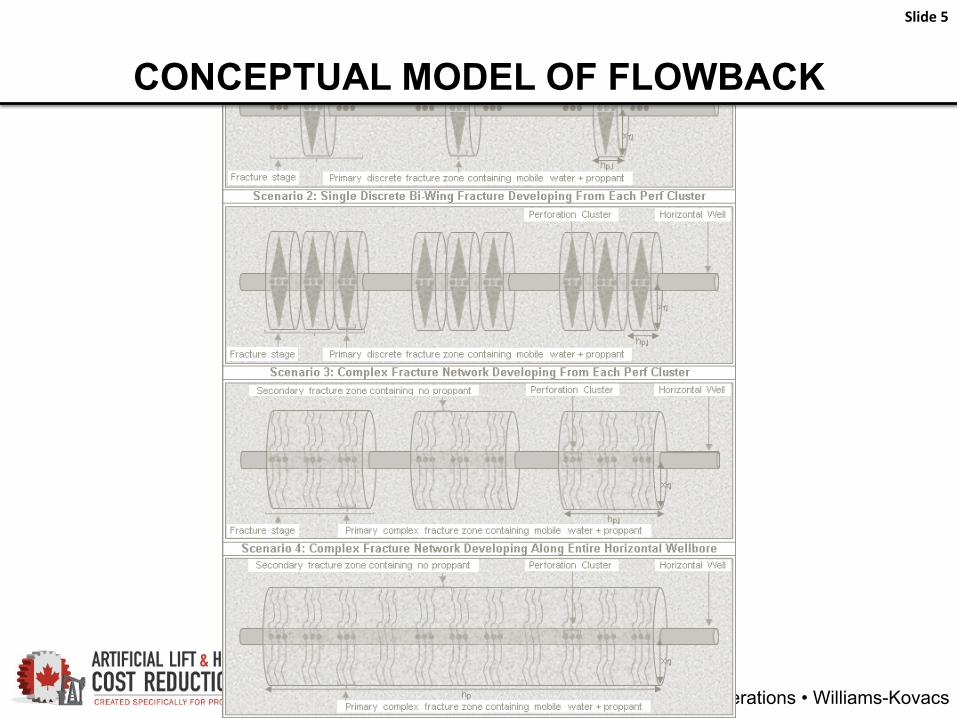
CONCEPTUAL MODEL OF FLOWBACK
Assessing the Impact of Early-Time Operations • Williams-Kovacs
Slide 6
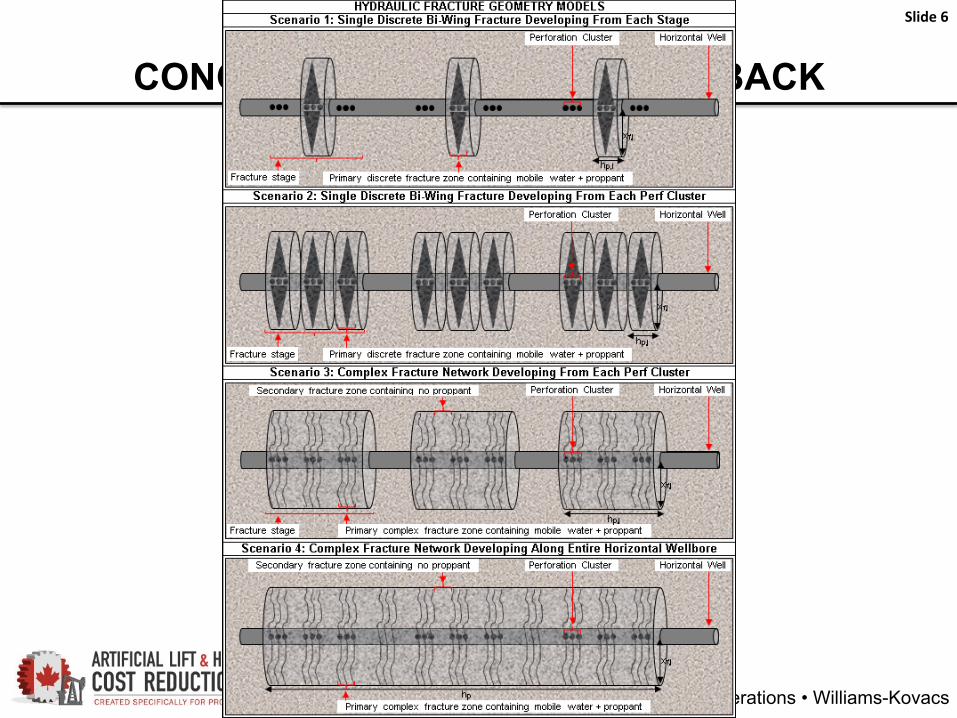
CONCEPTUAL MODEL OF FLOWBACK
Assessing the Impact of Early-Time Operations • Williams-Kovacs
Slide 7
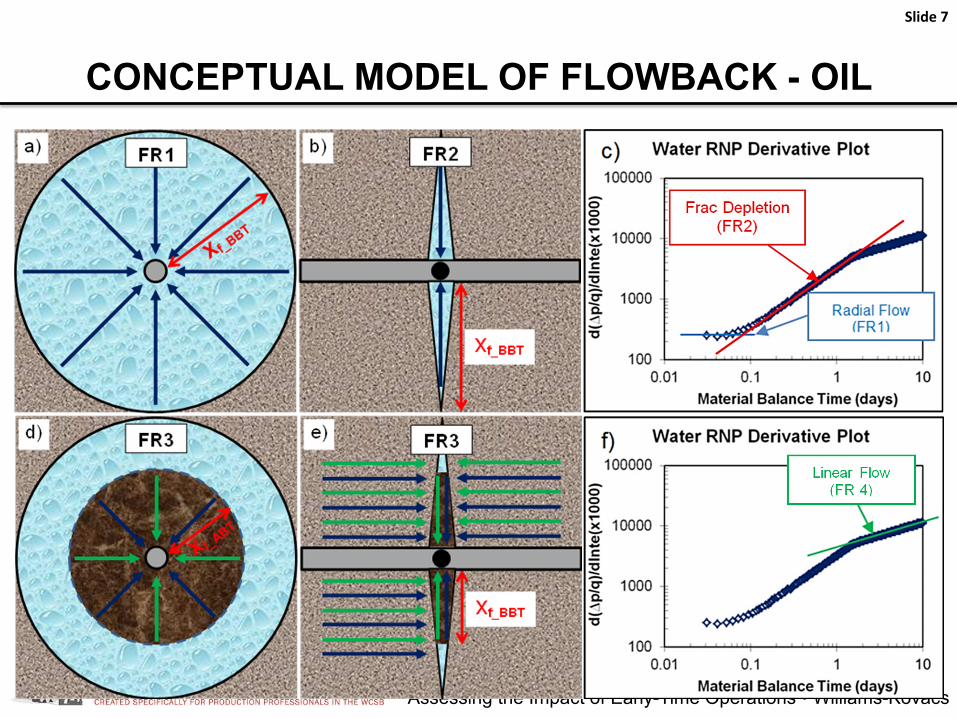
CONCEPTUAL MODEL OF FLOWBACK - OIL
Assessing the Impact of Early-Time Operations • Williams-Kovacs
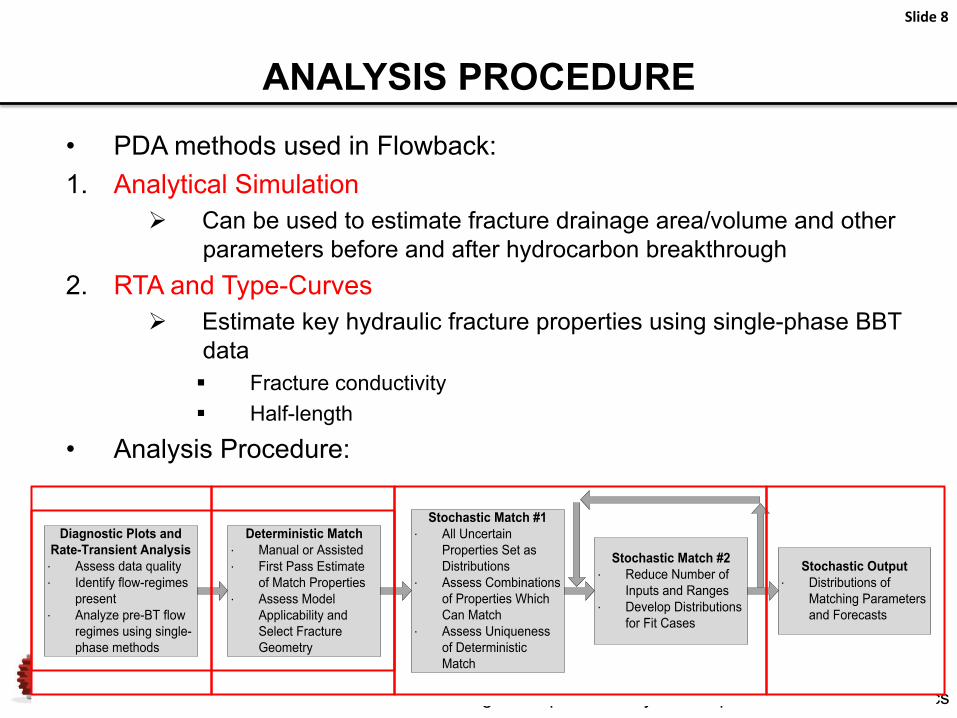
Deterministic Match·∙ Manual or Assisted·∙ First Pass Estimate
of Match Properties·∙ Assess Model
Applicability and Select Fracture Geometry
Stochastic Match #1·∙ All Uncertain
Properties Set as Distributions
·∙ Assess Combinations of Properties Which Can Match
·∙ Assess Uniqueness of Deterministic Match
Stochastic Match #2·∙ Reduce Number of
Inputs and Ranges·∙ Develop Distributions
for Fit Cases
Stochastic Output·∙ Distributions of
Matching Parameters and Forecasts
Diagnostic Plots and Rate-Transient Analysis·∙ Assess data quality·∙ Identify flow-regimes
present·∙ Analyze pre-BT flow
regimes using single-phase methods
Slide 8
ANALYSIS PROCEDURE
• PDA methods used in Flowback: 1. Analytical Simulation
Ø Can be used to estimate fracture drainage area/volume and other parameters before and after hydrocarbon breakthrough
2. RTA and Type-Curves Ø Estimate key hydraulic fracture properties using single-phase BBT
data § Fracture conductivity § Half-length
• Analysis Procedure:
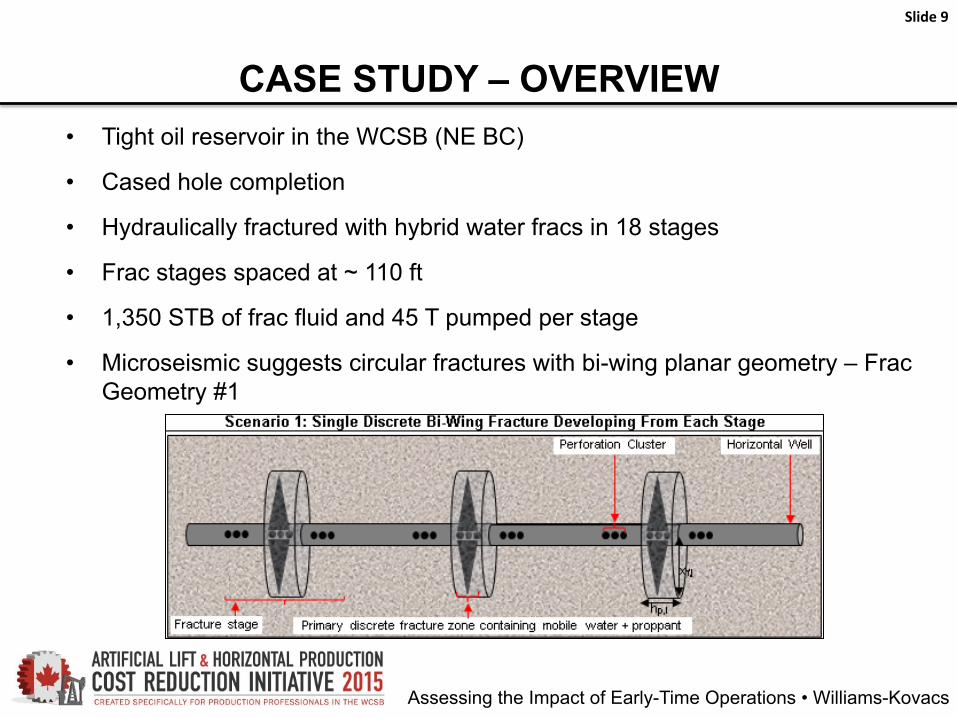
• Tight oil reservoir in the WCSB (NE BC)
• Cased hole completion
• Hydraulically fractured with hybrid water fracs in 18 stages
• Frac stages spaced at ~ 110 ft
• 1,350 STB of frac fluid and 45 T pumped per stage
• Microseismic suggests circular fractures with bi-wing planar geometry – Frac Geometry #1
CASE STUDY – OVERVIEW
Slide 9
Assessing the Impact of Early-Time Operations • Williams-Kovacs
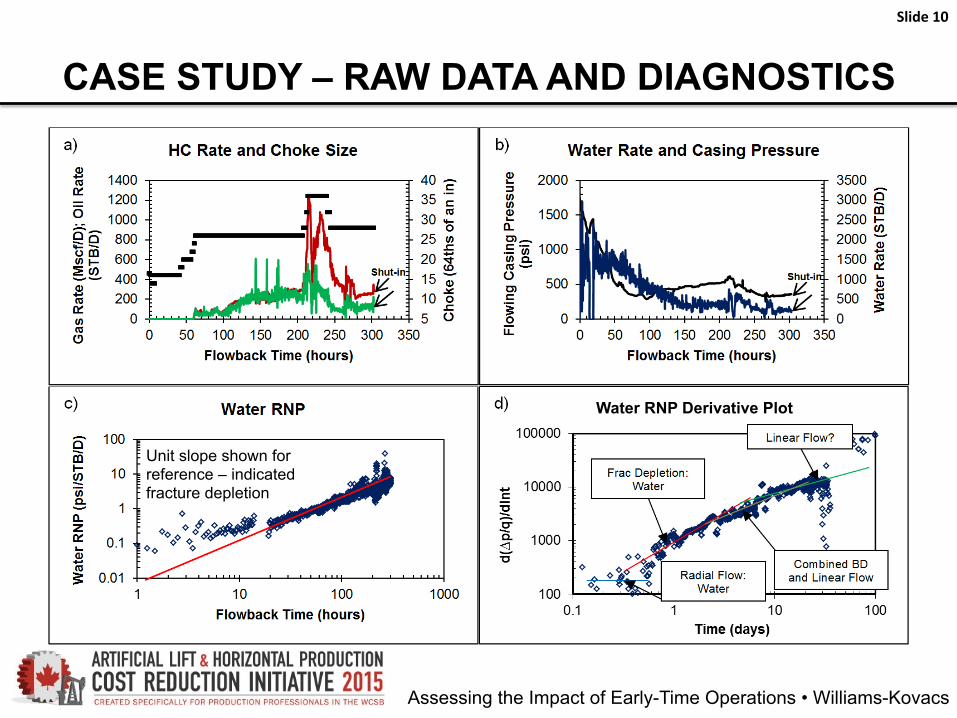
Water RNP Derivative Plot Water RNP Derivative Plot
CASE STUDY – RAW DATA AND DIAGNOSTICS
Slide 10
Unit slope shown for reference – indicated fracture depletion
Assessing the Impact of Early-Time Operations • Williams-Kovacs
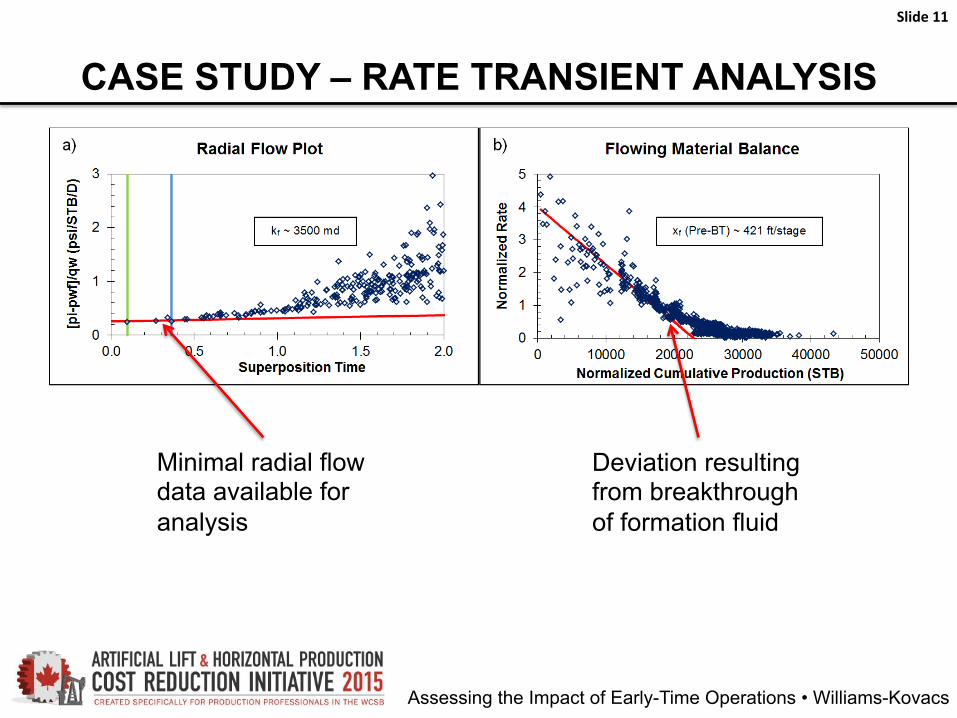
CASE STUDY – RATE TRANSIENT ANALYSIS
Slide 11
Minimal radial flow data available for analysis
Deviation resulting from breakthrough of formation fluid
Assessing the Impact of Early-Time Operations • Williams-Kovacs
Assessing the Impact of Early-Time Operations • Williams-Kovacs
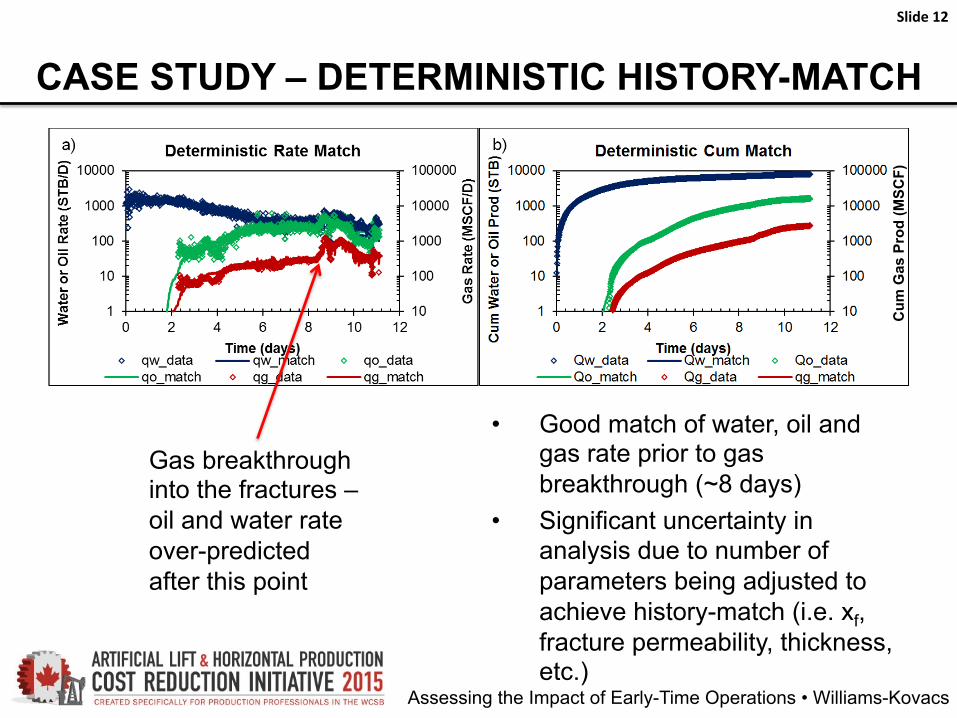
CASE STUDY – DETERMINISTIC HISTORY-MATCH
Slide 12
• Good match of water, oil and gas rate prior to gas breakthrough (~8 days)
• Significant uncertainty in analysis due to number of parameters being adjusted to achieve history-match (i.e. xf, fracture permeability, thickness, etc.)
Gas breakthrough into the fractures – oil and water rate over-predicted after this point
Cum
Gas
Pro
d (M
SCF)
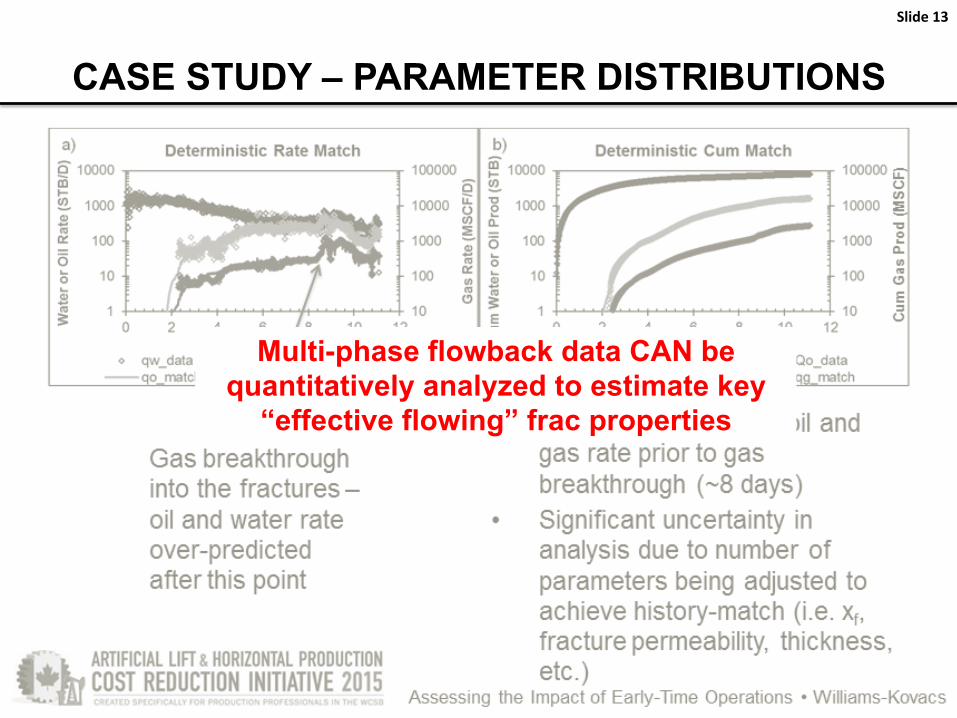
CASE STUDY – PARAMETER DISTRIBUTIONS
Slide 13
Multi-phase flowback data CAN be quantitatively analyzed to estimate key
“effective flowing” frac properties
Assessing the Impact of Early-Time Operations • Williams-Kovacs
Pre-‐Drill Reservoir Sample and Log Analysis
Pre-‐Frac Welltest and DFIT Analysis
Fracture Monitoring (microseismic, etc.)
Pre-‐Frac
Frac Treatment
Post-‐Frac Frac ModellingFlowback Analysis, Post-‐Frac Well Test
Online Production Data Analysis Reservoir Simulation (analytical and numerical)Rate-‐Transient Analysis
Well Optimization
Economic AssessmentEconomic Analysis
Future Development Planning
Absolute permeability, porosity, pore size distribution, capillary pressure and relative permeability, electrical properties, fluid saturation, TOC, gas content, adsorption isotherm, rock mechanical properties
kh, initial reservoir pressure
Frac performance, maximum half-‐length, maximum SRV
xf, kf, FCD, Acm
kh, xf, FCD, Acm, History-‐match and forecast future production
NGL yields, economic indicators
Optimize future well performance
Additional Data: fluid properties, flowing pressures, seismic, spinner & tracer logs, completion data, wellbore diagram, deviation survey
Slide 14
CASE STUDY – COMPARISON WITH OTHER DATA
Slide 15
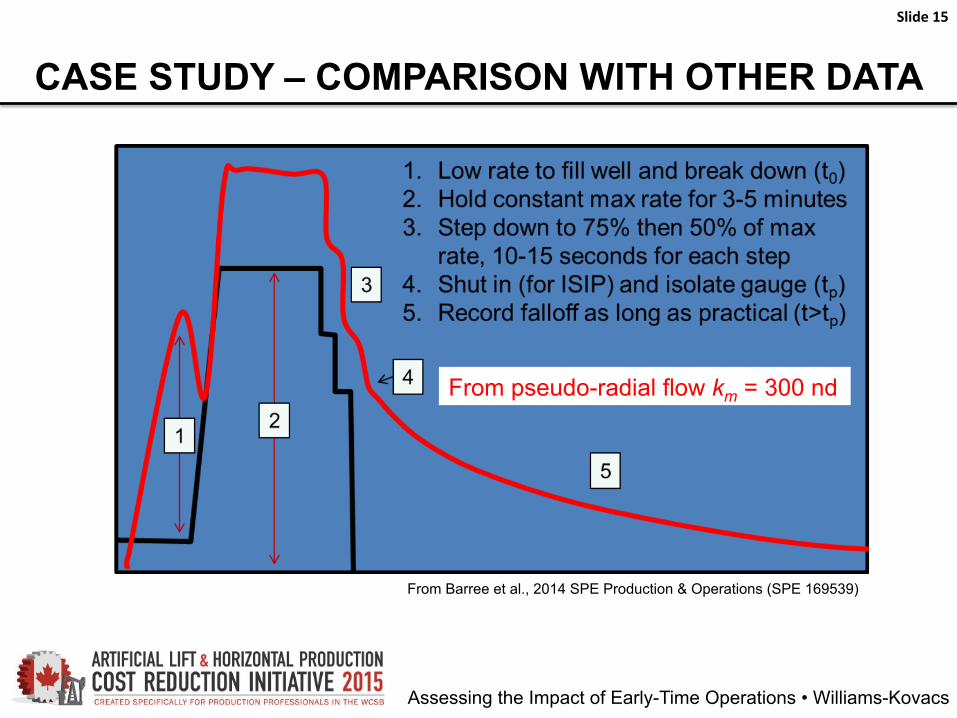
CASE STUDY – COMPARISON WITH OTHER DATA
From Barree et al., 2014 SPE Production & Operations (SPE 169539)
From pseudo-radial flow km = 300 nd
Assessing the Impact of Early-Time Operations • Williams-Kovacs
Assessing the Impact of Early-Time Operations • Williams-Kovacs
Pre-‐Drill Reservoir Sample and Log Analysis
Pre-‐Frac Welltest and DFIT Analysis
Fracture Monitoring (microseismic, etc.)
Pre-‐Frac
Frac Treatment
Post-‐Frac Frac ModellingFlowback Analysis, Post-‐Frac Well Test
Online Production Data Analysis Reservoir Simulation (analytical and numerical)Rate-‐Transient Analysis
Well Optimization
Economic AssessmentEconomic Analysis
Future Development Planning
Absolute permeability, porosity, pore size distribution, capillary pressure and relative permeability, electrical properties, fluid saturation, TOC, gas content, adsorption isotherm, rock mechanical properties
kh, initial reservoir pressure
Frac performance, maximum half-‐length, maximum SRV
xf, kf, FCD, Acm
kh, xf, FCD, Acm, History-‐match and forecast future production
NGL yields, economic indicators
Optimize future well performance
Additional Data: fluid properties, flowing pressures, seismic, spinner & tracer logs, completion data, wellbore diagram, deviation survey
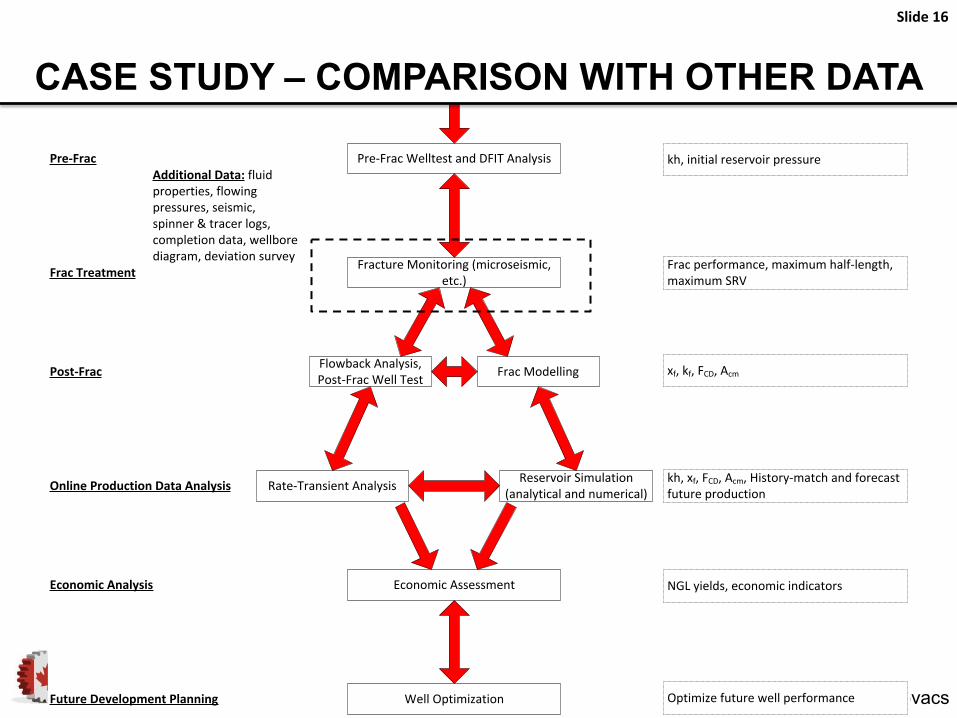
Slide 16
CASE STUDY – COMPARISON WITH OTHER DATA
Assessing the Impact of Early-Time Operations • Williams-Kovacs
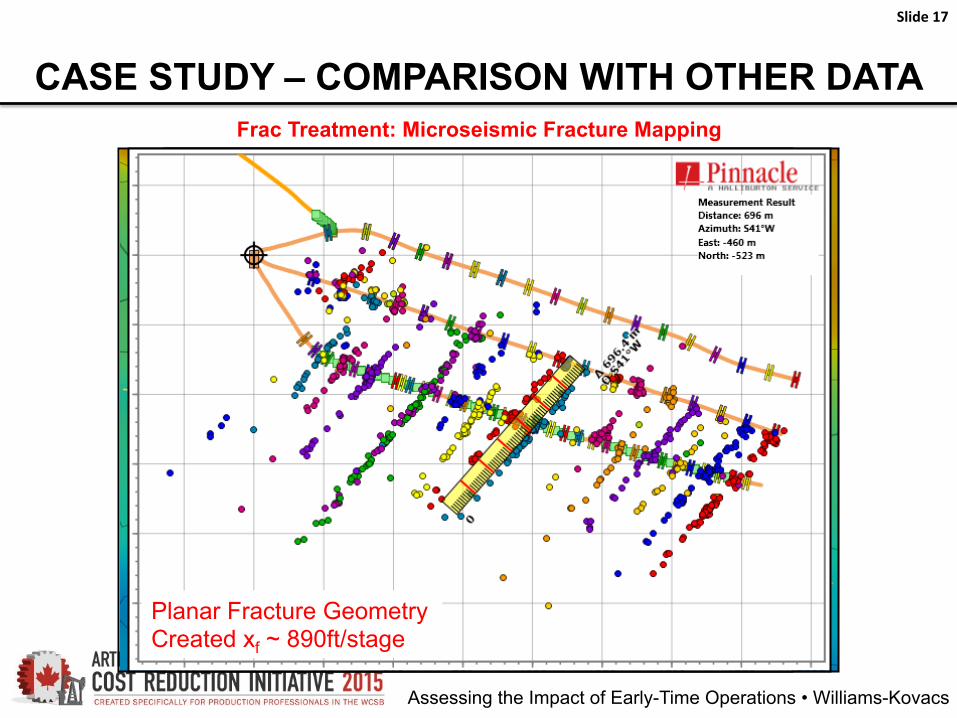
CASE STUDY – COMPARISON WITH OTHER DATA
Slide 17
Frac Treatment: Microseismic Fracture Mapping
Vertical Observation Array
Horizontal Observation Array
Significant Frac Height Growth
Planar Fracture Geometry Created xf ~ 890ft/stage
Assessing the Impact of Early-Time Operations • Williams-Kovacs
Pre-‐Drill Reservoir Sample and Log Analysis
Pre-‐Frac Welltest and DFIT Analysis
Fracture Monitoring (microseismic, etc.)
Pre-‐Frac
Frac Treatment
Post-‐Frac Frac ModellingFlowback Analysis, Post-‐Frac Well Test
Online Production Data Analysis Reservoir Simulation (analytical and numerical)Rate-‐Transient Analysis
Well Optimization
Economic AssessmentEconomic Analysis
Future Development Planning
Absolute permeability, porosity, pore size distribution, capillary pressure and relative permeability, electrical properties, fluid saturation, TOC, gas content, adsorption isotherm, rock mechanical properties
kh, initial reservoir pressure
Frac performance, maximum half-‐length, maximum SRV
xf, kf, FCD, Acm
kh, xf, FCD, Acm, History-‐match and forecast future production
NGL yields, economic indicators
Optimize future well performance
Additional Data: fluid properties, flowing pressures, seismic, spinner & tracer logs, completion data, wellbore diagram, deviation survey
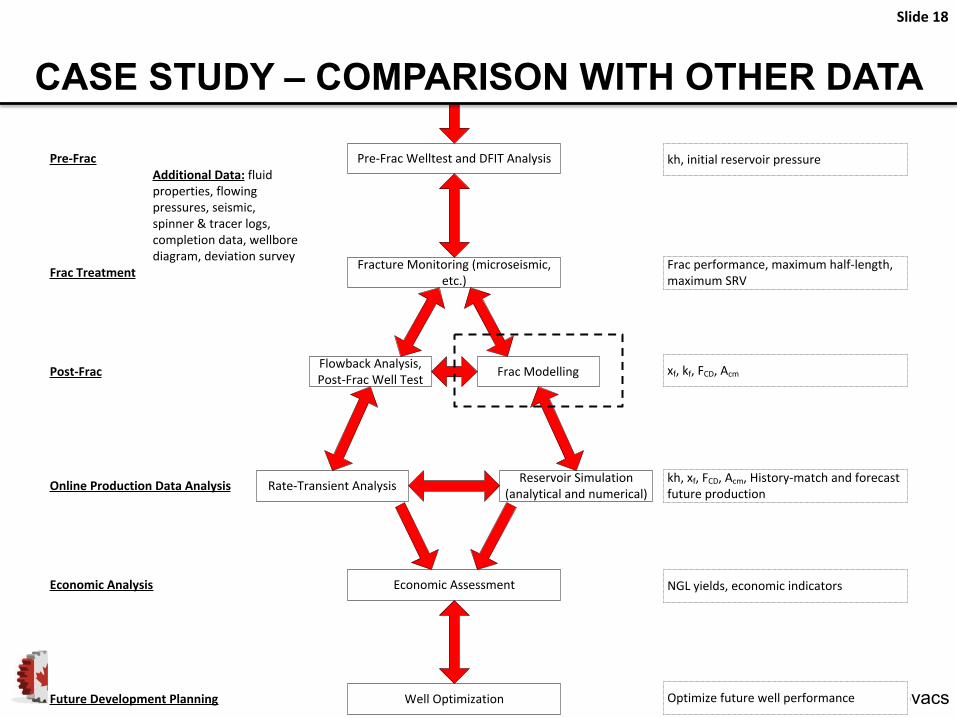
Slide 18
CASE STUDY – COMPARISON WITH OTHER DATA
Assessing the Impact of Early-Time Operations • Williams-Kovacs
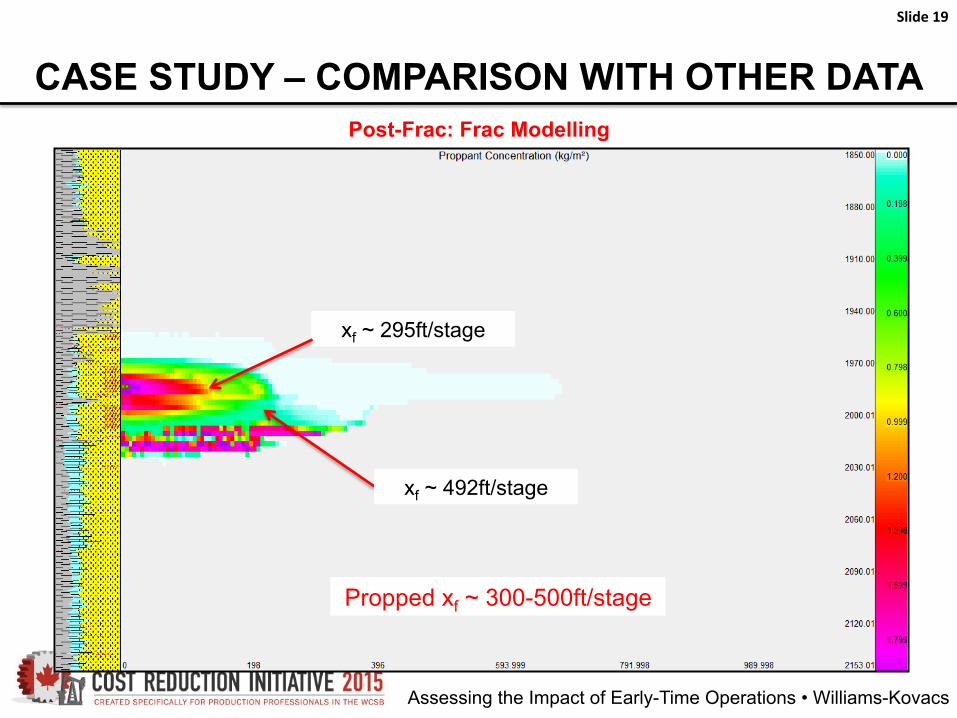
CASE STUDY – COMPARISON WITH OTHER DATA
Slide 19
Post-Frac: Frac Modelling
xf ~ 295ft/stage
xf ~ 492ft/stage
Propped xf ~ 300-500ft/stage
Assessing the Impact of Early-Time Operations • Williams-Kovacs
Pre-‐Drill Reservoir Sample and Log Analysis
Pre-‐Frac Welltest and DFIT Analysis
Fracture Monitoring (microseismic, etc.)
Pre-‐Frac
Frac Treatment
Post-‐Frac Frac ModellingFlowback Analysis, Post-‐Frac Well Test
Online Production Data Analysis Reservoir Simulation (analytical and numerical)Rate-‐Transient Analysis
Well Optimization
Economic AssessmentEconomic Analysis
Future Development Planning
Absolute permeability, porosity, pore size distribution, capillary pressure and relative permeability, electrical properties, fluid saturation, TOC, gas content, adsorption isotherm, rock mechanical properties
kh, initial reservoir pressure
Frac performance, maximum half-‐length, maximum SRV
xf, kf, FCD, Acm
kh, xf, FCD, Acm, History-‐match and forecast future production
NGL yields, economic indicators
Optimize future well performance
Additional Data: fluid properties, flowing pressures, seismic, spinner & tracer logs, completion data, wellbore diagram, deviation survey
Slide 20
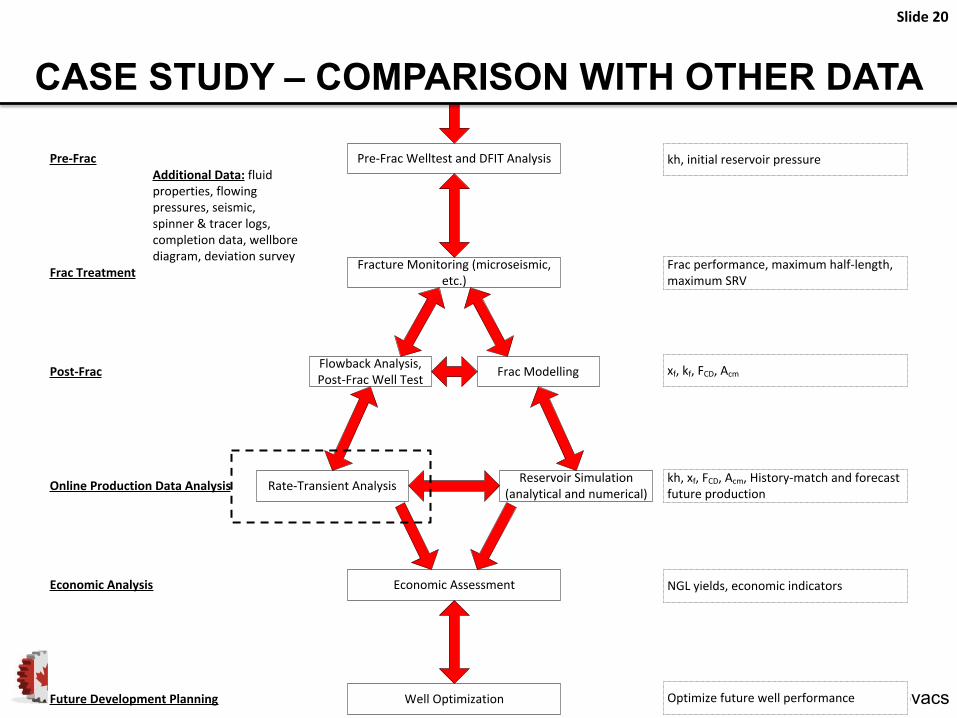
CASE STUDY – COMPARISON WITH OTHER DATA
Assessing the Impact of Early-Time Operations • Williams-Kovacs
0.0E+00
2.0E+01
4.0E+01
6.0E+01
8.0E+01
1.0E+02
1.2E+02
1.4E+02
1.6E+02
1.8E+02
2.0E+02
0 5 10 15
[pi-p
wf)/
qo
Sqrt Time (Days)^0.5
Square-Root Time Plot Linear Flow Analysis
Raw Data Raw Data Corrected For Multi-Phase Flow Fit
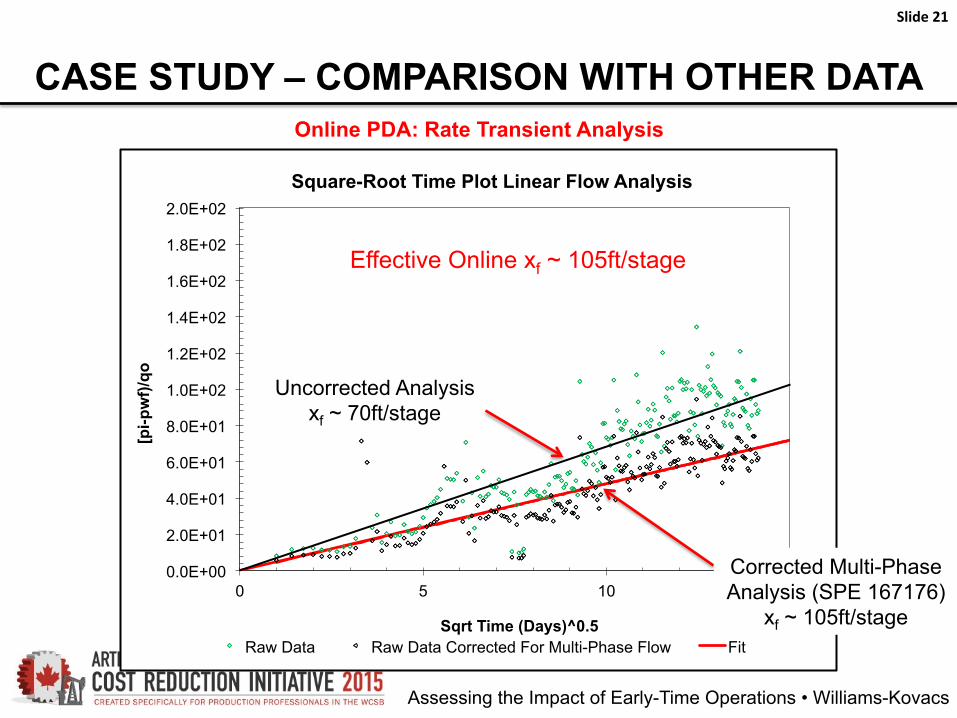
CASE STUDY – COMPARISON WITH OTHER DATA
Slide 21
Online PDA: Rate Transient Analysis
Uncorrected Analysis xf ~ 70ft/stage
Effective Online xf ~ 105ft/stage
Corrected Multi-Phase Analysis (SPE 167176)
xf ~ 105ft/stage
Assessing the Impact of Early-Time Operations • Williams-Kovacs
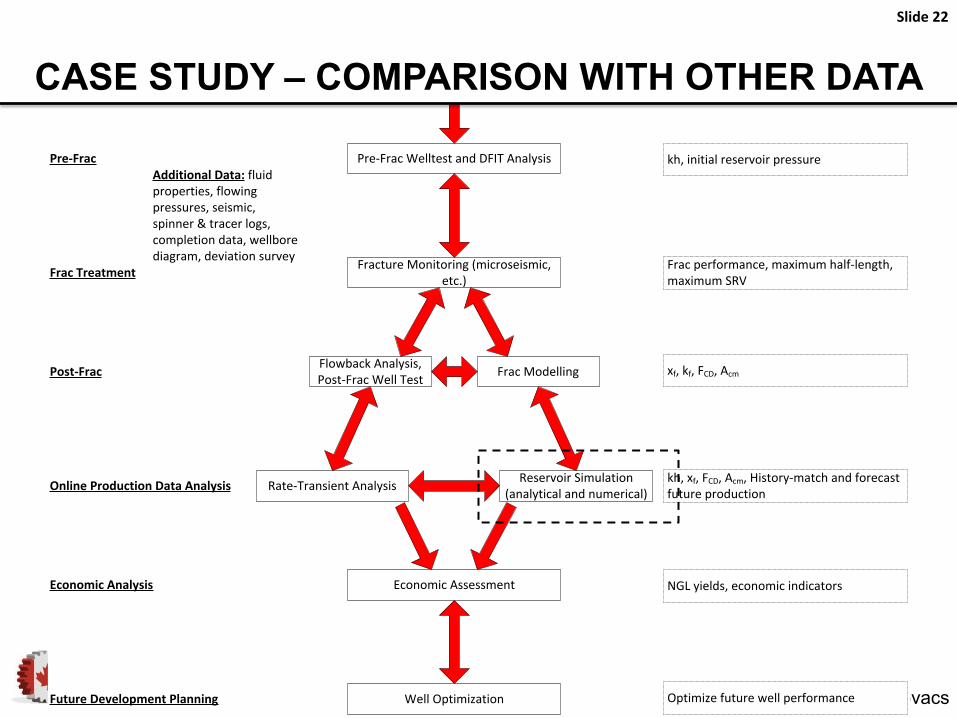
Pre-‐Drill Reservoir Sample and Log Analysis
Pre-‐Frac Welltest and DFIT Analysis
Fracture Monitoring (microseismic, etc.)
Pre-‐Frac
Frac Treatment
Post-‐Frac Frac ModellingFlowback Analysis, Post-‐Frac Well Test
Online Production Data Analysis Reservoir Simulation (analytical and numerical)Rate-‐Transient Analysis
Well Optimization
Economic AssessmentEconomic Analysis
Future Development Planning
Absolute permeability, porosity, pore size distribution, capillary pressure and relative permeability, electrical properties, fluid saturation, TOC, gas content, adsorption isotherm, rock mechanical properties
kh, initial reservoir pressure
Frac performance, maximum half-‐length, maximum SRV
xf, kf, FCD, Acm
kh, xf, FCD, Acm, History-‐match and forecast future production
NGL yields, economic indicators
Optimize future well performance
Additional Data: fluid properties, flowing pressures, seismic, spinner & tracer logs, completion data, wellbore diagram, deviation survey
Slide 22
CASE STUDY – COMPARISON WITH OTHER DATA
Assessing the Impact of Early-Time Operations • Williams-Kovacs
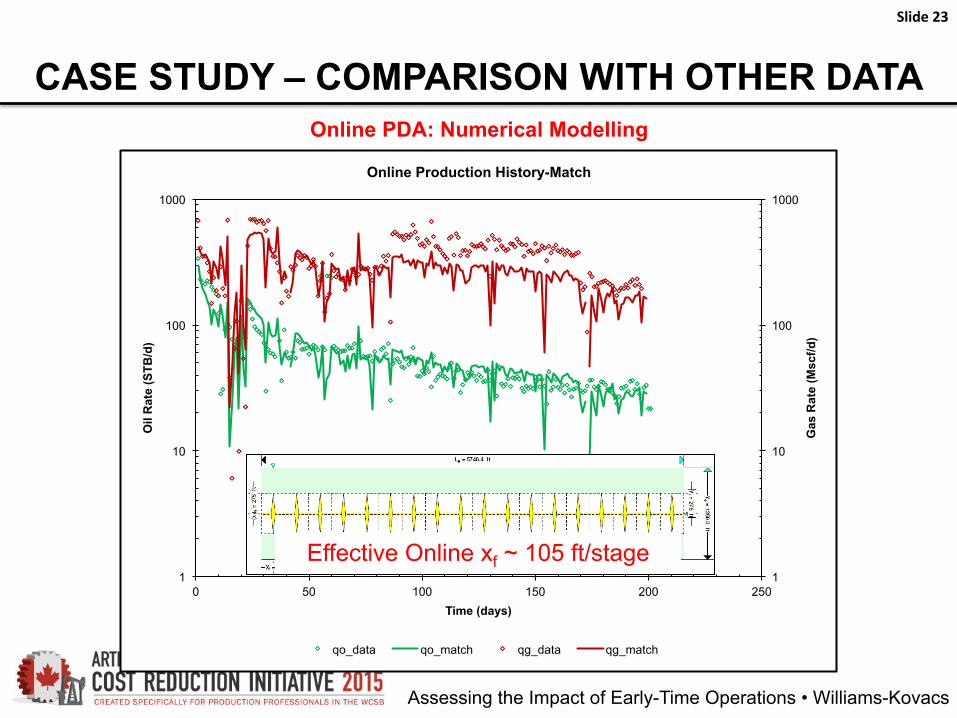
CASE STUDY – COMPARISON WITH OTHER DATA
Slide 23
Online PDA: Numerical Modelling
1
10
100
1000
1
10
100
1000
0 50 100 150 200 250 Time (days)
Gas
Rat
e (M
scf/d
)
Oil
Rat
e (S
TB/d
)
Online Production History-Match
qo_data qo_match qg_data qg_match
Effective Online xf ~ 105 ft/stage
Assessing the Impact of Early-Time Operations • Williams-Kovacs
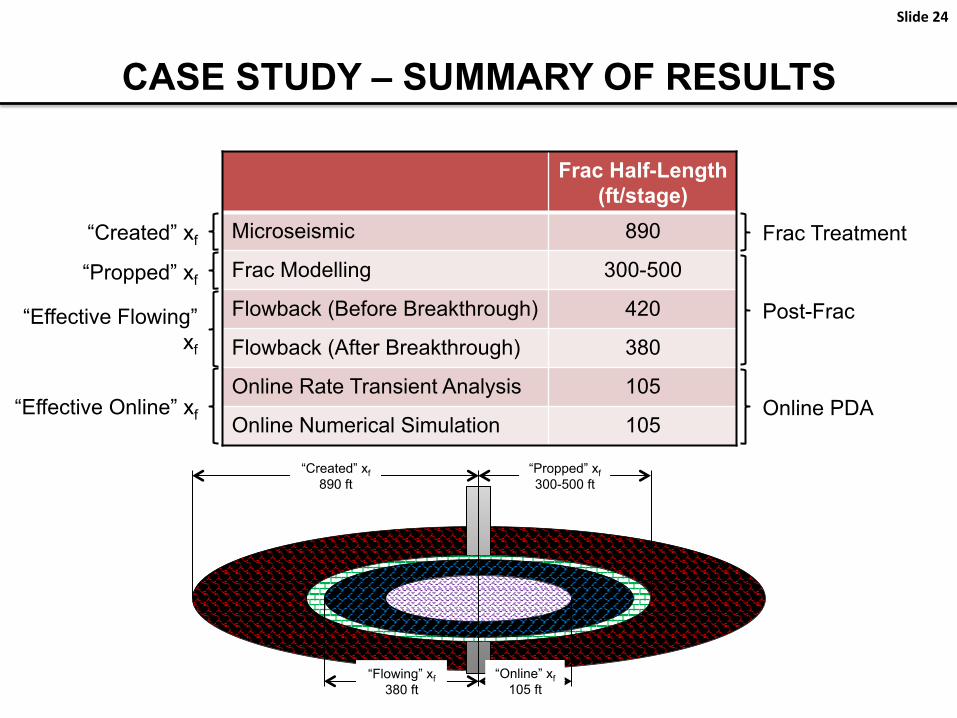
CASE STUDY – SUMMARY OF RESULTS
Slide 24
Frac Half-Length (ft/stage)
Microseismic 890
Frac Modelling 300-500
Flowback (Before Breakthrough) 420
Flowback (After Breakthrough) 380
Online Rate Transient Analysis 105
Online Numerical Simulation 105
Frac Treatment
Post-Frac
Online PDA
“Created” xf
“Propped” xf
“Effective Flowing” xf
“Effective Online” xf
“Created” xf 890 ft
“Propped” xf 300-500 ft
“Flowing” xf 380 ft
“Online” xf 105 ft
Assessing the Impact of Early-Time Operations • Williams-Kovacs
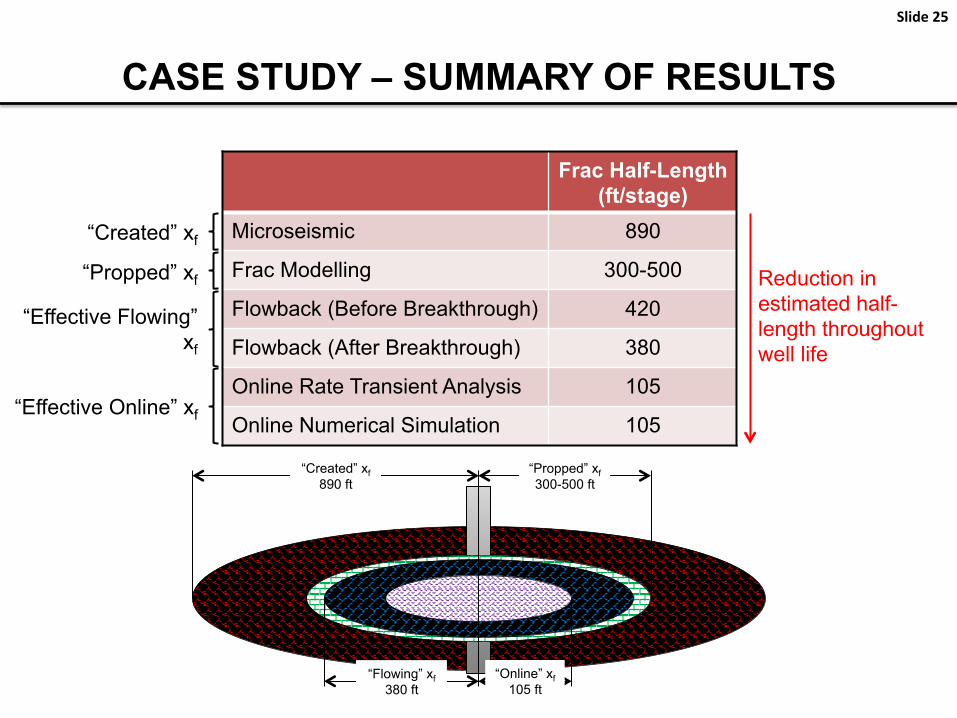
CASE STUDY – SUMMARY OF RESULTS
Slide 25
Frac Half-Length (ft/stage)
Microseismic 890
Frac Modelling 300-500
Flowback (Before Breakthrough) 420
Flowback (After Breakthrough) 380
Online Rate Transient Analysis 105
Online Numerical Simulation 105
“Created” xf
“Propped” xf
“Effective Flowing” xf
“Effective Online” xf
Reduction in estimated half-length throughout well life
“Created” xf 890 ft
“Propped” xf 300-500 ft
“Flowing” xf 380 ft
“Online” xf 105 ft
Assessing the Impact of Early-Time Operations • Williams-Kovacs
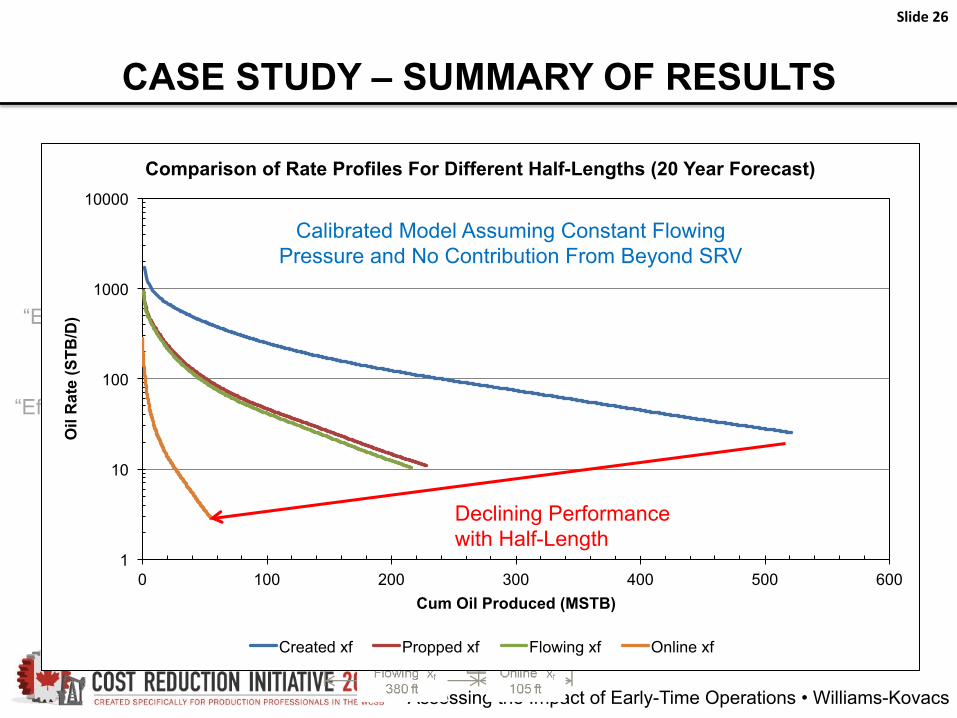
CASE STUDY – SUMMARY OF RESULTS
Slide 26
Frac Treatment
Post-Frac
Online PDA
“Created” xf
“Propped” xf
“Effective Flowing” xf
“Effective Online” xf
1
10
100
1000
10000
0 100 200 300 400 500 600
Oil
Rat
e (S
TB/D
)
Cum Oil Produced (MSTB)
Comparison of Rate Profiles For Different Half-Lengths (20 Year Forecast)
Created xf Propped xf Flowing xf Online xf
Declining Performance with Half-Length
Calibrated Model Assuming Constant Flowing Pressure and No Contribution From Beyond SRV
Assessing the Impact of Early-Time Operations • Williams-Kovacs
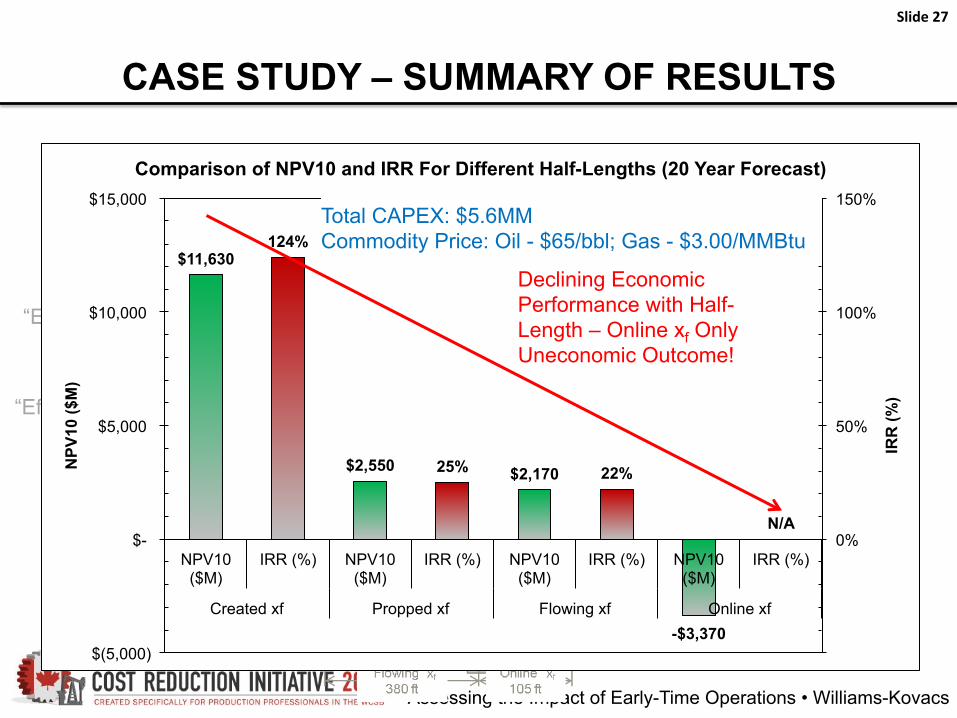
CASE STUDY – SUMMARY OF RESULTS
Slide 27
Frac Treatment
Post-Frac
Online PDA
“Created” xf
“Propped” xf
“Effective Flowing” xf
“Effective Online” xf
$11,630
$2,550 $2,170
-$3,370
124%
25% 22%
N/A
-50%
0%
50%
100%
150%
$(5,000)
$-
$5,000
$10,000
$15,000
NPV10 ($M)
IRR (%) NPV10 ($M)
IRR (%) NPV10 ($M)
IRR (%) NPV10 ($M)
IRR (%)
Created xf Propped xf Flowing xf Online xf
IRR
(%)
NPV
10 ($
M)
Comparison of NPV10 and IRR For Different Half-Lengths (20 Year Forecast)
Declining Economic Performance with Half-Length – Online xf Only Uneconomic Outcome!
Total CAPEX: $5.6MM Commodity Price: Oil - $65/bbl; Gas - $3.00/MMBtu
Assessing the Impact of Early-Time Operations • Williams-Kovacs
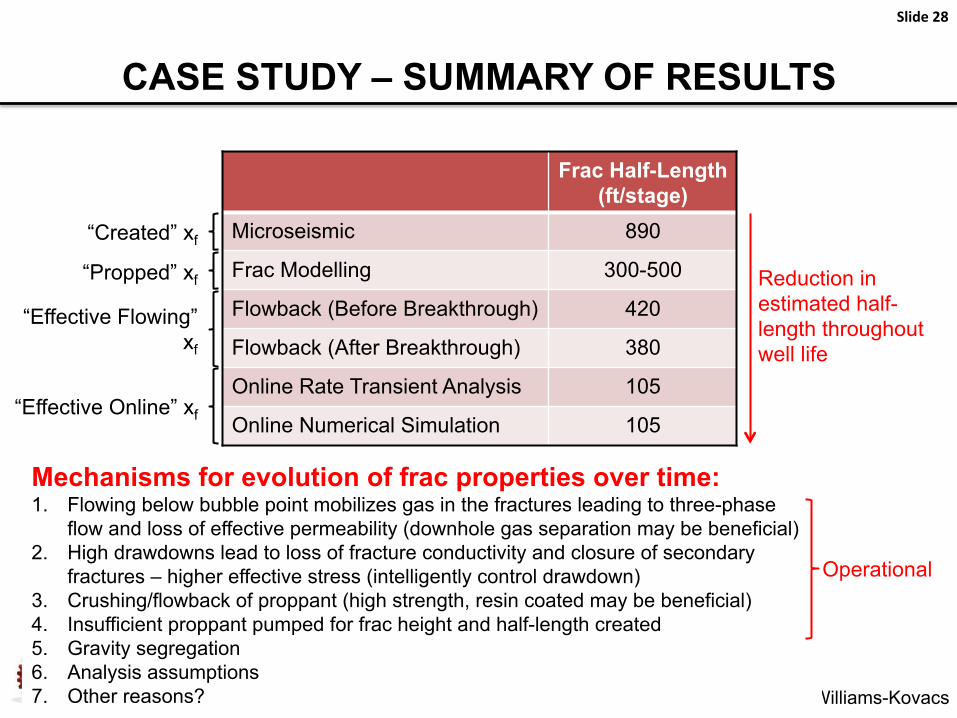
Mechanisms for evolution of frac properties over time: 1. Flowing below bubble point mobilizes gas in the fractures leading to three-phase
flow and loss of effective permeability (downhole gas separation may be beneficial) 2. High drawdowns lead to loss of fracture conductivity and closure of secondary
fractures – higher effective stress (intelligently control drawdown) 3. Crushing/flowback of proppant (high strength, resin coated may be beneficial) 4. Insufficient proppant pumped for frac height and half-length created 5. Gravity segregation 6. Analysis assumptions 7. Other reasons?
Operational
CASE STUDY – SUMMARY OF RESULTS
Slide 28
Frac Half-Length (ft/stage)
Microseismic 890
Frac Modelling 300-500
Flowback (Before Breakthrough) 420
Flowback (After Breakthrough) 380
Online Rate Transient Analysis 105
Online Numerical Simulation 105
“Created” xf
“Propped” xf
“Effective Flowing” xf
“Effective Online” xf
Reduction in estimated half-length throughout well life
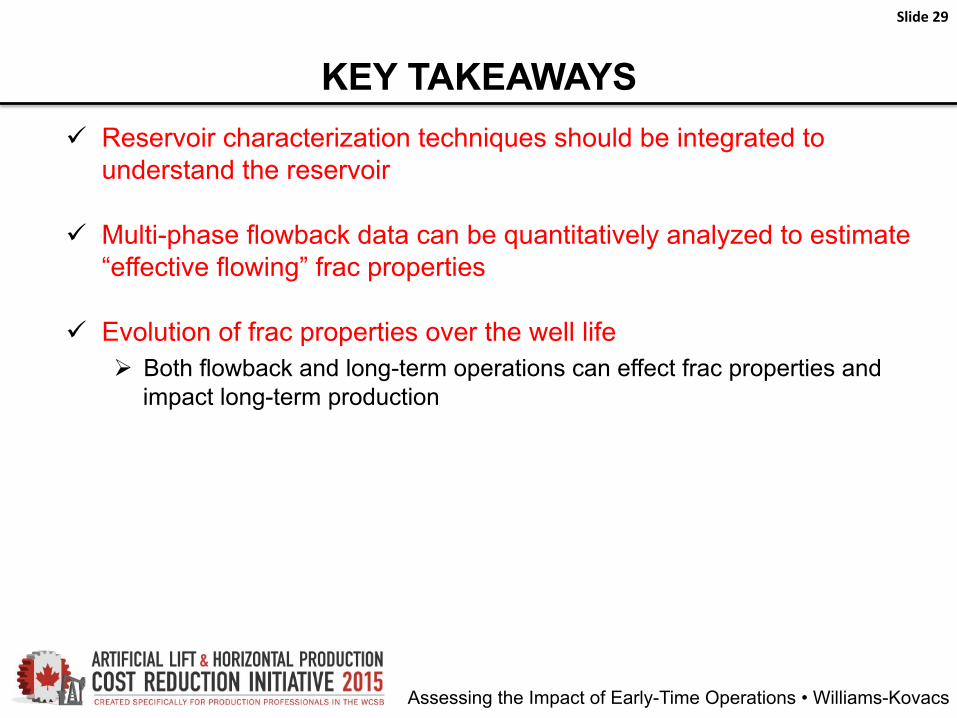
ü Reservoir characterization techniques should be integrated to understand the reservoir
ü Multi-phase flowback data can be quantitatively analyzed to estimate “effective flowing” frac properties
ü Evolution of frac properties over the well life Ø Both flowback and long-term operations can effect frac properties and
impact long-term production
Slide 29
KEY TAKEAWAYS
Assessing the Impact of Early-Time Operations • Williams-Kovacs
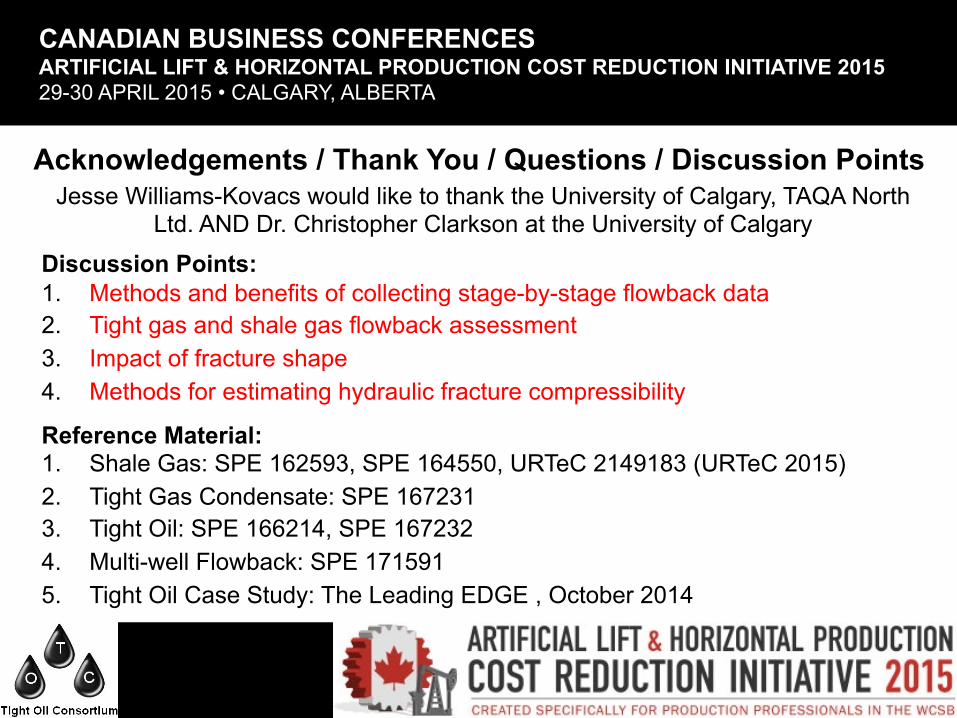
Acknowledgements / Thank You / Questions / Discussion Points Jesse Williams-Kovacs would like to thank the University of Calgary, TAQA North
Ltd. AND Dr. Christopher Clarkson at the University of Calgary
Discussion Points: 1. Methods and benefits of collecting stage-by-stage flowback data 2. Tight gas and shale gas flowback assessment 3. Impact of fracture shape 4. Methods for estimating hydraulic fracture compressibility
Reference Material: 1. Shale Gas: SPE 162593, SPE 164550, URTeC 2149183 (URTeC 2015) 2. Tight Gas Condensate: SPE 167231 3. Tight Oil: SPE 166214, SPE 167232 4. Multi-well Flowback: SPE 171591 5. Tight Oil Case Study: The Leading EDGE , October 2014
CANADIAN BUSINESS CONFERENCES ARTIFICIAL LIFT & HORIZONTAL PRODUCTION COST REDUCTION INITIATIVE 2015 29-30 APRIL 2015 • CALGARY, ALBERTA
Assessing the Impact of Early-Time Operations • Williams-Kovacs
Slide 31
FLOWBACK DATA GATHERING AND ASSESSMENT
Assessing the Impact of Early-Time Operations • Williams-Kovacs
Slide 32
FLOWBACK DATA GATHERING AND ASSESSMENT
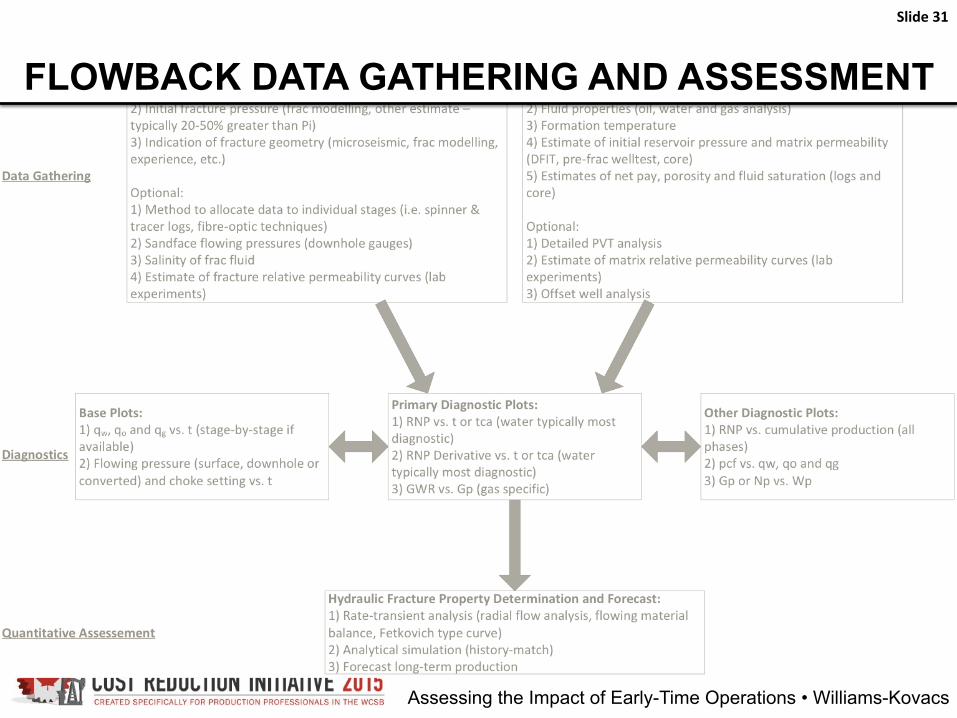
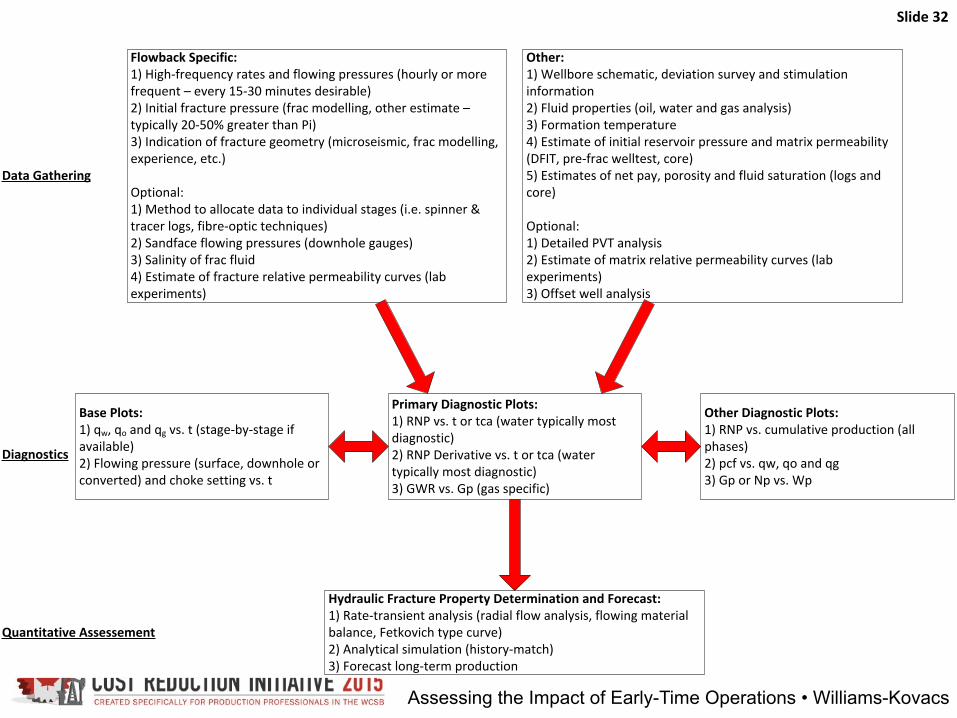
Data Gathering
Flowback Specific:1) High-‐frequency rates and flowing pressures (hourly or more frequent – every 15-‐30 minutes desirable)2) Initial fracture pressure (frac modelling, other estimate – typically 20-‐50% greater than Pi)3) Indication of fracture geometry (microseismic, frac modelling, experience, etc.)
Optional:1) Method to allocate data to individual stages (i.e. spinner & tracer logs, fibre-‐optic techniques) 2) Sandface flowing pressures (downhole gauges)3) Salinity of frac fluid4) Estimate of fracture relative permeability curves (lab experiments)
Diagnostics
Quantitative Assessement
Other:1) Wellbore schematic, deviation survey and stimulation information 2) Fluid properties (oil, water and gas analysis)3) Formation temperature4) Estimate of initial reservoir pressure and matrix permeability (DFIT, pre-‐frac welltest, core)5) Estimates of net pay, porosity and fluid saturation (logs and core)
Optional:1) Detailed PVT analysis2) Estimate of matrix relative permeability curves (lab experiments)3) Offset well analysis
Base Plots:1) qw, qo and qg vs. t (stage-‐by-‐stage if available)2) Flowing pressure (surface, downhole or converted) and choke setting vs. t
Primary Diagnostic Plots:1) RNP vs. t or tca (water typically most diagnostic)2) RNP Derivative vs. t or tca (water typically most diagnostic)3) GWR vs. Gp (gas specific)
Other Diagnostic Plots:1) RNP vs. cumulative production (all phases)2) pcf vs. qw, qo and qg3) Gp or Np vs. Wp
Hydraulic Fracture Property Determination and Forecast:1) Rate-‐transient analysis (radial flow analysis, flowing material balance, Fetkovich type curve)2) Analytical simulation (history-‐match)3) Forecast long-‐term production
Assessing the Impact of Early-Time Operations • Williams-Kovacs
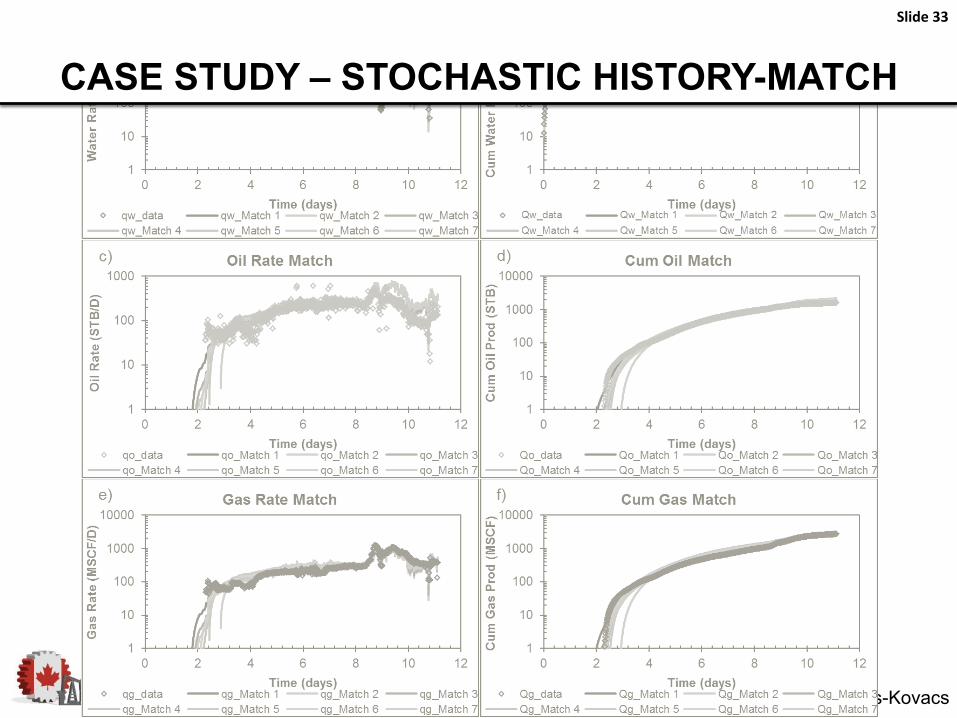
CASE STUDY – STOCHASTIC HISTORY-MATCH
Slide 33
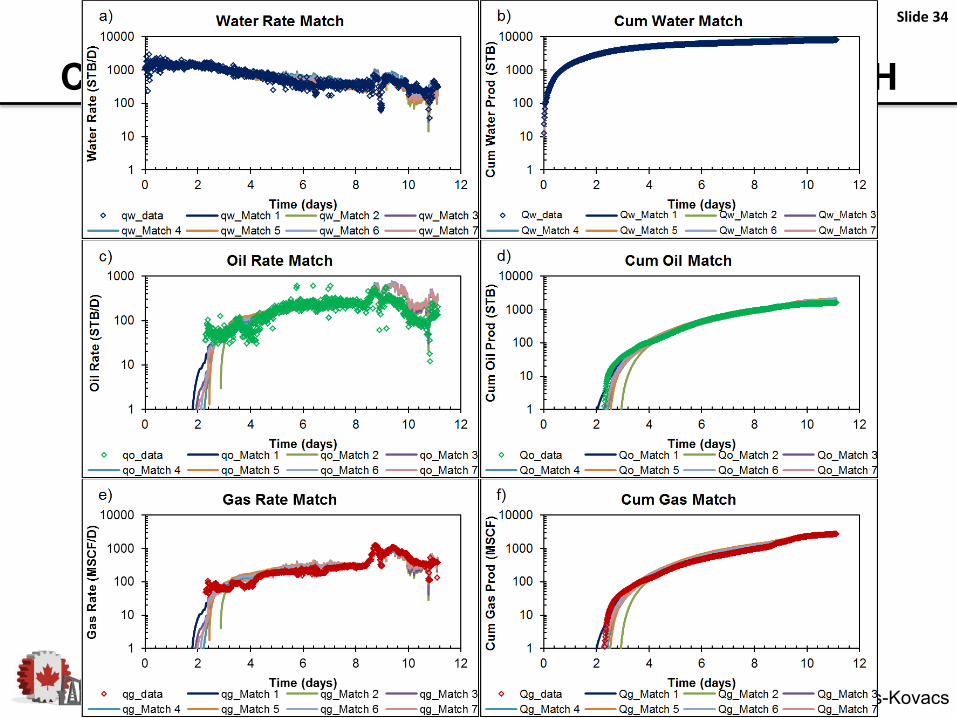
CASE STUDY – STOCHASTIC HISTORY-MATCH
Assessing the Impact of Early-Time Operations • Williams-Kovacs
Slide 34
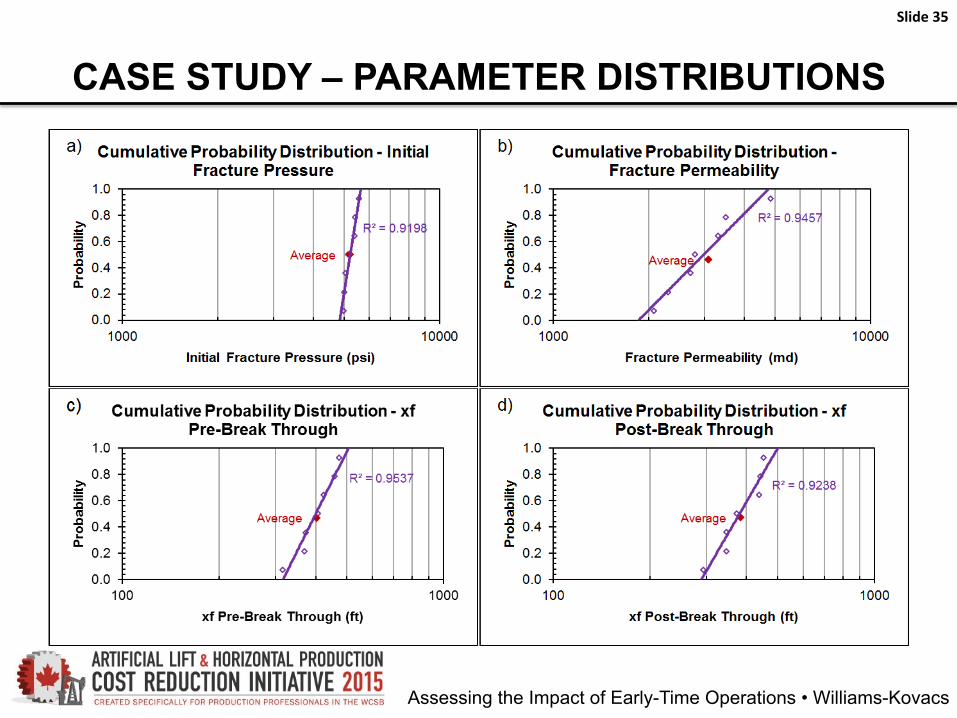
CASE STUDY – PARAMETER DISTRIBUTIONS
Slide 35
Assessing the Impact of Early-Time Operations • Williams-Kovacs
Assessing the Impact of Early-Time Operations • Williams-Kovacs
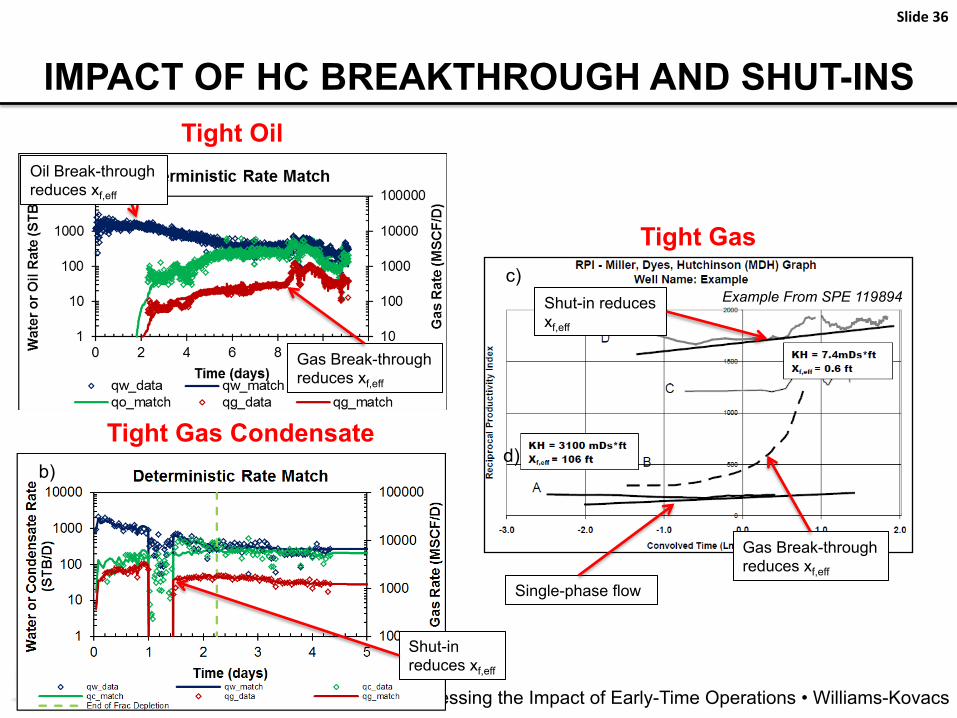
IMPACT OF HC BREAKTHROUGH AND SHUT-INS
Slide 36
Single-phase flow
Gas Break-through reduces xf,eff
Shut-in reduces xf,eff
Example From SPE 119894
Tight Gas
Shut-in reduces xf,eff
Tight Gas Condensate
a)
Gas Break-through reduces xf,eff
Oil Break-through reduces xf,eff
Tight Oil
b)
c)
d)
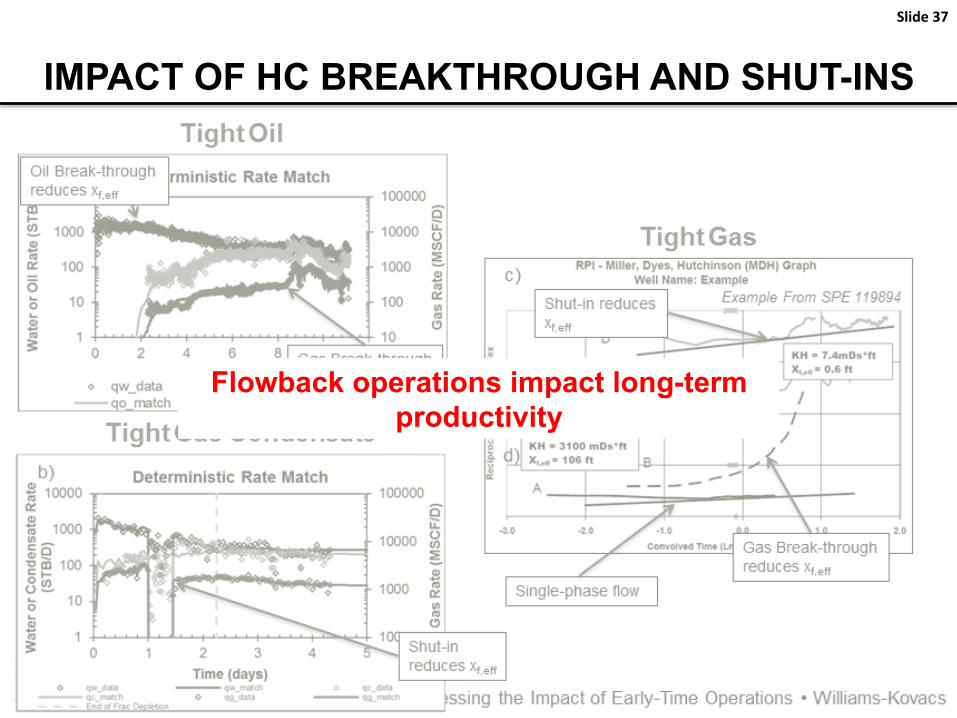
IMPACT OF HC BREAKTHROUGH AND SHUT-INS
Slide 37
Flowback operations impact long-term productivity