Embed Size (px)
Citation preview

Assessing Intended Nationally Determined Contributions to the Paris Climate Agreement – what are the projected global and national emission levels for 2025–2030?


Assessing Intended Nationally Determined Contributions to the Paris Climate Agreement


Assessing Intended Nationally Determined Contributions to the Paris Climate Agreement – what are the projected global and national emission levels for 2025–2030?
Assessing Intended Nationally Determined Contributions to the Paris Climate Agreement – what are the projected global and national emission levels for 2025–2030?© PBL Netherlands Environmental Assessment AgencyThe Hague, 2015PBL publication number: 1879
Authors:Annemiek Admiraal (PBL), Michel den Elzen (PBL), Nicklas Forsell (IIASA), Olga Turkovska (IIASA), Mark Roelfsema (PBL), Heleen van Soest (PBL)
Corresponding [email protected]
GraphicsBeeldredactie PBL
Production coordination and English-language editingPBL Publishers; Christien Ettema, Shades of Green
LayoutTextcetera, The Hague
AcknowledgementsThe project was financed by the European Commission, Directorate General Climate Action (DG CLIMA), and the Dutch Ministry of Infrastructure and the Environment. The report and the calculations have benefited from comments by Ariane Labat and Miles Perry (both from DG CLIMA), and Marcel Berk and Paul van Dam (both from the Dutch Ministry). We also thank all colleagues involved, in particular Pieter Boot, Andries Hof and Detlef van Vuuren (all PBL), and Mykola Gusti and Michael Obersteiner (both IIASA), with a special thanks to Allard Warrink (PBL) for all his work on the infographics (www.pbl.nl/indc).
This report has been prepared by PBL/ IIASA under contract to DG CLIMA (Service Contract no. 071303/2011/662342/SER/CLIMA.A4
– Renewal (Ares (2013)3407741)) renewed in November 2013.
The information and views set out in this study are those of the authors and do not necessarily reflect the official opinion of the
Commission. The Commission does not guarantee the accuracy of the data included in this study. Neither the Commission nor any
person acting on the Commission’s behalf can be held responsible for the use of any information from this study.
This publication can be downloaded from: www.pbl.nl/en. Parts of this publication may be reproduced, providing the source is
stated, in the form: Admiraal A et al. (2015), ‘Assessing Intended Nationally Determined Contributions to the Paris climate agreement
– what are the projected global and national emission levels for 2025–2030?’, The Hague: PBL Netherlands Environmental
Assessment Agency.
PBL Netherlands Environmental Assessment Agency is the national institute for strategic policy analyses in the fields of the
environment, nature and spatial planning. We contribute to improving the quality of political and administrative decision-making,
by conducting outlook studies, analyses and evaluations in which an integrated approach is considered paramount. Policy relevance
is the prime concern in all our studies. We conduct solicited and unsolicited research that is both independent and always
scientifically sound.
Contents
MAIN FINDINGS
Main findings 8
Executive summary 9
FULL RESULTS
1 Introduction 18
2 Overview of the mitigation contribution of submitted INDCs 202.1 What are the announced emission reduction proposals of the INDCs submitted to date? 20
3 Global impact of the INDCs 263.1 What are the projected global greenhouse gas emission levels by 2030 if all INDCs are implemented? 263.2 What is the projected impact of the INDCs on reducing the global 2 ˚C emission gap by 2030? 283.3 What is the projected impact of the INDCs on emissions and removals from land use, land-use change and
forestry (LULUCF) in the context of high uncertainties? 30
4 Assessment of national emission levels resulting from INDC implementation: the G20 countries 364.1 How do emission reductions as projected for national INDCs compare to different historical base years? 364.2 How do emission reductions as projected for national INDCs compare to PBL business-as-usual projections? 364.3 Are national INDCs in line with below-2 °C pathways? 374.4 What do INDCs imply for the timing and level of greenhouse gas emission peaks? 414.5 Are per capita emissions and emission intensities, as projected from national INDCs, converging between
countries? 42
References 46
Annex I: Calculations of LULUCF emissions 48


7Main findings |
MAI
N F
IND
ING
S
MAIN FINDINGS
8
| Assessing Intended Nationally Determined Contributions to the Paris Climate Agreement
Main findings
By 29 October 2015, 156 Parties (representing approxima-tely 90% of global greenhouse gas emissions in 2012) had submitted their Intended Nationally Determined Contributions (INDCs) to the UNFCCC in preparation for the adoption of the Paris Agreement in December 2015 (UNFCCC, 2015). In this report, we assess the mitigation components of the INDCs of 102 of these Parties (representing approximately 89% of global greenhouse gas emissions in 2012), including the EU28 Member States. The main findings of this assessment are:Findings regarding global emissions: The collective ambition of the INDCs put forward in 2030 falls short of what is needed to put the world directly on a cost-effective pathway to keep the global temperature increase below 2 °C; however, if fully implemented, the INDCs will deliver significant emission reductions from business-as-usual trends.– Full implementation of all unconditional INDCs is
projected to reduce yearly global greenhouse gas emissions by approximately 9 (5–10) GtCO2eq by 2030, relative to the PBL business-as-usual scenario of about 65 GtCO2eq in 2030.
– Additional implementation of all conditional INDCs (which would require some form of international climate finance or international cooperation mechanisms) would increase this projected reduction to about 11 (7–13) GtCO2eq in 2030 below PBL business-as-usual levels.
– Despite these projected reductions relative to business-as-usual levels, global emissions are projected to increase until at least 2030, to about 56 (54–60) GtCO2eq if the unconditional INDCs are implemented, or to about 54 (52–58) GtCO2eq if the conditional INDCs are implemented as well. The median estimates for 2030 are 13% to 18% above 2010 emission levels.
– Implementation of the unconditional INDCs would still leave an emission gap of 14 (13–18) GtCO2eq relative to the global emission level needed for keeping the temperature increase below 2 °C with a likely chance (42 GtCO2eq in 2030, as estimated in the UNEP Gap Report of 2014). Implementation of the conditional INDCs would further reduce this gap to 12 (10–16) GtCO2eq.
Findings regarding national INDCs (G20 members): the presented analysis of individual INDCs shows how INDC implementation could enable a transition from business-as-usual trends to lower emission levels, lower emissions per capita and lower emission intensities at both national and global levels.– Based on national INDCs, emissions in middle-income
countries such as Mexico, Indonesia, Brazil and South Korea are expected to peak before 2025. Emissions in China, India and South Africa are expected to peak by 2030 or later. Emissions in most high-income countries have already peaked in the past.
– The largest emission reductions in 2030 relative to the PBL business-as-usual scenario (which assumes that no new climate policies will be implemented) are projected for Australia, Brazil and Canada.
– Full implementation of submitted INDCs (uncondi-tional and conditional) would decrease global net land-use (LULUCF) emissions by 2.6 GtCO2eq in 2030 compared to national business-as-usual projections, which is approximately one third of the total global emission reduction that would result from the full implementation of all unconditional INDCs. The largest absolute reductions in land-use emissions are expected for Brazil and Indonesia, followed by the United States, China, Ethiopia, Gabon and Democratic Republic of the Congo.
– Based on the submitted INDCs, per capita emission levels are projected to decline between 2010 and 2030 in all G20 countries except Argentina, China, India, the Russian Federation and Turkey.
– Similarly, emission intensities (emissions per GDP) are projected to decline between 2010 and 2030 in all G20 countries except Turkey, indicating a relative decoupling of economic growth and greenhouse gas emissions. Decoupling – implying absolute emission reductions in a growing economy – is projected for 13 to 15 of the G20 countries, depending on the conditionality of their INDCs.
– While the aggregate effect of submitted INDCs is projected to be insufficient to close the global emission gap, INDCs of some countries are nevertheless consistent with national cost-optimal below-2 °C pathways (EU28, United States) and/or below-2 °C pathways based on converging per capita emissions (United States).

9Main findings |
Executive summary
From March 2015 all Parties to the UNFCCC could submit their Intended Nationally Determined Contributions (INDCs) to the UNFCCC Secretariat in preparation for the adoption of the Paris Agreement in December 2015. This report provides an overview of the INDCs submitted by 29 October 2015 and analyses their level of ambition. The INDCs are compared to emission projections based on i) implementation of current climate policies and ii) business-as-usual developments (not taking into account climate policies that have been put in place after 2004).The results of this study are presented below according to the following nine questions:
Global assessmentQ1) What are the announced reduction proposals of the
INDCs submitted to date?Q2) What are the projected global greenhouse gas
emission levels by 2030 if all submitted INDCs are implemented?
Q3) What is the projected impact of the INDCs on reducing the global 2 °C emission gap by 2030?
Q4) What is the projected impact of the INDCs on emissions and removals from land use, land-use change and forestry (LULUCF) in the context of high uncertainties?
National assessment (G20 members)Q5) How do emission reductions as projected for national
INDCs compare to different historical base years?Q6) How do emission reductions as projected for national
INDCs compare to PBL business-as-usual projections?Q7) Are national INDCs in line with below-2 °C pathways?Q8) What do national INDCs imply for the timing and level
of greenhouse gas emission peaks?Q9) Are per capita emissions and emission intensities, as
projected from national INDCs, converging between countries?
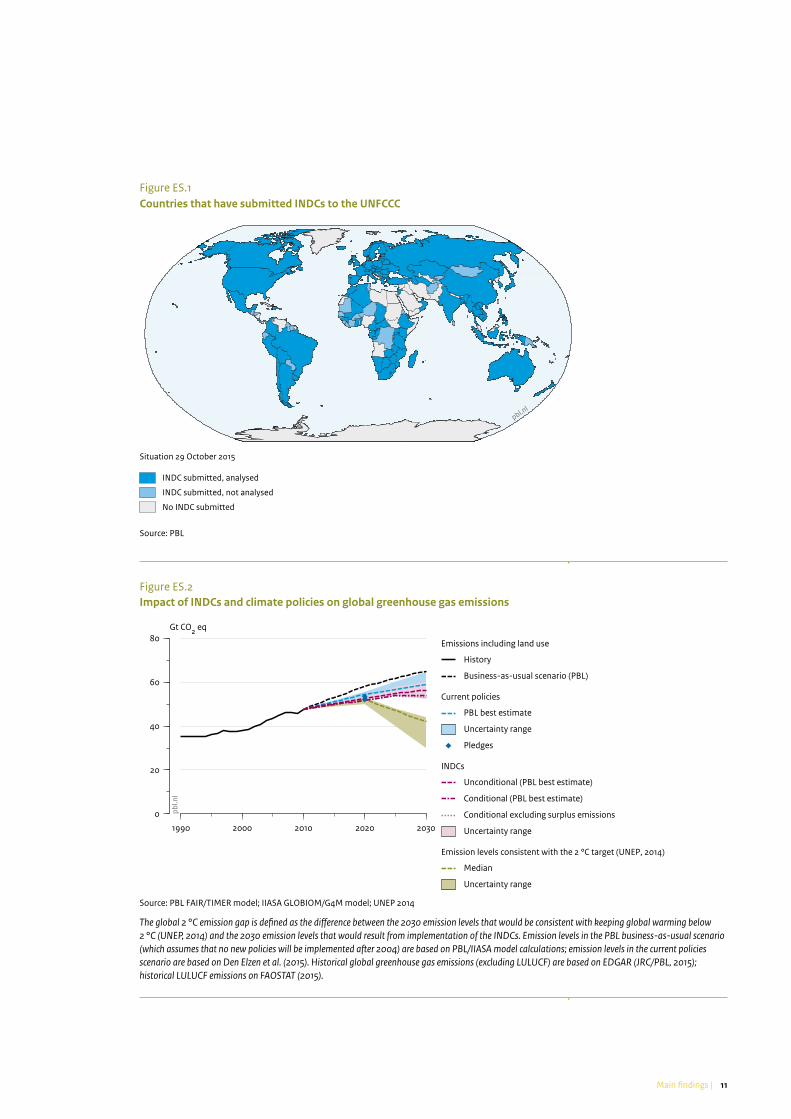
Q1: What are the announced emission reduction proposals of the INDCs submitted to date?– By 29 October 2015, 156 Parties out of 195 Parties to the
UNFCCC had submitted their INDCs to the UNFCCC Secretariat (see Figure ES.1). Together, these Parties were responsible for approximately 90% of global greenhouse gas emissions in 2012. Our analysis focuses on 74 INDCs (representing 102 Parties, including the 28 EU Member States1), covering all
major emitting countries and including all Parties with a 2012 emission share of more than 0.1%. Some smaller countries for which adequate data was available for calculating the effect of their INDC targets were also included. The selected Parties together were responsible for 89% of global greenhouse gas emissions in 2012. Table ES.1 summarises the announced mitigation efforts of the G20 countries.
Q2: What are the projected global greenhouse gas emission levels by 2030 if all submitted INDCs are implemented?– Under full implementation of all unconditional INDCs, global
greenhouse gas emissions are projected to be reduced by approximately 9 (5–10) GtCO2eq by 2030, relative to the PBL business-as-usual scenario of 65 GtCO2eq (which assumes no new policies after 2004, see Box 3.1). If all conditional INDCs are implemented as well, this reduction would increase to approximately 11 (7–13) GtCO2eq in 2030. Compared to the current policies scenario (emission development under current and planned pre-2020 policies), projected reductions are 3 (0–5) GtCO2eq for the unconditional INDCs and 5 (1–7) GtCO2eq for the conditional INDCs. The uncertainty ranges are a result of uncertainties in the INDC projections for Australia, the Russian Federation, the United States, China and India.
– Global emissions are projected to increase until at least 2030. Based on the unconditional INDCs the global emission level for 2030 is projected at about 56 (55–60) GtCO2eq. If the conditional INDCs are implemented as well, this level would be about 54 (52–58) GtCO2. The median estimates are 13% to 18% above 2010 emission levels (Figure ES.2).
– Global emissions could be reduced by an additional 1 (0–2) GtCO2eq by 2030 if, for some countries, current policies are assumed rather than INDCs. In some countries, INDC implementation could result in higher emission levels than projected under current policies (according to our analysis, e.g. in Argentina, Chile, Ghana, Kazakhstan, Lebanon, Peru, Russian Federation, Turkey, Ukraine and Vietnam). If emission levels of these countries are projected under current policies rather than INDCs, the global emission projection for 2030 under the conditional INDC scenario (53 (52–57) GtCO2) would be 1 (0–2) GtCO2eq lower.

10
| Assessing Intended Nationally Determined Contributions to the Paris Climate Agreement
– The above-mentioned estimates are subject to large uncertainties (in the range of 5 GtCO2eq), as a result of uncertainties in the projections for some of the INDCs. A large uncertainty is due to the dependence of several INDCs on economic growth. For instance, a 1% change in China’s average annual economic growth would already result in a change in the emission target of approximately 2.5 GtCO2eq in the estimates of China’s INDC. There are major uncertainties on the projections of land-use emissions and removals (see relevant section).
Q3: What is the projected impact of the INDCs on reducing the global 2 °C emission gap by 2030?– According to the UNEP Gap Report (2014), global emission
levels consistent with a likely chance of staying within the 2 °C limit are projected at 42 (30–44) GtCO2eq in 2030 (median and 20th – 80th percentile range).
– This leaves a gap of 14 (13–18) GtCO2eq between the global emissions projected to result from the unconditional INDCs (56 (55–60) GtCO2eq) and the median emission level in the below-2 °C scenario of UNEP. If the conditional INDCs are implemented as well, this gap would be 2 GtCO2eq smaller.
Table ES.1Summary of the unconditional and conditional mitigation targets for 2025 and 2030, as proposed in the INDCs of the G20 countries
Country1) Unconditional INDC (conditional) Base year and Business-as-Usual2) emission level
(MtCO2eq)
Emission target (MtCO2eq)
based on calculations of this study3
2025 2030 2025 2030
Argentina - -15% (-30%) BAU 2030 670 - 570 (469)
Australia - -26% to -28% 2005 601 - 433 to 445
Brazil -37% -43% 2005 2,100 1,300 1,200
Canada - -30% 2005 749 - 524
China - Peaking CO2 emissions around 2030; 60% to 65% CO2 emission intensity reduction; 20% non-fossil fuels in primary energy consumption & increased forest stock volume
2005 7,038 - 13,957[12,602; 16,835]
EU28 - -40% 1990 5,626 - 3,376
India - Conditional: 33% to 35% emission intensity reduction; 40% non-fossil fuel electricity; Increase carbon sink volume
2005 1,809 - 4,168[4,168; 6,733]
Indonesia - -29% (-41%) BAU 2030 2,881 - 2,046 (1,700)
Japan - -26% Fiscal Year 2013
1,408 - 1,042
Mexico - -22% (-36%) BAU 2030 973 - 759 (623)
Russian Federation - -25% to -30% 1990 3,363 - 2,354 to 2,523
South Africa - - BAU 2030 - 398 to 614 398 to 614
South Korea - -37% BAU 2030 851 - 536
Turkey - -21% BAU 2030 1,175 - 928
United States -26% to -28%
- 2005 6,439 4,636 to 4,765
(3,992 to 4,121)4)
1) The country-specific emission levels stated above include all greenhouse gas emissions from energy, industry and services, as well as emissions and removals from activities related to land use, land-use change and forestry (LULUCF) for the following countries: the United States, Turkey, Mexico, Indonesia, Brazil, India, China, Australia, and Argentina. The land-use emissions and removals from the remaining countries were aggregated as part of the global estimates of effects on land-use emissions and removals.
2) Projected business-as-usual emission levels, as reported by the submitted INDCs (UNFCCC, 2015).3) Successful implementation of the INDCs is contingent upon an ambitious global agreement including additional means of
implementation to be provided by developed country parties, technology transfer and capacity building following Articles 3.1 and 4.7 of the Convention.
4) The US INDC target for 2025 may be extrapolated to 2030 by assuming a linear pathway to the national long-term target (83% reduction below 2005 levels by 2050).
11Main findings |
Figure ES.1Countries that have submi�ed INDCs to the UNFCCC
pbl.nl
Situation 29 October 2015
INDC submi�ed, analysed
INDC submi�ed, not analysed
No INDC submi�ed
Source: PBL
Figure ES.2
1990 2000 2010 2020 2030
0
20
40
60
80Gt CO2 eq
Source: PBL FAIR/TIMER model; IIASA GLOBIOM/G4M model; UNEP 2014
pbl.n
l
Emissions including land use
History
Business-as-usual scenario (PBL)
Current policies
PBL best estimate
Uncertainty range
Pledges
INDCs
Unconditional (PBL best estimate)
Conditional (PBL best estimate)
Conditional excluding surplus emissions
Uncertainty range
Emission levels consistent with the 2 °C target (UNEP, 2014)
Median
Uncertainty range
Impact of INDCs and climate policies on global greenhouse gas emissions
The global 2 °C emission gap is defined as the difference between the 2030 emission levels that would be consistent with keeping global warming below 2 °C (UNEP, 2014) and the 2030 emission levels that would result from implementation of the INDCs. Emission levels in the PBL business-as-usual scenario (which assumes that no new policies will be implemented after 2004) are based on PBL/IIASA model calculations; emission levels in the current policies scenario are based on Den Elzen et al. (2015). Historical global greenhouse gas emissions (excluding LULUCF) are based on EDGAR (JRC/PBL, 2015); historical LULUCF emissions on FAOSTAT (2015).
12 | Assessing Intended Nationally Determined Contributions to the Paris Climate Agreement
Q4: What is the projected impact of the INDCs on emissions and removals from land use, land-use change and forestry (LULUCF) in the context of high uncertainty?– Of the 156 Parties that had submitted an INDC by 29 October
2015, 95 Parties explicitly state that emissions and removals from LULUCF are included in their mitigation targets. However, only 36 of them provide quantifiable details of measures or specific targets for the LULUCF sector. Of the remaining INDCs, 42 INDCs explicitly state that LULUCF emissions and removals are not included in their mitigation targets but nevertheless propose measures or policies to reduce net LULUCF emissions. The other 19 INDCs state that LULUCF emissions and removals are not covered and do not propose measures or policies for reducing net LULUCF emissions.
– There is high uncertainty on the historical levels of emissions and removals, as well as on the projections of future emissions and removals. There is also only partial information in the INDCs on how INDCs will address these emission sources.
– Taking into account these uncertainties, we could estimate that the full implementation of all unconditional and conditional INDCs would decrease net LULUCF emissions in 2030 compared to national business-as-usual projections. By contrast, under national business-as-usual scenarios and independent baseline scenarios, it is expected that net LULUCF emissions would increase by 2030. This shows that implementing INDCs is important for addressing these emission sources. However, the quantified impact of the INDCs on these emissions and removals is sensitive to the data and methodologies used. This study used national business-as-usual projections based on data provided by countries in their INDCs, complemented with information from National Communications or other published information sources where needed.
– The largest absolute reductions in net LULUCF emissions are expected in Brazil and Indonesia, followed by the United States, China, Ethiopia, Gabon and Democratic Republic of the Congo.
Q5: How do emission reductions as projected for national INDCs compare to different historical base years?– The national INDCs can be converted into reduction targets
for 2030, compared to various historical years. For example, the EU28’s target of 40% reduction relative to 1990 levels is equivalent to 29% reduction relative to 2010 levels, due to the fact that emissions in the EU declined between 1990 and 2010. The target of the United States (26%–28% reduction relative to 2005 levels, by 2025) may be extrapolated to a 36% to 38% reduction by 2030, assuming a linear pathway towards the country’s long-term goal of 83% reduction by 2050. Relative to 2010 levels, however, the reduction estimated for 2030 would be 30% to 32%.
Q6: How do emission reductions as projected for national INDCs compare to PBL business-as-usual projections?– The INDCs of the G20 countries are projected to reduce
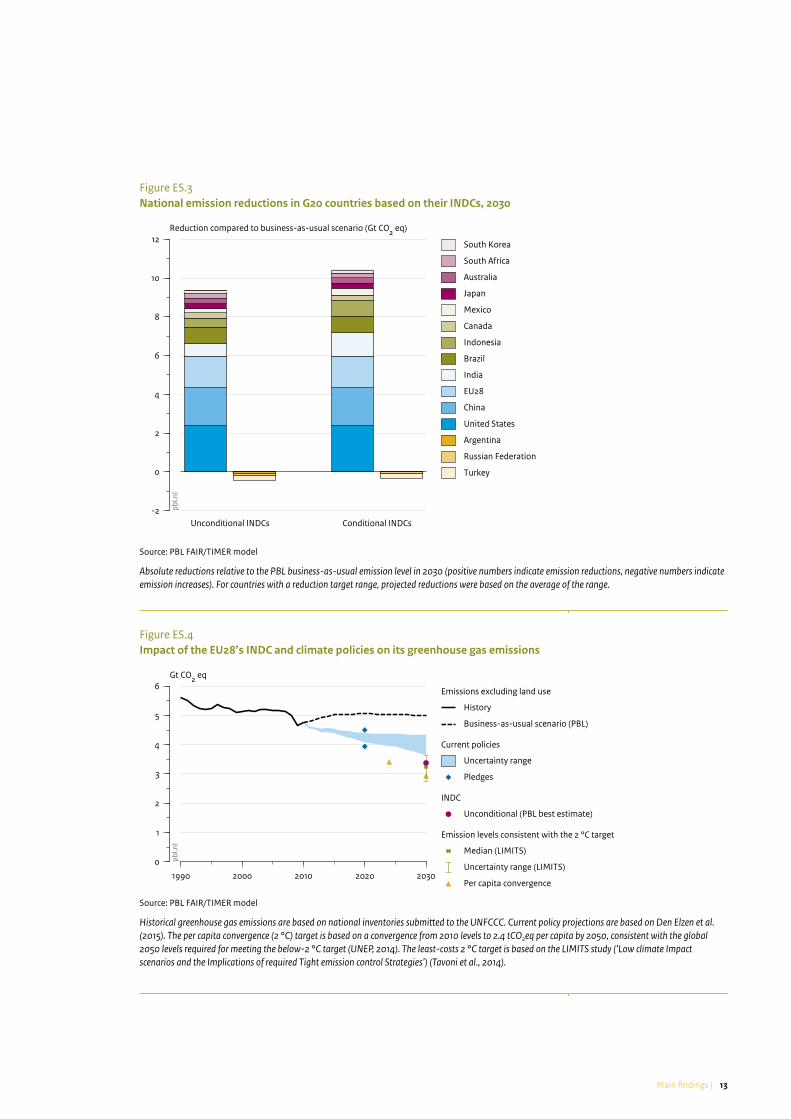
emissions relative to PBL business-as-usual levels by approximately 9 to 10 GtCO2eq by 2030. The INDCs of other (non-G20) countries are projected to reduce emissions by an additional 0 to 1 GtCO2eq. Among the G20, substantive absolute emission reductions from PBL business-as-usual levels can be expected for the United States, followed by China, the EU28, India and Brazil. Together, these five countries would achieve approximately 80% of the total global emission reduction projected (Figure ES.3).
– The largest relative emission reductions compared to PBL business-as-usual emission levels in 2030 are projected for Australia, Brazil, Canada and the United States.
Q7: Are national INDCs in line with below-2 °C pathways?– While the aggregate effect of the submitted INDCs is
projected to be insufficient to close the global emission gap, INDCs of some countries are nevertheless consistent with below-2̊ C emission pathways based on either cost-effectiveness or per capita emission convergence.
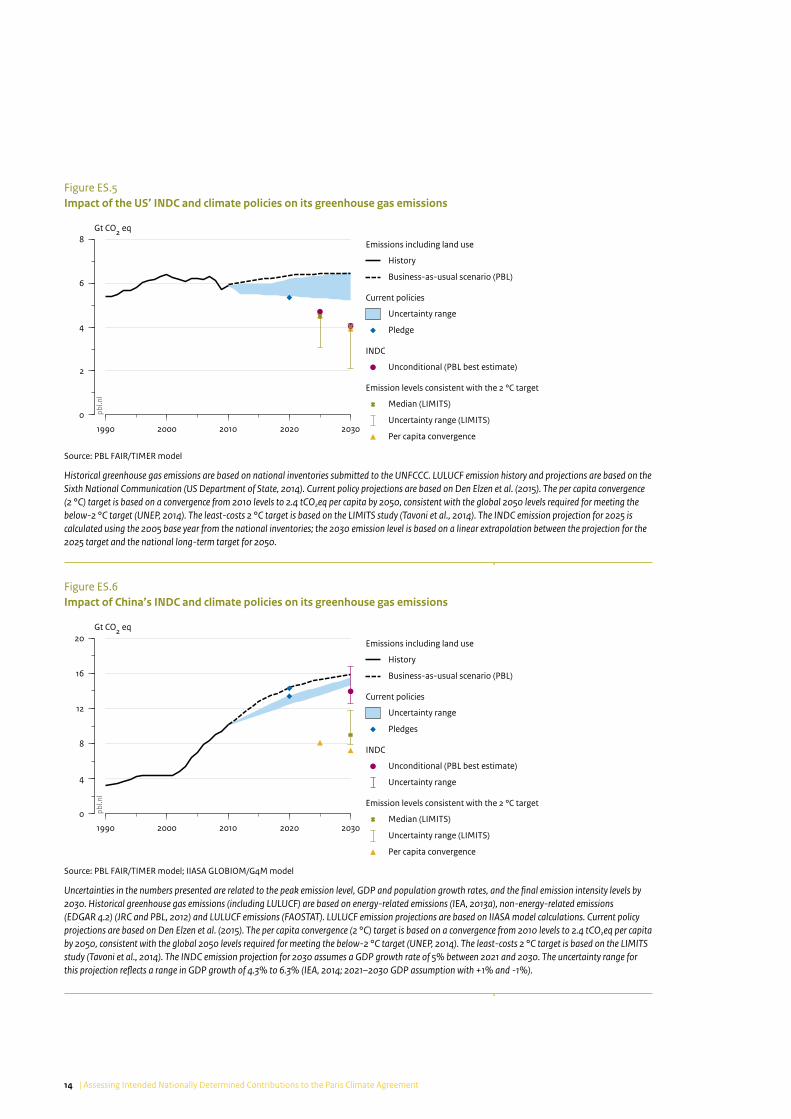
– The INDC of the EU28 is projected to reduce emissions to a level close to the domestic reduction of 40% to 45% required in a least-costs below-2 ˚C scenario. However, the projected reduction is not consistent with a below-2 °C pathway based on convergence of per capita emissions from 2010 levels to 2.4 tonnes CO2eq per capita by 2050 (Figure ES.4).
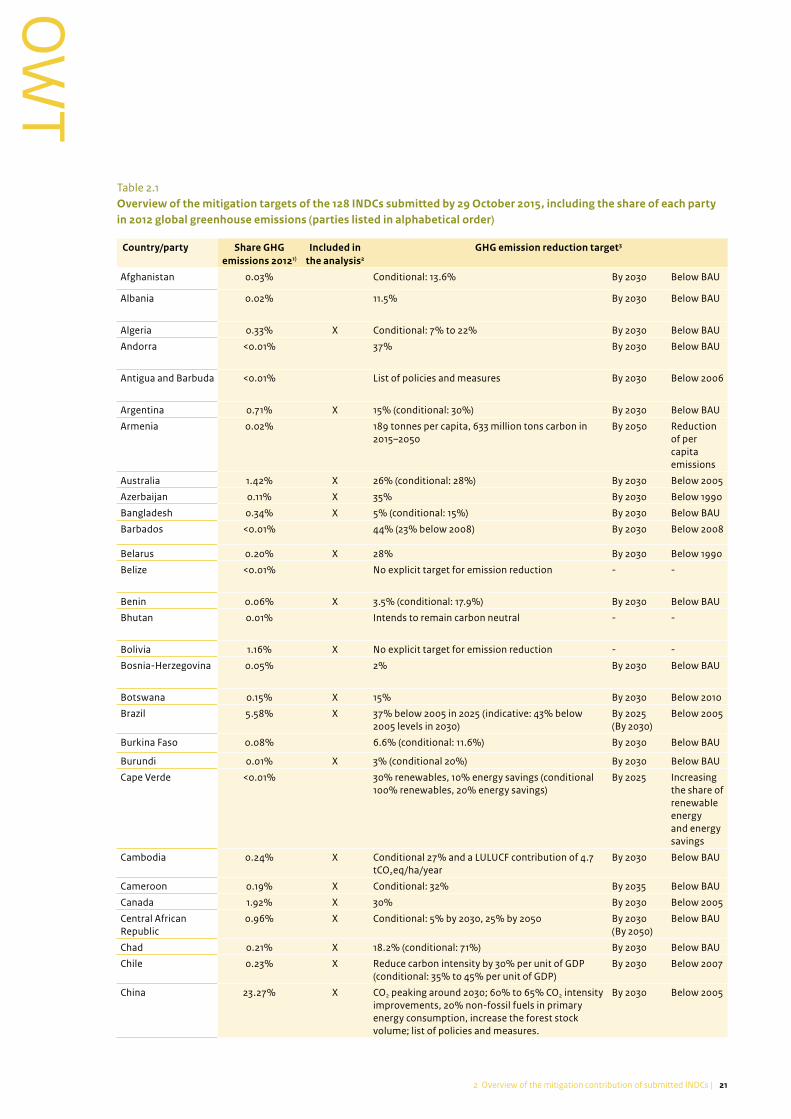
– The INDC of the United States is projected to reduce emissions to well below current policies levels. If the reduction target for 2025 is extrapolated to 2030 (based on the national long-term 2050 target), the resulting emission reduction would be in line with both the least-costs below-2 °C emission pathway and the per capita emissions convergence trajectory for this country. The latter is particularly noteworthy, considering the relatively high per capita emissions in the United States in 2010 (22 tonnes CO2eq per capita, more than twice the level of the EU in that year). However, both pathway estimates (least-costs and per capita convergence) are subject to large uncertainties related to LULUCF CO2 emission projections for this country (Figure ES.5).
– The INDCs of China and India are projected to result in emissions well above levels required for below-2 °C scenarios. However, the INDC projections for these countries are subject to many uncertainties, including uncertainties related to GDP growth rate projections and the implementation of policies announced in the submitted INDCs (Figures ES.6 and ES.7).
13Main findings |
Figure ES.3
Unconditional INDCs Conditional INDCs-2
0
2
4
6
8
10
12Reduction compared to business-as-usual scenario (Gt CO2 eq)
Source: PBL FAIR/TIMER model
pbl.n
l
South Korea
South Africa
Australia
Japan
Mexico
Canada
Indonesia
Brazil
India
EU28
China
United States
Argentina
Russian Federation
Turkey
National emission reductions in G20 countries based on their INDCs, 2030
Absolute reductions relative to the PBL business-as-usual emission level in 2030 (positive numbers indicate emission reductions, negative numbers indicate emission increases). For countries with a reduction target range, projected reductions were based on the average of the range.
Figure ES.4
1990 2000 2010 2020 2030
0
1
2
3
4
5
6Gt CO2 eq
Source: PBL FAIR/TIMER model
pbl.n
l
Emissions excluding land use
History
Business-as-usual scenario (PBL)
Current policies
Uncertainty range
Pledges
INDC
Unconditional (PBL best estimate)
Emission levels consistent with the 2 °C target
Median (LIMITS)
Uncertainty range (LIMITS)
Per capita convergence
Impact of the EU28’s INDC and climate policies on its greenhouse gas emissions
Historical greenhouse gas emissions are based on national inventories submitted to the UNFCCC. Current policy projections are based on Den Elzen et al. (2015). The per capita convergence (2 °C) target is based on a convergence from 2010 levels to 2.4 tCO2eq per capita by 2050, consistent with the global 2050 levels required for meeting the below-2 °C target (UNEP, 2014). The least-costs 2 °C target is based on the LIMITS study (‘Low climate Impact scenarios and the Implications of required Tight emission control Strategies’) (Tavoni et al., 2014).
14 | Assessing Intended Nationally Determined Contributions to the Paris Climate Agreement
Figure ES.5
1990 2000 2010 2020 2030
0
2
4
6
8Gt CO2 eq
Source: PBL FAIR/TIMER model
pbl.n
l
Emissions including land use
History
Business-as-usual scenario (PBL)
Current policies
Uncertainty range
Pledge
INDC
Unconditional (PBL best estimate)
Emission levels consistent with the 2 °C target
Median (LIMITS)
Uncertainty range (LIMITS)
Per capita convergence
Impact of the US’ INDC and climate policies on its greenhouse gas emissions
Historical greenhouse gas emissions are based on national inventories submitted to the UNFCCC. LULUCF emission history and projections are based on the Sixth National Communication (US Department of State, 2014). Current policy projections are based on Den Elzen et al. (2015). The per capita convergence (2 °C) target is based on a convergence from 2010 levels to 2.4 tCO2eq per capita by 2050, consistent with the global 2050 levels required for meeting the below-2 °C target (UNEP, 2014). The least-costs 2 °C target is based on the LIMITS study (Tavoni et al., 2014). The INDC emission projection for 2025 is calculated using the 2005 base year from the national inventories; the 2030 emission level is based on a linear extrapolation between the projection for the 2025 target and the national long-term target for 2050.
Figure ES.6
1990 2000 2010 2020 2030
0
4
8
12
16
20Gt CO2 eq
Source: PBL FAIR/TIMER model; IIASA GLOBIOM/G4M model
pbl.n
l
Emissions including land use
History
Business-as-usual scenario (PBL)
Current policies
Uncertainty range
Pledges
INDC
Unconditional (PBL best estimate)
Uncertainty range
Emission levels consistent with the 2 °C target
Median (LIMITS)
Uncertainty range (LIMITS)
Per capita convergence
Impact of China’s INDC and climate policies on its greenhouse gas emissions
Uncertainties in the numbers presented are related to the peak emission level, GDP and population growth rates, and the final emission intensity levels by 2030. Historical greenhouse gas emissions (including LULUCF) are based on energy-related emissions (IEA, 2013a), non-energy-related emissions (EDGAR 4.2) (JRC and PBL, 2012) and LULUCF emissions (FAOSTAT). LULUCF emission projections are based on IIASA model calculations. Current policy projections are based on Den Elzen et al. (2015). The per capita convergence (2 °C) target is based on a convergence from 2010 levels to 2.4 tCO2eq per capita by 2050, consistent with the global 2050 levels required for meeting the below-2 °C target (UNEP, 2014). The least-costs 2 °C target is based on the LIMITS study (Tavoni et al., 2014). The INDC emission projection for 2030 assumes a GDP growth rate of 5% between 2021 and 2030. The uncertainty range for this projection reflects a range in GDP growth of 4.3% to 6.3% (IEA, 2014; 2021–2030 GDP assumption with +1% and -1%).

15Main findings |
Figure ES.7
1990 2000 2010 2020 2030
0
2
4
6
8Gt CO2 eq
Source: PBL FAIR/TIMER model; IIASA GLOBIOM/G4M model
pbl.n
l
Emissions including land use
History
Business-as-usual scenario (PBL)
Current policies
Uncertainty range
Pledges
INDCs
Conditional: intensity target
Conditional: intensity target, non-fossiltarget, afforestation target
Emission levels consistent with the 2 °C target
Median (LIMITS)
Uncertainty range (LIMITS)
Per capita convergence
Impact of India’s INDC and climate policies on its greenhouse gas emissions
Historical greenhouse gas emissions (including LULUCF) are based on energy-related emissions (IEA, 2013a), non-energy-related emissions (EDGAR 4.2) (JRC and PBL, 2012) and LULUCF emissions (FAOSTAT). LULUCF emission projections are based on IIASA model calculations. Current policy projections are based on Den Elzen et al. (2015). The per capita convergence (2 °C) target is based on a convergence from 2010 levels to 2.4 tCO2eq per capita by 2050, consistent with the global 2050 levels required for meeting the below-2 °C target (UNEP, 2014). The least-costs 2 °C target is based on the LIMITS study (Tavoni et al., 2014). The range in INDC projections is based on the range in GDP growth rates taken from WEO (IEA, 2014) and PBL model estimates of respectively 6.8% and 7.4% annual growth between 2005 and 2030.
Figure ES.8
0 10 20 30 40 50 60
thousand USD2005 per capita per year (ppp)
0
5
10
15
20
25
30t CO2 eq per capita per year
Source: PBL FAIR/TIMER model; SSP database
pbl.n
l
2010
2020
2030
EU28
United States
Mexico
Russian Federation
South Africa
India
Turkey
Canada
Brazil
China
South Korea
Indonesia
Australia
Japan
Argentina
Emissions per capita
Greenhouse gas emissions versus GDP per capita
0 10 20 30 40 50 60
thousand USD2005 per capita per year (ppp)
0
500
1000
1500
2000
2500t CO2 eq per million USD2005 per year
pbl.n
l
Emissions per GDP
Symbols represent emissions per capita and per GDP (y-axis) as a function of per capita GDP (PPP) (x-axis) in 2010, 2020 and 2030. Population and GDP data are from PBL business-as-usual calculations, based on the SSP2 scenario database (SSP database, 2015). The SSP database uses the population and GDP history until 2008 from The World Bank (2015) with SSP growth projections onwards. The 2020 emission levels are based on PBL projections for current policies; 2030 emission levels are based on PBL projections for the submitted INDCs.

16 | Assessing Intended Nationally Determined Contributions to the Paris Climate Agreement
Q8: What do national INDCs imply for the timing and level of greenhouse gas emission peaks?– Based on national INDCs, emissions in middle-income
countries such as Mexico, Indonesia and Brazil are expected to peak before 2025.
– Emissions in China, India and South Africa are expected to peak by 2030 or later. These countries have relatively high emission intensities due to carbon intensive economies. Based on China’s INDC, CO2 emissions in this country are projected to peak by 2030 at the latest, but its total greenhouse gas emissions are projected to peak after 2030.
– Emissions in most high-income countries have already peaked in the past. Emissions in the EU peaked around 1980; of the Russian Federation (then Soviet Union), around 1990; of Australia, Canada, Japan and the United States, around 2005; and of South Korea, around 2010.
Q9: Are per capita emissions and emission intensities, as projected from national INDCs, converging between countries?– Based on national INDCs, per capita emission levels are
projected to decline between 2010 and 2030 in all G20 countries, except Argentina, China, India, the Russian Federation and Turkey. Furthermore, the positive correlation between income and emissions per capita will largely disappear by 2030, as emissions per capita are converging between countries with different income levels (Figure ES.8, left panel).
– Similarly, emission intensities (emissions per GDP) are projected to decline substantially between 2010 and 2030 in all G20 countries (except Turkey), with levels converging by 2030. The largest reductions are projected for countries with the highest emission intensities in 2010, such as Indonesia, China and Brazil. Emission intensities are converging to levels between 250 and 750 tonnes CO2eq per million USD in all G20 countries by 2030, independent of their emission intensity levels in 2010 and income levels in 2030 (Figure ES.8, right panel).
– The convergence of both emission intensities and emissions per capita between G20 countries, despite their different income levels, reflects a decoupling of economic growth and greenhouse gas emissions.
Note
1 In our analysis, the EU28 is considered as a single Party, and
EU Member States are not considered individually. To ease
reading, this report uses ‘countries’ and ‘national’ to refer to
all ‘Parties’, including the EU28.

FULL
RES
ULT
S
FULL RESULTS

18
ON
E
| Assessing Intended Nationally Determined Contributions to the Paris Climate Agreement
Introduction
During the international climate negotiations under the umbrella of the United Nations Framework Convention on Climate Change (UNFCCC), Parties have agreed to collectively reduce greenhouse gas emissions with the aim to limit global mean temperature increase to less than 2 ˚C above pre-industrial levels, in order to avoid dangerous anthropogenic climate change (UNFCCC 2009; UNFCCC 2010). In this context, many countries have formulated emission reduction proposals (pledges) for the year 2020, which are anchored in the Cancun Agreements. These pledges focus on mitigation, and a distinction is made between the effort level required from Annex I countries versus non-Annex I countries. Assessments of these pledges have shown that the associated emission reductions fall short of those consistent with the 2 ˚C climate target (Hof et al., 2013; UNEP, 2014).The Conference of the Parties (COP) therefore invited all Parties to initiate or intensify domestic actions before 2020 and submit post-2020 goals, in order to achieve the below-2̊ C objective of the Convention. Parties were asked to submit their post-2020 goals, formally known as Intended Nationally Determined Contributions (INDCs), well in advance of the COP21 in Paris in December 2015, where a legal agreement is planned to be adopted. These post-2020 INDCs differ from the 2020 pledges in that they do not only cover mitigation: Parties are also requested to address adaptation, fairness and ambition. Where necessary, INDCs may also include a call for financial support for mitigation and adaptation measures. Among the 156 Parties that had submitted an INDC by 29 October 2015, most Parties have included both adaptation and mitigation targets (UNFCCC, 2015). Another difference with the pre-2020 pledges is that, in order to encourage ambition among all Parties, the distinction between Annex I and non-Annex I countries has been abandoned.In this report, we provide an assessment of a selection of the INDCs submitted to the UNFCCC by 29 October 2015 (Figure 1.1). We analyse the aggregate effect of these selected INDCs on projected global greenhouse gas
emissions up to 2030, and compare the result to emission projections based on implementation of current climate policies and on business-as-usual developments. Furthermore, we assess the emission gap between the global emission levels required for keeping global temperature increase within 2°C, and those that would result from implementation of the submitted INDCs, by 2025 and 2030. Uncertainties in emission projections are also discussed. For G20 countries (including the EU28), we present several emission indicators to compare the ambition levels of their INDCs. We address the following questions:
Global assessment1. What are the announced reduction proposals of
the INDCs submitted to date? (Chapter 2)2. What are the projected global greenhouse gas
emission levels by 2030 if all submitted INDCs are implemented? (Section 3.1)
3. What is the projected impact of the INDCs on reducing the global 2 °C emission gap by 2030? (Section 3.2)
4. What is the projected impact of the INDCs on emissions and removals from land use, land-use change and forestry (LULUCF) in the context of high uncertainties? (Section 3.3)
National assessment (G20 members)5. How do emission reductions as projected for national
INDCs compare to different historical base years? (Section 4.1)
6. How do emission reductions as projected for national INDCs compare to PBL business-as-usual emission projections? (Section 4.2)
7. Are national INDCs in line with below-2 °C pathways? (Section 4.3)
8. What do national INDCs imply for the timing and level of greenhouse gas emission peaks? (Section 4.4)
9. Are per capita emissions and emission intensities, as projected from national INDCs, converging between countries? (Section 4.5)

191 Introduction |
ON
E
ONE
Figure 1.1Countries that have submi�ed INDCs to the UNFCCC
pbl.nl
Situation 29 October 2015
INDC submi�ed, analysed
INDC submi�ed, not analysed
No INDC submi�ed
Source: PBL

20
TWO
| Assessing Intended Nationally Determined Contributions to the Paris Climate Agreement
Overview of the mitigation contribution of submitted INDCs
2.1 What are the announced emission reduction proposals of the INDCs submitted to date?
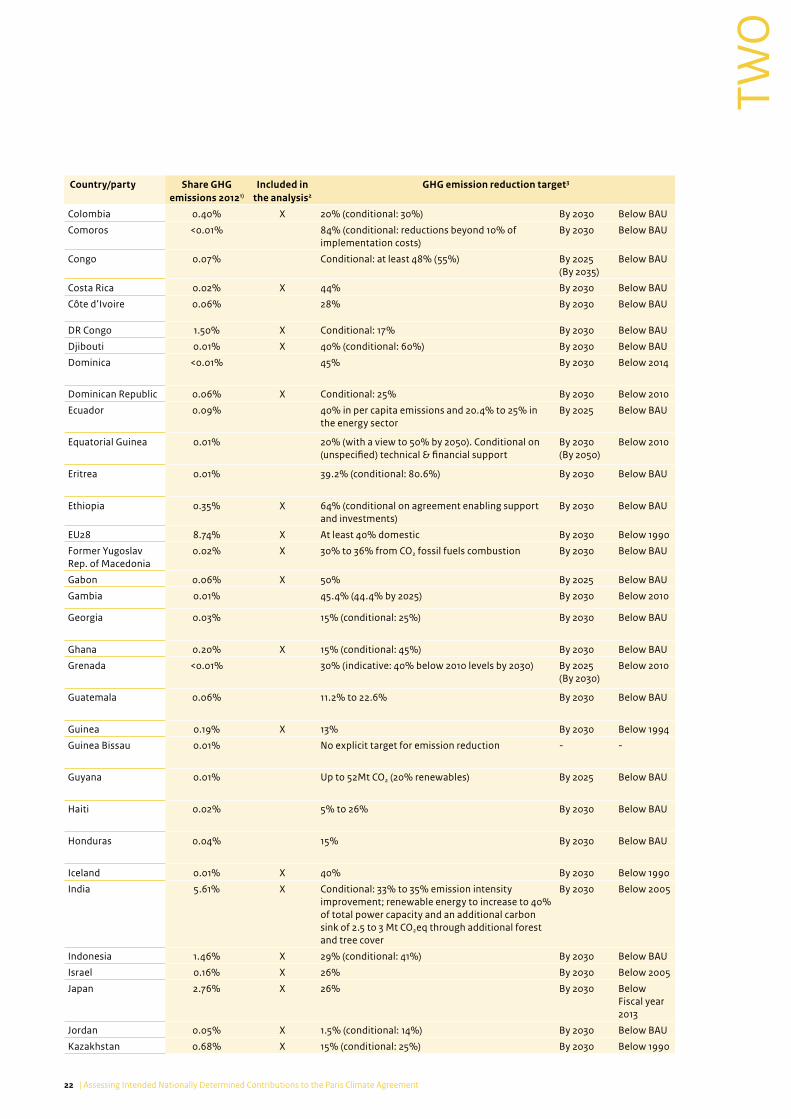
By 29 October 2015, 128 INDCs had been submitted to the UNFCCC in preparation for the adoption of the Paris Agreement in December 2015. These INDCs (including the INDC submitted by the EU, on behalf of its 28 Member States) cover emissions from 156 out of 195 Parties to the UNFCCC1. Together, these 156 Parties were responsible for approximately 90% of global greenhouse gas emissions in 2012 (Figure 1.1 and Table 2.1). In this report, we provide a quantitative assessment of the INDC mitigation targets of Parties with a 2012 global emission share of more than 0.1%. Some smaller countries for which adequate data were available for calculating the effect of their INDC targets were also included. Based on this selection we analysed a total of 102 Parties (including the EU28 Member States), which together were responsible for 89% of global greenhouse gas emissions in 2012 (see Table 2.1).
Table 2.1 presents an overview of the mitigation targets of all 128 INDCs submitted. Almost all parties committed to an unconditional reduction target. Among countries with emissions exceeding 100 MtCO2eq in 2012, India is the only country whose INDC targets are conditional, whereas targets set by Algeria, Argentina, Bangladesh, Chile, Colombia, Indonesia, Kazakhstan, Mexico, Philippines, Turkmenistan and Thailand are partially conditional. Conditional means that the implementation of reduction measures is conditional on international support, economic and technological developments, or other factors. Most countries defined their INDC targets for the year 2030, except for some countries (for example Brazil and the United States), who defined targets for 2025.
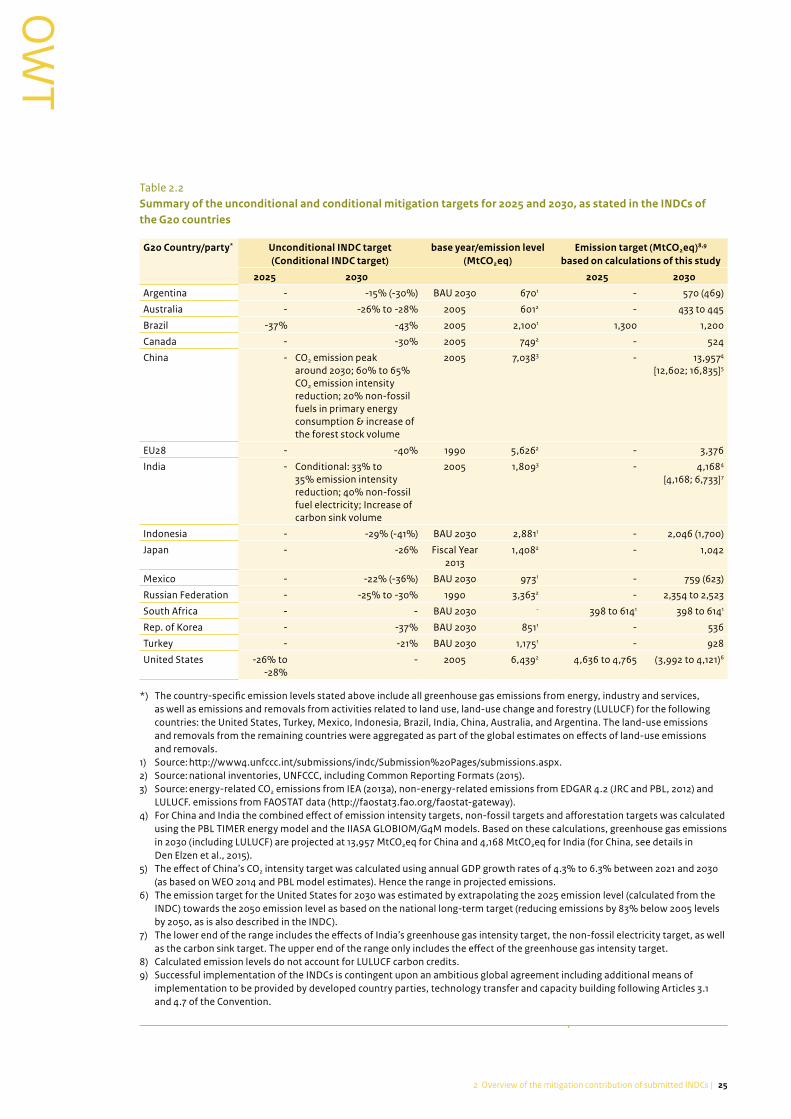
Table 2.2 quantifies the mitigation components of the INDCs submitted by G20 members2, showing their reduction targets, the base year relative to which these targets are defined, and the calculated absolute emission
targets. The latter emission levels were calculated using either national data from the INDC submission (if provided by the submitting party) or the national inventories (historical data or business-as-usual projections depending on how the INDC reduction targets were defined). More specifically, the base year and historical emissions for Australia, Canada, the EU28, Japan, the Russian Federation and the United States were based on UNFCCC national inventories, whereas base year emissions for Argentina, Brazil, Indonesia, Mexico, South Korea and Turkey were provided in the INDC submissions of these countries. It should be noted that our calculations do not account for credits or debits from land use, land-use change and forestry (LULUCF), surplus emission units, and double counting and additionality of offsets.
Among the G20, China and India are the only countries that did not propose an emission reduction target; instead, they propose a combination of climate policies and emission intensity reduction targets. The combined effect of their emission intensity targets, non-fossil targets and afforestation targets was calculated using the PBL TIMER energy model (Van Vuuren et al., 2014) for energy-related emissions and the IIASA GLOBIOM/G4M model (Havlik et al., 2014; Kindermann et al., 2008) for the LULUCF emissions. Based on these calculations, greenhouse gas emission levels in 2030 (including LULUCF) are projected at 13,955 MtCO2eq for China and 4,170 MtCO2eq for India (for details on China, see Den Elzen et al., 2015).
Notes
1 In our analysis, the EU28 is considered as a single Party, and
EU Member States are not considered individually. To ease
reading, this report uses ‘countries’ and ‘national’ to refer to
all ‘Parties’, including the EU28.
2 Except Saudi Arabia, as this country submitted an INDC
after 29 October 2015. France, Italy, Germany and the
United Kingdom are covered by the INDC of the EU.
212 Overview of the mitigation contribution of submitted INDCs |
TWO
TWO
Table 2.1Overview of the mitigation targets of the 128 INDCs submitted by 29 October 2015, including the share of each party in 2012 global greenhouse emissions (parties listed in alphabetical order)
Country/party Share GHG emissions 20121)
Included in the analysis2
GHG emission reduction target3
Afghanistan 0.03% Conditional: 13.6% By 2030 Below BAU
Albania 0.02% 11.5% By 2030 Below BAU
Algeria 0.33% X Conditional: 7% to 22% By 2030 Below BAU
Andorra <0.01% 37% By 2030 Below BAU
Antigua and Barbuda <0.01% List of policies and measures By 2030 Below 2006
Argentina 0.71% X 15% (conditional: 30%) By 2030 Below BAU
Armenia 0.02% 189 tonnes per capita, 633 million tons carbon in 2015–2050
By 2050 Reduction of per capita emissions
Australia 1.42% X 26% (conditional: 28%) By 2030 Below 2005
Azerbaijan 0.11% X 35% By 2030 Below 1990
Bangladesh 0.34% X 5% (conditional: 15%) By 2030 Below BAU
Barbados <0.01% 44% (23% below 2008) By 2030 Below 2008
Belarus 0.20% X 28% By 2030 Below 1990
Belize <0.01% No explicit target for emission reduction - -
Benin 0.06% X 3.5% (conditional: 17.9%) By 2030 Below BAU
Bhutan 0.01% Intends to remain carbon neutral - -
Bolivia 1.16% X No explicit target for emission reduction - -
Bosnia-Herzegovina 0.05% 2% By 2030 Below BAU
Botswana 0.15% X 15% By 2030 Below 2010
Brazil 5.58% X 37% below 2005 in 2025 (indicative: 43% below 2005 levels in 2030)
By 2025 (By 2030)
Below 2005
Burkina Faso 0.08% 6.6% (conditional: 11.6%) By 2030 Below BAU
Burundi 0.01% X 3% (conditional 20%) By 2030 Below BAU
Cape Verde <0.01% 30% renewables, 10% energy savings (conditional 100% renewables, 20% energy savings)
By 2025 Increasing the share of renewable energy and energy savings
Cambodia 0.24% X Conditional 27% and a LULUCF contribution of 4.7 tCO2eq/ha/year
By 2030 Below BAU
Cameroon 0.19% X Conditional: 32% By 2035 Below BAU
Canada 1.92% X 30% By 2030 Below 2005
Central African Republic
0.96% X Conditional: 5% by 2030, 25% by 2050 By 2030 (By 2050)
Below BAU
Chad 0.21% X 18.2% (conditional: 71%) By 2030 Below BAU
Chile 0.23% X Reduce carbon intensity by 30% per unit of GDP (conditional: 35% to 45% per unit of GDP)
By 2030 Below 2007
China 23.27% X CO2 peaking around 2030; 60% to 65% CO2 intensity improvements, 20% non-fossil fuels in primary energy consumption, increase the forest stock volume; list of policies and measures.
By 2030 Below 2005
22 | Assessing Intended Nationally Determined Contributions to the Paris Climate Agreement
TWO
Country/party Share GHG emissions 20121)
Included in the analysis2
GHG emission reduction target3
Colombia 0.40% X 20% (conditional: 30%) By 2030 Below BAU
Comoros <0.01% 84% (conditional: reductions beyond 10% of implementation costs)
By 2030 Below BAU
Congo 0.07% Conditional: at least 48% (55%) By 2025 (By 2035)
Below BAU
Costa Rica 0.02% X 44% By 2030 Below BAU
Côte d’Ivoire 0.06% 28% By 2030 Below BAU
DR Congo 1.50% X Conditional: 17% By 2030 Below BAU
Djibouti 0.01% X 40% (conditional: 60%) By 2030 Below BAU
Dominica <0.01% 45% By 2030 Below 2014
Dominican Republic 0.06% X Conditional: 25% By 2030 Below 2010
Ecuador 0.09% 40% in per capita emissions and 20.4% to 25% in the energy sector
By 2025 Below BAU
Equatorial Guinea 0.01% 20% (with a view to 50% by 2050). Conditional on (unspecified) technical & financial support
By 2030 (By 2050)
Below 2010
Eritrea 0.01% 39.2% (conditional: 80.6%) By 2030 Below BAU
Ethiopia 0.35% X 64% (conditional on agreement enabling support and investments)
By 2030 Below BAU
EU28 8.74% X At least 40% domestic By 2030 Below 1990
Former Yugoslav Rep. of Macedonia
0.02% X 30% to 36% from CO2 fossil fuels combustion By 2030 Below BAU
Gabon 0.06% X 50% By 2025 Below BAU
Gambia 0.01% 45.4% (44.4% by 2025) By 2030 Below 2010
Georgia 0.03% 15% (conditional: 25%) By 2030 Below BAU
Ghana 0.20% X 15% (conditional: 45%) By 2030 Below BAU
Grenada <0.01% 30% (indicative: 40% below 2010 levels by 2030) By 2025 (By 2030)
Below 2010
Guatemala 0.06% 11.2% to 22.6% By 2030 Below BAU
Guinea 0.19% X 13% By 2030 Below 1994
Guinea Bissau 0.01% No explicit target for emission reduction - -
Guyana 0.01% Up to 52Mt CO2 (20% renewables) By 2025 Below BAU
Haiti 0.02% 5% to 26% By 2030 Below BAU
Honduras 0.04% 15% By 2030 Below BAU
Iceland 0.01% X 40% By 2030 Below 1990
India 5.61% X Conditional: 33% to 35% emission intensity improvement; renewable energy to increase to 40% of total power capacity and an additional carbon sink of 2.5 to 3 Mt CO2eq through additional forest and tree cover
By 2030 Below 2005
Indonesia 1.46% X 29% (conditional: 41%) By 2030 Below BAU
Israel 0.16% X 26% By 2030 Below 2005
Japan 2.76% X 26% By 2030 Below Fiscal year 2013
Jordan 0.05% X 1.5% (conditional: 14%) By 2030 Below BAU
Kazakhstan 0.68% X 15% (conditional: 25%) By 2030 Below 1990

232 Overview of the mitigation contribution of submitted INDCs |
TWO
TWO
Country/party Share GHG emissions 20121)
Included in the analysis2
GHG emission reduction target3
Kenya 0.10% X Conditional: 30% By 2030 Below BAU
Kiribati <0.01% 12.8% (13.7% by 2025) By 2030 (By 2025)
Below BAU
Kyrgyzstan 0.03% 11.49% to 13.75% (conditional: 29% to 30.89%) (also includes 2050 goals)
By 2030 Below BAU
Lao People’s Democratic Republic
0.30% X No explicit target for emission reduction - -
Lebanon 0.04% X 15% (conditional 30%) By 2030 Below BAU
Lesotho 0.01% X 10% (conditional 35%) By 2030 Below BAU
Liberia 0.01% Conditional 15% By 2030 Below BAU
Liechtenstein <0.01% 40% By 2030 Below 1990
Madagascar 0.22% X 14% emission sinks enhanced by 32% By 2030 Below BAU
Malawi 0.04% X No explicit target for emission reduction - -
Maldives <0.01% 10% (conditional: 24%) By 2030 Below BAU
Mali 0.14% X 27% (29% from agriculture, 31% from energy and 21% from LULUCF)
By 2030 Below BAU
Marshall Islands <0.01% 32% (indicative: 45% below 2010 levels by 2030) By 2025 Below 2010
Mauritania 0.02% 22.3% (33.6 MtCO2eq) of which 88% conditional By 2030 Below BAU
Mauritius 0.01% Conditional: 30% By 2030 Below BAU
Mexico 1.24% X 22% (conditional: 36%), emissions peaking after 2026
By 2030 Below BAU
Monaco <0.01% 50% By 2020 Below 1990
Mongolia 0.05% List of policies and measures - -
Montenegro <0.01% 30% (preliminary target; could revisit after AFOLU rules agreed)
By 2030 Below 1990
Morocco 0.20% X 13% (conditional: 32%) By 2030 Below BAU
Mozambique 0.71% X No explicit target for emission reduction - -
Myanmar 0.99% X REDD+ goals otherwise not quantified - -
Namibia 0.07% X Conditional: 89% By 2030 Below BAU
New Zealand 0.15% X 30% By 2030 Below 2005
Niger 0.02% 3.5% by 2030 and 2.5% by 2020.Conditional: 25% by 2020, 34.6% by 2030.
By 2030 Below BAU
Norway 0.12% X At least 40% By 2030 Below 1990
Oman 0.12% X 2% By 2030 Below BAU
Papua New Guinea 0.02% No explicit target for emission reduction - -
Paraguay 0.09% 10% to 20% By 2030 Below BAU
Peru 0.14% X 20% (conditional: 30%) By 2030 Below BAU
Philippines 0.31% X Conditional: 70% By 2030 Below BAU
Republic of Korea (South Korea)
1.25% X 37% By 2030 Below BAU
Republic of Moldova 0.02% X 64% to 67% (conditional: 78%) By 2030 Below 1990
Russian Federation 5.24% X 25% to 30% By 2030 Below 1990
Rwanda 0.01% No explicit target for emission reduction - -
Samoa <0.01% No explicit target for emission reduction - -

24 | Assessing Intended Nationally Determined Contributions to the Paris Climate Agreement
TWO
Country/party Share GHG emissions 20121)
Included in the analysis2
GHG emission reduction target3
San Marino <0.01% 20% By 2030 Below 2005
Sao Tome and Principe
<0.01% 24% By 2030 Below 2005
Senegal 0.09% 5% (conditional: 21%) (with targets for 2020 and 2025)
By 2030 Below BAU
Serbia 0.13% X 9.8% By 2030 Below 1990
Seychelles <0.01% X 29% (21.4%) By 2030 (2025)
Below BAU
Sierra Leone 0.02% No explicit target for emission reduction - -
Singapore 0.10% X Reduce emission intensity by 36%, emissions peaking around 2030
By 2030 Below 2005
Solomon Islands 0.01% 45% (27%) By 2030 (2025)
Below BAU
South Africa 0.84% X By 2025 and 2030, emissions will be in a range between 398 and 614 MtCO2eq, peaking between 2020 and 2025
By 2030 Below BAU
Sri Lanka 0.06% No explicit target for emission reduction By 2030 Below BAU
Suriname <0.01% No explicit target for emission reduction By 2025 Below BAU
Swaziland 0.01% No explicit target for emission reduction By 2030 -
Switzerland 0.10% X 50% By 2030 Below 1990
Tajikistan 0.03% 10% to 20% By 2030 Below 1990
Thailand 0.82% X 20% (conditional: 25%) By 2030 Below BAU
Togo 0.04% 11.14% to 31.14% By 2030 Below BAU
Trinidad and Tobago 0.11% X 30% in public transport; plus conditional 15% in power generation, transport and industrial sectors
By 2030 Below BAU
Tunisia 0.07% 13% decrease in carbon intensity (conditional: 41%; for energy sector 46%)
By 2030 Below 2010
Turkey 0.83% X 21% By 2030 Below BAU
Turkmenistan 0.17% X No explicit target for emission reduction - -
Uganda 0.15% X Conditional 22% By 2030 Below BAU
Ukraine 0.76% X 60% By 2030 Below 1990
United Arab Emirates
0.38% X List of policies and measures, including an increase of renewable energy to 24% of the total energy mix by 2021
By 2021 and 2030
Below BAU
United Republic of Tanzania
0.44% X Conditional 10% to 20% By 2030 Below BAU
Uruguay 0.06% X A list of sectorial targets sorted by GHG gas - -
United States of America
11.85% X 26% to 28% By 2025 Below 2005
Vanuatu <0.01% Conditional: 30% reduction in energy sector, 15% in all other sectors except agriculture and forestry (100% renewables for electricity)
By 2030 Below BAU
Vietnam 0.58% X 8% (conditional: 25%) By 2030 Below BAU
Zambia 0.60% X Conditional: 47% By 2030 Below 2010
Zimbabwe 0.13% X 33% By 2030 Below BAU
Total share 90% 89%
1) Including emissions from international transport. Source: EC-JRC EDGAR (JRC & PBL, 2012).2) Covered in the analysis of this report (together representing 89% of global 2012 emissions). Other countries are not included in this
analysis because of too much uncertainty in the quantification of their INDCs, or because their 2012 emission share was less than 0.1%.3) As submitted to http://www4.unfccc.int/submissions/indc/Submission%20Pages/submissions.aspx (UNFCCC, 2015)
252 Overview of the mitigation contribution of submitted INDCs |
TWO
TWO
Table 2.2Summary of the unconditional and conditional mitigation targets for 2025 and 2030, as stated in the INDCs of the G20 countries
G20 Country/party* Unconditional INDC target (Conditional INDC target)
base year/emission level (MtCO2eq)
Emission target (MtCO2eq)8,9 based on calculations of this study
2025 2030 2025 2030
Argentina - -15% (-30%) BAU 2030 6701 - 570 (469)
Australia - -26% to -28% 2005 6012 - 433 to 445
Brazil -37% -43% 2005 2,1001 1,300 1,200
Canada - -30% 2005 7492 - 524
China - CO2 emission peak around 2030; 60% to 65% CO2 emission intensity reduction; 20% non-fossil fuels in primary energy consumption & increase of the forest stock volume
2005 7,0383 - 13,9574
[12,602; 16,835]5
EU28 - -40% 1990 5,6262 - 3,376
India - Conditional: 33% to 35% emission intensity reduction; 40% non-fossil fuel electricity; Increase of carbon sink volume
2005 1,8093 - 4,1684
[4,168; 6,733]7
Indonesia - -29% (-41%) BAU 2030 2,8811 - 2,046 (1,700)
Japan - -26% Fiscal Year 2013
1,4082 - 1,042
Mexico - -22% (-36%) BAU 2030 9731 - 759 (623)
Russian Federation - -25% to -30% 1990 3,3632 - 2,354 to 2,523
South Africa - - BAU 2030 - 398 to 6141 398 to 6141
Rep. of Korea - -37% BAU 2030 8511 - 536
Turkey - -21% BAU 2030 1,1751 - 928
United States -26% to -28%
- 2005 6,4392 4,636 to 4,765 (3,992 to 4,121)6
*) The country-specific emission levels stated above include all greenhouse gas emissions from energy, industry and services, as well as emissions and removals from activities related to land use, land-use change and forestry (LULUCF) for the following countries: the United States, Turkey, Mexico, Indonesia, Brazil, India, China, Australia, and Argentina. The land-use emissions and removals from the remaining countries were aggregated as part of the global estimates on effects of land-use emissions and removals.
1) Source: http://www4.unfccc.int/submissions/indc/Submission%20Pages/submissions.aspx.2) Source: national inventories, UNFCCC, including Common Reporting Formats (2015).3) Source: energy-related CO2 emissions from IEA (2013a), non-energy-related emissions from EDGAR 4.2 (JRC and PBL, 2012) and
LULUCF. emissions from FAOSTAT data (http://faostat3.fao.org/faostat-gateway).4) For China and India the combined effect of emission intensity targets, non-fossil targets and afforestation targets was calculated
using the PBL TIMER energy model and the IIASA GLOBIOM/G4M models. Based on these calculations, greenhouse gas emissions in 2030 (including LULUCF) are projected at 13,957 MtCO2eq for China and 4,168 MtCO2eq for India (for China, see details in Den Elzen et al., 2015).
5) The effect of China’s CO2 intensity target was calculated using annual GDP growth rates of 4.3% to 6.3% between 2021 and 2030 (as based on WEO 2014 and PBL model estimates). Hence the range in projected emissions.
6) The emission target for the United States for 2030 was estimated by extrapolating the 2025 emission level (calculated from the INDC) towards the 2050 emission level as based on the national long-term target (reducing emissions by 83% below 2005 levels by 2050, as is also described in the INDC).
7) The lower end of the range includes the effects of India’s greenhouse gas intensity target, the non-fossil electricity target, as well as the carbon sink target. The upper end of the range only includes the effect of the greenhouse gas intensity target.
8) Calculated emission levels do not account for LULUCF carbon credits.9) Successful implementation of the INDCs is contingent upon an ambitious global agreement including additional means of
implementation to be provided by developed country parties, technology transfer and capacity building following Articles 3.1 and 4.7 of the Convention.
26
THRE
E
| Assessing Intended Nationally Determined Contributions to the Paris Climate Agreement
Global impact of the INDCs
3.1 What are the projected global greenhouse gas emission levels by 2030 if all INDCs are implemented?
To estimate the aggregate effect of INDCs on global emission levels, we distinguished two scenarios: one in which only the unconditional targets are implemented (‘the unconditional INDC scenario’), and one in which both unconditional and conditional targets are implemented (‘the conditional INDC scenario’). For countries whose INDC included unconditional targets only, we assumed that their emission level would be the same in both the unconditional and conditional scenarios. For countries whose INDC included only conditional targets, we assumed current policies emission levels (based on Den Elzen et al., 2015; Roelfsema et al., 2013), or, if not available, PBL business-as-usual levels when calculating total global emissions in the unconditional scenario.Secondly, we assumed that emission levels of countries that had not submitted an INDC by 29 October 2015 would either follow current policies emission levels (Den Elzen et al., 2015; Roelfsema et al., 2013) or PBL business-as-usual levels based on the OECD Environmental Outlook (OECD, 2012). Total global emissions were calculated by adding international aviation emissions (ICAO, 2013) and international shipping emissions (IMO, 2014) (both harmonised to EDGAR 2010 emissions) and LULUCF emissions based on various sources (including FAOSTAT, national communications and model projections)1 for those countries whose INDC did not address LULUCF. The resulting global emission level in 2010 is estimated at 45.9 GtCO2eq, which is about 2 GtCO2eq lower than the 47.8 GtCO2eq estimated from the total sum of global greenhouse gas emissions (excluding LULUCF CO2) from the EDGAR database (JRC/PBL, 2012) and the global LULUCF CO2 emissions from FAOSTAT. Both sources were used for historical greenhouse gas emissions. Therefore,
global emission projections were harmonised to the 2010 emission level of 47.8 Gt CO2eq, using a constant harmonisation factor over time from 2010 onwards. The difference between the global emission estimates is completely due to differences in the estimates for LULUCF emissions: the EDGAR data base reports higher LULUCF emissions than the estimates from FAOSTAT and national communications (see Chapter 11, IPCC Fifth Assessment Report).
Table 3.1 presents global and national greenhouse gas emissions in 2030, as projected from the submitted INDCs. As these projections show, global emissions will keep increasing until at least 2030, even if all INDCs are fully implemented. The projected global emission level in 2030 is about 56 (55–60) GtCO2eq if all unconditional INDCs are implemented, and about 54 (52–58) GtCO2eq if the conditional INDCs are implemented as well. The median estimates are 13 – 18% above 2010 emission levels. The range in these estimates is a result of the uncertainties in the INDC projections for Australia, the Russian Federation, South Africa, the United States, China and India.
The aggregate effort proposed by the INDCs is shown by comparing the 2030 global emission level projected for the INDCs with the 2030 global emission level projected for the PBL business-as-usual scenario (Box 3.1) and the current policies scenario2, based on Den Elzen et al. (2015) and Roelfsema et al. (2013). The first comparison gives an indication of the total effort proposed relative to business-as-usual scenarios. This effort is projected at 9 to 11 GtCO2eq globally by 2030. The second comparison gives an indication of the effort proposed in addition to already implemented climate policies; this additional effort is projected at 3 to 5 GtCO2eq globally by 2030.
Although most of the individual INDCs are projected to lead to a decrease in national emission levels before 2030, compared to their current policies scenario (largely due to accelerated decarbonisation after 2020), total

273 Global impact of the INDCs |
THRE
E
THREE
Table 3.1Greenhouse gas emissions in G20 countries and global emission levels, projected for 2030 for the PBL business-as-usual scenario, the current policies scenario, the unconditional INDC scenario and the conditional INDC scenario (the effect of INDCs of non-G20 countries is covered in the category ‘other countries’)
Greenhouse gas emissions, including LULUCF (MtCO2eq)1
PBL BAU scenario
PBL current policies
scenario3
Unconditional INDC
scenario
ConditionalINDC
scenario
G20 countries 19902 20102 2030 2030 2030 2030
Argentina6 320 374 479 479 570 469
Australia7 555 560 708 666 43910
[433; 445] 43910
[433; 445]
Brazil6 1,611 1,688 2,062 1,524 1,200 1,200
Canada 613 707 796 671 524 524
China6 3,254 10,130 15,914 14,646 13,95710
[12,602; 16,835] 13,95710
[12,602; 16,835]
EU28 5,626 4,751 4,992 3,992 3,376 3,376
India6 1,180 2,379 5,374 4,739 4,739[4,168; 6,733]
4,16810
[4,168; 6,733]
Indonesia6 1,063 2,059 2,516 2,094 2,046 1,700
Japan 1,234 1,258 1,310 1,105 1,042 1,042
Mexico7 559 748 976 843 759 623
Russian Federation 3,363 2,221 2,342 2,174 2,43810,13
[2,354; 2,523] 2,43810,13
[2,354; 2,523]
South Africa 380 515 747 700 50610
[398 ; 614] 50610
[398 ; 614]
South Korea 289 629 673 545 536 536
Turkey7 144 346 675 545 928 928
United States7 5,402 5,907 6,447 5,572 4,05610
[3,992; 4,121] 4,05610
[3,992; 4,121]
Other countries5 6,223 9,172 14,766 14,895 14,861 13,769
Remaining LULUCF CO2 emissions8 2,596 1,385 657 657 657 657
International marine & aviation emissions4
678 1,117 1,792 1,792 1,792 1,792
Harmonisation factor9 173 1,811 1,811 1,811 1,811 1,811
World, harmonised11 35,265 47,757 65,032 59,339 56,235[54,613; 60,091]
53,990[52,368; 58,416]
Excluding the impact of new surplus emissions12
-1,083 -797
World, harmonisedexcl. hot air
55,152[53,614; 58,214]
53,193[51,655; 56,825]
1) The country-specific emission levels stated above include all greenhouse gas emissions from energy, industry and services, as well as emissions and removals from activities related to land use, land-use change and forestry (LULUCF) for the following countries: the United States, Turkey, Mexico, Indonesia, Brazil, India, China, Australia, and Argentina. The land-use emissions and removals from the remaining countries were aggregated as part of the global estimates on effects of land-use emissions and removals. Only including LULUCF CO2 emissions in countries with a high share of land-use emissions in their total emissions (including emissions from peatlands) and countries that explicitly addressed LULUCF in their INDC.
2) Source: Historical emissions in China, India and Indonesia are based on energy-related emissions (IEA, 2013), non-energy-related emissions (EDGAR 4.2, http://edgar.jrc.ec.europa.eu/overview.php?v=42FT2012#) (JRC/PBL, 2012) and LULUCF emissions (FAOSTAT). Historical emissions from other countries are based on UNFCCC national inventory submissions or the INDC submissions. Business-as-usual emissions are based on the OECD Environmental Outlook (OECD, 2012) as calculated by the IMAGE modelling framework.
3) Emission projections for the current policies scenario are based on Roelfsema et al. (2013) and Den Elzen et al. (2015).4) Source: EDGAR 4.2 history, http://edgar.jrc.ec.europa.eu/overview.php?v=42FT2012#, and ICAO and IMO projections from 2010
through 2030.5) Source: EDGAR 4.2 history, http://edgar.jrc.ec.europa.eu/overview.php?v=42FT2012#, and IMAGE projections from 2010 through
2030. This category covers the INDCs of non-G20 countries.6) LULUCF source: FAOSTAT history, http://faostat3.fao.org/download/G2/*/E, and IIASA projections from 2010 through 2030.7) LULUCF source: national communications as reported in the UNFCCC national inventory submissions.
28 | Assessing Intended Nationally Determined Contributions to the Paris Climate Agreement
THRE
E
global emissions are still projected to increase until 2030. Interestingly, INDC emission levels of some countries are projected to be higher than their current policy emission levels or business-as-usual emission levels (in our analysis, this is the case for Argentina, Chile, Ghana, Kazakhstan, Lebanon, Peru, Russian Federation, Turkey, Ukraine and Vietnam). If for these countries we assume current policy emission levels rather than INDC emission levels, total global emissions in the INDC scenario would be 1 (0–2) GtCO2eq lower by 2030: 55 GtCO2eq (54–58) for the unconditional INDCs and 53 GtCO2eq (52–57) if the conditional INDCs are implemented as well (Table 3.1).
Our global emission projections for the INDC scenarios (Table 3.1) are surrounded with considerable uncertainties, as for some of the INDCs precise estimates are not possible. For instance, emission levels of countries with per capita or per GDP intensity targets (such as China and India) strongly depend on future GDP and population trends, which are subject to large uncertainties. Furthermore, we assumed that emissions in sectors not explicitly covered in the INDCs follow the current policies trend, which may have led to an overestimation of the projected emission levels. Finally, our calculations do not account for credits or debits from LULUCF accounting rules, because there is too much uncertainty on which rules will be applied, and specific LULUCF information and projections are often lacking. The presented ranges are an attempt at quantifying the above uncertainties. The largest uncertainty is due to the dependence of China’s emissions on economic growth: a 1% change in this country’s average annual economic growth would already result in a target emission level change of approximately 2.5 GtCO2eq.
3.2 What is the projected impact of the INDCs on reducing the global 2 ˚C emission gap by 2030?
Global emission levels consistent with a likely chance of staying below the 2 °C climate target are projected at 42 (30–44) GtCO2eq for the year 2030 (median and 20th – 80th percentile range presented in the UNEP Gap report, 2014). In December 2014, the Lima Call for Climate Action noted a significant gap between the aggregate effect of the pledges for 2020 and the above-mentioned emission level required to meet the 2 °C target. This report analyses the aggregate effect of the submitted INDCs on narrowing this global 2 °C emission gap.
Based on our calculations, implementation of the unconditional INDCs is projected to result in global emission levels of approximately 56 (55–60) GtCO2eq in 2030 (Figure 3.1 and Table 3.2), leaving a gap of 14 (13–18) GtCO2eq relative to the median emission level required in 2 °C scenarios. According to our projections, this gap will be 2 GtCO2eq smaller if the conditional INDCs are implemented as well, leaving a remaining gap of 12 (10–16) GtCO2eq. Assuming business-as-usual or current policy scenario emission levels for countries whose INDCs are projected to lead to surplus emissions (see Table 3.1, Footnote 12), the emission gap would be further reduced by 1 GtCO2eq, to a level of approximately 11 (10–15) GtCO2eq by 2030.
8) LULUCF source: FAOSTAT history, http://faostat3.fao.org/download/G2/*/E, and IIASA projections from 2010 through 2030, except for Canada, the EU28, Japan, the Russian Federation and South Korea. For these regions we used data from national communications.
9) Global emission projections are harmonised to the 2010 emission level of 47.8 GtCO2eq (See Section 3.1).10) For the INDC reduction target ranges of the United States (26% to 28%) and Australia (26% to 28%) we assumed an average
reduction of 27%, and for the Russian Federation (25% to 30%) an average reduction of 27.5%. For South Africa we assumed an average emission level of 506 MtCO2eq in 2030, based on the target range in its INDC. For China and India the combined effect of emission intensity targets, non-fossil targets and afforestation targets was calculated using the PBL TIMER energy model and the IIASA GLOBIOM/G4M models. Based on these calculations, 2030 emission levels (including LULUCF) of these countries are projected at 13,957 MtCO2eq and 4,168 MtCO2eq, respectively (for China, see details in Den Elzen et al., 2015). For India, the upper end of the INDC range is limited to the upper end of the current policies emission level.
11) Emission projections for the INDCs do not account for national LULUCF carbon credits, and are not corrected for possible double counting or surplus emission units. All greenhouse gas emissions in this report refer to emissions relevant under the Kyoto Protocol (Annex A), i.e. the global warming potential-weighted sum of the six Kyoto greenhouse gases (CO2, CH4, N2O, HFCs, PFCs and SF6), with the exception of emissions from LULUCF.
12) Surplus emissions may arise if the emission levels projected from INDCs are above the emission levels in the current policies scenario. In our analysis, INDCs of the following countries are projected to lead to surplus emissions: Argentina, Chile, Ghana, Kazakhstan, Lebanon, Peru, Russian Federation, Turkey, Ukraine and Vietnam.
13) LULUCF emissions not covered by INDCs were aggregated in the ‘Remaining LULUCF CO2 emissions’.

293 Global impact of the INDCs |
THRE
E
THREE
Box 3.1 PBL business-as-usual (BAU) projectionsOur assessment makes use of the PBL/IIASA business-as-usual (BAU) projections for energy and emissions of all Kyoto greenhouse gases, except CO2 emissions from land-use change. These projections are an update of the business-as-usual scenario in the OECD Environmental Outlook (OECD, 2012), and were calculated using the PBL energy model TIMER (Van Vuuren et al., 2014) and the PBL land-use model IMAGE (Stehfest et al., 2014), based on GDP projections of the OECD (2012). Data on CO2 emissions from LULUCF (e.g. deforestation) were based on the IIASA forestry model G4M (Kindermann et al., 2008). The resulting projections were harmonised to historical 1990–2010 emission data from the UNFCCC National Inventory Submissions (Common Reporting Format Tables) for those countries for which this information is available; for other countries, data were derived from the EDGAR database (JRC/PBL, 2012) and the National Communications. Modelling was done on the scale of 26 IMAGE world regions. For countries not covered by a single IMAGE region, a downscaled baseline was used (Van Vuuren et al., 2007b). In this study this applies to Australia, Argentina, South Korea and Turkey.
The PBL business-as-usual scenario serves as a baseline, aiming to describe a plausible trajectory for emissions given medium population and income projections and assuming that no new climate policies are introduced after 2004. The PBL business-as-usual scenario only includes national domestic energy policies as implemented before 2010. The projections are based on the GDP projections by the OECD ENV-Linkages model (Burniaux and Chateau 2010) developed for the OECD Environmental Outlook (OECD 2012). Furthermore, the scenario assumes the UN medium population growth trajectory (OECD 2012).
Figure 3.1
1990 2000 2010 2020 2030
0
20
40
60
80Gt CO2 eq
Source: PBL FAIR/TIMER model; IIASA GLOBIOM/G4M model; UNEP 2014
pbl.n
l
Emissions including land use
History
Business-as-usual scenario (PBL)
Current policies
PBL best estimate
Uncertainty range
Pledges
INDCs
Unconditional (PBL best estimate)
Conditional (PBL best estimate)
Conditional excluding surplus emissions
Uncertainty range
Emission levels consistent with the 2 °C target (UNEP, 2014)
Median
Uncertainty range
Impact of INDCs and climate policies on global greenhouse gas emissions
The global 2 °C emission gap is defined as the difference between the 2030 emission levels that would be consistent with keeping global warming below 2 °C (UNEP, 2014) and the 2030 emission levels that would result from implementation of the INDCs. Emission levels in the PBL business-as-usual scenario (which assumes that no new policies will be implemented after 2004) are based on PBL/IIASA model calculations; emission levels in the current policies scenario are based on Den Elzen et al. (2015). Historical global greenhouse gas emissions (excluding LULUCF) are based on EDGAR (JRC/PBL, 2015); historical LULUCF emissions on FAOSTAT (2015).

30 | Assessing Intended Nationally Determined Contributions to the Paris Climate Agreement
THRE
E
Table 3.2Global impact of INDCs on reducing the global 2̊ C emission gap by 2030
Emissions (Gt CO2eq) 2030 value Emission gap1 from 2 °C
2 °C pathway (UNEP, 2014 median estimate) 42 -
PBL current policies scenario 59 (58–65) 17 (16–23)
PBL business-as-usual scenario 65 23
2030 value Reduction relative to BAU
Reduction relative to current policies
Emission gap1 from 2 °C
Unconditional INDC scenario 56 (55–60) 9 (5–10) 3 (0–5) 14 (13–18)
Conditional INDC scenario 54 (52–58) 11 7–13) 5 (1–7) 12 (10–16)
Conditional INDC scenario (excluding surplus emissions)2
53 (52–57) 12 (8–13) 6 (3–8) 11 (10–15)
1) The emission gap is defined as the difference between the emission levels projected for BAU/current policies/INDCs and the median emission level required to meet the 2 °C target. The ranges in the emission gap are a result of the range in expected emission levels from the current policies and the INDCs, as shown in Figure 3.1. Here, the range in INDC emission levels reflects the ranges in INDC emission levels projected for Australia, the Russian Federation, the United States, China and India.
2) Excluding the potential impact of surplus emissions in countries where achieving INDC targets is projected to lead to higher emissions than the current policy trajectory. In our analysis, this is the case for Argentina, Chile, Ghana, Kazakhstan, Lebanon, Peru, Russian Federation, Turkey, Ukraine and Vietnam (See Section 3.1)
3.3 What is the projected impact of the INDCs on emissions and removals from land use, land-use change and forestry (LULUCF) in the context of high uncertainties?
Of the 156 Parties (including the EU28 Member States) that submitted an INDC by 29 October 2015, 95 countries explicitly state that emissions and removals from land-use activities are included in their mitigation component (see Annex I). However, only 36 of these 95 INDCs provide quantifiable details of measures or specific targets for the LULUCF sector. Furthermore, 42 INDCs explicitly state that LULUCF emissions and removals are not included but nevertheless propose measures or policies to reduce LULUCF emissions. The remaining 19 INDCs state that LULUCF emissions and removals are not covered and do not propose measures or policies for reducing LULUCF emissions (see Annex I for more information).There is high uncertainty on the historical levels of emissions and removals, as well as on the projections of future emissions and removals. There is also partial information in the INDCs on how INDCs will address these emission sources.Taking into account these uncertainties, we could estimate that the full implementation of all unconditional and conditional INDCs would decrease net LULUCF emissions in 2030, compared to national business-as-usual projections. By contrast, under national business-as-usual scenarios and independent baseline scenarios, it is expected that net LULUCF emissions would increase
by 2030. This shows that implementing INDCs is important for addressing these emission sources. However, the quantified impacts of the INDCs on these emissions and removals is sensitive to the data and methodologies used.The aggregate impact of these 95 INDCs on LULUCF emissions is shown in Figure 3.2, which compares LULUCF CO2 emissions as projected for these INDCs to emission levels as projected for the national business-as-usual scenario. Both the national business-as-usual and INDC projections are based on data provided in the INDCs, complemented with information from National Communications where needed. (see Annex I for more information as to how the national business-as-usual and INDC projections were constructed).According to our calculations, full implementation of these 95 INDCs would decrease LULUCF emissions by 2.6 GtCO2eq in 2030 compared to national business-as-usual projections. Compared to historical emissions, implementation of the INDCs would lead to a reduction in LULUCF emissions, whereas in the national business-as-usual scenario LULUCF emissions are projected to increase (Figure 3.2).
Figure 3.3 shows the absolute net LULUCF emission reductions projected from INDCs of the G20 countries, compared to the national business-as-usual LULUCF emission levels. The largest absolute LULUCF net emission reductions are expected in Brazil and Indonesia, followed by the United States, China, Ethiopia, Gabon and Democratic Republic of the Congo. The INDCs of the Russian Federation and, to a lesser extent, Switzerland and Colombia are expected to result in an increase in net

313 Global impact of the INDCs |
THRE
E
THREE
Figure 3.2
1990 2000 2010 2020 2030
0
1
2
3
4Gt CO2
Source: IIASA
pbl.n
l / ii
asa.
ac.a
t
History
National business-as-usual scenario(INDC / National Communications)
Implementation of INDCs
Global CO2 emissions from land use
LULUCF emissions expected to result from INDC implementation, compared to national business-as-usual projections based on official national data as provided in the INDCs and National Communications (in other words, not based on the PBL business-as-usual development). (see Annex I for further details).
Figure 3.3
2020 2030-0.5
0.0
0.5
1.0
1.5
2.0
2.5
3.0Reduction compared to business-as-usual scenario (Gt CO2 eq)
Source: National Communications/ INDCs
pbl.n
l / ii
asa.
ac.a
t
Chile
Costa Rica
Norway
Morocco
EU28
New Zealand
South Africa
Australia
Japan
Mexico
India
Democratic Republic of the Congo
Gabon
Ethiopia
China
United States
Indonesia
Brazil
Russian Federation
Switzerland
Colombia
Reduction in national greenhouse gas emissions from land use
Positive numbers indicate emission reductions, negative numbers indicate emission increases.

32 | Assessing Intended Nationally Determined Contributions to the Paris Climate Agreement
THRE
E
LULUCF emissions. The impact of these increased net LULUCF emissions on INDC targets for overall emission reduction is highly dependent on the way in which changes in LULUCF emissions will be accounted for. For example, the projected increase in Russia’s LULUCF emissions of approximately 150 MtCO2eq in 2030 is directly related to intensification of forest management. More details on country-level LULUCF reductions are provided in Box 3.2.It should be noted that only 36 countries have put forward quantifiable information regarding national business-as-usual LULUCF emission projections and accounting rules to be applied for the LULUCF sector. Hence, it should be kept in mind that the uncertainties surrounding the projected net LULUCF emission reductions are large. The projected increase in LULUCF emissions in the Russian Federation, Colombia and
Switzerland are all based on the data as provided in these countries’ National Communications, because their INDCs do not provide estimates of future greenhouse gas emissions in the LULUCF sector.It should also be noted that the business-as-usual net LULUCF emission projections are derived from data provided in the INDCs and/or National Communications, i.e. not from the PBL business-as-usual development. For some countries, the projected national business-as-usual net LULUCF emissions are not entirely consistent with the projected PBL business-as-usual net LULUCF emissions. This inconsistency is observed for Brazil, China and Indonesia, and is directly related to the definition of the baseline. On a global level, the national business-as-usual projection of net LULUCF emissions in 2030 is roughly 450 MtCO2eq higher than the PBL business-as-usual projection.
Box 3.2 Countries’ contributions to LULUCF emission reductions and construction of national baseline and INDC scenarios.
The INDC of Australia does not provide LULUCF emission projections for the business-as-usual scenario nor the INDC scenario. Consequently, our assessment is based on the business-as-usual scenario as reported in the 6th National Communication (Australian Government, 2013), updated according to 2015 UNFCCC reporting of CRF tables. Our LULUCF projections for the INDC scenario are based on the analysis of the Australian Department of the Environment, which indicates that LULUCF related emissions can be decreased by 28 MtCO2eq through sequestration efforts supported by the Australia’s Emission Reduction Fund (Department of Environment, 2015). If the emission reduction as estimated in the INDC scenario is achieved, the LULUCF sector would become a net sink by 2030, instead of a net source of emissions by 2010 in the business-as-usual scenario. These projections (for both the business-as-usual and the INDC scenario) do not account for emissions/removals from natural disturbances.
The INDC of Brazil covers the LULUCF sector but does not provide LULUCF emission projections for the business-as-usual scenario nor the INDC scenario. Furthermore, this INDC does not account for removals within the LULUCF sector, but does contain a list of future mitigation measures in the LULUCF sector (e.g. zero illegal deforestation by 2030). Our estimate of the INDC mitigation potential is based on the recent REDD-PAC project report (Report REDD-PAC, 2015), which provides a baseline and a scenario with reduction measures for the LULUCF sector as estimated by bottom-up land-use models. To the extent of our knowledge the LULUCF data in the REDD-PAC report is consistent with the data provided in the INDC submission. Implementation of Brazil’s INDC is estimated to lead to emission reductions of approximately 500 MtCO2eq by 2020 and 780 MtCO2eq by 2030, compared to the national business-as-usual scenario. Even if the full emission reduction potential of the INDC measures would be achieved, the LULUCF sector would still be a net source of emissions in 2030.
The INDC of China does not provide LULUCF emission projections for the business-as-usual scenario nor the INDC scenario, but does propose future mitigation measures aimed specifically at the LULUCF sector. The 2nd National Communication (Government of China, 2012) also does not provide a business-as-usual scenario. Therefore, our assessment assumes that business-as-usual LULUCF emissions stay constant over time, at the level of 2005 (-421 MtCO2eq). Furthermore, China’s INDC states that the forest stock in China will be increased by 4.5 billion m3 by 2030, compared to the 2005 level. The mitigation potential of this measure is estimated to be approximately 96 MtCO2eq in 2020 and 165 MtCO2eq in 2030, compared to the LULUCF business-as-usual level in 2005. This estimate is based on the assumption of a linearly increasing build-up of the forest area and biomass stock over time and of a wood stock density of about 4 tons of biomass carbon per cubic meter.

333 Global impact of the INDCs |
THRE
E
THREE
The INDC of the Democratic Republic of the Congo covers the LULUCF sector, and also includes LULUCF emission projections up to 2030 for both the business-as-usual and INDC scenario. In the business-as-usual scenario as provided by the INDC, LULUCF emissions increase from 100 MtCO2eq in 2010 to roughly 400 MtCO2eq by 2030. The largest changes in LULUCF emissions as a result of INDC implementation are expected to occur after 2020, resulting in emission reductions of approximately 100 MtCO2eq in 2030 when compared to business-as-usual projections. The INDC states that this reduction in LULUCF emissions will mainly be achieved through afforestation and reforestation measures.
The INDC of Ethiopia provides LULUCF emission projections up to 2030, for both the business-as-usual and INDC scenario. The mitigation measures proposed by the Ethiopian government include protection of forest areas, re-establishment of forest, and an increase of carbon stocks. According to the INDC, implementation of these measures is estimated to lead to emission reductions of approximately 65 MtCO2eq in 2020 and 130 MtCO2eq in 2030, compared to business-as-usual levels. If these reductions are indeed achieved, Ethiopia’s LULUCF sector would become a net carbon sink by 2030, instead of a net source of emissions by 2010 in the business-as-usual scenario.
The INDC of Gabon covers the LULUCF sector and also includes business-as-usual emission projections for the LULUCF sector. The mitigation potential for Gabon is expected to slightly increase over time, from 95 MtCO2eq in 2020 to 102 MtCO2eq in 2030, compared to business-as-usual projections. However, there is an inconsistency between historical LULUCF emissions as reported in the INDC (80 MtCO2eq in 2000) and historical LULUCF emissions as reported in the 2nd National Communication (Government of Gabon, 2011) (-64 MtCO2eq in 2000).
The INDC of India does not provide LULUCF emission projections for the business-as-usual scenario nor the INDC scenario. However, the INDC does mention future mitigation measures in the LULUCF sector (e.g. afforestation). Business-as-usual LULUCF emission levels are neither provided in the 2nd National Communication (Govern-ment of India, 2012). Therefore, our assessment assumes that business-as-usual LULUCF emissions stay constant over time, at the emission level of 2007 (-175 MtCO2eq) as reported in India’s 2nd National Communication. Furthermore, based on the mitigation strategies and potentials as described in the 2014 report of the Planning Commission of the Government of India (2014), we estimated the INDC mitigation potential of India at 31 MtCO2eq in 2020 and 53 MtCO2eq in 2030, compared to the business-as-usual LULUCF emission level of 2007. Implementation of India’s INDC would further increase the net sink effect of this country’s LULUCF sector.
The INDC of Indonesia covers the LULUCF sector but does not provide LULUCF projections for the business-as-usual scenario nor the INDC scenario. However, we were able to construct LULUCF projections for both scenarios based on publically available information in supporting documents3. It should be noted that our projections (for both scenarios) do take into account emissions from peat fires. According to Indonesia’s INDC, the government will focus on mitigation actions such as ecosystem conservation and restoration, coastal zone protection, and reduction of forest degradation and deforestation. As a result, INDC implementation is estimated to lead to LULUCF emission reductions of approximately 336 MtCO2eq by 2020 and 672 MtCO2eq by 2030, compared to the business-as-usual LULUCF emissions. Overall, this implies that the LULUCF sector would still be a net source of LULUCF emissions in 2030.
The INDC of Japan does not provide LULUCF projections for the business-as-usual scenario nor the INDC scenario. Business-as-usual LULUCF emission levels are neither provided in the 6th National Communication (Government of Japan, 2013). Consequently, our assessment assumes that business-as-usual LULUCF emissions stay constant over time, at the level of 2010 as updated according to 2015 UNFCCC reporting of CRF tables (-69 MtCO2eq). Japan’s INDC does provide an emission reduction target for the LULUCF sector by 2030, stating that LULUCF emissions will be reduced by 37 MtCO2eq in 2030 compared to the emission level in 2010. This implies that the LULUCF emission reduction by 2020 would be around 12 MtCO2eq. According to the INDC, approximately 75% of this reduction will be based on forest carbon sinks measures while the remaining 25% will be the result of cropland management, grazing land management and revegetation.

34 | Assessing Intended Nationally Determined Contributions to the Paris Climate Agreement
THRE
ENotes
1 LULUCF emissions from 1990 to 2030 were calculated using
various sources: national communications, FAOSTAT and
the IIASA G4M model. More details are provided in the
footnotes to Table 3.1.
2 These studies took into account the impact of the most
effective current and planned policies on greenhouse gas
emissions, as estimated by Ecofys & NewClimate Institute,
IIASA and PBL (Den Elzen et al., 2015; Roelfsema et al., 2013).
Ecofys & NewClimate Institute based their calculations on
existing scenarios from national and international studies
(e.g. IEA’s World Energy Outlook 2014), as well as their own
calculations of the impact of individual policies in different
subsectors. PBL based its calculations on the FAIR policy
model (Den Elzen et al., 2014) and the TIMER energy model
(Van Vuuren et al., 2014). The PBL model results are
The INDC of Mexico covers the LULUCF sector and also includes mitigation targets specifically for this sector (e.g. 0% deforestation by 2030). However, no LULUCF emission projections are provided for the business-as-usual scenario nor for the INDC scenario. Therefore, our assessment uses the business-as-usual scenario as reported in the 5th National Communication (Government of Mexico, 2012). Based on the quantification of Mexico’s Mitigation Portfolio as provided in the 5th National Communication, the LULUCF related mitigation potential for Mexico is expected to be approximately 18.9 MtCO2eq in 2020. This National Communication does not provide a quantification of mitigation options for the LULUCF sector for 2030. If the estimated emission reductions would be achieved, the LULUCF sector would still be a net source of emissions by 2020. However, with continued implementation of emission abatements options after 2020, the LULUCF sector could potentially become a net sink of emissions by 2030.
The INDC of the Russian Federation explicitly states that the LULUCF sector is included in the mitigation component of the INDC. However, this INDC does not provide LULUCF emission projections for the business-as-usual scenario nor the INDC scenario. Our projections of LULUCF emissions are therefore based on the forest management intensification scenarios as provided in the 6th National Communication of the Russian Federation (Government of the Russian Federation, 2013). Based on these projections, INDC implementation is expected to result in a LULUCF emission increase of approximately 147 MtCO2eq in 2030, compared to business-as-usual projections. As stated in the 6th National Communication, this increase in LULUCF emissions is directly related to an intensification of forest management, which would reduce the forest carbon sink. However, it should be noted that the extent and implementation of these measures is still highly uncertain.
The INDC of the United States explicitly states that the LULUCF sector is covered, but does not provide LULUCF emission projections for the business-as-usual scenario nor the INDC scenario. An emission reduction target for the AFOLU sector is provided by the US State Department of Agriculture in “Building blocks for Climate Smart Agriculture & Forestry” (SDA, 2014). The strategy proposed in this document is to reduce net emissions and enhance carbon sequestration by over 120 MtCO2eq per year by 2025. However, the document does not specify potential reduction in the LULUCF sector. Therefore, we did not include this target in projections for the INDC scenario. Instead, we estimated the mitigation potential for the United States using the LULUCF emission projections from the 6th National Communication (US Department of State, 2014). Based on these projections, INDC implementation is expected to lead to emission reductions of approximately 284 MtCO2eq by 2020 and 372 MtCO2eq by 2030, relative to business-as-usual projections. The business-as-usual scenario assumes a significant increase in LULUCF emissions over time, due to an expected reduction of the sequestration potential.
supplemented with LULUCF CO2 emission projections based
on land use and agricultural policies using IIASA’s global
land use model GLOBIOM (Havlík et al., 2014) and global
forest model G4M (Gusti, 2010).
3 http://apki.net/wp-content/uploads/2015/07/Presentasi-
INDC-BAPPENAS-di-KLHK.pptx.

THRE
E
36
FOU
R
| Assessing Intended Nationally Determined Contributions to the Paris Climate Agreement
Assessment of national emission levels resulting from INDC implementation: the G20 countries
This chapter assesses national emission levels resulting from INDC implementation, focusing on G20 countries. Assessment is based on the following indicators: emission reductions relative to base year, emission reductions relative to national business-as-usual emission projections, emission reductions relative to below-2 °C pathways, timing and level of emission peak, emissions per capita and emissions per GDP. The aim of assessing individual INDCs is to understand how, in different national contexts, they may contribute over time to the reduction of national emissions, emission intensities and emissions per capita, and to determine whether these projected trajectories are consistent with below-2 °C pathways.
4.1 How do emission reductions as projected for national INDCs compare to different historical base years?
The national INDCs emission reduction targets for 2030 can be converted, compared to different historical base years (Table 4.1). For example, the EU28’s target of a 40% reduction relative to 1990 levels is equivalent to a 29% reduction relative to 2010 levels, due to the fact that emissions in the EU declined between 1990 and 2010. The target of the United States (26%–28% reduction relative to 2005 levels, by 2025) may be extrapolated to 36% to 38% reduction by 2030, assuming a linear pathway towards this country’s long-term goal of 83% reduction by 2050. Relative to 2010 levels, however, the reduction estimated for 2030 would be 30% to 32%.
Emission projections based on the INDCs show that, among the G20 countries, the EU would achieve its highest reductions relative to 1990 emission levels, while Brazil would achieve its highest reductions relative
to 2005 levels and Canada its highest reduction relative to 2010 levels. However, the projections for Canada are uncertain because emission reductions in this country are subject to natural disturbances in LULUCF emissions. Emission reductions by 2030 in countries such as Mexico, South Africa and South Korea are projected to be smaller. Greenhouse gas emissions in countries in relatively rapid economic transition continue to increase compared to historical years; this is the case for Argentina, China, India and Turkey. Furthermore, emissions in the Russian Federation are expected to increase as well. However, all of these countries do show decreasing emission growth rates towards 2030, such that greenhouse gas emissions are expected to peak between 2020 and 2030 in most countries (see Section 4.4)
4.2 How do emission reductions as projected for national INDCs compare to PBL business-as-usual projections?
Greenhouse gas emission reductions relative to business-as-usual projections (OECD, 2012) give an indication of the effort required to meet the targets included in the INDCs. Among the G20 countries, substantive absolute emission reductions from business-as-usual levels can be expected for the United States, China, the EU28, India and Brazil (Figure 4.1). Together, the INDCs of the G20 countries are projected to reduce global emissions relative to PBL business-as-usual levels by approximately 9 to 10 GtCO2eq by 2030. The INDCs of non-G20 countries (not shown in Figure 4.1) are projected to reduce emissions by an additional 0 to 1 GtCO2eq. The largest relative emission reductions compared to PBL business-as-usual emission levels in 2030 are projected for Australia, Brazil, Canada and the United States (Table 4.2).

374 Assessment of national emission levels resulting from INDC implementation: the G20 countries |
FOU
R
FOUR
Table 4.1Emission reductions (-%) and increases (+%) by 2030 as projected from national INDCs (G20 countries), relative to different historical base years (1990, 2005 and 2010)*
G20 country GHG emissions in Mt CO2 e1 Projected change (%) by 2030,Unconditional INDC scenario(Conditional INDC scenario)2
1990 2005 2010 relative to1990
relative to 2005 relative to 2010
Argentina 320 373 374 +78% (+47%) +53% (+26%) +52% (+25%)
Australia 555 601 560 -21% -27% -22%
Brazil 1,611 2,100 1,688 -26% -43% -29%
Canada 613 749 707 -14% -30% -26%
China 3,254 7,038 10,130 +329% +98% +38%
EU28 5,626 5,178 4,751 -40% -35% -29%
India 1,180 1,809 2,379 (+253%) (+130%) (+75%)
Indonesia 1,063 1,852 2,059 +92% (+60%) +10% (-8%) -1% (-17%)
Japan 1,234 1,350 1,258 -16% -23% -17%
Mexico 559 655 748 +36% (+11%) +16% (-5%) +1% (-17%)
Russian Federation 3,363 2,135 2,221 -27.5% +14.2% +9.8%
South Africa 380 498 515 +4.7% to +61.6% -20% to +23% -23% to +19%
South Korea 289 590 629 +85.1% -9% -14.8%
Turkey 144 281 346 +543% +230% +169%
United States 5,402 6,439 5,907 -25%3) -37%3) -31%3)
*) Values cover all greenhouse gas emissions, including emissions and removals from activities related to land use, land-use change and forestry (LULUCF), unless otherwise specified in previous tables.
1) Source: Historical emissions in China, India and Indonesia are based on IEA (2012), EDGAR 4.2 (JRC/PBL, 2012) and FAOSTAT (2015). Historical emissions in other countries are based on UNFCCC national inventory submissions or INDC submissions.
2) INDC projections as presented in Table 3.1. For INDCs with a reduction target range (Russian Federation: -25% to -30%; United States: -26% to -28%; and Australia: -26% to -28%) we assumed an average reduction of 27.5%, 27% and 27%, respectively. For China and India, the combined effect of emission intensity targets, non-fossil targets and afforestation targets was calculated using the PBL TIMER energy model and IIASA GLOBIOM/G4M models, resulting in total emissions of 13,957 MtCO2eq and 4,168 Mt CO2eq for China and India, respectively, in 2030.
3) Emissions in the United States in 2030 were estimated by extrapolating the 2025 emission level (calculated from the INDC) towards the 2050 emission level as based on the national long-term target (reducing emissions by 83% below 2005 levels by 2050).
4.3 Are national INDCs in line with below-2 °C pathways?
On a global level, the emission reductions that would result from implementation of the submitted INDCs are insufficient to close the global 2 °C emission gap (see Section 3.2). On an individual country level, however, INDCs may be consistent with the global 2 °C target. Consistency with below-2 °C emission pathways at country level can be assessed by either considering burden sharing or by assuming cost-optimal domestic implementation of climate policies (Tavoni et al., 2014). In the first approach, emission allowances and reductions towards meeting the global 2 °C target are distributed across countries based on equity principles. The second approach focuses on cost-optimal implementation, where emission reductions are distributed across countries, sectors and greenhouse gases in such a
way that the global costs of meeting the 2 °C target are minimised. Note that the latter approach refers to the cost-optimal geographical distribution of physical emission reductions, not to the sharing of mitigation finance; however, domestic mitigation actions still may be partly financed by international funding. We have considered both approaches as follows:– With regard to burden sharing, we employed an
effort-sharing approach that assumes per capita emission convergence. Although there is a wide range of effort-sharing approaches, in which the distribution of national reduction targets may vary significantly depending on the equity criteria used (see Höhne et al., 2013), our study focused on per capita convergence, as this is the most common, widely known approach. In this approach, countries converge to equal per capita emission allowances by 2050. Based on the global emission pathway consistent with the 2 °C target as presented in the

38 | Assessing Intended Nationally Determined Contributions to the Paris Climate Agreement
FOU
R
Figure 4.1
Unconditional INDCs Conditional INDCs-2
0
2
4
6
8
10
12Reduction compared to business-as-usual scenario (Gt CO2 eq)
Source: PBL FAIR/TIMER model
pbl.n
l
South Korea
South Africa
Australia
Japan
Mexico
Canada
Indonesia
Brazil
India
EU28
China
United States
Argentina
Russian Federation
Turkey
National emission reductions in G20 countries based on their INDCs, 2030
Positive numbers indicate emission reductions; negative numbers indicate emission increases. For countries with a reduction target range, projected reductions are based on the average of the range.
Table 4.2Absolute and relative emission reductions by 2030 resulting from INDC implementation in G20 countries, as shown in Figure 4.1*
Country Emission changes relative to PBL-BAU scenario, 20301
Unconditional INDC scenario Conditional INDC scenario
Mt CO2eq % change Mt CO2eq % change
Argentina -91 +19% 10 -2%
Australia 270 -38% 270 -38%
Brazil 856 -42% 856 -42%
Canada 271 -34% 271 -34%
China 1,958 -12% 1,958 -12%
EU28 1,616 -32% 1,616 -32%
India 635 -12% 1,205 -22%
Indonesia 470 -19% 816 -32%
Japan 268 -20% 268 -20%
Mexico 218 -22% 354 -36%
Russian Federation -96 +4% -96 +4%
South Africa 241 -32% 241 -32%
Rep. of Korea 137 -20% 137 -20%
Turkey -254 +38% -254 +38%
United States 2,390 -37% 2,390 -37%
* Values cover all greenhouse gas emissions, including emissions and removals from activities related to land use, land-use change and forestry (LULUCF), unless otherwise specified in previous tables.
1) Emission reductions (or increases) resulting from INDC implementation relative to PBL business-as-usual projections (see Table 3.1). For countries with a reduction target range, projected reductions are based on the average of the range.
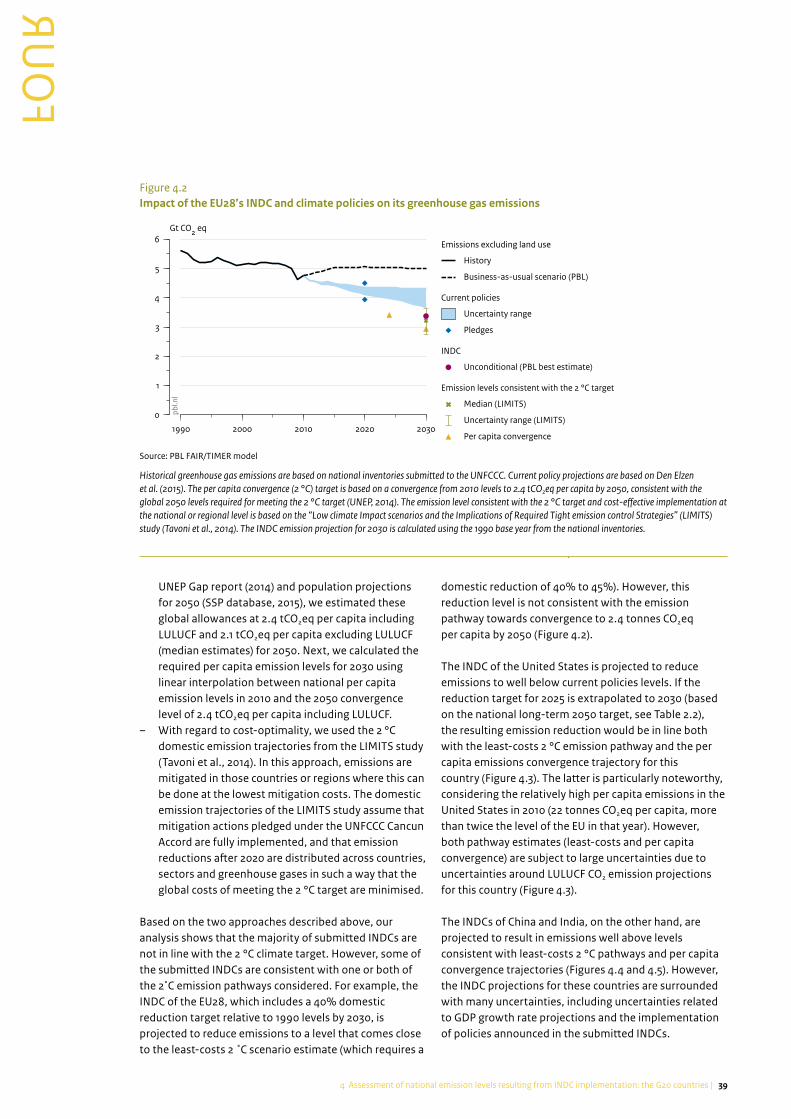
394 Assessment of national emission levels resulting from INDC implementation: the G20 countries |
FOU
R
FOUR
UNEP Gap report (2014) and population projections for 2050 (SSP database, 2015), we estimated these global allowances at 2.4 tCO2eq per capita including LULUCF and 2.1 tCO2eq per capita excluding LULUCF (median estimates) for 2050. Next, we calculated the required per capita emission levels for 2030 using linear interpolation between national per capita emission levels in 2010 and the 2050 convergence level of 2.4 tCO2eq per capita including LULUCF.
– With regard to cost-optimality, we used the 2 °C domestic emission trajectories from the LIMITS study (Tavoni et al., 2014). In this approach, emissions are mitigated in those countries or regions where this can be done at the lowest mitigation costs. The domestic emission trajectories of the LIMITS study assume that mitigation actions pledged under the UNFCCC Cancun Accord are fully implemented, and that emission reductions after 2020 are distributed across countries, sectors and greenhouse gases in such a way that the global costs of meeting the 2 °C target are minimised.
Based on the two approaches described above, our analysis shows that the majority of submitted INDCs are not in line with the 2 °C climate target. However, some of the submitted INDCs are consistent with one or both of the 2̊ C emission pathways considered. For example, the INDC of the EU28, which includes a 40% domestic reduction target relative to 1990 levels by 2030, is projected to reduce emissions to a level that comes close to the least-costs 2 ˚C scenario estimate (which requires a
domestic reduction of 40% to 45%). However, this reduction level is not consistent with the emission pathway towards convergence to 2.4 tonnes CO2eq per capita by 2050 (Figure 4.2).
The INDC of the United States is projected to reduce emissions to well below current policies levels. If the reduction target for 2025 is extrapolated to 2030 (based on the national long-term 2050 target, see Table 2.2), the resulting emission reduction would be in line both with the least-costs 2 °C emission pathway and the per capita emissions convergence trajectory for this country (Figure 4.3). The latter is particularly noteworthy, considering the relatively high per capita emissions in the United States in 2010 (22 tonnes CO2eq per capita, more than twice the level of the EU in that year). However, both pathway estimates (least-costs and per capita convergence) are subject to large uncertainties due to uncertainties around LULUCF CO2 emission projections for this country (Figure 4.3).
The INDCs of China and India, on the other hand, are projected to result in emissions well above levels consistent with least-costs 2 °C pathways and per capita convergence trajectories (Figures 4.4 and 4.5). However, the INDC projections for these countries are surrounded with many uncertainties, including uncertainties related to GDP growth rate projections and the implementation of policies announced in the submitted INDCs.
Figure 4.2
1990 2000 2010 2020 2030
0
1
2
3
4
5
6Gt CO2 eq
Source: PBL FAIR/TIMER model
pbl.n
l
Emissions excluding land use
History
Business-as-usual scenario (PBL)
Current policies
Uncertainty range
Pledges
INDC
Unconditional (PBL best estimate)
Emission levels consistent with the 2 °C target
Median (LIMITS)
Uncertainty range (LIMITS)
Per capita convergence
Impact of the EU28’s INDC and climate policies on its greenhouse gas emissions
Historical greenhouse gas emissions are based on national inventories submitted to the UNFCCC. Current policy projections are based on Den Elzen et al. (2015). The per capita convergence (2 °C) target is based on a convergence from 2010 levels to 2.4 tCO2eq per capita by 2050, consistent with the global 2050 levels required for meeting the 2 °C target (UNEP, 2014). The emission level consistent with the 2 °C target and cost-effective implementation at the national or regional level is based on the “Low climate Impact scenarios and the Implications of Required Tight emission control Strategies” (LIMITS) study (Tavoni et al., 2014). The INDC emission projection for 2030 is calculated using the 1990 base year from the national inventories.

40 | Assessing Intended Nationally Determined Contributions to the Paris Climate Agreement
FOU
R
Figure 4.3
1990 2000 2010 2020 2030
0
2
4
6
8Gt CO2 eq
Source: PBL FAIR/TIMER model
pbl.n
l
Emissions including land use
History
Business-as-usual scenario (PBL)
Current policies
Uncertainty range
Pledge
INDC
Unconditional (PBL best estimate)
Emission levels consistent with the 2 °C target
Median (LIMITS)
Uncertainty range (LIMITS)
Per capita convergence
Impact of the US’ INDC and climate policies on its greenhouse gas emissions
Historical greenhouse gas emissions are based on national inventories submitted to UNFCCC. LULUCF emission history and projections are based on the Sixth National Communication (US Department of State, 2014). Current policy projections are based on Den Elzen et al. (2015). The per capita convergence (2 °C) target is based on a convergence from 2010 levels to 2.4 tCO2eq per capita by 2050, consistent with the global 2050 levels required for meeting the 2 °C target (UNEP, 2014). The emission level consistent with the 2 °C target and cost-effective implementation at the national or regional level is taken from the LIMITS study (Tavoni et al., 2014).The INDC emission projection for 2025 is calculated using the 2005 base year from the national inventories. The 2030 emission level is based on a linear extrapolation between the projection for the 2025 target and the national long-term target for 2050.
Figure 4.4
1990 2000 2010 2020 2030
0
4
8
12
16
20Gt CO2 eq
Source: PBL FAIR/TIMER model; IIASA GLOBIOM/G4M model
pbl.n
l
Emissions including land use
History
Business-as-usual scenario (PBL)
Current policies
Uncertainty range
Pledges
INDC
Unconditional (PBL best estimate)
Uncertainty range
Emission levels consistent with the 2 °C target
Median (LIMITS)
Uncertainty range (LIMITS)
Per capita convergence
Impact of China’s INDC and climate policies on its greenhouse gas emissions
Uncertainties in the numbers presented are related to the peak emissions level, GDP and population growth rates, and the final emission intensity levels by 2030. Historical greenhouse gas emissions (including LULUCF) are based on energy-related emissions (IEA, 2013a), non-energy-related emissions (EDGAR 4.2) (JRC and PBL, 2012) and LULUCF emissions (FAOSTAT). LULUCF emission projections are based on IIASA model calculations. Current policy projections are based on Den Elzen et al. (2015). The per capita convergence (2°C) target is based on a convergence from 2010 levels to 2.4 tCO2eq per capita by 2050, consistent with the global 2050 levels required for meeting the 2 °C target (UNEP, 2014). The emission level consistent with the 2 °C target and cost-effective implementation at the national or regional level is taken from the LIMITS study (Tavoni et al., 2014). The INDC emission projection for 2030 assumes a GDP growth rate of 5% between 2021 and 2030. The uncertainty range for this projection reflects a range in GDP growth of 4.3% to 6.3% (IEA, 2014; 2021–2030 GDP assumption with +1% and -1%).
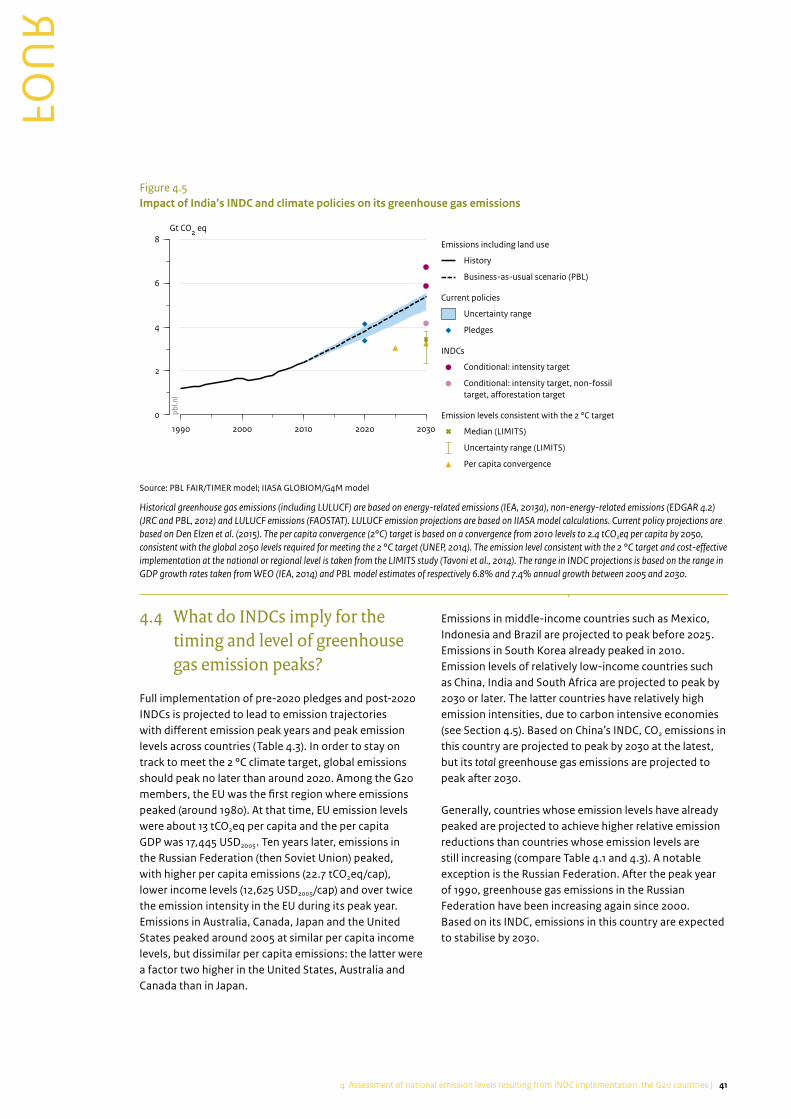
414 Assessment of national emission levels resulting from INDC implementation: the G20 countries |
FOU
R
FOUR
4.4 What do INDCs imply for the timing and level of greenhouse gas emission peaks?
Full implementation of pre-2020 pledges and post-2020 INDCs is projected to lead to emission trajectories with different emission peak years and peak emission levels across countries (Table 4.3). In order to stay on track to meet the 2 °C climate target, global emissions should peak no later than around 2020. Among the G20 members, the EU was the first region where emissions peaked (around 1980). At that time, EU emission levels were about 13 tCO2eq per capita and the per capita GDP was 17,445 USD2005. Ten years later, emissions in the Russian Federation (then Soviet Union) peaked, with higher per capita emissions (22.7 tCO2eq/cap), lower income levels (12,625 USD2005/cap) and over twice the emission intensity in the EU during its peak year. Emissions in Australia, Canada, Japan and the United States peaked around 2005 at similar per capita income levels, but dissimilar per capita emissions: the latter were a factor two higher in the United States, Australia and Canada than in Japan.
Emissions in middle-income countries such as Mexico, Indonesia and Brazil are projected to peak before 2025. Emissions in South Korea already peaked in 2010. Emission levels of relatively low-income countries such as China, India and South Africa are projected to peak by 2030 or later. The latter countries have relatively high emission intensities, due to carbon intensive economies (see Section 4.5). Based on China’s INDC, CO2 emissions in this country are projected to peak by 2030 at the latest, but its total greenhouse gas emissions are projected to peak after 2030.
Generally, countries whose emission levels have already peaked are projected to achieve higher relative emission reductions than countries whose emission levels are still increasing (compare Table 4.1 and 4.3). A notable exception is the Russian Federation. After the peak year of 1990, greenhouse gas emissions in the Russian Federation have been increasing again since 2000. Based on its INDC, emissions in this country are expected to stabilise by 2030.
Figure 4.5
1990 2000 2010 2020 2030
0
2
4
6
8Gt CO2 eq
Source: PBL FAIR/TIMER model; IIASA GLOBIOM/G4M model
pbl.n
l
Emissions including land use
History
Business-as-usual scenario (PBL)
Current policies
Uncertainty range
Pledges
INDCs
Conditional: intensity target
Conditional: intensity target, non-fossiltarget, afforestation target
Emission levels consistent with the 2 °C target
Median (LIMITS)
Uncertainty range (LIMITS)
Per capita convergence
Impact of India’s INDC and climate policies on its greenhouse gas emissions
Historical greenhouse gas emissions (including LULUCF) are based on energy-related emissions (IEA, 2013a), non-energy-related emissions (EDGAR 4.2) (JRC and PBL, 2012) and LULUCF emissions (FAOSTAT). LULUCF emission projections are based on IIASA model calculations. Current policy projections are based on Den Elzen et al. (2015). The per capita convergence (2°C) target is based on a convergence from 2010 levels to 2.4 tCO2eq per capita by 2050, consistent with the global 2050 levels required for meeting the 2 °C target (UNEP, 2014). The emission level consistent with the 2 °C target and cost-effective implementation at the national or regional level is taken from the LIMITS study (Tavoni et al., 2014). The range in INDC projections is based on the range in GDP growth rates taken from WEO (IEA, 2014) and PBL model estimates of respectively 6.8% and 7.4% annual growth between 2005 and 2030.

42 | Assessing Intended Nationally Determined Contributions to the Paris Climate Agreement
FOU
R
4.5 Are per capita emissions and emission intensities, as projected from national INDCs, converging between countries?
In this section, INDCs of the G20 countries are compared using two indicators of emission efficiency: emissions per unit of GDP (i.e. emission intensity) and emissions per capita. Indicator values were derived from historical data or calculated from the INDCs using projections for population and economic development (GDP in purchasing power parity, PPP) from the SSP Database (2015). The resulting values are shown in Tables 4.4 and 4.5 and Figure 4.6.As Figure 4.6 (left panel) shows, national emission levels per capita are projected to decline between 2010 and 2030 as a result of the implementation of national INDCs, in all G20 countries except Argentina, China, India, the Russian Federation and Turkey. This figure also shows
Table 4.3Observed or projected emission peak years of the G20 countries, and (observed or projected) per capita emissions, GDP per capita and emission intensities in these peak years*
Country Peak year Per capita emissions GDP (PPP) per capita Emission intensity
(tCO2eq/cap) (USD2005/cap) (tCO2eq/ million USD2005, PPP)
Argentina 2030 10.9 to 12.4 26,024 475 to 391
Australia 2005 26.0 33,806 869
Brazil 2020 7.2 13,496 530
Canada 2005 23.2 35,061 662
China1 2030 9.6 23,117 416
EU28 1980 13.3 17,445 759
India 2030 2.79 8,182 341
Indonesia 2025 7.46 8,846 672
Japan 2005 10.7 30,405 351
Mexico1 2025 6.4 18,275 275
Russian Federation2 1990 22.7 12,625 1,797
South Africa 2030 11.3 18,807 599
South Korea 2010 13.1 27,420 446
Turkey 2030 10.5 22,361 470
United States 2005 21.7 42,558 580
*) Values cover all greenhouse gas emissions, including emissions and removals from activities related to land use, land-use change and forestry (LULUCF), unless otherwise specified in previous tables.
1) Expected peak year, based on Pledge targets and/or INDC targets as presented in Table 2.2 (for projected emission levels, see Table 3.1).
2) Following the peak year of 1990, greenhouse gas emissions in the Russian Federation have been increasing again since 2000. Based on its INDC, emissions in this country are expected to stabilise in 2030.
that the positive correlation between income level and per capita emissions will largely disappear by 2030. Furthermore, per capita emissions are shown to converge between G20 countries over time, despite the different income levels of these countries, indicating a decoupling of economic growth and greenhouse gas emissions.This decoupling trend is further illustrated by Figure 4.6 (right panel), which shows a substantive reduction in emission intensity between 2010 and 2030, in tandem with increasing income levels. The reduction in emission intensity is projected for all countries (except for Turkey) and is a result of current climate policies and national INDCs. The largest reductions are observed for countries with the highest emission intensities in 2010, such as Indonesia, China and Brazil. Furthermore, emission intensities of all G20 countries are converging to levels between 250 and 750 tons CO2eq per million USD in 2030, independent of these countries’ emission intensity levels in 2010 and income levels in 2030. This convergence again reflects a decoupling of economic growth and greenhouse gas emissions.

434 Assessment of national emission levels resulting from INDC implementation: the G20 countries |
FOU
R
FOUR
Figure 4.6
0 10 20 30 40 50 60
thousand USD2005 per capita per year (ppp)
0
5
10
15
20
25
30t CO2 eq per capita per year
Source: PBL FAIR/TIMER model; SSP database
pbl.n
l
2010
2020
2030
EU28
United States
Mexico
Russian Federation
South Africa
India
Turkey
Canada
Brazil
China
South Korea
Indonesia
Australia
Japan
Argentina
Emissions per capita
Greenhouse gas emissions versus GDP per capita
0 10 20 30 40 50 60
thousand USD2005 per capita per year (ppp)
0
500
1000
1500
2000
2500t CO2 eq per million USD2005 per year
pbl.n
l
Emissions per GDP
Symbols represent emissions per capita and per GDP (y-axis) as a function of per capita GDP (PPP) (x-axis) in 2010, 2020 and 2030. Population and GDP data are from PBL business-as-usual scenario calculations, based on the SSP2 scenario database (SSP database, 2015). The SSP database uses the population and GDP history until 2008 from The World Bank (2015) with SSP growth projections onwards. The 2020 emission levels are based on PBL projections for current policies; 2030 emission levels are based on PBL projections for the submitted INDCs as presented in Table 3.1.

44 | Assessing Intended Nationally Determined Contributions to the Paris Climate Agreement
FOU
R
Table 4.4Per capita emissions in G20 countries in historical years and as projected for 2030, based on submitted INDCs
Emissions per capita (tCO2eq/cap)1,2,3
Unconditional INDC scenario
Conditional INDC scenario
% change relative to
1990 2005 2030 2030 2005
Argentina 9.8 9.7 12.4 10.2 +27% to +5%
Australia4 31.1 29.4 15.6 15.6 -47%
Brazil 8.7 8.7 5.5 5.5 -36%
Canada 25.3 23.2 13.0 13.0 -44%
China4 2.8 5.4 9.6 9.6 +79%
EU28 11.8 10.5 6.6 6.6 -37%
India4 1.4 1.6 2.8 2.8 +76%
Indonesia 5.8 8.2 7.5 6.2 -8% to -24%
Japan 10.1 10.7 8.9 8.9 -17%
Mexico 6.6 6.2 5.9 4.8 -4% to -22%
Russian Federation 4 22.7 14.8 18.5 18.5 +25%
South Africa 10.3 10.4 7.3 to 11.3 7.3 to 11.3 -30% to +8%
South Korea 6.7 12.5 11.0 11.0 -12%
Turkey 2.7 4.1 10.5 10.5 +155%
United States4 21.8 21.7 11.1 11.1 -49%
1) Values cover all greenhouse gas emissions, including emissions and removals from activities related to land use, land-use change and forestry (LULUCF), unless otherwise specified in previous tables.
2) History and projection of population, source: SSP database, 2015.3) Emission projections based on INDCs do not account for carbon credits.4) For INDCs with a reduction target range (Russian Federation: -25% to -30%; United States: -26% to -28%; and Australia: -26%
to -28%) we assumed an average reduction of 27.5%, 27% and 27%, respectively. For China and India, the combined effect of emission intensity targets, non-fossil targets and afforestation targets was calculated using the PBL TIMER energy model and IIASA GLOBIOM/G4M models, resulting in total emissions of 13,957 MtCO2eq and 4,168 MtCO2eq for China and India respectively, in 2030.

454 Assessment of national emission levels resulting from INDC implementation: the G20 countries |
FOU
R
FOUR
Table 4.5Emission intensities of G20 countries in historical years and as projected for2030, based on submitted INDCs
Emission intensity (tCO2eq/ millionUSD 2005, PPP)1,2,5
Unconditional INDC scenario
Conditional INDC scenario
% change compared to
1990 2005 2030 2030 2005
Argentina 1,315 890 475 391 -47% to -56%
Australia6 1,252 869 306 306 -65%
Brazil 1,500 1,301 317 317 -76%
Canada 935 662 282 282 -57%
China4,6 2,605 1,312 416 416 -68%
EU28 581 393 160 160 -59%
India3,6 1,137 732 341 341 -53%
Indonesia 2,878 2,633 672 558 -74% to -79%
Japan 381 351 219 219 -38%
Mexico 666 507 284 233 -44% to -54%
Russian Federation 1,6 1,797 1,259 612 612 -51%
South Africa 1,354 1,227 389 to 599 389 to 599 -51% to -68%
South Korea 594 539 211 211 -61%
Turkey 330 360 470 470 +30%
United States6 690 510 193 193 -62%
1) Values cover all greenhouse gas emissions, including emissions and removals from activities related to land use, land-use change and forestry (LULUCF), unless otherwise specified in previous tables.
2) History and projection of GDP, source: SSP database, 2015.3) India’s emission intensity target of -33% to -35% relative to 2005 levels includes CO2 only. However, the numbers in this table also
cover emissions of non-CO2 greenhouse gases, and account for India’s non-fossil-fuel target and carbon sink target.4) China’s emission intensity target of -60% to -65% relative to 2005 levels includes CO2 only. However, the numbers in this table
also cover emissions of non-CO2 greenhouse gases.5) Emission projections based on INDCs do not account for carbon credits.6) For INDCs with a reduction target range (Russian Federation: -25% to -30%; United States: -26% to -28%; Australia: -26% to
-28%) we assumed an average reduction of 27.5%, 27%, and 27%, respectively. For China and India, the combined effect of emission intensity targets, non-fossil targets and afforestation targets was calculated using the PBL TIMER model and IIASA GLOBIOM/G4M models, resulting in total emissions of 13,957 MtCO2eq and 4,168 MtCO2eq for China and India, respectively.

46 | Assessing Intended Nationally Determined Contributions to the Paris Climate Agreement
References
Australian Government (2013). Australia’s Sixth National Communication on Climate Change – A report under the United Nations Framework Convention on Climate Change. Canberra: Department of Industry, Innovation, Climate Change, Science, Research and Tertiary Education.
Bouwman AF, Kram T and Klein Goldewijk K. (2006). Integrated modelling of global environmental change. An overview of IMAGE 2.4. PBL Netherlands Environmental Assessment Agency, The Hague.
Burniaux JM and Chateau J. (2008). An Overview of the OECD ENV-Linkages Model.
Den Elzen MGJ, Fekete H, Admiraal A, Forsell N, Höhne N, Korosuo A, Roelfsema M, Van Soest H, Wouters K, Day T, Hagemann M and Hof AF. (2015). Enhanced policy scenarios for major emitting countries; Analysis of current and planned climate policies, and selected enhanced mitigation measures. PBL Netherlands Environmental Assessment Agency, The Hague, http://www.pbl.nl/sites/default/files/cms/publicaties/pbl-2015-enhanced-policy-scenarios-for-major-emitting-countries_1631.pdf.
Department of the Environment, Australia (2015). Emission Reduction Fund 15-16 April Auction Results, http://www.cleanenergyregulator.gov.au/DocumentAssets/Documents/Emissions%20Reduction%20Fund%20auction%20results%20factsheet%20-%20April%202015.pdf.
Department of industry, innovation, climate change, science, research and tertiairy education (2013). Australia’s Six National Communication on Climate Change, http://unfccc.int/resource/docs/natc/aus_nc6.pdf.
FAOSTAT (2015). Land use emissions. http://faostat3.fao.org/download/G2/*/E
Government of China (2012). The second national communication on climate change of the People’s Republic of China. National Development and Reform Commission, http://unfccc.int/resource/docs/natc/chnnc2e.pdf.
Government of Gabon, MINISTERE DE L’HABITAT, DE L’URBANISME, DE L’ECOLOGIE ET DU DEVELOPPEMENT DURABLE (2011). Seconde Communication Nationale du Gabon sur le Changements, http://unfccc.int/resource/docs/natc/gabnc2.pdf.
Government of India (2012). Second national communication to the United Nations Framework
Convention on Climate Change.: Ministry of Environment and Forests, http://unfccc.int/resource/docs/natc/indnc2.pdf.
Government of Japan (2013). Sixth National Communication to the United Nations Framework Convention on Climate Change, http://unfccc.int/files/national_reports/annex_i_natcom/submitted_natcom/application/pdf/nc6_jpn_resubmission.pdf.
Government of Mexico (2012). México quinta comunicación nacional ante la Convención Marco de las Naciones Unidas sobre el Cambio Climático. Tlalpan, México: Secretaría de Medio Ambiente y Recursos Naturales & Instituto Nacional de Ecología y Cambio Climático, http://unfccc.int/resource/docs/natc/mexnc5s.pdf.
Government of the Russian Federation, Ministry of Natural resources and ecology (2013). Sixth National Communication of Russian Feredation (in Russian).
Gusti M. (2010). An algorithm for simulation of forest management decisions in the global forest model. Artificial Intelligence N4:45–49.
Havlik P, Valin H, Herrero M, Obersteiner M, Schmid E, Rufino MC, Mosnier A, Thornton PK, Böttcher H, Conant RT, Frank S, Fritz S, Fuss S, Kraxner Fand Notenbaert A. (2014). Climate change mitigation through livestock system transitions. Proceedings of the National Academy of Sciences of the United States of America 111:3709–3714.
Hof AF, Den Elzen MGJ and Roelfsema M. (2013). The effect of updated pledges and business-as-usual projections, and new agreed rules on expected global greenhouse gas emissions in 2020. Environmental Science & Policy 33:308–319.
Höhne N, Den Elzen MGJ and Escalante D. (2013). Regional GHG reduction targets based on effort sharing: a comparison of studies, Climate Policy.
IEA (2014). World Energy Outlook 2014. Paris: OECD/IEA.IEA (2013). Energy Statistics and Energy Balances [Online].
Paris: IEA, http://www.iea.org/statistics/topics/energybalances/.
ICAO (2013). Environmental Report 2013, Aviation and climate change, http://cfapp.icao.int/Environmental-Report-2013/files/assets/common/downloads/ICAO_2013_Environmental_Report.pdf.
IMO (2014). Third IMO Greenhouse Gas study 2014, London: International Maritime Organization

47References |
http://www.imo.org/OurWork/Environment/PollutionPrevention/AirPollution/Documents/MEPC%2067-INF.3%20-%20Third%20IMO%20GHG%20Study%202014%20-%20Final%20Report%20%28Secretariat%29.pdf.
IPCC (2014). Summary for Policymakers. In: Climate Change 2014: Mitigation of Climate Change. Contribution of Working Group III to the Fifth Assessment Report of the Intergovernmental Panel on Climate Change [Edenhofer, O., R. Pichs-Madruga, Y. Sokona, E. Farahani, S. Kadner, K. Seyboth, A. Adler, I. Baum, S. Brunner, P. Eickemeier, B. Kriemann, J., Savolainen, S. Schlömer, C. von Stechow, T. Zwickel and J.C. Minx (eds.). Cambridge, United Kingdom and New York, NY, USA.: Cambridge University Press.
JRC and PBL (2012). EDGAR version 4.2 FT2010. Joint Research Centre of the European Commission & PBL Netherlands Environmental Assessment Agency.
Kindermann G, Obersteiner M, Sohngen B, Sathaye J, Andrasko K, Rametsteiner E, Schlamadinger B, Wunder S and Beach R. (2008). Global cost estimates of reducing carbon emissions through avoided deforestation. Proceedings of the National Academy of Sciences of the United States of America (PNAS)‚ 105(30)‚ pp.10302-10307‚ doi: http://dx.doi.org/10.1073/pnas.0710616105.
OECD (2012). OECD Environmental Outlook to 2050. OECD, Paris.
PBL (2015). PBL Climate Pledge INDC tool, http://www.pbl.nl/indc/, version 5 October 2015.
Planning Commission Government of India (2014). The final report of the expert group on low carbon strategies for inclusive growth, http://planningcommission.nic.in/reports/genrep/rep_carbon2005.pdf.
REDD-PAC project team. 2015. Modelling Land Use Changes in Brazil: 2000-2050, http://www.redd-pac.org/reports/lucc_brazil_folder.pdf.
Roelfsema M, Den Elzen MGJ, Höhne N, Hof AF, Braun N, Fekete H, Brandsma R, Larkin J and Böttcher H. (2013). Assessment of climate and energy policies of major emitting countries, http://www.pbl.nl/en/publications/assessment-of-climate-and-energy-policies-of-major-emitting-countries: PBL Netherlands Environmental Assessment Agency, The Hague.
SSP database 2015. https://secure.iiasa.ac.at/web-apps/ene/SspDb/dsd?Action=htmlpage&page=about.
Stehfest E, Van Vuuren D, Kram T, Bouwman L, Alkemade R, Bakkenes M, Biemans H, Bouwman A, Den Elzen M, Janse J, Lucas P, Van Minnen J, Müller M and Prins A. (2014). Integrated Assessment of Global Environmental Change with IMAGE 3.0. Model description and policy applications. PBL Netherlands Environmental Assessment Agency, The Hague, http://www.pbl.nl/sites/default/files/cms/PBL-2014-Integrated_
Assessment_of_Global_Environmental_Change_with_IMAGE_30-735.pdf.
Tavoni M, Kriegler E, Aboumahboub T, Calvin K, De Maere G, Jewell J, Kober T, Lucas P, Luderer G, McCollum D, Marangoni G, Riahi K and Van Vuuren DP. (2014). Post-2020 climate agreements in the major economies assessed in the light of global models. Nature Climate Change, DOI: 10.1038.
The World Bank. (2015). http://data.worldbank.org/data-catalog/world-development-indicators.
UNEP (2014). The Emissions Gap Report 2014: A UNEP Synthesis Report. Nairobi: United Nations Environment Programme (UNEP).
UNFCCC (2009). Copenhagen Accord. http://unfccc.int/resource/docs/2009/cop15/eng/l07.pdf.
UNFCCC (2010). Decision 1/CP.16, The Cancun Agreements. UNFCCC document. FCCC/CP/2010/7/Add.1, http://unfccc.int/resource/docs/2010/cop16/eng/07a01.pdf#page=2.
UNFCCC (2015). Intended Nationally Determined Contributions (INDCs), http://unfccc.int/files/adaptation/application/pdf/all__parties_indc.pdf OR http://www4.unfccc.int/submissions/indc/Submission%20Pages/submissions.aspx.
US Department of State (2014). United States Climate Action Report 2014: Sixth National Communication of the Unites States of America – First Biennial Report of the United States of America. Washington, D.C.: U.S. Department of State, http://unfccc.int/files/national_reports/annex_i_natcom/submitted_natcom/application/pdf/2014_u.s._climate_action_report%5B1%5Drev.pdf.
Van Vuuren D, Van Ruijven B, Girod B, Daioglou V, Edelenbosch O and Deetman S. (2014). Energy Supply and Demand. In Stehfest E, Van Vuuren D, Kram T and Bouwman L. (eds.) Integrated Assessment of Global Environmental Change with IMAGE 3.0 - Model description and policy applications. PBL Netherlands Environmental Assessment Agency, The Hague, pp. 71–152.
Van Vuuren DP, Lucas P and Hilderink H. (2007). Downscaling drivers of global environmental change. Enabling use of global SRES scenarios at the national and grid levels. Global Environmental Change‚ 17‚ pp.114–130‚ doi: http://dx.doi.org/10.1016/j.gloenvcha.2006.04.004.
48 | Assessing Intended Nationally Determined Contributions to the Paris Climate Agreement
Annex I: Calculations of LULUCF emissionsWhat kind of information do INDCs provide on LULUCF emissions?Of the 156 Parties (representing 155 countries) who submitted an INDC, 95 countries explicitly state that emissions and removals from land-use activities (LULUCF) are included in the mitigation component of their INDC (see Table A1). However, only 36 of these 95 countries provide quantifiable details of measures or specific targets for the LULUCF sector. Some countries provide information on the development of LULUCF emissions over time in business-as-usual and INDC scenarios (e.g. Madagascar, Mali), or refer to a complementary report where such information can be found (e.g. Brazil, South Africa). Other countries only provide LULUCF emission levels as estimated based on the effect of proposed general reduction measures. Many countries provide estimates of LULUCF emission reductions based on measures and policies specifically related to the LULUCF sectors (e.g. Japan, Guyana). Some countries provide information about the area which will be afforested or the amount of carbon that will be sequestered as a result of forest stock management (e.g. China, India).
The other 59 of these 95 countries state in their INDCs that the LULUCF sector is covered in their mitigation targets, without providing LULUCF projections or quantifiable information concerning LULUCF mitigation policies. For example, several countries provide projections for the agriculture, forestry and land-use sector (AFOLU) but without the additional data needed to distinguish LULUCF emissions (e.g. Mauritania). Some countries provide a list of measures and policies in the LULUCF sector but do not include the data needed for estimating LULUCF emission reductions (e.g. Indonesia, Jordan). Other countries state that the LULUCF sector is covered but do not specify a LULUCF reduction target or mitigation measures (e.g. Russia, New Zealand).
This leaves 60 countries who explicitly state that LULUCF emissions are not included in their INDC mitigation targets. In this group, 41 countries nevertheless do propose measures or policies to reduce LULUCF emissions (e.g. Chile, Georgia), with some of them stating that the decision whether or not to include the LULUCF sector in mitigation targets will be taken by 2020 (e.g. EU28, Thailand).The remaining 19 countries state that LULUCF emissions are not covered and also do not propose measures or policies for reducing LULUCF emissions. Some of these countries do not mention the LULUCF sector at all (e.g. Moldova, Andorra), or only mention the possibility that the LULUCF sector will be included at a later stage (e.g. South Korea, Montenegro).
Calculation of LULUCF emissions projections in national business-as-usual and INDC scenariosIn this study, we projected LULUCF emissions for countries who explicitly state in their INDC submission that the LULUCF sector is covered (95 Parties) (see Table A.1, two left columns). For these countries, LULUCF emissions were projected both for a national business-as-usual scenario and a scenario in which the national INDC is fully implemented (INDC scenario for short). Our LULUCF projections are based on LULUCF estimates provided in the national INDCs (where provided) and/or LULUCF emission and removal projections and estimates presented in the National Communications or in supporting documents. For countries for which no sufficient information was available to estimate LULUCF emission development over time (either in the business-as-usual or INDC scenarios), we assumed that LULUCF emissions would stay constant. As such, our projections of future LULUCF emissions and removals are based only on information as provided by countries themselves in terms of National Communications, INDCs, and/or supporting information as officially provided. This is summarised in Table A.2.

49Annex I: Calculations of LULUCF emissions |
Table A.1Categorization of countries according to whether the LULUCF sector is covered in the submitted INDCs
LULUCF is covered and measures and/or specific targets are explicit
LULUCF is covered but no measures and/or specific targets are listed
LULUCF is partly covered LULUCF is not covered
Algeria, Australia, Azerbaijan, Benin, Bolivia, Brazil, Burundi, Cabo Verde, Cambodia, Central African Republic, Chad,China, Comoros, Congo, DR of Congo, Eritrea, Ethiopia, Gabon, Ghana, Guyana, Haiti, India, Indonesia, Japan, Lesotho, Madagascar, Malawi, Mali, Morocco, Namibia, Norway, Senegal, South Africa, Uganda, Uruguay,Zambia
Afghanistan, Antigua and Barbuda, Argentina, Armenia, Belize, Bhutan, Bosnia-Herzegovina, Burkina Faso, Canada, Colombia, Costa Rica, Djibouti, Dominica, Dominican Republic, Ecuador, Equatorial Guinea, Grenada, Guatemala, Guinea Bissau, Iceland, Jordan, Kazakhstan, Kenya, Kiribati, Kyrgyzstan, Lao People’s Democratic Republic, Lichtenstein, Mauritania, Mauritius, Mexico, Mozambique, Myanmar, New Zealand, Niger, Papua New Guinea, Paraguay, Peru, Philippines, Rep. of Moldova, Russia, Rwanda, San Marino, Sao Tome and Principe, Serbia, Sierra Leone, Singapore, Solomon Islands, Sri Lanka, Suriname, Switzerland, Tajikistan, Tanzania, Togo, Tunisia, Turkey, Ukraine, United States, Vanuatu, Vietnam
Bangladesh, Cameroon,Chile, Côte d’Ivoire, EU28 Member States, Gambia, Georgia, Guinea, Lebanon, Liberia, Mongolia, Samoa, Thailand, Zimbabwe
Albania, Andorra, Barbados, Belarus, Botswana, Honduras, Israel, Maldives, Marshall Islands, Monaco, Montenegro, Oman, Rep. of Macedonia, Seychelles, South Korea, Swaziland, Trinidad and Tobago, Turkmenistan, United Arab Emirates
36 59 41 19
Table A.2Information sources used for projecting LULUCF emissions in national business-as-usual and INDC scenarios, for the 95 countries whose INDCs explicitly state that the LULUCF sector is covered
LULUCF projections in both the business-as-usual and INDC scenario are based on information from the INDC
LULUCF projections in the business-as-usual scenario are based on information from the National Communication; in the INDC scenario, on information from the INDC
LULUCF projections in both the business-as-usual and INDC scenario are based on information from the National Communication
LULUCF projections in both the business-as-usual and INDC scenario are based on information from supporting documents
Azerbaijan, Central African Republic, Chad, Comoros, Congo, DR of Congo, Ethiopia, Gabon, Madagascar, Mali, Senegal, Uganda
Algeria, Australia, Benin, Bolivia, Burundi, Cabo Verde, Cambodia, China, Eritrea, Ghana, Guyana, Haiti, Japan, Lesotho, Malawi, Morocco, Namibia, Norway, Uruguay, Zambia
Argentina, Afghanistan, Antigua and Barbuda, Armenia, Belize, Bhutan, Bosnia-Herzegovina, Burkina Faso, Canada, Colombia, Costa Rica, Djibouti, Dominica, Dominican Republic, Ecuador, Equatorial Guinea, Grenada, Guatemala, Guinea Bissau, Iceland, Jordan, Kazakhstan, Kenya, Kiribati, Kyrgyzstan, Lao People’s Democratic Republic, Lichtenstein, Mauritania, Mauritius, Mexico, Mozambique, Myanmar, New Zealand, Niger, Papua New Guinea, Paraguay, Peru, Philippines, Rep. of Moldova, Russia, Rwanda, San Marino, Sao Tome and Principe, Serbia, Sierra Leone, Singapore, Solomon Islands, Sri Lanka, Suriname, Switzerland, Tajikistan, Tanzania, Togo, Tunisia, Turkey, Ukraine, United States, Vanuatu, Vietnam
Brazil, India, Indonesia, South Africa
12 20 59 4

PBL Netherlands Environmental Assessment Agency
Mailing addressPO Box 303142500 GH The HagueThe Netherlands
Visiting addressOranjebuitensingel 62511VE The HagueT +31 (0)70 3288700
www.pbl.nl/en
November 2015