Embed Size (px)
Citation preview

University of New MexicoUNM Digital RepositoryTeacher Education, Educational Leadership &Policy ETDs Education ETDs
9-10-2015
Assessing instructional leadership in rural NewMexico: An exploration of the reliability andvalidity of the Principal Instructional ManagementRating Scale (PIMRS)Christiana Sisneros
Follow this and additional works at: https://digitalrepository.unm.edu/educ_teelp_etds
This Dissertation is brought to you for free and open access by the Education ETDs at UNM Digital Repository. It has been accepted for inclusion inTeacher Education, Educational Leadership & Policy ETDs by an authorized administrator of UNM Digital Repository. For more information, pleasecontact [email protected].
Recommended CitationSisneros, Christiana. "Assessing instructional leadership in rural New Mexico: An exploration of the reliability and validity of thePrincipal Instructional Management Rating Scale (PIMRS)." (2015). https://digitalrepository.unm.edu/educ_teelp_etds/37

i
Christiana M. Sisneros Candidate
Teacher Education, Educational Leadership and Policy Department
This dissertation is approved, and it is acceptable in quality and form for publication:
Approved by the Dissertation Committee:
Allison M. Borden, Ed.D., Chairperson
Arlie Woodrum, Ed.D., Committee Member
Sheri Williams, Ed.D., Committee Member
David Bower, Ed.D., Committee Member

ASSESSING INSTRUCTIONAL LEADERSHIP IN RURAL NEW MEXICO ii
Assessing instructional leadership in rural New Mexico: An exploration of the reliability and
validity of the Principal Instructional Management Rating Scale (PIMRS)
by
Christiana M. Sisneros
B.A., Business Education, College of Santa Fe, 1990
M. Ed., Education Administration, New Mexico State University, 1996
DISSERTATION
Submitted in Partial Fulfillment of the
Requirements for the Degree of
Doctor of Educational Leadership
The University of New Mexico
Albuquerque, New Mexico

ASSESSING INSTRUCTIONAL LEADERSHIP IN RURAL NEW MEXICO iii
Dedication
To my children
David J. and Kristen M. Sisneros,
you have made me stronger,
better and more
fulfilled than I could ever imagine.
I love you to infinity and beyond.

ASSESSING INSTRUCTIONAL LEADERSHIP IN RURAL NEW MEXICO iv
Acknowledgements
I am grateful for many individuals who have assisted me in this five-year journey. I wish to
acknowledge and sincerely thank:
My dissertation chairperson, Dr. Allison Borden – for her faith, kindness, guidance,
and constant encouragement. I love you more than you will ever know.
My dissertation committee members – Dr. Arlie Woodrum, Dr. Sheri Williams, and
Dr. David Bower.
My UNM professors – in particular, Dr. Allison Borden, Dr. David Bower, Dr. Rick
Kitchen, Dr. Peter Winograd, and Dr. Arlie Woodrum.
My friends, cohort members, and fellow Norteñas who took this journey with me,
Monica Archuleta, Carol Brown, Myra Maestas, and Vivian Valencia. Puro Amor.

ASSESSING INSTRUCTIONAL LEADERSHIP IN RURAL NEW MEXICO v
Assessing instructional leadership in rural New Mexico: An exploration of the reliability and
validity of the Principal Instructional Management Rating Scale (PIMRS)
by
Christiana M. Sisneros
B.A., Business Education, College of Santa Fe, 1990
M. Ed., Education Administration, New Mexico State University, 1996
Ed. D, Educational Leadership, University of New Mexico, 2015

ASSESSING INSTRUCTIONAL LEADERSHIP IN RURAL NEW MEXICO vi
Abstract
This study examined the validity and reliability of the Principal Instructional Management
Rating Scale (PIMRS; Hallinger, 1985) for use among teachers in a rural school district. The
problem addressed by this study was the need for a well-substantiated tool, which
demonstrated reliable and valid assessments of principal leadership skills among elementary
and secondary teachers. Measuring principal leadership behaviors is valuable and necessary
for the on-going study of the phenomenon of effective school leadership.
This was a study involving one rural, northern New Mexico school district, with an
enrollment of approximately 4,000 students and a teacher population of 214. The survey was
administered at a teacher staff meeting by the researcher and a research assistant. The
participants were assured the anonymity and confidentiality of their responses and their ability
to terminate participation at any time and for any reason without repercussion.
The sample consisted of five elementary principals and 162 elementary and secondary
teachers in a northern New Mexico school district. Descriptive statistics were calculated and
correlation coefficients were estimated to analyze and examine the degree to which
relationships existed between the teacher and principal demographics and the instructional
leadership behaviors of principals. Results indicate a statistically significant relationship
between the number of years the teacher has worked with the current principal and 9 out of 10
instructional behavior subcategories. There was also a statistically significant relationship
between the years of experience teachers had and the teachers’ perception of the principals’
instructional behaviors in coordinating curriculum, monitoring student progress, and
providing incentives for teachers and students.
In this study, I tested reliability by estimating Cronbach’s alpha reliability coefficient.
Eight of the 10 functional subscales fell in the excellent range and two in the good range
(George & Mallery, 2003). In Hallinger’s (1983) original study, three of the 10 functional
subscales fell in the excellent range and seven in the good range. I assessed construct validity
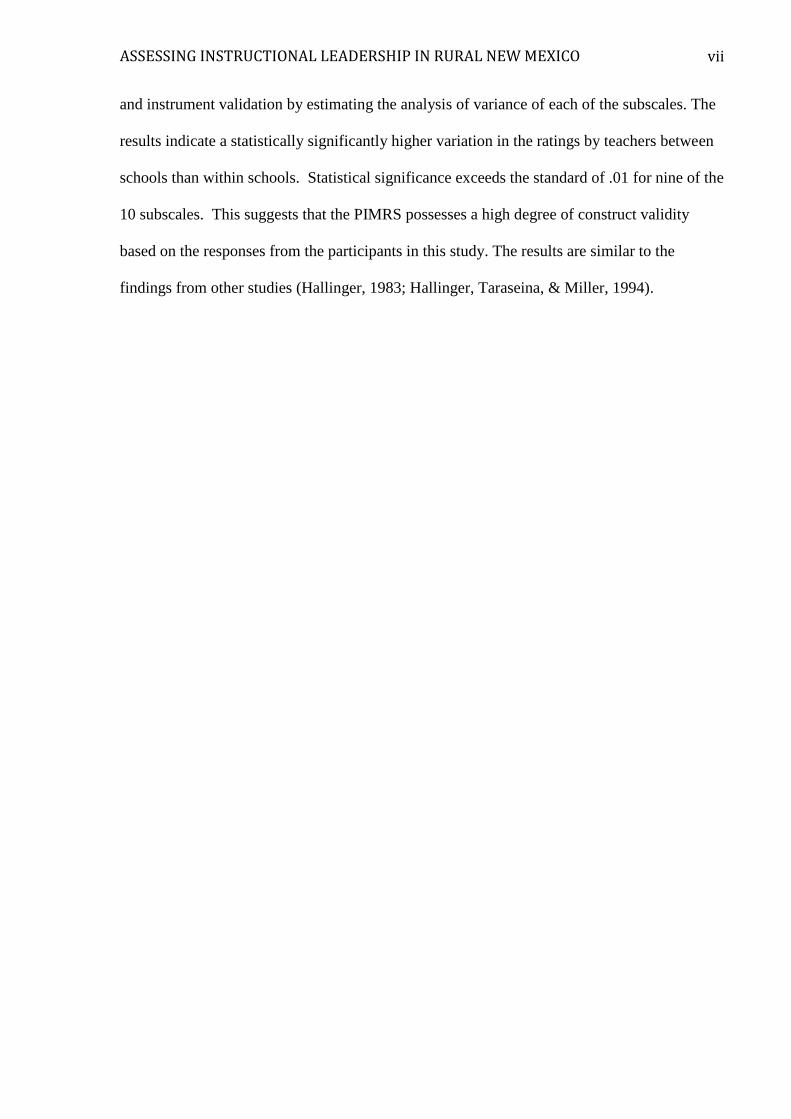
ASSESSING INSTRUCTIONAL LEADERSHIP IN RURAL NEW MEXICO vii
and instrument validation by estimating the analysis of variance of each of the subscales. The
results indicate a statistically significantly higher variation in the ratings by teachers between
schools than within schools. Statistical significance exceeds the standard of .01 for nine of the
10 subscales. This suggests that the PIMRS possesses a high degree of construct validity
based on the responses from the participants in this study. The results are similar to the
findings from other studies (Hallinger, 1983; Hallinger, Taraseina, & Miller, 1994).

ASSESSING INSTRUCTIONAL LEADERSHIP IN RURAL NEW MEXICO viii
Table of Contents
Dedication ................................................................................................................................ iii
Acknowledgements ................................................................................................................... iv
Abstract ..................................................................................................................................... vi
Table of Contents ................................................................................................................... viii
Chapter 1 Introduction ............................................................................................................. 11
Setting for the study .................................................................................................................11
History of Rio Arriba County ..................................................................................................12
Native Americans in Rio Arriba ..............................................................................................14
The Tewa People-Ohkay Owingeh and Santa Clara ........................................................ 14
The Athabaskan Peoples .................................................................................................. 16
Western Religion in Rio Arriba ...............................................................................................17
The Fraternidad Piadosa de los Hermanos de Nuestro Padre Jesús Nazareno ................ 17
Santuario do Chimayó...................................................................................................... 18
Formal Education in Rio Arriba ..............................................................................................19
Española Valley .......................................................................................................................20
Española Public Schools .................................................................................................. 20
Statement of the Problem .........................................................................................................21
Purpose of the Study ................................................................................................................23
Research Hypotheses ...............................................................................................................23
Research Questions ..................................................................................................................24
Significance of the Study .........................................................................................................24
Limitations ...............................................................................................................................24
Overview of the Study .............................................................................................................25
Chapter 2 Literature Review .................................................................................................... 26
Title Searches, Articles, Research Documents, and Journals Researched ...............................26
Educational Leadership ............................................................................................................26
Instructional Leadership................................................................................................... 27
Transformational Leadership ........................................................................................... 29
Educational Leaders and Student Achievement .............................................................. 31
Conceptual Framework ............................................................................................................37
Defining the School’s Mission......................................................................................... 38
Managing the Instructional Program ............................................................................... 39
Developing the School Learning Climate ........................................................................ 40
Rural Education and School Leadership ..................................................................................41
Rural America .................................................................................................................. 42
Poverty in Rural America ................................................................................................ 44

ASSESSING INSTRUCTIONAL LEADERSHIP IN RURAL NEW MEXICO ix
Rural New Mexico ........................................................................................................... 45
Challenges Faced by Rural Schools ................................................................................. 47
Access to Curriculum ....................................................................................................... 51
Summary ..................................................................................................................................51
Chapter 3 Research Methods ................................................................................................... 53
Setting and Sample ..................................................................................................................53
Instrument ................................................................................................................................54
Instrument Validity and Reliability .........................................................................................56
Data Collection Procedures ......................................................................................................57
Chapter 4 Findings ................................................................................................................... 62
Demographic Profile of Sample - Teachers .............................................................................62
Demographic Profile of the Sample - Principals ..................................................................... 63
Teachers’ Perceptions of the Principals’ Instructional Management ......................................63
Communicates the School’s Goals .................................................................................. 69
Supervises and Evaluates Instruction ............................................................................... 70
Coordinates the Curriculum ............................................................................................. 71
Monitors Student Progress ............................................................................................... 73
Protects Instructional Time .............................................................................................. 74
Maintains High Visibility ................................................................................................ 75
Provides Incentives for Teachers ..................................................................................... 76
Promotes Professional Development ............................................................................... 77
Provides Incentives for Learning ..................................................................................... 78
Principals’ Self-Ratings of Instructional Management ............................................................85
Relationships between demographic factors and subscale scores ........................................... 92
Reliability ................................................................................................................................. 94
Cronbach’s alpha ............................................................................................................. 94
Validity .................................................................................................................................... 95
Summary ..................................................................................................................................97
Research Question 1 ........................................................................................................ 97
Research Question 2 ........................................................................................................ 98
Chapter 5 Conclusions and Recommendations ........................................................................ 99
Research Questions and Explanation of Findings ...................................................................99
Limitations .............................................................................................................................101
Implications............................................................................................................................ 102
Directions for Future Research ..............................................................................................103
Addressing the Challenges of Rural School Principals .........................................................103
Summary ................................................................................................................................ 104
References .............................................................................................................................. 106

ASSESSING INSTRUCTIONAL LEADERSHIP IN RURAL NEW MEXICO x
Appendix A Correspondence with Dr. Hallinger .................................................................. 124
Appendix B UNM IRB Approval .......................................................................................... 125
Appendix C PIMRS-Teacher Form ....................................................................................... 127
Appendix D Information Sheet .............................................................................................. 135
Appendix E Survey Administration Script ............................................................................ 137
Appendix F Raffle Ticket ...................................................................................................... 138
Appendix G IRB Approval- Amendment/Modification Principal Form ............................... 139
Appendix H PIMRS-Principal Form ..................................................................................... 141

ASSESSING INSTRUCTIONAL LEADERSHIP IN RURAL NEW MEXICO 11
Chapter 1
Introduction
Setting for the study
Rio Arriba County, established in 1852, was one of the nine original counties of the
New Mexico Territory. It is located in central northern New Mexico, bordering southern
Colorado (Torrez & Trapp, 2010; Viva New Mexico, 2014; Wroth, 2014). "Rio Arriba"
means Upper River; the county is so named because the Rio Grande runs through it. Under
Mexican rule established in 1821, New Mexico was divided into two territories, Rio Arriba
and Rio Abajo, the “Lower River,” comprising everything south of Santa Fe (Torrez, 2010).
According to the U.S. Census Bureau, the county has a total area of 5,896 square miles
of which 5,858 square miles is land and 38 square miles is water (United States Census
Bureau, 2014). The total Rio Arriba County population in 2010 was 40,246, which had
dropped 2.29% since 2000 (United States Census Bureau, 2014).
In 2010, Rio Arriba County had 6.8% of its population under the age of five, and
24.1% under the age of 18. According to the US Census, Rio Arriba county had 71.3% of its
population identified as Hispanic, 16.05% identified as Native American, 13.3% White, and
3.5% Other. Sixty-two percent of the persons asked reported they sometimes or always spoke
a language other than English in the home (United States Census Bureau, 2014).
Within Rio Arriba County, 21% of the inhabitants have less than a high school
education, 30% have graduated from high school, and 32% have some college or an
associate’s degree. Slightly more than 9% have a bachelor’s degree and 6.7% have a degree
above a bachelor’s degree. Approximately 19% of the population lives in poverty (United
States Census Bureau, 2014).
There are six school districts in Rio Arriba County. The largest school district is
Española Public Schools with 4,000 students and 280 teachers; the smallest school district is
Jemez Mountain Schools with 316 students and 30 teachers. The remaining four districts each

ASSESSING INSTRUCTIONAL LEADERSHIP IN RURAL NEW MEXICO 12
have fewer than 1,000 students enrolled in their schools and have between 25-65 teacher
employees. In Rio Arriba County, the educational services, health care, and social services
are the largest employers, with 23% of the population employed in these areas.
There are 37 communities, villages, and towns in Rio Arriba. The largest town is
Española.
History of Rio Arriba County
The history of Rio Arriba County dates back to 1823, originally known as Villa de
Santa Cruz de la Cañada. Villa de Santa Cruz de la Cañada was one of four districts created
by the territorial council (Torrez & Trapp, 2010). In 1844, New Mexico reorganized into three
regions designated as the northern, central and southern districts. The northern district
consisted of Rio Arriba and Taos (Torrez & Trapp, 2010).
In 1846, New Mexico was occupied by the American Army of the West led by
General Kearny. In August 1846, Kearny's forces of about 1,600 soldiers seized control of
Santa Fe and organized a new civilian government for New Mexico, promising a democratic
administration (PBS, 2014). The new political organization for New Mexico was known as
the “Kearny Code” (New Mexico Compilation Commission, 2014). This new law organized
local government and district courts around seven districts: Santa Fe, San Miguel del Bado,
Rio Arriba, Taos, Santa Ana, Bernalillo, and Valencia. Socorro and Dona Ana were later
added to complete the nine New Mexico Territory counties (Figure 1) (Torrez & Trapp,
2010).

ASSESSING INSTRUCTIONAL LEADERSHIP IN RURAL NEW MEXICO 13
Figure 1. Map of New Mexico and Arizona shows the long, narrow strip that constituted early
Rio Arriba County (American History and Genealogy Project-New Mexico, 2014).
In 1863, Arizona was created as a separate territory, considerably changing the Rio
Arriba County boundaries, and in 1880 the county again experienced changes when new
north-south boundaries were created and all of western Taos County was ceded to Rio Arriba
County (Figure 2) (Torrez & Trapp, 2010).

ASSESSING INSTRUCTIONAL LEADERSHIP IN RURAL NEW MEXICO 14
Figure 2. Map of New Mexico, 1880 Reorganization of Rio Arriba and Taos County
Boundaries (Peralta & Hayes, 2014).
Native Americans in Rio Arriba
Long before Rio Arriba was formed, Native Americans traveled along the Rio Grande
and its principal tributary, the Rio Chama. As far back as the fourteenth century, small
villages sprung up along the Rio Chama, El Rito Creek, the Ojo Caliente, Abiquiú, Cañones
and the Rio Oso (Torrez & Trapp, 2010).
The Tewa People-Ohkay Owingeh and Santa Clara
The Tewa people, also known as Pueblo Indians, lived along the Rio Grande. The
Tewa People comprise Nambé, Pojoaque, San Ildefonso, Ohkay Owingeh, Santa Clara, and
Tesuque Pueblos. Ohkay Owingeh and Santa Clara are located in Rio Arriba County (Rio
Arriba County, 2011; Torrez & Trapp, 2010).
Ohkay Owingeh is a pueblo located in Rio Arriba County; the Tewa name of the
pueblo means “place of the strong people.” Juan de Oñate arrived with his colonization
expedition in 1598 and settled in Ohkay Owingeh, renaming it San Juan de Los Caballeros

ASSESSING INSTRUCTIONAL LEADERSHIP IN RURAL NEW MEXICO 15
and establishing what is considered the first European capital of New Mexico (Rio Arriba
County, 2011; Torrez & Trapp, 2010; Wroth, 2014).
Oñate’s main purpose in colonizing New Mexico was to discover gold and silver
mines, but he soon realized there was nothing of value and returned to Mexico in 1607 (Riley,
1995; Wroth, 2014). By 1675, after years of suffering under Spanish rule, discontent among
the Pueblo peoples came to a head when 47 Pueblo religious leaders were jailed, among those
leaders was a medicine man name Popé, who was born and raised in San Juan Pueblo. After
his capture and release he moved to Taos, where he established his base of operations and
went on to plot with confederates to drive Hispanic settlers out of New Mexico (Aragón,
2006; Riley, 1995; Torrez & Trapp, 2010; Wroth, 2014).
From 1680-1692, Popé and his followers set out to remove all signs of the Spanish,
beginning with the churches. Church records and crosses in the cemeteries were burned and
Indians who had converted to Catholicism had to wash off the effects of baptism. Popé
insisted on doing away with everything introduced by the Spanish, except for paying taxes.
Popé and his men collected food, blankets, and other supplies as forms of taxes (Burke, 1973).
In 1685, Popé lost power and was replaced by his lieutenant. He regained his position in 1688,
dying a year later (Burke, 1973).
In the eighteenth century, Spanish authority adopted a much more lenient attitude, no
longer forcing Pueblo people into labor, or suppressing religious rites (Ortiz, 1979). In
December of 2005, the tribal council formally changed the name from San Juan Pueblo back
to Ohkay Owingeh (Torrez & Trapp, 2010; Wroth 2014).
Santa Clara Pueblo was established around 1550 and is located in southern Rio Arriba
County; the traditional name is Kha’p’oo Owinge (Indian Pueblo Cultural Center, 2014).
Santa Clara Pueblo is famous for its handcrafted and elaborately rendered red and black
pottery (Torrez & Trapp, 2010).

ASSESSING INSTRUCTIONAL LEADERSHIP IN RURAL NEW MEXICO 16
The Athabaskan Peoples
The Athabaskans (Apachean) constitute various Apache groups that became known as
Navajo. Scholars (Ortiz, 1979; Riley, 1995; Torrez & Trapp, 2010) suggest that the
Athabaskans were partially responsible for the abandonment of the Anasazi cultural region
around the Four Corners.
The Jicarilla, named “little basket” for the baskets they wove, are one of the six major
Athabaskan groups that migrated out of Canada to the southwest, emerging during the 1600s,
after the Spanish arrived in New Mexico (Jicarilla Apache Nation, 2014; Torrez & Trapp,
2010). The Jicarilla are organized into two bands that occupied and lived in the diverse plains
or mountain regions; they are the Llaneros, or the plains people, who lived in the plains of
northeast New Mexico, and the Olleros, or the mountain-valley people, who migrated
annually to the Rio Grande Valley (Jicarilla Apache Nation, 2014; Torrez & Trapp, 2010).
During the 1850s, the United States government tried to negotiate several treaties with
the Jicarilla in an attempt to establish a reservation. The U.S. Congress never approved the
treaty. Open warfare with the Jicarilla broke out in 1854 because of their raids on settlements
and stealing of livestock (University of Michigan, 2014).
During the eighteenth century, Spanish authorities had an ally in the Jicarilla because
they both had a common enemy in the Comanche. The Spanish recruited the Jicarilla in
military action against the Comanche. In 1779 Governor Juan Bautista de Anza and his troops
along with 200 Jicarilla, Ute, and Pueblo defeated the Comanche (Tiller, 1983; Worth, 2014).
In 1874, the Jicarilla entered into a treaty with the United States government that
created a reservation for them along the San Juan River, which was later rescinded by
President Hayes who ordered the Jicarilla to move to the Mescalero reservation in southern
New Mexico. The Jicarilla ignored the order and stayed in northern New Mexico (Tiller,
1983; Torrez & Trapp, 2010). It was not until 1887 that President Cleveland issued an

ASSESSING INSTRUCTIONAL LEADERSHIP IN RURAL NEW MEXICO 17
Executive Order making Dulce the permanent home of the Jicarilla Apache (Tiller, 1983;
Torrez & Trapp, 2010; Worth, 2014).
Today the Jicarilla Apache Reservation covers 850,000 acres along the western border
of Rio Arriba County and was incorporated officially as the Jicarilla Apache Nation in 1937
under the Indian Reorganization Act of 1934 (Jicarilla Apache Nation, 2014). The tribe has
negotiated oil and gas leases, managed timber and livestock resources, developed an elk
preserve widely known for its trophy hunting and operated a casino (Jicarilla Apache Nation,
2014; Torrez & Trapp, 2010).
Western Religion in Rio Arriba
Spanish explorers came to New Mexico for three things: glory, gold, and God
(Archdiocese of Santa Fe, 2014a; Wroth, 2014). The Pueblo and Navajo Indians practiced the
first Western religions in New Mexico. Franciscan missionaries arrived at the time of
Coronado's conquest in 1540, and the first Roman Catholic Church in the state was built in
1598. Roman Catholicism has long been the dominant religion, though from the mid-1800s
there has also been a steady increase in the number of Protestants. The first Baptist
missionaries arrived in 1849, the Methodists in 1850, and the Mormons in 1877 (Ortiz &
Reichelt, 2014; Torrez & Trapp, 2010).
Jewish history in New Mexico started centuries ago when New Mexico was still a
territory. Fleeing the Inquisition, a number of Jewish colonists settled in New Mexico in the
17th
and 18th
centuries. Many Jews converted to Catholicism under pressure, privately holding
on to Jewish practices and rituals such as the Sabbath and candle lighting (New Mexico
Jewish Historical Society, 2014; Ortiz & Reichelt, 2014).
The Fraternidad Piadosa de los Hermanos de Nuestro Padre Jesús Nazareno
The Penitente brotherhood was central to village life in Rio Arriba. The Fraternidad
Piadosa de los Hermanos de Nuestro Padre Jesús Nazareno is a confraternity of Spanish-
American men from northern New Mexico, Tomé, and southern Colorado. This group was

ASSESSING INSTRUCTIONAL LEADERSHIP IN RURAL NEW MEXICO 18
devoted to providing aid and community charity, the spirit of penance, and the Passion of
Jesus Christ (Brown, 1978). Each year during Lent, the Penitentes re-enact the Passion of the
Savior through the use of art, song, and atonement (Tate, 1968).
Penitential activities were introduced into New Mexico with the arrival of Don Juan de
Oñate and his colonists in 1598 (Aragón, 2006). During the Great Pueblo Rebellion in 1680,
churches and sacred images were destroyed. A small group of Spaniards survived and made
their way to El Paso del Norte, taking with them the image of Nuestra Señora del Rosario
(Our Lady of the Rosary, Our Lady of the Conquest) (Burke, 1973). Penitentes carried out
many religious functions themselves because of the scarcity of priests for most of the 17th
and
18th
centuries (Aragón, 2006). Bishop José Antonio de Zubiria visited northern New Mexico
in 1833. He condemned the Penitentes and their activities (Aragón, 2006; Ortiz & Reichelt,
2014). In 1845, Bishop Zubiria returned to New Mexico, again admonishing the Penitentes,
forcing the Penitentes to become more secretive (Aragón, 2006; Ortiz & Reichelt, 2014). In
1851, Jean Baptiste Lamy was appointed the first American Bishop of New Mexico. He also
condemned the Penitentes (Horgan, 1975).
Santuario do Chimayó
Each year, thousands of people journey to a small adobe church in Chimayó, New
Mexico, especially during Holy Week, the week leading up to Easter Sunday. They come in
search of spiritual or physical healing. Pilgrims walk from near and far, some are barefoot,
some carrying crosses. Some walk as an expression of their culture and beliefs, some walk to
give thanks for answered prayers, and some walk to pray for divine intercession, healing for
themselves or their loved ones (Archdiocese of Santa Fe, 2014b). They believe the church was
built on ground that possesses healing powers (Holy Family of Chimayo, 2014). The land
where the Santuario now stands belonged to Don Bernardo Abeyta, one of the first members
of Los Hermanos de la Fraternidad Piadosa de Nuestro Padre Jesús Nazarena (the
Penitentes) in the area (Carrillo, 1999).

ASSESSING INSTRUCTIONAL LEADERSHIP IN RURAL NEW MEXICO 19
Formal Education in Rio Arriba
Formal education in New Mexico dates back to as early as 1524, when schools were
established to teach Latin, music, and academic subjects to native youth (Torrez & Trapp,
2010). The Royal and Pontifical University of Mexico were established in 1551. In 1630,
Franciscan Friars were in charge of educating the Spanish and Indians to read and write and
educate them in “acts of civilized society” (Torrez & Trapp, 2010, p. 192). In 1721, free
public schools were established in the Pueblos and in all the Spanish settlements by order of
the King of Spain, and they were to be run by the Franciscans (Hallenbeck, 1950). Pueblos
and Spanish settlements during this period included Socorro, Sevilleta, Santa Fe, San Juan,
Taos, Santa Cruz de la Cañada, Zuni, Laguna, and Sandia (Jenkins & Shroeder, 1974). By the
nineteenth century, there was little evidence of public schooling in New Mexico (Moyer,
1941).
In 1822, the territorial council issued new regulations for schools. Town councils
developed their own procedures to recruit, hire, and pay public school teachers and made it a
criminal offense for parents to keep their children from attending school (Mondragón &
Stapleton, 2005). By 1827, there were nineteen schools located in Santa Fe, Cochiti, San Juan,
Zia, Sandia, Alameda, Albuquerque, Vado, Tomé, Belén, Santa Cruz de La Cañada, Laguna,
Abiquiú, and San Miguel (Mondragón & Stapleton, 2005). A lack of funding limited the
success of free public schooling and the neglect continued throughout the American territorial
period and into the early stages of statehood (Mondragón & Stapleton, 2005; Torrez & Trapp,
2010). Only one public school, located in Santa Fe, was reported in 1846 (Torrez & Trapp,
2010).
In 1856, the territorial legislature called for an election to approve the statute for free
public schooling in four counties: Taos, Rio Arriba, Santa Ana, and Socorro. All four counties
voted against the bill (Torrez & Trapp, 2010). In 1860, the territorial legislature passed “An
Act Providing Means for the Education of Children” (Mondragon & Stapleton, 2005, p. 19),

ASSESSING INSTRUCTIONAL LEADERSHIP IN RURAL NEW MEXICO 20
placing the local Justice of the Peace in charge of appointing a person from each community
to teach children. The law made attendance at school mandatory and threatened parents with
fines if they failed to comply (Mondragón & Stapleton, 2005). Under this law, children could
be exempt from attending if they were being home schooled, or if the father decided that he
needed to employ the children (Torrez & Trapp, 2010).
In 1872, a law was passed to establish a board of supervisors and directors for public
schools in each county. Rio Arriba County, under this system, had seventeen public schools
with a total of 270 students (Gallegos, 1992). In 1884, the legislature revised the public school
law and established the position of school superintendent for each county (Gallegos, 1992;
Torrez & Trapp, 2010). In 1891, the Superintendent of Public Instruction in Rio Arriba
County reported that there were thirty-six schools with a total enrollment of 1,786 students.
Española Valley
Española was founded in 1880 as a railroad village and incorporated as a city in 1925
(City of Espanola, 2014). Española Valley is in two counties, Rio Arriba and Santa Fe (Torrez
& Trapp, 2010). The town of Española is located on the west side of the Rio Grande River,
surrounded by ten other communities. These communities are: Santa Cruz, Sombrillo, San
Pedro, Riverside, Santo Nino, Fairview, Ranchitos, El Llano, Corral de Piedra and La
Angostura (Torrez & Trapp, 2010). Española has a population of 10,224. Española is made
up of 85% Hispanics, 1.9% Native Americans, 9.5% White, 0.7% African American, 1.2%
Asian and 1.7% Other. Nearly 4,700 families reside in the city (United States Census Bureau,
2014).
Española Public Schools
The Española Public School District serves students in Española, Chimayó, Santa
Cruz, Sombrillo, Alcaldé, Velardé, Dixon, Abiquiú, Hernandez, Cordova, Truchas, and the
Ohkay Owingeh and Santa Clara Pueblos.

ASSESSING INSTRUCTIONAL LEADERSHIP IN RURAL NEW MEXICO 21
The school district has 3,809 students enrolled in grades K-12 with the following
demographics: 88% Hispanic, 6% Native American, 5% Anglo, <1% Asian, <1% African
American, 19% English Language Learners (ELL), 14% Special Education (SPED) and 97%
socio-economically disadvantaged (SED) (see Table 1).
Table 1
Student Demographics of Española Public Schools
School
Total
Enrollment
Hispanic Native
American
Anglo Asian Black FRL SPED
Elem 1 121 96% 1% 2% - - 100% 14%
Elem 2 167 99% - <1% - - 100% 16%
Elem 3 146 97% 1% 1% - <1% 100% 18%
Elem 4 71 74% 1% 24% - 1% 100% 20%
Elem 5 323 91% 2% 7% <1% - 100% 16%
Elem 6 153 95% 1% 3% <1% <1% 100% 8%
Elem 7 432 85% 6% 6% 3% <1% 100% 17%
Elem 8 398 73% 24% 3% - - 100% 14%
Elem 9 294 94% 1% 3% 1% <1% 100% 13%
Elem 10 82 96% - 4% - - 100% 11%
Mid Sch. 526 90% 5% 4% 1% - 100% 12%
High Sch. 961 87% 5% 6% 1% <1% 57% 12%
Total/Average 3,809 88% 6% 5% <1% <1% 96% 14%
The eleven elementary schools are located in different geographical areas of the school
district, so the demographics for each school vary slightly from the overall district
demographics as shown in Table 1. Total enrollments at the 11 elementary schools range from
a school with only 67 students to one with 398 students. The district has one middle school
with an enrollment of 526 students and one high school with 961 students; both are located
within the city of Española. Two elementary schools shared the same principal and one
elementary school had a head teacher who was not eligible to participate in the study.
Statement of the Problem
Measuring the behaviors of school leaders is valuable and necessary for the on-going
study of effective school reform. There is a gap in the literature; however, as there are limited
studies conducted in small or rural school communities.

ASSESSING INSTRUCTIONAL LEADERSHIP IN RURAL NEW MEXICO 22
Challenges
During the past seven years the district experienced notable changes in school
leadership:
The district has experienced extensive turnover in superintendents. Between school
years 2007 and 2012 the school district had five different superintendents.
Superintendent mobility averaged 67%. I calculated this percentage based on the
number of superintendents the district has had in the past 10 years. This led to
instability at the district level in terms of monitoring program implementation and
implementation of goals and objectives, as many of the incoming superintendents did
not have adequate knowledge of the goals and objectives of reforms such as the
implementation of the mathematics and reading curriculums.
Equally, school sites have also experienced turnover, with each school averaging four
principals in the school years between 2007 and 2012. In those five years, one school
site has had as many as seven principals. Three schools have had five principals. Four
schools have had four principals and three have had three principals. Principal
mobility averaged 75% throughout the seven-year cycle. I calculated principal
mobility based on the turnover of principals at each school site over a seven-year
cycle. This led to instability at the school site level in terms of monitoring program
implementation and implementation of goals and objectives, as many of the incoming
administrators did not have adequate knowledge of the goals and objectives of reforms
such as the implementation of the mathematics and reading curriculums.
Although not formally measured, based on my experience in and knowledge of the
district, teacher mobility between schools and grade levels was also high. This has had much
of the same effect as administrative mobility. High rates of teacher mobility can have a
negative impact on student achievement (Grissom, 2009). Schools serving low income and
minority students are often the ones hurt most by teacher turnover (Barnes, 2007).

ASSESSING INSTRUCTIONAL LEADERSHIP IN RURAL NEW MEXICO 23
Purpose of the Study
The purpose of this study is to further add to the discussion on effective schools and
effective school leadership. The study examines the validity and reliability of the Principal
Instructional Management Rating Scale (Hallinger, Murphy, Well, & Mesa, 1983) based on
the responses from teachers and principals in a small school district in New Mexico. Although
the PIMRS has been normed in larger districts, its use for research with rural school districts
has been limited. Through this study, I sought to determine if the PIMRS could be a useful
tool to measure principal leadership behaviors in a northern New Mexico, rural,
predominantly Hispanic-serving school district. It is important to note that the PIMRS does
not measure an administrator’s effectiveness. Rather, it assesses the degree to which a
principal is providing instructional leadership in his/her school as perceived by the teachers
and according to the principal’s self-assessment (Hallinger, 2013).
I was not looking at superintendent practices or the perceptions of superintendents of
principals’ instructional leadership behaviors. In their review of the literature on policies and
practices of principal evaluation, Davis, Kearney, Sanders, Thomas, & Leon (2011) cited
McInerney and Fletcher’s (1995) study of Indiana public school district superintendents,
which found differences between what superintendents valued and the content of the actual
principal evaluation frameworks: “Perceptions regarding the purposes, processes, and
outcomes of evaluation often vary between principals and superintendents” (p. 13).
Research Hypotheses
This research concerning the reliability and validity of the PIMRS tested the following
hypotheses:
1. There is no difference in the measures of internal consistency yielded from this
study when compared with the measures yielded from previous research.
2. The PIMRS is not a valid measure of rural teachers’ perceptions of their
principals’ instructional behaviors.

ASSESSING INSTRUCTIONAL LEADERSHIP IN RURAL NEW MEXICO 24
Research Questions
This study was guided by these two research questions:
1. Based on the Principal Instructional Management Rating Scale (PIMRS), how do
teachers in the Española Public Schools perceive the instructional management of
their principals?
2. To what extent is the PIMRS reliable and valid when administered to a sample of
teachers and principals from a rural, northern New Mexico, predominantly
Hispanic-serving school district?
Significance of the Study
The findings from this study will inform the current body of research regarding
measurement of principals’ instructional management strategies as perceived by teachers and
as assessed by the principals themselves. If the PIMRS is a valid and reliable tool, the
information collected via this instrument could assist district leaders and policy makers in
improving instructional management behaviors and strategies among principals as perceived
by teachers and in response to the principals’ self-assessments. This information will be useful
for practitioners who have a need for reliable measures of principal instructional leadership in
small and rural districts.
Limitations
As is the case with all research, this study had limitations. The first limitation was the
inclusion of only one district in the study. The district is a small one, with 11 elementary
schools, one middle school, and one high school, and therefore the findings cannot be
generalized to other geographic regions with similar demographic characteristics.
The second limitation was that two of the 11 elementary schools were not included in
the study because the schools did not have a certified principal, but rather a lead teacher.

ASSESSING INSTRUCTIONAL LEADERSHIP IN RURAL NEW MEXICO 25
Overview of the Study
The design of this study includes the framework set out by Hallinger (1983), where a
questionnaire was distributed to teachers and the results were used to conduct a reliability and
validity study. A questionnaire was disseminated to all kindergarten to twelve grade teachers
and the principals of each school in the district. The instrument, developed by Hallinger
(1983), is known as the Principal Instructional Management Rating Scale (PIMRS). The
teachers were asked to rate their principals and principals were asked to rate themselves on ten
categories of instructional management where each category has five different questions. The
results were aggregated to assign an average category score for principals at each level
(elementary and secondary). This resulted in profiles of principal instructional management as
perceived by the teachers.

ASSESSING INSTRUCTIONAL LEADERSHIP IN RURAL NEW MEXICO 26
Chapter 2
Literature Review
The purpose of this research study was to examine the validity and reliability of the
Principal Instructional Management Rating Scale (PIMRS). This chapter includes a review of
the literature of the historical and current perspectives in the area of leadership. The intent of
this literature review is to present an introduction, analyze the existing literature, conclude
with a summary, and state the specific research questions and hypotheses developed from the
review and that were examined in this study.
Title Searches, Articles, Research Documents, and Journals Researched
The intent of the literature review for this study was to examine the principal’s
leadership practices and how they are related to student success. I conducted an extensive
exploration of peer-reviewed articles, expanded title searches, research documents from
professional journals located on ProQuest, EBSCO, and other electronic library portals. The
database searches included key terms or phrases such as: No Child Left Behind, school
leadership, effective school leadership, Principal Instructional Management Rating Scale,
transformational leadership, rural education, and school accountability.
Educational Leadership
The concept and definition of leadership have been a matter of discussion among
scholars for years. Defining leadership is difficult because it involves a multitude of follower
interactions, which take place in many different types of organizations and environments
(Leithwood & Duke, 1999). Leadership is based on organizational improvement (Leithwood,
Day, Sammons, Hopkins, & Harris, 2006; Marzano, Waters, & McNulty, 2005), setting
direction within the organization (Leithwood, Jantzi, & Steinbach, 1999; Leithwood et al.,
2006; Yukl, 2006), and the importance of leader influence (Jantzi & Leithwood, 1996;
Leithwood & Duke, 1999; Leithwood & Jantzi, 1999a; Leithwood et al., 2006; Yukl, 2006).
Yukl (2006) defined leadership as “the process of influencing others to understand and agree

ASSESSING INSTRUCTIONAL LEADERSHIP IN RURAL NEW MEXICO 27
about what needs to be done and how to do it, and the process of facilitating individual and
collective efforts to accomplish shared objectives” (p. 8).
A growing body of research evidence indicates that school principals and the decisions
they make at the school level are critical to raising student achievement (Leithwood, 2004).
Principals need to have an understanding of instructional practices that contribute to student
academic success and the capacity to work with school staff to implement these practices
(Hoachlander, Alt, & Beltranena, 2001). The No Child Left Behind Act (NCLB) (Public Law
107-110, 2002) made principals accountable for student success, demanding principals have
knowledge and skills that had not been expected of principals in the past (Heck & Hallinger,
1999; Hoachlander, Alt, & Beltranena, 2001).
Instructional leadership models began to emerge in the late 1970s into the early 1980s
via the effective schools research, which identified strong, directive leadership focused on
curriculum and instruction from the principal as an effective characteristic (Edmonds, 1979;
Leithwood & Montgomery, 1982). Leadership can be described by two core functions,
providing direction and exercising influence (Leithwood & Louis, 2012). Leadership is about
organizational improvement, establishing direction and doing whatever it takes to support
people to move in that direction (Leithwood & Louis, 2012). The school principal plays a
central role in education and is seen as a building manager, administrator, politician, change
agent, and instructional leader (Wood, Finch, & Mirecki, 2013).
Two of the most common models are instructional leadership and transformational
leadership (Heck & Hallinger, 1999); these two models focus on how administrators and
teachers improve teaching and learning (Stewart, 2006).
Instructional Leadership
Instructional leaders focus on school goals, the curriculum, instruction and the school
environment (Stewart, 2006). Hallinger’s (2003) most frequently used conceptualization of
instructional leadership proposes three dimensions: defining the school’s mission, managing

ASSESSING INSTRUCTIONAL LEADERSHIP IN RURAL NEW MEXICO 28
the instructional program, and promoting a positive school learning climate. Effective
instructional leaders are involved in curricular and instructional issues that directly affect
student achievement (Cotton, 2000). School leaders have an effect on student learning through
the teachers they hire, how they assign those teachers to classrooms, how they retain teachers,
and how they create opportunities for teachers to improve (Hrong & Loeb, 2010). The
principal who is an instructional leader becomes the primary source of educational expertise
in the building (Hallinger, 1992; Marks & Printy, 2003). The principal is responsible for
managing the school and improving the teaching and learning in the building (Leithwood,
1994). The principal leads the faculty toward attainment of the goals as a means to school
improvement.
The Center for Educational Leadership (2014) included four dimensions of
instructional leadership in its framework: 1) vision, mission, and culture building; 2)
improvement of instructional practice; 3) allocation of resources; and 4) management of
people and processes. The framework is supported by five core beliefs:
1. Instructional leadership is learning-focused, learning for both students and adults,
measured by improvement in instruction and in the quality of student learning.
2. Instructional leadership must reside with a team of leaders of which the principal
serves as the “leader of leaders.”
3. A culture of public practice and reflective practices is essential for effective
instructional leadership and improvement of instructional practices.
4. Instructional leadership addresses the cultural, linguistic, socio-economic and
learning diversity in the school community.
5. Instructional leadership focuses upon the effective management of resources and of
people – recruiting, hiring, developing, evaluating – particularly in changing
environments. (Center for Educational Leadership, 2014, para. 5)

ASSESSING INSTRUCTIONAL LEADERSHIP IN RURAL NEW MEXICO 29
Instructional leaders are “strong, directive leaders” whose “unitary role” (Hallinger,
2003, p. 335) is coordinating, controlling, supervising, and developing curriculum and
instruction in the school (Bamburg & Andrews, 1990; Edmonds, 1979; Hallinger & Murphy,
1985; Leithwood & Montgomery, 1982). Instructional leaders operate from a combination of
expertise and charisma, are goal oriented, focusing on the improvement of students’ academic
outcomes, are viewed as culture builders, and foster high expectations and standards for
teachers and students (Cuban, 1984; Hallinger & Murphy, 1985; Purkey & Smith, 1983).
Instructional leadership has been characterized by some scholars as a directive and
top-down approach to school leadership (Barth, 1990; Day, Harris, Hadfield, 2001; Hallinger,
1992; Marks & Printy, 2003), “with an emphasis on coordinating and controlling others to
move towards goals that may have been set at the top of the organization” (Hallinger, 2003, p.
343). Another flaw in instructional leadership is that, sometimes, great leaders are not great
classroom teachers (Liontos, 1992) and yet instructional leaders must have a solid grounding
in teaching and learning (Liontos, 1992).
Transformational Leadership
Burns (1978) first proposed the concept of transformational leadership in his seminal
work entitled Leadership. Burns studied transformational leadership in relation to political and
business leaders and army officers (1978). Leithwood and his colleagues extended the study
of transformational leadership into the field of education (Stewart, 2006).
Transformational leadership focuses on developing the organization’s capacity to
innovate (Hallinger, 2003). Transformational leaders seek to build the organization’s capacity
to select its purposes and to support the development of changes in the practices of teaching
and learning (Hallinger, 2003). Leithwood, Jantzi, and Steinbach (1998) argued that
transformational leadership moves schools beyond first-order, surface changes to second-
order, deeper transformations that alter pedagogy, curriculum and assessment.

ASSESSING INSTRUCTIONAL LEADERSHIP IN RURAL NEW MEXICO 30
Transformational leaders develop a shared vision and build goal consensus, hold high
performance expectations for teachers and students (Jantzi & Leithwood, 1996; Leithwood,
1994; Leithwood, Jantzi, & Steinbach, 1998; Leithwood et al., 1999; Leithwood & Jantzi,
2005; Leithwood & Jantzi, 2006; Leithwood & Duke, 2006). Transformational leaders
provide support, acting as mentors or coaches to staff, and support teacher professional
development. They provide intellectual stimulation by challenging staff assumptions, and
encouraging their creativity (Jantzi & Leithwood, 1996; Leithwood, 1994; Leithwood, Jantzi,
& Steinbach, 1998; Leithwood et al., 1999; Leithwood & Jantzi, 2005, 2006; Leithwood et al.,
2006; Leithwood & Sun, 2012). Transactional leaders help staff members evaluate their
practices, refine them, and carry out their tasks more effectively while transformational
leaders model valued behaviors, beliefs, and values. They strengthen the culture of the school,
promoting an atmosphere of caring and trust. Leaders build structures to enable collaboration.
They engage parents and the wider community and focus on instructional development (Jantzi
& Leithwood, 1996; Leithwood, 1994; Leithwood, Jantzi, & Steinbach, 1998; Leithwood et
al., 1999; Leithwood & Jantzi, 2005, 2006; Leithwood et al., 2006; Leithwood & Sun, 2012).
Transformational leadership creates commitment, motivation, and empowerment in
individuals. The growth of organizational members transforms both the follower and the
leader as they work together to improve the organization (Burns, 1978).
Scholars have reached varied conclusions on the impact of transformational leadership
on student achievement, including many scholars who have found no relationship between
transformational leadership and student achievement (Griffith, 2004; Leithwood& Jantzi,
2006; Marks & Printy, 2003). Some scholars found weak effects (Barnett & McCormick,
2004). Leithwood and Jantzi (2005), in a review of research studies, found mixed results
between transformational leadership and student achievement. Leithwood et al. (2006) found
that there were combined direct and indirect effects of transformational leadership on student
achievement; the effects were small but educationally significant. Leithwood and his

ASSESSING INSTRUCTIONAL LEADERSHIP IN RURAL NEW MEXICO 31
colleagues found three overarching categories of transformational leadership that had a
positive effect on student achievement: setting direction, developing people, and redesigning
the organization (Leithwood et al., 2006).
Educational Leaders and Student Achievement
Over the past two decades, there has been significant research on the principalship that
indicates that school leaders affect student achievement indirectly through their influence on
the school organization and instructional quality (Hallinger & Heck, 1996; Smylie & Hart,
1999). Strong administrative leadership was among the factors of school effectiveness that
made a difference in student learning (Brookover & Lezotte, 1977; Edmonds, 1979). Only
within the last two decades has empirical research begun to develop links between patterns of
successful leadership practices and the school’s capacity to improve student learning (Day,
Sammons, Hopkins, Harris, Leithwood, Gu, & Brown, 2010; Hallinger, 2003; Leithwood et
al., 2010; Murphy & Meyers, 2008).
Hallinger, Bickman, and Davis (1996) examined the relationship between principal
leadership and student achievement in reading using a structural equation model, finding that
it was possible to detect the indirect effects of principal leadership on student achievement.
Hallinger and Heck (1998) reviewed 43 studies that were conducted between 1980 and 1995
that examined the relationship between the principal leadership and student achievement. In
their analysis they organized the studies into three categories:
1. Direct-effect of the principal leadership on student achievement. This involves
examining the relationship between the principal leadership (e.g. attitude, behavior,
decision-making skills) and student learning without variables (p. 20).
2. Mediated effect of the principal leadership on student achievement through intervening
variables. This is the effect of the principal leadership (e.g. high visibility, instructional
supervision, and modeling of expectations) that will occur indirectly through the

ASSESSING INSTRUCTIONAL LEADERSHIP IN RURAL NEW MEXICO 32
principal’s efforts to influence those who come into more frequent direct contact with
the students (Pitner, 1988).
3. Reciprocal effects where the relationships between leadership efforts and school and
environmental factors are interactive. This approach suggests mediating processes and
school outcomes as affecting principal leadership, as well as leadership affecting those
same processes and outcomes (p. 29).
Hallinger and Heck (1998) saw little evidence of direct effects and few examples of
reciprocal effects, with most evidence pointing to indirect effects, concluding that principals
have a measurable, but indirect, effect on school effectiveness and student achievement.
Studies repeatedly find a principal’s ability to identify and articulate a vision and
having high expectations leads to increased student achievement (Hallinger & Heck, 1999).
Waters, Marzano and McNulty (2003) conducted a meta-analysis examining the effects of
leadership practices on student achievement. They analyzed 70 studies conducted over a 30-
year period and identified 21 leadership responsibilities that are associated with student
achievement (p. 3). Eleven of the 21 leadership responsibilities have a statistically significant
relationship with second-order change (Waters & Cameron, 2007).
Second order change can be defined as dramatic and more intense than incremental or
first order change (Marzano, Waters, & McNulty, 2005). First order change refers to an
extension from past practices and focuses on doing a better job at what is already being done.
Second order change is related to complex change that “alters the system in fundamental
ways, offering a dramatic shift in direction, requiring new ways of thinking and acting”
(Marzano et al., 2005, p. 66). Table 2 outlines the eleven principal responsibilities correlated
with student achievement and second order change. Seven of the 11 had a positive correlation
with second order change (Knowledge of Curriculum, Instruction, and Assessment;
Flexibility; Change Agent; Ideals and Beliefs; Monitor and Evaluate; Intellectual Stimulation;
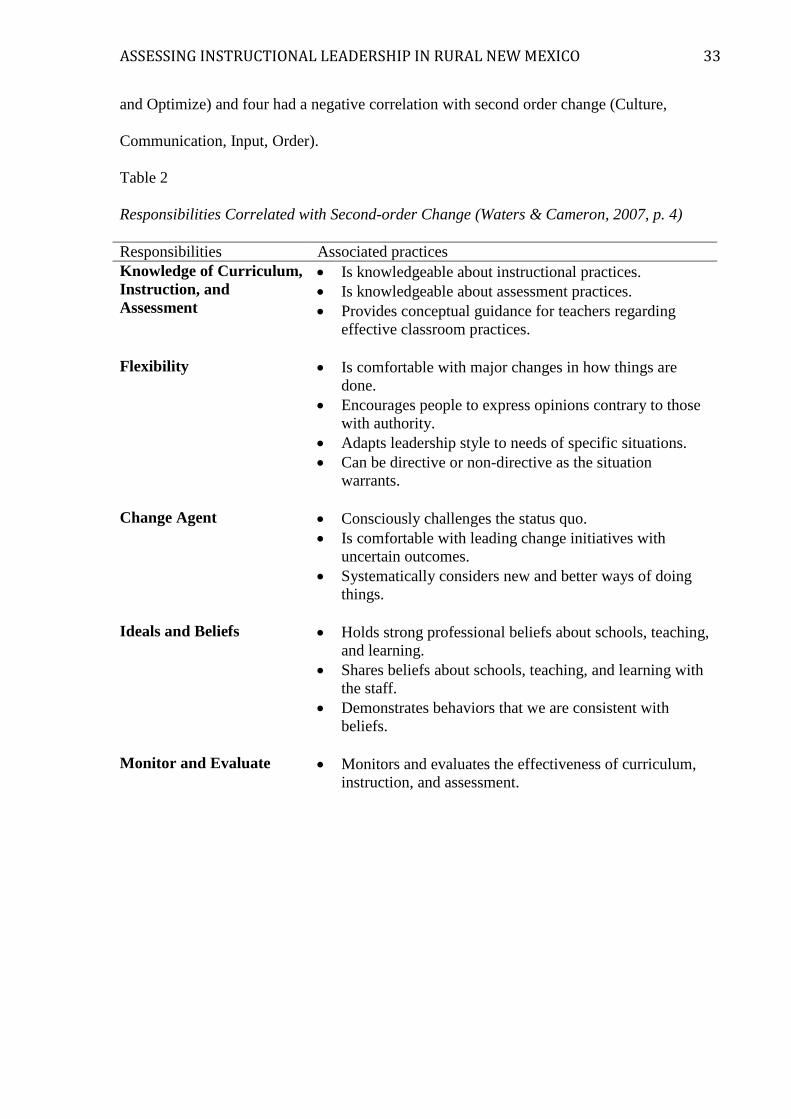
ASSESSING INSTRUCTIONAL LEADERSHIP IN RURAL NEW MEXICO 33
and Optimize) and four had a negative correlation with second order change (Culture,
Communication, Input, Order).
Table 2
Responsibilities Correlated with Second-order Change (Waters & Cameron, 2007, p. 4)
Responsibilities Associated practices
Knowledge of Curriculum,
Instruction, and
Assessment
Is knowledgeable about instructional practices.
Is knowledgeable about assessment practices.
Provides conceptual guidance for teachers regarding
effective classroom practices.
Flexibility Is comfortable with major changes in how things are
done.
Encourages people to express opinions contrary to those
with authority.
Adapts leadership style to needs of specific situations.
Can be directive or non-directive as the situation
warrants.
Change Agent Consciously challenges the status quo.
Is comfortable with leading change initiatives with
uncertain outcomes.
Systematically considers new and better ways of doing
things.
Ideals and Beliefs Holds strong professional beliefs about schools, teaching,
and learning.
Shares beliefs about schools, teaching, and learning with
the staff.
Demonstrates behaviors that we are consistent with
beliefs.
Monitor and Evaluate Monitors and evaluates the effectiveness of curriculum,
instruction, and assessment.

ASSESSING INSTRUCTIONAL LEADERSHIP IN RURAL NEW MEXICO 34
Table 2 (continued)
Intellectual Stimulation Keeps informed about current research and theory
regarding effective schooling.
Continually exposes the staff to cutting-edge ideas about
how to be effective.
Systematically engage staff in discussion about current
research and theory.
Continually involves the staff in reading articles and
books about effective practice.
Optimize Inspires teachers to accomplish things that might seem
beyond their grasps.
Portrays a positive attitude about the ability of the staff to
accomplish substantial things.
Is a driving force behind major initiatives.
Culture Promotes cooperation among staff.
Promotes a sense of well-being.
Promotes cohesion among staff.
Develops an understanding of purpose.
Develops a shared vision of what the school could be
like.
Communication Is easily accessible to teachers.
Develops effective means for teachers to communicate
with one another.
Maintains open and effective lines of communication
with staff.
Input Provides opportunity for input on all, important
decisions.
Provides opportunities for all staff to be involved in
developing school policies.
Uses leadership team in decision-making.
Order Provides and enforces clear structure, rules, and
procedures for students.
Provides and enforces clear structures, rules, and
procedures with staff.
Establishes routines regarding the running of the school
that staff understand and follow.

ASSESSING INSTRUCTIONAL LEADERSHIP IN RURAL NEW MEXICO 35
Leithwood, Louis, Anderson, and Wahlstrom (2004) suggested that successful
leadership could play a significant role in improving student learning. Through a synthesis of
both quantitative and qualitative studies, they concluded that school leadership “is second
only to teaching among school-related factors in its impact on student learning” and “effects
are usually largest where and when they are needed the most” (p. 5). Without a powerful
leader, troubled schools are unlikely to be turned around. The authors stressed, "many other
factors may contribute to such turnarounds, but leadership is the catalyst" (p. 7).
The Wallace Foundation (2006) highlighted the connection between achievement and
instructional leadership: “Behind excellent teaching and excellent school is excellent
leadership—the kind that ensures that effective teaching practices don’t remain isolated and
unshared…the importance of having such a leader in every school is greater than ever” (p. 3).
In Table 3, I display the similarities and differences among selected frameworks for
examining and understanding principals’ behaviors as they relate to school improvement and
school effectiveness. I selected the PIMRS (Hallinger, 1985) for this study not only because it
has been found to be reliable and valid in research settings for thirty years (Hallinger, 1983,
2011; Hallinger & Murphy, 1985; Hallinger, Taraseina, & Miller, 1994) but also, as can be
seen in Table 3, because subsequent research has confirmed the relevance of many of the
factors measured by the PIMRS.

ASSESSING INSTRUCTIONAL LEADERSHIP IN RURAL NEW MEXICO 36
Table 3
Similarities and Differences among Frameworks for Examining and Understanding
Principals’ Behaviors
Edmonds (1977) and Brookover & Lezotte (1979)
Hallinger (1985)
Leithwood (1987)
Waters et al. (2003) Clifford & Ross (2012)
Instructional Leadership
Supervise and Evaluate Instruction
Improve instructional program
Knowledge of Curriculum, Instruction, and Assessment
Focus on learning
Clear and Focused Mission
Framing the Goals
Develop shared vision Strengthen school culture
Focus, Culture Build shared purpose
Safe and Orderly Environment
Maintain High Visibility, Protects Instructional Time
Hold high performance expectations
Order Discipline Visibility
Manage organizational systems
Climate of High Expectations
Hold high performance expectations
Ideals/Beliefs Lead with integrity
Frequent Monitoring of Student Progress
Monitor student progress
Improve instructional program
Monitors/Evaluates
Positive Home-School Relations
Engage communities
Outreach Collaborate with community
Opportunity to Learn and Student Time on Task
Improving the instructional program
Discipline

ASSESSING INSTRUCTIONAL LEADERSHIP IN RURAL NEW MEXICO 37
Conceptual Framework
The PIMRS (Hallinger, 1982/1990) is grounded in a conceptual framework that
proposes three dimensions in the instructional leadership role: Defines the School Mission,
Manages the Instructional Program, and Develops a Positive School Climate (Hallinger &
Murphy, 1985; see Figure 3). Within each of the three dimensions are 10 instructional
leadership functions. Under “Defining the School Mission” are two functions, frames the
school’s goals and communicates the school’s goals; under “Managing the Instructional
Program” are three functions, coordinates the curriculum, supervises and evaluates
instruction, and monitors student progress; and under “Developing the School Learning
Climate” are five functions, protects instructional time, provides incentives for teachers,
provides incentives for learning, promotes professional development and maintains high
visibility (Hallinger & Murphy, 1985, p. 221).
Figure 3. Principal Instructional Management Rating Scale (PIMRS) conceptual framework
(Hallinger & Murphy, 1985).
Defining the School Mission
Frames the School's Goals
Communicates the School's
Goals
Managing the Instructional
Program
Coordinates the
Curriculum
Monitors Student
Progress
Supervises and Evaluates
Instruction
Developing the School Learning
Climate
Protects Instructional
Time
Provides Incentives for
Teachers
Provides Incentives for
Learning
Promotes Professional Development
Maintains High Visibility

ASSESSING INSTRUCTIONAL LEADERSHIP IN RURAL NEW MEXICO 38
Defining the School’s Mission
School mission refers to the school’s orientation toward improving student learning
(Hallinger, Bickman, & Davis, 1996). Hallinger and Heck (1996) found that establishing a
clear school mission was an important avenue through which principals influence school
effectiveness. Hallinger (1982) stated that the principal does not define the school’s mission
alone, but is responsible for ensuring that a mission exists and communicates the mission to
all staff. One of the greatest barriers to school reform is lack of a clear vision (Schlechty,
2000). Excellent schools have a clear vision (Sergiovanni, 1991). Leaders give their schools
purpose and direction by developing a shared strategic vision, shaping school culture and
values, and formulating school improvement efforts (Thomson, 1993). Principals serve as
facilitators, eliciting the involvement of stakeholders and ensuring that efforts are carried out
(Thomson, 1993).
Leaders should be visionaries, strategists, and cultivators of practical ideals and
enablers of others (Gill, 2003). A shared vision is the force that bonds students, teachers and
others together in a common cause (Sergiovanni, 1991). Vision defines the desired state that a
school is working toward; school improvement strategies and goals are needed to move
toward the vision (Thomson, 1993). Hallinger and Heck (2002) described vision as the moral
and spiritual values that underlie a leader’s view of the world and provide the inspiration for
the leader’s life work.
Leaders who set a clear sense of direction have the greatest impact (Leithwood, Louis,
Anderson, & Wahlstrom, 2004). Principals must be able to lead organizations through a goal-
setting process in which improvement areas are identified and actions for change are initiated
(Thomson, 1993). If leaders help to develop among their staff members a shared
understanding of the organization and its goals and activities, this understanding becomes the
basis for a sense of purpose or vision. Leithwood et al. (2012) asserted having goals “helps
people make sense of their work and enables them to find a sense of identity for themselves

ASSESSING INSTRUCTIONAL LEADERSHIP IN RURAL NEW MEXICO 39
within their work context" (p. 10). Effective principals work to build consensus among staff
on the guiding beliefs and values of their school (Thomson, 1993).
Setting organizational direction is one of the core tasks for transformational leadership
(Leithwood, 1996). Leaders build consensus among staff about the importance of common
purpose and achieving the organization’s goals (Leithwood et al., 2012). Witziers, Bosker,
and Kruger (2003) conducted a quantitative meta-analysis of specific leadership behaviors and
determined that “defining and communicating mission” had the largest effect size of all those
they examined. Goldring and Pasternack (1994) examined the relationship between strategies
used by principals to coordinate organizational activities and school effectiveness. They found
that the principal’s role in framing school goals and establishing a clear mission was
instrumental in establishing school effectiveness. Effective leaders collect and utilize data to
develop a purpose that focuses on student learning; they commit to and communicate values
that all children will learn at high levels, and inspire others with that vision (Green, 2013).
Studies repeatedly find a principal’s ability to identify and articulate a vision leads to
increased student achievement (Hallinger & Heck, 1999).
Managing the Instructional Program
Managing the instructional program requires that principals be deeply engaged in
stimulating, supervising, and monitoring teaching and learning in the school (Green, 2013;
Hallinger, 2005). This also requires that principals have expertise in teaching and learning and
a commitment to the school’s improvement (Hallinger, 2005). A central task of the principal
is to ensure that school goals are translated into school practice (Hallinger & Murphy, 1985).
This is achieved by coordinating classroom objectives of teachers with those of the school,
providing instructional support to teachers, and monitoring classroom instruction through
classroom observations (Hallinger & Murphy, 1985). Effective leaders also use data to make
instructional program decisions that meet the needs of all students (Green, 2013).

ASSESSING INSTRUCTIONAL LEADERSHIP IN RURAL NEW MEXICO 40
Along with supervision of instruction, a principal must be able to coordinate
curriculum and monitor student progress. School curricular objectives are closely aligned with
the content taught and achievement tests, principals provide teachers with assessment results
in a timely and useful manner, discuss test results with staff as a whole and with grade-level
staff and individual teachers and provide interpretive analyses (Hallinger & Murphy, 1985,
pp. 222-224).
Developing the School Learning Climate
Developing the school learning climate includes protecting instructional time,
promoting professional development, maintaining high visibility, providing incentives for
teachers, developing high expectations and standards and providing incentives for learning
(Hallinger, 2005). Principals play a key role in supporting and encouraging teachers’
professional development needs. Leaders demonstrate a commitment to the professional
development of others, they keep track of teacher needs, and provide resources and materials
to improve teachers’ repertoire of instructional practices (Green, 2013; Leithwood, Louis,
Wahlstrom, & Anderson, 2010).
The term culture is used to describe the similar, but more limited, phenomenon that
occurs within organizations (Deal & Peterson, 1990). Schein (1985) described culture as
“basic assumptions and beliefs that are shared by members of an organization, that operate
unconsciously, and that define in a basic ‘take-for-granted’ fashion an organization’s view of
itself and its environment” (p. 6). Values and norms emerge from the culture and guide
employee behavior (Thomson, 1993). Productivity is linked to a strong positive culture in
schools (Leithwood, 1992).
Principals craft school cultures that help set the foundation for change (Peterson &
Deal, 1998). Cultural leadership is the art of fusing a personal vision with a school that needs
direction (Office of Educational Research and Improvement, 1990). Effective leaders establish
clearly defined, school-wide academic and behavioral standards to promote high expectations
ASSESSING INSTRUCTIONAL LEADERSHIP IN RURAL NEW MEXICO 41
and hold teachers and students accountable for learning; leaders expect a high standard of
professionalism from staff (Green, 2013; Leithwood & Sun, 2012). Principals play a key
instructional leadership role by shaping teachers’ attitudes toward students’ ability to master
subject matter (Purkey, 1983). Bolman and Deal (2001) stated that school leaders must fully
care and commit by being insightful, opportunistic, loving, and empowering in addition to
valuing those who work for them (p. 172).
Organizational improvement comes from the improvement of the people who are
members of the organization (Leithwood et al., 1999). Intellectual stimulation helps promote
intelligence, rationality, and problem solving (Bass, 1990). Intellectual stimulation through
professional development leads to collaboration and promotion of collective action to reach
school goals (Brown, 1993; Poplin 1992).
Rural Education and School Leadership
The No Child Left Behind Act of 2001 (NCLB) presented challenges for schools and
districts to ensure that all students are proficient on state standards by 2014 and that, by 2006,
all teachers be highly qualified (U.S. Department of Education, 2011). Due to small student
populations and geographic isolation, these requirements are uniquely problematic for rural
schools and districts (Reeves, 2003).
Rural school principals face multiple challenges that are unique to their environment,
including school-based and community-related challenges and meeting increased achievement
expectations (Williams & Nierengarten, 2011). Williams and Nierengarten (2011) conducted a
mixed-methods study, surveying K-12 administrators across six regions in Minnesota to
determine the challenges specific to rural administrators. Their study identifies student
achievement, specifically testing, adequate yearly progress, achievement for all, and
professional development for staff as concerns for rural administrators.
Reeves (2003) studied the impact of NCLB legislation on rural school districts and
found issues of accountability, teacher recruitment and retention, and funding and fiscal
ASSESSING INSTRUCTIONAL LEADERSHIP IN RURAL NEW MEXICO 42
management, further stating that small schools and districts are more likely to be labeled in
need of improvement due to the volatility of annual test scores.
Rural America
The United States Census Bureau (2013) states that “rural” encompasses all
populations existing outside urban clusters (2,500 - 50,000 people) or urbanized areas (50,000
or more people). The urban area of the United States for the 2010 Census contained 80.7% of
the population, whereas rural areas contained 19.3% of the population (United States Census
Bureau, 2014). Since 2000, metro areas grew by 11 percent. The U.S. Census Bureau shows
that rural regions saw sharper losses than expected in the last decade.
Since 1976, the rural population has been declining (Figure 4), with its greatest loss
during the 1980s. However, overall population change remained positive during the 1980s
because natural increases (births minus deaths) contributed to a roughly 0.5 percent growth
(United States Department of Agriculture, 2013). Historically, non-metro populations grew
because high rates of natural increase always offset any net migration loss experienced by
non-metro areas (United States Department of Agriculture, 2013). Since 2010, the increase in
non-metro population from natural change has not matched the decrease in population from
the net migration. The 2010-2013 period marks the first time there was an estimated
population loss for non-metro America as a whole (United States Department of Agriculture,
2013).

ASSESSING INSTRUCTIONAL LEADERSHIP IN RURAL NEW MEXICO 43
Figure 4. The population change by metro/non-metro status, 1976-2013 represented in percent
of change from previous year (United States Department of Agriculture, 2013).
Many Americans perceive that rural areas offer a wholesome life; likewise many also
believe that rural areas can be less-than-ideal places to live, with poverty, low wages, few job
opportunities, and rapidly increasing drug use and crime (Kellogg Foundation, 2001). For
decades, media have delivered anti-rural imagery with comic strips, radio and television
shows portraying rural people as hillbillies, backward, ignorant, or dim-witted folk lacking
ambition or sophistication, and we continue to accept these stereotypes because it is deeply
engrained in our culture (Theobald & Wood, 2010). These misconceptions further exacerbate
the notion that to be rural is to be sub-par, even among members of rural communities, as
Theobald and Wood (2010) found through discussions with administrators, teachers, students
and community members from eighteen rural school districts in New York. Many students,
teachers and administrators conceded that they did not have the best schools, teachers, or
provide the best education for students.
ASSESSING INSTRUCTIONAL LEADERSHIP IN RURAL NEW MEXICO 44
There are several factors driving change in rural America: demographic transitions,
changing economic conditions, changing patterns of investment and resource distribution
(transportation, telecommunications, etc.), environmental challenges, and challenges facing
community institutions and civic leadership (Carsey Institute, 2007; Chi & Ventura, 2011).
Many rural communities are experiencing a loss in population, especially those that
are in remote areas (McGranahan & Beale, 2002). Rural communities often experience the
loss of the most educated people to urban areas (Artz, 2003). Some families discourage their
children from attending college, fearing their children may never return (Corbett, 2007;
Stricker, 2008).
Poverty in Rural America
In 2010, approximately 10 million persons or 16.3 percent of the rural and small town
population lived in poverty and nearly one-quarter of people in poverty live in rural areas
(Housing Assistance Council, 2012). Rural minorities continue to experience the highest
poverty rates in America, with poverty rates more than twice those of rural white not Hispanic
at 28 percent, rural African Americans at nearly 34 percent, and rural Native Americans at 30
percent (Housing Assistance Council, 2012). Rural minorities have higher poverty rates
compared to minorities nationally, and economic conditions for many rural minorities have
not improved over the past decades (Housing Assistance Council, 2012).
Mattingly, Johnson and Schaefer (2011) found when looking at poverty rates across
the United States between 1980 and 2009, there were 706 persistent child poverty counties
and 571 (81%) of these counties were rural counties. When looking at 362 U. S. counties
categorized as nearing persistent or “frequent high child poverty” (p. 3), the researchers found
267, or 74% of the counties encompassed rural communities. The researchers identified
several “hot spots” along the Rio Grande in Texas and New Mexico (Mattingly, Johnson, &
Schaefer, 2011, p. 1).

ASSESSING INSTRUCTIONAL LEADERSHIP IN RURAL NEW MEXICO 45
Mattingly et al. (2011) identified characteristics of counties with persistent child
poverty, including high rates of unemployment, low education levels, and higher proportions
of minority children.
Rural New Mexico
In 2010, ninety-nine percent of the land area in New Mexico was considered rural,
with 46.3 percent of the population living in rural and small cities. New Mexico saw a spike
in the number of people living in poverty in 2013 and had the nation’s second highest
percentage of people living in poverty. Since 2007, the poverty rate has increased from 17.9
percent to 21.9 percent (United States Census Bureau, 2014). The number of children living in
extreme poverty, those who live in families with income less than 50 percent of the federal
poverty level, has increased from 10 percent in 2009 to 15 percent in 2013 (Population
Reference Bureau, 2013).
Figure 5 shows New Mexico’s rural locations in 2000, based on three definitions of
Census Places (United States Census Bureau, 2014). Rural definition number 1 includes all
areas outside a Census place with 2,500 or more people. Rural definition number 2 includes
all areas outside Census Places with 10,000 or more people, and rural definition number 3
encompasses all areas outside Census places with 50,000 or more people (United States
Census Bureau, 2014).

ASSESSING INSTRUCTIONAL LEADERSHIP IN RURAL NEW MEXICO 46
Figure 5.The rural locations in the State of New Mexico, 2000 (U.S. Census Bureau, 2013)
There are 89 school districts in New Mexico. Of these 89 districts, 33.7% have
populations less than 2,500, ranging from a total population of 248 to 2,267, and an estimated
population of 5 to 17 year olds ranging between 33 and 452. These 30 school districts have an
average of five percent of 5 to 17 year olds living in poverty. Twenty-nine percent of New
Mexico’s school districts have populations between 2, 500 and 10,000 ranging from 2,686 to
9,862, with an estimated population of 5 to 17 year olds between 346 and 1806. These 26
school districts have an average of 5.5% of children ages 5 to 17 living in poverty. Twenty-
eight percent of school districts in New Mexico have total populations between 10,001 and
50,000, ranging from 10,703 to 47,994, with an estimated population of 5 to 17 year olds
ranging from 1,586 to 9,267 with an average of 5% of children ages 5 to 17 living in poverty.
There are only eight school districts with a total population exceeding 50,000 (U.S. Census
Bureau, 2013).

ASSESSING INSTRUCTIONAL LEADERSHIP IN RURAL NEW MEXICO 47
Challenges Faced by Rural Schools
Nearly 32% of public schools in the United States are considered rural, with
approximately 25% of all public school students enrolled in these schools (National Center for
Education Statistics, 2013). Principals play a role in shaping school culture and organizing the
day-to-day running of the school (Deal & Peterson, 1999), and play a significant role in the
community (Clarke & Wildy, 2008; DeYoung, 1995; Mohr, 2000).
Rural schools face issues of school consolidation, closures, and declining economics
(Barley, 2007). Changes in social and economic structures of rural communities have created
families that are economically insecure, socially dislocated, and highly mobile (Schafft,
Killeen, & Morrissey, 2010). Many rural communities are in economic distress, which
contributes to many of the social problems that affect rural schools and rural students’
achievement (Budge, 2006).
Highly mobile students are less successful academically, drop out of school at higher
rates, and require more frequent disciplinary action (Barley & Beesley, 2007; Chen, 2008;
Killeen & Schafft, 2009). Districts with extremely high student mobility are often rural and
have a higher number of students eligible for free or reduced-priced meals (Beesley, Moore, &
Gopalani, 2010; Chen 2008; Engec, 2006). In their research on rural school districts in New
York and Pennsylvania, Schafft, Killeen, and Morrissey (2010), Killeen and Schafft (2008),
and Schafft (2006) identified several key challenges for school districts and mobility: 1)
Strains on teaching and administrative staff; 2) Highly mobile, high needs students tend to be
high-cost students, 3) There was a perceived impact on school testing and assessments by
teachers and administrators, 4) Academic underachievement, and 5) Reduced social and
academic attachment of mobile students. Disadvantaged districts’ student turnover rates were
twice those of wealthier districts where mobility was driven largely by household social and
economic insecurity and lack of safe, adequate, and affordable housing (Killeen & Schafft,
2008; Schafft, 2006; Schafft, Killeen, & Morrissey, 2010).

ASSESSING INSTRUCTIONAL LEADERSHIP IN RURAL NEW MEXICO 48
Teacher recruitment and retention is a challenge in rural areas, especially in the
secondary schools where there are fewer and fewer science and math teachers, placing a
burden on rural school administrators (Clarke & Hood, 1986). Gagnon and Mattingly (2012)
found that poor communities have higher percentages of beginning teachers, with upwards of
11 percent classified as beginning teachers, further adding that a higher concentration of
minority students in districts is associated with a higher percentage of beginning teachers
(Gagnon & Mattingly, 2012). According to the National Center for Education Statistics
(2013), the average base salary for teachers in rural areas was $47,130, well below the
national average of $53,070, and below the average salaries for teachers in towns ($47,780),
suburbs ($58,470), and cities ($54,070) (National Center for Education Statistics, 2013).
A national survey of rural school superintendents conducted by the American
Association of School Administrators and the Appalachia Educational Laboratory found that
superintendents identified low salaries and social and geographical isolation as the main
factors responsible for their difficulties in recruiting and retaining teachers (Schwartzbeck,
Prince, Redfieled, Morris, & Hammer, 2003).
Selection and retention of effective principals has become problematic for rural
schools because the pool of candidates is growing smaller (Young, Peterson, & Short, 2002).
Rural schools are at a disadvantage when searching for school leaders (Pijanowski, Hewitt, &
Brady, 2009). Rural areas may not be as attractive as urban areas to principal applicants
(Ayers, 2011). Cruzeiro and Boone (2009) cited factors such as lower pay, isolation, and lack
of support from central office contributed to the lack of effective leadership in rural school
districts.
Challenges faced by Rural School Principals
Clarke and Hood (2002) identified six challenges faced by rural school administrators:
(a) geographic isolation that focuses the school as the center of the community; (b) cultural
isolation that prevents the diffusion of effort; (c) financial stringency that is caused by a small

ASSESSING INSTRUCTIONAL LEADERSHIP IN RURAL NEW MEXICO 49
tax base; (d) inadequate mass, which prevents specialization, staff members take on multiple
roles depending on the needs; (e) personal loneliness where communication of trouble occurs
quickly, but good news takes longer; and, (f) historical stability where rural schools represent
the history of the community (p. 80). Preston, Jakubiec, and Kooymans (2013) presented
thematically common challenges associated with the role of the rural principal using data from
the United States, Canada and Australia. Compared to urban principals, rural principals faced
unique challenges, among those challenges was the importance of the principal having an
affiliation or a connection to the rural community; principals need to “fit into the political and
social context of the local community” (Preston, Jakubiec, & Kooymans, 2013, p. 3), and that
without this quality, the principal may be viewed with suspicion by the community (Keddie &
Niesche, 2012). In their study of two schools in north central British Columbia, Foster and
Goddard (2003) found that current administrators who were raised in the community had a
greater understanding of the values, priorities and culture of the community. Lock, Budge,
Oakley, and Lunay (2012) found that principals were most likely to stay in remote rural areas
when they felt a sense of acceptance by and involvement in the community, this acceptance
appeared to create stronger ties that compensated for some of the challenges faced by staff in
remote communities.
Adding to the challenges, there is a feeling of professional loneliness and isolation as
well as a lack of professional development for principals (Starr & White, 2008). Feelings of
professional isolation and loneliness are magnified in rural settings (Hobson, Brown, Ashby,
Keys, Sharp, & Benefield, 2003). Rural principals often assume other roles with fewer
resources and complex issues around school accountability and change (Preston et al., 2013).
Lock et al.’s (2012) research on rural school principals in Australia indicates that rural school
principals require professional learning more suited to their needs as managers and leaders in
rural settings. Rural principals also have fewer opportunities to network with colleagues in
face-to-face environments (Lock et al., 2012). Buettner (2004) found:

ASSESSING INSTRUCTIONAL LEADERSHIP IN RURAL NEW MEXICO 50
Opportunities for frequent and purposeful dialogue should be provided
whereby principals can openly communicate their frustrations and feelings
in relation to a particular circumstance. Discussions would have the
potential to alleviate tension arising from distressful events in schools.
(p. 12)
Rural principals serve in many roles and responsibilities such as “accountability,
planning, monitoring, reporting, school performance” (Clarke & Wildy, 2004, p. 555). They
also have to deal with student discipline, working with community, and being the face of the
school (Ashton & Duncan, 2012).
Leaders in successful rural high schools in California maintained “a school-wide focus
on instruction and high expectations, developed multiple support systems for students with
varying needs, and capitalized on strengths on teachers to enhance student outcomes.
Successful leaders discover ways to utilize and stretch resources to help students, regardless of
location or lack of funding” (Masumoto & Brown-Welty, 2009, p 15).
Factors perceived by school personnel to contribute to success in high-performing,
high-needs rural schools include “a close and mutually supportive relationship with the
community, high teacher retention, supportive leadership, use of student data to support
student achievement, parental involvement, and a culture of caring” (Barley & Beesly, 2007,
p. 1).
Challenges faced by rural school principals are unique to each district. Challenges
faced by many principals include pressure from political groups, becoming acquainted with
the district and community, deciding who to trust, and a lack of people in whom to confide
(Czaja, 1997, p. 2). Rural school principals must be aware of the politics that come into play,
because of the likelihood of community members being related to one another (De Ruyck,
2005). It is also important for principals to form relationships within the community;
principals need to understand local knowledge, histories, key figures, and rituals (Murphy,

ASSESSING INSTRUCTIONAL LEADERSHIP IN RURAL NEW MEXICO 51
1996). Rural school principals often do not have the means to separate themselves from the
political arena, as do administrators in larger districts (De Ruyck, 2005).
Access to Curriculum
Rural school youth have a greater likelihood of experiencing a narrow school
curriculum, fewer educational opportunities, fewer electives, less advanced placement
offerings, and a shortage of teachers with advanced degrees (Alspaugh, 1998; Edington &
Koehler, 1997; Lapan, Tucker, Kim, & Kosciulek, 2011).
Students in rural areas and small towns have limited access to rigorous curriculum and
instruction. Graham (2009) found that nearly 50 percent of students in rural areas and small
towns attend schools that only offer one to three advanced mathematics courses, and only 10
percent have access to seven or more courses in advanced mathematics, capping the possible
mathematics achievement levels for rural students. Data based on national assessments
suggest that rural youth are not achieving at the same level of mathematics proficiency as
urban high school students (Provasnik, KwealRamani, Coleman, Gilbertson, Herring, & Xi,
2007).
Nearly one-half (47.2 percent) of rural school districts have no secondary students
enrolled in Advanced Placement (AP) courses, compared with only 20.1 percent of town, 5.4
percent of suburban, and 2.0 percent of urban districts and remote rural districts are 10 times
less likely to offer access to AP courses (Gagnon & Mattingly, 2015). Rural school districts
often find it “difficult to offer rigorous coursework because of insufficient numbers of capable
students, lack of appropriate teacher staffing, or other logistical concerns” (Gagnon &
Mattingly, 2015, p. 3). Lack of access to rigorous coursework continues to place rural
students at a disadvantage compared with their urban and suburban peers (Graham, 2009).
Summary
In this chapter, I presented an overview of the body of knowledge related to effective
school leadership. The review of literature included a discussion of instructional leaders,

ASSESSING INSTRUCTIONAL LEADERSHIP IN RURAL NEW MEXICO 52
transformational leaders, and rural school communities. Instructional leadership models
began to emerge in the late 1970s into the early 1980s via the effective schools research,
which identified strong, directive leadership focused on curriculum and instruction from the
principal as an effective characteristic (Edmonds, 1979; Leithwood & Montgomery, 1982).
Key findings include:
1. Strong administrative leadership was among the factors of school effectiveness that
made a difference in student learning (Brookover & Lezotte, 1977; Edmonds, 1979).
2. Principal leadership behaviors have an indirect effect on student achievement
(Hallinger, Bickman, & Davis, 1996).
3. Successful leadership can play a significant role in improving student learning
(Leithwood et. al., 2004).
4. Rural communities have higher poverty and mobility rates, high rates of
unemployment, low educational levels, higher proportions of minority children, and
high teacher and principal mobility (Killeen & Schafft, 2008; Mattingly et al., 2011;
Schafft, 2006; Schafft, Killeen, & Morrissey, 2010).
5. The majority of New Mexico, 99%, is considered rural, with 46.3 percent of the
population living in rural or small cities.

ASSESSING INSTRUCTIONAL LEADERSHIP IN RURAL NEW MEXICO 53
Chapter 3
Research Methods
This chapter presents the research methods that I used to collect data to help me
answer my research questions:
1. Based on the Principal Instructional Management Rating Scale (PIMRS), how do
teachers in the Española Public Schools perceive the instructional management of
principals?
2. To what extent is the PIMRS reliable and valid when administered to a sample of
teachers and principals from a rural, northern New Mexico, predominantly Hispanic-
serving school district?
I outline the criteria I used to select the teachers and principals that were invited to
complete the questionnaires. I also describe the instrument, the Principal Instructional
Management Rating Scale. Finally, I describe the data collection procedures and data
analyses.
Setting and Sample
I conducted the study in the Española Public Schools, a public school district in
Northern New Mexico. The study targeted elementary and secondary teachers and principals
working in the school district during the 2014-2015 academic year. There were 132 teachers
teaching in the primary grades and 82 teachers teaching at the secondary level that were
eligible to take part in the study, for a total of 214. Twenty-six percent of the teachers were
male and 74% were females, with 11% of males working at the elementary level. Of the 214
teachers, 62% of the teachers were Hispanic, 20% were White, 16% were Filipino, and 2%
were other. There were ten principals eligible to participate in this study, eight principals
from the 11 elementary schools (two schools shared a principal and one had a lead teacher)
and two principals at the secondary level (one each at the middle school and high school
levels).

ASSESSING INSTRUCTIONAL LEADERSHIP IN RURAL NEW MEXICO 54
Instrument
The Principal Instructional Management Rating Scale (Appendix A) is a survey tool
designed and tested by Hallinger (1983). The PIMRS assess three dimensions of instructional
leadership: Defining the School’s Mission, Managing the Instructional Program, and
Promoting a Positive School Learning Climate (Hallinger & Murphy, 1985). The tool consists
of 50 questions that cover 10 different areas of instructional management with five questions
for each characteristic and is used to survey teachers to elicit their perceptions of their
principals’ instructional management. By using a five-point, Likert-type scale (Almost Never
- 1, Seldom - 2, Sometimes - 3, Frequently - 4, Almost Always - 5) teachers document the
frequency with which they perceive their principal to be performing certain instructional-
related tasks. The PIMRS has been used in 135 empirical studies over the past 30 years
appears to have attained a consistent record of yielding reliable and valid data on principal
instructional leadership (Hallinger, 2013).
The PIMRS was developed by Hallinger (1982) to measure principal instructional
management behaviors in a school building. Hallinger (1982) developed the PIMRS based on
the School Effectiveness Program Model of Instructional Leadership. The original form had
eleven categories, but was narrowed to ten categories after further research (Hallinger, 1983).
Hallinger tested the questionnaire for reliability and validity. I obtained duplication rights for
use in this study.
The original validation study found that the PIMRS met high standards of reliability
(Hallinger, 1983). Four criteria for this validation were used. First, content validity received a
minimum average agreement of .80 among the group of raters, which indicated there was
relevancy among the group of raters, which in turn indicated there was relevancy among the
items listed on the questionnaire concerning the critical requirements of the principals’ job.
Second, the estimate of Cronbach’s alpha reliability coefficient, which tests the internal
consistency of an instrument, was .75 and the test of significance was at the .05 level. Fourth,

ASSESSING INSTRUCTIONAL LEADERSHIP IN RURAL NEW MEXICO 55
construct validity, achieved by a subscale intercorrelation and documentary support, indicated
a strong correlation between the questionnaire and related studies (Hallinger, 1983).
The ten categories of principal instructional management are:
1. Frames the School’s Goals – refers to the principal’s role in determining the areas
in which the school will focus its resources during a given school year.
2. Communicates School’s Goals – concerned with the ways in which the principal
communicates the school’s most important goals to teachers, parents, students, etc.
3. Supervises and Evaluates Instruction – ensuring that the school goals are being
translated into practice at the classroom level, which involves coordinating with
the classroom teacher and evaluating classroom instruction.
4. Coordinates Curriculum – curricular objectives are closely aligned with both the
content taught and the achievement tests used by the school.
5. Monitors Student Progress - refers to how the principal communicates and
provides teachers with test results.
6. Protects Instructional Time – refers to the principal’s ability to protect instructional
time of teachers.
7. Maintains High Visibility – refers to the interaction between the principal, students
and teachers.
8. Provides Incentives for Teachers – refers to how the principal recognizes staff both
formally and informally.
9. Promotes Professional Development – refers to how the principal supports teachers
in the effort to improve instruction.
10. Provides Incentives for Learning – refers to the principal’s ability to create a
learning climate in the school in which academic achievement is highly valued by
students and where students are recognized for their academic achievement and
improvement. (Hallinger, 2013, p. 14)

ASSESSING INSTRUCTIONAL LEADERSHIP IN RURAL NEW MEXICO 56
I added two open-ended questions on both the teacher and principal form of the
PIMRS. I asked the teachers: “What does your principal need to know and do in order to
support teachers at your school?” and “Is there anything else you would like to add? “I asked
the principals: “What does your supervisor need to know and do in order to support principals
in your district?” and “Is there anything else you would like to add?”
Instrument Validity and Reliability
Research often attempts to measure intangible constructs such as attitudes, behaviors,
emotions, or personalities. Researchers often design surveys, interviews, and other
assessments to measure these concepts. Tests must accurately measure given traits and do so
with consistency (Galvan, 2006; Ruane, 2005; Wright & Stone, 1999).
Validity and reliability are the common terms to designate test accuracy and
consistency. In assessing the effective relevance and usefulness of the PIMRS with school
leaders, it is critical to assess both the validity and reliability of the tool.
Joppe (2000, p. 1) defines reliability as “the extent to which results are consistent over
time and an accurate representation of the total population under the study is referred to as
reliability and if the results of the study can be reproduced under a similar methodology, then
the research instrument is considered to be reliable.”
Kirk and Miller (1986, pp. 41-42) identified three types of reliability in quantitative
research: the degree to which a measurement, given repeatedly, remains the same; the stability
of a measurement over time; and the similarity of measurement within a given time period. In
other words, reliability refers to the degree to which the rating scales measure the targeted
phenomenon consistently.
Validity is a general term denoting “correctness of measure” (Yaremko, Harari,
Harrison, & Lynn, 1982, p. 245). To be a valid instrument, survey questions must measure the
identified dimensions or construct of interest (Czaja & Blair, 2005). “A valid measure should
yield consistent (reliable) data about what is concerned with regardless of the time of day,

ASSESSING INSTRUCTIONAL LEADERSHIP IN RURAL NEW MEXICO 57
week, or month, the measures are taken and regardless of who takes the measure” (Latham &
Wexley, 1981, p. 65).
Data Collection Procedures
I obtained approval from both the University of New Mexico Institutional Review
Board (IRB) and the selected school district prior to commencing the research (Appendix B).
I was not affiliated with the school district. My research assistant, as approved by the IRB,
was the assistant superintendent for the school district. Valid certificates of completion of the
University tutorial on research related to human subjects were on file for the principal
investigator, the research assistant, and the faculty advisor prior to commencing data
collection.
In the spring of 2015, either the research assistant or I recruited teacher participants
during teacher meetings in a designated meeting room on the school campuses. Prior to
disseminating the paper and pencil version of the PIMRS-Teacher Form (Appendix C) to
those interested in taking part in the study, we reviewed the Information Sheet (Appendix D)
with all potential participants and they were given the opportunity to decide whether or not to
participate. I disseminated the PIMRS at eight schools and my research assistant disseminated
it at three schools. The process of completing and submitting the instrument constituted
consent to take part in the study.
Participants remained anonymous and did not provide any identifiable information that
could link them to their responses. My research assistant and I used a script that we read to the
teachers (Appendix E), which explained that participation in this study on principal leadership
behaviors was voluntary. In order to encourage participation, again with approval from the
IRB, I offered incentives: the possibility to win via a raffle a Kindle Fire HD, a $25 gift
certificate to Wal-Mart, or a $25 gift certificate to a local restaurant.
The participants were assured of their anonymity and the confidentiality of their
responses and their ability to terminate their participation at any time and for any reason

ASSESSING INSTRUCTIONAL LEADERSHIP IN RURAL NEW MEXICO 58
without repercussions. It was also made clear during the consent process that refusal to
participate would not affect the participants’ status in the school district. Those teachers who
chose to participate were encouraged to answer the questions with complete honesty and to
ask questions at any time. After disseminating the instrument, we left the room to allow those
that wished to participate time to complete the questionnaire and return it. Upon completion,
participants placed the completed questionnaire in a secure box, detached a form that served
as a “raffle ticket” (Appendix F) for the drawing where they recorded their name and
telephone number. Teacher participants deposited the “raffle ticket” in a separate secure box.
We picked up the two boxes when the last participant left the room. The completed
instruments were stored in a locked file cabinet in my office.
I submitted an amendment to the original IRB (Appendix G) to collect data from
principals. The research assistant collected the data from the principals. She had a meeting
with the principals to have them fill out the PIMRS; only five elementary principals
completed the survey, none of the secondary principals completed the survey. Two
elementary principals left the district prior to data collection.
Prior to disseminating the paper and pencil version of the PIMRS-Principal form
(Appendix H) to those interested in taking part in the study, the research assistant reviewed
the Information Sheet with all potential participants and they were given the opportunity to
decide whether or not to participate. The research assistant disseminated the PIMRS to the
principals. The process of completing and submitting the instrument constituted consent to
take part in the study.
Participants remained anonymous and did not provide any identifiable information that
could link them to their responses. My research assistant used a script that she read to the
principals, which explained that participation in this study on principal leadership behaviors
was voluntary.

ASSESSING INSTRUCTIONAL LEADERSHIP IN RURAL NEW MEXICO 59
The principals were assured of their anonymity and the confidentiality of their
responses and their ability to terminate their participation at any time and for any reason
without repercussions. It was also made clear during the consent process that refusal to
participate would not affect the participants’ status in the school district. Those principals
who chose to participate were encouraged to answer the questions with complete honesty and
to ask questions at any time. After disseminating the instrument, the research assistant left the
room to allow those that wished to participate time to complete the questionnaire and return it.
Upon completion, participants placed the completed questionnaire in a secure box
Dataset Construction and Analysis
In a MS Excel spreadsheet, I entered each person’s responses to the items on the
PIMRS and then checked for data entry errors. I used standard methods for dealing with
missing data (Osborne, 2013). I organized the responses using the subscales on the PIMRS.
I created categorical variables to record information about the teacher’s principal’s
gender (Male = 1, Female = 0) and the school level (Primary = 1, Secondary = 0). I used the
categories from the instrument to create the variables for the number of years the teacher has
worked with the current principal and the teacher’s number of years of experience at the
school (1 year = 1, 2-4 years = 2, 5-9 years = 3, 10-15 years = 3, more than 15 = 4). Principals
were asked to indicate the number of years s/he has worked at the school (1 year = 1, 2-4
years = 2, 5-9 years = 3, 10-15 years = 3, more than 15 = 4). Other demographic data collected
from the principals was the years of experience they have had as principals (1 year = 1, 2-4
years = 2, 5-9 years = 3, 10-15 years = 3, more than 15 = 4), their gender (Male = 1, Female =
0), and the level the principals worked at (Primary = 1, Secondary = 0).
Once I had created the dataset in Excel, I imported it into the Statistical Package for
Social Sciences (SPSS v. 22) for subsequent analyses. In order to answer my first research
question regarding teachers’ perceptions of principals’ instructional leadership behaviors, I
calculated descriptive statistics, created scores on the 10 sub-scales of the PIMRS, and

ASSESSING INSTRUCTIONAL LEADERSHIP IN RURAL NEW MEXICO 60
estimated correlation coefficients between demographic variables and the scores on the sub-
scales. In order to answer the second research question about the reliability and validity of the
instrument, I estimated Cronbach’s alpha reliability coefficient for the 10 sub-scales,
examined the estimated intercorrelation of the scores on the sub-scales, and conducted one-
way analysis of variance (ANOVA). Table 4 presents a summary of the analyses I conducted.
Table 4
Data Analyses to Create Profiles of Principals’ Instructional Leadership Behavior and Assess
Validity and Reliability of the PIMRS
Statistical
Analysis
Assessment Questions to be considered
Descriptive
Statistics and
Correlation
Profiles of
principals’
instructional
leadership behaviors
How do teachers perceive the instructional
leadership behaviors of their principals?
Correlation Construct Validity Is the PIMRS a valid instrument when used
with teachers in rural NM?
Cronbach’s
Alpha Reliability
Coefficient
Reliability-Internal
Consistency
Is the PIMRS a reliable instrument when
used with teachers in rural NM? Does the
internal consistency of the instrument match
that of previous research attempts?
One-way analysis
of variance
(ANOVA)
Concurrent Validity Is the PIMRS a valid instrument when used
with teachers in rural NM?
Qualitative
analysis of open
ended questions
Categorize by
subscale
What do principals need to do and know to
support teachers in their school?
I compared the results from this administration of the PIMRS to the trends from
previous research studies. I compared the teachers’ perceptions of their principals’
instructional behaviors to the principals’ self-assessments of their instructional leadership in
anticipation of revealing areas for possible professional development for school leaders in
Española’s Public Schools.

ASSESSING INSTRUCTIONAL LEADERSHIP IN RURAL NEW MEXICO 61
Analysis of responses to open-ended questions
Teachers and principals were asked two open-ended questions: “What does your
principal/supervisor need to know and do in order to support teachers/principals in your
school/district?” and “Is there anything else you would like to add?”
One hundred sixteen teachers responded to the first question, and 43 of the 116
teachers responded to the second question. Four of the five principals responded to the first
question, none of the principals responded to the second question.
I entered all open-ended responses verbatim into a spreadsheet, along with each
participant’s responses to the questionnaire. Responses were then grouped into themes as they
related to the 10 instructional behaviors on the PIMRS. Teacher and principal quotes were
used to illustrate findings in Chapter 4.

ASSESSING INSTRUCTIONAL LEADERSHIP IN RURAL NEW MEXICO 62
Chapter 4
Findings
The purpose of this study was to investigate the reliability and validity of Hallinger’s
(1983) Principal’s Instructional Management Rating Scale when used with teachers from a
small district in northern New Mexico. The statistical analyses I conducted are: 1) Descriptive
statistics of the scores and demographic variables, 2) the estimate of Cronbach’s alpha
reliability coefficient estimate of the overall PIMRS and for the ten sub-scales, 3) the
estimated correlation matrix for the PIMRS and demographic variables, 4) the estimated
correlation matrix for the scores on the sub-scales, and 5) one-way analysis of variance
(ANOVA).
Demographic Profile of Sample - Teachers
There are 214 teachers in the district, 132 are elementary teachers (grades K-6) and 83
teachers at the secondary level (grades 7-12). One hundred and ten teachers at the elementary
level and 52 teachers at the secondary level completed the questionnaire, resulting in a 75%
response rate. Non-respondents included those teachers who were not present at the meeting
to invite participation in the study and those who chose not to complete the instrument. All
elementary and secondary schools that have a certified/licensed administrator are represented.
Participants with ID numbers 129 and 138 did not complete more than 90 percent of the
questionnaire, and therefore their responses were not included in the data analysis.
Of the 160 teachers in the analytic sample, 68 percent were elementary teachers and 32
percent were secondary teachers. Approximately 92 percent of teachers indicated that they
had worked with their current principal for 1-4 years and of those, 47.5 percent indicated that
they had worked with their current principal for just 1 year. Only 2.5 percent of teachers
indicated that they had worked with their current principal for more than 5 years. Eighty-six of
the respondents (54%) indicated they currently work with a female administrator, and 74
respondents (46%) indicated they work with a male administrator.

ASSESSING INSTRUCTIONAL LEADERSHIP IN RURAL NEW MEXICO 63
One hundred and twenty teachers (77.5 percent) indicated they would have 10 or more
years of teaching experience by the end of the 2014-2015 school year, and 21.3 percent
indicated they would have between two and nine years of teaching experience by the end of
the 2014-2015 school year.
Demographic Profile of the Sample - Principals
At the time we collected data from the teachers, there were eight elementary principals
and two secondary principals in the district. When we collected data from the principals, the
district had lost two elementary principals. Of the eight remaining principals, five principals
completed the questionnaire, all of which were elementary principals. Four principals who
responded indicated that they had been at their current school between 2 and 4 years. Two
principals indicated they had more than 15 years of experience as a principal, one indicated
that s/he had between 10 to 15 years of experience, one indicated 5 to 9 years of experience
and one indicated 2 to 4 years of experience as a school principal. Three of the principals were
male and two were female.
Teachers’ Perceptions of the Principals’ Instructional Management
The Principal Instructional Management Rating Scale (PIMRS) was the instrument I
utilized in this study to collect data on principals’ and teachers’ perceptions of principals’
instructional management behaviors. The PIMRS employs a Likert-type scale ranging from 1
to 5, which creates the possibility of a total score across 10 subscales that ranges from 50 (a
response of 1 or almost never for all items) to 250 (a response of 5 or almost always for all
items). Since each subscale consists of five items, the minimum score on a sub-scale would be
5 (a response of 1 or almost never for the five items) to 25 (a response of 5 or almost always
for the five items).
There is considerable variation in the teachers’ total scores with a minimum score of
52 and a maximum score of 247 (range = 195, Std. = 45.24). The descriptive statistics for the
total score on the PIMRS and the ten sub-scale scores are displayed in Table 5. Examination

ASSESSING INSTRUCTIONAL LEADERSHIP IN RURAL NEW MEXICO 64
of the mean for each subscale tells us that, on average, teachers perceived that their principals
exhibited these behaviors sometimes to frequently.
Table 5
Descriptive Statistics for Total Scores and Subscales from Teachers’ Responses on the PIMRS
Variable N Mean Standard
Deviation
Maximum Minimum
PIMRS Total Score
160 168.9 45.24 246 52
Framing the School’s Goals
160 18.13 5.00 25 5
Communicates the School’s
Goals
160 17.77 5.46 25 5
Supervises and Evaluates
Instruction
160 17.43 5.03 25 5
Coordinates the Curriculum
160 16.86 5.15 25 5
Monitors Student Progress
160 16.77 5.03 25 5
Protects Instructional Time
160 16.86 4.83 25 5
Maintains High Visibility
160 16.18 5.32 25 5
Provides Incentives for
Teachers
160 14.90 5.51 25 5
Promotes Professional
Development
160 18.40 5.04 25 5
Provides Incentives for Students 160 15.61 5.81 25 5
Table 6 summarizes the average rating principals received from the teachers on each
of the questions on the Principal Instructional Management Rating Scale. I used the average
PIMRS item ratings to describe teachers’ perceptions of the frequency of principal
instructional management behavior. For example, PIMRS average ratings closer to 5.0
indicate higher principal instructional management behavior. It is important to note that the
ratings do not measure the quality of those instructional management behaviors (Hallinger,
1982).

ASSESSING INSTRUCTIONAL LEADERSHIP IN RURAL NEW MEXICO 65
Table 6
Averages of Teachers’ Ratings of Principals for Each Item on the PIMRS
Sub-Scale
Average of
Teachers’ Ratings
of Principals
Frames the School’s Goals Q1 3.59
Q2 3.64
Q3 3.46
Q4 3.82
Q5 3.63
Communicates the School’s Goals Q6 3.67
Q7 3.81
Q8 3.64
Q9 3.26
Q10 3.38
Supervises and Evaluates
Instruction Q11
3.57
Q12 3.43
Q13 3.44
Q14 3.47
Q15 3.52
Coordinates the Curriculum Q16 3.45
Q17 3.52
Q18 3.29
Q19 3.36
Q20 3.24
Monitors Student Progress Q21 2.99
Q22 3.38
Q23 3.68
Q24 3.42
Q25 3.30
Protects Instructional Time Q26 3.49
Q27 3.31
Q28 2.63
Q29 3.89
Q30 3.53

ASSESSING INSTRUCTIONAL LEADERSHIP IN RURAL NEW MEXICO 66
Maintains High Visibility Q31 3.65
Q32 3.33
Q33 3.81
Q34 2.84
Q35 2.55
Provides Incentives for Teachers Q36 3.21
Q37 3.44
Q38 2.57
Q39 2.79
Q40 2.89
Promotes Professional Development Q41 3.64
Q42 3.58
Q43 3.73
Q44 3.78
Q45 3.68
Provides Incentives for Learning Q46 3.30
Q47 3.42
Q48 2.95
Q49 2.79
Q50 3.15
I developed principal profiles from the data I collected from teachers. Table 7 presents
the average teacher rating each principal received on each of the subscales on the PIMRS.

ASSESSING INSTRUCTIONAL LEADERSHIP IN RURAL NEW MEXICO 67
Table 7
Comparison of Principals by Subscale Average based on the Teachers’ Ratings
Prin1 Prin2 Prin3 Prin4 Prin5 Prin6 Prin7 Prin8 Prin9 Prin10
Frames the
School’s Goal 4.29 3.67 2.50 2.81 4.22 3.88 3.56 4.42 3.99 3.13
Communicates
the School’s
Goals 4.43 3.67 2.80 2.71 4.34 3.71 3.34 4.33 3.99 3.02
Supervises &
Evaluates
Instruction 3.71 3.16 3.60 2.91 3.32 3.54 3.70 4.22 4.02 3.11
Coordinates
the
Curriculum 3.80 3.39 3.10 2.89 3.60 3.55 3.20 4.23 3.79 2.83
Monitors
Student
Progress 4.09 3.35 3.15 2.72 3.60 3.48 3.14 4.23 3.74 2.91
Protects
Instructional
Time 3.83 3.56 3.70 2.87 3.64 3.68 3.56 3.82 3.14 2.96
Maintains
High Visibility 3.94 3.69 3.65 2.47 3.58 3.28 3.27 4.07 3.71 2.45
Provides
Incentives for
Teachers 3.20 2.53 3.28 2.48 3.00 3.50 2.76 3.84 3.33 2.45
Promotes
Professional
Development 4.31 3.84 3.65 3.34 3.74 4.03 3.61 4.23 3.99 2.95
Provides
Incentives for
Learning 3.83 3.56 3.20 2.11 3.62 3.40 2.70 4.08 3.54 2.58
Frames the School’s Goals
As a group, principals were, on average, rated within 3.46 and 3.82 on each of the
questions on framing the school goals (see Table 6), indicating teachers perceived their
principals in the sometimes range when creating a mission and goals for the school.
Overall, principals scored highest using data on student performance when developing the
school’s academic goals (Q4) and lowest on using needs assessment or other formal and
informal methods to secure staff input on goal development (Q3).
Each principal received a total average score on each of the subscales (see Table
7). Looking across the ten principals, we can see that teachers rated their principal from a
low of 2.81 (Principal 4) to a high of 4.42 (Principal 8). Lower averages tell us that the

ASSESSING INSTRUCTIONAL LEADERSHIP IN RURAL NEW MEXICO 68
teachers perceived their principals’ leadership practices and behaviors as seldom
exhibited and higher averages as frequently exhibited.
Figure 6 shows the average total scores of teachers’ ratings of their principals on
the extent to which they frame the school’s goals. A score of 15 indicates that the
occurrences of instructional leadership behaviors as perceived by teachers are sometimes
displayed in daily practice. Elementary Principal 4, with an average total score of 14.03,
received the lowest total rating from her/his teachers and Elementary Principal 8 received
the highest total score with 22.08 points. Fifty percent of the principals fell at or above
the 20-point range, indicating that the occurrences of instructional leadership related to
framing the school’s goals were frequently displayed in daily practice. Forty percent of
the principals were above the 15-point range. Teachers who work with Principal 4 rated
this principal a 2.81 on average, indicating that this principal’s behaviors fall within the
seldom range, whereas Elementary Principal 8 was rated an average of 4.42, indicating
that the principal’s behaviors fell within the frequently range (See Table 7).
When asked “What does your principal need to know and do in order to support
teachers at your school”, teachers responded with the principal needs to have “clearer
goals” and “help staff understand what the school wide goals are, (communicate) the
mission and vision.”

ASSESSING INSTRUCTIONAL LEADERSHIP IN RURAL NEW MEXICO 69
Figure 6. A comparison of the average total score each principal received on the subscale,
Frames the School’s Goal.
Communicates the School’s Goals
Principals were rated on the extent to which teachers perceived them as
communicating the school’s goals and mission effectively to members of the school
community; discussing the school’s academic goals with teachers at faculty meetings;
referring to the school’s academic goals when making curricular decisions with teachers;
ensuring that the school’s academic goals are reflected in highly visible displays in the
school; and the extent to which the principal refers to the school’s goals or mission in
forums with students.
As a group, teachers’ perceptions of their principals’ instructional behaviors
ranged from 3.26 to a 3.81 (Table 6), indicating the principals, on average, fell in the
sometimes range on each of the questions related to communicating the school’s goals.
Individual principals ranged, on average, from as low as 2.71, indicating that the principal
was in the seldom range, and as high as 4.43, indicating that principal was in the
frequently range. The majority of principals fell in the sometimes and frequently range.
Figure 7 shows the average total scores of teachers’ ratings of their principals on the
0.00
5.00
10.00
15.00
20.00
25.00

ASSESSING INSTRUCTIONAL LEADERSHIP IN RURAL NEW MEXICO 70
extent to which they communicate the school goals. Elementary Principal 4 received the
lowest ratings with an average score of 13.54, indicating teachers perceived this principal
in the seldom range when it came to communicating the school’s goals. Fifty percent of
principals had a total average score at or above 20 points, with Elementary Principal 1
received the highest rating with an average score of 22.14, indicating teachers perceived
these principals as frequently communicating the school’s goals. Forty percent of
principals had a total average score above 15 points, indicating teachers perceived these
principals as sometimes communicating the school’s goals.
When asked what their principal needed to know and do in order to support them,
one teacher stated s/he needed the principal to “better communicate expectations and
ensure staff is on board with decisions made for the school.”
Figure 7. A comparison of the average total score each principal received on the subscale,
Communicates the School Goals.
Supervises and Evaluates Instruction
Teachers, on average, rated the principals between a 3.43 and 3.57 on supervising
and evaluating instruction (Table 6), rating principals highest on ensuring that the
classroom priorities of teachers are consistent with the goals and direction of the school
0.00
5.00
10.00
15.00
20.00
25.00

ASSESSING INSTRUCTIONAL LEADERSHIP IN RURAL NEW MEXICO 71
(Q11) and lowest on reviewing student work products when evaluating classroom
instruction (Q12). Individually, principals ranged from 2.91 (Seldom range) to a 4.22
(Frequently range) (Table 7). Figure 8 shows the average total scores of teachers’ ratings
of their principals on the extent to which they supervise and evaluate instruction. The
majority of principals received average ratings below 20 points with only Elementary
Principal 8 scoring over 20 points and Elementary Principal 4 receiving the lowest points.
Several teachers stated they needed support from their principal in this area. One
elementary teacher stated s/he needed “constructive criticism and more praise for the
work we do.” Another stated that s/he needed the principal to conduct “classroom
observations, formal and informal, and provide feedback after the observations,” and
“take notice of teacher performance and praise them for their efforts.”
Figure 8. A comparison of the average total score each principal received on the subscale,
Supervises and Evaluates Instruction.
Coordinates the Curriculum
All principals were rated, on average, between a 3.24 and a 3.52 on coordinating
the curriculum (see Table 6), rated lowest on participating actively in the review of
curricular materials (Q20), with an average rating of 3.24 and highest on drawing upon
0.00
5.00
10.00
15.00
20.00
25.00

ASSESSING INSTRUCTIONAL LEADERSHIP IN RURAL NEW MEXICO 72
results of school-wide testing when making curricular decisions (Q17), with an average
rating of 3.52. Individual principals ranged from a 2.83 (Seldom range) to a 4.23
(Frequently range) (Table 7). The majority of principals fell in the sometimes range.
Figure 9 shows the average total scores of teachers’ ratings of their principals on the
extent to which they coordinate the curriculum. Elementary Principal 4 and Secondary
Principal 2 received the lowest average scores (14.47 and 14.15, respectively), indicating
these principals fell in the seldom range when coordinating the curriculum, as perceived
by teachers. Sixty percent of principals scored between 16 and 19 average points,
indicating they fell in the sometimes range. Only Elementary Principal 8 scored above 20
points, indicating that her/his teachers perceived her/him as frequently coordinating the
curriculum.
When asked what the principal needs to know and do to support them, a teacher
reported that the principal needed to “make sure that we get the necessary materials for
the classroom” and another stated “…the principal needs to know the curriculum we are
utilizing in our classrooms and the tools we need to implement our lessons.”
Figure 9. A comparison of the average total score each principal received on the subscale,
Coordinates the Curriculum.
0.00
5.00
10.00
15.00
20.00
25.00

ASSESSING INSTRUCTIONAL LEADERSHIP IN RURAL NEW MEXICO 73
Monitors Student Progress
As a whole group, teachers rated their principals between a 2.99 and a 3.68 on
monitoring student progress (See Table 6), with the lowest average of 2.99 on meeting
individually with teachers to discuss student progress (Q21) and the highest average of
3.68 on using tests and other performance measures to assess progress toward school
goals (Q23). When looking at individual school principals (see Table 7), principals
ranged from an average of 2.72 (Seldom range) through a 4.23 (Frequently). Figure 10
shows the average total scores of teachers’ ratings of their principals on the extent to
which they monitor student progress. Elementary Principal 4 and Secondary Principal 2
are the only two principals that had fewer than 15 point-averages. Only Elementary
Principal 1 and Elementary Principal had average ratings above 20 points.
When asked what the principal needs to know and do in order to support teachers
at the school, one elementary teacher stated the principal “need[s] to provide more
tutoring classes for students at risk.”
Figure 10. A comparison of the average total score each principal received on the
subscale, Monitors Student Progress.
0.00
5.00
10.00
15.00
20.00
25.00

ASSESSING INSTRUCTIONAL LEADERSHIP IN RURAL NEW MEXICO 74
Protects Instructional Time
Overall, principals were rated on average between 2.63 (Seldom range) and 3.89
(Sometimes range) on protecting instructional time (see Table 6), scoring lowest on
ensuring that students are not called to the office during instructional time (Q27) and
scoring highest on encouraging teachers to use instructional time for teaching and
practicing new skills and concepts (Q29). The majority of principals were rated in the
Sometimes range, when looking at principals individually (see Table 7). Figure 11
shows the average of the total points each principal received on the extent to which they
protect instructional time for teachers. Elementary Principal 4 and Secondary Principal 2
are the only principals who fell below the 15 points, indicating that these principal scored
more in the seldom range in regards to protecting instructional time for teachers. All other
principals scored above 15 points, but below 20, indicating teachers perceived principals
as sometimes protecting instructional time.
When asked what the principal needs to know and do to support teachers, one
teacher stated that the principal needs to “support teachers’ planning time, quit cancelling
specials (library, music, PE),” and another stated that the principal needs to “respect our
time, be aware of our curriculum, assessments, and schedules.”

ASSESSING INSTRUCTIONAL LEADERSHIP IN RURAL NEW MEXICO 75
Figure 11. A comparison of the average total score each principal received on the
subscale Protects Instructional Time.
Maintains High Visibility
Overall, teachers, on average, rated principals between a 2.55 (Seldom range) and
3.84 (Sometimes) on maintaining high visibility (see Table 6), rating highest on covering
classes for teachers until a late or substitute teacher arrives (Q34) and rating lowest on
tutoring students or providing direct instruction to classes (Q35). Individually, principals
averaged from as low as 2.45 (Seldom range) to 4.07 (Frequently range) (see Table 7).
Figure 12 shows the average total score each principal received on the subscale,
Maintains High Visibility. Elementary Principal 4 and Secondary Principal 2 averaged
approximately 12 points, indicating teachers felt the principal seldom maintained high
visibility. The majority of principals were between 15 and 20 points, only Elementary
Principal 8 scored above 20 points.
When asked what the principal needs to know and do to support teachers, one
teacher stated s/he needed the principal to “limit off-site meetings as much as
possible…be visible in classrooms and on campus.” Another teacher stated s/he needs the
principal “to get involved with the student body and find more time to interact with
0.00
5.00
10.00
15.00
20.00
25.00

ASSESSING INSTRUCTIONAL LEADERSHIP IN RURAL NEW MEXICO 76
them.” Another teacher stated the principal needed to be “actively involved with
students…students would benefit by knowing their principal.” Several teachers expressed
that their principal needs to provide opportunities for input, “be more open to our ideas,”
“to be more open and welcome to ideas and suggestions given by teachers,” “listen to
concerns, allow for open discussion and opinions from others, often if it is not her idea,
it’s not considered.”
Figure 12. A comparison of the average total score each principal received on the
subscale, Maintains High Visibility.
Provides Incentives for Teachers
For the most part, principals were rated lowest on providing incentives for
teachers with an overall average of 2.98 and ranging between 2.5 and 3.21 (see Table 6).
Teachers rated principals lowest on acknowledging teachers exceptional performance by
writing memos for their personnel files (Q38) and rated principals highest on
complimenting teachers privately for their efforts (Q37). Individually, principals ranged
from 2.45 (Seldom range) to a 3.84 (Sometimes range) (see Table 7). Figure 13 shows
the average total score each principal received on the subscale, Provides Incentives for
Teachers. Fifty percent of principals earned averages below 15 points, indicating
0.00
5.00
10.00
15.00
20.00
25.00

ASSESSING INSTRUCTIONAL LEADERSHIP IN RURAL NEW MEXICO 77
teachers felt the principal fell in the seldom range in regards to providing incentives for
teachers. Four principals scored between 15 and 20 points, indicating teachers felt that
these principals sometimes displayed behaviors associated with providing incentives for
teachers.
Teachers reported that principals needed to “recognize teachers who are making a
difference, recognize growth…this might motivate teachers who are stagnant and do not
show growth,” “provide more positive reinforcement and recognition,” and “treat us as
professionals, find our areas of expertise, do not crucify us.”
Figure 13. A comparison of the average total score each principal received on the
subscale, Provides Incentives for Teachers.
Promotes Professional Development
With an overall average of 3.68, principals were rated the highest on promoting
professional development; teachers, on average, rated their principals highest on the
principal leading or attending teacher in-service activities concerned with instruction
(Q44) and rated principals lowest on actively supporting the use in the classroom of skills
acquired during in-service activities (Q42) (see Table 6). Individually, principals ranged
from 2.95 (Seldom range) to 4.31 (Frequently range) (see Table 7). Figure 14 shows the
0.00
5.00
10.00
15.00
20.00
25.00

ASSESSING INSTRUCTIONAL LEADERSHIP IN RURAL NEW MEXICO 78
average total score each principal received on the subscale, Promotes Professional
Development. All principals scored above an average of 15 points (Seldom range),
except for Secondary principal 2. Two principals scored averages above 20 points,
indicating that they sometimes to frequently display instructional behaviors associated
with promoting professional development.
When asked what the principal needs to do and know in order to support teachers,
one teacher commented, “More professional development training for teachers should be
provided so teachers will gain more knowledge on his/her content field.” Another stated,
“The principal needs to continue training and support teachers and staff.”
Figure 14. A comparison of the average total score each principal received on the
subscale, Promotes Professional Development.
Provides Incentives for Learning
Teachers, on average, rated principals between a 2.79 to a 3.42 on providing
incentives for learning (see Table 6). They rated principals lowest on contacting parents
to communicate improved or exemplary student performance or contributions (Q49) and
rated principals highest on using assemblies to honor students for academic
accomplishments or for behavior or citizenship (Q47). Individually, the principals’
0.00
5.00
10.00
15.00
20.00
25.00

ASSESSING INSTRUCTIONAL LEADERSHIP IN RURAL NEW MEXICO 79
average score on the subscale ranged from 2.73 (Seldom range) to 4.15 (Frequently
range); the majority of principals fell in the Sometimes range (see Table 7). Figure 15
shows the average total score each principal received on the subscale, Provides Incentives
for Learning. Three principals scored below the average score of 15 (Sometimes range),
with one of those principals scoring close to an average of 10 points, indicating that this
principal fell in the seldom range. One principal scored above an average of 20 points,
indicating that the teachers perceived this principal to frequently provide incentives for
learning. One teacher felt that the principal needed to ensure “monthly rewards for
children are implemented, like perfect attendance, best reader, etc.”
Figure 15. A comparison of the average total score each principal received on the
subscale Provides Incentives for Learning.
Comparison of Teachers’ Perceptions by Individual Principal
In Figures 16a and 16b, I display the average rating teachers gave each principal
on the 10 PIMRS subscales. Principal 4 was rated in the seldom range on 9 of the 10
subscales and lowest among principals in 6 of 10 subscales (Supervises and Evaluates
Instruction, Protects Instructional Time, Provides Incentives for Learning, Monitors
Student Progress, Frames the School’s Goals and Communicates the School’s Goals) and
0.00
5.00
10.00
15.00
20.00
25.00

ASSESSING INSTRUCTIONAL LEADERSHIP IN RURAL NEW MEXICO 80
second lowest in 4 of 10 subscales (Provides Incentives for Teachers, Coordinates the
Curriculum, Maintains High Visibility, and Promotes Professional Development).
Principal 10 was rated in the seldom range on 7 of the 10 subscales and in the sometimes
range on the remaining three subscales. Principal 10 was lowest among principals on
four subscales, Provides Incentives for Teachers, Coordinates the Curriculum, Maintains
High Visibility, and Promotes Professional Development and second lowest on the
remaining six.
Principal 8 was rated in the frequently range on 8 of the 10 subscales (Frames the
School’s Goals, Communicates the School’s Goals, Coordinates the Curriculum,
Monitors Student Progress, Promotes Professional Development, Supervises and
Evaluates Instruction, Provides Incentives for Learning, and Maintains High Visibility)
and in the sometimes range on the subscales, Provides Incentives for Teachers and
Protects Instructional Time. Principal 8 was rated the highest among principals on 7 of 10
subscales and second highest on the remaining 3, scoring lowest on Provides Incentives
for Teachers. Principal 1 was rated in the frequently range on 4 of the 10 subscales
(Communicates the School’s Goals, Promotes Professional Development, Frames the
School’s Goal, and Monitors Student Progress) and in the sometimes range on the
remaining six, scoring lowest on Provides Incentives for teachers.
Five of the principals scored in the seldom range on Provides Incentives for
Teachers, making this the lowest scoring subscale among principals. Provides Incentives
for Teachers requires principals to reinforce, acknowledge, and reward superior
performance through written form, compliment teachers privately for efforts or
performance, and create professional development opportunities as a reward.

ASSESSING INSTRUCTIONAL LEADERSHIP IN RURAL NEW MEXICO 81
Figure 16a. A comparison of the average total score principals received on each of the
subscales, as perceived by their teachers.
0.00
0.50
1.00
1.50
2.00
2.50
3.00
3.50
4.00
4.50
5.00
Prin1 Prin2 Prin3 Prin4 Prin5

ASSESSING INSTRUCTIONAL LEADERSHIP IN RURAL NEW MEXICO 82
Figure 16b. A comparison of the average total score principals received on each of the
subscales, as perceived by their teachers.
Open Ended Responses
I added two open-ended questions to the instrument for teachers: “What does your
principal need to know and do in order to support teachers at your school? and “Is there
anything else you would like to add.”
Twenty-eight teachers indicated they had between 1 and 4 years of teaching
experience. These teachers specifically indicated that they would like their principals to
support them by providing feedback after observations, actively checking on teachers and
offering support in the classroom, and communicating better with teachers. One teacher
0.00
0.50
1.00
1.50
2.00
2.50
3.00
3.50
4.00
4.50
5.00
Prin6 Prin7 Prin8 Prin9 Prin10

ASSESSING INSTRUCTIONAL LEADERSHIP IN RURAL NEW MEXICO 83
stated that the principal “should know what we are struggling with in order to help
support us.” New teachers need to know what is expected of them and what kinds of
support they can expect from principals (Davis & Bloom, 1998). Principals can build
relationships with new teachers by maintaining regular communication with teachers,
maintaining an open-door policy, providing positive and honest feedback, and fostering a
welcoming, nurturing, and collegial work environment (Carver, 2003).
Eight teachers indicated they had between 5-9 years of experience, but only six
answered the open-ended question. These teachers stated the principal needs to “know the
problems encountered by teachers and address the issues”, and “have clearer goals,
recognize students, monitor student progress.” Communication seemed to be a concern
with one teacher stating the principal needs to “provide feedback after observations, have
clear, delineated expectations, and respond to emails and calls in a timely manner.”
Another stated, the principal needs to “forewarn staff of pending changes, rather than
“effective immediately.”
One hundred and sixteen teachers that indicated that they have ten or more years
of teaching experience answered the open-ended question. Many of their responses could
be grouped into categories such as recognition of teachers, communication, favoritism,
and input and collaboration.
Comments regarding recognition included:
“We need more constructive criticism, and more praise for the work we do.”
“I feel that more recognition of a job well done would be welcome. Small
rewards would be welcome also.”
“Praise and encourage everyone. Don't leave anyone out. When someone is
doing a good job, say so.”

ASSESSING INSTRUCTIONAL LEADERSHIP IN RURAL NEW MEXICO 84
Comments regarding favoritism included:
“There needs to be a sense of equality of input and importance
between/among all teachers. At times there seems to be or there is a display of
favoritism towards some teachers and this creates a divide in the staff as a
whole and distrust between employees. This is a huge problem created by
principals, superintendents and board.”
“Make standards the same for all teachers and staff regardless of their personal
relationship with the principal as a family member or friend.”
“Not have favoritism, treat everyone with respect.”
Teachers’ comments regarding collaboration and input included:
“First and foremost listen to concerns. Allow for open-discussion and opinions
of others. Often it appears as though if it's not his/her idea, it's not
considered.”
“Make time to informally ask if there is any way he/she can help or guide in
an area of concern. Teachers might not ask because they’re made to feel
he/she's too busy.”
“Be open-minded to teacher input and suggestions. Be supportive in general,
specifically for new teachers.”
“Needs to be more open and welcome to ideas and suggestions given by
teachers. As teachers we need to have discipline issues with students to be
taken care of in a timely manner. Be more open to our ideas. Not support just
‘certain’ teachers.”
“He/she can schedule an informal meeting with each teacher and ask him/her
about the problems he/she encounters in class, without pressure and
prejudice.”

ASSESSING INSTRUCTIONAL LEADERSHIP IN RURAL NEW MEXICO 85
“Work with teachers, ask opinions, allow teachers to teach, do not
micromanage, we are professionals.”
Principals’ Self-Ratings of Instructional Management
The principals completed a version of the PIMRS that allows them to self-rate on
the ten subscales related to instructional leadership behaviors. Only five elementary
principals participated in the study; there were no secondary principals who agreed to
participate. Table 8 presents the descriptive statistics from the PIMRS for the five
elementary principals that took part in the study.
Table 8
Means and Standard Deviations on the PIMRS Completed by the Principals (N=5)
Variable N Mean Standard
Deviation
PIMRS Overall Score 5 3.74 0.21
Frames the School’s Goals 5 3.92 0.48
Communicates the School’s Goals 5 3.80 0.71
Supervises and Evaluates Instruction 5 3.64 0.26
Coordinates the Curriculum 5 3.48 0.59
Monitors Student Progress 5 3.36 0.67
Protects Instructional Time 5 3.84 0.38
Maintains High Visibility 5 3.96 0.50
Provides Incentives for Teachers 5 3.68 0.63
Promotes Professional Development 5 4.00 0.51
Provides Incentives for Students 5 3.72 0.52
Results from the analyses of responses to the PIMRS show principals rate
themselves highest in the area of Promotes Professional Development (x = 4.00). A mean
of 4 represents the occurrence of instructional leadership behaviors that are frequently
displayed in daily practice. For all other categories of job behaviors or practice, the
principals rated themselves, on average, as sometimes exhibiting the behavior or practice.
The overall mean for all five principals completing the PIMRS was 3.74 (SD = .21).
Principals rated themselves highest in the job function Promotes Professional

ASSESSING INSTRUCTIONAL LEADERSHIP IN RURAL NEW MEXICO 86
Development (mean = 4.00, SD = .51) and lowest in the area of Monitors Student
Progress (mean = 3.36, SD = .67). The second lowest self-rating for principals in the area
of instructional leadership behaviors was Coordinates the Curriculum (mean = 3.48, SD
=.59), suggesting principals spend little time coordinating curriculum across grade levels,
utilizing results from assessments to make curricular decisions, monitoring classroom
curriculum, and reviewing curricular materials.
Each subscale contains five items and scores can range from 5 to 25. A score of 5
means that the principal self-rated the frequency of her/his behavior on the five items
with a 1 (almost never) and a score of 25 means that the principal self-rated the frequency
of her/his behavior on the five items with a 5 (almost always). I considered any score
above 15 as positive and scores below 15 as negative because a score of 15 means that the
self-ranking of the frequency of behaviors was a 3 for each item (sometimes). Figures 17
through 21 illustrate the average on the principal’s self-rating on each of the
subcategories.
Figure 17. Average, self-rated scores on the PIMRS for Elementary Principal 1.
0.00
0.50
1.00
1.50
2.00
2.50
3.00
3.50
4.00

ASSESSING INSTRUCTIONAL LEADERSHIP IN RURAL NEW MEXICO 87
As illustrated in Figure 17, the highest average subscale scores for Elementary
Principal 1 are Frame’s the School’s Goals (mean = 3.80), Protects Instructional Time,
(mean = 3.80), Provides Incentives for Teachers (mean = 3.80). A mean score of 3
represents instructional leadership behaviors that are sometimes displayed in daily
practice.
Elementary Principal 2 ranked her/himself in the sometimes category in the
assessment of her/his leadership behaviors in all 10 job functions. When asked, “What
does your supervisor need to know and do in order to support principals in your district?”
the response was, “Allow more time for on-site time with staff and principal for working
on the goals, professional development, etc.”
Figure 18. Average, self-rated scores on the PIMRS for Elementary Principal 2.
Results from analyses of responses to the PIMRS show Elementary Principal 2
(Figure 18) rating her/himself highest in the area of Protects Instructional Time (mean =
4.40) and Maintains High Visibility (mean = 4.40). This principal assessed her/himself in
the range of frequently or almost always for Communicates the School’s Goals (mean =
4.20), Provides Incentives for Teachers (mean = 4.20), and Promotes Professional
0.000.501.001.502.002.503.003.504.004.505.00

ASSESSING INSTRUCTIONAL LEADERSHIP IN RURAL NEW MEXICO 88
Development (mean = 4.20). Elementary Principal 2 found that s/he sometimes exhibited
job functions such as Frames the School’s Goals (mean = 3.60), Coordinates the
Curriculum (mean = 3.40), Monitors Student Progress (mean=3.40) and Provides
Incentives for Learning (mean = 3.60).
As displayed in Figure 19, elementary Principal 3 rated the degree to which s/he
exhibited instructional leadership behaviors as frequently or almost always on 4 out of 10
job functions and displaying instructional leadership behaviors sometimes on
Communicates the School’s Goals (mean = 3.4), Supervises and Evaluates the
Curriculum, (mean = 3.80), Protects Instructional Time (mean = 3.60), and Provides
Incentives for Teachers (mean = 3.80). When asked, “What does your supervisor need to
know and do in order to support principals in your district?” the response was, “Our
needs as a school to include PD, materials and facility needs.”
Figure 19. Average, self-rated scores on the PIMRS for Elementary Principal 3.
Results from analyses of responses to the PIMRS show Elementary Principal 4
(Figure 20) rating her/himself highest in the area of Maintains High Visibility (mean =
0.00
0.50
1.00
1.50
2.00
2.50
3.00
3.50
4.00
4.50
5.00

ASSESSING INSTRUCTIONAL LEADERSHIP IN RURAL NEW MEXICO 89
4.40). Another area for displaying instructional leadership behaviors rated by the
principal as frequently was Promotes Professional Development (mean = 4.00). The areas
for displaying job behaviors or practice identified by Elementary Principal 4 as sometimes
included the job functions of Frames the School’s Goals (mean = 3.40), Coordinates the
Curriculum (mean = 3.40), Supervises and Evaluates Instruction (mean = 3.40), Protects
Instructional Time (mean = 3.40) and Providing Incentives for Learning (mean = 3.60).
Elementary Principal 4 had the lowest total mean subscale scores on Coordinates the
Curriculum (mean = 2.60), Monitors Student Progress (mean = 2.60) and Provides
Incentives for Learning (mean= 2.60), all in the seldom range in terms of displaying
specific job functions associated with these categories. When asked, “What does your
supervisor need to know and do in order to support principals in your district?” the
response was, “It would be helpful if our (school) calendar included on half day per week
for PLCs, RtI, and in-service.”
Figure 20. Average, self-rated scores on the PIMRS for Elementary Principal 4.
0.000.501.001.502.002.503.003.504.004.505.00

ASSESSING INSTRUCTIONAL LEADERSHIP IN RURAL NEW MEXICO 90
Elementary Principal 5 rated the frequency of her/his instructional leadership
behaviors as frequently or almost always on 8 out of 10 job functions and displaying
instructional leadership behaviors sometimes on Supervises and Evaluates Instruction,
(mean = 3.40), and Monitors Student Progress (mean = 3.40) (Figure 21). When asked
“What does your supervisor need to know and do in order to support principals in your
district?” the response was, “with all the new initiatives, requirements, it is going to take
a new principal, like myself, some time to get full “on board” with each one. As we focus
on one (PARCC, Teacher Evaluations, Accreditation…) it seems as though others get
neglected and fall through the cracks.”
Figure 21. Average, self-rated scores on the PIMRS for Elementary Principal 5.
Table 9 shows the average teacher rating and the average principal self-rating on
each of the PIMRS subscales for the elementary teachers and principals. The results of
the study show there is a consistent difference at the elementary level in the perceptions
0.00
0.50
1.00
1.50
2.00
2.50
3.00
3.50
4.00
4.50

ASSESSING INSTRUCTIONAL LEADERSHIP IN RURAL NEW MEXICO 91
of teachers and principals concerning the level of instructional leadership exercised by the
principals.
Table 9
Average Elementary Teacher Ratings and Elementary Principal Self-Ratings on Each of
the PIMRS Subscales
PIMRS Scale Teachers Principals Difference
Frames the School’s Goals 3.69 3.92 0.23
Communicates the School’s Goals 3.61 3.80 0.19
Supervises and Evaluates Instruction 3.48 3.64 0.16
Coordinates the Curriculum 3.44 3.48 0.04
Monitors Student Progress 3.40 3.36 -0.04
Protects Instructional Time 3.53 3.84 0.31
Maintains High Visibility 3.36 3.96 0.60
Provides Incentives for Teachers 3.06 3.68 0.62
Promotes Professional Development 3.82 4.00 0.18
Provides Incentives for Learning 3.19 3.72 0.53
Principals, on average, rated themselves higher on nine of the ten subscales, with
the difference ranging from 0.04 points to 0.62 points. This finding of differences
between the perceptions of teachers and principals is consistent with prior research (e.g.,
Hallinger & Murphy, 1985).
The biggest differences were on Provides Incentives for Teachers, with teachers
rating principals on average with a 3.06 (Sometimes Range) and principals rating
themselves on average with a 3.68 (Sometimes/Frequently range); Maintains High
Visibility, with teachers rating principals on average with a 3.36 (Sometimes Range) and
principals rating themselves on average with a 3.96 (Sometimes/Frequently range); and,
Provides Incentives for Learning with teachers rating principals, on average, at a 3.19
(Sometimes range) and principals rating themselves, on average, at a 3.72
(Sometime/Frequently range).

ASSESSING INSTRUCTIONAL LEADERSHIP IN RURAL NEW MEXICO 92
Looking at the teachers’ ratings, seven of the subscale means fell between 3.0 and
3.6: Supervises and Evaluates Instruction, Coordinates the Curriculum, Monitors Student
Progress, Protects Instructional Time, Maintains High Visibility, Provides Incentives for
Teachers, and Provides Incentives for Learning. Two subscales fell between 3.6 and 3.7:
Frames the School’s Goals and Communicates the School’s Goals. The highest aggregate
score achieved among the principals on a subscale was a mean of 3.82 on the function,
Promotes Professional Development.
According to the teachers, when analyzed in terms of the three instructional
leadership dimensions (Hallinger, 1985), the highest average ratings across the subscales
were on the principals’ behaviors under Defining the School’s Mission. For the
dimensions of Developing the School Learning Climate and Managing the Instructional
Program the average rating across the subscales was 3.4 (in the sometimes range).
Relationships between demographic factors and subscale scores
Table 10 presents a partial estimated correlation matrix in which I tested bivariate
relationships between the teachers’ demographic variables and their scores on the PIMRS
subscales.

ASSESSING INSTRUCTIONAL LEADERSHIP IN RURAL NEW MEXICO 93
Table 10
Partial Estimated Correlation Matrix of PIMRS and Demographic Variables
(Spearman’s rho, n = 160)
LEVEL
Grade Level
YEARCUR
Years
worked with
current
principal
YEAREXP
Years of
experience as
teacher
GENDER
Gender of
principal
YEARCUR .236**
Years worked with current
principal
YEARSEXP -0.048 0.042
Years of experience as teacher
GENDER 0.055 -0.092 0.059
Gender of principal
Scale1Score 0.071 .252** 0.216 -0.094
Scale2Score 0.051 .288** 0.09 -0.065
Scale3Score -0.019 .157* 0.153 0.059
Scale4Score 0.07 .238** .215** -0.033
Scale5Score 0.056 .264** .180* -0.075
Scale6Score .210** 0.151 0.144 -0.087
Scale7Score 0.138 .282** 0.03 0.025
Scale8Score 0.087 .195* .172* -0.049
Scale9Score .166* .275** 0.126 -0.04
Scale10Score 0.084 .353** .197* -0.129 * p <.05, ** p < .001
There was a positive, weak statistically significant correlation (r = .236, p = .003)
between the number of years the teacher has worked with the principal and the level at
which the teacher is teaching (elementary or secondary), indicating that teachers who
work at the elementary level tend to have worked with their principal for a longer period
of time than those working at the secondary level. There was also a positive, weak
statistically significant correlation (r = .210, p = .008) between the level at which the
teacher is teaching and the Scale6Score (Protects Instructional Time), indicating that
teachers who work at the elementary level tend to score their principal higher on the
extent to which they protect the teachers’ instructional time. Finally, there is a positive,
weak statistically significant correlation (r = .166, p = .036) between whether the teacher

ASSESSING INSTRUCTIONAL LEADERSHIP IN RURAL NEW MEXICO 94
works at the elementary or secondary level and Scale9Score (Promotes Professional
Development), indicating that teachers who work at the elementary level tend perceive
their principal as more frequently supporting teachers’ efforts to improve instruction
The results indicate that there are positive, statistically significant relationships
between all subscale scores and the number of years teachers indicated they have worked
with their current principal.
The number of years of teaching experience is related to Scale4Score
(Coordinates the Curriculum, r = .215, p = .006), Scale5Score (Monitors Student
Progress, r = .180, p = .023), Scale8Score (Provides Incentives for Teachers, r = .172, p =
.030) and Scale10Score (Provides Incentives for Learning, r = .098, p = .013).
There are positive, statistically significant relationships between working at the
elementary level and the frequency with which principals supervise and evaluate
instruction (r = .153, p = .054), coordinate curriculum (r = .215, p = .006), monitor
student progress (r = .180, p = .023), provide incentives for teachers (r = .172, p = .030)
and provide incentives for learning (r = .191, p = .013).
Reliability
Cronbach’s alpha
The second research question asked: does the internal consistency of the
instrument match that of previous research attempts? The Null Hypothesis (H0) states:
there is no difference in the measures of internal consistence yielded from this study
when compared with the measures yielded from previous research.
In order to determine the internal consistency of the PIMRS when tested with a
sample of rural teachers, I estimated Cronbach’s alpha of reliability coefficient and
compared it to Hallinger’s (1983) original findings. I also examined an estimated
correlation matrix of the relationship between the PIMRS and demographic variables.

ASSESSING INSTRUCTIONAL LEADERSHIP IN RURAL NEW MEXICO 95
The estimated Cronbach’s alpha reliability coefficients for all ten subscales were
greater than .80, estimates that fall in the acceptable category (George & Mallery, 2003).
The reliability of the entire PIMRS was quite high with an estimated Cronbach’s alpha of
.985. The estimates of Cronbach’s alpha reliability coefficients for the PIMRS subscales
based on this study are presented in Table 11.
Table 11
Comparison of Estimates of Cronbach’s Alpha Reliability Coefficient for the 10
Subscales on the PIMRS from Hallinger (1983) and Sisneros (2015)
Subscale
Northern New
Mexico
Sample*
# of
Items
Hallinger’s
(1983)
Original
Study
Frames the School’s Goals 0.99
5
0.89
Communicates the School’s Goals 0.94
5
0.89
Supervises and Evaluates Instruction 0.91
5
0.90
Coordinate the Curriculum 0.94
5
0.90
Monitors Student Progress 0.91
5
0.90
Protects Instructional Time 0.86
5
0.84
Maintains High Visibility 0.88
5
0.81
Provides Incentives for Teachers 0.91
5
0.78
Promotes Professional Development 0.93
5
0.86
Provides Incentives for Learning 0.93
5
0.87
*Reliability estimates are Cronbach’s Alpha coefficients
Validity
Construct validity and instrument validation must be examined to ensure the
instrument is actually measuring the constructs that it intends to measure (Vogt, 2007). I
used a one-way analysis of variance (ANOVA) to determine the ability of the PIMRS to
differentiate among the teachers’ perceptions of the instructional leadership behavior of
the principals being rated. I compared the variance in teacher ratings of principals within
schools with the variance in teacher ratings across schools on each of the subscales. Table
12 presents the results from these analyses.

ASSESSING INSTRUCTIONAL LEADERSHIP IN RURAL NEW MEXICO 96
The results indicate a significantly higher variation in the ratings by teachers
between schools than within schools. Statistical significance exceeds the standard of .01
** p < .05, *** p<.01 for nine of the 10 subscales and the standard of .05 for the tenth.
This suggests that the PIMRS possesses a high degree of construct validity.
Another way to test construct validity is to compare the “intercorrelation between
pairs of subscales with each subscale's reliability coefficient. When the intercorrelation
between subscales is lower than the subscale reliability coefficients, it suggests that the
subscales are measuring distinguishable constructs” (Hallinger, 1994, p. 18).
When comparing the intercorrelation for the subscales in this study (Table 13) we
can see that these estimated correlations are lower than the estimated reliability
coefficients in Table 12, thus providing additional evidence of the construct validity of
the PIMRS with the data collected in this study.
Table 12
PIMRS Construct Validity: Analysis of Variance by Subscale
Subscale F value Significance
Frames the School’s Goals 6.25*** 0.000
Communicates the School’s Goals 5.69*** 0.000
Supervises and Evaluates Instruction 3.14*** 0.002
Coordinates the Curriculum 3.48*** 0.001
Monitors Student Progress 4.07*** 0.000
Protects Instructional Time 2.50** 0.011
Maintains High Visibility 6.40*** 0.000
Provides Incentives for Teachers 3.75*** 0.000
Promotes Professional Development 3.82*** 0.000
Provides Incentives for Learning 5.87*** 0.000

ASSESSING INSTRUCTIONAL LEADERSHIP IN RURAL NEW MEXICO 97
Table 13
Estimated Correlation Matrix for 10 Subscales on the PIMRS (n = 160)
Sub1 Sub2 Sub3 Sub4 Sub5 Sub6 Sub7 Sub8 Sub9 Sub10 Sub1 1 Sub2 .865** 1 Sub3 .752** .774** 1 Sub4 .796** .814** .831** 1 Sub5 .790** .831** .848** .882** 1 Sub6 .682** .683** .621** .662** .697** 1 Sub7 .721** .787** .708** .747** .804** .718** 1 Sub8 .643** .730** .690** .737** .764** .677** .728** 1 Sub9 .764** .761** .680** .773** .742** .709** .736** .725** 1 Sub10 .734** .742** .669** .767** .789** .656** .764** .765** .758** 1
**Correlation is significant at the 0.01 level (2-tailed)
Other studies of the PIMRS’ validity have tended to focus on establishing face,
content and construct validity of the instrument and provide reliable data on instructional
leadership (Hallinger, 2011).
Summary
In this section, I present each research question and a summary of the findings that
helped me answer the questions.
Research Question 1
Based on the Principal Instructional Management Rating Scale (PIMRS), how do teachers
in the Española Public Schools perceive the instructional management of their principals?
Teachers rated the frequency of their principal’s instructional leadership behaviors
between seldom and sometimes on all of the PIMRS subscales, whereas principals self-
rated between sometimes and frequently. The results of the study show there is a
consistent difference in the perceptions of teachers and principals concerning the level of
instructional leadership exercised by the principals. On nine of ten subscales, the
principals perceived themselves as exercising more active instructional leadership than
that perceived by their teachers. This finding of differences between the perceptions of
teachers and principals is consistent with prior research (e.g., Hallinger & Murphy, 1985).
ASSESSING INSTRUCTIONAL LEADERSHIP IN RURAL NEW MEXICO 98
Research Question 2
To what extent is the PIMRS reliable and valid when administered to a sample of teachers
and principals from a rural, northern New Mexico, predominantly Hispanic-serving
school district?
I utilized estimates of Cronbach’s alpha reliability coefficient to determine the
reliability of the instrument and compared my findings to Hallinger’s (1983) original
findings. Based on the data from this study, the estimated Cronbach’s alpha reliability
coefficients for all ten subscales were greater than .80, estimates that fall in the acceptable
category (George & Mallery, 2003). Also based on this study, the reliability of the entire
PIMRS was quite high, with an estimated Cronbach’s alpha of .985 and again similar to
findings from previous studies.
I conducted a one-way analysis of variance (ANOVA) to determine if the PIMRS
could differentiate among the teachers’ perceptions of the instructional leadership
behavior of the principals being rated. The results indicate a significantly higher variation
in the ratings by teachers between schools than within schools. Statistical significance
exceeds the standard of .01 for nine of the 10 subscales and the standard of .05 for the
tenth. This suggests that the PIMRS possesses a high degree of construct validity.

ASSESSING INSTRUCTIONAL LEADERSHIP IN RURAL NEW MEXICO 99
Chapter 5
Conclusions and Recommendations
The purposes of this study were to 1) determine to what extent the Principal
Instructional Management Rating Scale (PIMRS) is reliable and valid when administered
to a sample of teachers and principals from a rural, northern New Mexico, predominantly
Hispanic-service school district and 2) to look at teachers’ perceptions of their principal’s
instructional management as it relates to the 10 subcategories on the PIMRS.
I begin with an explanation of the findings included in Chapter 4. I continue with
a discussion of limitations, implications, directions for future research, a discussion of
how to address the challenges of rural school principals and a summary of results.
Research Questions and Explanation of Findings
The first research question I sought to answer was: Based on the Principal
Instructional Management Rating Scale (PIMRS), how do teachers in the Española Public
Schools perceive the instructional management of their principals? Based on the teachers’
rating, they perceived their principal to display the leadership behaviors outlined on the
PIMRS between seldom and sometimes. Even though, for the most part, principals rated
themselves higher than the teachers, I was surprised that their self-ratings only fell in the
sometimes/frequently range. This suggests to me that they may also see a need for better
understanding of their roles and responsibilities. This in turn provides possible directions
for professional development.
The second research question I sought to answer was: To what extent is the
PIMRS reliable and valid when administered to a sample of teachers and principals from
a rural, northern New Mexico, predominantly Hispanic-serving school district?
In this study, reliability was tested through estimates of Cronbach’s alpha
reliability coefficient and an estimated Spearman correlation matrix. Internal consistency
ASSESSING INSTRUCTIONAL LEADERSHIP IN RURAL NEW MEXICO 100
is a measure based on the correlations between different items on the same test; internal
consistency was measured with Cronbach’s alpha, calculated from the pairwise
correlations between items (Knapp, 1991). George and Mallery (2003) present a
commonly accepted rule-of-thumb for describing internal consistency using Cronbach’s
alpha where values greater than .9 are considered excellent, values of .7 up to .9 are
considered good, values of .6 to .7 are considered acceptable, and values lower than of .5
to .6 are considered poor, and below .5 as unacceptable. The estimates of Cronbach’s
alpha reliability coefficient for eight of the 10 functional subscales can be considered
excellent and two fall in the good range. The estimates ranged from a low of .86 for
“Protects Instructional Time” to a high of .99 for “Frames the School’s Goals” and were
consistent with Hallinger’s (1983) findings.
The original validation study found that the PIMRS met high standards of
reliability (Hallinger, 1982). In this case, all ten subscales exceed .80 using Cronbach’s
test of internal consistency.
A statistically significant correlation was found between the number of years the
teacher had worked with the current principal and the extent to which the principal:
Frames the School’s Goals (r = .252, p<.001), Communicates the School’s Goals (r =
.288, p<.001), Supervised and Evaluated Instruction (r = .157, p<.05), Coordinates the
Curriculum (r = .238, p<.001), Monitors Student Progress (r = .264, p<.001), Maintains
High Visibility (r = .282, p<.001), Provided Incentives for Teachers (r = .194, p<.05),
Promotes Professional Development (r = .275, p<.001), and Provides Incentives for
Learning (r = .353, p<.001).
The total years of experience as a teacher was shown to have a statistically
significant relationship with Coordinates the Curriculum (r = .215, p<.001), Monitors
ASSESSING INSTRUCTIONAL LEADERSHIP IN RURAL NEW MEXICO 101
Student Progress (r = .180, p<.05), Provides Incentives for Teachers (r = .172, p<.05),
and Providing Incentives for Learning (r = .197, p<.05).
The results of the study show there are consistent differences in the perceptions of
teachers and principals concerning the level of instructional leadership exercised by the
principals. On nine of the ten subscales, the principals perceived themselves as exercising
more active instructional leadership than that perceived by their teachers. This finding of
differences between the perceptions of teachers and principals is consistent with prior
research (e.g., Hallinger & Murphy, 1985). The PIMRS demonstrated attributes of
predictive ability because its ability to predict more positive attitudes of teachers towards
their principals leadership behaviors. Differences in perceptions may be attributed to a
misunderstanding of what the principal’s role is as a leader in the school. The role of the
principal is ever changing. The principal is responsible for providing leadership and
school reform within the school where he/she works. Principals are responsible for
interacting with parents who serve on advisory boards, parent/teacher organizations, and
booster clubs (Education Encyclopedia, 2015). Because the work of a school leader is
ever evolving, principals and teachers may not have a clear understanding of what those
roles and responsibilities are. It is quite possible that due to the amount of turnover in the
district, the teachers have not formed positive attitudes toward the principal.
The school district can help principals become better leaders by addressing gaps
in principals’ instructional leadership behavior through professional development and
clearly defining instructional leadership roles so that administrators and teachers clearly
understand what is expected of the principal (Hallinger & Murphy, 1985).
Limitations
As is the case with all research, this study has limitations. The first limitation is
the inclusion of only one district in the study. The district is a small one, with 11

ASSESSING INSTRUCTIONAL LEADERSHIP IN RURAL NEW MEXICO 102
elementary schools, one middle school, and one high school. While the findings cannot
be generalized to other geographic regions with similar demographic characteristics, the
results are similar to other studies using the PIMRS to collect data.
Implications
This study supports the use of the PIMRS as a valid and reliable tool for
measuring teachers’ perceptions of principal leadership behaviors with rural
schoolteachers. Probably the biggest implication from the substantiation of this tool as a
valid and reliable instrument is the potential for its expanded use in other rural school
districts. Prior to this current study, the instrument had been normed in urban school
districts in the United States (Coltharp, 1989; Hallinger, 1983; Hallinger & Murphy,
1985; Jones, 1987; Krug, 1986; Lehl, 1989). Hallinger, Taraseina, and Miller (1994)
conducted a study in Thailand, and Saavadra (1985) conducted a study in Malaysia.
Ultimately, school principals and the decisions they make at the school level are
critical to raising student achievement (Leithwood et al., 2004). Principals are
accountable for student success and must have knowledge and skills that had not been
required in the past (Hoachlander, Alt, & Beltranena, 2001). Principals need to have an
understanding of instructional practices that contribute to student academic success and
the capacity to work with school staff to implement these practices (Hoachlander, Alt, &
Beltranena, 2001). The effectiveness of building principals as instructional leaders is
based on a combination of intrapersonal and interpersonal skills (Hallinger, 2003). Rural
school districts will be able to use data from the instrument to evaluate principals and
design professional development for principals around leadership and instructional
behaviors as they relate to school improvement.

ASSESSING INSTRUCTIONAL LEADERSHIP IN RURAL NEW MEXICO 103
Directions for Future Research
The findings from my study suggest additional areas to explore, including: 1)
whether or not teachers would be willing to rate principals higher if they had worked with
them longer; 2) how to differentiate rural culture vs. urban culture in research on
principals; 3) a better understanding of the institutional supports and incentives that could
contribute to principals wanting to become better instructional leaders; and, 4) whether or
not there is a need to reconceptualize the correlates of effective leadership when thinking
about rural principals.
Addressing the Challenges of Rural School Principals
If I were the superintendent of this district, I would use the results to work with
principals on creating professional development plans, not only to address perceptions,
but also to address the professional development principals need to be more effective
administrators and as a basis for planning and evaluating the district professional
development programs (Hallinger & Murphy, 1985).
Examples of the professional development that would be required for all
principals based on this study include the use of school and student data to inform
decisions around goal setting, curriculum and instruction, teacher evaluation, and
evaluation of programs. Principals need adequate learning supports if they are to use data
to improve practice (Datnow, 2007; Ingram, Louis, & Schroeder, 2004; Supovitz &
Klien, 2003). Based on the answers teachers gave on the open-ended questions,
professional development for principals could focus on effective communication
strategies, creating and communicating the school’s vision, mission, goals and
expectations for teachers and learning.
Principals will continue to need professional development in the use of technology
as a communication tool, as a tool to analyze data, and as a tool to warehouse

ASSESSING INSTRUCTIONAL LEADERSHIP IN RURAL NEW MEXICO 104
information. Technology can also be used to address professional development needs for
principals through on-line courses, video conferencing, and webinars (De Ruyck, 2005).
Working in a rural school district can be challenging for principals. Challenges
include geographic and cultural isolation. It can be difficult to attain a position as a
principal in a rural school district if candidates do not have some type of affiliation with
the community (Preston et al., 2013). “Possessing personal and/or historic ties to the
community impacts the principal’s ability to deal with tensions that may spill into the
school from the community” (Preston et al., 2013, p. 3).
Challenges faced by rural school principals are unique to each district. They might
include pressure from political groups, the need to become acquainted with the district
and community, deciding who to trust, and a lack of people in whom to confide (Czaja,
1997, p. 2). Rural school principals must be aware of the politics that come into play,
because of the likelihood of community members being related to one another (De
Ruyck, 2005). It is also important for principals to form relationships within the
community. Principals need to understand local knowledge, histories, key figures, and
rituals (Murphy, 1996). Rural school principals often do not have the means to separate
themselves from the political arena as administrators do in larger districts (De Ruyck,
2005).
Summary
Chapter 5 included an overview of the study, the conclusions, various
implications, and recommendations based on the analysis of the collected data. The
purpose of this quantitative research study was to determine the reliability and validity of
the PIMRS when administered to teachers and principals in a rural school district in
northern New Mexico and based on the PIMRS, how teachers in this district perceive the
instructional management of principals.

ASSESSING INSTRUCTIONAL LEADERSHIP IN RURAL NEW MEXICO 105
The present study was the first attempt to examine in this school district the
teachers’ perceptions of principal leadership behaviors on the 10 instructional leadership
functions outlined in the PIMRS. In addition, the study is one of the very few to look at
principals’ leadership behaviors using the PIMRS in a rural, poor, predominantly
Hispanic school district. These results address gaps in the literature.
Findings from the study indicate that this tool is a valid and reliable tool to
measure teachers’ perceptions of principal leadership behaviors in a rural school district.
The findings can assist districts in creating professional development for principals and
assist in principal evaluation. For individual principals these data can be used to identify
aspects of the instructional leadership role. Comparisons of principal self-assessment data
with teacher perceptions can be used for goal-setting or problem solving (Hallinger &
Murphy, 1987).
Principals need to understand their roles and responsibilities in order to lead
effective schools. Using this instrument and others like it would help establish a baseline
of principals’ behaviors and start conversations around the kinds of professional
development, support, and mentoring that both novice and veteran principals alike so
rightly deserve.

ASSESSING INSTRUCTIONAL LEADERSHIP IN RURAL NEW MEXICO 106
References
Alspaugh, J. W. (1998). The relationship of school and community characteristics to high
school drop-out rates. The Clearing House, 71(3), 184-188.
American History and Genealogy Project-New Mexico. (2014, March). 1852 Map of
New Mexico Territory. Retrieved from
http://nmahgp.genealogyvillage.com/bernalillo/countymap.html
Aragón, R. J. (2006). The Penitentes of New Mexico: Hermanos de la Luz/Brothers of the
Light. Santa Fe: Sunstone Press.
Archdiocese of Santa Fe. (2014a, March). Four Hundred Years of Catholicism in New
Mexico. Retrieved from
http://www.archdiocesesantafe.org/ABSheehan/ABSMessages/98.1.1.400YearN
M.html
Archdiocese of Santa Fe. (2014b, March). The Long Journey of the Pilgrim Child.
Retrieved from http://www.holychimayo.us/Santuario/PilgrimChild.html
Artz, G. (2003). Rural area brain drain: Is it a reality? Retrieved from American
Agricultural Economics Association: www.choicesmagazine.org
Ashton, B. & Duncan, H. E. (2012). A Beginning Rural Principal's Toolkit: A guide for
success. Rural Educator, 34(1), 19-31.
Ayers, J. (2011). Considerations for reauthorizing the elementary and secondary
education act. Retrieved from
http://www.americanprogress.org/wpcontent/uploads/issues/2011/08/pdf/rural_sc
hools.pdf
Bamburg, J. &. Andrews, R. (1990). School goals, principals and achievement. School
Effectiveness and School Improvement, 2(3), 175-191.

ASSESSING INSTRUCTIONAL LEADERSHIP IN RURAL NEW MEXICO 107
Barley, Z. A & Beesley, A. D. (2007). Rural school success: What can we learn? Journal
of Research in Education, 1-16.
Barnett, K., & McCormick, J (2004). Leadership and individual principal-teacher
relationships in schools. Educational Administration Quarterly, 40(3), 406-434.
Barth, R. S. (1990). Improving schools from within: Teachers, parents and principals can
make the difference. San Francisco, CA: Jossey-Bass. A Wiley Company.
Barnes, G. C. (2007). The cost of teacher turnover in five school districts. National
Commission on Teaching and America's Future.
Bass, B. M. (1990). From transactional to transformational leadership: Learning to share
the vision. Organizational dynamics, 18(3), 19-31.
Beesley, A., Moore, L., & Gopalani, S. (2010). Student mobility in rural nonrural
districts in five Central Region states. Washington, DC: U.S. Department of
Education, Institute of Education Sciences, National
Barley, Z. A. (2007). Rural school success: What can we learn? Retrieved from
http://jrre.psu/articles/22-1.pdf
Bolman, L. G. & Deal, T. E. (2001). Leading with soul: An uncommon journey of spirit.
San Francisco: Jossey-Bass.
Brookover, W., & Lezotte, L. (1977). Changes in school characteristics coincident with
changes in student achievement. East Lansing: College of Urban Development,
Michigan State University.
Brown, L. W. (1978). Hispano Folk life of New Mexico. Albuquerque: University of New
Mexico Press.
Budge, K. (2006). Rural leaders, rural places: Problem, privilege, and possibility. Journal
of Research in Rural Education, 21(13), 1-10.

ASSESSING INSTRUCTIONAL LEADERSHIP IN RURAL NEW MEXICO 108
Buettner, R. (2004). Coping mechanisms used by rural principals. Retrieved from
http://www.saskschoolboards.ca/old/ResearchAndDevelopment/ResearchReports/
Leadership/95-13.htm
Burke, J. T. (1973). The Miserable Kingdom. Las Vegas, NM: Our Lady of Sorrows
Church.
Burns, J. (1978). Leadership. New York: Harper & Row.
Carrillo, C. (1999). Our Lord of Esquipulas in New Mexico. Tradicion Revista, 4(2).
Carsey Institute. (2007). Rural America in the 21st century: Perspectives from the field.
Durham: University of New Hampshire.
Center for Educational Leadership. (2014, June). 4 Dimensions of Instructional
Leadership. Retrieved from www.info.k-12leadership.org
Chen, G. (2008). Communities, students, schools, and school crime: a confirmatory study
on crime in U.S. high schools. Urban Education, 43(3), 301-18.
Chi, G, & Ventura, S. J. (2011). An integrated framework of population change:
Influential factors, spatial dynamics, and temporal variation. Growth and Change,
43(4), 549-570.
City of Española. (2014, March 14). City of Española. Retrieved from
http://www.cityofespanola.org/
Clarke, J. & Hood, K. (1986). School improvement in a rural state. Educational
Leadership, 77-80.
Clarke, S., & Wildy, H. (2004). Context counts: Viewing small school leadership from
the inside out. Journal of Educational Administration, 42(5), 555-572.
Clifford, M. & Ross, S. (2012, September). Rethinking Principal Evaluation: A new
paradigm informed by research and practice. . Retrieved from
http://educatortalent.org/inc/docs/rethinkingPrincEvalReport.pdf

ASSESSING INSTRUCTIONAL LEADERSHIP IN RURAL NEW MEXICO 109
Coltharp, G. P. (1989). The relationship between leadership behaviors and instructional
leader effectiveness of building level administrators. Kansas State University,
Kansas: Unpublished Dissertation.
Corbett, M. (2007). Learning to leave: The irony of schooling in a coastal community.
Black Point, NS: Fernwood.
Cotton, K. (2000). The Schooling Practices that Matter Most. Portland: Northwest
Regional Educational Laboratory.
Cruzeiro, P. & Boone, M. (2009). Rural and small school principal candidates:
Perspectives of hiring superintendents. The Rural Educator, 31(1), 1-9.
Cuban, L. (1984). Transforming the frog into a prince: Effective schools research, policy
and practice as the district level. Harvard Educational Review, 54(2), 446-473.
Czaja, M. & Harman. M. (1997). Excessive school district superintendent turnover: An
explorative study in Texas. Retrieved from
http://iejll.synergiesprairies.ca/iejll/index.php/ijll/article/viewFile/14/13
Czaja, R. & Blair, J. (2005). Designing surveys: A guided to decisions and procedures.
Thousand Oaks, CA: Pine Forge Press.
Datnow, A. P. (2007). Achieving with data: How high performing districts use data to
improve instruction for elementary school students. Los Angeles, CA: Center on
Educational Governance. Retrieved from
https://ccl.northwestern.edu/papers/2012/LevinDatnow2012.pdf
Davis, B. & Bloom, G. (1998). Support for new teachers. Thrust for Educational
Leadership (November/December), pp. 16-18.
Davis, S., Kearney, K., Sanders, N. Thomas, C., & Leon, R. (2011). The policies and
practices of principal evaluation: A review of the literature. Retrieved from
www.wested.org/online_pubs/resource1104.pdf.

ASSESSING INSTRUCTIONAL LEADERSHIP IN RURAL NEW MEXICO 110
Day, C., Sammons, P., Hopkins, A., Leithwood, K. Gu, Q. & Brown, E. (2010). 10 strong
claims about successful school leadership. College for Leadership of Schools and
Children's Services.
Deal, T. & Peterson K. (1999). Shaping School Culture: The heart of leadership. San
Francisco, CA: Jossey-Bass.
De Ruyck, T. (2005, July 8). Identifying and Addressing the Challenges of the Rural
Principal. Retrieved from www.mern.ca/f08-papers/De-Ruyck.doc
DeYoung, A. (1995). Constructing and staffing the cultural bridge: The school as a
change agent in rural Appalachia. Anthropology and Education Quarterly, 26(2),
168-192.
Edington, E. D. & Koehler, L. (1987). Rural student achievement: Elements for
consideration. Retrieved from ERIC Document Reproduction Service No. ED
289658.
Edmonds, R. (1979). Effective schools for the urban poor. Educational Leadership, 37,
15-24.
Education Encyclopedia. (2015, July 8). School Principal - The Role of Elementary and
Secondary School Principals, Principal Duties and Responsibilities, Principal
Qualifications. Retrieved from
http://education.stateuniversity.com/pages/2333/Principal-School.html
Engec, N. (2006). Relationship between mobility and student performance and behavior.
Journal of Educational Research, 99(3), 167-78.
Foster, R. & Goddard, T. (2003). Leadership and culture in schools in northern British
Columbia: Bridge building and/or re-balancing act? Canadian Journal of
Educational Administration Policy (27), 1-5. Retrieved from

ASSESSING INSTRUCTIONAL LEADERSHIP IN RURAL NEW MEXICO 111
https://www.umanitoba.ca/publications/cjeap/articles/miscellaneousArticles/fostrv
erd.html
Gagnon, D. & Mattingly, M. J. (2012, July 17). Beginning teachers are more common in
rural, high-poverty, and racially diverse schools. Retrieved from
www.scholars.unh.edu
Gagnon, D. J. & Mattingly, M. J. (2015). Limited access to AP courses for students in
smaller and more isolated rural school districts. Durham, NH: Carsey School of
Public Policy, University of New Hampshire.
Gallegos, B. P. (1992). Literacy, Education, and Society in New Mexico, 1693-1821.
Albuquerque, NM: University of New Mexico Press.
Galvan, J. (2006). Writing literature reviews: a guide for students of the behavioral
sciences. (3rd ed.). Glendale, CA: Pyrczak Publishing.
George, D. & Mallery, P. (2003). SPSS for Windows step by step: A simple guide and
reference. (4th ed., Vol. 11.0). Boston: Allyn & Bacon.
Gill, R. (2003). Change management - or change leadership? Journal of Change
Management, 3(4), 307-318.
Goldring, E. B. & Pasternack, R. (1994). Principals' coordinating strategies and school
effectiveness. School Effectiveness and School Improvement, 5(3), 239-253.
Graham, S. (2009, Fall). Students in rural schools have limited access to advanced
mathematic courses. Retrieved from www.scholars.unh.edu
Green, R. L. (2013). A response to the call for effective leadership in today's schools:
Three essentials- preparation, competency, and dispositions. National Reform of
Applied Educational Research Journal, 26 (1 & 2), 3-16.

ASSESSING INSTRUCTIONAL LEADERSHIP IN RURAL NEW MEXICO 112
Griffith, J. (2004). Relation of principal transformational leadership on school staff job
satisfaction, staff turnover, and school performance. Journal of Educational
Administration, 42(3), 333-359.
Grissom, J. (2009). The role of effective principals in reducing teacher turnover in
disadvantaged schools. Truman Policy Research.
Hallenbeck, C. (1950). Land of the conquistadores. Caldwall, ID: Caxton Printers.
Hallinger, P. & Murphy, J. (1985). Assessing the instructional leadership behaviors of
principals. Elementary School Journal, 86(2), 217-248.
Hallinger, P. & Murphy, J. (1987). Assessing and developing principal instructional
leadership. Retrieved from http://philiphallinger.com/old-site/papers.html
Hallinger, P. (1983). Assessing the instructional management behavior of principals
(Doctoral dissertation). ERIC database (ED8320806). Retrieved from ERIC
Database (ED8320806).
Hallinger, P. (1992). The evolving role of American principals: From managerial to
instructional to transformational leaders. Journal of Educational Administration,
30(3), 35-48.
Hallinger, P. (2003). Leading educational change: Reflections on the practice of
instructional and transformational leadership. Cambridge Journal of Education,
33(3), 329-351.
Hallinger, P. (2005). Instructional leadership and the school principal: A passing fancy
that refuses to fade away. Leadership and Policy in Schools, 4, 1-20.
Hallinger, P. (2011). A review of three decades of doctoral studies using the Principal
Instructional Management Rating Scale: A lens of methodological progress in
educational leadership. Education Administration Quarterly, 47(2), 271-306.
Hallinger, P. (2013). Measurement Properties of the Principal Instructional Rating Scale.

ASSESSING INSTRUCTIONAL LEADERSHIP IN RURAL NEW MEXICO 113
Hallinger, P., Bickman, L., & Davis, K. (1996). School context, principal leadership, and
student reading achievement. Elementary School Journal, 96(5), 527-549.
Hallinger, P., Murphy, J., Well, M., & Mesa, R. (1983). Identifying the specific practices,
behaviors for principals. NASSP Bulletin, 83-91.
Hallinger, P., Taraseina, P., & Miller, J. (1994). Assessing the instructional leadership of
secondary school principals in Thailand. School Effectiveness and School
Improvement, 321-348.
Heck, R. & Hallinger, P. (1999). Conceptual models, methodology, and methods for
studying school leadership. In J. &. Murphy, The 2nd Handbook of Research in
Educational Administration. San Francisco: McCutchan.
Hoachlander, G., Alt, M. & Beltranena, R. (2001). Leading school improvement: What
the literature says. Atlanta, GA: SREB.
Hobson, A., Brown, E., Ashby, P., Keys, W., Sharp, C., & Benefield P. (2003). Issues for
early headship. Problems and support strategies.
Holy Family of Chimayo. (2014, March). El Santuario de Chimayo. Retrieved from
http://www.elsantuariodechimayo.us/index.html
Horgan, P. (1975). Lamy of Santa Fe. New York: Farrar, Straus, and Giroux.
Housing Assistance Council. (2012). Poverty in rural America. Retrieved from
www.ruralhome.org
Hrong, E. & Loeb, S. (2010). New Thinking about Instructional Leadership. Kappan,
92(3), 66-69.
Indian Pueblo Cultural Center. (2014, March). Santa Clara Pueblo. Retrieved from
http://www.indianpueblo.org/19pueblos/santaclara.html

ASSESSING INSTRUCTIONAL LEADERSHIP IN RURAL NEW MEXICO 114
Ingram, D., Louis, K. S., & Schroeder, R. G. (2004). Accountability policies and teacher
decision making: Barriers to the use of data to improve practice. Teacher College
Record, 106(6), 1258-1287.
Jantzi, D. & Leithwood, K. (1996). Toward the explanation of variation in teachers:
Perceptions of transformational school leadership. Educational Administration
Quarterly, 32(4), 512-538.
Jicarilla Apache Nation. (2014, March). History. Retrieved from
http://www.jicarillaonline.com/History/jic_apachehistory.html
Jenkins, M. E. & Schroeder, A. H. (1977). A brief history of New Mexico. Albuquerque:
University of New Mexico Press.
Jones, P. A. (1987). The relationship between principal behavior and student
achievement in Canadian secondary schools. Stanford University: Unpublished
Dissertation.
Joppe, M. (2000). Reliability. Retrieved from www.htm.uoguelph.ca/MJResearch/rp.htm
Keddie, A. & Niesche, R. (2012). It's almost like a white school now: Racialized
complexities, indigenous representation and school leadership. Critical Studies in
Education, 53(2), 169-182.
Kellogg Foundation. (2001). Perceptions of rural America. Battle Creek, MI: Kellogg
Foundation.
Killeen, K. & Schafft, K. A. (2009). The organizational and fiscal implications of
transient student populations in urban and rural areas. In H. A. Ladd, Handbook
of Research in Education Finance and Policy (pp. 631-650). New York:
Routledge.
Kirk, J. & Miller, M. L. (1986). Reliability and validity in qualitative research. Thousand
Oaks, CA: Sage Publications.
ASSESSING INSTRUCTIONAL LEADERSHIP IN RURAL NEW MEXICO 115
Knapp, T. R. (1991). Coefficient alpha: Conceptualizations and anomalies. Research in
Nursing & Health, 457-480.
Krug, F. S. (1986). The relationship between the instructional management behavior of
elementary school principals and student achievement. San Francisco:
Unpublished Dissertation.
Lapan, R., Tucker, B., Kim, S., & Kosciulek, J. F. (2011). Preparing rural adolescents for
post-high school transition. Journal of Counseling & Development, 329-342.
Latham, G. & Wexley, K. (1981). Increasing productivity through performance
appraisal. Menlo Park, CA: Addison Wesley.
Lehl, A. (1989). A comparison study of the instructional knowledge and instructional
leadership of elementary principals in Nebraska. University of Nebraska:
Unpublished Dissertation.
Leithwood, K. & Duke, D. (1999). A century's quest to understand school leadership. In
J. M.-L. (Eds.), Handbook of research on educational administration (2nd ed., pp.
45-73). San Francisco, CA: Jossey-Bass.
Leithwood, K. & Jantzi, D. (2005). A review of transformational leadership research
1996-2005. Leadership and Policy in Schools, 4(3), 177-199.
Leithwood, K. & Jantzi, D. (2006). Transformational school leadership for large-scale
reform: Effects on students, teachers, and their classroom practices. School
Effectiveness and School Improvement, 17(2), 201-227.
Leithwood, K. & Louis, K. S. (2012). Linking leadership to student learning. San
Francisco, CA: Wiley.
Leithwood, K. & Sun, J. (2012). The nature and effects of transformational school
leadership: A meta-analytic review of unpublished research. Educational
Administration Quarterly, 48(3), 387-423.

ASSESSING INSTRUCTIONAL LEADERSHIP IN RURAL NEW MEXICO 116
Leithwood, K. (1994). Leadership for school restructuring. Educational Administration
Quarterly, 30(4), 498-518.
Leithwood, K. A. & Montgomery, D. J. (1982). The role of the elementary school
principal in program improvement. Review of Educational Research, 52, 309-339.
Leithwood, K., Day, C., Sammons, P., Hopkins, D., & Harris, A. (2006). Successful
school leadership: What it is and how it influences pupil learning. Nottingham,
UK: University of Nottingham, Department of Education and Skills.
Leithwood, K., Jantzi, D., & Steinbach, R. (1998). Leadership and other conditions which
foster organizational learning in schools. In K. L. (Eds.), Organizational learning
in schools (pp. 67-92). Lisse: Swets & Zeitlinger.
Leithwood, K., Jantzi, D., & Steinbach, R. (1999). Changing leadership for changing
times. Buckingham, UK: One University Press.
Leithwood, K., Louis, K., Wahlstrom, K., & Anderson, S. (2010). Learning from
leadership: Investigating the link to improved student learning. New York:
Wallace Foundation.
Leithwood, K., Louis, K., Anderson, S. Wahlstrom, K. (2004, September). How
Leadership Influences Student Learning. Retrieved from
http://www.wallacefoundation.org/knowledge-center/school-leadership/key-
research/pages/How-Leadership-Influences-Student-Learning.aspx
Liontos, L. B. (1992). Transformational Leadership. Eugene, OR: ERIC Clearinghouse
on Educational Management.
Lock, G., Budge, G., Oakley, G., & Lunay, R. (2012). The loneliness of the long-distance
principal: Tales from remote Western Australia. Australian and International
Journal of Rural Education, 22(2), 65-77.

ASSESSING INSTRUCTIONAL LEADERSHIP IN RURAL NEW MEXICO 117
Marks, H. M., & Printy, S. M. (2003). Principal leadership and school performance: An
integration of transformational and instructional leadership. Educational
Administration Quarterly, 39(3), 370-379.
Marzano, R. J., Waters, T., & McNulty, B. A. (2005). School leadership that works:
From research to results. Alexandria, VA: ASCD.
Masumoto, M., & Brown-Welty, S. (2009). Case study of leadership practices and
school-community interrelationships in high-performing, high-poverty, rural
California high schools. Journal of Research in Rural Education, 24(1), 1-18.
Mattingly, M., Johnson, K. M., & Schaefer, A. (2011). More poor kids in more poor
places: Children increasingly live where poverty persists. Retrieved from
www.scholars.unh.edu.
McInerey, W. D. & Fletcher, T. E. (1995). Principal performance domains and principal
evaluations. National Council of Professors of Educational Administration.
Williamsburg, Virginia.
McGranahan, D. A., & Beale, C. A. (2002). Understanding rural population loss. Rural
America, 17(4), 2-11.
Mohr, N. (2000). Small schools are not large schools. Potential pitfalls and implications
for leadership. New York, NY: Teacher College Pres.
Mondragón, J. & Stapleton, E.S. (2005). Public Education in New Mexico. Albuquerque:
University of New Mexico Press.
Murphy, J. & Meyers, C. (2008). Turning around failing schools: Leadership lessons
from the organizational sciences. Thousand Oaks, CA: Corwin Press.
National Center for Education Statistics. (2013). Publications & Products, Staff.
Retrieved from www.nces.ed.gov

ASSESSING INSTRUCTIONAL LEADERSHIP IN RURAL NEW MEXICO 118
National Center for Education Statistics. (2013, May). The Condition of Education.
Retrieved from http://nces.ed.gov/programs/coe/indicator_tla.asp
New Mexico Compilation Commission. (2014, March). Brief History of the Compilation
and Publication of New Mexico Laws. Retrieved from
http://www.nmcompcomm.us/history.htm
New Mexico Jewish Historical Society. (2014, March). Home. Retrieved from
http://www.nmjewishhistory.org/
Office of Educational Research and Improvement. (1990). The principal's role in shaping
school culture. Washington, DC: U.S. Department of Education.
Ortiz, A. (1979). San Juan Pueblo. In S. Institution, Handbook of North American
Indians, Volume I: Southwest. Washington: Smithsonian Institution.
Ortiz, R. & Reichelt, L. (2014, March). The History of Rio Arriba. Retrieved from
http://www.rio-arriba.org/places_to_see,_things_to_do/local_history/index.html
Osborne, J. W. (2013). Best practices in data cleaning. Thousand Oaks, CA: Sage
Publishing.
PBS. (2014, March). U.S. Mexican War. Retrieved from
http://www.pbs.org/kera/usmexicanwar/biographies/stephen_kearny.html
Peralta, K. & Hayes, C. (2014, March). 1880 New Mexico Map. Retrieved from
http://nino-ladron-de-guevara.com/1880-new-mexico-map.html
Peterson, K. D., & Deal, T. E. (1998). How leaders influence the culture of schools.
Educational Leadership, 56(1), 28-30.
Pijanowski, J. C., Hewitt, P. M., & Brady, K. P. (2009). Superintendents' perceptions of
the principal shortage. NASSP Bulletin, 93, 85-95.

ASSESSING INSTRUCTIONAL LEADERSHIP IN RURAL NEW MEXICO 119
Pitner, N. J. (1988). The study of administration effects on effectiveness. In N. Boylan,
Handbook of Research in Educational Administration (pp. 99-122). New York:
Longman.
Poplin, M. (1992). The leader's role: Looking to the growth of teachers. Educational
Leadership, 49(5), 10-11.
Population Reference Bureau. (2013). Census 2000 Supplementary Survey. Retrieved
from www.census.gov
Preston, J. P., Jakubiec, B. A. E., & Kooymans, R. (2013). Common challenges faced by
rural principals: A review of the literature. Rural Educator, 35(1), 1-12.
Provasnik, S., KwealRamani, A., Coleman, M. M., Gilbertson, L., Herring, W., & Xi, Q.
(2007). Status of education in rural America (NCES 2007-040). Washington, DC:
National Center for Education Statistics, U.S. Department of Education.
Public Law 107-110. (2002, January). Retrieved from
http://www.gpo.gov/fdsys/pkg/PLAW-107publ110/content-detail.html
Purkey, S., & Smith, M. (1983). Effective schools: A review. Elementary School Journal,
427-452.
Reeves, C. (2003). Implementing the No Child Left Behind Act: Implications for rural
schools and districts. Naperville, Illinois: NCREL.
Riley, C. L. (1995). Rio del Norte, People of the Upper Rio Grande from Earliest Times
to the Pueblo Revolt. Utah: University of Utah Press.
Rio Arriba County. (2011). County History. Retrieved from http://www.rio-
arriba.org/places_to_see,_things_to_do/local_history/index.html
Ruane, J. (2005). Essentials of research methods: A guide to social science research.
Oxford: Blackwell Publishing.

ASSESSING INSTRUCTIONAL LEADERSHIP IN RURAL NEW MEXICO 120
Saavedra, A. (1987). Instructional management behaviors of secondary school
administrators. Malaybalay, Bukidnon, Malaysis: Unpublished master’s
dissertation.
Schafft, K., Killeen, K. M., & Morrissey, J. (2010). The challenges of student transiency
for rural schools and communities in the era of No Child Left Behind. In K. A.
Schafft, Rural Education for the twenty-first century: Identity, place, and
community in a globalizing world. (pp. 96-114). University Park: The
Pennsylvania State University Press.
Schafft, K. A. (2006). Poverty, residential mobility and student transiency within a rural
New York school district. Rural Sociology, 71(2), 212-231.
Schein, E. H. (1985). Organizational culture and leadership: A dynamic view. San
Francisco: Jossey-Bass.
Schlechty, P. C. (2000). Leading a school system through change: Key steps for moving
reform forward. In The Jossey-Bass Reader on Educational Leadership (pp. 182-
201). San Francisco, CA: Jossey-Bass.
Schwartzbeck, T. D., Prince, C. D., Redfield, D., Morris, H., & Hammer, P. C. (2003).
How are rural school districts meeting the teacher quality requirements of No
Child Left Behind. American Association of School Administrators and
Appalachia Educational Laboratory.
Sergiovanni, T. J. (1991). The principalship: A reflective practice perspective.
Massachusetts: Allyn and Bacon.
Smylie, M., & Hart, A. (1999). School leadership for teacher learning and change: A
human and social capital development perspective. In J. &. Murphy, Handbook of
research on educational administration. A project of the American Educational
Research Association (2nd ed., pp. 421-441). San Francisco: Jossey-Bass.

ASSESSING INSTRUCTIONAL LEADERSHIP IN RURAL NEW MEXICO 121
Starr, K., & White, S. (2008). The small rural school principalship: Key challenges and
cross-school responses. Journal of Research in Rural Education, 23(5), 1-12.
Stewart, J. (2006). Transformational Leadership: An evolving concept examined through
the works of Burns, Bass, Avolio, and Leithwood. Canadian Journal of
Educational Administration and Policy 54, 1-24.
Stricker, K. (2008). Dakota diaspora: The out-migration of talented youth from one rural
community. American Educational Research Association. New York.
Supovitz, J. A., & Klein, V. (2003). Mapping a course for improved student learning:
How innovative schools systematically use student performance data to guide
improvement. Philadelphia: Consortium for Policy Research in Education-
University of Pennsylvania.
Tate, B. (1968). The Penitentes of Sangre de Cristo. Truchas, NM: Tate Gallery.
Theobald, P., & Wood, K. (2010). Learning to be rural: Identify lessons from history,
schooling, and the U.S. corporate media. In K. A. Schafft, Rural education for the
twenty-first century (pp. 17-33). University Park, PA: The Pennsylvania State
University.
Thomson, S. (1993). Principals for Our Changing Schools: The Knowledge and Skills
Base. Fairfax, VA. : National Policy Board for Educational Administration.
Tiller, V. E. (1983). Jicarilla Apache. In S. Institution, Handbook of North American
Indians, Volume 10: Southwest. Washington: Smithsonian Institution.
Torrez, R. J. and Trapp, R. (2010). Rio Arriba: A New Mexico County. Los Ranchos,
NM: Rio Grande Books.
U. S. Department of Education. (2014, February 17). Rural Education Achievement
Program. Retrieved from http://www2.ed.gov/nclb/freedom/local/reap.html

ASSESSING INSTRUCTIONAL LEADERSHIP IN RURAL NEW MEXICO 122
U.S. Census Bureau. (2013). School District Estimates for 2013. Retrieved from
http://www.census.gov/did/www/saipe/data/schools/data/2013.html
U.S. Department of Education. (2001). No Child Left Behind. Retrieved from
http://www2.ed.gov/policy/elsec/leg/esea02/index.html
United States Census Bureau. (2014, March). 2010 Census. Retrieved from
https://www.census.gov/2010census/
United States Department of Agriculture. (2013). Population change by metro/nonmetro
status, 1976-2013. Retrieved from http://www.ers.usda.gov/topics/rural-economy-
population/population-migration.aspx#.U0_wtKKwURU
University of Michigan. (2014). Jicarilla History. Retrieved from http://www-
personal.umich.edu/~sarhaus/courses/NRE501_W1999/FINAL/BEISELT/Jicarill
a99/Default.htm
Viva New Mexico. (2014). Historical Sidebar. Retrieved from
http://www.vivanewmexico.com/ghosts/hscounty.html
Vogt, W. P. (2007). Quantitative Research Methods for Professionals. Boston, MA:
Pearson.
Wallace Foundation. (2006). Leadership for learning: Making the connections among
state, district and school policies and practices. New York: Wallace Foundation.
Waters, T. & Cameron, G. (2007). The Balanced Leadership Framework: Connecting
vision with action. Denver, CO: Mid-continent Research for Education and
Learning.
Waters, T., Marzano, R. J., & McNulty, B. (2003). Balanced Leadership: What 30 years
of research tells us about the effect of leadership on student achievement. Aurora:
MCREL. Retrieved from www.mcrel.org

ASSESSING INSTRUCTIONAL LEADERSHIP IN RURAL NEW MEXICO 123
Williams, J. M., & Nierengarten, G. (2011). Recommendations from the North Star state:
Rural administrators speak out. Rural Educator, 33(1), 15-24.
Witziers, B., Bosker, R. J., & Kruger, M. L. (2003). Educational leadership and student
achievement. The elusive search for an association. Educational Administration
Quarterly, 398-425.
Wood, J. N., Finch, K., & Mirecki, R. M. (2013). If we get you, how can we keep you?
Problems with recruiting and retaining rural administrators. The Rural Educator,
12-24.
Wright, B. D. & Stone, M. H. (1999). Measurement Essentials (2nd ed.). Wilmington,
DE: Wide Range, Inc.
Wroth, W. H. (2014, March). Jicarilla Apache. Retrieved from
http://www.newmexicohistory.org/
Wroth, W. H. (2014, March). Ohkay Owingeh. Retrieved from
http://dev.newmexicohistory.org/filedetails.php?fileID=510
Yaremko, R. M., Harari, H., Harrison, R. C., & Lynn, E. (1986). Handbook of research
and quantitative methods in psychology: For students and professionals.
Hillsdale, NJ: Lawrence Erlbaum Associates.
Young, M. D., Peterson, G. T., & Short, P. M. (2002). The complexity of substantive
reform: A call for interdependence among key stakeholders. Educational
Administration Quarterly, 38(2), 137-175.
Yukl, G. (2006). Leadership in Organizations (6th ed.). Upper Saddle River, NJ:
Pearson/Prentice Hall.

ASSESSING INSTRUCTIONAL LEADERSHIP IN RURAL NEW MEXICO 124
Appendix A
Correspondence with Dr. Hallinger

ASSESSING INSTRUCTIONAL LEADERSHIP IN RURAL NEW MEXICO 125
Appendix B
UNM IRB Approval

ASSESSING INSTRUCTIONAL LEADERSHIP IN RURAL NEW MEXICO 126

ASSESSING INSTRUCTIONAL LEADERSHIP IN RURAL NEW MEXICO 127
Appendix C
PIMRS-Teacher Form
PRINCIPAL INSTRUCTIONAL MANAGEMENT
RATING SCALE
TEACHER FORM
Published by:
Dr. Philip Hallinger
7250 Golf Pointe Way
Sarasota, FL 34243
Leadingware.com
813-354-3543
All rights are reserved. This instrument may not be reproduced in whole or in part
without the written permission of the publisher.
Teacher Form 2.0

ASSESSING INSTRUCTIONAL LEADERSHIP IN RURAL NEW MEXICO 128
THE PRINCIPAL INSTRUCTIONAL MANAGEMENT
RATING SCALE
PART I: Please provide the following information about yourself:
(A) School Name: ____________________________
(B) Years, at the end of this school year, that you have worked with the current
principal:
____1 _____5-9 _____more than 15
____2-4 _____10-15
(C) Years experience as a teacher at the end of this school year:
____1 _____5-9 _____more than 15
____2-4 _____10-15
PART II: This questionnaire is designed to provide a profile of principal leadership. It
consists of 50 behavioral statements that describe principal job practices and behaviors.
You are asked to consider each question in terms of your observations of the principal's
leadership over the past school year.
Read each statement carefully. Then circle the number that best fits the specific job
behavior or practice of this principal during the past school year. For the response to each
statement:
5 represent Almost Always
4 represents Frequently
3 represent Sometimes
2 represent Seldom
1 represents Almost Never
In some cases, these responses may seem awkward; use your judgment in selecting the
most appropriate response to such questions. Please circle only one number per question.
Try to answer every question. Thank you.

ASSESSING INSTRUCTIONAL LEADERSHIP IN RURAL NEW MEXICO 129
To what extent does your principal . . . ?
ALMOST ALMOST
NEVER ALWAYS
I. FRAME THE SCHOOL GOALS
1. Develop a focused set of annual school-wide goals 1 2 3 4 5
2. Frame the school's goals in terms of staff
responsibilities for meeting them 1 2 3 4 5
3. Use needs assessment or other formal and informal
methods to secure staff input on goal development 1 2 3 4 5
4. Use data on student performance when developing
the school's academic goals 1 2 3 4 5
5. Develop goals that are easily understood and used
by teachers in the school 1 2 3 4 5
II. COMMUNICATE THE SCHOOL GOALS
6. Communicate the school's mission effectively
to members of the school community 1 2 3 4 5
7. Discuss the school's academic goals with teachers
at faculty meetings 1 2 3 4 5
8. Refer to the school's academic goals when making
curricular decisions with teachers 1 2 3 4 5
9. Ensure that the school's academic goals are reflected
in highly visible displays in the school (e.g., posters
or bulletin boards emphasizing academic progress) 1 2 3 4 5
10. Refer to the school's goals or mission in forums with
students (e.g., in assemblies or discussions) 1 2 3 4 5
III. SUPERVISE & EVALUATE INSTRUCTION
11. Ensure that the classroom priorities of teachers are
consistent with the goals and direction of the school 1 2 3 4 5
12. Review student work products when evaluating
classroom instruction 1 2 3 4 5

ASSESSING INSTRUCTIONAL LEADERSHIP IN RURAL NEW MEXICO 130
ALMOST ALMOST
NEVER ALWAYS
13. Conduct informal observations in classrooms on a
regular basis (informal observations are unscheduled,
last at least 5 minutes, and may or may not involve
written feedback or a formal conference) 1 2 3 4 5
14. Point out specific strengths in teacher's instructional
practices in post-observation feedback (e.g., in
conferences or written evaluations) 1 2 3 4 5
15. Point out specific weaknesses in teacher instructional
practices in post-observation feedback (e.g., in
conferences or written evaluations) 1 2 3 4 5
III. COORDINATE THE CURRICULUM
16. Make clear who is responsible for coordinating the
curriculum across grade levels (e.g., the principal,
vice principal, or teacher-leaders) 1 2 3 4 5
17. Draw upon the results of school-wide testing when
making curricular decisions 1 2 3 4 5
18. Monitor the classroom curriculum to see that it covers
the school's curricular objectives 1 2 3 4 5
19. Assess the overlap between the school's curricular
objectives and the school's achievement tests 1 2 3 4 5
20. Participate actively in the review of curricular materials 1 2 3 4 5
V. MONITOR STUDENT PROGRESS
21. Meet individually with teachers to discuss student
progress
1 2 3 4 5
22. Discuss academic performance results with the faculty
to identify curricular strengths and weaknesses 1 2 3 4 5
23. Use tests and other performance measure to assess
progress toward school goals
1 2 3 4 5
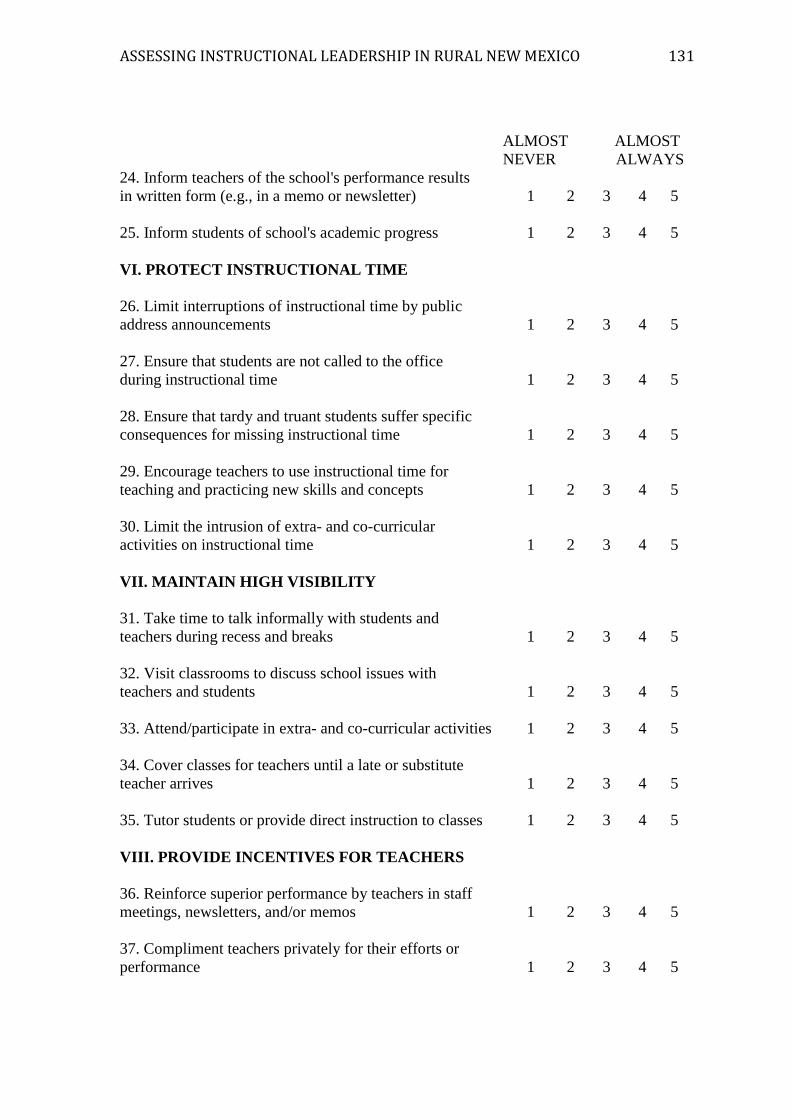
ASSESSING INSTRUCTIONAL LEADERSHIP IN RURAL NEW MEXICO 131
ALMOST ALMOST
NEVER ALWAYS
24. Inform teachers of the school's performance results
in written form (e.g., in a memo or newsletter) 1 2 3 4 5
25. Inform students of school's academic progress 1 2 3 4 5
VI. PROTECT INSTRUCTIONAL TIME
26. Limit interruptions of instructional time by public
address announcements 1 2 3 4 5
27. Ensure that students are not called to the office
during instructional time 1 2 3 4 5
28. Ensure that tardy and truant students suffer specific
consequences for missing instructional time 1 2 3 4 5
29. Encourage teachers to use instructional time for
teaching and practicing new skills and concepts 1 2 3 4 5
30. Limit the intrusion of extra- and co-curricular
activities on instructional time 1 2 3 4 5
VII. MAINTAIN HIGH VISIBILITY
31. Take time to talk informally with students and
teachers during recess and breaks 1 2 3 4 5
32. Visit classrooms to discuss school issues with
teachers and students 1 2 3 4 5
33. Attend/participate in extra- and co-curricular activities 1 2 3 4 5
34. Cover classes for teachers until a late or substitute
teacher arrives 1 2 3 4 5
35. Tutor students or provide direct instruction to classes 1 2 3 4 5
VIII. PROVIDE INCENTIVES FOR TEACHERS
36. Reinforce superior performance by teachers in staff
meetings, newsletters, and/or memos 1 2 3 4 5
37. Compliment teachers privately for their efforts or
performance 1 2 3 4 5

ASSESSING INSTRUCTIONAL LEADERSHIP IN RURAL NEW MEXICO 132
ALMOST ALMOST
NEVER ALWAYS
38. Acknowledge teachers' exceptional performance by
writing memos for their personnel files 1 2 3 4 5
39. Reward special efforts by teachers with opportunities
for professional recognition 1 2 3 4 5
40. Create professional growth opportunities for teachers
as a reward for special contributions to the school 1 2 3 4 5
IX. PROMOTE PROFESSIONAL DEVELOPMENT
41. Ensure that in service activities attended by staff
are consistent with the school's goals 1 2 3 4 5
42. Actively support the use in the classroom of skills
acquired during in service training 1 2 3 4 5
43. Obtain the participation of the whole staff in
important in-service activities 1 2 3 4 5
44. Lead or attend teacher in-service activities concerned
with instruction 1 2 3 4 5
45. Set aside time at faculty meetings for teachers to
share ideas or information from in-service activities 1 2 3 4 5
X. PROVIDE INCENTIVES FOR LEARNING
46. Recognize students who do superior work with formal
rewards such as an honor roll or mention in the
principal's newsletter 1 2 3 4 5
47. Use assemblies to honor students for academic
accomplishments or for behavior or citizenship 1 2 3 4 5
48. Recognize superior student achievement or improvement
by seeing in the office the students with their work 1 2 3 4 5
49. Contact parents to communicate improved or exemplary
student performance or contributions 1 2 3 4 5
50. Support teachers actively in their recognition
and/or reward of student contributions to and
accomplishments in class 1 2 3 4 5

ASSESSING INSTRUCTIONAL LEADERSHIP IN RURAL NEW MEXICO 133
Open Response Questions
1. What does your principal need to know and do in order to support teachers in
your school?
2. Is there anything else you would like to add?

ASSESSING INSTRUCTIONAL LEADERSHIP IN RURAL NEW MEXICO 134
ABOUT THE AUTHOR
Professor Dr. Philip Hallinger, author of the Principal Instructional Management Rating
Scale
(PIMRS), received his doctorate in Administration and Policy Analysis from Stanford
University.
He has worked as a teacher, administrator, and professor and as the director of several
leadership development centers. He has been a consultant to education and healthcare
organizations throughout the United States, Canada, Asia, and Australia. He is currently
Professor and
Executive Director of the College of Management, Mahidol University, in Thailand.
The PIMRS was developed with the cooperation of the Milpitas (California) Unified
School District, Richard P. Mesa, Superintendent. As a research instrument, it meets
professional standards of reliability and validity and has been used in over 150 studies of
principal leadership in the United States, Canada, Australia, Europe, and Asia.
The scale is also used by school districts for evaluation and professional development
purposes.
It surpasses legal standards for use as a personnel evaluation instrument and has been
recommended by researchers interested in professional development and district
improvement (see, for example, Edwin Bridges, Managing the Incompetent Teacher,
ERIC, 1984). Articles on the development and use of the PIMRS have appeared in The
Elementary School Journal, Administrators Notebook, NASSP Bulletin, and Educational
Leadership.
The PIMRS is copyrighted and may not be reproduced without the written permission of
the author. Additional information on the development of the PIMRS and the rights to its
use may be obtained from the publisher (see cover page).
ASSESSING INSTRUCTIONAL LEADERSHIP IN RURAL NEW MEXICO 135
Appendix D
Information Sheet
Research Project: Assessing instructional leadership in rural New Mexico: An
exploration of the reliability and validity of the Principal Instructional Management
Rating Scale (PIMRS).
Student Investigator: Christiana M. Sisneros
Faculty Advisor: Dr. Allison Borden, Associate Professor of Education, University of
New Mexico
You are being invited to take part in this research study because you are a teacher in the
Española Public Schools and are over 18 years of age. This survey is being conducted by
Christiana M. Sisneros in fulfillment of the requirements for the degree of doctor of
education in the Educational Leadership program at the University of New Mexico.
Why is this study being conducted?
This project focuses on teacher’s perceptions of school principal leadership behaviors.
This study examines the validity and reliability of the Principal Instructional Management
Rating Scale developed by Dr. Phillip Hallinger. Information shared as part of this study
will be used to inform practice and professional development around school and principal
leadership.
How many people will take part in this study?
All current teachers in the Española Public Schools will be invited to participate in this
study.
What is involved in this study?
Participation in this study will consist of completion of a 50-statement questionnaire that
describes principal job practices and behaviors and your observation of the principal’s
leadership. The survey should take approximately 15 minutes to complete. The survey is
completely anonymous. This study only involves the completion of the survey.
What are the risks and discomforts of the study?
There are no foreseeable risks associated with this study. Your involvement in the study
will have no consequences, disciplinary or otherwise, for you or your school.
What are the benefits of participating in the study?
There may be no direct benefits to you for participating. Data gained from your survey
will become the finding for the dissertation. These findings may add to the body of
knowledge related to principal leadership and effective schools.
Are there any costs?
The only cost is your time to participate.
What is the compensation?
You will not receive any compensation for participating in the study. However, you will
have an opportunity to submit your name to be included in a drawing for a Kindle Fire,
gift certificate to a local restaurant, or a $25 gift card to Walmart. When you finish the

ASSESSING INSTRUCTIONAL LEADERSHIP IN RURAL NEW MEXICO 136
questionnaire, you will complete and detach the bottom of the cover page and deposit it in
a secured box. That will be your “entry” or “raffle” ticket.
Can you withdraw from the study?
Participation is voluntary and you may choose to terminate participation in the study any
time prior to completion and submission of the survey. If you choose to withdraw, you
should leave the room and not submit your survey. If you begin the survey and choose to
withdraw before completion you should simply leave the room and discard the
incomplete survey. There is no consequence for withdrawing from the study.
What about confidentiality
The information that you provide is anonymous and will be kept confidential. You will
not be identified in any reports or papers. All surveys will be kept in a secure and locked
cabinet outside the district. Only the student investigator and her advisor will have access
to this information.
Contact Information
Should you have further questions or concerns about this research you may contact
Christiana Sisneros or her advisor, Dr. Allison Borden, at the address and telephone
number given below. If you have any questions about your rights as a participant in a
research project or for more information on how to proceed should you believe that you
have been injured as a result of your participation in this study, you should contact the
UNM Office of the IRB at (505) 277-2644 or email at [email protected].
Principal Investigator: Christiana M. Sisneros
Address: 4517 Camino San Juan
Santa Fe, NM 87507
Email: [email protected]
Telephone: 505-980-7708
Name of Faculty Sponsor: Dr. Allison Borden
Address: University of New Mexico, 309 Hokona Hall, MSCOS 3040, College of
Education, 1 University of New Mexico, Albuquerque, NM 87131-1231
Email: [email protected]
Telephone: 505-277-1285
Statement of consent
You have been given and have read or have had read to you a summary of this research
study. Participation in this study is voluntary and you may refuse to participate or
withdraw at any time without penalty or prejudice. Your decision whether or not to
participate will not impact your past (or future) involvement in the Espanola Public
School District.

ASSESSING INSTRUCTIONAL LEADERSHIP IN RURAL NEW MEXICO 137
Appendix E
Survey Administration Script
I’d like to inform you about an opportunity to participate in a research study about
principal leadership behaviors, which will take about 10-15 minutes of your time. In
order to encourage a high rate of return, the primary investigator of this study has offered
to raffle a Kindle Fire, a gift certificate to a local restaurant, and a $25 gift certificate to
Walmart. If you wish to learn more about the study, please remain in the room. The
choice is up to you to participate—it is entirely voluntary. If you do not wish to
participate you may leave the room at any time without consequence.
Thank you for your time, my name is Myra Martinez, and I am assisting with the
administration of this research project regarding teachers’ perceptions about principal
leadership behaviors. The information sheet I’m distributing gives some important
information about the study.
Please follow along as I review this sheet with you.
(Read the sheet word for word)
Does anyone have any questions? This form is for you to keep. Those who agree to
complete the survey should remain in the room.
(Allow time to leave)
This study is not a test, but rather a questionnaire on your observations of the principal’s
leadership practices and behaviors. There are not right or wrong answers. It is important
for you to answer the survey with full honesty.
This study only involves completion of the survey. Let me assure you once again that
your responses are anonymous.
If you choose to complete the survey please be sure to answer all questions and fill out all
information requested at the top of the questionnaire. I ask that you place your completed
questionnaires in the envelope provided, seal and place in the secured box provided. You
will detach and complete the cover sheet and place that in the additional secured box
provided, this will serve as your raffle ticket for the drawing that will be conducted at the
completion of the data collection for this study.
Once I distribute the questionnaires I will need to leave the room. Does anyone have any
final questions before I leave the room?
Thanks so much to everyone for participating.

ASSESSING INSTRUCTIONAL LEADERSHIP IN RURAL NEW MEXICO 138
Appendix F
Raffle Ticket
To be eligible for the drawing for a Kindle Fire, a gift certificate to a local restaurant, or a
$25 gift certificate to Walmart, please complete this sheet.
You should detach this sheet from your questionnaire and deposit it in the secured
box.
Name:
Phone number:
School:

ASSESSING INSTRUCTIONAL LEADERSHIP IN RURAL NEW MEXICO 139
Appendix G
IRB Approval- Amendment/Modification Principal Form

ASSESSING INSTRUCTIONAL LEADERSHIP IN RURAL NEW MEXICO 140

ASSESSING INSTRUCTIONAL LEADERSHIP IN RURAL NEW MEXICO 141
Appendix H
PIMRS-Principal Form

ASSESSING INSTRUCTIONAL LEADERSHIP IN RURAL NEW MEXICO 142

ASSESSING INSTRUCTIONAL LEADERSHIP IN RURAL NEW MEXICO 143

ASSESSING INSTRUCTIONAL LEADERSHIP IN RURAL NEW MEXICO 144

ASSESSING INSTRUCTIONAL LEADERSHIP IN RURAL NEW MEXICO 145

ASSESSING INSTRUCTIONAL LEADERSHIP IN RURAL NEW MEXICO 146

ASSESSING INSTRUCTIONAL LEADERSHIP IN RURAL NEW MEXICO 147
ABOUT THE AUTHOR
Professor Dr. Philip Hallinger, author of the Principal Instructional Management Rating
Scale
(PIMRS), received his doctorate in Administration and Policy Analysis from Stanford
University.
He has worked as a teacher, administrator, and professor and as the director of several
leadership development centers. He has been a consultant to education and healthcare
organizations throughout the United States, Canada, Asia, and Australia. He is currently
Professor and
Executive Director of the College of Management, Mahidol University, in Thailand.
The PIMRS was developed with the cooperation of the Milpitas (California) Unified
School District, Richard P. Mesa, Superintendent. As a research instrument, it meets
professional standards of reliability and validity and has been used in over 150 studies of
principal leadership in the United States, Canada, Australia, Europe, and Asia.
The scale is also used by school districts for evaluation and professional development
purposes.
It surpasses legal standards for use as a personnel evaluation instrument and has been
recommended by researchers interested in professional development and district
improvement (see, for example, Edwin Bridges, Managing the Incompetent Teacher,
ERIC, 1984). Articles on the development and use of the PIMRS have appeared in The
Elementary School Journal, Administrators Notebook, NASSP Bulletin, and Educational
Leadership.
The PIMRS is copyrighted and may not be reproduced without the written permission of
the author. Additional information on the development of the PIMRS and the rights to its
use may be obtained from the publisher (see cover page).

ASSESSING INSTRUCTIONAL LEADERSHIP IN RURAL NEW MEXICO 148
Open Response Questions:
1. What does your supervisor need to know and do in order to support principals in
your district?
2. Is there anything else you would like to add?