Embed Size (px)
Citation preview
F I N A N C I A L E N G I N E E R I N G L A B O R A T O R Y Technical University of Crete
Assessing Financial Distress where Bankruptcy is not an Option: An Alternative Approach for Local Municipalities Sandra Cohen Michael Doumpos Evi Neophytou Constantin Zopounidis
Working Paper 2011.02
July 2011
Working papers are in draft form. They are distributed for purposes of comment and discussion only. The papers are expected to be published in due course, in revised form. They may not be reproduced without permission of the copyright holder(s). Copies of working papers are available at www.fel.tuc.gr

FINANCIAL ENGINEERING LABORATORY
Department of Production Engineering & Management Technical University of Crete
List of Working Papers
Editorial Committee
Constantin Zopounidis, Michael Doumpos, Fotios Pasiouras
2010.01 Modelling banking sector stability with multicriteria approaches C. Gaganis, F. Pasiouras, M. Doumpos, C. Zopounidis
2010.02 Bank productivity change and off-balance-sheet activities across different levels of economic development A. Lozano-Vivas, F. Pasiouras
2010.03 Developing multicriteria decision aid models for the prediction of share repurchases D. Andriosopoulos, C. Gaganis, F. Pasiouras, C. Zopounidis
2010.04 Developing an employee evaluation management system: The case of a healthcare organization E. Grigoroudis, C. Zopounidis
2010.05 Analysis of domestic and cross-border mega-M&As of European commercial banks M. Nnadi, S. Tanna
2010.06 Corporate culture and the tournament hypothesis N. Ozkan, O. Talavera, A. Zalewska
2011.01 Mutual funds performance appraisal using a multicriteria decision making approach V. Babalos, N. Philippas, M. Doumpos, C. Zopounidis
2011.02 Assessing financial distress where bankruptcy is not an option: An alternative approach for local municipalities S. Cohen, M. Doumpos, E. Neophytou, C. Zopounidis

1
ASSESSING FINANCIAL DISTRESS WHERE BANKRUPTCY IS NOT AN OPTION:
AN ALTERNATIVE APPROACH FOR LOCAL MUNICIPALITIES
Sandra Cohen1, Michael Doumpos
2, Evi Neophytou
1, Constantin Zopounidis
2
1 Athens University of Economics and Business
Dept. of Business Administration (Sandra Cohen)
Dept. of Accounting and Finance (Evi Neofytou)
76, Patission St.
10434, Athens, Greece
2 Technical University of Crete
Dept. of Production Engineering and Management
Financial Engineering Laboratory
University Campus
73100, Chania, Greece
Abstract
The goal of this paper is to identify the key financial distress performance indicators of local
governments by using published financial data. Thus, using proper financial ratios the
financial performance of municipalities is assessed through a multicriteria methodology that
combines simulation analysis approach (stochastic multicriteria acceptability analysis) with a
disaggregation technique. In particular, an evaluation model is developed on the basis of
accrual financial data from 360 Greek municipalities for 2007. A set of customised to the
local government context financial ratios is defined that rate municipalities and distinguish
those with good financial condition from those experiencing financial problems. The model is
validated by testing its outputs on a subsample of 100 local governments assessed in two time
periods, 2007 and 2009. The model succeeded in correctly classifying distressed
municipalities according to a benchmark set by the central government in 2010. Such a model
and methodology could be particularly useful for performance assessment in the context of
several European Union countries that have a similar local government framework to the
Greek one and apply accrual accounting techniques.
Key words: Local governments, financial distress, multiple criteria analysis, financial ratios,
Greece
1. INTRODUCTION
The assessment of local government performance has become a major issue worldwide since
municipalities take on increasingly more responsibility in terms of providing essential
services to taxpayers. The increasing decentralization in decision-making from central to local
governments has made the measurement and evaluation of their financial performance
critical. Within this context, one could define sound financial performance as a municipality’s

2
ability to meet its financial obligations and to satisfy its service obligations to its citizens,
currently and in the foreseeable future. Municipalities with poor financial performance are not
able to offer quality municipal services to their residents, a fact that causes a plethora of
problems to the local community. Thus, local government interested parties would like to
know the indicators that signal the prospect of a municipality’s financial distress, as the
implications to political, social and economic state of affairs could be significant (Carmeli,
2003). This is of outmost importance, as municipalities, with rare exceptions, cannot declare
bankruptcy. In the same vein, the recent global financial crisis of 2007 has considerably
influenced the financial condition of local governments obliging them to cut down costs and
to focus more on efficiency improvements.
In the private sector the recent collapse of a significant number of large corporations has
resulted in an increased interest in distress modeling (e.g., Altman, 2001; Neofytou and Mar
Molinero, 2004). Distress prediction models are extensively used for screening and
monitoring purposes such as going concern, loan default and corporate performance
assessment. On the other hand, limited amount of effort has been devoted to develop such
models for the not-for-profit sector, despite the fact that these would provide important
insights for local government performance, albeit with notable exceptions (Kloha et al., 2005;
Murray and Dollery, 2005; Jones and Walker, 2007; Zafra-Gómez et al., 2009a; 2009b).
The scope of our research is to identify the key financial performance indicators of local
governments, using published accrual financial data. Therefore we develop a rating model for
evaluating municipalities according to their financial conditions and distinguishing those that
have a sound financial position from those that exhibit poor performance. More specifically,
our model ranks municipalities according to their financial status and it constitutes a robust
early warning system of financial distress for both external stakeholders as well as
municipality management. Such a model would be useful to policymakers and stakeholders to
identify a potential crisis, and also to assist municipalities that face financial trouble.
Moreover, our research is timely, at least for Greece, where the recent financial crisis has
considerably affected the financial condition of local governments. It is interesting that
Moody’s has recently (June, 2011) downgraded the municipality of Athens, the biggest
municipality in Greece that hosts the capital of the country with the reasoning that the
financial condition of the country could unavoidably influence local governments as well due
to the high level of integration of its local economic base with that of the national economy1.
1 http://www.moodys.com/research/Moodys-downgrades-City-of-Athens-to-Caa1-negative-
outlook?lang=en&cy=global&docid=PR_220129.

3
The model is developed by using a multicriteria decision making methodology
(Doumpos and Zopounidis, 2002; Zeleny, 1982), based on a simulation approach, which
enables the consideration of a large number of different evaluation scenarios to be examined.
At a second stage, the results of the simulation analysis are aggregated to build up an
operational evaluation model, which can be used to evaluate and rate the performance of any
municipality at any point in time. The model is developed on the basis of data retrieved form
a large sample of Greek municipalities for year 2007. However, we expect this model to have
a wider application, as there has been a recent shift towards accrual accounting adoption in
the European local government area (Pina et al., 2009). As the majority of European Union
countries have a financial reporting framework that shares similarities to the Greek one, we
anticipate that such a model and the proposed multicriteria methodology could be of particular
use to assess their performance as well. Moreover, our study expands research on local
governments’ financial distress in a European context, as past research has been mainly
focused on US and Australia.
The paper is structured as follows: in the second section we present the literature
review. The third section provides a short description of the characteristics of local
governments in Greece. Section 4 is devoted to the description of the methodology. In section
5 we present the results of the application of the methodology to our sample. Finally, the last
section of the paper discusses the conclusions of our study.
2. LITERATURE REVIEW
Even though there are a number of models that predict financial distress in the private sector,
such models are rare in the public sector. There are two main reasons for this. Firstly, the
majority of municipalities in Europe started publishing accrual accounting financial
statements only a few years ago, in contrast to the US local government sector that has a long
reporting history albeit under fund accounting (i.e. modified accrual accounting). Thus, the
calculation of financial ratios (i.e. liquidity ratios, activity ratios and capital structure ratios)
that are commonly used in corporate distress prediction models becomes feasible only after
the aforementioned accounting reform. Secondly, as municipalities in the majority of
countries cannot declare bankruptcy, the researchers cannot rely on historical data to identify
the characteristics that distinguish failed municipalities from healthy ones. Nevertheless, there
are some well known cases of local financial crises in the US such the New York City’s in
1976, Philadelphia’s in 1990, Orange County’s in 1994 and Miami’s in the 1990’s (Holande,
2003).

4
On the other hand, the application of private sector financial distress models in the
public sector is unsuitable. This is because both the interpretation of the financial ratio values
and their desirable magnitude is different in the public sector compared to the private sector
due to the intrinsic characteristics of the former. For example, the existence of high ROA
(return on assets) and ROCE (return on capital employed) values that characterize efficient
private sector corporations, is not a socially desirable outcome for municipalities due to their
non-profit character. Increased profitability may be interpreted not as an indication of
efficiency but as a result of unjustified high taxes imposition. In a similar vein, extensive debt
exposure may not result into debt default as the central government can help municipalities to
overcome liquidity problems. Moreover, the archetypal two-state failure model (i.e. failed vs
non failed) that is commonly used in the private sector is not applicable in the public sector,
as financially distressed entities do not actually declare bankruptcy.
While there have only been a few attempts to predict local government financial distress
in the research literature, several different techniques have been employed to identify
municipalities that may be facing financial difficulties. These techniques range from heuristic
approaches, such as financial statement analysis to more sophisticated methods such as
statistical modelling approaches.
The majority of these studies have been conducted in US and Australia where the
financial reporting systems are demanding in accounting information disclosures. More
specifically, Kleine et al. (2003) after reviewing existing assessment models developed a
simple fiscal distress index based on a weighting of nine variables for assessing the
performance of local governments. The same authors applied their model to a sample of
Michigan local governments and reported that it performed better than Michigan’s current
system of identifying potentially distressed local councils (Kloha et al., 2005).
Honadle (2003) in his survey that included fifty states in the US found that less than
half of these states made some attempt to predict local government’s fiscal crises. Their
prediction was mainly based on reviewing audit reports, local government reporting, or from
information gathered from discussions or regional workshops. Murray and Dollery (2005)
developed an econometric distress prediction model, applied it on Australian councils and
tested its validity against the results of a “watch list” compiled by a state government agency.
The categorisation in which they resulted was different from that of the government agency.
Jones and Walker (2007) developed a statistical model to explain sources of distress in local
governments. Their main finding was that the degree of distress, defined as the cost of
restoring infrastructure, in local councils is positively associated with the size of the

5
population they serve and the size and composition of their revenues. Zafra-Gómez et al.
(2009a) developed a model, which indicates whether a local government heads for financial
trouble and tested it in Spanish local governments. Their model scores local governments and
makes an assessment of their financial condition that ranges from emergency to excellent.
Nevertheless, they mostly use budgetary variables in their model that they consider to be more
relevant for their research setting.
An important aspect of the financial distress surveys is the proxy used in order to
distinguish local governments that experience financial problems from the healthy ones.
Several variables have been proposed for this purpose such as ratio indicators (Clark, 1977;
ICMA, 2003; Burne, 1992), the incidence of mergers or amalgamations, the quantity or
quality of service delivery and the cost of restoring infrastructure assets to satisfactory
condition (Jones and Walker, 2007).
3. CHARACTERISTICS OF GREEK MUNICIPALITIES
Greek municipalities provide traditional local government services such as the local registry,
refuse collection, development and maintenance of local infrastructure, cultural activities and
events. Recently they have also assumed several other responsibilities due to the
decentralization policy followed by the central government. As a result they offer primary and
secondary education services, transportation services, health services, etc. Municipalities’
revenues include taxes and fees as well as subsidies. Municipalities are forbidden to institute
their own taxes, while their fees and charges can only be varied between certain legal
boundaries and must be used for the specific purpose addressed by the fee or charge. The
subsidies cover both operating and investment needs and are mainly financed by specific
types of governmental revenues (e.g., a percentage of income tax, tax duties, etc.) which
according to legislation and are attributable exclusively to municipalities. Municipalities are
subject to the restrictive expenditure control mechanisms that govern the public sector
financials. The financial autonomy of local government (while guaranteed by the
Constitution) is in practice rather limited. Local governments, with the exception of the
largest municipalities, receive the largest part, roughly 57% of their revenues, from the central
government. Approximately 30% of that amount is received as earmarked grants, the
remainder as a general purpose grant (IMF, 2006, p. 12-13). Finally, it has to be noted that
the loans that local governments contract with banks are guaranteed for their payment by the
central government.

6
4. MULTICRITERIA METHODOLOGY
4.1. General framework
The construction of multicriteria evaluation models requires subjective judgments with
respect to the parameters of the evaluation process. These parameters should reflect the
judgment policy of a specific decision maker or a group of decision makers. In the context of
this study, however, this line of approach is not applicable, due to the lack of a decision maker
who could provide the necessary information and be the actual user of the evaluation model.
Furthermore, the difficulty of defining the concept of financial distress for local municipalities
in Greece and the complete lack of historical distress data make it impossible to develop
distress prediction models similar to the ones used for private entities (firms).
To overcome these difficulties, a combination of a simulation-based approach with a
disaggregation model is employed instead. An outline of the multicriteria methodology is
illustrated in Figure 1. A detailed description of the main parts of the methodology is given in
the following subsections.
Reference data
Trade-offsMarginal value
functions
Additive model
Ranking & classification of the
municipalities under each scenario
Aggregate rating
Final evaluation model
Scenario analysis through simulation
Figure 1: Methodological framework
4.2. Selection of reference data
The analysis is based on a set of reference data involving a selected base year. These data
provide a reference starting basis for the evaluation of the municipalities. Once the evaluation

7
model is constructed (on the basis of the reference data) it can be used to assess the
performance of any municipality at any given point in time, having the reference set as a kind
of benchmark. In this study, on the basis of data availability, the data for the municipalities in
2007 serve as the reference set. This is the year just before the outbreak of the global financial
crisis and the corresponding data provide a useful reference point, which is recent enough but
it is not affected by the turmoil caused by the crisis.
4.3. Scenario analysis for model building
The main part of the model building process is based on a scenario generation approach
implemented within the context of a simulation procedure. Simulation-based techniques have
become popular in MCDA as a powerful tool to address the uncertainties involved in
multicriteria evaluation problems with respect to the set of preferential parameters and/or the
data. A typical example of such approaches is the stochastic multicriteria acceptability
analysis framework (SMAA; Lahdelma et al., 1998; Lahdelma and Salminen, 2001), which
has been applied successfully in several decision making/aiding contexts (Tervonen and
Figueira, 2008). Similar approaches have been used by Arbel and Vargas (1993) within the
context of AHP, Butler et al. (1997, 2001) for multiattribute utility models, and Doumpos and
Zopounidis (2010) for the PROMETHEE method in bank rating.
In the context of this study, each municipality i is considered as a multivariate vector in
n , i.e., 1 2( , , , )i i i inx x x x , where xik denotes the input data for municipality i on evaluation
criterion k. For the purpose of the evaluation process, we assume an additive value model
defined as follows:
1
( ) ( )n
i i
k
k k kV w v x
x (1)
where wk is the trade-off constant for criterion k (all trade-offs are assumed to be non-
negative, while summing up to 1) and (·)kv is the marginal value function for criterion k,
normalized in [0, 1]. The additive model is well founded from a theoretical point of view
(Keeney and Raiffa, 1993) and has been used in a wide range of multicriteria evaluation
problems. Furthermore, the additive model retains the comprehensibility of a linear weighted
average aggregation, while overcoming its simplistic linearity assumption.
In order to avoid posing any restrictions (other than monotonicity) on the form of the
marginal value functions, we employ a piecewise linear modelling approach similar to the one
used in the context of the UTA methods (Jacquet-Lagrèze and Siskos, 1982). In particular,

8
1ks breakpoints 10 1 k k
k k k k
s sb b b b are introduced on the scale of each criterion k,
where 0
kb and k
k
sb are the minimum and maximum values, respectively, of criterion k in the
data set. Then, assuming that the performance xik of a municipality i on criterion k falls in a
subinterval 1[ , ]k kb b
(for some {1, , }ks ), its marginal value can be expressed by linear
interpolation as follows:
11 1
1
( ) ( ) [ ( ) ( )]k
k k k
k k k k k
ikk ki
x bv x v b v b v b
b b
(2)
Therefore, in context of the additive value function (1) different settings for the criteria
trade-offs 1, , nw w and the (piecewise linear) marginal value functions 1, , nv v lead to a
different evaluation model.
As noted above, in the absence of a decision maker that would provide information on
these parameters, a simulation-based approach is employed instead. In contrast to the
simulation approach, used for instance, in the SMAA framework, the simulation implemented
in this study is not restricted only to the criteria trade-off constants. Instead, we also take into
consideration the form of the marginal value functions, which is an important part of the
additive evaluation model. Thus, the simulation procedure is based on the generation of a set
of different scenarios for all the aforementioned parameters of the additive value function
(criteria trade-offs and marginal value functions). In this setting, in each simulation run
(scenario) a random additive value function is constructed through a two-step process, as
follows:
1. For each criterion k, a random marginal value function is constructed by generating 1ks
uniformly distributed random numbers in (0, 1), which are sorted (in ascending order) and
then assigned to 1( )k
kv b , 2( )k
kv b , …, 1( )k
k
skv b . For normalization, 0( )k
kv b and ( )k
k
k sv b are
set equal to 0 and 1, respectively. In all simulations, four subintervals are used for the
criteria (i.e., 4ks , for all 1, ,k n ), with the intermediate breakpoints defined on the
basis of the 25%, 50%, and the 75% percentile of the data.
2. The tradeoff constants 1, , nw w are generated at random such that 1 1nw w .
The constant is set equal to 0.01 in order to exclude unrealistic scenarios, where a
criterion becomes almost irrelevant for the evaluation. The random weights are adjusted
with the entropy approach proposed by Zeleny (1982), in order to take into account the
information introduced by each criterion in the analysis, according to the corresponding
marginal value function generated in the previous step.

9
The additive value function obtained with this procedure is used to evaluate all
municipalities in the reference set. The evaluation leads to a ranking of the municipalities
from the best to the worst performing ones. A relative rating scheme can also be employed. In
this study, a five-point rating (classification) of the municipalities is performed: top
performers, good performers, intermediate municipalities, poor performers, and very poor
performing municipalities (details on the rating process are given in section 5.3). Five-point
rating scales are widely used in many areas, ranging from questionnaire design (e.g., Likert
scale), to corporate performance evaluation and risk analysis. In that regard, the use of a five-
point rating scale provides a convenient way to present the results of an evaluation model,
which is easy for policy makers to understand.
4.4. Aggregation of the results and building of an operational evaluation model
At the end of the scenario-simulation analysis process, a set of evaluations is available for the
reference municipalities (rankings and ratings for each scenario run). These can be analyzed
with various statistical procedures and measures to obtain a holistic view of the strengths and
weakness of each municipality. However, this set of multiple evaluations is not very helpful
from an operational point of view. For instance, evaluating a specific municipality in the
future would require performing again the whole simulation process.
To address this issue, the results of the scenario analysis are aggregated to build an
operational evaluation model expressed in the form of an additive value function aggregating
(as best as possible) the complete set of evaluations. In the context of this study, the
simulation analysis results are first aggregated into a “collective” rating of the municipalities,
which is specified on the basis of the ratings obtained under each evaluation scenario in the
simulation process. This aggregate rating is then used as an input to a disaggregation method
in order to build the final evaluation model. At this step we use the UTADIS method
(Doumpos and Zopounidis, 2002) which enables the development of a multicriteria
classification model from a given set of reference data. Alternatively, it could also be possible
to define a range of possible ratings for each municipality (according to the simulation results)
and then employ recently proposed variants of the UTADIS method which are suitable for
handling this kind of input data (see for instance Greco et al., 2010).

10
5. CASE STUDY ON THE EVALUATION OF GREEK MUNICIPALITIES
5.1. Data description
At the end of 2010 there were around 900 municipalities in Greece. Municipalities that meet the
size criteria (either population or revenue thresholds) for accrual accounting adoption and
therefore should report financial statements are 577 according to EETAA’s2 calculations. The
sample used in this study uses the financial data of 364 Greek municipalities for year 2007.
Therefore our sample corresponds to the 63% of eligible population. The financial statements
have been collected from various sources in either hard copy form or as an electronic file. As
mentioned in the previous section, the 2007 data define the reference set on which the
evaluation model is built. An additional sample of 130 municipalities for 2009 is used to
examine the effect of the recent sever financial crisis in Greece (which became evident in the
beginning of 2010) on the financial performance of the municipalities. Furthermore, the 2009
data also facilitate the “validation” of the evaluation model.
In our analysis we selected six financial ratios. The selection of these financial ratios is
based on both private sector and public sector literature (ICMA, 2003; Berne, 1992; Anthony
and Young, 2003; Finkler, 2005; Cohen, 2008) as well as on the intrinsic characteristics of
Greek municipalities’ financial structure. Moreover, we believe that our model meets the key
attributes and criteria defined by Kloha et al. (2005) as prerequisites of a fiscal distress
assessment model. In contrast to other countries, Greece has not adopted explicitly defined
procedures for using specific measures in the context of assessing the financial performance
of local governments. However, there is an explicit provision included in the Municipal and
Communal Code issued in 2006 (Law 3463/2006) that financial ratios will be used. The new
law that intensifies the provision of quantitative information (Decision 17838/2010) states
that the performance of local governments will be assessed by applying ratio analysis and
gives a list of ratios that should accompany the published financial statements. All these ratios
are of financial nature. A working definition of financial performance assessment that
corresponds to the intentions of the Ministry of Interior is that ratio analysis should reflect an
assessment of a municipality’s ability to meet its financial obligations and to satisfy its service
obligations to its citizens both currently and in the foreseeable future.
The ratios that have been selected for the purpose of our model are the following:
2 EETAA is an agency responsible to provide to the local government agencies, the public sector and the social
agencies professional and technical support.

11
Total liabilities / Total assets (L/A): This ratio depicts the reliance of a municipality on
third party financing. According to Finkler (2005) a debt to equity value of one or less is a
favorable indicator. In other words, a value for L/A of more than 50% is a less favorable
indicator. The higher the value of the liabilities to total assets the greater the
municipality’s leverage and thus the greater the extent to which it utilizes debt funds to
supplement internal equity funds.
Own revenues / Total liabilities (R/L): Total liabilities correspond to bank loans (short
term and long term) as well as short term debts to suppliers, contractors, and other
accounts payable (e.g. social security and pension funds, taxes). In Greece municipalities
are permitted to get into contract with banks only for acquiring loans to finance their
investments. Getting loans for financing operating expenses in prohibited by law. The
capacity of municipalities to pay the interest from their own revenue is a sign of financial
health. The more the part of the own revenues that is necessary to cover interest payments,
the less the resources available to cover operating expenses. According to data available
up to 2005, the indebtedness of local governments was low and balanced by substantial
cash holdings (IMF (2006, p.12)3. In contrast to other EU countries, until recently there
were no restrictions on the modalities of borrowing instruments, and, for example, no
maximum debt-revenue or debt-service to revenue limits. However, the memorandum
signed between Greece, IMF and EC (Law 3845/2010) after the outbreak of the financial
crisis in Greece included a clause that municipalities would be able to contract new loans
only if the ratio of total liabilities to total revenues was less than 60%.
Short term liabilities / Own revenues (STL/R): This ratio is indicative of the relation
between the short term liabilities and the own revenues. In its reverse form it is a turnover
ratio that refers to how many times own revenues are sufficient to cover short term
liabilities (in the case of Greek municipalities, short term liabilities mostly involve
financial obligations towards suppliers, contractors, as well as taxes and obligations
towards social security and pension funds). Therefore, we use this measure as a liquidity
indicator. We use this ratio instead of a traditional liquidity ratio such as the current ratio
for two reasons. Firstly, as the current assets of municipalities in Greece usually include
moving creditor balances, we considered that the traditional current ratio would not be
3 There are two main restrictions on local government borrowing. First, for every loan, approval is required from
the municipal council and for loans above 3 million euros a council majority of two-thirds must provide this
approval, which is rather difficult by taking into account the polyphony in Greece’s political context. Second,
each loan requires a report on the repayment capacity of the municipality, which must be approved by the
regional administration on behalf of the Minister of the Interior.

12
useful for performance assessment. Secondly, the value of the current ratio could not be
interpreted in a continuum scale. This is because either very low or very high values of the
current ratio are both indicative of financial operating problems.
Operating expenses / Own revenues (OE/R): Municipalities cannot finance their
expenses relaying only on own revenues. They have to complement their financial input
from government subsidies. The higher the value of the OE/R ratio the more reliant is a
municipality on subsidies in order to have a sound financial condition. Therefore the
reliance of a municipality on an external source increases the financial risk it faces as it is
depended on an exogenous parameter (i.e. governmental subsidies) that is non directly
controllable.
Subsidies / Population (S/P): The use of per citizen ratios are very common in local
government ratio analysis literature (Berne, 1992; ICMA, 2003). This ratio reflects the per
citizen subsidy acquired by a municipality. The value of this ratio is indicative of a
municipality’s reliance on central government subsidies. Local governments may
experience fiscal problems in part because central governments (or states) are cutting aids
(Kloha et al., 2005). Moreover, compared to the next ratio (own revenues per citizen) it
reveals the structure of municipality’s revenues. As this ratio corresponds to a monetary
value it can be easily used for cross-municipality comparisons. In principal, in Greece
municipalities facing a disadvantageous external environment (e.g., are rural, poor in
terms of regional GDP, etc.) are characterized by a higher S/P ratio. More specifically, the
general purpose grants that are given to municipalities from the central government are
distributed on the basis of objective criteria defined in law, which include population,
accessibility by road, level of tax autonomy, economic growth and unemployment levels,
and climatic conditions. These criteria are usually modified on a yearly basis, but only to a
limited extent.
Own revenues / Population (R/P): This ratio reflects the average per citizen revenue of
the municipality. It is indicative of its financial autonomy and easiness to overcome
financing problems when central government faces difficulties in providing subsidies. The
value of this ratio is influenced by the sociopolitical and economic environment of the
area. For example, municipalities that host (within their geographical boundaries) tourist
areas can generate more revenues compared to remote and of low business activity areas.
It is worth mentioning that the selected set of ratios does not include indicators that are
directly associated to profitability. Typical examples of such indicators used for corporate
entities include ratios such as earnings before interest and taxes to total assets, net income to
13
revenues, net income to equity, etc. However, the use of such ratios in the context of
evaluating the financial performance of Greek local governments was proved to be
misleading. This is because the financial results (operating or net surplus/deficit) of Greek
municipalities are heavily influenced by the subsidies received from the central government.
As a result, traditional profitability indicators provide a misleading picture of the
municipalities’ ability to achieve an acceptable level of profitability. Furthermore, if local
government subsidies are excluded from the definition of net or operational income
(surplus/deficit), then the resulting profitability measures almost coincide with measures
related to the expenses burden (e.g., the operating expenses to own revenues ratio). Thus, it is
evident that in the context of Greek municipalities the analysis of operating expenses is much
more informative than the one based on profitability ratios. In this vein, we decided to focus
our analysis on the evaluation of operating expenses, whose control and reduction is crucial
for the financial viability of municipalities in Greece.
Some descriptive statistics (means and standard deviations in parentheses) for the
selected ratios for 2007 and 2009 are presented in Table 1. The statistics are presented for the
samples of 2007 and 2009, as well as for the sub-sample of municipalities for which there are
available data in both years. Focusing on the results for the municipalities that are common in
2007 and 2009 (for which the results are directly comparable), it is evident that total liabilities
to total assets (L/A) remained rather unchanged between the two years. Therefore no
significant changes are observed in the capital structure of the municipalities. However, the
relation between own revenues and liabilities (R/L) has worsen, albeit, not considerably (p-
values 0.464 according to the Wilcoxon matched-pairs signed-rank test). There was an
increase in own revenues per citizen (R/P) between the two periods, indicating a raise in
prices or an increase in quantity of services rendered or a combination of both (population
remains the same). The increase of the R/P ratio from 2007 to 2009 is found significant at the
1% level according to the Wilcoxon matched-pairs signed-rank test. The same also holds true
for the subsidies per citizen ratio (S/P). However, costs had increased with a more intensive
mode compared to own revenues as indicated in the OE/R ratio (the difference between the
two years is again found significant at the 1% level according to the Wilcoxon matched-pairs
signed-rank test). This increase in costs was not witnessed in the bottom line of the financial
statements of the municipalities as the per citizen subsidy exhibited an unexpected significant
upward change (the average ROA (return on assets) increased from -0.2% in 2007 to 0.96% in
2009, with the difference being significant at the 1% level according to the Wilcoxon
matched-pairs signed-rank test).
14
Table 1: Descriptive statistics for the financial ratios (means and standard deviations in
parentheses)
Full samples Sub-sample common in
both years
Ratios 2007 2009 2007 2009
L/A 0.135 0.163 0.168 0.164
(0.137) (0.168) (0.161) (0.174)
R/L 2.069 1.389 1.570 1.382
(5.838) (1.518) (2.175) (1.648)
STL/R 0.733 0.692 0.690 0.697
(0.623) (0.426) (0.458) (0.418)
OE/R 2.987 2.867 2.553 2.898
(1.498) (1.422) (1.058) (1.470)
S/P 204.949 275.017 188.275 267.962
(55.093) (100.126) (51.205) (69.108)
R/P 214.134 245.222 224.534 239.641
(188.235) (173.772) (217.664) (160.896)
5.2. Results of simulation analysis
The simulation process described in section 4.3 was implemented with 10,000 scenarios, each
corresponding to a different (randomly generated) additive evaluation model.
Figure 2 presents some summary results from the analysis for the 2007 reference data.
In particular, Figure 2(a) presents the distribution of the mean scores of the municipalities.
The mean scores are obtained by averaging the global values (scores) from model (1) over all
10,000 simulation runs. The distribution is slightly skewed toward lower scores (worst
performance) with a skewness of 0.025. A similar result was also observed for the distribution
of the median scores, with a slightly higher skewness of 0.041.
Figure 2(b) illustrates the relationship between the mean scores of the municipalities
and the stability of their rankings. In each simulation run, the municipalities are ranked (in
descending order) from the best to the worst performing ones according to their global values.
The stability of these rankings under different evaluation models is an issue worth the
consideration. In Figure 2(b) the variability of the ranks for each municipality (i.e., the range
between its best and worst rank over all simulation runs) is plotted against the municipality’s
mean score. As expected, the best and worst performing municipalities (in terms of their mean
scores) exhibit a lower variability in their ranking. On the other hand, the variability is highest

15
for municipalities with an average score. Municipalities whose performance ranking relative
to the others is very unstable, have very diverse characteristics (combining strong and weak
points), which increase the level οf uncertainty with respect to their overall performance.
Mean score
Fre
qu
ency
0 0.2 0.4 0.6 0.8 10
10
20
30
40
50
60
Var
iabil
ity (
range)
of
ranks
Mean score
0 0.2 0.4 0.6 0.8 10
100
200
300
400
(a) (b)
Figure 2: Distribution of the municipalities’ mean scores and the stability of their ranking
(2007 data)
5.3. Rating of the municipalities
As mentioned in section 4.4, in order to build an operational evaluation model for assessing
and monitoring the performance the municipalities, an “aggregate” rating is constructed on
the basis of the simulation/scenario analysis results. In order to construct this rating, the
municipalities are first rated (classified) on the basis of their evaluation in each simulation run
(model scenario). The rating is defined in relative terms, given the difficulty of defining
specific norms for each financial ratio that would lead to a rating of the municipalities in
absolute terms. In particular, let 1( )tV x , 2( )tV x , etc., denote the overall performance of the
municipalities according to the additive model under scenario t and let tP denote the
corresponding % percentile of the municipalities’ global scores. Then, the group of top
performing municipalities is defined to include the top 10% (i.e., every municipality i with
90( ) t
t iV Px ). The next group of good performers includes municipalities whose overall score
falls in the range 67 90,[ )t tP P . Similarly, the intermediate group consists of municipalities with
scores in the range 33 67,[ )t tP P , the group of poor municipalities includes cases in the range
10 33,[ )t tP P , whereas the bottom 10% of the municipalities are classified in the very poor

16
performance group. The cut-off points used to define these five grades introduce a
symmetrical Gaussian-type distribution of the municipalities in the rating scale, which is in
good accordance with the distribution observed for the mean scores of the municipalities (cf.
Figure 2b) and it is often considered as a desirable property of financial rating systems. On the
basis of this rating process, a global (aggregate) rating is introduced on the basis of the class
membership probabilities of the municipalities. In particular, for each municipality i and
rating class k, the group membership probability ik is defined as the percentage of
simulation scenarios under which municipality i is classified in rating class k. Each
municipality i is then classified in the rating class for which the corresponding membership
probability is highest.
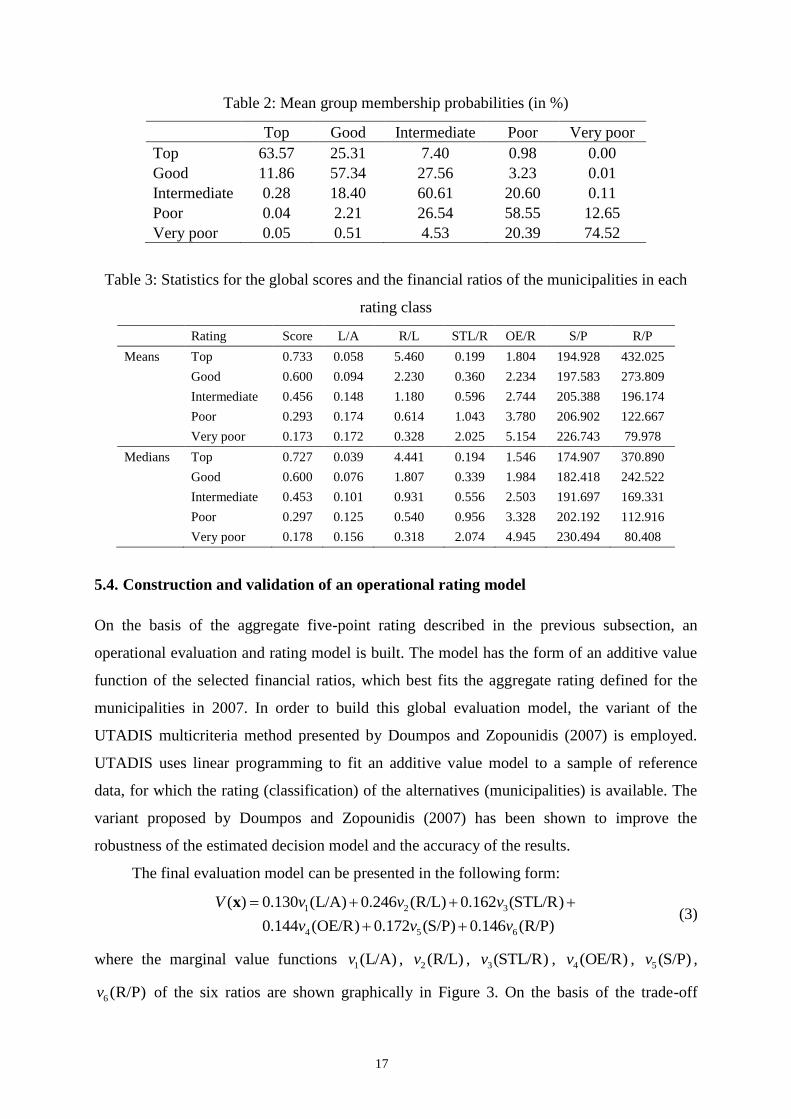
Table 2 presents some results on the class membership probabilities averaged over all
municipalities in each aggregate rating group. The results indicate that the top and very poor
performing classes are well distinguished from the three other groups. For instance, on
average, top performing municipalities (in terms of their aggregate rating) were classified in
the top group in 63.57% of all simulations scenarios. In about 25.3% of the simulation runs,
top performing municipalities (in terms of their aggregate rating) were classified in the group
of good performers. On the other hand, top performing cases were classified in the poor or
very poor classes in only about 1% of the scenarios (on average). Similarly the “confidence”
on the classification of municipalities in the “very poor” rating group is also high (average
membership probability 74.52%). Overall, the aggregate rating seems to be robust, in the
sense that two or more notch differences (compared to the ratings defined under the
simulation runs), are infrequent.
Some further statistics on the obtained aggregate rating in relation to the global scores
and financial ratios of the municipalities are given in Table 3 for the 2007 data. The results
show that there is a clear differentiation between the groups, both in terms of the mean score
and the financial ratios for the municipalities in each group. Furthermore, there is (almost
consistently) a strong monotonic relationship between the ratings and the financial ratios.
17
Table 2: Mean group membership probabilities (in %)
Top Good Intermediate Poor Very poor
Top 63.57 25.31 7.40 0.98 0.00
Good 11.86 57.34 27.56 3.23 0.01
Intermediate 0.28 18.40 60.61 20.60 0.11
Poor 0.04 2.21 26.54 58.55 12.65
Very poor 0.05 0.51 4.53 20.39 74.52
Table 3: Statistics for the global scores and the financial ratios of the municipalities in each
rating class
Rating Score L/A R/L STL/R OE/R S/P R/P
Means Top 0.733 0.058 5.460 0.199 1.804 194.928 432.025
Good 0.600 0.094 2.230 0.360 2.234 197.583 273.809
Intermediate 0.456 0.148 1.180 0.596 2.744 205.388 196.174
Poor 0.293 0.174 0.614 1.043 3.780 206.902 122.667
Very poor 0.173 0.172 0.328 2.025 5.154 226.743 79.978
Medians Top 0.727 0.039 4.441 0.194 1.546 174.907 370.890
Good 0.600 0.076 1.807 0.339 1.984 182.418 242.522
Intermediate 0.453 0.101 0.931 0.556 2.503 191.697 169.331
Poor 0.297 0.125 0.540 0.956 3.328 202.192 112.916
Very poor 0.178 0.156 0.318 2.074 4.945 230.494 80.408
5.4. Construction and validation of an operational rating model
On the basis of the aggregate five-point rating described in the previous subsection, an
operational evaluation and rating model is built. The model has the form of an additive value
function of the selected financial ratios, which best fits the aggregate rating defined for the
municipalities in 2007. In order to build this global evaluation model, the variant of the
UTADIS multicriteria method presented by Doumpos and Zopounidis (2007) is employed.
UTADIS uses linear programming to fit an additive value model to a sample of reference
data, for which the rating (classification) of the alternatives (municipalities) is available. The
variant proposed by Doumpos and Zopounidis (2007) has been shown to improve the
robustness of the estimated decision model and the accuracy of the results.
The final evaluation model can be presented in the following form:
1 2 3
4 5 6
( ) 0.130 (L/A) 0.246 (R/L) 0.162 (STL/R)
0.144 (OE/R) 0.172 (S/P) 0.146 (R/P)
V v v v
v v v
x (3)
where the marginal value functions 1(L/A)v , 2(R/L)v , 3(STL/R)v , 4(OE/R)v , 5(S/P)v ,
6 (R/P)v of the six ratios are shown graphically in Figure 3. On the basis of the trade-off

18
constants of the six ratios in the model, it is evident that the own revenues to total liabilities
ratio is an important factor for the evaluation and rating of the municipalities, followed by the
subsidies/population and short term liabilities/own revenues ratios.
0 0.2 0.4 0.6 0.8 10
0.2
0.4
0.6
0.8
1
0 2 4 6 8 100
0.2
0.4
0.6
0.8
1
0 1 2 3 40
0.2
0.4
0.6
0.8
1
0 2 4 6 8 10 120
0.2
0.4
0.6
0.8
1
0 100 200 300 400 500 6000
0.2
0.4
0.6
0.8
1
0 200 400 600 800 10000
0.2
0.4
0.6
0.8
1
Liabilities / Assets Own revenues / Liabilities
Short term liabilities / Own revenues Operating expenses / Own revenues
Subsidies / Citizens Own revenues / Citizens
Figure 3: Marginal value functions of the aggregate rating model
The constructed model fits the rating of the municipalities in 2007 very well, with the
overall accuracy rate being equal to 96.43%. Furthermore, the differences between the rating
estimated through the aggregate model and the predefined rating never exceed one notch.
In order to perform of kind of validation of the constructed model, the 2009 data are
used. The 2009 data refer to 130 municipalities, including 100 cases for which data is also
available in 2007. By the end of 2009 the recent crisis began to be evident in Greece with the

19
country’s economic condition starting to deteriorate. As mentioned in section 5.1 this
situation has affected the financial characteristics of the municipalities, whose operating
expenses increased considerably together with their reliance on obtaining financing from the
central government (subsidies).
Within this context, one should expect that the evaluations obtained from the
constructed model would be in accordance with the deteriorating condition in the
characteristics of the Greek municipalities. Indeed, this is true. According to the aggregate
model, the average global score of the municipalities in 2007 is 0.443 vs. 0.409 in 2009. This
is reduction of 7.6%, which is significant at the 5% level (according to both a parametric t-test
and the nonparametric Mann-Whitney test). The comparison is clearer when focusing on the
municipalities for which data are available in both years. The average global score of these
municipalities in 2007 is 0.455 vs. 0.404 in 2009; a reduction of 11.4%, which is statistically
significant at the 1% level (verified with the paired samples t-test and the Wilcoxon signed
ranks test).
Figure 4 presents a comparison of the distribution of the ratings obtained through the
evaluation model in 2007 and 2009. Figure 4(a) involves all municipalities, whereas Figure
4(b) focuses only on the 100 municipalities for which data are available in both years. The
results indicate a clear increase in the number of municipalities classified in the very poor and
poor groups. On the other hand, the number of municipalities classified as good or top
performers decreases considerably in 2009. Once again the deterioration in the rating of the
municipalities is more clearly evident in the direct comparison involving the cases for which
data are available in both years.
0.0
0.1
0.2
0.3
0.4
TopGoodInterm.PoorVery poor
2009
2007
0.0
0.1
0.2
0.3
0.4
0.5
TopGoodInterm.PoorVery poor
2009
2007
(a) All municipalities (b) Municipalities common in 2007 & 2009
Figure 4: Distribution of ratings

20
Table 4 presents the migration matrix for the ratings of the municipalities for which data
are available in both 2007 and 2009. The mobility of the ratings towards worst groups is
clearly evident. For instance, about 50% of the top performing municipalities in 2007 were
downgraded to the group of good performers in 2009. On the other hand, there is no
municipality rated as “very poor” in 2007 which was upgraded in 2009. Overall, out of the
100 municipalities common in both years, only 4 managed to improve their rating in 2009 as
opposed to 2007 (by one notch at most), 45 retained the same rating, and 51 were downgraded
(47 cases with an one-notch downgrade and 4 cases with a two-notch downgrade).
Table 4: Ratings migration matrix (municipalities common in 2007 and 2009)
2009 rating
Top Good Intermediate Poor Very poor
2007 r
atin
g Top 41.7 50.0 8.3 0.0 0.0
Good 4.3 34.8 52.2 8.7 0.0
Intermediate 0.0 2.5 45.0 50.0 2.5
Poor 0.0 0.0 9.5 47.6 42.9
Very poor 0.0 0.0 0.0 0.0 100.0
As already mentioned an important aspect of the financial distress surveys in the public
sector is that there is not an unanimously proxy used in order to distinguish local governments
that experience financial problems from the healthy ones. In our case we use a benchmark that
streams for the memorandum signed between Greece, IMF and EC (Law 3845/2010) as a
proxy of financial distress. According to a relevant decision, municipalities can only contract
new loans if the ratio of total liabilities to total revenues (L/TR) is less than 60%. Therefore,
we could infer that municipalities could be classified as “solvent” if their L/TR ratio is less
than 60% and “insolvent” otherwise. Therefore, as a further test for validating the model we
tested the global scores obtained through the model, with the dichotomous classification
based on the above threshold.
Table 5 presents the results on the relationship between the ratings of the municipalities
and their classification according to their L/TR ratio. The presented figures are the
frequencies of insolvent municipalities (i.e., L/TR>60%) in each rating class. Three
comparisons are performed. In particular, the first two columns of Table 5 involve the
comparison between the ratings of all municipalities in each year with their corresponding
L/TR classification. The third column of Table 5 is a kind of predictive test, where the rating
of the municipalities in 2007 is compared to their L/TR classification in 2009 (this

21
comparison applies only to municipalities common in both years). Furthermore, Table 5 also
reports the area under the receiver operating characteristic curve (AUROC; Fawcett, 2006)
which is a popular non-parametric test of the discriminating power of rating systems. In this
case, AUROC is used to measure the association of the municipalities’ scores estimated
through the evaluation model with their L/TR classification.
Table 5: Frequencies (in %) of insolvent municipalities (L/TR>60%) in each rating class
2007 rating, 2007 L/TR
(all municipalities)
2009 rating, 2009 L/TR
(all municipalities) 2007 rating - 2009 L/TR
Top 0.0 0.0 0.0
Good 22.0 0.0 26.1
Intermediate 36.2 33.3 25.0
Poor 61.9 38.5 57.1
Very poor 75.0 64.7 75.0
AUROC (%) 75.9 75.8 72.4
The results of Table 5 indicate that there is a strong relationship between the results of
the developed rating model with the classification of the municipalities according to their
L/TR ratio. For instance, there is no a top performing municipality with an L/TR ratio higher
than 60%. On the other hand, a significant majority (65-75%) of municipalities rated as “very
poor” has an L/TR ratio higher than 60%. The “predictive” test (third column of Table 5)
further indicates that the rating of the municipalities in 2007 is strongly associated with their
L/TR classification in 2009, thus indicating the validity and robustness of the results over
time. These findings are also supported by the AUROC test, which is significant (in all cases)
at the 1% level.
6. CONCLUSIONS
The global financial crisis had considerable effects on both governments and public sector
organizations. The new financial environment not only calls for the intense application of the
3Es (Efficiency, Effectiveness and Economy), but it has also affected the viability and the
financial health of the public sector, including local governments. In this new era,
benchmarking the financial performance and viability of local governments is of major
importance for policy makers, oversight bodies, politicians and citizens. It is also useful for
the elected officials that are responsible for the every-day operation of local governments.

22
In this paper we have developed a financial rating model for local governments
according to a set of financial ratios customised to the local government context. In this way
we distinguish those municipalities with strong financial performance from those
experiencing financial problems. The model was developed on the grounds of a multicriteria
decision making methodology. The model was built on financial information retrieved for a
large sample of Greek local governments for 2007 and has been successfully tested for
validity and robustness through various tests.
Our model has several practical implications. The model has been developed by using
information retrieved by accrual financial statements. This type of information is publicly
available and periodically reported. As there is a worldwide trend in accrual accounting
adoption in local governments, we believe that our model has potential applications that go
beyond the boundaries of Greece. The use of accrual accounting information albeit being a
standard in the private sector, is rather rarely encountered in the public sector financial
distress modelling. This is because public sector customarily used and was mainly assessed on
the basis of either cash (budgetary) accounting data or fund accounting information.
Secondly, the model is easy to apply and can be used for benchmarking purposes, offering
early distress signals to multiple stakeholders that could be used for informing decision-
making.
Of course our analysis is subject to some limitations. Firstly, the analysis is based on
financial statements and therefore the quality of financial information affects the accuracy of
the results. Nevertheless, accounting information has been retrieved by audited financial
statements, which mitigates the risk of poor information quality. Secondly, we did not try to
give an explicit definition of the terms “financial stress” or “financial crisis” which is an issue
encountered in relevant literature (Holande, 2003). The severity of financial problems that
local governments experience may take different forms depending on the context (e.g.,
environmental, social or economical) in which they take place. However, the comparative
classification that we have developed is useful for performance benchmarking. Finally, our
model does not take into account conditions that are exogenous to municipalities such as their
wealth that could be proxied by regional GDPs or the type of economic activity (e.g., tourist
activity). Empirical research has shown that such parameters influence the values of financial
ratios per se (Cohen, 2008; Zafra-Gómez et al., 2009b).
As a concluding remark it should be noted that the relations that exist between local
governments and the central governments, at least in Greece, are highly influenced by strong
political bonds (Hlepas, 2010). In the same vein, IMF (2006, p.14) mentions there are cases of

23
politically pressured bail-outs in cases of financial mismanagement in local governments.
Therefore political decisions may assist municipalities to overcome financial problems when
such problems emerge. This might be the case if the central government had not being
experiencing severe financial problems itself. Therefore in the current global financial
situation, in which central governments such Greece strive for financial resources, an
objective and easy to apply performance assessment system is not only useful but also
necessary for public financial goals achievement.
ACKNOWLEDGMENT: We are grateful to Hellenic Agency for Local Development and Local
Government (EETAA) for the financial statements provision. This research was funded by the
Research Centre of the Athens University of Economics and Business.
REFERENCES
Altman, E.I. (2001), Bankruptcy, Credit Risk and High Yield Junk Bonds, Blackwell, Oxford,
2001.
Anthony, R. and D. Young, (2003), Management Control in Nonprofit Organizations, 7th
ed.,
McGraw-Hill Irwin.
Arbel, A. and Vargas, L.G. (1993), “Preference simulation and preference programming:
Robustness issues in priority derivation”, European Journal of Operational Research,
69(2), 200–209.
Berne, R. (1992), Research Report: The Relationships Between Financial Reporting and the
Measurement of Financial Condition, GASB (Norwalk).
Butler, J., Morrice, D.J., and Mullarkey, P.W. (2001), “A multiple attribute utility theory
approach to ranking and selection”, Management Science, 47(6), 800–816.
Butter, J., Jia, J., and Dyer, J.S. (1997), “Simulation techniques for the sensitivity analysis of
multi-criteria decision models”, European Journal of Operational Research, 103(3),
531–546.
Carmeli, A. (2003), “Introduction: Fiscal and Financial Crises of Local Governments”,
International Journal of Public Administration, 26 (13), pp. 1423-1430.
Clark, T.N. (1977), “Fiscal management of American cities: Funds flow indicators”, Journal
of Accounting, Research, 15, 54–94.
Cohen, S. (2008), “Identifying the moderator factors of financial performance in Greek
municipalities”, Financial Accountability and Management, 24(3), 265–293.

24
Decision 17838/2010, “Determination of the format, the content, the time and the way of
updating the database called “Local Government Financial Data”, the financial ratios for
performance measurement and any other necessary detail’, Ministry of Interior, 29-12-
2010 (in Greek).
Doumpos, M. and Zopounidis, C. (2002), Multicriteria Decision Aid Classification Methods,
Kluwer Academic Publishers, Dordrecht.
Doumpos, M. and Zopounidis, C. (2007), “Regularized estimation for preference
disaggregation in multiple criteria decision making”, Computational Optimization and
Applications, 38(1), 61–80.
Doumpos, M. and Zopounidis, C. (2010), “A multicriteria decision support system for bank
rating”, Decision Support Systems, 50(1), 55–63.
Fawcett, T. (2006), “An introduction to ROC analysis”, Pattern Recognition Letters, 27(8),
861–874.
Finkler, S. (2005), Financial Management for Public Health and Not-for-profit
Organizations, 2nd
ed., Prentice Hall, New Jersey.
Greco, S., Mousseau, V., and Slowinski, R. (2010), “Multiple criteria sorting with a set of
additive value functions”, European Journal of Operational Research, 207(3), 1455–
1470.
Hlepas, N. (2010), “Incomplete Greek territorial consolidation: From the first (1998) to the second
(2008–09) wave of reforms”, Local Government Studies, 36(2), 223–249.
Honadle, B.W. (2003), “The states’ role in U.S. local government fiscal crises: A theoretical
model and results of a national survey”, International Journal of Public Administration,
26(13), 1431–1472.
International City/Country Management Association (2003), Evaluating Financial Condition:
A Handbook for Local Government, ICMA (Washington).
Jacquet-Lagrèze, E. and Siskos, Y. (1982), “Assessing a set of additive utility functions for
multicriteria decision making: The UTA method”, European Journal of Operational
Research, 10(2), 151–164.
Jones, S. and Walker, R. (2007), “Explanators of local government distress”, Abacus, 43(3),
396–418.
Keeney, R. and Raiffa, H. (1993), Decisions with Multiple Objectives: Preferences and Value
Trade-offs, Cambridge University Press, Cambridge.

25
Kleine, R., Kloha, P. and Weissert, C.S. (2003), “Monitoring local government fiscal health”,
Government Finance Review, 19(3), 18–23.
Kloha, P., Weissert, C.S. and Kleine, R. (2005), “Developing and testing a composite model
to predict local fiscal distress”, Public Administration Review, 65(3), 313–323.
Lahdelma, R. and Salminen, P. (2001), “SMAA-2: Stochastic multicriteria acceptability
analysis for group decision making”, Operations Research, 49(3), 444–454.
Lahdelma, R., Hokkanen, J., and Salminen, P. (1998), “SMAA-stochastic multiobjective
acceptability analysis”, European Journal of Operational Research, 106(1), 137–143.
Law 3463/2006, “Municipal and communal code”, National Gazette 114/8-7-2006 (in Greek)
Law 3845/2010, “On the policy measures relating to the conditionality criteria of the euro
area/IMF financing package”, National Gazette 65Α/ 6-5-2010 (in Greek).
Murray, D. and Dollery, B. (2005), “Local council performance monitoring in New South
Wales: Are ‘at risk’ councils really at risk?”, Economic Papers, 24(4), 332–345.
Neofytou, E. and Mar Molinero, C. (2004), “Predicting corporate failure in the UK: A
multidimensional scaling approach”, Journal of Business Finance and Accounting,
31(5–6) , 677–710.
Pina V., Torres, L., and Yetano, A. (2009), “Accrual accounting in EU local governments:
One method, several approaches”, European Accounting Review, 18(4), 765–807.
Tervonen, T. and Figueira, J. (2008), “A survey on stochastic multicriteria acceptability
analysis methods”, Journal of Multi-Criteria Decision Analysis, 15(1–2), 1–14.
Zafra-Gómez, J.L., López-Hernández, A.M., and Hernández-Bastida, A. (2009a),
“Developing an alert system for local governments in financial crisis”, Public Money &
Management, 29(3), 175–181
Zafra-Gómez, J.L., López-Hernández, A.M., and Hernández-Bastida, A. (2009b),
“Developing a Model to Measure Financial Condition in Local Government”, The
American Review of Public Administration, 39 (4), 425-449.
Zeleny, M. (1982), Multiple Criteria Decision Making, McGraw Hill, New York.