Embed Size (px)
Citation preview

Research Inventy: International Journal Of Engineering And Science
Issn: 2278-4721, Vol. 2Issue 5 (February 2013), Pp 13-26 Www.Researchinventy.Com
13
Assessing Efficiency of ITIL Framework to Align Business And IT
1,Narges Zeinolabedin,
2,Maryam Khademi,
3,Neda Rahbar
1Department of ITM, Islamic Azad University, Electronic Branch, Tehran, Iran 2,Department of Applied Mathematics, Islamic Azad University, South Tehran Branch, Tehran, Iran
3,Department of Computer, Islamic Azad University, Broujerd Branch , Broujerd, Iran
Abstract: Ensuring that IT and business have a more mature alignment relationship is recognized as being
critical to an organization’s success. To achieve alignment leveraging, Information Technology Infra-structure
Library (ITIL) is considered fundamental as a comprehensive approach to planning and managing IT actions
within the organization, based on its business requirements.
This survey reports on a study to assess the effect of successful ITIL Framework on the Business-IT alignment in
an Iranian organization (municipality IT organization Of Tehran, Iran), using the Luftman’s maturity model as
the assessment tool.
Keywords: Business-IT Alignment (BITA); IT Governance; Information Technology Infrastructure Library
(ITIL); Luftman’s maturity model.
I. Introduction
The first decade of the 21st century has seen Information Technology (IT) make great strides, quickly
evolve and grow so conspicuously, from a time when it was providing mere back office support, until now
where it plays a strategic role in organizations. IT now supports several business strategies and also has the
ability to introduce new strategies within organizations. Therefore, IT executives who are trying to shape
business strategies within their own organizations see the pressing need to improve their own abilities to tap
innovation [1].Business-IT alignment (BITA) is one of the vital topics of IT management sciences and is often ranked first in the surveys of senior managers’ top ten concerns [2]. Alignment is a complex concept involving
several different approaches to understanding and achieving it [1] [3] [4] [5] [6] [7]. These approaches can be
classified under three main categories:
alignment via ―governance‖ [8] .
alignment via ―architecture‖ [8].
alignment via ―relationship‖ [8] [6] [9].
Regardless of the reasons and rationalization of an ITIL Framework, these projects are expected to positively
affect BITA improvements. Therefore, finding a solution to this problem, related to the type of method required
to quantitatively measure the effect of the IT executive plans on achieving business strategies and goals, was the
force that motivated this present study. The purpose of this study is to increase knowledge about the BITA
factors influenced by an ITIL Framework. The two main questions addressed in this study are:
1. Does an ITIL Framework impact BITA improvement?
2. What is the scope of this effect?
This research focuses on the use of Luftman’s alignment maturity assessment model [10] to examine the BITA
maturity in An Iranian organization, whose the ITIL Framework have been completed after 2011. This research
was conducted via a closed questionnaire, which had been designed according to the metrics of the Luftman’s
assessment model, to one organization that had completed the ITIL Framework. Ultimately, 33 questionnaires
were received back and analyzed. The results of this study show a dramatic improvement in BITA on
completion of an ITIL project.
This paper begins with a literature review on BITA, ITIL, BITA maturity models, as well as the Luftman’s
model as the main research tool. After establishing the theoretical foundation, an explanation of the research design is given, followed by data collection and analysis. Finally, a summary of the findings is presented , as a
conclusion to the paper.

Assessing Efficiency Of Itil Framework To Align Business…
14
II. Literature Review To develop a theoretical framework for testing the ITIL effects on BITA, multiple streams of related
literature were examined. This consisted of studying previous and recent research literature to identify the nature
of research that has been done thus far and what is yet to be studied, in the future.
2.1 Business-IT alignment
Business-IT alignment is the highly desired state in which an organization can effectively use IT to
achieve its business objectives. This term particularly encompasses the efforts of the IT and business
professionals to bridge the gap prevalent among the stakeholders of the organization, owing to differences in objectives, culture and incentives,including a reciprocal unawareness of one another.Aligning business with IT
is a fast growing concept that was initially introduced in the 1970s; however, senior managers were not able to
actually apply alignment in their organizations until the 1990s, when a systematic model was presented by
Henderson and Venkatraman (1993). Studies show that organizations with IT-enabled growth are not only
positively affected by economic impacts (e.g. increasing sales and decreasing expenditures) [11], they can also
achieve a better strategic match, a more efficient IT architecture and more core competencies, as well as better
decision-making and faster competitive reactions.
Several definitions have been proposed on BITA by scholars, of which the more important are listed below:
Applying IT in an appropriate and timely manner, in accordance with existing business strategies, goals and
needs [10].
Matching business requirements with relevant IT services [7].
The degree to which the IT applications, infrastructure and organization enable and support the business
strategy and processes, including the processes to realize this [6].
Aligning the information systems (IS) capabilities with the business goals [8].
Looking beyond immediate business needs, considering technology trends and competitive landscape to play a
proactive role in shaping business strategy by applying IT [1].As seen from the above, most of the definitions
focus on a unilateral alignment; however, some definitions consider a bilateral relationship between business
and IT. Due to this wide spectrum of definitions, several methods and frameworks have been developed to align
business with IT.As shown in Table 1, the features characteristic of the different BITA models reveal that this
concept can be realized at three levels [11].After carefully reviewing the literature, this study clearly approves
the classification given below. Alignment of IT/IS with business goals and strategies is the first level of BITA [9] [12]. The second level shows aligning IT/ IS features with the requirements of the external environment of
the organization [13]. Finally, the third level of BITA is related to the organization’s future changes
[8].Achieving BITA is noteworthy and considered to be an evolutionary and dynamic process, requiring strong
support from senior management, mature relationships, powerful leadership, appropriate prioritization, trust, and
effective communication, as well as a reciprocal understanding of the business and IT units [10].
2.2 ITIL
One possible way to achieve alignment is for IT organizations to transform themselves into service providers [12]. Being a service provider means using IT as a solution to business problems and running the IT
department as a business function. It also means providing a new competitive strategy. This is because the focus
of the companies moves toward customers and providing high quality products and services at low cost to satisfy
their demands [13]. In order to be an effective service provider organizations are required to have high quality
ITSM[12]. ITSM is ―concerned with delivering and supporting IT services that are appropriate to the business
requirements of the organization [14]. ITSM uses the best practice ITIL approach to improve delivery and
support of IT services. ITIL will enable organizations to improve their IT service management [12].Information
Technology Infrastructure Library (ITIL) has introduced with Office of Government Commerce (OGC). It has
three versions: ITIL Version 1, ITIL Version 2 and recently ITIL Version 3. After ten years use of ITIL V2, ITIL
V3 was introduced in 2007 by OGC. The context of this publication of the ITIL is the ITIL framework as a
source of good practice in service management. [15] For better understanding of ITIL, here some difference of ITIL V2 and V3 will discussed. ―ITIL Version 2 deals primarily with aligning IT to the business. but ITIL V3
will enable organizations to move from alignment of IT with the business to the integration of IT with the
business‖. [16]The ITIL Version 3 Library has the following components [5]:
• The ITIL Core: There are five volumes as best practice guidance applicable which covers all types of
organizations who provide services to a business. The structure of the core is in the form of a lifecycle (Figure
1). It is iterative and multidimensional.

Assessing Efficiency Of Itil Framework To Align Business…
15
• The ITIL Complementary Guidance: A complementary set of publications which are useful guides for
industry sectors, organization types, operating models, and technology architectures.
The ITIL Core consists of five publications:
Service Strategy
Service Design
Service Transition
Service Operation
Continual Service Improvement
Fig. 1 Itil Framework
Table 1 The comparison of BITA models
Scholar Model Characteristics Alignment
level
Henderson and Venkatraman
(1993)
SAM Focusing on internal and external areas for both business and IT
Defining four domains: business strategy, IT strategy, organizational infrastructure and processes, IS infrastructure and processes
Defining vertical (strategic fitness) and horizontal (functional integration) relationships between four domains
Explaining four main alignment perspectives
Current business
Clarke (1994) Clarke Based on Scott Morton’s five forces influencing the organization’s
objectives (Scott Morton 1991)
Including five factors: structure, management processes, individuals and
roles, technology and strategy regard to the management process
Considering internal and external technological and socio-economic
environments
Explaining an indirect relationship between IT and business strategy
External needs
Yetton et al. (1994) Fujitsu Based on Scott Morton’s five forces influencing the organization’s
objectives (Scott Morton 1991)
Having a technology focused perspective
Focusing on IT as a driver to change
External needs
Wegmann (2002) SEAM Focusing on the resources of enterprise and its environment, and the
processes
Considering four organizational levels: business, company, operation and technology
Proposing an iterative alignment process
Using three kinds of development activities: multi-level modeling,
design and deployment
External needs
van Eck et al.
(2004)
GRAAL Consisting of four dimensions: life-cycle, aspects (internal and external),
service layers and refinement
Considering four phases in the life-cycle: plan, design, realize and
deploy
Focusing on business services, application services, platform services
and network services
Cross checking with SAM (Henderson and Venkatraman 1993)
Future
business

Assessing Efficiency Of Itil Framework To Align Business…
16
Weiss and Anderson (2004)
4 C Considering the value of IT in three levels: operational resource,
strategic resource and strategic weapon
Explaining four common themes of alignment under business/IT
governance: clear direction, commitment, communication and cross-functional integration
Current business
H. M. Chen et al. (2005)
BITAM 12 steps method
Focusing on architectural adaption, misalignment detection, and
misalignment prevention
Including three layers: business model, business architecture and IT
architecture
Future business
Derzsi and Gordijn (2005)
- Using the value network (Allee 2008; Hakanson and Johanson 1992)
approach
Based on the concepts of service ontology
Using e3 value model (Gordijn and Akkermans 2001, 2003)
Current business
Bleistein et al. (2006)
B-SCP Based on engineering requirements approach
Validating IS requirements regarding alignment with strategy, context
and processes
Using goal models, Jackson problem diagrams and role activity
diagrams (RAD)
Current business
Versteeg and Bouwman (2006)
- Focusing on business architecture
Considering other three aspects of architecture: information, process and
application
Linking business strategy to business architecture
Linking business architecture to other aspects
Current business
Baïna et al. (2008) Goal Model
Based on SAM (Henderson and Venkatraman 1993)
Supporting Business Motivation Model (BMM) (TBRG 2007)
Current business
Carvalho and Sousa (2008)
BISMAM A holistic model
Including three components: nomenclature, classification and
Management
Focusing on misalignment detection, correction and prevention
Current business
Table 2 The comparison of the BITA maturity models
Scholar Model Characteristics Cited
Luftman(2000) Luftman • Qualitative approach • Multi-level assessment • Using Likert scale(1–5)
• Experienced in many organizations (Luftman 2000; Luftman and Kempaiah 2007)
516
Papp(2001) Papp • Qualitative approach • Based on SAM (Henderson and Venkatraman 1993) • Single-levelassessment • Using Likert scale (1–7)
62
Gutierrez et al. (2006) - •Qualitative approach • Based on Luftman’s model (Luftman 2000) • Multi-level assessment • Assessing strategic, tactical and operational alignment
11
Silva et al (2006) SBITA-TD • Quantitative approach
• Based on SAM (Henderson and Venkatraman 1993) • Multi-level assessment
10
Tapia (2007) VITALMM • Qualitative approach • Single-levelassessment • Focusing on workflow structure, ITgovernance, enterprise architecture,
IT/business processes, and coordination
18

Assessing Efficiency Of Itil Framework To Align Business…
17
Few scholars have focused their research on the relationship between ITIL and BITA. Kashanchi
(2006)presented Applying ITIL to the SAM model has determined that ITIL can impact on the four alignment
perspectives introduced by the model. It has been identified that ITIL has the ability to impact business strategy
and support it but not shape it. Also, it can impact and enhance IT strategy. In addition, ITIL can impact
organizational infrastructure significantly. To a minimal extent it also has an impact on business processes. So it
has the ability to improve alignment. Bagher Esmaili (2010) believed that ITIL plays two differencesroles in
business of organization. Generally IT services play a supportive role for business to meet the business strategies and goals and facilitate business maturity. Furthermore ITIL uses IT as an enabler and driver for
business to recognize new initiatives.As explained earlier, no research has been conducted until now, to assess
the effect of ITIL on achieving BITA in organizations and to discuss the domains of BITA most affected by
ITIL. This study aims at examining the effect of ITIL in organizations on different aspects of their BITA, as
well as to identify the limitations in developing ITIL frameworks that hinder organizations from achieving the
expected BITA level so as to be able to propose some improvement points.
2.3 BITA maturity
The BITA maturity assessment provides organizations with a vehicle to evaluate their activities, which
are performed to align business with IT [10]. Today, several maturity models are available to assess such an
alignment.The BITA maturity models not only generally—meaning, not specifically—address the necessary issues to achieveBITA [7], but also make it possible for an organization to identify its position and plan
improvement measures [10], by assessing the organization’s maturity level and strategies to increase this level
in the future.Some models measure the alignment to support its relevance, the impact of IT on business
performance, and its relationship with financial benefits or business IT values.Other models aid in the
understanding of the alignment events and assess it to improve the organization’s current position. The more
acceptable BITA maturity models, which are more frequently cited in the related researches, are presented by
Luftman (2000), Papp (2001), Gutierrez et al. (2006), Silva et al. (2006), Tapia (2007), and Tapia et al (2007). A
comparison of these models is given in Table 2.Citation of these models in other related studies was checked
and counted by Google Scholar (Google). As the Luftman’s model was found to be the most highly cited in the
literature when compared with other BITA maturity models, it has been selected as the most valid and basic
foundation of this study to evaluate the maturity level of BITA in the Iranian organization that have successfully
completed their ITIL project.
2.4 Luftman’s alignment maturity assessment model
Luftman’s model [10] is the result of his extended researches, which he began by redefining the SAM
model [17] followed by more detailed studies on the enablers and inhibitors of alignment [18], and it is
completely consistent with his previous works.Using the same background, he concluded that the harmony
prevalent among the 12 components of the SAM model is impacted by the six main components.The first
component of the model is titled ―communications.‖This criterion measures the effectiveness of the exchange of
ideas, knowledge, and information between ITand business organizations, enabling both to clearly understand
the organization’s strategies, plans, business and IT environments, risks, priorities, and how to achieve them
[10]. Many frameworks are applied to improve this measure [9] [17] [19] .―Competency/value measurements‖ is
the second component of the Luftman’s model. It employs analytics for assessing both IT and business organizations to demonstrate the contributions of information technology and the IT organization to the business
in terms that are acceptable to both the business and IT [10]. Some BITA frameworks have been developed to
cover this measure .The third component of the model is ―governance.‖ It defines who has the authority to make
IT decisions, as well as the types of processes IT and business managers employ at strategic, tactical, and
operational levels to set IT priorities for allocating IT resources [10]. IT governance is defined as ―specifying
the decision rights and accountability framework to encourage desirable behavior in the use of IT‖ [19] and
considers decisions, decision-makers, and decision-making processes related to IT. This term has recently been
modified to an approach to achieve BITA [8]. Moreover, some frameworks have been developed to establish it
within the organization [5].The fourth component of the Luftman’s model is ―partnership.‖ This criterion
evaluates the relationship between business and IT organizations, including the role of IT in defining business
strategies, the degree of trust existing between them, and how each perceives the other’s contribution [10]. This component is the key to motivate the development of some recent BITA frameworks .―Scope and architecture‖
is the fifth component of the model which measures IT’s provision of a flexible infrastructure, its evaluation and
application of emerging technologies, its ability to enable or drive business process changes, and its delivery of
valuable customized solutions to internal business units and external customers or partners [10]. Similar to the
assessment of communications, architectural concerns are the main motivation of several BITA frameworks [8].

Assessing Efficiency Of Itil Framework To Align Business…
18
The last component of the Luftman’s model is ―skills.‖ It considers and measures human resources practices,
such as the hiring, retention, training, and performance feedback mechanism, encouraging innovation and career
opportunities, and developing the skills of the employees [10]. It also measures the organization’s readiness for
change, capability for learning, and ability to adopt and adapt to new ideas. It appears that some BITA
frameworks [9] have had a glance on this measure.As practiced in many maturity models, the scores an
organization achieves for these six components of maturity are drawn up on the core concepts of the Software
Engineering Institute’s capability maturity metric (CMM) and are based on a five-point Likert scale. These five levels of maturity are signified as below [10]:
1. Initial/ad-hoc process
2. Committed process
3. Established focused process
4. Improved/managed process
5. Optimized process
III. Research Model And Methodology Hypothesis1: Thecommunications between the various parts of the business and IT in an organization and
their awareness of each other (communications) can be improved by running an ITIL
Framework. Hypothesis 2: Conducting an ITIL Framework will positively influence the demonstration of IT values to the
business in terms that the business understands Competency/ value measurements).
Hypothesis 3: Conducting an ITIL Framework will positively influence the IT decision-making, IT
prioritization and IT resource allocation (governance).
Hypothesis 4: The relationships between thebusiness and IT units in an organization including their
partnership on the risks and benefits (partnership) will be positively influenced by running an
ITIL Framework.
Hypothesis 5: Conducting an ITIL Framework has apositive impact on the standardization , integration and
managing the business needs (scope and architecture).
Hypothesis 6: Running an ITIL Framework in the organization will positively influence the human resource
considerations (skills).
If hypotheses 1 to 6 are true, then automatically the main proposition of the study (i.e. conducting an ITIL
Framework positively impacts the BITA maturity) will hold true and by virtue of this, the moment one of them
is false, the main proposition will also be false.To address the research hypotheses, a survey of organization in
Iran that recently ran and completed an ITIL Framework between 2011 and 2012 was conducted. The qualitative
approach was adopted for this research because of the small sample size. The research methodology in this
study involved presenting a questionnaire listing 39 questions, based on six components and their measures
corresponding to the Luftman’s model, to evaluate the BITA maturity in a valid manner, in each organization.
This questionnaire included two similar parts: one to be answered before implementation of the ITIL
Framework and Earlier, to score each of the 39 questions, respondents had been requested to select an option
from a multiple choice list of five statements. These five statements were designed to represent a continuum from the first, signifying the lowest level of alignment maturity to the fifth statement, signifying the highest
level. In the next step, these selected options were mapped to the scores 1 to 5. Thus, the systemized concepts
were utilized instead of subjective numbers, to increase the validity of each measurement [11].The six measures
of the BITA maturity described earlier were used. As mentioned above, CIOs were requested to respond by
selecting the item that most accurately described the BITA scenario of their organization, before and after
conducting the ITIL Framework there. Their responses were then analyzed. The matching calculation utilized
the differences between the corresponding factors in the two states.Furthermore, the research hypotheses of this
study postulated that conducting the ITIL would definitely enhance the maturity of BITA in organizations. To
address these hypotheses, the mean of these enhancements in each six measure were employed and the results
sorted out. The research model in this study is shown in Fig. 2.Statistical analyses were performed by SPSS.
Prior to data analysis, the research instrument was assessed for reliability as well as validity. It appeared that the
research tool would be valid because a questionnaire containing 39 Luftman’s standard measures ,was used. Moreover, Cronbach’s alpha was employed to analyze the reliability of this tool.Regarding the hypotheses of the
research, this data was also analyzed by the t-test for paired samples , and significant results explained in the
next section, were identified.

Assessing Efficiency Of Itil Framework To Align Business…
19
Fig. 2 Research model of the relationship between EA and BITA
IV. Data And Results
4.1 Data collection, validation and verification A two-part questionnaire, including a complete description of our purpose, ITIL Framework definition,
the organizational scale of the project, and 39 questions based on the Luftman’s model, was prepared in
Microsoft Excel format and distribute it to municipality IT organization Of Tehran. 50clerks of the organization
selected were requested to answer the questions, once before conducting the ITIL Framework and once again
after deployment. Finally, 33 clerks responded with completed questionnaires for both states, after our follow-
up, in six months.Eventually, the verified data was imported into SPSS.The frequencies of the observed
measures are shown in Table 6 of Appendix A. Figure 3 shows the line graphs for each of the six main criteria
of the Luftman’s model. As shown in these graphs, all measures show a conspicuous
improvement in their maturity scores after conducting the ITIL Framework.
4.2 Construct validity
Construct validity is the degree to which the variables employed in the study accurately measure the concepts they purport to measure [21]. It basically refers to this question, ―Are the theory and information
sources used in the study adequate?‖ In qualitative research, construct validity involves the development of a set
of measures to collect data [22], and ensures that the study focuses on specific factors related to research
objectives [23].The original source for the metrics was considered a well-known framework to assess the BITA
maturity, and the information proceeding from it should be valid because the variables were derived from an
instrument that had been successfully applied in a similar study type [11].Moreover, construct validity was met
by utilizing multiple sources of evidence. In this investigation, the authors used several different sources of data
to answer the research questions. The sources included documentation, workforce interviews, and observation of
firms. Data collection focused on specific IT projects and the organization’s operations related to the criteria of
the research model, rather than to all their processes.
4.3 Internal validity
Internal validity is most relevant in causal studies, where the researcher attempts to determine specific
actions leading to predicted results [22],and refers to this question, ―Was the intended answer really selected?‖
In causal studies, internal validity requires that all possible cause and effect relationships are accounted for in
the methodology design. The methodology accounted for the internal validity by utilizing multiple sources that
were triangulated against the aim of the study to determine how CIOs could assess the alignment between
business and IT in their organizations by employing a set of selected criteria. Feedback from interviews showed
that the selected measures had adapted well to the CIOs’ insights, which ensured that the proper metrics had
been selected and customized. This was understood by comparing the results obtained from the respondents and
the outcomes from investigating other sources of evidence.
4.4 External validity
External validity depends on whether the results of a study can be generalized and applied to other,
similar cases [22], and raises the question, ―Can the results and findings of a study be generalized?‖ To achieve

Assessing Efficiency Of Itil Framework To Align Business…
20
such types of validity, the thesis of the research needs to be applicable to each organization and similar results
should be gained. The subjects participating in this experiment were all CIOs from one Iranian
organization(municipality IT organization Of Tehran), holding very high ranks. The results of the study were
expected to be, to
Fig. 3 Line graph for BITA
Components

Assessing Efficiency Of Itil Framework To Align Business…
21
Fig. 4 Line graph for all measures
some degree, representative of this class of subjects. Any generalization of the results regarding organization
size or even type needs to be made cautiously.However, what should be emphasized is that the research
presented in its current stage is exploratory in nature and merely the first step in a series of experiments, which
could yield results which will prove amenable to more generalization, in the future.
4.5 Reliability
The reliability of a study design refers to the ability of an instrument to consistently measure an
attribute ,and ensures that a different researcher conducting exactly the same study, employing the same methodology on the exact same participants would end-up with the same results [22]. This implies that the
experiment is replicable [21].As mentioned earlier, Cronbach’s alpha, which is the measure of internal
consistency or reliability of a psychometric test score for a sample of examinees, was applied to analyze the
reliability of different sections of the questionnaire.Alpha can take on any value less than or equal to 1,
including negative values, although only the positive values make sense. The higher values of alpha are more
desirable [24]. The α coefficient was found to be 0.826 for ―before ITIL‖ and 0.879 for ―after ITIL;‖ therefore,
two parts of the questionnaire were reliable because the values of α in both cases were well above the acceptable

Assessing Efficiency Of Itil Framework To Align Business…
22
threshold, at 0.8 [25].Based on the results of assessing reliability and validity, statistical analyses could be
executed on the collected data.
4.6 Test results
Descriptive statistics
The descriptive statistics of the research variables are presented in Table 3.Figure 4 shows the overall
the line graph for the six main components of the Luftman’s model in an Iraninan organization (municipality IT organization Of Tehran).As shown in Table 3 and Fig. 4, the BITA maturity level shows meaningful growth
in all measures and in the organization after performing ITIL compared with the state prior to the ITIL initiative.
Furthermore, the same gradient of measure lines and the consistent shift, visible in both the ITIL Framework
implementation states, show similar trends of improvement in all the questionnaires.
4.7 Test of the research proposition
As the two groups of variables (i.e. before and after ITIL), which were suggested by one person, needed to be
compared, the paired-samples t-test [27] was used to test the research proposition of the study. Therefore, two
expectedhypotheses were drawn up as stated below:H0: performing ITIL Framework cannot change BITA
maturity (μafter=μbefor).H1: performing ITIL Framework can change BITA maturity (μafter≠μbefor).If the
significance level value was higher than 0.05, hypothesis H0 would be asserted; else, if it were less than 0.05, hypothesis H1 would be proven. This implies that running ITIL Framework can improve BITA maturity. This
test was also applied to each of the six main components of the Luftman’s model, in a similar manner. Table 4
shows the results of the tests.As shown in Table 4, the significant level values of all the six components were
less than 0.05. This explains the significant difference prevalent between the two states of the study. Therefore,
conducting ITIL Framework was proven to have a positive effect on all BITA maturity aspects and improved it.
V. Discussion Beginning with the results presented in this section, interpretations and possible
Table 3 Descriptive statistics of the research variables
Table 4 Testing the proposition of the study

Assessing Efficiency Of Itil Framework To Align Business…
23
Table 5 Descriptive statistics of the differences between two states of main measures
explanations of the outcomes of the experiment are mentioned below.Testing the positive effect of the ITIL
Framework on BITA confirmed a statistically significantly beneficial impact on the change of scores from
―before ITIL‖ to ―after ITIL‖ for the variables of the BITA maturity. This provided ample evidence for the
assumption that an ITIL Framework can play an effective role in BITA improvement.Moreover, comparing the
values listed under column ―mean‖ for similar variables in Table 3 reveals that the differences between both
statuses differs from one BITA domain to another. However, no identical effects were identified for different
variables, although running an ITIL Framework was assumed to be an excellent tool to increase the BITA
maturity. Table 5 shows descriptive statistics of the differences between the two states of the main criteria.Based
on the values of ―mean‖ in Table 5, the effect of an ITIL Framework on each component of BITA maturity is listed as below:
1. Governance (1.2313)
2. Communications (1.0001)
3. Skills (0.989)
4. Competency/value measurements (0.6706)
5. Scope and architecture (0.6667)
6. Partnership (0.3599)
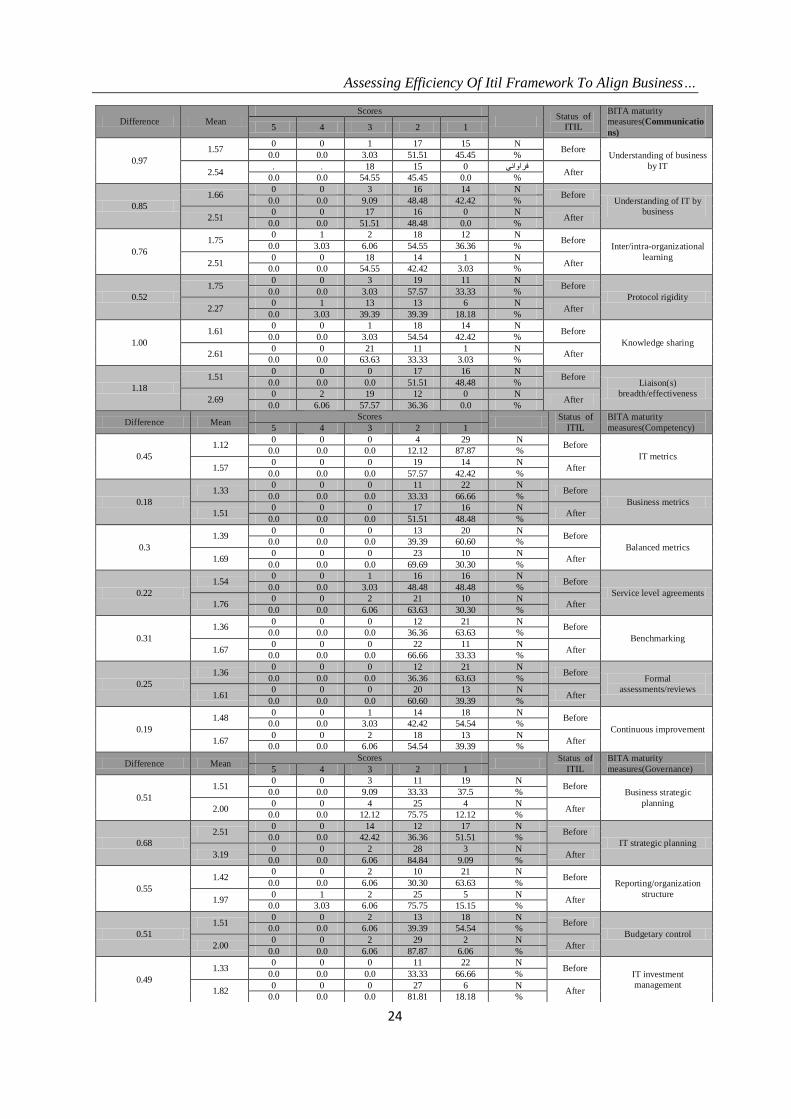
It is also clearly understood from Table 6 of Appendix A that a totally meaningful movement has occurred from levels 1 and 2 to levels 3 and 4 of the maturity scores.
VI. Conclusions Performance evaluation of enterprise architecture in aligning business and information technology is
the main purpose of this study. To achieve this goal, An Iranian governmental organization which had
successfully completed an ITIL Framework since 2011 was selected, and their BITA maturity was assessed as
an effective method of evaluating the alignment between business and IT. A two-part questionnaire based on
criteria of the Luftman’s model was prepared and sent out to the selected organization. Fully completed
questionnaires that had been received were revised cooperatively and used in the final analyses.Although this study is a significant contribution, particularly to both ITIL and business-IT alignment research as it reveals the
relationship between the successful ITIL deployment and the BITA maturity, additional works are required to
examine why the factors ―Partnership‖ and ―Scope and architecture‖ contributed less significantly to the
respondents’ self-rated maturity level. This could be attributed to the small size of the study sample (only One
organization), excluding the IT and business executives participants in this survey, or for other reasons yet
undiscovered, and which should ideally be identified through a more thorough study based on the larger amount
of data.
Appendix A. Collected data based on the Luftman’s model
Table 6 shows the frequencies of the observed data in this survey. This data was collected from one Iranian
organization for two states: before performing their ITIL Framework and after that.
Assessing Efficiency Of Itil Framework To Align Business…
24
BITA maturity
measures(Communicatio
ns)
Status of
ITIL
Scores
Mean Difference 1 2 3 4 5
Understanding of business
by IT
Before N 15 17 1 0 0
1.57
0.97 % 45.45 51.51 3.03 0.0 0.0
After . . 18 15 0فراواني
2.54 % 0.0 45.45 54.55 0.0 0.0
Understanding of IT by
business
Before N 14 16 3 0 0
1.66
0.85 % 42.42 48.48 9.09 0.0 0.0
After N 0 16 17 0 0
2.51 % 0.0 48.48 51.51 0.0 0.0
Inter/intra-organizational
learning
Before N 12 18 2 1 0
1.75
0.76 % 36.36 54.55 6.06 3.03 0.0
After N 1 14 18 0 0
2.51 % 3.03 42.42 54.55 0.0 0.0
Protocol rigidity
Before N 11 19 3 0 0
1.75
0.52 % 33.33 57.57 3.03 0.0 0.0
After N 6 13 13 1 0
2.27 % 18.18 39.39 39.39 3.03 0.0
Knowledge sharing
Before N 14 18 1 0 0
1.61
1.00 % 42.42 54.54 3.03 0.0 0.0
After N 1 11 21 0 0
2.61 % 3.03 33.33 63.63 0.0 0.0
Liaison(s)
breadth/effectiveness
Before N 16 17 0 0 0
1.51
1.18 % 48.48 51.51 0.0 0.0 0.0
After N 0 12 19 2 0
2.69 % 0.0 36.36 57.57 6.06 0.0
BITA maturity
measures(Competency)
Status of
ITIL
Scores Mean Difference
1 2 3 4 5
IT metrics
Before N 29 4 0 0 0
1.12
0.45 % 87.87 12.12 0.0 0.0 0.0
After N 14 19 0 0 0
1.57 % 42.42 57.57 0.0 0.0 0.0
Business metrics
Before N 22 11 0 0 0
1.33
0.18 % 66.66 33.33 0.0 0.0 0.0
After N 16 17 0 0 0
1.51 % 48.48 51.51 0.0 0.0 0.0
Balanced metrics
Before N 20 13 0 0 0
1.39
0.3 % 60.60 39.39 0.0 0.0 0.0
After N 10 23 0 0 0
1.69 % 30.30 69.69 0.0 0.0 0.0
Service level agreements
Before N 16 16 1 0 0
1.54
0.22 % 48.48 48.48 3.03 0.0 0.0
After N 10 21 2 0 0
1.76 % 30.30 63.63 6.06 0.0 0.0
Benchmarking
Before N 21 12 0 0 0
1.36
0.31 % 63.63 36.36 0.0 0.0 0.0
After N 11 22 0 0 0
1.67 % 33.33 66.66 0.0 0.0 0.0
Formal
assessments/reviews
Before N 21 12 0 0 0
1.36
0.25 % 63.63 36.36 0.0 0.0 0.0
After N 13 20 0 0 0
1.61 % 39.39 60.60 0.0 0.0 0.0
Continuous improvement
Before N 18 14 1 0 0
1.48
0.19 % 54.54 42.42 3.03 0.0 0.0
After N 13 18 2 0 0
1.67 % 39.39 54.54 6.06 0.0 0.0
BITA maturity
measures(Governance)
Status of
ITIL
Scores Mean Difference
1 2 3 4 5
Business strategic
planning
Before N 19 11 3 0 0
1.51
0.51 % 37.5 33.33 9.09 0.0 0.0
After N 4 25 4 0 0
2.00 % 12.12 75.75 12.12 0.0 0.0
IT strategic planning
Before N 17 12 14 0 0
2.51
0.68 % 51.51 36.36 42.42 0.0 0.0
After N 3 28 2 0 0
3.19 % 9.09 84.84 6.06 0.0 0.0
Reporting/organization
structure
Before N 21 10 2 0 0
1.42
0.55 % 63.63 30.30 6.06 0.0 0.0
After N 5 25 2 1 0
1.97 % 15.15 75.75 6.06 3.03 0.0
Budgetary control
Before N 18 13 2 0 0
1.51
0.51 % 54.54 39.39 6.06 0.0 0.0
After N 2 29 2 0 0
2.00 % 6.06 87.87 6.06 0.0 0.0
IT investment
management
Before N 22 11 0 0 0
1.33
0.49 % 66.66 33.33 0.0 0.0 0.0
After N 6 27 0 0 0
1.82 % 18.18 81.81 0.0 0.0 0.0

Assessing Efficiency Of Itil Framework To Align Business…
25
Steering committee(s)
Before N 16 17 0 0 0
1.51
0.34 % 48.48 51.51 0.0 0.0 0.0
After N 5 28 0 0 0
1.85 % 15.15 84.84 0.0 0.0 0.0
Prioritization process
Before N 19 10 4 0 0
1.54
0.25 % 57.57 30.30 12.12 0.0 0.0
After N 7 26 0 0 0
1.79 % 21.21 78.78 0.0 0.0 0.0
BITA maturity
measures(Partnership)
Status of
ITIL
Scores Mean Difference
1 2 3 4 5
Business perception of IT
value
Before N 17 16 0 0 0
1.48
0.25 % 51.51 48.48 0.0 0.0 0.0
After N 16 10 7 0 0
1.73 % 48.48 30.30 56.3 0.0 0.0
Role of IT in strategic
business planning
Before N 18 14 1 0 0
1.48
0.43 % 54.54 42.42 3.03 0.0 0.0
After N 12 13 7 1 0
1.91 % 36.36 39.39 21.21 3.03 0.0
Shared goals, risk,
rewards/penalties
Before N 16 16 1 0 0
1.54
0.22 % 48.48 48.48 3.03 0.0 0.0
After N 12 14 6 0 0
1.76 % 36.36 42.42 18.18 0.0 0.0
IT program management
Before N 18 12 3 0 0
1.54
0.07 % 54.54 36.36 9.09 0.0 0.0
After N 14 18 1 0 0
1.61 % 42.42 54.54 3.03 0.0 0.0
Relationship/trust style
Before N 19 11 3 0 0
1.51
0.25 % 57.57 33.33 9.09 0.0 0.0
After N 13 17 1 2 0
1.76 % 39.39 51.51 3.03 6.06 0.0
Business
sponsor/champion
Before N 18 13 2 0 0
1.51
0.36 % 54.54 39.39 6.06 0.0 0.0
After N 12 17 2 2 0
1.89 0.0 6.06 6.06 51.51 36.36درصد
BITA maturity
measures(Scope and
architecture)
Status of
ITIL
Scores
Mean Difference 1 2 3 4 5
Traditional,
enabler/driver, external
Before N 26 7 0 0 0
1.21
0.70 % 78.78 21.21 0.0 0.0 0.0
After N 10 16 7 0 0
1.91 % 30.30 48.48 21.21 0.0 0.0
Standards articulation
Before N 25 8 0 0 0
1.24
0.70 % 75.75 24.24 0.0 0.0 0.0
After N 11 16 7 0 0
1.94 % 33.33 48.48 21.21 0.0 0.0
Architectural integration
(functional organization)
Before N 22 9 2 0 0
1.39
0.37 % 66.66 27.27 6.06 0.0 0.0
After N 13 17 1 2 0
1.76 % 39.39 51.51 3.03 6.06 0.0
Architectural integration
(enterprise)
Before N 23 9 1 0 0
1.33
0.55 % 69.69 27.27 3.03 0.0 0.0
After N 11 16 5 1 0
1.88 % 33.33 48.48 15.15 3.03 0.0
Architectural integration
(inter-enterprise)
Before N 24 8 1 0 0
1.30
0.49 % 72.72 24.24 3.03 0.0 0.0
After N 12 16 5 0 0
1.79 % 36.36 48.48 15.15 0.0 0.0
Architectural
transparency, flexibility
Before N 21 10 2 0 0
1.42
0.34 % 63.63 30.30 6.06 0.0 0.0
After N 14 15 2 2 0
1.76 % 42.42 45.45 6.06 6.06 0.0
BITA maturity
measures(Skills)
Status of
ITIL
Scores Mean Difference
1 2 3 4 5
Innovation,
entrepreneurship
Before N 26 4 3 0 0
1.30
0.64 % 78.78 12.12 9.09 0.0 0.0
After N 11 13 9 0 0
1.94 % 33.33 39.39 27.27 0.0 0.0
Locus of power
Before N 22 6 5 0 0
1.48
0.43 % 66.66 18.18 15.15 0.0 0.0
After N 13 12 6 2 0
1.91 % 39.39 36.36 18.18 6.06 0.0
Management style
Before N 23 5 3 1 0
1.39
0.34 % 69.69 15.15 9.09 3.03 0.0
After N 14 14 5 0 0
1.73 % 42.42 42.42 15.15 0.0 0.0
Change readiness Before
N 25 7 1 0 0 1.27
0.52 % 75.75 21.21 3.03 0.0 0.0
After N 12 16 5 0 0 1.79

Assessing Efficiency Of Itil Framework To Align Business…
26
Refrence
[1] D. Craig, K. Kanakamedala and R. Tinaikar, "The next frontier in IT strategy: A McKinsey Survey," McKinsey Quarterly,
Spring, 2007.
[2] M. McGee, "InformationWeek," no. http://www.informationweek.com/news/210300331, 2008.
[3] J. Luftman, "Assessing IT/business alignment," Information Strategy 20 , p. 7, 2003.
[4] J. McKeen and H. Smith, "Making IT Happen: Critical Issues in IT Management.," no. John Wiley & Sons, 2003.
[5] OGC, "Introduction to ITIL, The IT Service Management Forum,, .pdf , UK," 2007.
[6] A. J. G. Silvius, "The Impact of National Cultures on Business & IT Alignment," Communications of the IIAM, 2008.
[7] R. S. Tapia, "Developing a Maturity Model for IT Alignment in a Cross-Organizational Environment," 2nd Dutch/Belgian
Conference on Enterprise Information Systems (EIS), 2007.
[8] H. M. Chen, "Towards Service Engineering: Service Orientation and Business-IT Alignment," in 41st Hawaii International
Conference on System Sciences (HICSS), 2008.
[9] 1. c. a. V. N. Henderson, "Strategic Alignment:Leveraging Information Technology for Transforming Organizations," vol. 32,
1993.
[10] J. Luftman, "Assessing Business-IT Alignment Maturity," Communications of the Association for Information Systems, vol. 4, p.
14, 2000.
[11] M. Alaeddini and S. Salekfard, "Investigating the role of an enterprise architecture project in the business-IT alignment in Iran,"
springer science, 2011.
[12] J. W. Weiss and D. Anderson, "Aligning Technology and business strategy," 2004.
[13] R. Clarke, "The path of development of strategic information systems theory.," (1994). [Online]. Available:
http://www.rogerclarke.com/SOS/StratISTh.html..
[14] R. Kashanchi and J. Toland, "Can ITIL contribute to IT/business alignment? An initial investigation," 2006.
[15] D. Avison, J. Jones, P. Powell and D. Wilson, "Using and validating the strategic alignment," The Journal of Strategic
Information, p. 223–246, 2004.
[16] M. Davies, "IT service management: An Overview," Proactive ITSM White Paper, p. 1–21, 2004.
[17] A. Nabiollahi and S. b. Sahibuddin, "Considering Service Strategy in ITIL V3 as a framework for ITGovenance," IEEE, 2008.
[18] S. Taylor, "ITIL Version 3: Support for growing Importance of Business Service management," White paper , BMCSoftware
Corporation, 2007.
[19] J. Luftman, "Competing in the information age: strategic alignment in practice," New York: Oxford University Press, 1996.
[20] J. Luftman and T. Brier, "Achieving and sustaining business-IT alignmen," California Management Review 42, p. 109–123,
1999.
[21] WeiL.P and Ross.J, "IT Governance – How Top Performers Manage IT Decision Rights for Superior Results," 2004.
[22] V. K. Vaishnavi and W. Kuechler, "Design science research methods and patterns," innovating information and communication
technology, 2008.
[23] R. K. Yin, "Case study research design and methods.," Thousand Oaks: Sage, 2003.
[24] J. Hartley, "Case study research. In C. Cassell & G. Symon," Essential guide to qualitative methods in organizational research, p.
323–333, 2004.
[25] L. J. Cronbach, "Coefficient alpha and the internal structure of tests," Psychometrika, 1951, p. 297–334..
[26] J. F. Hair, R. E. Anderson, R. L. Tatham and W. C. Black, Multivariate data analysis (5th ed.)., 1998.
[27] A. J. L. Baker and B. J. Charvat, Research methods in child welfare., NY, USA: Columbia University Press, 2008.
% 36.36 48.48 15.15 0.0 0.0
Career crossover
Before N 21 7 5 0 0
1.51
1.51 % 63.63 21.21 15.15 0.0 0.0
After N 11 15 3 4 0
2.00 % 33.33 45.45 9.09 12.12 0.0
Education, cross-training
Before N 24 6 3 0 0
1.36
0.34 % 72.72 18.18 9.09 0.0 0.0
After N 15 14 3 1 0
1.70 % 45.45 42.42 9.09 3.03 0.0
Social, political, trusting
environment
Before N 26 7 0 0 0
1.21
0.67 % 78.78 21.21 0.0 0.0 0.0
After N 11 16 2 4 0
1.88 % 33.33 48.48 6.06 12.12 0.0