Embed Size (px)
Citation preview

ASSESSING DIGITAL FRONTIERS IN PACKAGED FOOD FOR FUTURE GROWTH
November 2016

INTRODUCTION
WHICH INNOVATIONS WILL LEAD THE WAY
IN FOOD?
WHO AND WHERE IS THE DIGITAL
CONSUMER?
FOOD FOR THOUGHT
APPENDIX

© Euromonitor International PASSPORT 3PACKAGED FOOD : ASSESSING DIGITAL FRONTIERS IN PACKAGED FOOD
FOR FUTURE GROWTH
Disclaimer
Much of the information in this
briefing is of a statistical nature and,
while every attempt has been made
to ensure accuracy and reliability,
Euromonitor International cannot be
held responsible for omissions or
errors.
Figures in tables and analyses are
calculated from unrounded data and
may not sum. Analyses found in the
briefings may not totally reflect the
companies’ opinions, reader
discretion is advised.
Packaged food volume growth
in developed markets (where the
majority of food sales are
generated) is expected to remain
static over the next five years.
This is forcing strategy makers
to look beyond traditional
growth markets to stay relevant,
and find new pockets of growth
through value creation in a new
technological era. This briefing
looks at where digital frontiers
can be found and assesses
which technological innovations
are out there, and which will
lead the way in food.
Scope
INTRODUCTION
2016 figures are provisional and based on part-year estimates.
The forecast period under review covers the years 2016 to 2021, inclusive.
Unless stated otherwise, all values expressed in this report are in US dollar
terms, using a fixed 2016 exchange rate for each year. As such, any impact from
currency and/or exchange rate volatility is discounted.
All forecast data are expressed in constant terms; inflationary effects are
discounted. Conversely, all historical data – country-specific, regional and global
– are expressed in current value terms, with inflationary effects included, unless
otherwise stated.
Global Packaged Food
USD2,063 billion
Modern grocery retailers
64%
1,319 billion
Traditional retailers
27%
560 billion
Internet retailing
2%
43 billion
Other
channels
7%
141 billion

© Euromonitor International PASSPORT 4PACKAGED FOOD : ASSESSING DIGITAL FRONTIERS IN PACKAGED FOOD
FOR FUTURE GROWTH
Key findings (1)
INTRODUCTION
Packaged food sales will be static in developed markets, making value creation all the more important.
With emerging markets no longer being the main drivers of growth, food players are turning to developed markets such as the US for sustained future growth. Per capita disposable incomes in developed markets are seven times higher than in emerging markets and product margins are also greater because of a sophisticated distribution network being in place. Yet prolonged deflationary pressures in core developed markets have been a concern for many packaged food players in 2016 which emphasises the need for value creation as future volume sales are expected to remain static.
For time-strapped consumers, value creation is mostly found in time-saving (technologically-driven) solutions. By assessing digital attractiveness, key markets are found to explore digital innovation.
New pockets of growth can be found in markets where digital commerce is strongly developed which can be measured in home, and mobile connectivity, market environment and commerce infrastructure. By leveraging over 2,500 data points Euromonitor has ranked 50 countries according to attractiveness for future deployment of digital initiatives. China, South Korea, the UK and the US score highest on the digital consumer index and are key markets to explore new food innovations that offer solutions in time management, food waste and experience.
Globally, Millennials and Generation Z consumers will hold 47% of gross income by 2025.
Digital consumers are predominantly Millennials and Generation Z consumers who are pioneers in the digital environment. This can be through use of smart appliances, connected devices, purchases through mobile devices, and so on. It will be these consumer groups that food manufacturers should target next in developed markets.

© Euromonitor International PASSPORT 5PACKAGED FOOD : ASSESSING DIGITAL FRONTIERS IN PACKAGED FOOD
FOR FUTURE GROWTH
Key findings (2)
INTRODUCTION
Consumers tend to be more daring when it comes to buying snacks and confectionery than staple foods yet technology opens new ways to excite consumers even for daily food items.
Staple foods that are price inelastic, such as bread, rice, pasta and milk, traditionally have seen little innovation as consumers are more conservative in these categories and typically stick to their favourite brand. Technological innovation can bring back excitement to these categories and get consumers to try new things at higher price points and build an innovative brand image at the same time. With an already high penetration of these foods, even a small price increase can generate substantial new revenue, even in a deflationary environment.

© Euromonitor International PASSPORT 6PACKAGED FOOD : ASSESSING DIGITAL FRONTIERS IN PACKAGED FOOD
FOR FUTURE GROWTH
It has been argued that we have entered a new industrial revolution. This is
often referred to as “Industry 4.0”.
Industry 4.0 is revolution of the Internet of Things where everyone is
interconnected through devices and production processes are transformed
by technology. Industry 4.0 is expected to increase its influence over the
next few years, transforming manufacturing processes on the way. It will
make supply chains and production processes more interconnected,
efficient and flexible, allowing mass-customisation.
For the food industry, this means looking at what technology is out there
and assessing what can be turned mainstream for the everyday consumer,
and allows for higher margins at the same time as maximum penetration.
Introducing industry 4.0 in packaged food
INTRODUCTION
Mainstream adoption of new platforms (including apps) that help guide food consumption for healthy living: measuring nutrition info on the go
Innovative concepts for ready-to-consume products (including 3D printed foods)
Traceability of food ingredients: quality assurance
Mass acceptance of connected food devices: the “internet of food” creates digital interaction
Smart food waste management
Key trends might include:

© Euromonitor International PASSPORT 7PACKAGED FOOD : ASSESSING DIGITAL FRONTIERS IN PACKAGED FOOD
FOR FUTURE GROWTH
Packaged food companies can be front runners in applying next generation tools to improve retail fmcg
business practices. Major food companies continually integrate new network technologies behind the
scenes, with the possibility of greater integration with consumer-facing products in the near future.
With giants like Nestlé and Samsung making substantial investment in technology, it is worth considering
some of the current and future implications of this mega-trend for the world of packaged food.
This briefing sets out to look at who the digital consumer is, which markets are the digital frontiers of
industry 4.0, and which innovations will lead the way in finding new pockets of growth.
Who, where with what?
INTRODUCTION
Who is the digital
consumer?
Where are the next digital
frontiers
Which innovations will lead the
way in packaged
food?

© Euromonitor International PASSPORT 8PACKAGED FOOD : ASSESSING DIGITAL FRONTIERS IN PACKAGED FOOD
FOR FUTURE GROWTH
In order to identify which geographic
markets are the most digitally attractive
and offer the best prospects for future
deployment of digital initiatives,
Euromonitor International has developed
the Digital Consumer Index. This tool
pinpoints a country’s relative digital
standing in the present, and offers
forecasts for where it is expected to be
five years from now.
Leveraging more than 2,500 data points,
the Digital Consumer Index assists with
market prioritisation for all digital
initiatives, including digital commerce. In
total, the Digital Consumer Index utilises
18 different metrics, all weighted
according to Euromonitor International’s
industry expertise, to provide an overall
market attractiveness score for each
component of the index.
A full explanation of the methodology
and rankings can be found in the
appendix of this briefing.
Prioritising markets with Euromonitor’s Digital Consumer Index
INTRODUCTION

INTRODUCTION
WHICH INNOVATIONS WILL LEAD THE WAY
IN FOOD?
WHO AND WHERE IS THE DIGITAL
CONSUMER?
FOOD FOR THOUGHT
APPENDIX

© Euromonitor International PASSPORT 10PACKAGED FOOD : ASSESSING DIGITAL FRONTIERS IN PACKAGED FOOD
FOR FUTURE GROWTH
Whilst the global digital landscape will continue to be defined by the narrowing gap between developed and emerging markets, there still is a divide in terms of food income elasticity.
In fact, the digital consumer index and packaged food income elasticity are inversely related, with packaged food being less income elastic in those markets which score higher on the digital consumer index.
The US, the UK and South Korea, for example, are amongst the top countries for digitisation, while food income elasticity is amongst the lowest. Vietnam, Egypt and the Philippines show the opposite.
An exception to the rule is China, where there is a significant discrepancy between tier one and three cities, allowing for high digitisation in the former cities and higher packaged food income elasticity in more rural areas.
Linking digital consumer index to low income elastic food groups
WHICH INNOVATIONS WILL LEAD THE WAY IN FOOD?
P value: <0.0001

© Euromonitor International PASSPORT 11PACKAGED FOOD : ASSESSING DIGITAL FRONTIERS IN PACKAGED FOOD
FOR FUTURE GROWTH
Staple foods that are most income inelastic, such as rice, pasta, noodles and dairy, traditionally have seen little innovation as consumers are more conservative in their purchasing habits and typically stick to their favourite brand.
Low income elasticity means that if consumers have less to spend, measured in GDP per capita, they are less likely to give up on these food types.
Technological innovation can bring back excitement to these categories and get consumers to try new things at higher price points and build an innovative brand image at the same time. With an already high penetration of these foods, even a small price increase can generate substantial new revenue, even in a deflationary environment.
In 2015, one of the leading brands in rice, pasta and noodles, Barilla, has started experimenting with 3D printing and offers consumers a unique personalised experience by printing any pasta shape they desire. While at the moment it is still far from commercial and serves mainly as a marketing tool, it does show the potential for experience-driven innovations in a declining pasta market.
Changing brand loyalty in staple foods by exciting consumers…
WHICH INNOVATIONS WILL LEAD THE WAY IN FOOD?
Least Income Elastic Food Categories Across
the UK, US, S-Korea and China (five year
elasticity 2016-2021)

© Euromonitor International PASSPORT 12PACKAGED FOOD : ASSESSING DIGITAL FRONTIERS IN PACKAGED FOOD
FOR FUTURE GROWTH
The competitive environment is quite different between high and low income elastic food groups. The top
five brands in breakfast cereals, where income elasticity is highest, hold a substantial share of the market at
39% in retail value terms. For rice, pasta and noodles, where income elasticity is lowest, the market is far
less dominated by the top five, which together capture just 12% of the market. If brand switching is limited
in staple foods and the market is far from consolidated, there are substantial gains to be made from
technological innovation as no brand has yet claimed an unassailable leading position.
…and competing against fewer brands
WHICH INNOVATIONS WILL LEAD THE WAY IN FOOD?
Hig
h v
s low
in
com
e e
lasticity

© Euromonitor International PASSPORT 13PACKAGED FOOD : ASSESSING DIGITAL FRONTIERS IN PACKAGED FOOD
FOR FUTURE GROWTH
Samsung the inevitable partner for food technology
WHICH INNOVATIONS WILL LEAD THE WAY IN FOOD?
As food companies look to technology for new pockets of growth, it is important to consider strategic partners for connected devices, such as smartphones. Whilst Samsung has been faced with negative publicity over its latest Galaxy Note 7 devices, it is still by far consumers’ first choice in terms of smartphone brands. As of 2016, Samsung leads sales in 36 countries around the world.

© Euromonitor International PASSPORT 14PACKAGED FOOD : ASSESSING DIGITAL FRONTIERS IN PACKAGED FOOD
FOR FUTURE GROWTH
A recent example of collaborations between food and tech is the Nestlé and Samsung partnership. In Q2
2016, Samsung’s Strategy and Innovation Center and Nestlé Institute of Health Sciences announced a
collaboration to harness the power of Internet of Things (IoT) technology and nutrition science to provide
new insights into healthy living.
This collaboration reportedly aims to combine IoT, scientifically validated bio sensors, advanced multi-
modal technology, and a comprehensive nutritional approach to provide people with entirely new insights
into health and wellness. The press release also mentioned that the collaboration aims to empower
individuals to better manage their own health and wellbeing by providing relevant and contextual
recommendations around nutrition, lifestyle and fitness, to help individuals live healthier and better lives.
As Nestlé aims to establish itself as a leading health and nutrition company, this collaboration is
unsurprising. It will be interesting to see what the joint forces of the leading packaged food player and
leading consumer electronics player will bring to the market.
Innovations are likely to be centred on tracking and collecting eating behaviour, with the trade-off for
consumers of being able to monitor nutritional intake, whilst Samsung and Nestlé receive priceless
information on the eating behaviour of their customers.
Controlling (or monitoring?) what we eat, by Nestlé and Samsung
WHICH INNOVATIONS WILL LEAD THE WAY IN FOOD?

© Euromonitor International PASSPORT 15PACKAGED FOOD : ASSESSING DIGITAL FRONTIERS IN PACKAGED FOOD
FOR FUTURE GROWTH
As connected devices move through the product life cycle and become more affordable, new pockets of
growth will be found among millennial and generation Z consumers, who are keen to incorporate
technology in their daily lives for ease and flexibility. As connected devices still require some investment, it
is most likely that they will be bought as a gift or a cool new gadget for the whole family.
Founded in 2012, Drop Kitchen has launched an innovative product combining technology with functionality
in baking appliances. The company has developed an app which is connected to a smart scale to simplify
baking. The app guides home cooks step-by-step through finding, making and sharing their creations. The
actual scale is able to rescale quantities, substitute ingredients, offer in-recipe tips, and share recipes and
photos online. It can be described as a smart baking virtual assistant.
Connectivity: Bringing recipes to life with virtual baking assistant
WHICH INNOVATIONS WILL LEAD THE WAY IN FOOD?
Drop Kitchen Inc, founded in 2012
https://www.getdrop.com/

© Euromonitor International PASSPORT 16PACKAGED FOOD : ASSESSING DIGITAL FRONTIERS IN PACKAGED FOOD
FOR FUTURE GROWTH
While the app for the Drop Kitchen scale described in the previous slide is free,
the scale itself costs US$80, compared with US$20 for the average electronic
scale. So why buy it? Because it offers convenience and an experience.
Although a completely unrelated industry, in some ways parallels can be drawn
with the initial sales of the robotic vacuum cleaner, which at first was mainly
purchased as a gift for others or for the entire family. Saving time through
technology is the main USP and robotic vacuum cleaners have outperformed
sales of other types, and posted a 24% volume CAGR over 2011-2016. Despite
the average unit price being three times that of a standard vacuum cleaner, it
has still outperformed other types by tapping into convenience and time-saving
benefits, features consumers will come to expect more in the food industry too.
Why pay more? Because it offers more through technology
WHICH INNOVATIONS WILL LEAD THE WAY IN FOOD?
Robotic
vacuum cleaner
Standard
vacuum cleaner
US$368
US$115
Average unit price (US$) 2016

© Euromonitor International PASSPORT 17PACKAGED FOOD : ASSESSING DIGITAL FRONTIERS IN PACKAGED FOOD
FOR FUTURE GROWTH
A substantial 70% of global households will be urbanised by 2030,
thus convenience-driven solutions will have a important part to play
in future food innovation. Starting in large cities such as London,
Paris and Berlin, many start-ups are already using technology to
make consumers’ daily lives easier. From ordering drinks at the bar
via an app to ordering customised cleaning services at home, or
using a carpool with strangers to travel across the city, technology
is increasingly becoming embedded in our daily lives.
Going forward, this will inevitably change the way consumer groups
are marketed to, and also opens opportunities for food
manufacturers to track consumer behaviour. Persil, for example
has teamed up with Zip Jet, an on-demand laundry app service
provider. Laundry apps have become a feature of Western cities,
targeting young professionals with higher disposable incomes, as
well as urban families with busy lifestyles, supported by a
consistent increase in smartphone possession rate in Western
Europe (predicted to reach 93% by 2030). Teaming up enables
Unilever not only to track disruptive changes within its markets but
also stay ahead of the curve by responding to changing consumer
demands and expectations.
This demonstrates that the mobile phone will inevitably play a
central part in future food innovation, and collaboration must be
sought with providers of these devices.
Connectivity: Future selves more likely to buy a service than food
WHICH INNOVATIONS WILL LEAD THE WAY IN FOOD?
Unilever teaming up with Zip Jet

© Euromonitor International PASSPORT 18PACKAGED FOOD : ASSESSING DIGITAL FRONTIERS IN PACKAGED FOOD
FOR FUTURE GROWTH
Amazon Dash (UK)
GBP49.99
A barcode-scanning, voice-recording grocery
device
Hiku (US)
USD49
Similar features to Amazon Dash, with a Wal-Mart partnership
TellSpec (US)
USD 499-2,000
A device that scans food at a molecular level (without a bar code).
Together with an app it scans food, identifies calories and nutrients.
You cannot however order food with it.
Say it, scan it, buy it. Are food scanners the new norm?
WHICH INNOVATIONS WILL LEAD THE WAY IN FOOD?
For anyone wanting to track their nutrition intake, a number of gadgets have now come to
the market, promising to make it easier to order food or to track what you eat. More and
more food scanners and devices have entered the market, and these are just three
examples:

© Euromonitor International PASSPORT 19PACKAGED FOOD : ASSESSING DIGITAL FRONTIERS IN PACKAGED FOOD
FOR FUTURE GROWTH
Nutrigenomics, or simply personalised nutrition, has become the buzz word when describing what could be
the next big (tech) thing in food. As consumers start to recognise that individual bodies react differently to
food because of genetic factors and predispositions, the idea of DNA testing to determine which food one
can eat or should avoid is potentially an exciting one.
In 2016, The Campbell Soup Co became the exclusive investor in Habit, an American personalised
nutrition meal delivery start-up. Users provide body metrics, such as height, weight and waist size, and
complete an at-home test kit that measures more than 60 different biomarkers. The company utilises a
patent-pending approach to analyse the data and determine the best foods and nutrients, based on the
individual’s needs. A team of chefs prepares the custom meals, which are delivered to the user’s door.
Campbell’s investment is part of a broader trend in the food industry to define the future of food using the
technology that is currently available. Moving forward, more partnerships such as these will determine the
next wave of food innovations that combine science with nutrition. Nestlé is likely to follow suit, through its
division devoted entirely to health science and its recent partnership with Samsung.
Nutrigenomics in real time: Campbell’s personalised meal kit
WHICH INNOVATIONS WILL LEAD THE WAY IN FOOD?

INTRODUCTION
WHICH INNOVATIONS WILL LEAD THE WAY
IN FOOD?
WHO AND WHERE IS THE DIGITAL
CONSUMER
FOOD FOR THOUGHT
APPENDIX

© Euromonitor International PASSPORT 21PACKAGED FOOD : ASSESSING DIGITAL FRONTIERS IN PACKAGED FOOD
FOR FUTURE GROWTH
Meet the interconnected consumer of today…
WHO AND WHERE IS THE DIGITAL CONSUMER
Global internet users
as of 2016
42%3.1Population using
internet as of 2016
The consumers of today are more
connected than ever before. The
number of internet users has
increased rapidly, to reach 3.1 billion
globally in 2016. An estimated 42%
of the population uses the internet as
of 2016.
The range of devices through which
consumers are connecting to the
internet covers anything from a tablet
to a smartphone to a smartwatch.
The rapid increase in digital
connections has ushered in speed
and convenience across all aspects
of life. This digital connectivity has
also underpinned generational shifts
in how consumers browse, compare
prices and buy packaged food.
Digital devices are increasingly
becoming the way companies
connect with today’s consumers.
BILLION

© Euromonitor International PASSPORT 22PACKAGED FOOD : ASSESSING DIGITAL FRONTIERS IN PACKAGED FOOD
FOR FUTURE GROWTH
…and of tomorrow
WHO AND WHERE IS THE DIGITAL CONSUMER
“Almost 70% of
primary and
secondary schools in
the UK now use tablet
computers”- Education technology
charity Tablets for Schools
Most households in developed markets own a tablet and in some cases such as
the US, even more than one. In the UK, students as young as eight years old
are already using tablets in their education and are exposed to the benefits
these offer. As these are the consumers of tomorrow, food players should
rethink how these consumers will interact with food or buy food when they grow
up, which will be entirely different to the consumers of today.

© Euromonitor International PASSPORT 23PACKAGED FOOD : ASSESSING DIGITAL FRONTIERS IN PACKAGED FOOD
FOR FUTURE GROWTH
Young people are
often the first
adopters of
technology and
that is no different
with mobile.
Among global
consumers,
consumers aged
20-39 years make
the most online
grocery
purchases.
These early
adopters are using
their mobile
phones for
multiple
purchases across
the fmcg
industries, and are
likely to increase
spending online.
Heavy mobile shoppers are most likely to be Millennials
WHO AND WHERE IS THE DIGITAL CONSUMER
Source: Euromonitor Global Consumer Trends 2016 survey

© Euromonitor International PASSPORT 24PACKAGED FOOD : ASSESSING DIGITAL FRONTIERS IN PACKAGED FOOD
FOR FUTURE GROWTH
When considering future digital
commerce opportunities, one must
consider the up-and-coming
generations. This subset of the
population not only offers future
commerce growth, but also
represents the part of the
population most likely to adopt
these new ways of browsing and
buying all types of goods and
services.
In 2015, Millennials, who are
typically defined as the generation
that reached adulthood in the new
millennium, already controlled 30%
of gross income. By 2025, when
adding in Generation Z – the cohort
born after the Millennials – these
two generations are expected to
control 47% of gross income.
Undoubtedly, these generations will
be important for any future digital
commerce plans.
Millennials and Gen Z will control 47% of gross income by 2025...
WHO AND WHERE IS THE DIGITAL CONSUMER
0% 20% 40% 60% 80% 100%
2025
2015
Gross income by generation
Gross Income by Generation 2015/2025
Generation Z Millennials Generation X Baby Boomers

© Euromonitor International PASSPORT 25PACKAGED FOOD : ASSESSING DIGITAL FRONTIERS IN PACKAGED FOOD
FOR FUTURE GROWTH
…and be the most populous cohort across the globe
WHO AND WHERE IS THE DIGITAL CONSUMER
© Euromonitor International PASSPORT 26PACKAGED FOOD : ASSESSING DIGITAL FRONTIERS IN PACKAGED FOOD
FOR FUTURE GROWTH
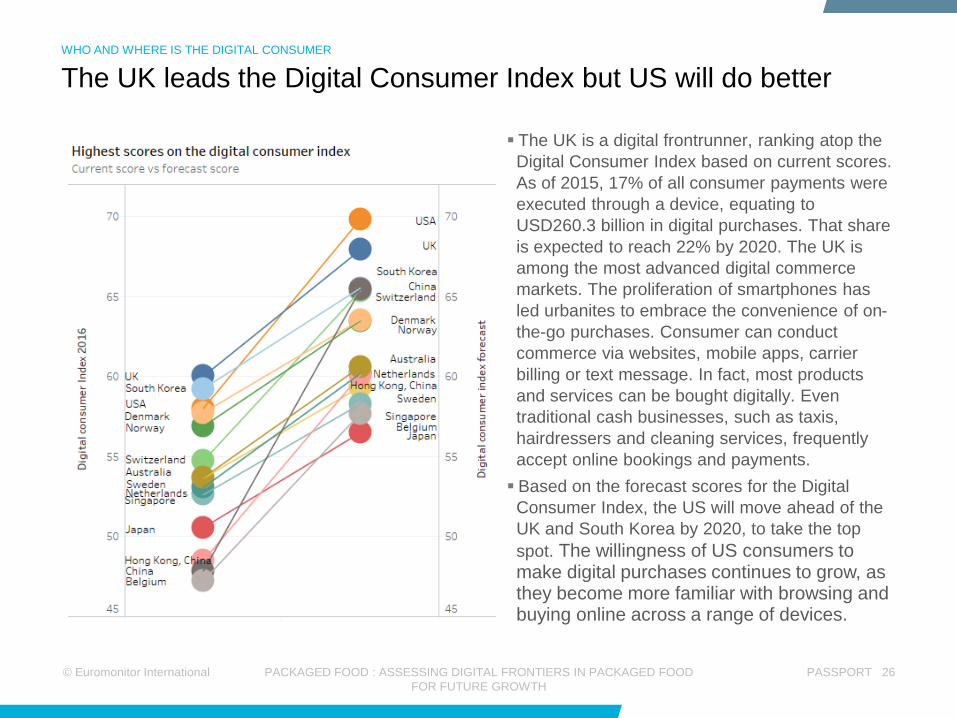
The UK leads the Digital Consumer Index but US will do better
WHO AND WHERE IS THE DIGITAL CONSUMER
The UK is a digital frontrunner, ranking atop the
Digital Consumer Index based on current scores.
As of 2015, 17% of all consumer payments were
executed through a device, equating to
USD260.3 billion in digital purchases. That share
is expected to reach 22% by 2020. The UK is
among the most advanced digital commerce
markets. The proliferation of smartphones has
led urbanites to embrace the convenience of on-
the-go purchases. Consumer can conduct
commerce via websites, mobile apps, carrier
billing or text message. In fact, most products
and services can be bought digitally. Even
traditional cash businesses, such as taxis,
hairdressers and cleaning services, frequently
accept online bookings and payments.
Based on the forecast scores for the Digital
Consumer Index, the US will move ahead of the
UK and South Korea by 2020, to take the top
spot. The willingness of US consumers to make digital purchases continues to grow, as they become more familiar with browsing and buying online across a range of devices.

© Euromonitor International PASSPORT 27PACKAGED FOOD : ASSESSING DIGITAL FRONTIERS IN PACKAGED FOOD
FOR FUTURE GROWTH
The four expected leaders in the forecast digital consumer index
WHO AND WHERE IS THE DIGITAL CONSUMER
South Korea and China are outpacing their emerging
market counterparts based on current scores on both the
Connected Commerce Index and the Digital Connectivity
Index, which together equally feed the top line Digital
Consumer Index.
South Korea
The Asian tech giant has ideal demographics to spur
digital commerce. The country’s tech-savvy culture is
unparalleled, with 99% of the population using broadband
connections. It is a leader in technological development,
and has implemented some of the fastest and most
extensive networks in the world.
China
China is a standout emerging market. Owing to the
slowing economy combined with the increasingly rapid
pace of life, digitally savvy consumers have been seeking
more efficient, convenient and cheaper ways of
purchasing. Digital commerce fulfils these goals.

© Euromonitor International PASSPORT 28PACKAGED FOOD : ASSESSING DIGITAL FRONTIERS IN PACKAGED FOOD
FOR FUTURE GROWTH
Digital frontiers
Food manufacturers should look to four digital frontiers when exploring test markets for digitally-
driven food innovations. These are the UK, the US, South Korea and China, as these markets are most
advanced in adopting digital initiatives such as home connectivity, mobile connectivity, market environment and infrastructure and expenditure
through connected devices.
Millennials and Generation Z
These generations represent the part of the population most likely to adopt new ways of
browsing for and buying food and services and will hold 47% of global gross income by 2025.
Food innovation should be centred around particular USPs for these consumers such as time-saving solutions, on-the-go formats and simplicity as consumers are overloaded with information, a
consequence of being connected everywhere at all times.
Shake up for incomeinelastic staple foods
Staple foods such as rice, pasta, noodles and dairy traditionally have seen little innovation as
consumers typically stick to their favourite brand. Yet it is exactly these foods that are least income inelastic meaning price is not the most immediate
determinant of purchase. This creates an opportunity for added-value innovations if the USP
is right.
Food and consumer electronicscan no longer be viewed separate
Globally, over 60% of consumers aged 20-39 years have bought groceries online in 2016, meaning food promotions will need to be geared towards
devices and vice versa.
Collaboration must be sought to connect food brands with the likes of virtual baking assistants, nutrigenomics initiatives and food scanners, as these devices will influence how consumers buy
food in the future.
Digitisation in food
Four key takeaways to explore new pockets of growth
WHO AND WHERE IS THE DIGITAL CONSUMER

INTRODUCTION
WHICH INNOVATIONS WILL LEAD THE WAY
IN FOOD?
WHO AND WHERE IS THE DIGITAL
CONSUMER?
RECOMMENDATIONS
APPENDIX

© Euromonitor International PASSPORT 30PACKAGED FOOD : ASSESSING DIGITAL FRONTIERS IN PACKAGED FOOD
FOR FUTURE GROWTH
Food for thought
RECOMMENDATIONS
As new digital consumers are more and more connected through their devices, this offers a whole plethora of options for food companies to monitor real consumption habits rather than biased self-reported ones. Business solutions will need to be geared around analysing this big data, which can offer huge opportunities in determining real consumer needs.
As millennial and generation Z consumers will hold 47% of gross income by 2025, added value food launches should be geared to consumer groups where devices play a key part in daily tasks. As such, collaboration should be sought with major players in the consumer electronics industry, which will pave the way in future innovation. Going forward, consumers are likely to buy a service around food rather than just food itself.
Front runners in terms of readiness for the digital revolution are the UK, the US, South Korea and China. In these markets, the fmcg environment, as well as government activity, are most developed, and it is in these markets that innovation in food technology will have the biggest chance of success.
As more emphasis is placed on wellbeing by governments, and there is renewed consumer thinking regarding health, food innovation geared towards health is likely to hold the most potential. Mass nutrigenomics could pave the way in terms of how consumers are informed about what to eat and what to avoid, and it is conceivable that there could be a number of tie-ups between manufacturers of food, consumer electronics and consumer health.

INTRODUCTION
WHICH INNOVATIONS WILL LEAD THE WAY
IN FOOD?
WHO AND WHERE IS THE DIGITAL
CONSUMER?
RECOMMENDATIONS
APPENDIX

© Euromonitor International PASSPORT 32PACKAGED FOOD : ASSESSING DIGITAL FRONTIERS IN PACKAGED FOOD
FOR FUTURE GROWTH
Digital Consumer Index and Subcomponents
Leveraging more than 2,500 data points from Passport, Euromonitor International’s syndicated research
platform, the Digital Consumer Index helps clients identify which geographic markets are the most digitally
attractive and offer the best prospects for future deployment of digital initiatives, including digital commerce.
This index utilises 18 different metrics, all weighted using Euromonitor International’s industry expertise, to
provide an overall market attractiveness score for each component of the index.
The Digital Consumer Index consists of two central components: the Digital Connectivity Index and the
Connected Commerce Index. Each component is given equal weight in the overall Digital Consumer Index.
The 2016 Digital Consumer Index contains a current and forecasted score for both the Digital Connectivity
and Connected Commerce subcomponents, as well as the combined score. The final score (out of 100
points) reflects the current as well as forecast digital readiness in a particular country.
The Digital Connectivity Index takes into consideration a consumer’s ability to access fixed and wireless
broadband and the speed of those connections. The Connected Commerce Index examines the market's
consumer profile, the development of the market's commerce infrastructure and digital commerce spend
across various consumer-facing industries.
Timeframes and Geographic Coverage
The Digital Consumer Index measures the digital connectivity and digital commerce readiness in 50
geographic markets at two different points in time. The two different data points are referred to as current
and forecasted scores. In the 2016 Digital Consumer Index, the current score reflects the current situation
in a particular country using 2015 data as a proxy for the current state of connectivity. In the 2020 Digital
Consumer Index, the forecasted score reflects the forecasted situation in a particular country based on
2020 projections.
Methodology for the Digital Consumer Index
APPENDIX

© Euromonitor International PASSPORT 33PACKAGED FOOD : ASSESSING DIGITAL FRONTIERS IN PACKAGED FOOD
FOR FUTURE GROWTH
Data Sources
All data used in the Digital Consumer Index were derived from Euromonitor International’s syndicated
research platform, Passport. The data used in building the index come from a variety of Passport systems,
including Digital Consumer, Consumer Finance, Consumer Foodservice, Income and Expenditure,
Population, Retailing and Travel.
Estimating Missing Values
For a few countries missing one of the indicators, Euromonitor International estimated the missing value by
calculating regional averages for each specific metric and applying that figure to those affected countries. In
this edition, the number of POS terminals on a per capita basis and mobile commerce were estimated using
this manner for four countries: Belgium, Peru, Slovakia and Switzerland.
Weights Applied to Metrics
The Digital Consumer Index was constructed by calculating a country’s score on a particular metric against
the leading country for each metric.
Relative market share offers a way to benchmark one country’s performance against the leading country
for that metric in order to determine a country’s relative position in the past, present and future. For
bounded variables, such as household possession rates of digital devices, the theoretical maximum value
of 100% was used as the denominator. Three variables – consumer expenditure, mobile internet
subscribers and online travel sales – had particularly notable variation among the countries. In order to
distribute the figures more normally, logarithmic transformation was applied to these three metrics.
Across all metrics, 2020 data were used for benchmarking both the current and forecasted scores to allow
for better comparison not only between the metrics, but also the two points in time.
Methodology for the Digital Consumer Index, continued
APPENDIX

© Euromonitor International PASSPORT 34PACKAGED FOOD : ASSESSING DIGITAL FRONTIERS IN PACKAGED FOOD
FOR FUTURE GROWTH
To help understand and illustrate the impact of each demand driver to a market’s retail growth performance
and prospects, Euromonitor International employs a graphical tool called “growth decomposition”.
The fundamental idea behind growth decomposition is that a product category’s retail sales performance
and future prospects can be explained through changes in underlying demand factors.
As explained above, the impact of demand driver change to retail market sales can be calculated by
multiplying a demand driver’s observed elasticity by that demand driver rate of change over a period of
time. Multiplying demand driver elasticity by forecast demand driver growth yields the percentage points of
overall retail growth that that specific demand driver is contributing to the market forecast under review.
In addition, Euromonitor analysts estimate the impact of “soft drivers” to overall retail growth via their
empirical research. The relative impact and importance of “soft drivers” can be shown alongside that of the
measurable demand drivers identified by the Industry Demand Model.
In the growth decomposition visual below, the percentage points of growth that each demand driver is
contributing to overall market growth are illustrated in the coloured segments of the stacked bar charts.
Growth decomposition explained
APPENDIX: INDUSTRY FORECAST MODEL

© Euromonitor International PASSPORT 35PACKAGED FOOD : ASSESSING DIGITAL FRONTIERS IN PACKAGED FOOD
FOR FUTURE GROWTH
By attributing a fraction of overall retail growth to each contributing demand driver, overall category growth
can be “decomposed”. In doing so, an extensive picture of underlying market fundamentals and processes
on a category-by-category and country-by-country basis can be provided.
Ultimately, growth decomposition allows Industry Forecast Model users to:
Identify different demand drivers that affect historic sales, and will likely impact future market prospects;
Evaluate the relative importance of different demand factors over time and then identify which factors
generate the highest deviations in historic - and ultimately future - consumption;
Illuminate the underlying market dynamics for each product category;
Measure and predict the effects of demand driver shocks, either expected or hypothetical;
Facilitate scenario analysis by generating understanding of which demand factors can be influenced by a
manufacturer or retailer and which are beyond their control.
Significance and applications for growth decomposition
APPENDIX: INDUSTRY FORECAST MODEL

© Euromonitor International PASSPORT 36PACKAGED FOOD : ASSESSING DIGITAL FRONTIERS IN PACKAGED FOOD
FOR FUTURE GROWTH
Key applications for Industry Forecast Models
APPENDIX: INDUSTRY FORECAST MODEL
1
• Quarterly Forecast Restatements
• Regularly updated retail market forecasts to reflect latest macro expectations (ie, quarter-on-quarter real GDP growth revisions) for all markets.
2
• “What If?” Scenario Analysis
• See and compare how a hypothetical event (ie Eurozone recession, China Hard Landing, Grexit) stands to impact different market forecasts.
3
• Growth Decomposition and Demand Driver Elasticities
• Understand, compare and respond to the forces driving expected market growth across different product categories and countries.
4
• Assess Market Potential
• See the ceiling on retail volume or value sales and growth, regardless of a specific forecast scenario. How much more can that market really grow?

FOR FURTHER INSIGHT PLEASE CONTACTLianne van den Bos
Senior Food Analyst
[
Related Analysis:
2016 Digital Consumer Index: Identifying The Next Digital Frontiers
Industry 4.0: The Future Impact of the Fourth Industrial Revolution

© Euromonitor International PASSPORT 38PACKAGED FOOD : ASSESSING DIGITAL FRONTIERS IN PACKAGED FOOD
FOR FUTURE GROWTH
This research from Euromonitor International is part of a global
strategic intelligence system that offers a complete picture of the
commercial environment. Also available from Euromonitor
International:
Global Briefings
Timely, relevant insight published every month on the state of the
market, emerging trends and pressing industry issues.
Interactive Statistical Database
Complete market analysis at a level of detail beyond any other source.
Market sizes, market shares, distribution channels and forecasts.
Strategy Briefings
Executive debate on the global trends changing the consumer markets
of the future.
Global Company Profiles
The competitive positioning and strategic direction of leading
companies including uniquely sector-specific sales and share data.
Country Market Insight Reports
The key drivers influencing the industry in each country;
comprehensive coverage of supply-side and demand trends and how
they shape future outlook.
Learn More
To find out more about
Euromonitor International's
complete range of business
intelligence on industries,
countries and consumers please
visit www.euromonitor.com or
contact your local Euromonitor
International office:
Bangalore +91 (80) 67740500
Cape Town +27 21 524 3000
Chicago +1 312 922 1115
Dubai +971 4 372 4363
London +44 0 20 7251 8024
Santiago +56 22 915 7200
Shanghai +86 21 6032 1088
Singapore +65 6429 0590
Sydney +61 0 2 9581 9200
Tokyo +81 3 3436 2100
Vilnius +370 5 243 1577
Experience more...