Embed Size (px)
Citation preview
Assessing cost-effectiveness – what is an ICER?-
Incremental analysis
Usa Chaikledkaew, Ph.D.
2
Outline
How to conduct health economic
evaluation results?
What is an Incremental cost-
effectiveness ratio (ICER)?
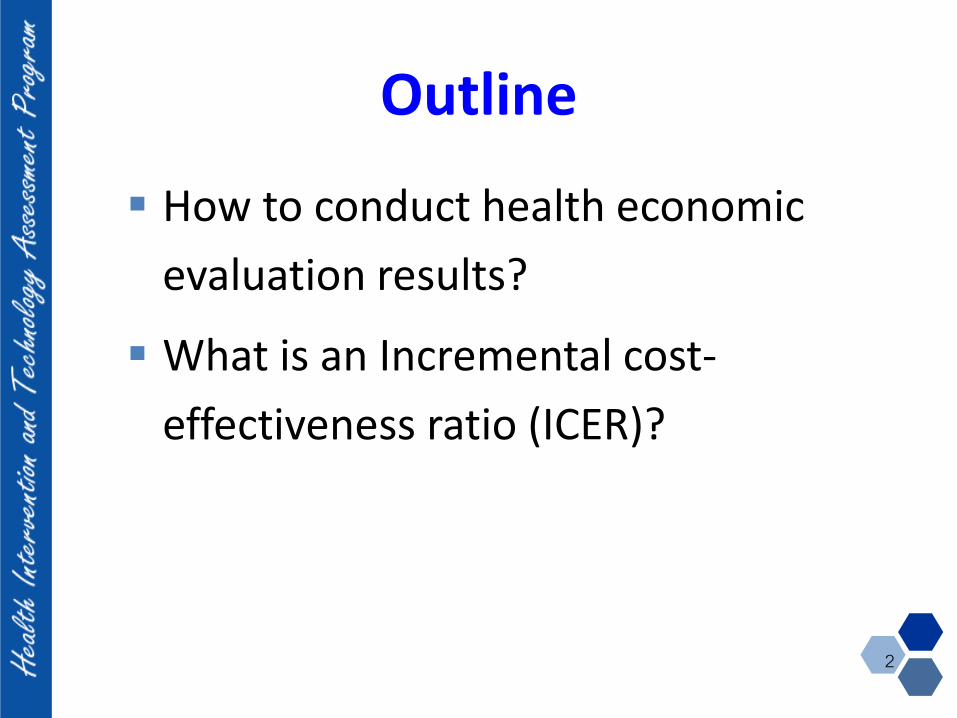
What is health economic evaluation?
Refers to a study that considers both the comparative costs associated with two or more health care interventions, and the comparative clinical effects, measured either in clinical units, health preferences, or monetary benefit
OutcomesCosts
$
Source: Drummond et al, 2005
LYGs QALYs
$
3
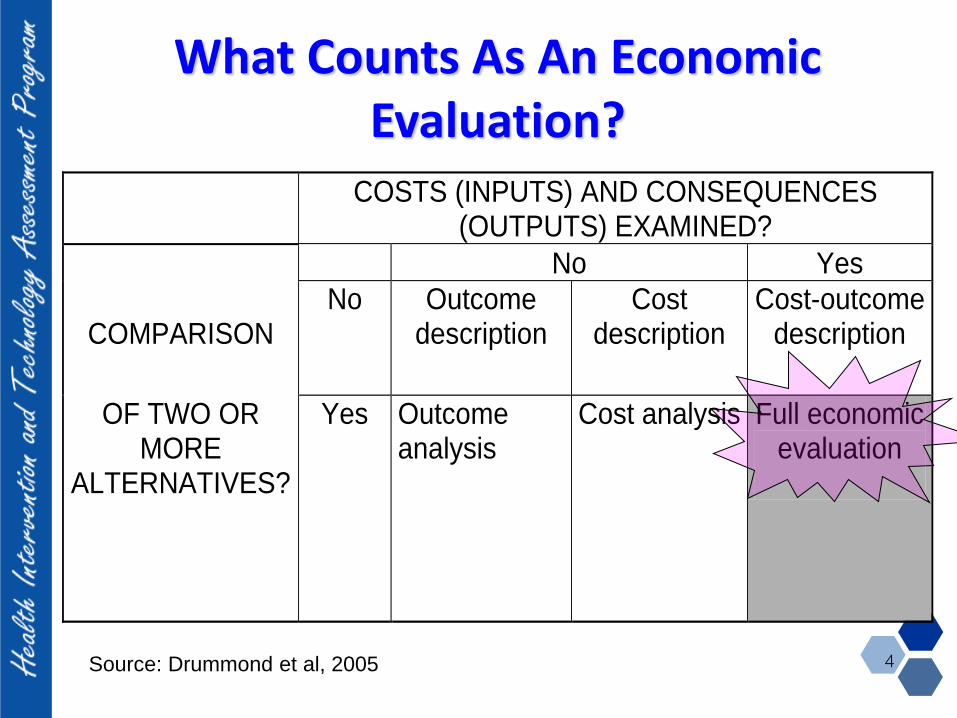
What Counts As An Economic Evaluation?
COSTS (INPUTS) AND CONSEQUENCES
(OUTPUTS) EXAMINED?
No Yes
COMPARISON
No Outcome description
Cost description
Cost-outcome description
OF TWO OR MORE
ALTERNATIVES?
Yes Outcome analysis
Cost analysis Full economic evaluation
Source: Drummond et al, 2005 4
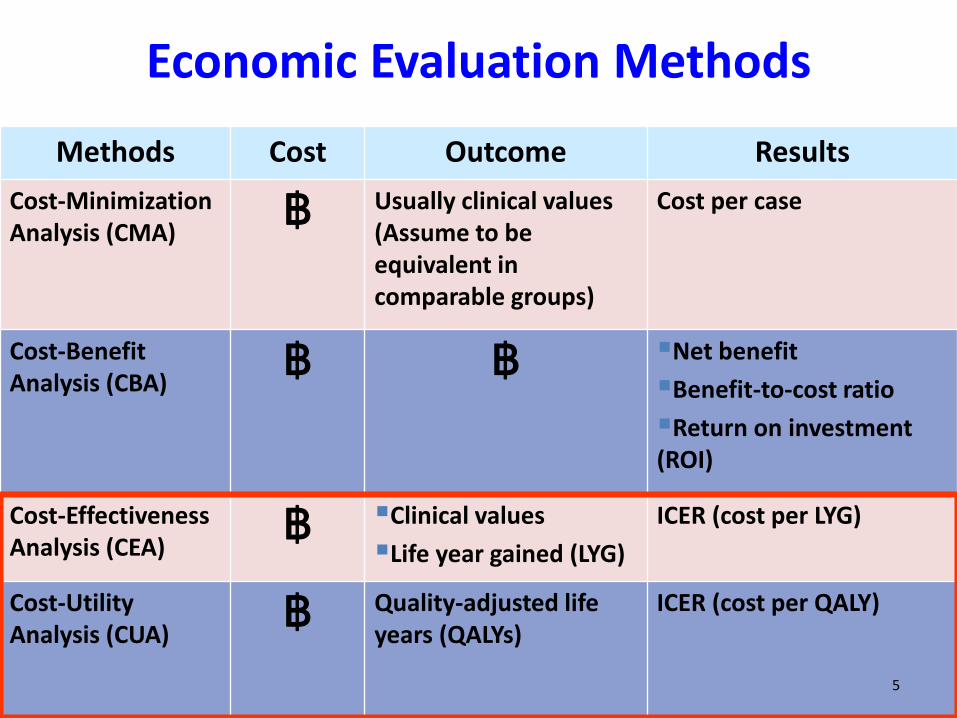
Economic Evaluation Methods
Methods Cost Outcome Results
Cost-Minimization Analysis (CMA)
฿ Usually clinical values (Assume to be equivalent in comparable groups)
Cost per case
Cost-Benefit Analysis (CBA)
฿ ฿ Net benefit
Benefit-to-cost ratio
Return on investment (ROI)
Cost-Effectiveness Analysis (CEA)
฿ Clinical values
Life year gained (LYG)
ICER (cost per LYG)
Cost-Utility Analysis (CUA)
฿ Quality-adjusted life years (QALYs)
ICER (cost per QALY)
5
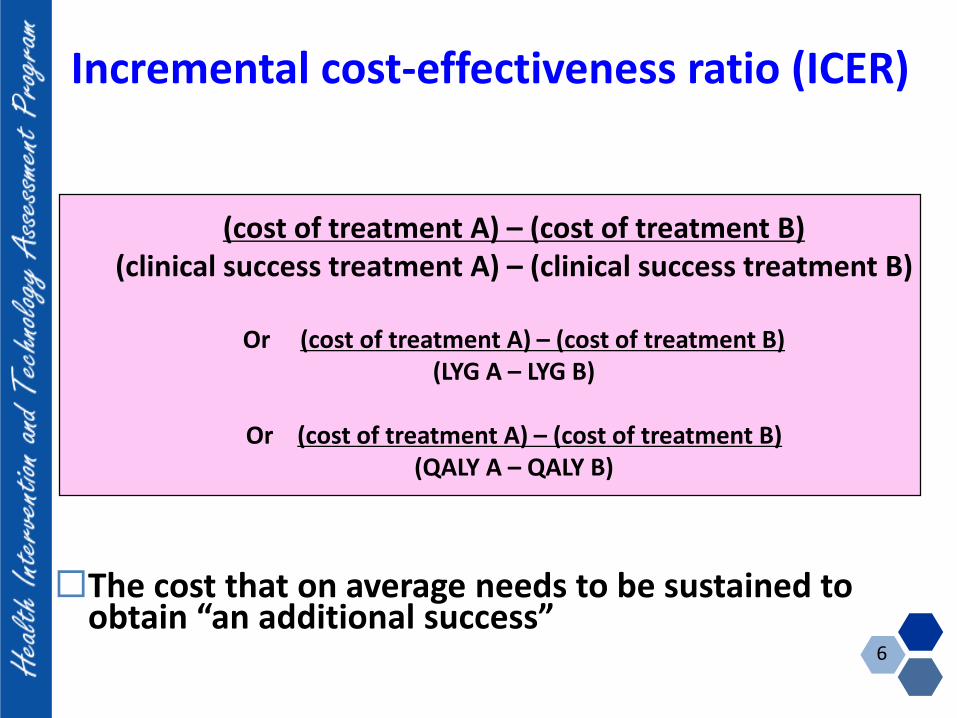
Incremental cost-effectiveness ratio (ICER)
The cost that on average needs to be sustained to obtain “an additional success”
(cost of treatment A) – (cost of treatment B)(clinical success treatment A) – (clinical success treatment B)
Or (cost of treatment A) – (cost of treatment B)(LYG A – LYG B)
Or (cost of treatment A) – (cost of treatment B)(QALY A – QALY B)
6
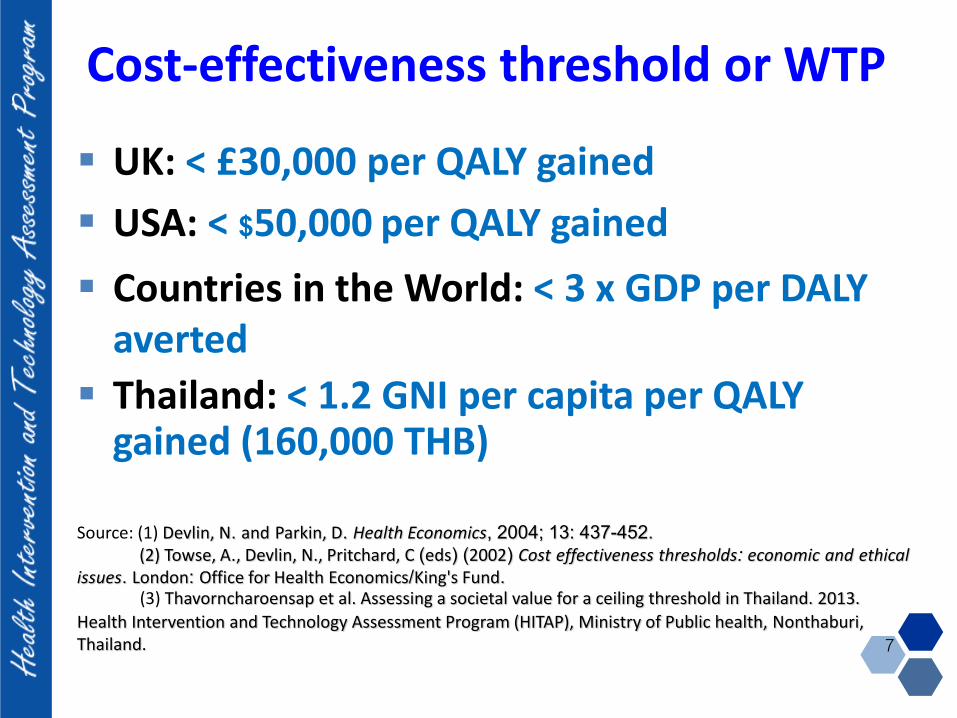
Cost-effectiveness threshold or WTP
UK: < £30,000 per QALY gained
USA: < $50,000 per QALY gained
Countries in the World: < 3 x GDP per DALY averted
Thailand: < 1.2 GNI per capita per QALY gained (160,000 THB)
Source: (1) Devlin, N. and Parkin, D. Health Economics, 2004; 13: 437-452.
(2) Towse, A., Devlin, N., Pritchard, C (eds) (2002) Cost effectiveness thresholds: economic and ethicalissues. London: Office for Health Economics/King's Fund.
(3) Thavorncharoensap et al. Assessing a societal value for a ceiling threshold in Thailand. 2013.
Health Intervention and Technology Assessment Program (HITAP), Ministry of Public health, Nonthaburi, Thailand. 7
How to conduct health
economic evaluation
results?
8
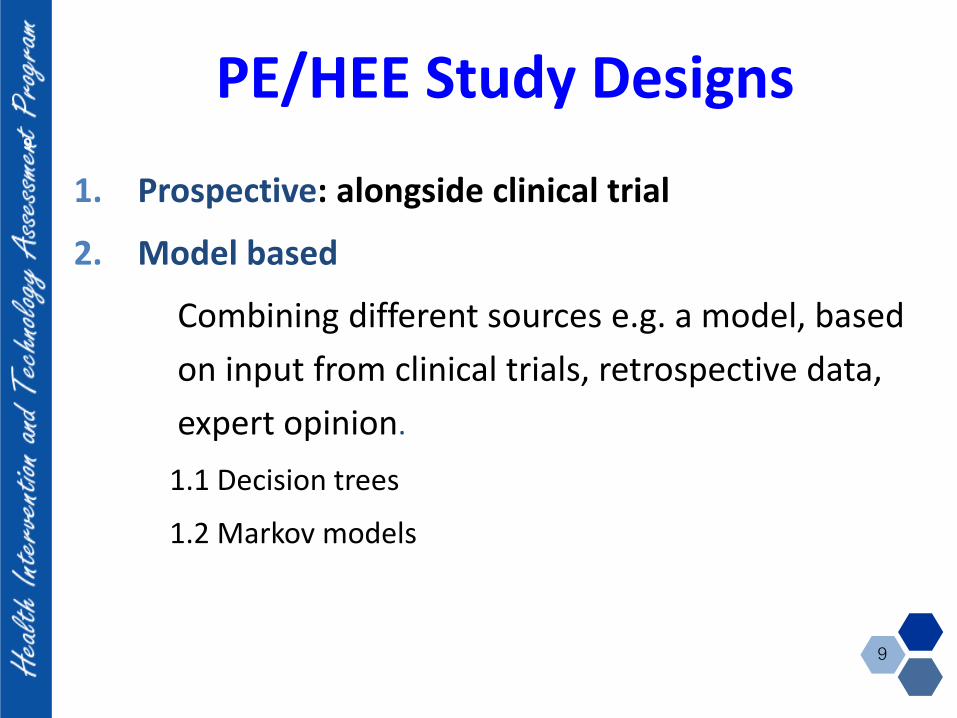
PE/HEE Study Designs
1. Prospective: alongside clinical trial
2. Model based
Combining different sources e.g. a model, based
on input from clinical trials, retrospective data,
expert opinion.
1.1 Decision trees
1.2 Markov models
9
9
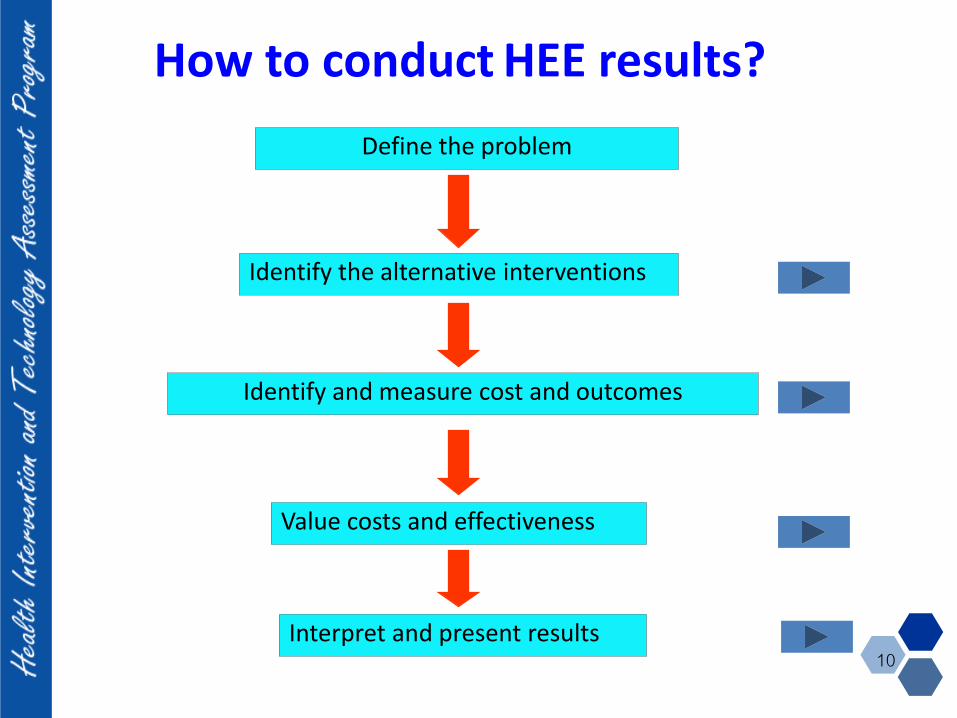
How to conduct HEE results?
Define the problem
Identify the alternative interventions
Identify and measure cost and outcomes
Value costs and effectiveness
Interpret and present results10
Example
11
Source: Thavorn et al. Tobacco Control 2008;17:177–182. doi:10.1136/tc.2007.022368
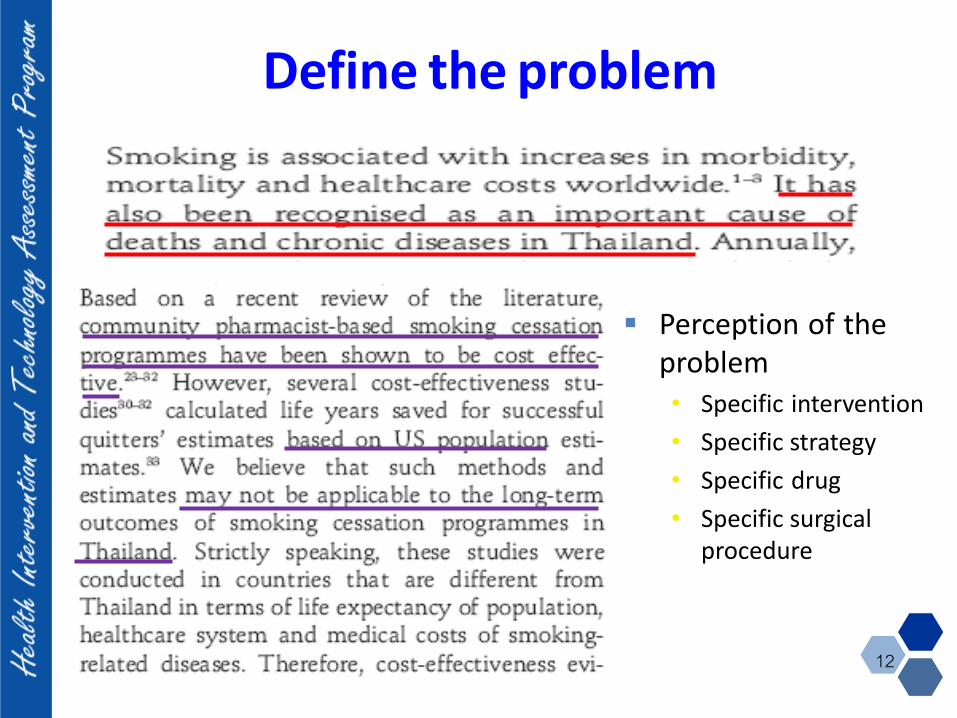
Define the problem
12
Perception of theproblem• Specific intervention
• Specific strategy
• Specific drug
• Specific surgicalprocedure
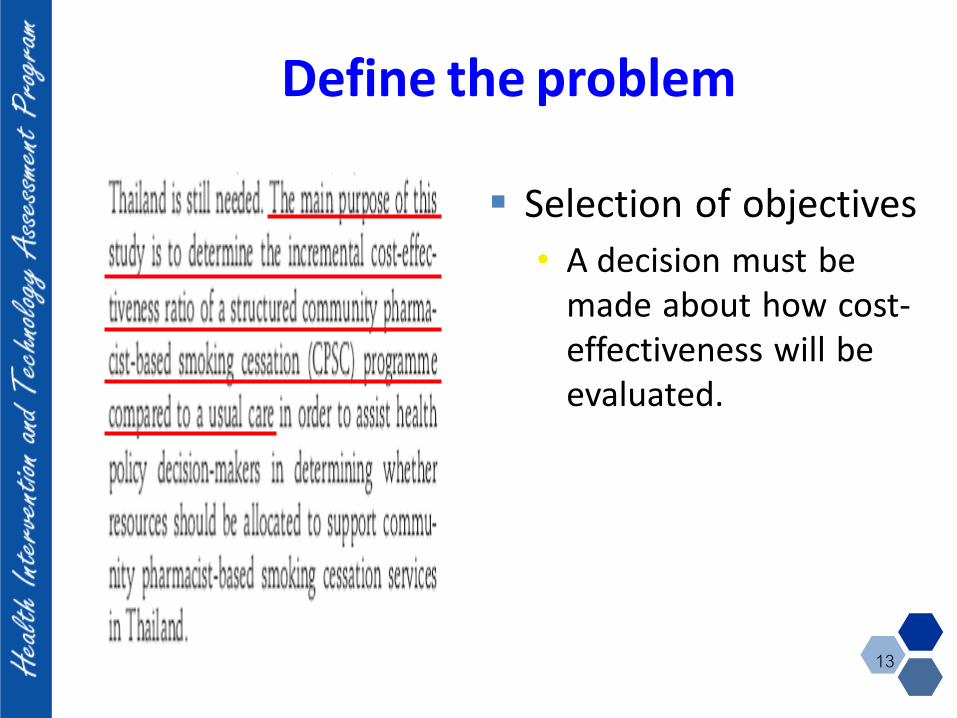
Define the problem
Selection of objectives
• A decision must bemade about how cost-effectiveness will beevaluated.
13
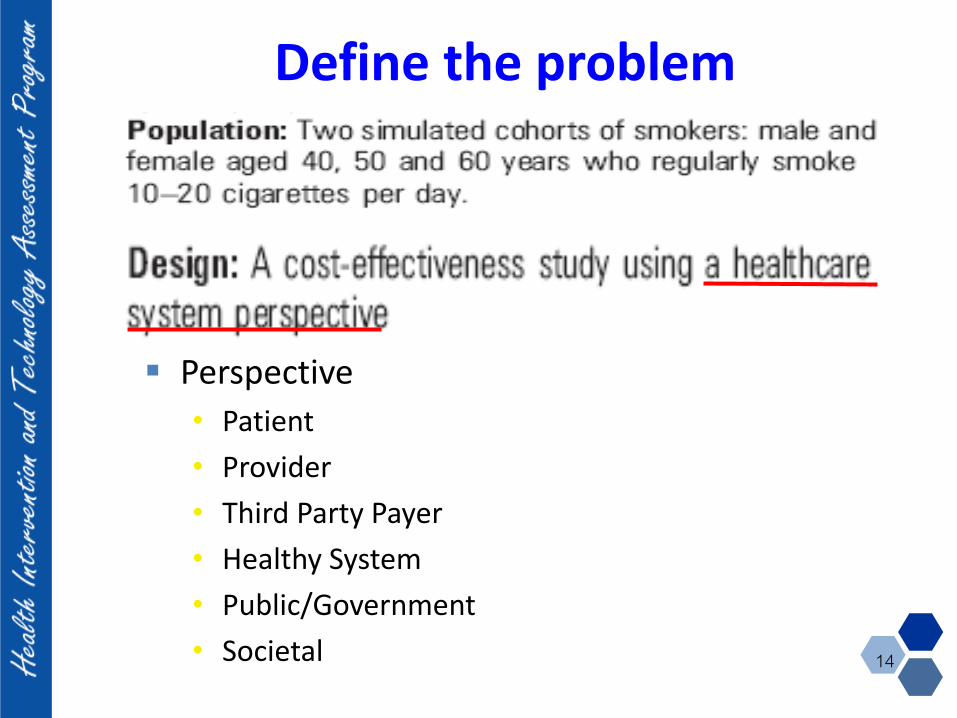
Perspective
• Patient
• Provider
• Third Party Payer
• Healthy System
• Public/Government
• Societal
Define the problem
14
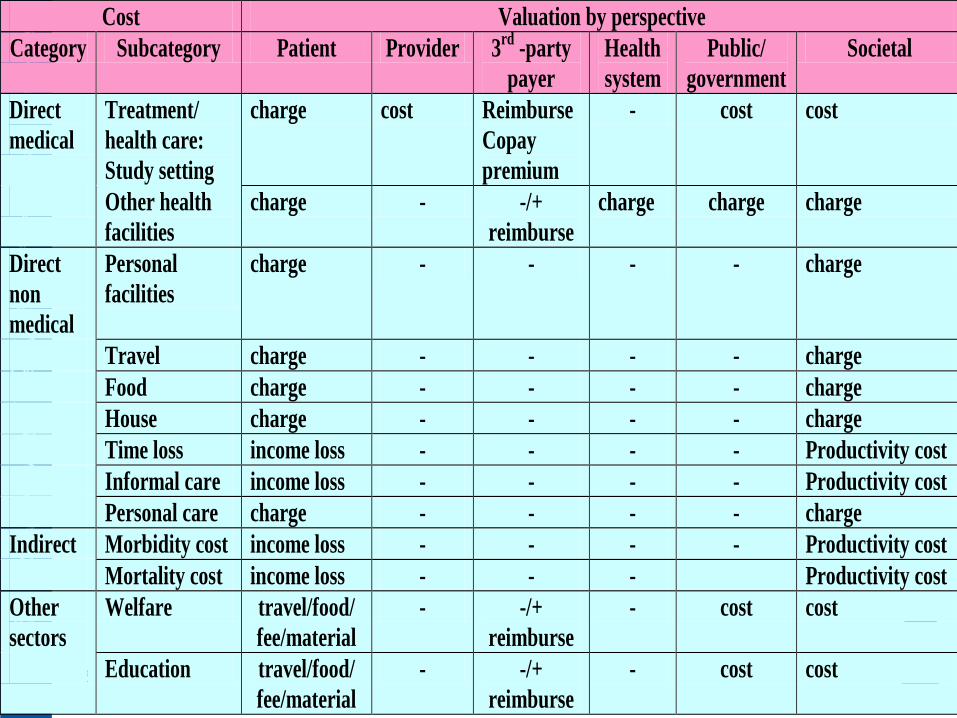
P.15
Cost Valuation by perspective
Category Subcategory Patient Provider 3rd
-party
payer
Health
system
Public/
government
Societal
Direct
medical
Treatment/
health care:
Study setting
charge cost Reimburse
Copay
premium
- cost cost
Other health
facilities
charge - -/+
reimburse
charge charge charge
Direct
non
medical
Personal
facilities
charge - - - - charge
Travel charge - - - - charge
Food charge - - - - charge
House charge - - - - charge
Time loss income loss - - - - Productivity cost
Informal care income loss - - - - Productivity cost
Personal care charge - - - - charge
Indirect Morbidity cost income loss - - - - Productivity cost
Mortality cost income loss - - - Productivity cost
Other
sectors
Welfare travel/food/
fee/material
- -/+
reimburse
- cost cost
Education travel/food/
fee/material
- -/+
reimburse
- cost cost
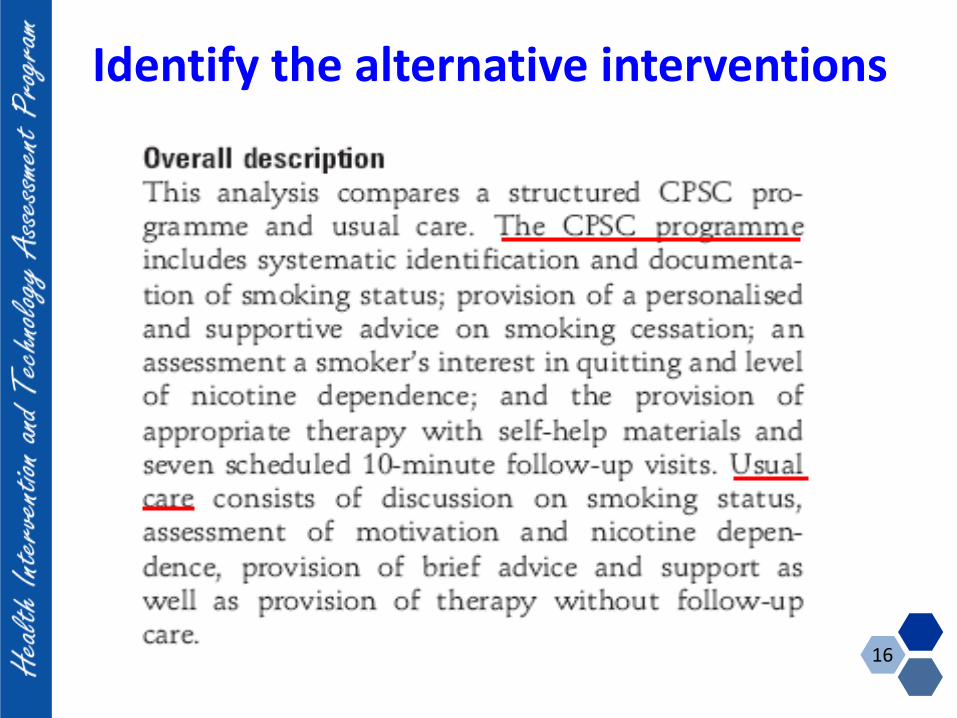
Identify the alternative interventions
16
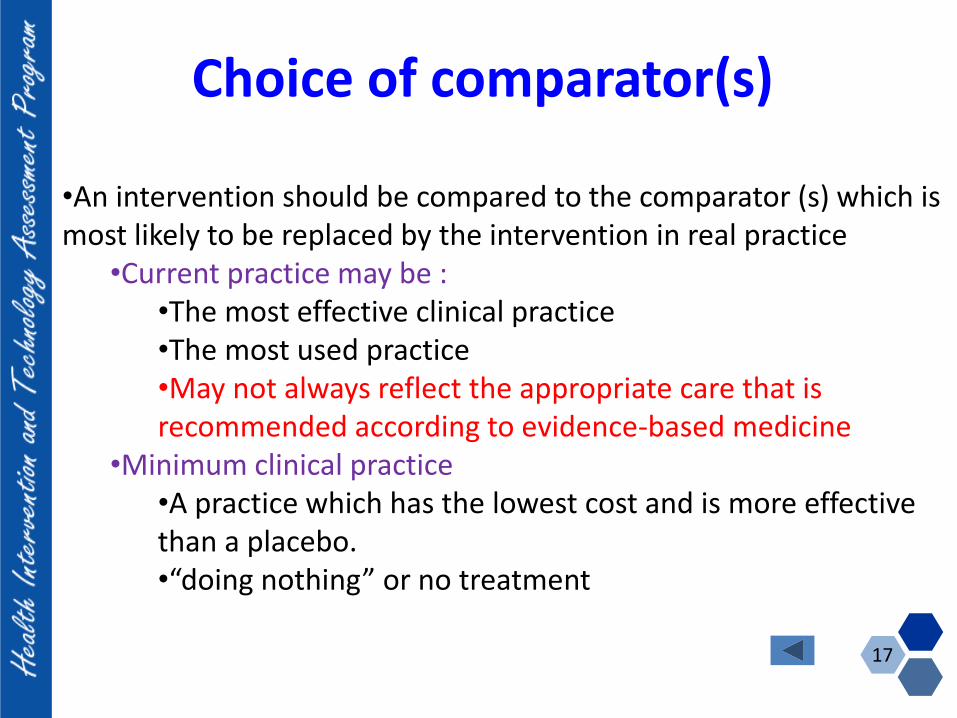
Choice of comparator(s)
•An intervention should be compared to the comparator (s) which is most likely to be replaced by the intervention in real practice
•Current practice may be :•The most effective clinical practice•The most used practice•May not always reflect the appropriate care that is recommended according to evidence-based medicine
•Minimum clinical practice•A practice which has the lowest cost and is more effective than a placebo.•“doing nothing” or no treatment
17
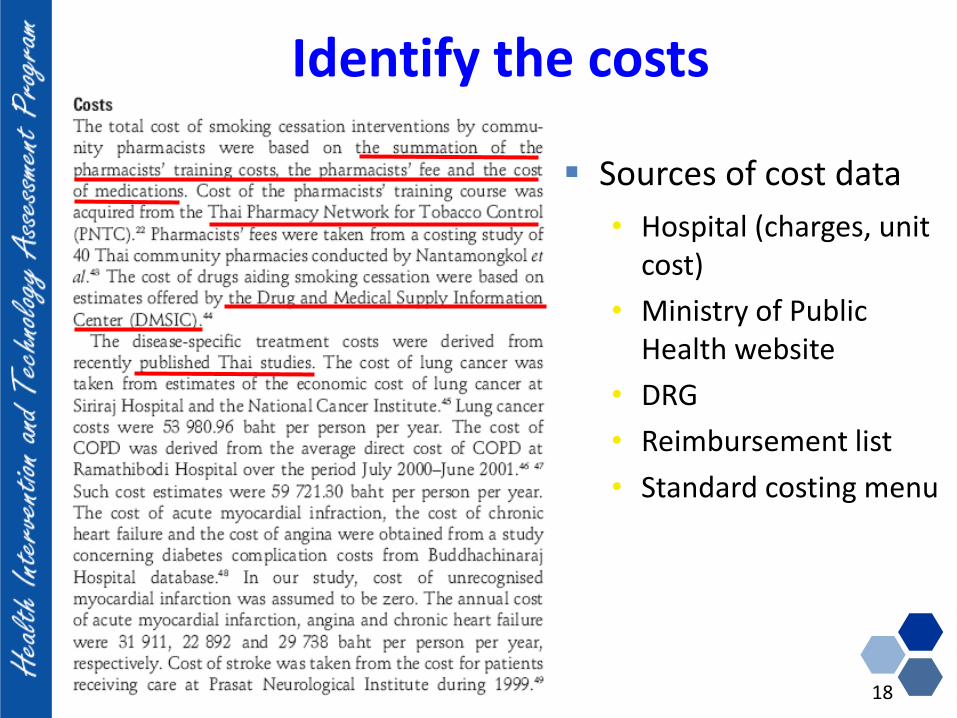
Identify the costs
18
Sources of cost data
• Hospital (charges, unit cost)
• Ministry of Public Health website
• DRG
• Reimbursement list
• Standard costing menu
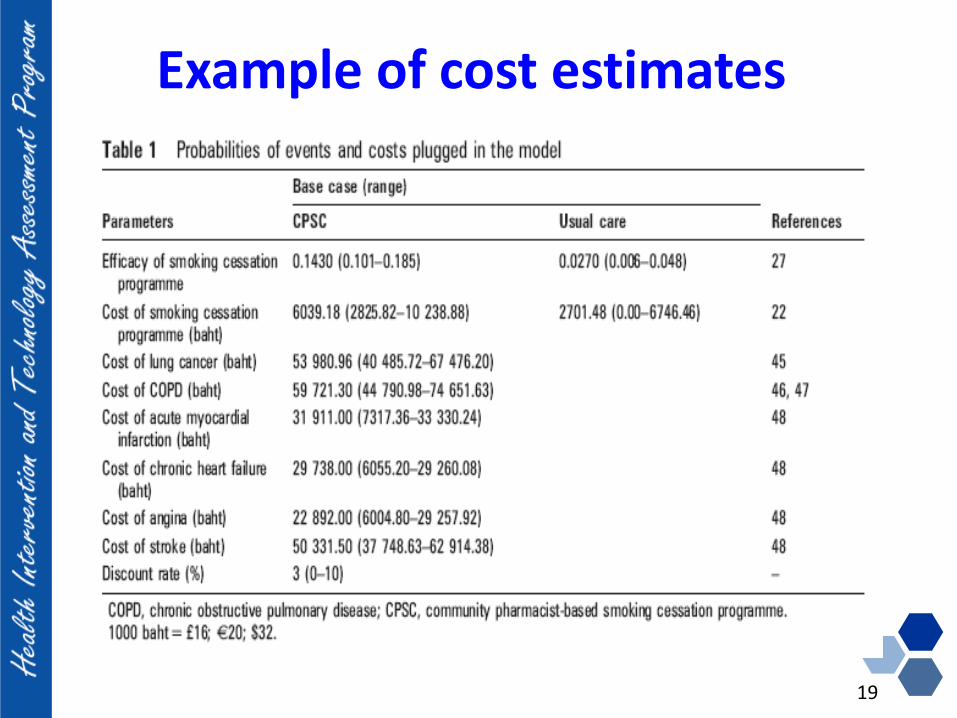
Example of cost estimates
19
Identify the outcomes
20
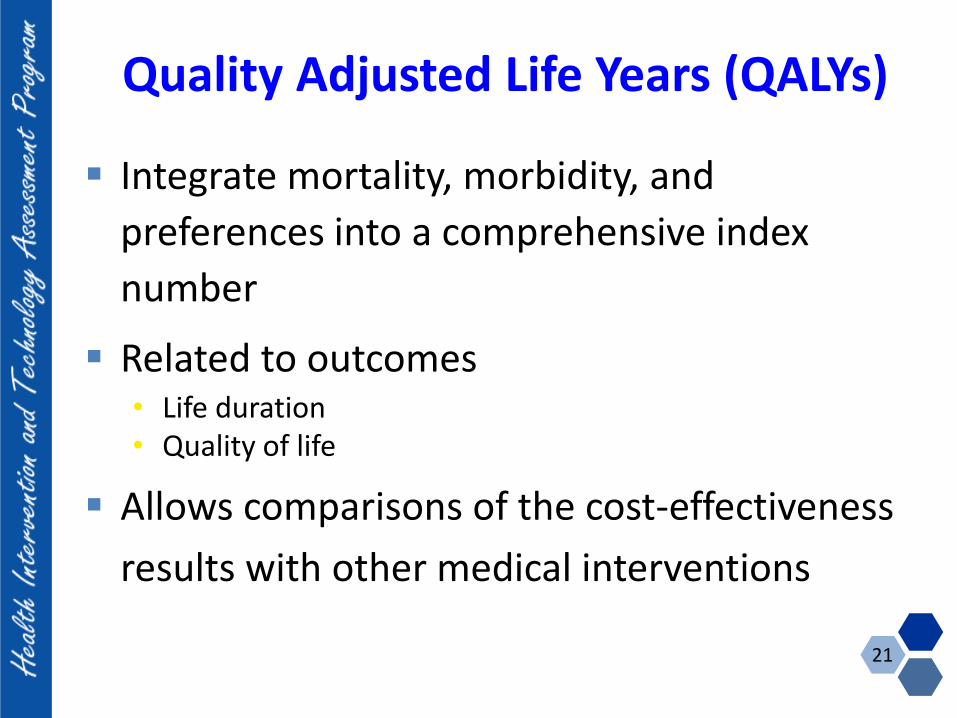
Quality Adjusted Life Years (QALYs)
Integrate mortality, morbidity, and
preferences into a comprehensive index
number
Related to outcomes • Life duration• Quality of life
Allows comparisons of the cost-effectiveness
results with other medical interventions
21
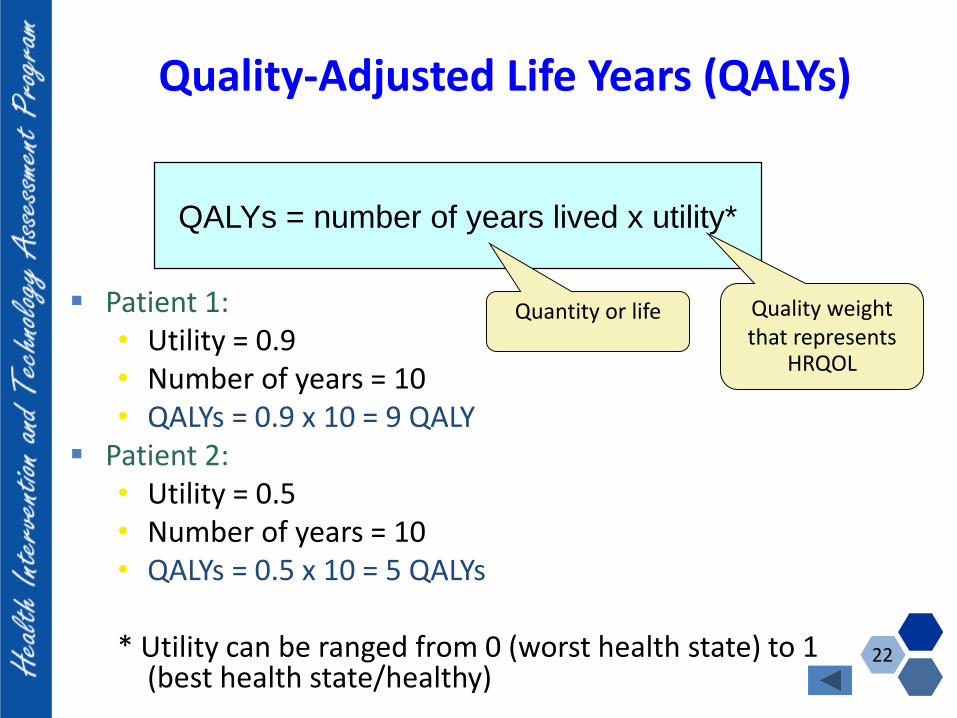
Quality-Adjusted Life Years (QALYs)
Patient 1: • Utility = 0.9• Number of years = 10• QALYs = 0.9 x 10 = 9 QALY
Patient 2:• Utility = 0.5• Number of years = 10• QALYs = 0.5 x 10 = 5 QALYs
* Utility can be ranged from 0 (worst health state) to 1 (best health state/healthy)
QALYs = number of years lived x utility*
Quality weight that represents
HRQOL
Quantity or life
22
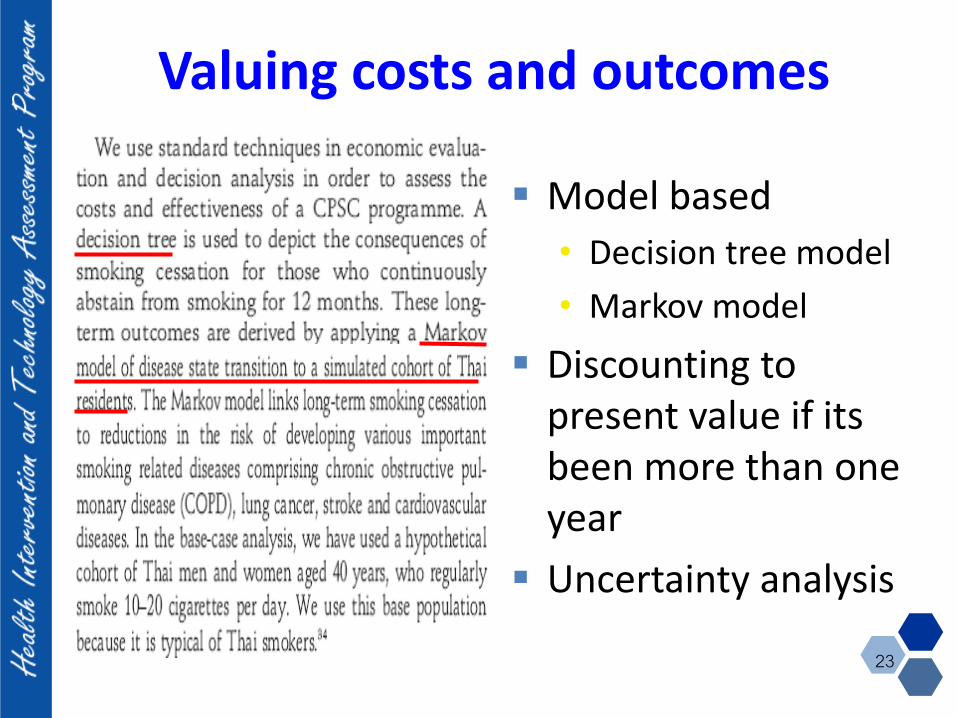
Valuing costs and outcomes
Model based
• Decision tree model
• Markov model
Discounting to present value if its been more than one year
Uncertainty analysis
23
What is an Incremental
cost-effectiveness ratio
(ICER)?
24
Interpretation and presentation of
results
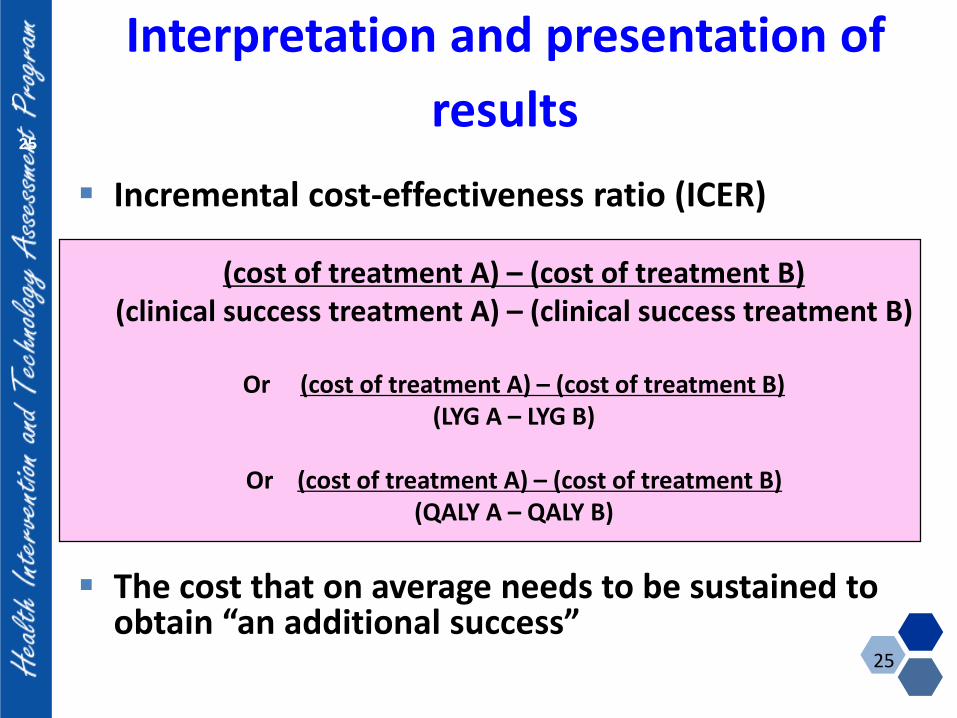
Incremental cost-effectiveness ratio (ICER)
The cost that on average needs to be sustained to obtain “an additional success”
(cost of treatment A) – (cost of treatment B)(clinical success treatment A) – (clinical success treatment B)
Or (cost of treatment A) – (cost of treatment B)(LYG A – LYG B)
Or (cost of treatment A) – (cost of treatment B)(QALY A – QALY B)
25
25
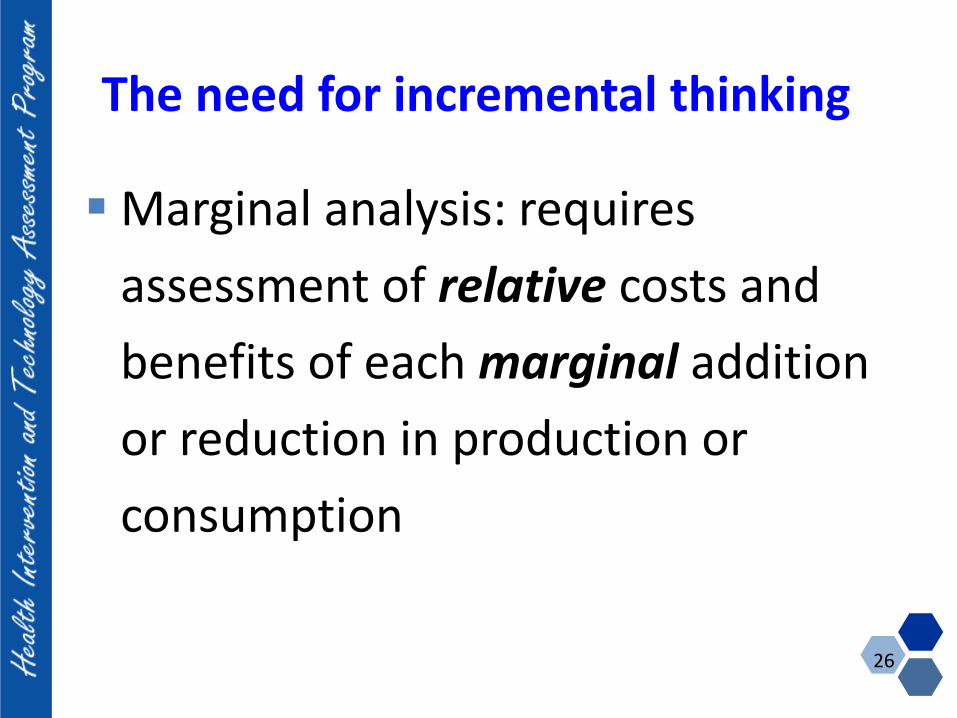
The need for incremental thinking
Marginal analysis: requires
assessment of relative costs and
benefits of each marginal addition
or reduction in production or
consumption
26
27
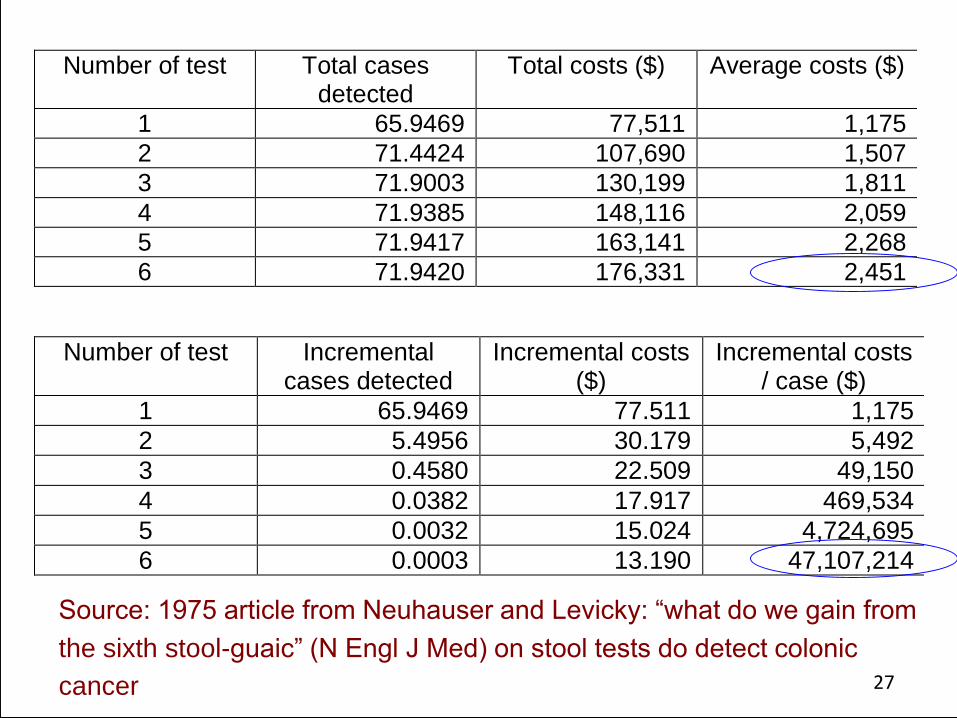
Number of test Total cases
detected
Total costs ($) Average costs ($)
1 65.9469 77,511 1,175
2 71.4424 107,690 1,507
3 71.9003 130,199 1,811
4 71.9385 148,116 2,059
5 71.9417 163,141 2,268
6 71.9420 176,331 2,451
Number of test Incremental cases
detected
Incremental costs
($)
Incremental costs /
case ($)
1 65.9469 77.511 1,175
2 5.4956 30.179 5.492
3 0.4580 22.509 49.150
4 0.0382 17.917 469.534
5 0.0032 15.024 4.724.695
6 0.0003 13.190 47.107.214
Number of test Total cases detected
Total costs ($) Average costs ($)
1 65.9469 77,511 1,175
2 71.4424 107,690 1,507
3 71.9003 130,199 1,811
4 71.9385 148,116 2,059
5 71.9417 163,141 2,268
6 71.9420 176,331 2,451
Number of test Incremental cases detected
Incremental costs ($)
Incremental costs / case ($)
1 65.9469 77.511 1,175
2 5.4956 30.179 5,492
3 0.4580 22.509 49,150
4 0.0382 17.917 469,534
5 0.0032 15.024 4,724,695
6 0.0003 13.190 47,107,214 Source: 1975 article from Neuhauser and Levicky: “what do we gain from
the sixth stool-guaic” (N Engl J Med) on stool tests do detect colonic
cancer 27
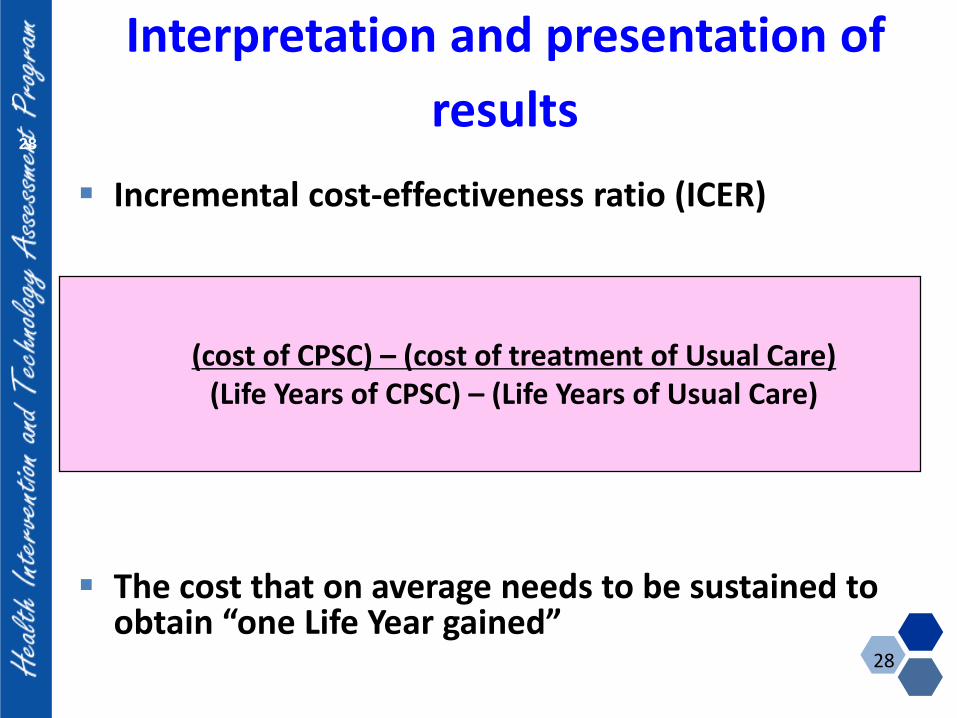
Interpretation and presentation of
results
Incremental cost-effectiveness ratio (ICER)
The cost that on average needs to be sustained to obtain “one Life Year gained”
(cost of CPSC) – (cost of treatment of Usual Care)(Life Years of CPSC) – (Life Years of Usual Care)
28
28
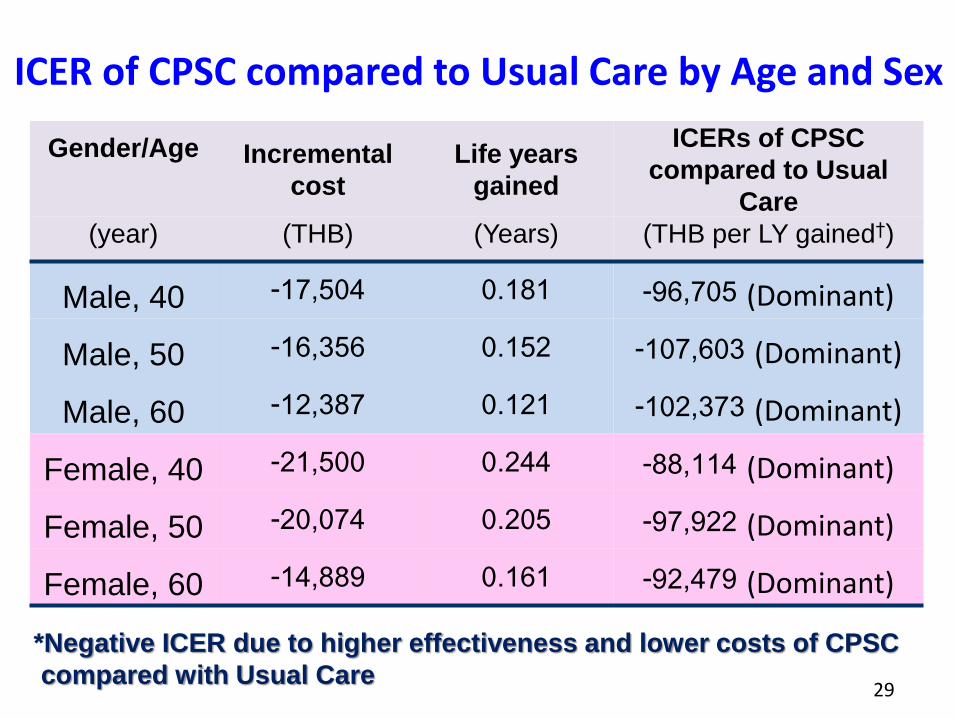
ICER of CPSC compared to Usual Care by Age and Sex
Gender/Age Incremental
cost
Life years
gained
ICERs of CPSC
compared to Usual
Care
(year) (THB) (Years) (THB per LY gained†)
Male, 40 -17,504 0.181 -96,705 (Dominant)
Male, 50 -16,356 0.152 -107,603 (Dominant)
Male, 60 -12,387 0.121 -102,373 (Dominant)
Female, 40 -21,500 0.244 -88,114 (Dominant)
Female, 50 -20,074 0.205 -97,922 (Dominant)
Female, 60 -14,889 0.161 -92,479 (Dominant)
*Negative ICER due to higher effectiveness and lower costs of CPSC
compared with Usual Care29
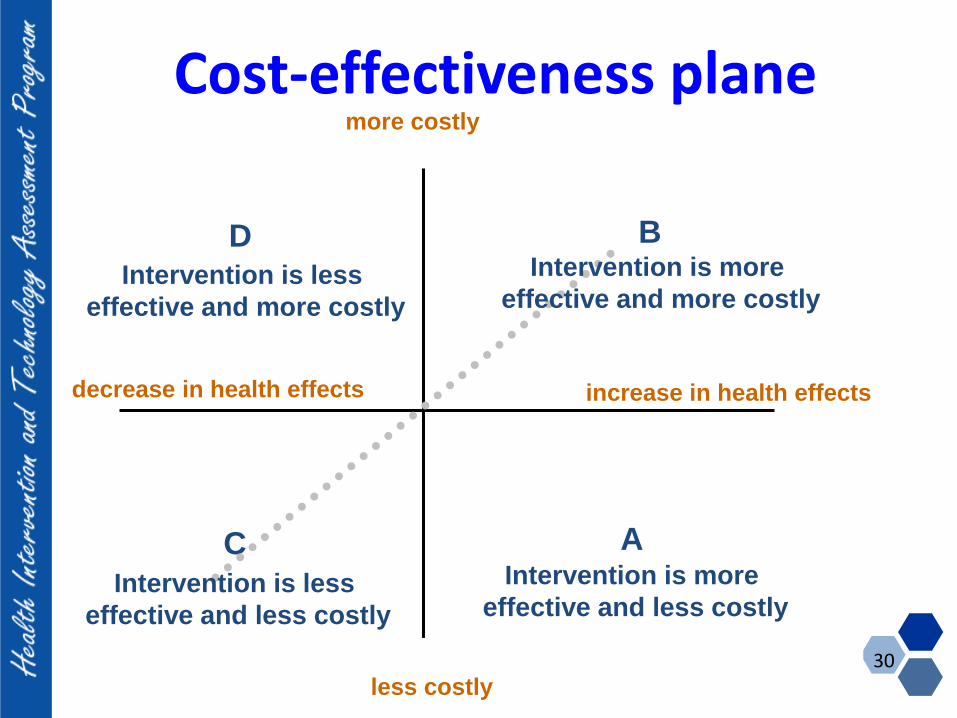
B
A
D
C
increase in health effects
more costly
less costly
Intervention is less
effective and more costly
Intervention is more
effective and more costly
Intervention is less
effective and less costly
Intervention is more
effective and less costly
Cost-effectiveness plane
decrease in health effects
30
Conclusions
31
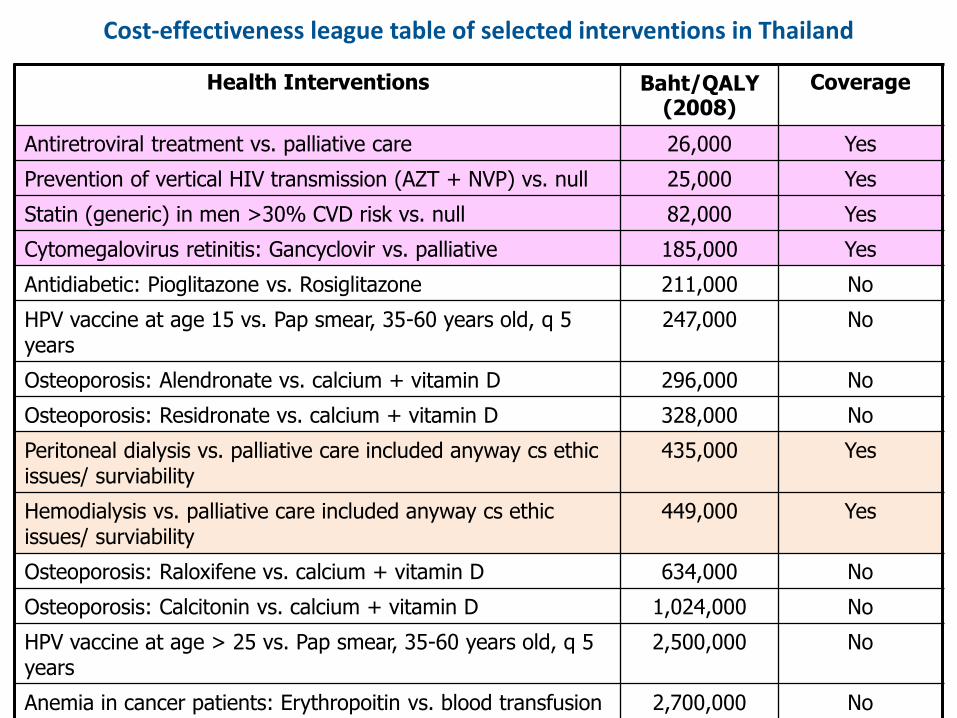
Cost-effectiveness league table of selected interventions in Thailand
Health Interventions Baht/QALY (2008)
Coverage
Antiretroviral treatment vs. palliative care 26,000 Yes
Prevention of vertical HIV transmission (AZT + NVP) vs. null 25,000 Yes
Statin (generic) in men >30% CVD risk vs. null 82,000 Yes
Cytomegalovirus retinitis: Gancyclovir vs. palliative 185,000 Yes
Antidiabetic: Pioglitazone vs. Rosiglitazone 211,000 No
HPV vaccine at age 15 vs. Pap smear, 35-60 years old, q 5 years
247,000 No
Osteoporosis: Alendronate vs. calcium + vitamin D 296,000 No
Osteoporosis: Residronate vs. calcium + vitamin D 328,000 No
Peritoneal dialysis vs. palliative care included anyway cs ethic issues/ surviability
435,000 Yes
Hemodialysis vs. palliative care included anyway cs ethic issues/ surviability
449,000 Yes
Osteoporosis: Raloxifene vs. calcium + vitamin D 634,000 No
Osteoporosis: Calcitonin vs. calcium + vitamin D 1,024,000 No
HPV vaccine at age > 25 vs. Pap smear, 35-60 years old, q 5 years
2,500,000 No
Anemia in cancer patients: Erythropoitin vs. blood transfusion 2,700,000 No
Transtuzumab in breast cancer 5,051,000 No