Embed Size (px)
Citation preview
Cambridge, MA Lexington, MA Hadley, MA Bethesda, MD Chicago, IL
Abt Associates Inc. 55 Wheeler Street Cambridge, MA 02138
Assessing Changes in Nonprofit Capacity— Outcome Study of the Compassion Capital Fund Demonstration Program
June 11, 2010 Final
Prepared for Office of Community Services Administration for Children and Families U.S. Department of Health and Human Services
Prepared by Abt Associates Inc. Branch Associates Inc

Contents
I. Introduction ................................................................................................................................. 1 The CCF Demonstration Program Evaluation..........................................................................1
II. Program Context........................................................................................................................ 3 Characteristics of Intermediaries ............................................................................................. 3 Profile of NPOs at Baseline..................................................................................................... 3 Services Provided to NPOs...................................................................................................... 4
III. Overview of Changes in Organizational Capacity...................................................................7 Strengthening Organizational Capacity.................................................................................... 7 Strengthening Service Delivery Capacity............................................................................... 13
IV. Capacity Changes by Organizational Characteristics ........................................................... 14
V. Summary and Conclusions....................................................................................................... 15
Appendix: Methodological Summary.........................................................................................A-1 The Evaluation of the Compassion Capital Fund Demonstration Program............................A-1 Analysis Methods................................................................................................................A-2
Technical Appendix Report Appendix I: Baseline and Follow-up Data Collection Appendix II: Background Information Appendix III: Item Analysis Tables Appendix IV: Subgroup Analysis Tables Appendix V: Baseline Survey Appendix VI: Follow-up Survey
Abt Associates Inc. Contents

List of Exhibits
Exhibit 1: Areas of Organizational Capacity Identified by Intermediaries as Needing Attention ......... 4 Exhibit 2: Distribution of Technical Assistance Hours ....................................................................... 5 Exhibit 3: Distribution of Training Hours .......................................................................................... 5 Exhibit 4: One-on-One Technical Assistance Received by NPOs from Intermediaries ....................... 6 Exhibit 5: One or Two Individuals Served as Head of Organization (compared to 3 or more) ............ 7 Exhibit 6: Organizations with Written Strategic Plans........................................................................ 8 Exhibit 7: Changes in Recordkeeping Practices ................................................................................. 9 Exhibit 8: Organizations Applying for / Obtaining Federal Funds for the First Time ........................ 10 Exhibit 9: Changes in Primary Activities of the Board ..................................................................... 11 Exhibit 10: Changes in Community Linkages .................................................................................. 12 Exhibit 11: Average Number of Service Recipients during Prior Month........................................... 13 Exhibit 12: Changes in Staffing ....................................................................................................... 13 Exhibit 13: Subgroup Distributions ................................................................................................. 14
Exhibit A-1: Outcomes Follow-up Study Sample Reconciliation ................................................... A-2
Abt Associates Inc. Contents

Abt Associates Inc. Outcome Study Final Report 1
I. Introduction
The Compassion Capital Fund (CCF), established by Congressional appropriation in 2002, is a keycomponent of President Bush’s Faith-Based and Community Initiative. CCF is administered throughthe Office of Community Services, Administration for Children and Families (ACF) within theDepartment of Health and Human Services. The primary purpose of CCF is to help nonprofitorganizations (NPOs) increase their organizational effectiveness, enhance the quality and volume ofservices delivered, diversify their funding sources, and create collaborations to better serve those inneed.
A major component of CCF is the Demonstration program. The CCF Demonstration program fundsintermediary organizations that serve as a bridge between the federal government and NPOs,providing grassroots faith-based and community organizations with three types of capacity buildingassistance: training, technical assistance, and financial sub-awards.
The CCF Demonstration Program Evaluation
Consistent with ACF’s emphasis on performance measurement and accountability, the agency hascontracted with Abt Associates and its partner, Branch Associates, to evaluate the outcomes andeffects of the Demonstration program. This report presents the key findings from the Outcome Study,which collected information from NPOs receiving technical or financial assistance services from 44intermediary grantees initially funded in the 2003, 2004, and 2005 CCF grant cycles. A subsequentImpact Study report will examine participants in the 2006 grant cycle.
A baseline survey for the Outcome Study was completed by 1,221 NPOs selected for services by theintermediaries in fall 2005. The survey consisted of 70 questions about basic organizationalcharacteristics, areas of service, and organizational capacity in areas such as financial management,fundraising, human resources, governance, recordkeeping, and community engagement. A similarfollow-up survey, asking about services received from the intermediary and other non-CCF fundedorganizations, was administered between August 2007 and February 2008, approximately 15 monthsafter the NPOs began receiving services from the intermediaries. A total of 835 NPOs completed thefollow-up survey for a response rate of 70 percent.1
Information from the baseline and follow-up surveys allows us to describe the extent of changes inorganizational and service delivery capacity reported by the NPOs over the 15-month period.2
1 For analysis purposes, the respondent follow-up sample was weighted so organizational size, as measuredby number served and annual expenditures, corresponds with characteristics of the baseline sample. Theseweights were applied in all analyses reported in the “Services Received by NPOs” and “Overview ofChanges in Organizational Capacity” sections below. Additional information on the analysis weightingmethodology, as well as on the baseline and follow-up data collection efforts, can be found in Appendix A.
2 Results from all analyses, as well as copies of the survey instruments used, are available in a companionTechnical Appendix Report.

Abt Associates Inc. Outcome Study Final Report 2
Limitations of the Outcome Study
CCF-funded intermediaries provided TA, training and financial assistance (sub-awards) to NPOs. Forthis Outcome Study’s purposes, we selected those NPOs that were to receive intensive services (TAand sub-award), in addition to training. Those that received only training were not included in thestudy.
This study provides estimates of change over time in various areas of organizational capacity amongfaith-based and community organizations that received sub-awards and/or one-on-one technicalassistance from CCF-funded intermediaries. However, the changes reported cannot be directlyattributed to the services provided by the CCF intermediary grantees.
The changes reported may be due to a variety of factors. For example, it is possible that organizationsseeking assistance to improve organizational capacity may already be on a growth trajectory,Reported changes may also be caused by external factors such as growing or shrinking fundingsources between the two survey periods. Because there is no comparison or control group, it is notknown what outcomes would have occurred in the absence of intermediary services.
Further, although the lessons learned through the study are useful for CCF program officials,policymakers, and others interested in nonprofit growth and sustainability, organizations in the studyare not a representative sample of the universe of NPOs in the larger CCF program or nationwide.Finally, the findings presented are based on NPOs’ self-reported information; there was noindependent validation of organizational capacity.
Overview of Report
The remainder of the report presents key findings of differences3 on selected measures oforganizational capacity between baseline and follow-up surveys reported by faith-based andcommunity organizations. The second section of the report presents information about thecharacteristics of CCF intermediary grantees and NPOs, and summary information about the capacitybuilding services received. The third section presents findings on changes in various domains oforganizational and service delivery capacity reported by NPOs over the course of the study. Thefourth section presents outcome findings for sub-groups of organizations categorized by organizationtype, age, size, and executive director compensation status (paid or unpaid). The final section presentsconclusions from the Outcome Study.
3 Unless noted in the report, only statistically significant changes are presented.

Abt Associates Inc. Outcome Study Final Report 3
II. Program Context
Characteristics of Intermediaries
The 44 intermediary grantees in the study were surveyed during the summer of 2007. Forty-tworesponses were received. Two-thirds of the intermediaries indicated they were secular organizations;the remaining one-third indicated they were faith-based. About half (49 percent) 4 reported that theywere also providers of direct social services. Others classified themselves as consulting organizations(20 percent), university-based (19 percent), or public agencies (2 percent). The remaining 10 percentwere nonprofit associations, tribal organizations, or a combination of social service, consulting andadvocacy agencies. The CCF intermediaries reported annual operating budgets ranging from$550,000 to $971,000,000. Ninety-three percent had budgets of over $1 million and the medianbudget was $3,500,000.
The intermediary grantees had experience providing assistance to other organizations—more thannine out of ten reported they had provided technical assistance (91 percent) and group training (95percent) prior to receipt of CCF funding. It was less common, however, for intermediaries to haveprior experience providing financial awards to other organizations; only 60 percent had previousexperience in this area. The number with prior experience in providing assistance specifically relatedto organizational capacity building was somewhat lower—77 percent had previously providedcapacity-related technical assistance and 46 percent had provided capacity-related financialassistance. The CCF grant was the first federal grant or contract for about one-quarter (28 percent) ofthe intermediaries.
Under the CCF Demonstration grant, intermediaries are allowed flexibility in determining the numberof organizations and the geographic areas they serve. Given the option of classifying their serviceapproach as one that “provides a limited number of organizations with as much time and resources aspossible” or one that “serves as many organizations as possible,” about half of the intermediaries (55percent) chose the first category and 45 percent chose the second. Reflecting this variation inapproach to service delivery, there was a sizeable range in the number of organizations intermediariesreported serving annually. About one-quarter (23 percent) served 30 or fewer NPOs and, at the otherend of the scale, just over one-quarter (26 percent) served more than 150 organizations.
Geographically, some intermediaries targeted CCF services to NPOs in specific neighborhoods (12percent) or a single city (16 percent). Others served one or more counties (31 percent), entire states(30 percent), or multiple cities across the country (12 percent).
Profile of NPOs at Baseline
NPOs completed a baseline survey at the time they applied for financial or technical assistance fromone of the CCF intermediary grantees in the study. At that time, NPOs reported diverse organizationalexperience and history. The median “age” of organizations was 7 years. Just over one-quarter (28percent) had been in operation for fewer than 5 years, while 15 percent had been in operation for 25
4 All numbers in the report have been rounded to the largest whole number, unless rounding would mask ameaningful data point. In these instances, the minimum number of decimal points has been provided toensure clarity.

Abt Associates Inc. Outcome Study Final Report 4
years or more. All reported that they were nonprofit organizations and almost three-quarters oforganizations (72 percent) reported having 501(c)(3) status. The remaining organizations reportedthey were in the process of obtaining 501(c)(3) status (15 percent), were hosted by a 501(c)(3) fiscalagent (10 percent), were unincorporated without a host (6 percent), or classified their legal status as“other” (7 percent).
The number of clients served and the size of organizational budget varied among NPOs. Some NPOshad not yet served any clients, while others reported serving thousands of individuals or families permonth. The median number of clients served per month was 88. The NPOs reported annualorganizational expenditures ranging from $0 to $75 million. The median expenditure level reportedfor the prior fiscal year was $70,000.
The organizations were programmatically diverse as well, with approximately two-thirds (67 percent)reporting that they provided services in three or more social service areas. Two programmatic areasstood out as the most common: at-risk youth/children and youth services (70 percent) and educationalservices (51 percent).
Services Provided to NPOs
Each intermediary provided training and technical assistance on multiple topics (e.g., leadershipdevelopment, organizational development, program development, and community engagement).These topics closely aligned with the intermediary’s understanding of NPOs’ critical organizationalcapacity needs, particularly fund development, funding sustainability, and improved governance (seExhibit 1).
e
Exhibit 1: Areas of Organizational Capacity Identified by Intermediaries as Needing Attention
% of Intermediaries Ranking the Area asMost Critical/Needing AttentionAreas
Fund development/sustainability 81%Improved governance/Board of Directors 57%Financial management skills/systems 40%Leadership/management skills 36%Methods to assess program outcomes/effectiveness 29%Strategic/long-term planning 26%Community partnerships 10%Understanding federal grant policies/rules 7%Use of technology 7%Attaining 501(c)(3) status 5%Source: Intermediary survey. Multiple responses allowed.
Individual NPOs did not necessarily receive training or technical assistance on all of the topicsoffered by a given intermediary. Instead, the intermediary determined which technical assistancetopics would be addressed with each organization based on two key factors: results from a formalorganizational assessment, and the organization’s stated interests.

Abt Associates Inc. Outcome Study Final Report 5
The intermediary survey showed that therewas substantial variation in the number ofhours of technical assistance provided. Thesurvey results indicate that over a third (37percent) of the NPOs were provided 8 orfewer hours of technical assistance whileabout one in ten were provided 100 hoursor more (Exhibit 2).
Exhibit 2: Distribution of Technical Assistance Hours
More than 200hours8%101-200 hours
3%
51-100 hours21%
8 hours or less37%
21-50 hours23%
9-20 hours19%
Source: Intermediary Survey
Similarly, the intermediary survey revealedsubstantial variation in the amount oftraining provided to NPOs. While about 40percent of organizations were providedmore than 30 hours, 37 percent wereprovided less than 4 hours. (Exhibit 3).
Exhibit 3: Distribution of Training Hours
More than 50hours13%
31-50 hours26%
4 hours or less37%
11-30 hours
5-10 hours22%
22%
Source: Intermediary Survey
About half (53 percent) of theintermediaries reported that allorganizations received training on the sametopics; the other half (47 percent) reportedthat organizations chose which trainingworkshop topics/sessions to attend. Abouthalf of the intermediaries (53 percent) saidthey offered separate training workshops orsessions geared to organizations at differentlevels of capacity.
To supplement the information fromintermediaries on the services provided, NPOs were asked to describe all the capacity buildingservices they received, including services received from CCF intermediaries as well as from others,within the 12 months prior to the follow-up survey. The survey listed specific capacity building areasand asked that organizations indicate the number of hours of training or technical assistance and ratethe helpfulness of the services.
Overall, NPOs received the greatest amount of assistance in the areas of Resource Development andFundraising, Board Development, and Becoming a 501(c)(3). Within a given area of capacity, NPOstaff may have received assistance through participation in one-on-one technical assistance, grouptraining, coaching or mentoring, college courses, or other modes of service delivery.
Many of these hours were provided in the form of one-on-one technical assistance (TA). Exhibit 4presents the average number of hours of TA NPOs reported receiving from a CCF intermediary ineach of the capacity areas.

Abt Associates Inc. Outcome Study Final Report 6
The period covered by the study was not thefirst time some NPOs had worked with theintermediary. A little over one-third (37percent) of the organizations had receivedtraining or technical or financial assistancefrom the intermediary in the past. Among theNPOs with a prior relationship with a CCFintermediary, over three-quarters (78 percent)had previously received training, over half (56percent) had received financial assistance, and40 percent had received technical assistance.
Most NPOs received assistance from CCFintermediaries and from other organizationsacross a variety of capacity building areas.When comparing the amount of assistance received from CCF intermediaries and others, NPOsreported receiving more hours of assistance in Board Development and Becoming a 501(c)(3) fromintermediaries, and more hours of assistance in Strategic Planning and Program Design from otherorganizations. For the remaining five content areas covered by the survey, NPOs reportedapproximately the same number of hours of assistance from both sources.5
NPOs were also asked how helpful the different types of capacity building services were. On average,the organizations found the services to be quite helpful (each type received an average score of 4 to4.5 on a scale of 1 to 5, where 5 is “very helpful”). NPOs rated the helpfulness of services from bothintermediaries and other organizations about the same.
5 It was unexpected that NPO would receive similar levels of assistance from other entities or organizationsas from the intermediaries. Follow-up calls to some survey respondents indicated that some NPOsclassified services provided through support from the CCF intermediary (e.g., consultants or otherproviders contracted by the intermediary) as services from “another organization.”
Exhibit 4: One-on-One Technical AssistanceReceived by NPOs from Intermediaries
Average #of hoursArea of Capacity Building
Board development 30Resource development and fundraising 27Program design 19Becoming a 501(c)(3) 17Human resources and volunteermanagement
17
Financial management 15Networking, collaboration, andpartnerships
15
Evaluation and outcome measurement 12Strategic planning 12Source: Outcome Study NPO Follow-up Survey

Abt Associates Inc. Outcome Study Final Report 7
III. Overview of Changes in Organizational Capacity
Below is a summary of results in keydomains of capacity building for the entiresample. Findings for sub-groups oforganizations are presented in the followingsection. Overall, analysis shows thatsignificant, positive changes occurred in 72percent of the survey items.
As noted earlier, a finding of a significantchange is not evidence of a causal effect ofthe services provided by the CCFintermediaries because we have no basis forestablishing what would have happenedanyway over the period of the study. Wecan assume that, to some extent, NPOs thatsought organizational capacity buildingassistance from CCF intermediary granteeswere very interested in improving theirorganizational capacity and would haveworked on these areas even without CCF-supported services. Because of the absenceof measures of change over time among alike group of NPOs (a control group) that did not receive CCF intermediary services, there is no basisfor attributing the changes observed specifically to the intermediary services.
Understanding Statistical Significance
In the following sections, survey results are presented thatcompare organizations' responses at baseline to their responses atfollow-up. All differences presented in the text are “statisticallysignificant,” meaning that it is quite unlikely that the differencesarose by chance.
For each significant difference observed, statistical testingconfirmed, with at least 95 percent confidence, that the changesreported are true and do not exist in the sample of NPOs merelyby chance. Although we cannot determine the cause of thesechanges, we can say for certain that the changes are real and existin the population of NPOs to which this study extends.
The precise level of confidence is indicated in each graph. If thetesting revealed that there was less than a 5 percent probabilitythat changes occurred simply by chance, there will be one star (*);if the probability was less than 1 percent there will be two stars(**). If there is no star the change was not statistically significant.
In addition to the statistically significant changes presented below,there were also survey items where no statistically significantdifferences were observed between baseline and follow-up. Acomplete set of survey data and results of significance testing canbe found in the Technical Appendix.
Strengthening Organizational Capacity
Organizational Structure
The study found improvements inleadership stability and legal status. Atfollow-up, 98 percent of organizationshad had only one or two individualsserve as the head (compared to three ormore) during the prior year, ascompared to 89 percent at baseline.(Exhibit 5). This is a substantialimprovement and reflects increasedstability in the leadership of theorganizations. There was no change inwhether the head of the organizationwas a paid position.
Exhibit 5: One or Two Individuals Served as Head ofOrganization in Prior Year (compared to 3 or more)
98%
89%
0% 20% 40% 60% 80% 100%
Number of
Organizations**
BaselineFollow -up
* p-value < 0.05** p-value <0.01Source: Outcome Study NPO Follow-up Survey

Abt Associates Inc. Outcome Study Final Report 8
Long-Term Planning
Organizational capacity for long-termplanning also increased between thebaseline and follow-up surveys. Asshown in Exhibit 6, the percent oforganizations with written strategicplans increased from 46 percent atbaseline to 70 percent at follow-up.
The number of organizations withwritten mission statements alsoincreased, although to a much smallerdegree, from 96 percent to 97 percent.Further, organizations (79 percent atfollow-up compared to 49 percent atbaseline) reported conducting moreassessments of organizational strengthsor needs than at baseline; of organizations that completed assessments, more used an external entityto conduct or guide the assessment (65 percent at follow-up compared to 54 percent at baseline).
Exhibit 6: Organizations with Written Strategic Plans
70%
46%
0% 20% 40% 60% 80% 100%
Number of
Organizations**
BaselineFollow -up
* p-value < 0.05** p-value <0.01Source: Outcome Study NPO Follow-up Survey
Staff Management
More organizations formalized human resource policies or implemented staff managementprocedures by the time of the follow-up survey. In addition, more organizations conducted annualperformance reviews for paid staff (73 percent at follow-up compared to 68 percent at baseline); andmore organizations had written job descriptions for each paid staff position (89 percent at follow-upcompared to 85 percent at baseline) and for unpaid staff positions (60 percent at follow-up comparedto 51 percent at baseline). There was no change in the number of organizations that conductedreviews for volunteer staff.
Tracking Outcomes and Keeping Records
In general, more organizations instituted methods to track outcomes. The percent of organizations thatformally measured service outcomes increased from 56 to 69 percent. Additionally, moreorganizations (87 percent at follow-up compared with 78 percent at baseline) reported that theysought regular feedback from recipients on service satisfaction.
Organizations reported improvements in four of five recordkeeping measures related to servicedelivery (Exhibit 7). The fifth measure, recording the number of families or individuals enrolled orserved, was high at the baseline, and did not significantly change.

Abt Associates Inc. Outcome Study Final Report 9
Exhibit 7: Changes in Recordkeeping Practices
Organization keeps records on…% Yes(Pre)
% Yes(Post)
Differencebetween Pre and
PostClient referral sources 63 74 11 **Needs of individuals/families upon first contact with the program 74 81 7 **Types of services provided to individuals/families 84.4 89.7 5.3 **Number of individuals or families enrolled in / served through programs 94 96 2Individual service recipients' outcomes 71 82 11 *** p-value < 0.05** p-value <0.01Source: Outcome Study NPO Follow-up Survey
Technology Access and Use
On average, by the time of the follow-up survey more organizations used technology to supportprogram operations. Within the full sample, more organizations acquired Internet access (an increasefrom 95 to 97 percent). Also, at the follow-up, 95 percent of organizations reported using the Internetto support organizational activities, compared to 90 percent at baseline. The ways in whichorganizations used the Internet also changed. Overall, we found that more organizations reportedusing the Internet to support the organizational website, to learn about funding opportunities, and togather information needed to write grant applications. The percent of organizations with staffproficient in computer and software use also increased, from 67 percent to 80 percent.
Diversified Funding
Survey analysis revealed mixed results related to revenue development capacity. On the one hand,more organizations hired grant writers to prepare funding applications (30 percent at follow-upcompared to 27 percent at baseline) and to train staff to prepare funding applications (16 percentcompared to 9 percent). However, the percentage of organizations reporting that they sought orobtained funding from new sources decreased. The percentage seeking funds from new sourcesdeclined from 75 percent at baseline to 67 percent at follow-up. The percentage reporting that theyobtained funding from a new source in the prior year decreased from 74 percent at baseline to 57percent at the time of the follow-up.

Abt Associates Inc. Outcome Study Final Report 10
With regard to federal funding, weexamined whether there was a changeamong organizations that had neverapplied for a federal grant at the time ofthe baseline survey. Among the 439organizations that indicated they hadnever applied for federal funds at thetime of the baseline survey, 32 percent6
reported having applied for federalgrants and 20 percent7 reported havingreceived federal funding by the time ofthe follow-up survey (Exhibit 8).
Exhibit 8: Organizations Applying for / Obtaining Federal Fundsfor the First Time
20%
32%
0% 20% 40% 60% 80% 100%
Obtained
Applied
Follow-up
Source: Outcome Study NPO Follow-up Survey
Additional analysis examined whetherthis increase in the number ofapplications for federal funds might havebeen offset by a decrease in applications to other grant sources among this group. The results showedthat organizations that had not previously applied for federal funds at the time of baseline reported anoverall increase in the total number of grant applications submitted to any source by the time offollow-up; the mean number of grant applications at baseline was 3.38 and the mean number of grantapplications at follow-up was 7.40. The same pattern held true for number of grants approved—therewas an increase in the number of grants approved for these organizations.
For the full sample, the number of applications approved by non-federal funders—state or localgovernment agencies, foundations, or federated giving groups such as the United Way—decreasedslightly between the baseline and follow-up surveys. In contrast, the number of applications approvedby federal agencies increased slightly, although significantly, from an average of 0.30 applications to0.38 applications per year.
On average the total amount of funds received from non-federal funders decreased between thebaseline and follow-up periods. Funds from state or local government agencies decreased by about$25,000, funds from foundations decreased by about $13,000, and funds from other federated givinggroups decreased by approximately $4,000. While the average amount of funds from these sourcesdecreased for the full sample, 129 organizations reported increases in state or local grant funding, 173organizations had increases in foundation grant funding, and 55 organizations had increases infunding from federated giving groups.8
6 The confidence interval on the 32 percent at follow-up is [27.81, 36.59].7 The confidence interval on the 20 percent at follow-up is [16.69, 24.27].8 While the mean funding amount calculated from the full sample decreased from pre to post, about 40
percent of the sample reported increases in federal, state/local, foundation, and/or other federated givinggroups funding. Additionally, it is interesting to note that the number of applications submitted and thenumber of applications approved from each source were the same at baseline and at follow-up. This couldsuggest that the decrease in funding is not due to a lack of organizational application success, but rather dueto decreases in the amount of funds available from each source.

Abt Associates Inc. Outcome Study Final Report 11
Financial Management Systems
Two of the three items that indicate financial management capacity changed significantly between thebaseline and follow-up surveys. The percent of organizations with procedures that provide checks andbalances increased from 67 percent at baseline to 93 percent at follow-up, and the percent oforganizations that use computer software to keep financial records rose from 75 percent to 89 percent.However, the number of organizations that had had financial audits did not significantly changebetween the baseline and follow-up surveys.
Governance
Organizations reported changes in some areas of governance capacity in the 12–15 months betweenthe baseline and follow-up surveys. While the number of organizations with Boards of Directors, orwith plans for establishing a Board, did not significantly change, the roles of the Boards did change.At the time of the follow-up survey, more organizations had Boards that engaged in best practiceactivities commonly seen in well-run organizations (See Exhibit 9). The one item on whichorganizations did not report a significant change—review of financial records—was the mostprevalent activity prior to receipt of CCF services (86 percent reported that this was a primary activityat baseline).
Exhibit 9: Changes in Primary Activities of the Board
Primary Activities of the Board…% Yes(Pre)
% Yes(Post)
Differencebetween Pre and
PostOutreach to community and key stakeholders 61.35 72.80 11.45 **Develop organization's budget 55 64 9 **Recruit new board members 67 75 8 **Set goals and strategies for the organization 81 88 7 **Review performance of programs and program outcomes 64.45 69.54 5.09 *Review organization's financial records to ensure funds were properly spent insupport of the organization's mission
86 87 1
Conduct performance reviews of executive director 47 59 12 *** p-value < 0.05** p-value <0.01Source: Outcome Study NPO Follow-up Survey
The internal development of Boards through formal orientations and training also changed. Sixty-fourpercent of organizations offered formal orientation to Board members at follow-up, compared to 47percent at baseline. Similarly, there was an 18 percentage point increase in the number oforganizations reporting that Board member(s) participated in training related to governance or rolesand responsibilities (66 percent at follow-up, compared with 48 percent at baseline).
Community Engagement
The survey found many changes in the area of community engagement. At follow-up, moreorganizations utilized two of four methods intended to expand community awareness aboutorganizational services. Specifically, 65 percent of organizations had created or updated a website, anincrease from 50 percent at baseline, and 51 percent utilized public service announcements or paidadvertising, an increase from 43 percent at baseline. Organizations did not report significant changeson the two other methods listed in the survey, developing written materials and making presentations.

Abt Associates Inc. Outcome Study Final Report 12
More organizations also engaged in partnerships since the baseline survey. The percent oforganizations with any partnership arrangements increased from 87 percent to 91 percent. There werechanges in all of the queried purposes of these partnerships, with increases on eight of nine purposes,and a decrease on one (joint programming). As shown in Exhibit 10, the items that increased rose bybetween 4 and 11 percentage points.
Exhibit 10: Changes in Community Linkages
Partnership Characteristics% Yes(Pre)
% Yes(Post)
Differencebetween Pre and
PostPartnership arrangements with other organizations 87 91 4 **
With Government 45 46 1With Business 40 43 3With Educational institution 56.8 57.2 0.4With Secular nonprofit 72 73 1With Faith-based sector 71.41 71.27 -0.14 *
Purpose of partnerships(s):Recipient referrals 71 82 10 **Joint programming 68.2 41.6 -26.6**Funding alliance 51 59 8 **Recruit volunteers 45.3 50.6 5.3*Advocacy, awareness & education 67 74 7**In-kind donations 42.2 47.7 5.5*Assess community needs 53 61 8**Peer learning 31 39 8**Access complementary skills/knowledge 38 49 11**
* p-value < 0.05** p-value <0.01Source: Outcome Study NPO Follow-up Survey

Abt Associates Inc. Outcome Study Final Report 13
Strengthening Service Delivery Capacity
The following section describes the changes in service delivery capacity among NPOs during thestudy period. Although a causal link between infrastructure changes and improved service deliverycannot be proven, increased organizational capacity may well have contributed. Regardless of thereasons for the changes, comparison of pre and post survey responses indicates strengthened servicedelivery capacity among the NPOs receiving CCF services.
Service Delivery and Program Design
Organizations reported an increase inthe number of individuals or familiesserved. The average number ofrecipients served in the prior monthincreased from approximately 427 atthe time of the baseline survey to 686at the time of the follow-up survey(Exhibit 11). In addition, moreorganizations undertook one or moreactivities to gain an understanding ofthe needs in their service area (e.g.,meeting with constituents, communitymapping, needs assessment survey ) inthe 12 months prior to the follow-upsurvey (63 percent) compared to the 12months prior to the baseline survey (55percent). There were no significantchanges, however, in the number or scope of organizations’ programmatic areas.
9 A staff member is defined as working part-time if they work between 2 and 30 hours per week.
Exhibit 11: Average Number of Service Recipients duringPrior Month
686
427
0 100 200 300 400 500 600 700 800
Number ofRecipients*
Baseline
Follow-up
* p-value < 0.05** p-value <0.01Source: Outcome Study NPO Follow-up Survey
Exhibit 12: Changes in Staffing
Baseline(Mean)
Follow-up(Mean)
Total number of full-time paid staff ** 3 4Total number of full-time unpaid staff* 0.65 1.09Total number of part-time paid staff* 2 3Total number of part-time unpaid staff 22 24* p-value < 0.05** p-value <0.01Source: Outcome Study NPO Follow-up Survey
Level of Staffing
On average, organizations reported smallbut significant increases in staffing levels.The average number of full-time paid staffmembers increased from 3 to 4 ; part-timepaid staff increased from 2 to 3, and thenumber of full-time volunteer (unpaid) staffincreased from 0.65 to 1.09.9 The numberof part-time volunteers did not significantlychange (Exhibit 12).

Abt Associates Inc. Outcome Study Final Report 14
IV. Capacity Changes by OrganizationalCharacteristics
In order to determine if the pre/postchanges differ across groups oforganizations, we conducted analyses forsubgroups defined by four characteristicsdocumented at baseline: 1) type—whetheran organization described itself as a faith-based or secular community-basedorganization, 2) age of organization—new(formed less than six years ago) orestablished (formed six years ago or more),3) whether or not the executive directorwas a paid position, and 4) organizationsize—small (annual expenditures less than$100,000) or large (expenditures $100,000or more). This section presents key findings from the subgroup analysis.
Exhibit 13: Subgroup Distributions
SubgroupNumberin group
Percentin group
Organization TypeFaith-based organization 417 50%Secular community-based organization 409 50%
AgeLess than 6 years since formed 331 40%6 years or more since formed 498 60%
Executive Director Compensation StatusPaid 513 62%Unpaid 314 38%
Organization SizeExpenditures less than $100,000 per year 445 57%Expenditures $100,000 per year or more 332 43%
Source: Outcome Study NPO Follow-up Survey
Faith-Based and Community-Based organizations
Analyses indicate faith-based organizations (FBOs) and secular, community-based organizations(CBOs) experienced similar levels of capacity change; that is, differences observed between thesetwo groups are similar to what would be attributable to chance. Specifically, only on 8 out of 140survey items tested, were CBO and FBO outcomes found to be significantly different. This equals 5.7percent of all survey items, which is only slightly higher than our 5 percent threshold expected bychance. Therefore, we conclude that there is no strong evidence of a differential change in capacitybetween FBOs and CBOs on the domains addressed in the survey.
New and Established Organizations
For the organizational age subgroup, there were more differences than would be expected by chance,with organizational maturity seeming to influence outcomes. For example, newer organizations (thoseformed less than six years ago) were more likely than established organizations to formalize theirorganization and its processes; to report increases in plans to establish a board of directors; and tomake gains in their adoption of financial management practices such as increases in financial audits,implementation of financial management procedures, and regular use of computer software to keepfinancial records. Among established organizations (those formed six years ago or more), a highernumber began to keep electronic records on the needs of individuals or families upon first contact(prior records were in hard-copy form), and the amount of funds they received from state and localgovernment agencies, foundations, and other federated giving groups decreased.
Paid and Unpaid Executive Directors
More differences in changes from baseline to follow-up than would be expected by chance werefound between organizations with a paid executive director and those without. More organizationswith unpaid executive directors became 501(c)(3) organizations, increased utilization of computer

Abt Associates Inc. Outcome Study Final Report 15
software to keep financial records, developed materials to expand community awareness about theorganization, and entered into new partnerships in hopes of receiving client referrals from newpartners. More organizations with paid executive directors reported increases in the number of full-time paid staff, increased utilization of partnerships to recruit volunteers, and increases in keepingrecords about the needs of recipients upon first contact with the program. On the financial side,organizations with paid executive directors were more likely to receive federal funding for the firsttime, but also reported decreases in funding from state and local government agencies, foundations,and other federated giving groups.
Small and Large Organizations
Organizations with annual expenditures below $100,000 (small) and those with expenditures of$100,000 or more (large) demonstrated some differences in their organizational capacity. Smallorganizations were more likely to change their legal status to 501(c)(3), enter into new partnerships inhopes of receiving client referrals from new partners, and adopt financial management practices thatincluded implementation of external audits, adoption of procedures that provide checks and balances,and use of computer software to keep financial records. More small organizations also startedformally measuring the results and benefits of their services and experienced increases in the numberof applications approved for funding from foundations. In contrast, large organizations were morelikely to experience decreases in funding from non-federal funders. Also, large organizations that didnot have Boards of Directors were less likely to plan to establish boards than smaller organizations.Large organizations were more likely, though, to begin to keep electronic records about the needs ofrecipients upon first contact with the program.
V. Summary and Conclusions
Despite the brief 15–month follow-up interval, both FBOs and CBOs served by CCF intermediariesexperienced substantial changes in multiple areas of organizational capacity. In fact, statisticallysignificant changes were found for at least one measure in each of the substantive organizationaldevelopment areas targeted by ACF in the CCF Demonstration program.
Further, across organizations of different sizes, types, and years in existence, consistent, significantchanges were found. In most cases, small organizations, new organizations, and organizations withoutpaid executive directors reported greater increases in the formalization of internal processes than didlarge organizations, established organizations, and organizations with paid executive directors. Thedifferences found seem generally to be consistent with a “ceiling effect,” (i.e., at baseline, matureorganizations have higher measured capacity than less established organizations, which have greaterroom for change and improvement). Information gained from subgroup analysis may be useful forCCF intermediaries in targeting services based on initial organizational characteristics.
As mentioned previously, it is important to keep in mind that the changes reported may be due tofactors other than the capacity building assistance received from CCF intermediaries. Nonetheless,the study demonstrates that organizations served through the CCF Demonstration program can attainimprovements in multiple domains of organizational capacity in a relatively short time period. It islikely that improvements achieved will help put these organizations on a path to further strengthenorganizational systems and processes and to increase effectiveness and sustainability.
Abt Associates Inc. Outcome Study Final Report 16
Abt Associates is currently conducting an impact study that will provide a rigorous answer toquestions about the effectiveness of CCF Demonstration program services. Using an experimentalevaluation design, the CCF Demonstration Impact Study randomly assigns NPOs to a treatment groupreceiving assistance from CCF intermediaries or to a control group. This study design will allow forattribution of changes in capacity to the services provided by CCF intermediary grantees. The CCFDemonstration Impact Study results are expected to be available in late 2009.

Abt Associates Inc. Appendix A-1
Appendix: Methodological Summary
Below we present a detailed background on all the studies associated with the evaluation of the CCFDemonstration program, the Outcome Study’s design limitations, data collection procedures, andanalysis methods.
The Evaluation of the Compassion Capital Fund DemonstrationProgram
Consistent with the Administration’s emphasis on performance measurement and accountability,HHS has implemented a comprehensive evaluation of the CCF Demonstration program to examinethe outcomes and effects of the Compassion Capital Fund in meeting its objective of improving thecapacity of NPOs. The primary research questions to be addressed by the evaluation are as follows:
1. What type/quality of technical assistance (TA) and what sub-award amounts are theNPOs receiving from CCF-funded intermediaries?
2. In what areas of organizational capacity and for what organizational types have NPOsshown the greatest improvement (i.e., increases in organizational capacity)?
3. How effective are the TA and sub-awards in increasing organizational capacity amongNPOs?
The CCF Demonstration program evaluation comprises three components: a Retrospective Study, anImpact Study, and an Outcome Study. The first evaluation component of the CCF Demonstrationprogram was retrospective, designed to complement the longer-term evaluations. That study focusedon a sample of NPOs that received support from intermediaries funded during the 2002 CCF grantcycle. The purpose of this study was to provide some preliminary insight into the extent to whichNPOs have succeeded in utilizing CCF resources to enhance their organizational and service deliverycapacity. The results of the retrospective study have been published(http://www.acf.hhs.gov/programs/ccf/surveys/retrospective/retrospective_page1.html).10
The Impact Study is a random assignment evaluation that includes eligible NPOs that applied forservices from the ten intermediary grantees funded in FY 2006. Experimental design is considered thestrongest design for measuring program impacts. Using this approach, NPOs applying for CCFdemonstration services were assigned at random to either a program group that received CCFprogram services or to a control group that did not. Under random assignment, the program andcontrol groups differed only by chance. Therefore, any subsequent differences between the twogroups (that exceed what would be expected by chance alone) can be confidently attributed to theprogram.
The Outcome Study examines NPOs that received intensive services from 44 intermediary granteesfunded between FY 2003 and FY 2005. This study relies on a pre/post design utilizing data collectedfrom a baseline survey administered at the time of application for CCF services and a follow-upsurvey administered approximately 15 months later. The results of the Outcome Study will be
10 Abt Associates Inc., Findings from a Retrospective Survey of Faith-Based and Community Organizations(NPOs). Cambridge, MA: Abt Associates, April 24, 2007.
Abt Associates Inc. Appendix A-2
informative about the changes experienced by the participating NPOs between the study’s baselineand follow-up periods.
Analysis Methods
Creation of Weights
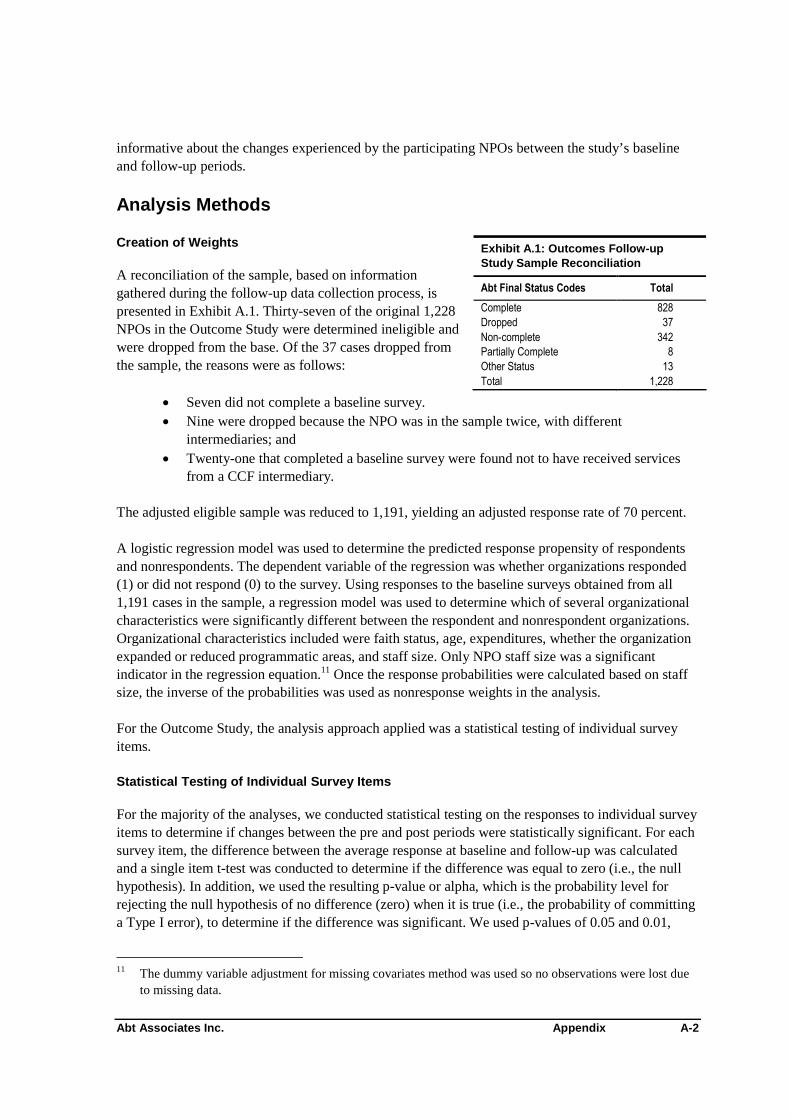
A reconciliation of the sample, based on informationgathered during the follow-up data collection process, ispresented in Exhibit A.1. Thirty-seven of the original 1,228NPOs in the Outcome Study were determined ineligible andwere dropped from the base. Of the 37 cases dropped fromthe sample, the reasons were as follows:
Exhibit A.1: Outcomes Follow-upStudy Sample Reconciliation
Abt Final Status Codes Total
Complete 828Dropped 37Non-complete 342Partially Complete 8Other Status 13Total 1,228
Seven did not complete a baseline survey. Nine were dropped because the NPO was in the sample twice, with different
intermediaries; and Twenty-one that completed a baseline survey were found not to have received services
from a CCF intermediary.
The adjusted eligible sample was reduced to 1,191, yielding an adjusted response rate of 70 percent.
A logistic regression model was used to determine the predicted response propensity of respondentsand nonrespondents. The dependent variable of the regression was whether organizations responded(1) or did not respond (0) to the survey. Using responses to the baseline surveys obtained from all1,191 cases in the sample, a regression model was used to determine which of several organizationalcharacteristics were significantly different between the respondent and nonrespondent organizations.Organizational characteristics included were faith status, age, expenditures, whether the organizationexpanded or reduced programmatic areas, and staff size. Only NPO staff size was a significantindicator in the regression equation.11 Once the response probabilities were calculated based on staffsize, the inverse of the probabilities was used as nonresponse weights in the analysis.
For the Outcome Study, the analysis approach applied was a statistical testing of individual surveyitems.
Statistical Testing of Individual Survey Items
For the majority of the analyses, we conducted statistical testing on the responses to individual surveyitems to determine if changes between the pre and post periods were statistically significant. For eachsurvey item, the difference between the average response at baseline and follow-up was calculatedand a single item t-test was conducted to determine if the difference was equal to zero (i.e., the nullhypothesis). In addition, we used the resulting p-value or alpha, which is the probability level forrejecting the null hypothesis of no difference (zero) when it is true (i.e., the probability of committinga Type I error), to determine if the difference was significant. We used p-values of 0.05 and 0.01,
11 The dummy variable adjustment for missing covariates method was used so no observations were lost dueto missing data.

Abt Associates Inc. Appendix A-3
which is the conventional practice in most social experiments.12 If the null hypothesis was rejected,then the results were considered statistically significant.
In addition, sub-group analysis was conducted to determine if there were statistically significantdifferences in the change between pre and post periods for certain subsamples defined by fourbaseline characteristics: organization type, age, executive director compensation, and organizationsize. Using a separate regression model for each outcome and sub-group, we calculated whether thedefining characteristic of each sub-group was a significant predictor of the survey item change scoresbetween baseline and follow-up. We used the resulting p-value or alpha, which is the probability levelfor rejecting the null hypothesis of no difference between the levels of the sub-groups when it is true,to determine if the scores were significantly different. Again, we used p-values of 0.05 and 0.01. Ifthe null hypothesis was rejected, then the item changed differently across the levels of the sub-group.
12 Knoke, D. and Bohrnstedt, G.W., Basic Social Statistics. Washington, DC: F.E. Peacock, 1991.