Embed Size (px)
Citation preview

Assessing assessment: the role of student effort in comparative studies
Ray Adams Jayne Butler
2
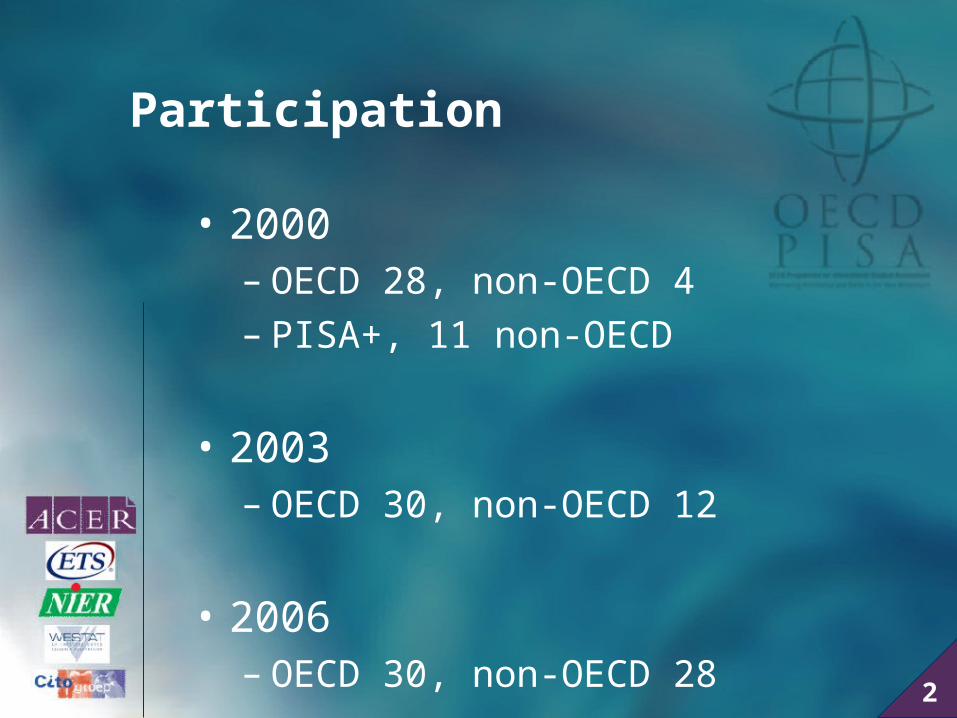
Participation
• 2000– OECD 28, non-OECD 4– PISA+, 11 non-OECD
• 2003– OECD 30, non-OECD 12
• 2006– OECD 30, non-OECD 28

3
Content
Coverage of domains
• Reading literacy
• Mathematical literacy
• Scientific literacy
4
Methods
Pencil and paper test
• Multiple choice questions
• Constructed responses
Student background questionnaire
School Principal survey
5
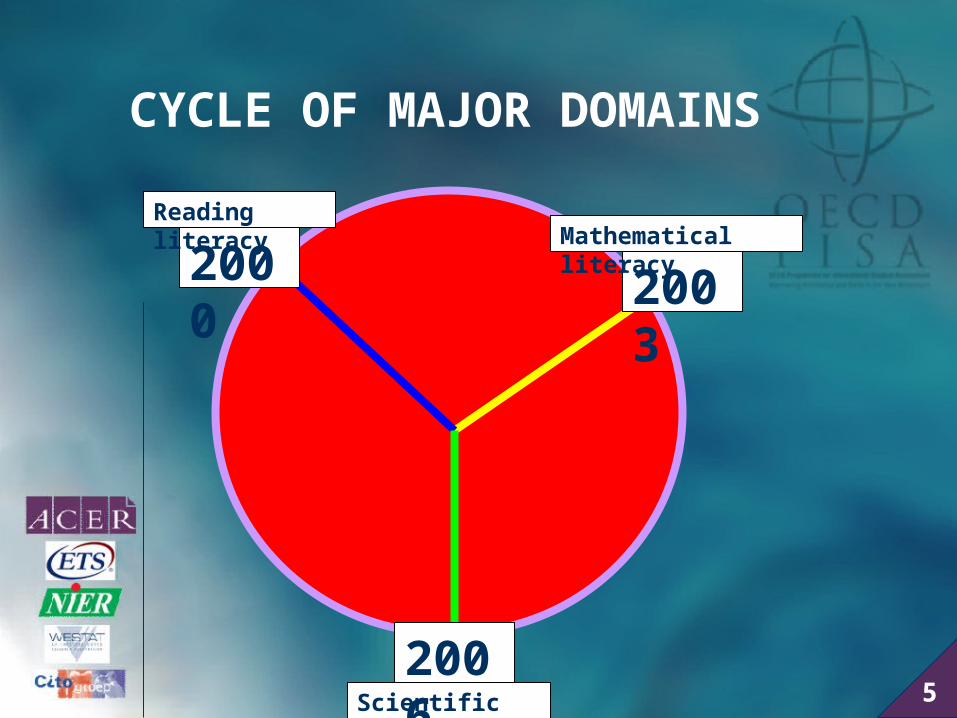
CYCLE OF MAJOR DOMAINS
2000 2003
Reading literacyMathematical literacy
Scientific literacy
2006

6
PISA outcomes
• Profiles of knowledge and skills
• Contextual indicators
• Trends and league tables

7
Instructions to students before the testYou have been chosen to take part in an important international education study. This study is called the Programme for International Student Assessment, ‘PISA’ for short. Its goal is to find out what students your age all around the world know about reading, mathematics and science. There are about <number of> students representing <country>. Around the world there are about 200,000 students involved, from more than 7000 schools in 40 countries. The results of the study will help countries determine what students are learning. Because the study may affect students all over the world in the future, we ask that you do the very best that you can.

8
Instructions to students at the end of the cognitive session
Please stop.
Now turn to the last page or so in your booklet, where there is a question about calculator use and a question about effort. Please answer these now, and then close your booklet.

9
The Effort Thermometer
How much effort did you invest?
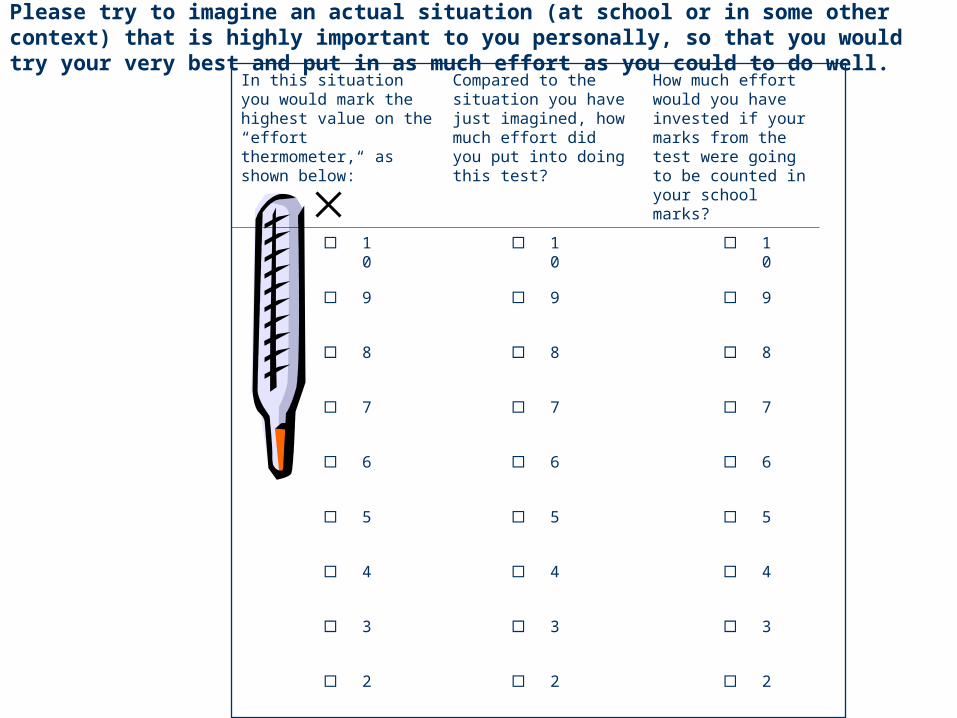
Please try to imagine an actual situation (at school or in some other context) that is highly important to you personally, so that you would try your very best and put in as much effort as you could to do well.
In this situation you would mark the highest value on the “effort thermometer,“ as shown below:
Compared to the situation you have just imagined, how much effort did you put into doing this test?
How much effort would you have invested if your marks from the test were going to be counted in your school marks?
10 10 10
9 9 9
8 8 8
7 7 7
6 6 6
5 5 5
4 4 4
3 3 3
2 2 2
1 1 1

11
Combined sample sizes for Country X and Y
Year No of students
2000 9597
2003 15997
Total 25594
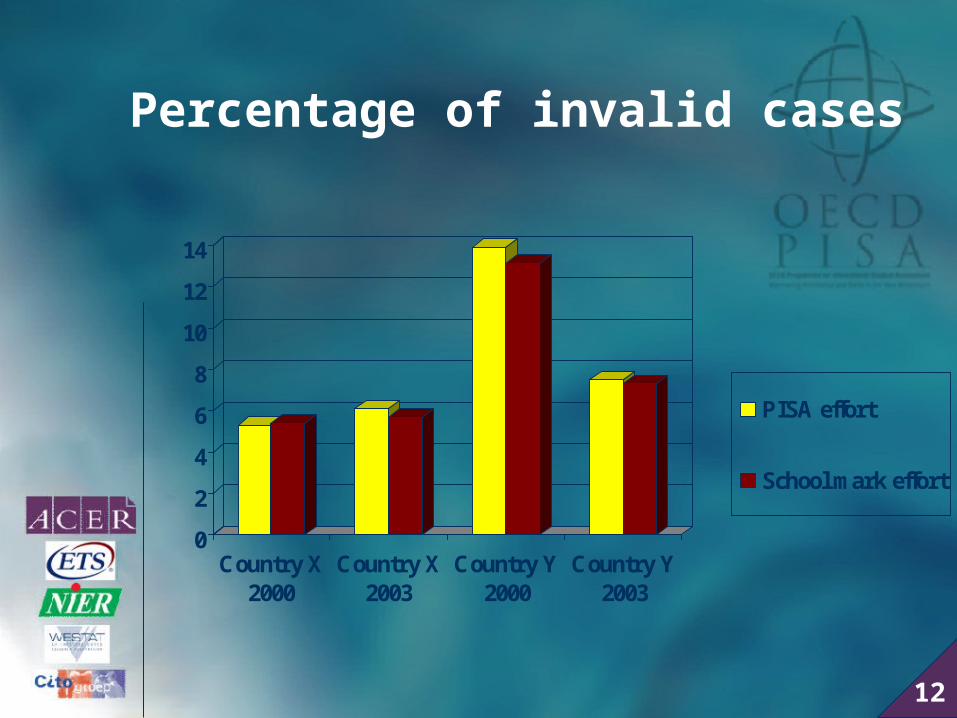
12
Percentage of invalid cases
0
2
4
6
8
10
12
14
Country X2000
Country X2003
Country Y2000
Country Y2003
PISA effort
School mark effort

13
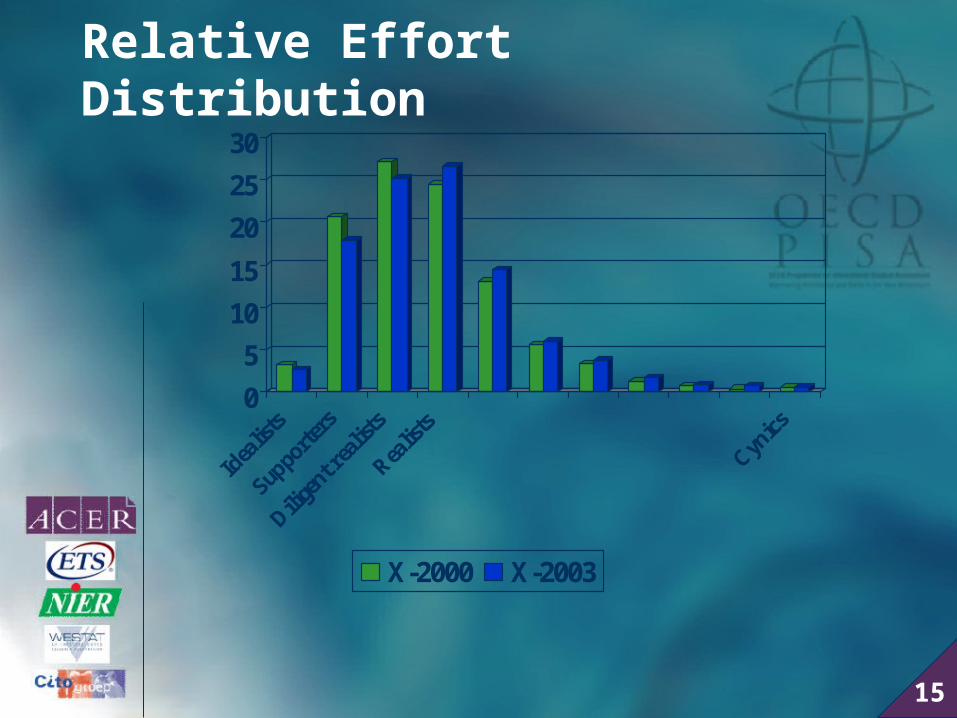
New variable
Relative Effort = School mark effort – PISA effort
Idealists: negative relative effort
Supporters: zero relative effort
Realists: positive relative effort
Cynics: extreme relative effort

14
Relative Effort Distribution
0
5
10
15
20
25
30
X-2000 Y-2000
15
Relative Effort Distribution
0
5
10
15
20
25
30
Idea
lists
Suppo
rter
s
Dilige
nt rea
lists
Realis
ts
Cynics
X-2000 X-2003

16
Relative Effort Distribution
0
5
10
15
20
25
30
Y-2000 Y-2003

17
Relative Effort Distribution
0
5
10
15
20
25
30
Idea
lists
Suppo
rter
s
Dilige
nt rea
lists
Realis
ts
Cynics
X-2000 Y-2000 X-2003 Y-2003
18
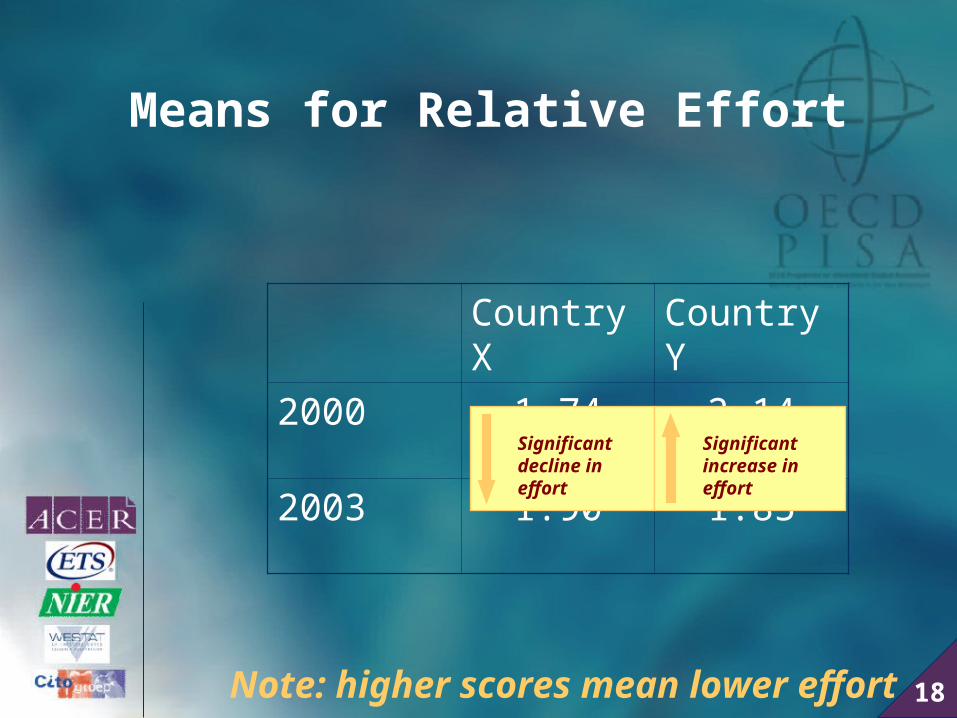
Means for Relative Effort
Country X Country Y
2000 1.74 2.14
2003 1.90 1.85
Note: higher scores mean lower effort
Significant decline in effort
Significant increase in effort

19
Means for Relative Effort by gender
1
1.2
1.4
1.6
1.8
2
2.2
2.4
Country X2000
Country Y2000
Country X2003
Country Y2003
FemaleMale
Note: higher scores mean lower effort
23
40
1623

Country X
2003
idealists
supporters
diligent realists
realistscynics
Relative effort
2000
Pla
usi
ble
val
ue
in R
ead
ing
idealists
supporters
diligent realists
realistscynics
idealists
supporters
diligent realists
realists
cynics
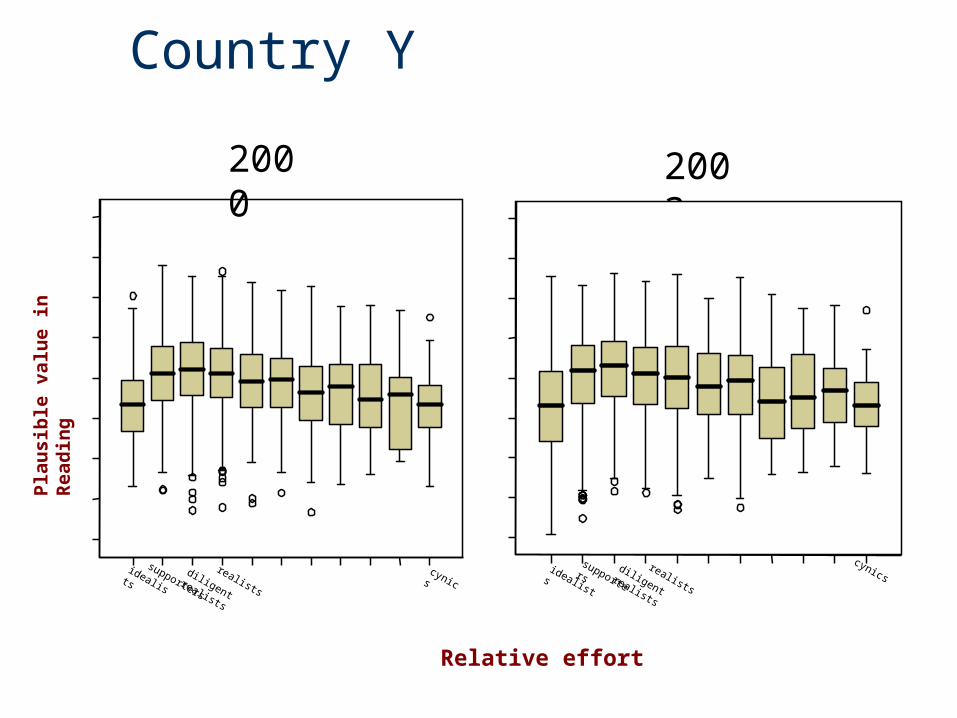
Country Y
2003
Relative effort
2000
Pla
usi
ble
val
ue
in R
ead
ing
idealists
supporters
diligent realists
realists
cynics

Relative effort by gender for reading
idealistssupporters
diligent realists
realistscynics
Pla
usi
ble
val
ue
in r
ead
ing Female
Male
Relative effort

23
Transformed mean scores for reading
0
20
40
60
80
100
120
140
160
Country X2000
Country X2003
Country Y2000
Country Y2003
female
male
overall

24
Does effort count?

25
Males
-10
0
10
20
30
40
50
2000 2003
X-Raw X-Adjusted Y-Raw Y-Adjusted
Consistent reduction in performance after adjustment for effort
Decrease rather than increase in performance after adjustment for effort

26
Females
0102030405060708090
2000 2003
X-Raw X-Adjusted Y-Raw Y-Adjusted
Relatively consistent performances, both with and without adjustment
Improvement (some, but not all) accounted for by effort

27
Country X
0102030405060708090
2000 2003
Male-Raw Female-Raw Male-Adjusted Female-Adjusted
Decline in boys over time leading to increased gender differences. Effort not affecting the pattern
28
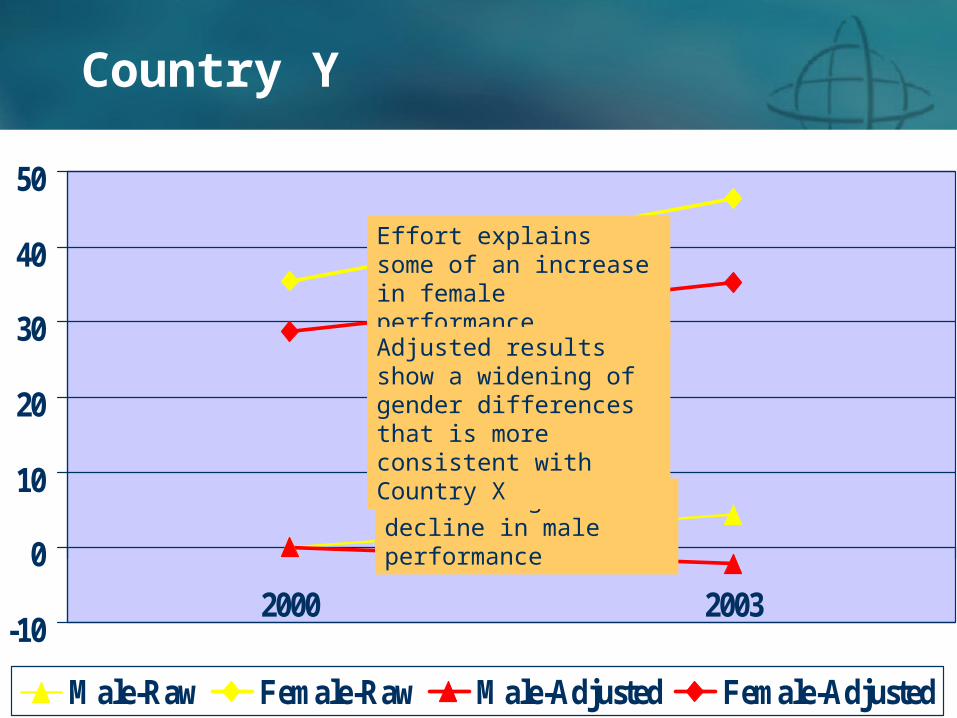
Country Y
-10
0
10
20
30
40
50
2000 2003
Male-Raw Female-Raw Male-Adjusted Female-Adjusted
Effort explains some of an increase in female performance
Effort disguises a decline in male performance
Adjusted results show a widening of gender differences that is more consistent with Country X

29
Summary
• Effort is related to achievement but the relationship is non-linear
• Effort is less in Country Y than Country X but Country Y improved its effort investment from 2000 to 2003.
• Effort is less for boys than girls• Effort explains some but not all of the differences
between the achievement of boys and girls• Effort explains some but not all of the improved
performance of Country Y
30
Future Direction
• Compare students matched by effort• Compare effort distributions across
countries• Examine variance explained by
effort• Explore group differences after
controlling for effort

31