1
AIRS RRTM All Sky OLR - Night Green- land The Assessing ARM Clear Sky BBHRP with CERES and AIRS University of Wisconsin - Madison, Space Science and Engineering Center Leslie Moy , Dave Tobin, Bob Knuteson, Lori Borg, Hank Revercomb (PI), Marty Mlynczak 1 , and Joel Susskind 2 1 NASA Langley, 2 NASA GSFC Introduction The overall objective of this research is to assess and improve the ARM Broad Band Heating Rate Profile (BBHRP) measurement-model comparison effort that will couple heating rates based on ARM data more directly into SCM and GCM models. Methods of determining OLR include measurements from broadband radiometers onboard satellites and calculations from radiative transfer models (RTM) requiring atmospheric profile and surface properties as inputs. We assess CERES against AER’s RRTM calculations using ARM data and AIRS retrievals. Summary of our technique SSF CERES is currently a better metric for BBHRP assessment than GOES. AIRS spectral radiance analysis allows us to evaluate the atmospheric and surface estimates. AIRS spectral flux analysis allows us to interpret uncertainties in the flux products, and infer uncertainties in the far IR. • Using AIRS retrievals allows for global RRTM calculations of OLR and heating rate profiles. All Sky Global Analysis of 16 November 2002 Acknowledgements Dave Rutan, Pat Minnis, Pat Heck, Mandy Khaiyer, Tony Clough, Eli Mlawer, the AIRS Project, the ARM infrastructure This work supported by DOE grant DE-FG02-90ER61057 Clear Sky Analysis at SGP between September 2002 and February 2005 : Night CERES & AIRS RRTM, W/m 2 Summary of Results The RRTM calculations of clear sky OLR agree with CERES observations to ~1 W/m 2 with an uncertainty of ~1 W/m 2 . * True at SGP over 2.5 years, true globally (with some understood regional exceptions) for study day. * True using ARM data as input to RRTM, true using AIRS sounding retrievals as input to RRTM. Global 16Nov2002 Lat:[-60:60] SGP 2002 - 2005 SGP 2002 - 2005 SGP 2002 - 2005 SSF CERES - AIRS RRTM **NIGHT** OLR differences: Observations minus Calculations SSF CERES - AIRS RRTM SSF CERES - BE profile with AIRS surface RRTM SSF CERES - BE RRTM **NIGHT** OLR differences: Observations minus Calculations +0.9* +1.2* +0.8 +0.5 Mean, W/m 2 < ± 0.5 ~1 ~1 ~1 Uncertainty in mean 2.6 1.8 2.2 2.6 Stdv, W/m 2 ~21k ~74 ~74 ~74 Pnts BE RRTM BE w/ AIRS surface RRTM AIRS RRTM Night time Clear Sky OLR AIRS spectral radiance analysis observations - calculations, 1 wavenumber bin mean shown Day - Night Bias at SGP AIRS Spectral flux analysis Partial fluxes (fluxes over a spectral range) are calculated from the radiances using: where ν is wavelength, and ψ is solid angle. F = radiance d" d# $$ Normal curve: μ =2.0, σ =1.5 Data statistics: mean =1.6, std =2.6 points 21k Data restricted to NIGHT time and latitudes between 60S and 60N to exclude known problem regions. Determining uncertainty in the mean @200K Blackbody @225K @250K @275K Wavenumber, cm -1 Earth’s spectrum AIRS coverage Far IR Total OLR CO2 O3 6.3 μm H2O Example of a Profile at SGP: Sept 20, 2002 For the 2007 STM the BBHRP clear sky methodology was extended at the SGP site to cover multiple years. TOA flux calculations using RRTM were compared to GOES fluxes (which is based on a regression with CERES). This year we compare directly with CERES SSF FM-3 OLR within 10 km of the SGP site and 10 minutes of the Aqua overpass times, and a 99% clear sky requirement. We used interpolated sondes to Aqua overpass times (Best Estimate profiles, BE), and added RRTM calculations using NASA AIRS level 2 retrievals. Clear Sky Global Analysis of 16 November 2002 Clear sky OLR RRTM calculations using NASA AIRS L2 retrievals (version 5) were compared to SSF CERES. NIGHT CERES clear sky OLR, W/m 2 [0.1-0.3] inferred 116 45 Far IR 100* (F AIRS obs - F AIRS calc ) / F AIRS obs, 100* (CERES - AIRS RRTM) / CERES 144 263 54 100 AIRS spectra Total OLR 0.3 0.2 Spectral Coverage Percent Residual definition Flux W/m 2 weight % % NASA AIRS L2 cloud retrieval product reports the cloud fraction and optical depths for up to two clouds. We calculated OLR with RRTM assuming grey clouds. 6.3 μm water band Assuming CERES errors are similar throughout the entire spectrum, and that there are no cancellation of errors between CERES and RRTM, we can infer the error in the far IR. (Our analyses show that CERES and AIRS agree in the window channels to approximately 0.1 W/m 2 .) Day CERES - AIRS RRTM, W/m 2 Night CERES - AIRS RRTM, W/m 2 Histogram for 16Nov2002 Night CERES - AIRS RRTM * Adjusted for upper level water error based on spectral analysis at SGP (~0.8 W/m 2 ). BE RRTM AIRS RRTM Temperature,K Water vapor, g/kg Heating rate, K/day BE-AIRS, K/day AIRS retrievals’ vertical resolution has a smoothing effect compared to sonde data. We attribute the Gaussian component to spatial mismatch between CERES and AIRS footprints. For the Gaussian shown, the statistical uncertainty is very small (0.01 W/m 2 ) and not representative of the true uncertainty of the mean. •The negative tail of the histogram is consistent with undetected clouds and distorts the mean. •Deviation between the mean of the original histogram and the Gaussian is: | X - μ | 0.4 W/m 2 We assign the complete difference between the mean of the full distribution with uncorrected tail and the mean of the Gaussian component to uncertainty in the mean (<0.5 W/m 2 ). * allows us to evaluate the profiles used as input to RRTM. * the upper level water bands show a brightness temperature bias ~0.7K. Reducing the water vapor above 5km by 10% eliminates this bias. * the far IR is very sensitive to upper level water vapor; the 10% reduction in the water vapor above 5km leads to a 0.2 W/m 2 in the 6.3 μm band and 0.5 W/m 2 in the far IR. Latitude, degrees Night All Sky OLR CERES - AIRS RRTM Difference versus total cloud fraction total cloud fraction W/m 2 CERES - AIRS RRTM, W/m 2 Day CERES & AIRS RRTM, W/m 2 Latitude, degrees Total Cloud Fraction 0.4 -1.8 53 74 127 2.2 1.8 2.4 +0.2 +2.0 +1.3 Day Night D&N SSF CERES - AIRS RRTM 0.4 -1.3 53 74 127 2.4 2.2 2.3 -0.5 +0.8 +0.3 Day Night D&N SSF CERES - BE profile & AIRS surface RRTM 0.7 -0.7 53 74 127 4.6 2.6 3.6 -0.2 +0.5 +0.3 Day Night D&N SSF CERES - BE RRTM Statistical uncertaint y Day- Nite Bias npts Stdev, W/m 2 Mean, W/m 2 OLR differences: Observations minus Calculations • Day/night differences are greater than the statistical uncertainties indicating a non-Gaussian source of bias. • Our nighttime uncertainty estimates are elevated to ~1 W/m 2 to reflect this. • We continue to study the source of the day/night bias; AIRS residuals are not significantly different between day and night, and CERES OLR is total minus solar. BE RRTM AIRS RRTM

Assessing ARM Clear Sky BBHRP with CERES and AIRS

  • Upload
    others

  • View
    5

  • Download
    0

Embed Size (px)

Citation preview

AIRS RRTM All Sky OLR - Night

Green-land

The

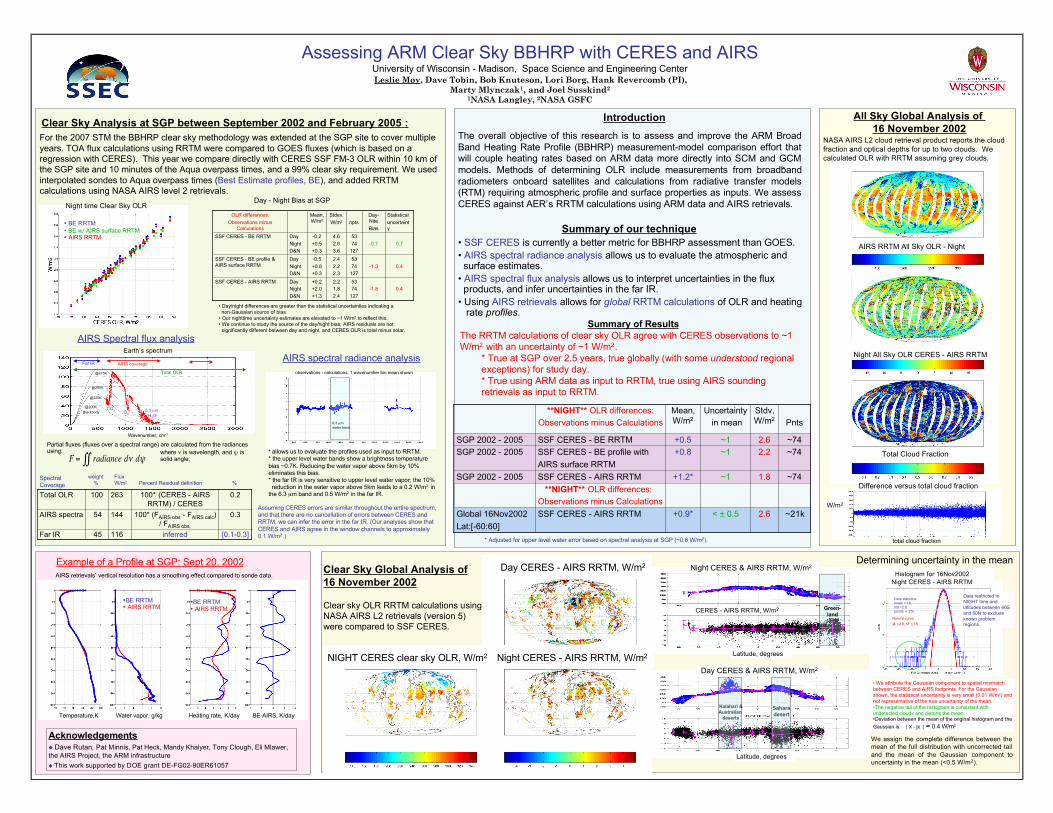
Assessing ARM Clear Sky BBHRP with CERES and AIRSUniversity of Wisconsin - Madison, Space Science and Engineering CenterLeslie Moy, Dave Tobin, Bob Knuteson, Lori Borg, Hank Revercomb (PI),

Marty Mlynczak1, and Joel Susskind2

1NASA Langley, 2NASA GSFC

IntroductionThe overall objective of this research is to assess and improve the ARM BroadBand Heating Rate Profile (BBHRP) measurement-model comparison effort thatwill couple heating rates based on ARM data more directly into SCM and GCMmodels. Methods of determining OLR include measurements from broadbandradiometers onboard satellites and calculations from radiative transfer models(RTM) requiring atmospheric profile and surface properties as inputs. We assessCERES against AER’s RRTM calculations using ARM data and AIRS retrievals.

Summary of our technique• SSF CERES is currently a better metric for BBHRP assessment than GOES.• AIRS spectral radiance analysis allows us to evaluate the atmospheric and surface estimates.• AIRS spectral flux analysis allows us to interpret uncertainties in the flux products, and infer uncertainties in the far IR.• Using AIRS retrievals allows for global RRTM calculations of OLR and heating rate profiles.

All Sky Global Analysis of 16 November 2002

Acknowledgements Dave Rutan, Pat Minnis, Pat Heck, Mandy Khaiyer, Tony Clough, Eli Mlawer,the AIRS Project, the ARM infrastructure This work supported by DOE grant DE-FG02-90ER61057

Clear Sky Analysis at SGP between September 2002 and February 2005 :

Kalahari &Australian

deserts

Saharadesert

Night CERES & AIRS RRTM, W/m2

Summary of ResultsThe RRTM calculations of clear sky OLR agree with CERES observations to ~1W/m2 with an uncertainty of ~1 W/m2.

* True at SGP over 2.5 years, true globally (with some understood regional exceptions) for study day.* True using ARM data as input to RRTM, true using AIRS sounding retrievals as input to RRTM.

Global 16Nov2002Lat:[-60:60]

SGP 2002 - 2005

SGP 2002 - 2005SGP 2002 - 2005

SSF CERES - AIRS RRTM

**NIGHT** OLR differences:Observations minus Calculations

SSF CERES - AIRS RRTM

SSF CERES - BE profile withAIRS surface RRTM

SSF CERES - BE RRTM

**NIGHT** OLR differences:Observations minus Calculations

+0.9*

+1.2*

+0.8+0.5

Mean,W/m2

< ± 0.5

~1

~1~1

Uncertainty in mean

2.6

1.8

2.22.6

Stdv ,W/m2

~21k

~74

~74~74

Pnts

• BE RRTM• BE w/ AIRS surface RRTM• AIRS RRTM

Night time Clear Sky OLR

AIRS spectral radiance analysisobservations - calculations, 1 wavenumber bin mean shown

Day - Night Bias at SGP

AIRS Spectral flux analysis

Partial fluxes (fluxes over a spectral range) are calculated from the radiancesusing: where ν is wavelength, and ψ is

solid angle.

!

F = radiance d" d#$$

histogram for 16 November 2002Night CERES - AIRS RRTM

Normal curve:µ =2.0, σ =1.5

Data statistics:mean =1.6, std =2.6points ≈ 21k

Data restricted toNIGHT time andlatitudes between 60Sand 60N to excludeknown problemregions.

Determining uncertainty in the mean

@200KBlackbody

@225K

@250K

@275K

Wavenumber, cm-1

Earth’s spectrum

AIRS coverageFar IR

Total OLR

CO2 O36.3 µm H2 O

Example of a Profile at SGP: Sept 20, 2002

For the 2007 STM the BBHRP clear sky methodology was extended at the SGP site to cover multipleyears. TOA flux calculations using RRTM were compared to GOES fluxes (which is based on aregression with CERES). This year we compare directly with CERES SSF FM-3 OLR within 10 km ofthe SGP site and 10 minutes of the Aqua overpass times, and a 99% clear sky requirement. We usedinterpolated sondes to Aqua overpass times (Best Estimate profiles, BE), and added RRTMcalculations using NASA AIRS level 2 retrievals.

Clear Sky Global Analysis of16 November 2002

Clear sky OLR RRTM calculations usingNASA AIRS L2 retrievals (version 5)were compared to SSF CERES.

NIGHT CERES clear sky OLR, W/m2

[0.1-0.3]inferred116 45Far IR

100* (FAIRS obs - FAIRS calc)/ FAIRS obs,

100* (CERES - AIRSRRTM) / CERES

144

263

54

100

AIRS spectra

Total OLR

0.3

0.2

SpectralCoverage Percent Residual definition

FluxW/m2

weight% %

NASA AIRS L2 cloud retrieval product reports the cloudfraction and optical depths for up to two clouds. Wecalculated OLR with RRTM assuming grey clouds.

6.3 µm water band

Assuming CERES errors are similar throughout the entire spectrum,and that there are no cancellation of errors between CERES andRRTM, we can infer the error in the far IR. (Our analyses show thatCERES and AIRS agree in the window channels to approximately0.1 W/m2.)

Day CERES - AIRS RRTM, W/m2

Night CERES - AIRS RRTM, W/m2

Histogram for 16Nov2002Night CERES - AIRS RRTM

* Adjusted for upper level water error based on spectral analysis at SGP (~0.8 W/m2).

•BE RRTM• AIRS RRTM

Temperature,K Water vapor, g/kg Heating rate, K/day BE-AIRS, K/day

AIRS retrievals’ vertical resolution has a smoothing effect compared to sonde data.

• We attribute the Gaussian component to spatial mismatchbetween CERES and AIRS footprints. For the Gaussianshown, the statistical uncertainty is very small (0.01 W/m2) andnot representative of the true uncertainty of the mean.•The negative tail of the histogram is consistent withundetected clouds and distorts the mean.•Deviation between the mean of the original histogram and theGaussian is: | X - µ | ≈ 0.4 W/m2

We assign the complete difference between themean of the full distribution with uncorrected tailand the mean of the Gaussian component touncertainty in the mean (<0.5 W/m2).

* allows us to evaluate the profiles used as input to RRTM.* the upper level water bands show a brightness temperaturebias ~0.7K. Reducing the water vapor above 5km by 10%eliminates this bias.* the far IR is very sensitive to upper level water vapor; the 10% reduction in the water vapor above 5km leads to a 0.2 W/m2 inthe 6.3 µm band and 0.5 W/m2 in the far IR.

Latitude, degrees

Night All Sky OLR CERES - AIRS RRTM

Difference versus total cloud fraction

total cloud fraction

W/m2

CERES - AIRS RRTM, W/m2

Day CERES & AIRS RRTM, W/m2

Latitude, degrees

Total Cloud Fraction

0.4-1.85374

127

2.21.82.4

+0.2+2.0+1.3

DayNightD&N

SSF CERES - AIRS RRTM

0.4-1.35374

127

2.42.22.3

-0.5+0.8+0.3

DayNightD&N

SSF CERES - BE profile &AIRS surface RRTM

0.7-0.75374

127

4.62.63.6

-0.2+0.5+0.3

DayNightD&N

SSF CERES - BE RRTM

Statisticaluncertainty

Day-NiteBias

nptsStdev ,W/m2

Mean,W/m2

OLR differences:Observations minus

Calculations

• Day/night differences are greater than the statistical uncertainties indicating a non-Gaussian source of bias.• Our nighttime uncertainty estimates are elevated to ~1 W/m2 to reflect this.• We continue to study the source of the day/night bias; AIRS residuals are not significantly different between day and night, and CERES OLR is total minus solar.

•BE RRTM• AIRS RRTM