Embed Size (px)
Citation preview

SEE WHAT YOU’RE MISSING U2U Conference SEE WHAT YOU’RE MISSING U2U Conference
Assembly Variation Analysis Objective Development for Proactive Design integrity
Praveen Gomer
248-576-1987
SEE WHAT YOU’RE MISSING U2U Conference 2
Variation in System;
Tolerances are inevitable
Systematic allocation
of tolerances
Assembly/Performance
requirement
Tolerances based on manufacturability & historic data
GD&T concepts and its
Application
Introduction to Dimension Management
Dimensional
Management
Geometric effects on
functionality
Measurement

SEE WHAT YOU’RE MISSING U2U Conference

SEE WHAT YOU’RE MISSING U2U Conference
VSA : Modeling Operation Overview
4
• 3D data in *.model format • 2D drawing and GD & T • Assembly sequence • Mfg. Process Information • Manual Stack sheet
• ToL files • Process report with major
Contributors • Recommendations
• Definition of objectives and assembly sequence
• Applying GD & T on the participating features
• Performing derivative analysis • Comparing with manual stack up
• Observed that manual stack did not consider effects of relevant tolerances
• New DRF evaluation • Prediction of % yield • Identification of Sensitivities &
contributors
Deliverable Inputs
Value addition
Variation Simulation
Analysis
Execution

SEE WHAT YOU’RE MISSING U2U Conference 5
Variation Simulation Analysis – Execution Steps
CAD Data
Measurement Objectives Definition
Joints Creation
Application of Constraints and GD&T
Simulation
Result Analysis Using Analyzer
CAD Assembly Created

SEE WHAT YOU’RE MISSING U2U Conference
Design Specification
6
Proactive Reliability Process (Draft)
Design Specifications
& Selection Guidelines
EBR Diagram and Matrix*
Noise Matrix
Functional Block
Diagram
DFMEA
DVP&R
Standard Test Guidelines/Procedure
PF
Core Design Process
*Event Based Reliability and Performance Testing
Quantum Quality Matrix FMEA
Robust Reliability Design?
Reliability-Based DFSS
Y
Severity ≥ 9and SO>20?
N
Fault Tree Analysis(1)
Y
Design Change
Design Change
Design Change
N
Prioritize Noise
1: Must be performed all ISO 26262 Hazard Analysis based Effects
The individual component level will use the drawing to establish dimension related functions

SEE WHAT YOU’RE MISSING U2U Conference
Function Block Diagram
7
The Functional Block Diagram documents the input items, the items which will be used to create the design (the scope), and the output items (where the Primary function will provide its outputs).
The input Items receive dotted lines. The direction of the arrow will show that the input functions are coming into the design. Inputs are conditions for success. When the condition is of poor quality, the input becomes a cause. The functions required for the must be documented in a verb-noun format. Their purpose to be satisfied by each input needs to be defined (e.g. energy for work, signal/timing for action, start of a challenge, response time, etc.).
Functional Blocks are Items which have solid lines. Each functional block must have its function(s) described in a verb-noun format. Place the functional blocks in their time/energy transfer sequence. Show how inputs enter into specific functional blocks.
Identify the Primary Function(s) of the Functional Block Diagram. Primary Functions are outputs to other functional block diagrams of a vehicle. Outputs will be actions, energy transfers, information (digital/analog), reactive structures, etc.
Output Items receive dotted lines. Output items are used to question how poor quality Primary functions will be noticed as effects.
The functional block diagram is an important tool to be used in developing a design, creating a P-Diagram, or creating a Failure Mode and Effects Analysis.
© Chrysler, LLC
Design Specifications
& Selection Guidelines
P-DiagramNoise Matrix
Functional Block
Diagram
DFMEA DVP&R
Standard Test Guidelines/Procedure
Design Structure, Specifications,
Guidelines, and Standard Tests
Ideal Functions, Design Parameters, Noise
Factors, Noise Map to Standard Tests
Structure of Functions, Failure Modes, Causes,
Recommended Actions/Risk
Reduction
Functions
Ideal FunctionsFunction Flow, Ideal Functions, and Conditions for Success, Areas of Causes, and Areas of Effects
Test Conditions
PFStructure
Function Based DVP&R
Design Change Recommendations
Event Based Reliability and Performance
Testing

SEE WHAT YOU’RE MISSING U2U Conference
Boundary Diagram

SEE WHAT YOU’RE MISSING U2U Conference
Bearing Function Model
SEE WHAT YOU’RE MISSING U2U Conference
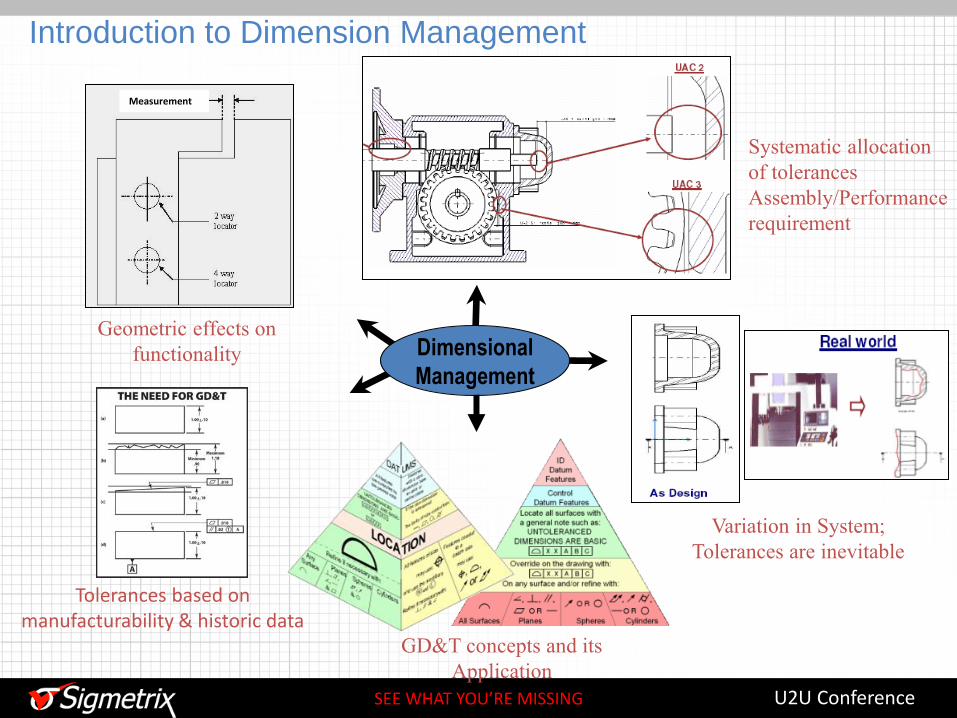
Crankshaft Function
SEE WHAT YOU’RE MISSING U2U Conference
DFMEA
11
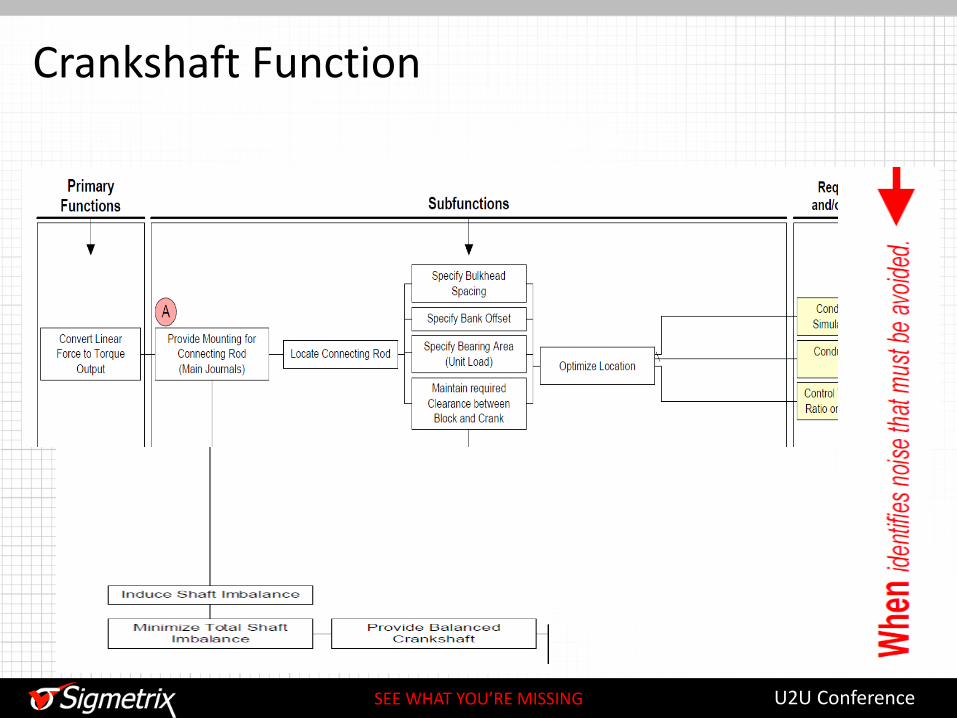
• Each function can respond poorly and become a failure mode. There are three categories of failure modes: The magnitude can be wrong, have unacceptable variation, and the function can respond too quickly/slowly.
• Before assessing the failure modes, the magnitude of the function (what it is and how it might be measured/controlled should be understood). Example: “engage pin” might really mean “move distance.” Understand the actual and simple physics of the function.
• These three categories produce the Seven Failure Modes: omission, excessively, incompletely (the magnitude failure modes), erratically, unevenly (the variation failure modes), too slowly, and too quickly (the timing/rate of energy transfer failure modes)
• These concepts are simple and direct but they do need to be practiced to be really understood.

SEE WHAT YOU’RE MISSING U2U Conference
Moving Towards the DFMEA
12
When the functions from the Items within the scope of the Functional Block Diagram (FBD) perform flawlessly, the Primary Functions will perform flawlessly.
When one of the functions performs poorly, the Primary function will perform poorly.
A function which performs outside acceptable levels becomes a Failure Mode and is described in one of seven ways of performing poorly (The Seven Failure Modes or 7FM).
Before a DFMEA can be performed, the Functions must be documented. For the DFMEA—DVP&R path, the operating specification for the Primary Functions must be documented.
For the Design path, the quality of the inputs (operating ranges/specs), all functions, and the Primary functions must be documented. The operational noise factors will also need to be documented. The following format can be used to document, in a single overview page, all this information.
© Chrysler, LLC

SEE WHAT YOU’RE MISSING U2U Conference
Moving Towards the DFMEA
13
The following function table can be expanded to include two more topics which are inputs and noise factors. Noise factors are determined through regional studies local studies. Local studies performed by taking the Functional Block Diagram into a P-diagram (covered later)
The input specifications define the functional quality of the input (target, max, min, quality etc).
In the example on this page, where the acceptance criteria/test target states “Design:” shows where the DRE needs to address the quality of the action/energy transfer (function). If the function is to be provided by a supplier design, this would be the next level down’s Primary function (supporting this level’s Primary function) which would require its own DFMEA/DVP&R.
© Chrysler, LLC
System, Sub-system, Part/Component Detail Function(s)
Primary Function Performance Specification
Criteria (DVP&R)
List the Item to be Studied Verb-Noun Acceptance Criteria/Test Target
1 PCM Provide Power Design: PWM Spec output to position the
actuator2 Actuator Move Actuator Pintle Design: Distance and speed/reaction time
specification in reaction to PCM signal3 Oil Control Valve Control Oil Flow Design: Flow Quantity, Oil Pressure, Response
Time (document the specifications required to
perform work)4 Cam Phaser Assembly Position Cam Shaft Primary Function: Required for DFMEA/DVP&R
Path: Response time, position accuracy
5 Cam Shaft Activate Valves Out of scope6 Cam Shaft Target Wheel Provide Reference Target Design: Define max angle error7 Oil Circuit Provide Oil Flow Design: Define min flow, pressure, oil quality8 Valve Cover Position Actuator Design: GD&T Target and USL/LSL9 Cam Sensor Provides Cam-Position-Signal Design: Define response time, max angle error
10 Crank Sensor Provides Crank-Position-Signal Design: Define response time, max angle error

SEE WHAT YOU’RE MISSING U2U Conference
Function Block Diagram
14
In this example, Time Cam Event is the Primary function. The sub-functions are supplied in sequential order from the PCM, Actuator, Oil Control Valve, to the Cam Phaser Assembly. Another sequence is from the Oil Circuit to the Oil Control Valve to the Cam Phaser Assembly. The team can now follow time/energy through a design.
© Chrysler, LLC
4 Cam Phaser Assy
1 PCM
Oil Pump
9 Cam Sensor
10 Crank Sensor
5 Cam Shaft6 Cam Shaft
Target Wheel3 Oil Control
Valve2 Actuator
Valve Cover
8 Timing Drive
7 Oil Circuit
Crank Shaft
Oil Temperature Sensor
Oil Pressure
Battery Voltage
Provide oil-temp-signal
Provide oil-pressure-signal
Provide Duty Cycle
Move Actuator Pintle
Control Oil Flow
Primary Function: Position Cam-shaft
Control liftProvides Reference
Target
Drive Cam-Phaser
Position Actuator
Provides Cam-Position-Signal
Provides Crank-Position-Signal
Provides Reference Target
Provides Power
Provide Oil Pressure
Provide Oil Flow
Produce Torque
Work Energy
Work Energy
Response Time
Response Time
Response Time
Timing
Timing
Engine
Driveline
Drivability/Customer
Only to Consider Effects
Noncompliance with Regulatory Requirements
Pedal Position
Engine Speed (Crank Sensor)
Challenge
Challenge
· Too much overlap· Not enough overlap· Misfire· Rough Running Engine· Poor Emissions· Walk Home· Engine Delay· NVH· Slow to respond· Knock
Provide Engine Speed
Provide Customer Request
Specifications can be developed for the inputs, functions, and Primary functions.

SEE WHAT YOU’RE MISSING U2U Conference
Valve train Variation Simulation Analysis
15
Unstable valve train dynamics
Noise, inadequate lash compensation, incorrect valve motion, failed valve
train
Poor Valve Sealing
Poor Valve to Valve Seat Sealing
Binding spring coils, dropped valve, engine
failure
Lash Adjuster Stoke Calculation
Cam Bore Machining Stock Calculation
Installed Valve Spring Height Calculation
Sealing between Valve and Valve Stem Seal
Valve Seat Machining Stock Calculation
Packaging of Valve Train System in Cylinder Head
Contact pattern between Roller Rocker Arm and Valve Tip
Valve Tip Height Variation
Valve train dynamics problems at Camshaft
Excessive wear on roller finger follower failed valve
train
Interface between Cam lobe and Roller Rocker Arm
Potential Effects of Failure Dimensional Objectives Identified

SEE WHAT YOU’RE MISSING U2U Conference
Cam – Crank max – min Position Error

SEE WHAT YOU’RE MISSING U2U Conference
Sign off Step 0
17

SEE WHAT YOU’RE MISSING U2U Conference
CoE Check 1 Activity
18

SEE WHAT YOU’RE MISSING U2U Conference
CoE Check 2
19

SEE WHAT YOU’RE MISSING U2U Conference
Coe Check 3
20

SEE WHAT YOU’RE MISSING U2U Conference
Chrysler PTVSA- Operation Model
21
Chief Engineer
Dimensional
Engineering Lead
Engines
Drive Line
/ Axles /
Trans
Engine
Systems
Adaptation
/ Vehicle
Integration
PLM / Data
Exchange
Project Lead
Domain
Experts
Process
Experts
Technologist
/ Modeling
Pro
gra
m m
anagem
ent
Pro
duct E
ngin
eers
Data Exchange
Chrysler Location Offsite Location

SEE WHAT YOU’RE MISSING U2U Conference
Chrysler PTVSA- Program Process
22
Identify PQC
Gage Design
Support
Document SOP/Learning
for Future Programs
Product Development Team
VSA Team
Legend
Program Timeline & Objectives
Mapping of VSA
Execution Plan to
Program Timeline
Provide Recomm-endations
Report VSA Program
Level Status
Finalize design/
tolerance changes
Change Release for
parts
Perform VSA
Mapping of VSA Execution Plan to Program Timeline
List of Objectives: • Fitment of Piston
Squirter • Spay Pattern Variation
Plot for Piston Squirter due to tolerances
Report VSA Program Level Status

SEE WHAT YOU’RE MISSING U2U Conference
Chrysler PTVSA- Execution Process
23
Function Objectives +Program Targets
Program Timing
Dimension Management Objectives Functionality Validation Component & subsystem fitment Sealing & leakage Prediction Packaging & Clearance Evaluations
Concept
VSA
Function Model & DFMEA
Drawings Objective Tracking Program Dashboard
Lau
nch
SEE WHAT YOU’RE MISSING U2U Conference - 24 -
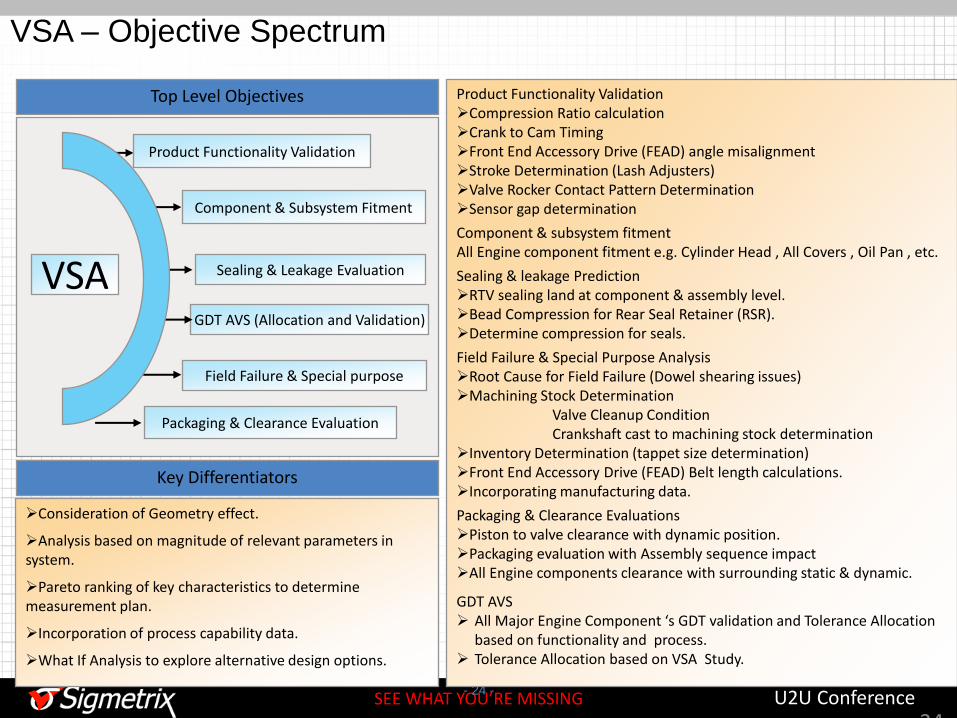
Product Functionality Validation Compression Ratio calculation Crank to Cam Timing Front End Accessory Drive (FEAD) angle misalignment Stroke Determination (Lash Adjusters) Valve Rocker Contact Pattern Determination Sensor gap determination
Component & subsystem fitment All Engine component fitment e.g. Cylinder Head , All Covers , Oil Pan , etc.
Sealing & leakage Prediction RTV sealing land at component & assembly level. Bead Compression for Rear Seal Retainer (RSR). Determine compression for seals.
Field Failure & Special Purpose Analysis Root Cause for Field Failure (Dowel shearing issues) Machining Stock Determination Valve Cleanup Condition Crankshaft cast to machining stock determination Inventory Determination (tappet size determination) Front End Accessory Drive (FEAD) Belt length calculations. Incorporating manufacturing data.
Packaging & Clearance Evaluations Piston to valve clearance with dynamic position. Packaging evaluation with Assembly sequence impact All Engine components clearance with surrounding static & dynamic.
GDT AVS All Major Engine Component ‘s GDT validation and Tolerance Allocation
based on functionality and process. Tolerance Allocation based on VSA Study.
Top Level Objectives
VSA
Product Functionality Validation
Component & Subsystem Fitment
Packaging & Clearance Evaluation
Sealing & Leakage Evaluation
Field Failure & Special purpose
Consideration of Geometry effect.
Analysis based on magnitude of relevant parameters in system.
Pareto ranking of key characteristics to determine measurement plan.
Incorporation of process capability data.
What If Analysis to explore alternative design options.
Key Differentiators
GDT AVS (Allocation and Validation)
VSA – Objective Spectrum
24

SEE WHAT YOU’RE MISSING U2U Conference 25
Dimension Management : Project Traceability
25
Status Tracker
WO No system to trace
project throughout its
development stages
Dimension Management Scorecard / Dashboard
At Program level tracking of all objective.
Identification of all Performance / Fit / Sealing requirement
& tracking throughout Product development stages.

SEE WHAT YOU’RE MISSING U2U Conference
PTVSA : Tigershark 2.0L - Dashboard
SEE WHAT YOU’RE MISSING U2U Conference
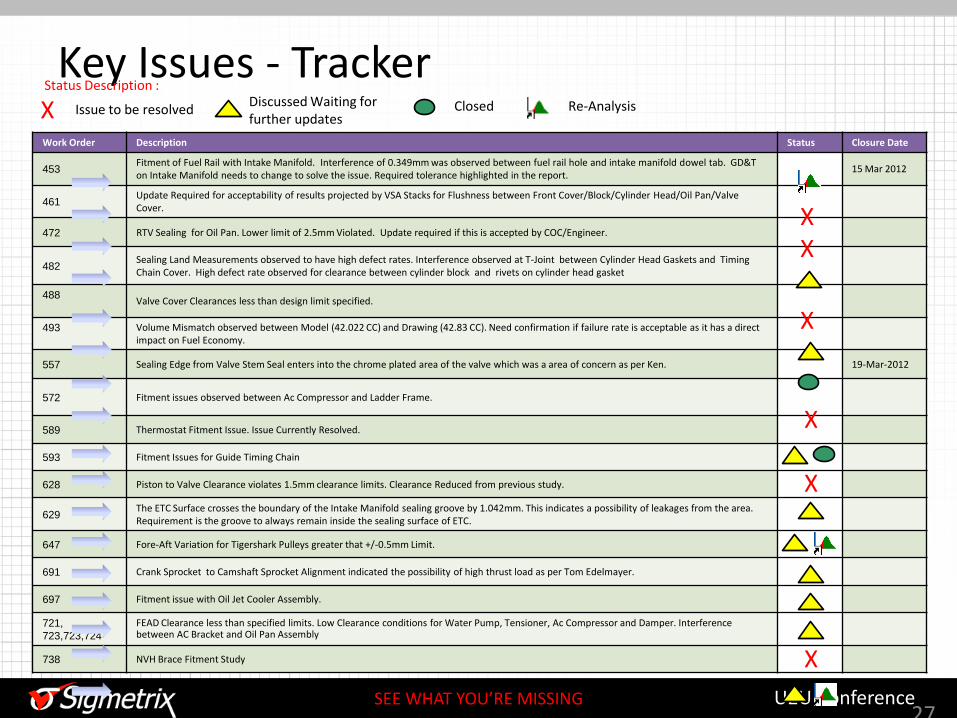
Issue to be resolved
Key Issues - Tracker
27
Work Order Description Status Closure Date
453 Fitment of Fuel Rail with Intake Manifold. Interference of 0.349mm was observed between fuel rail hole and intake manifold dowel tab. GD&T on Intake Manifold needs to change to solve the issue. Required tolerance highlighted in the report.
15 Mar 2012
461 Update Required for acceptability of results projected by VSA Stacks for Flushness between Front Cover/Block/Cylinder Head/Oil Pan/Valve Cover.
472 RTV Sealing for Oil Pan. Lower limit of 2.5mm Violated. Update required if this is accepted by COC/Engineer.
482 Sealing Land Measurements observed to have high defect rates. Interference observed at T-Joint between Cylinder Head Gaskets and Timing Chain Cover. High defect rate observed for clearance between cylinder block and rivets on cylinder head gasket
488
Valve Cover Clearances less than design limit specified.
493
Volume Mismatch observed between Model (42.022 CC) and Drawing (42.83 CC). Need confirmation if failure rate is acceptable as it has a direct impact on Fuel Economy.
557 Sealing Edge from Valve Stem Seal enters into the chrome plated area of the valve which was a area of concern as per Ken. 19-Mar-2012
572 Fitment issues observed between Ac Compressor and Ladder Frame.
589 Thermostat Fitment Issue. Issue Currently Resolved.
593 Fitment Issues for Guide Timing Chain
628 Piston to Valve Clearance violates 1.5mm clearance limits. Clearance Reduced from previous study.
629 The ETC Surface crosses the boundary of the Intake Manifold sealing groove by 1.042mm. This indicates a possibility of leakages from the area. Requirement is the groove to always remain inside the sealing surface of ETC.
647 Fore-Aft Variation for Tigershark Pulleys greater that +/-0.5mm Limit.
691 Crank Sprocket to Camshaft Sprocket Alignment indicated the possibility of high thrust load as per Tom Edelmayer.
697 Fitment issue with Oil Jet Cooler Assembly.
721,
723,723,724
FEAD Clearance less than specified limits. Low Clearance conditions for Water Pump, Tensioner, Ac Compressor and Damper. Interference between AC Bracket and Oil Pan Assembly
738 NVH Brace Fitment Study
X Status Description :
Discussed Waiting for further updates
Closed Re-Analysis
X X
X
X
X
X
SEE WHAT YOU’RE MISSING U2U Conference
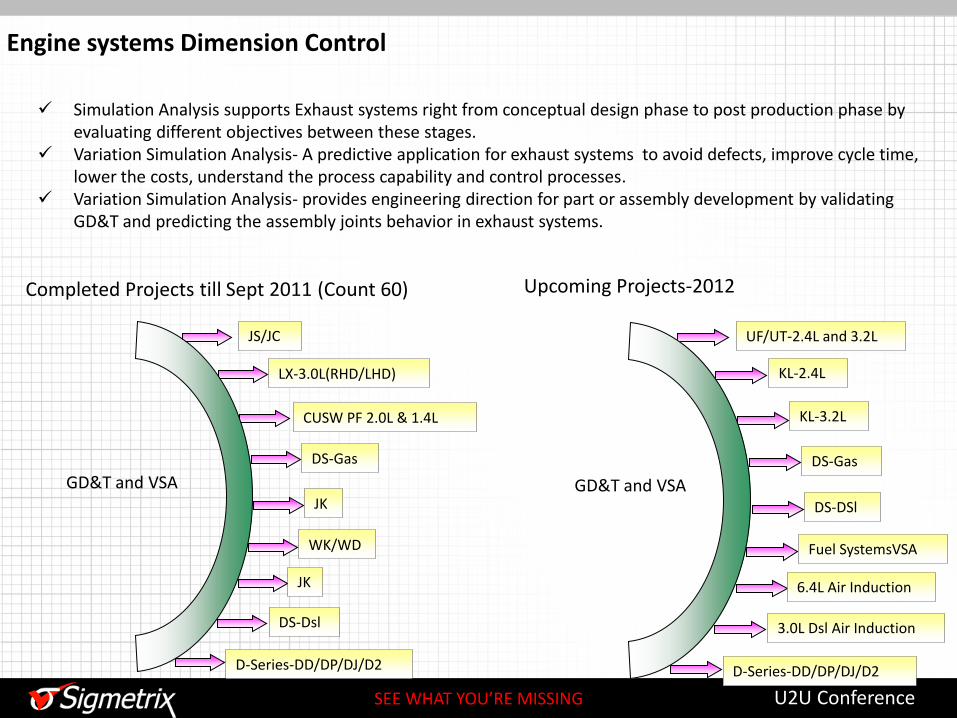
Engine systems Dimension Control
Simulation Analysis supports Exhaust systems right from conceptual design phase to post production phase by evaluating different objectives between these stages.
Variation Simulation Analysis- A predictive application for exhaust systems to avoid defects, improve cycle time, lower the costs, understand the process capability and control processes.
Variation Simulation Analysis- provides engineering direction for part or assembly development by validating GD&T and predicting the assembly joints behavior in exhaust systems.
GD&T and VSA
JS/JC
LX-3.0L(RHD/LHD)
CUSW PF 2.0L & 1.4L
DS-Gas
JK
WK/WD
JK
D-Series-DD/DP/DJ/D2
DS-Dsl
Completed Projects till Sept 2011 (Count 60)
GD&T and VSA
UF/UT-2.4L and 3.2L
KL-2.4L
KL-3.2L
DS-Gas
DS-DSl
Fuel SystemsVSA
6.4L Air Induction
D-Series-DD/DP/DJ/D2
3.0L Dsl Air Induction
Upcoming Projects-2012

SEE WHAT YOU’RE MISSING U2U Conference
Engine System Dimension Control Maturity va
lue
Support
Platform wise VSA Engagement
FY 2009 FY 2010
• Engine System Packaging & Functional Evaluation
•Engine System GD&T creation
•Engine System Gauging concept
•Field Failure or Plant Build Issue Evaluation
•Providing Design solution
Exhaust System Engineering
• Individual analysis Request based Work
• Fitment Analysis
•Subsystem clearance Analysis
FY 2012
•Involving in Joint definition
•Involvement in tooling kick off
•Involvement in Gauge review
• Feature functionality based VSA analysis
• Assembly Constraining- LX Dsl • Tooling kick off for LX & CUSW
• Tunnel to Hanger Clearance-Plant Issue • Tiger shark 2.0L Brace Fitment Analysis- Design Solution
• 2011 WK 3.6L Hot End Exhaust Steady Rest Bracket Fitment • Tiger Shark 2.0L Hot End Exhaust Fitment and sealing study

SEE WHAT YOU’RE MISSING U2U Conference
VSA for Solution-LT tip prominent
30
ASSEMBLY OVERVIEW
BODY FRAME EXHAUST
TAIL PIPE LH
EXHAUST TIP LH
EXHAUST TIP RH
EXHAUST TAIL PIPE RH
MUFFLER ASSEMBLY
EXTENSION PIPE EXHAUST PIPE ASSEMBLY
FRONT (Y-PIPE)
LOOSE FLANGES-NOT WELDED TO PIPES
VSA PROPOSAL 1 NORMA JOINT REMOVED
NORMA JOINT REMOVED
LOOSE FLANGES-NOT WELDED TO PIPES
VSA PROPOSAL 2
Problem Statement:
Cold End exhaust LT Tip more prominent as compared to RT tip
VSA Analysis output:
Design variation
Major contributors in system
Feature sensitivity
Design Recommendation
Advantages:
Number of parts reduced.
Number of Exhaust Joints reduced
Number of assembly operations reduced
Reduced tip variation.

SEE WHAT YOU’RE MISSING U2U Conference
Value Proposition: Reusability Concept
Power train variation for a particular Engine has been calculated separately & used as input for System level analysis across different platforms.
Re usability model
concept
5.7L 3.6L
1.4L 2.4L/2.0L
• Once a System level Model is created it can be reused to perform different tasks
– Evaluate different design proposals
• Different routing for clearance evaluation
• Various Joints (Exhaust System Joints) to understand system behavior
– Evaluate Supplier’s tolerance and Datum proposal
• Source Package tolerance and Datum evaluation
• Supplier’s feedback evaluation
– Evaluate different assembly concepts
• Torque sequence to negate assembly variations contributions
• Quick manufacturing data feedback by plugging data back into VSA model
Advantage:
• Reduction in Lead time
– Evaluation of different design configurations
– Gives decision making time on the basis of VSA
• Reduction in Execution effort (650 Hours of effort saved by implementing reusability concept till Sep-2011)

SEE WHAT YOU’RE MISSING U2U Conference 32
GDT allocation & Validation (AVS) GDT allocation & Validation work involves following major activities : Functionality tagging at feature level.
- Identification of functional / fit / assembly requirement of feature - Interrelationship among other feature - Relationship with Datum – Direct / Indirect compliance to Fit / Function.
Compliance to ASME / Company standards. - Datum Identification & Suitability. - Degree of Freedom (DOF) evaluation at feature level. - All relevant checks as per ASME standard - VCB Compatibility - Finalization of tolerance value (Component level or through Variation Simulation Analysis (VSA)).
Benchmarking against existing best practices. - For all possible cases checking with available company best practices - Input to designer with comparative details
Gauging & Manufacturability of Feature. - Cross verification of functional requirements with manufacturing sequence / feasibility. - Interaction with Chrysler Vendors as required for component gauging (Engine Systems).

SEE WHAT YOU’RE MISSING U2U Conference 33
Case Study : GDT AVS
Input Desired Output
Detailed Feature Level Breakup
ASME Compliance
Identification of Issue
Markup on Drawing to trace
Features Recommendation on GDT
Justification with proposed change

SEE WHAT YOU’RE MISSING U2U Conference 34
Thank You
![OBJECTIVE GRID FOR MICROSOFT .NET USER’S …...Table 1 – Objective Grid for Microsoft .NET Assemblies Assembly File Stingray.Grid [Stingray.GridUtils.dll] Stingray.GridControl](https://img.pdfslide.us/doc/110x75/5fc7dfb72fa2b424755900f9/objective-grid-for-microsoft-net-useras-table-1-a-objective-grid-for-microsoft.jpg)