Embed Size (px)
Citation preview

Matthew Pel, B.Tech., Eng.L. is a Building Science Consultant and Principal at Morrison Hershfield, Vancouver, BC. Derek Budde B.A.Sc. EIT is a Building Science Consultant at Morrison Hershfield, Vancouver, BC
Drainage Capabilities and Heat Loss of Different Inverted Roof Assemblies
Matthew Pel, B.Tech., Eng.L. Derek Budde, B.A.Sc. EIT
ABSTRACTEnergy use in buildings throughout North America has attracted significant attention over the past decade. In cold marine climates, rainwater management is also a critical aspect of the building enclosure and energy performance. Various drainage practices used for low slope inverted roofing are often designed without quantified data available regarding the cold rain affects on the thermal performance of the systems.
The effect of cold water under the roof insulation and its impact on the effective thermal performance in inverted roofs is well researched. The aim of this project was to develop a better understanding of the impact of cold rain events on the effective thermal performance of inverted roofs in an effort to develop best practice inverted roofs design guidelines.
The project included the construction of a ‘calibrated hot box’ to mimic the temperature difference between interior and exterior winter conditions. The evaluated roof assemblies consist of typical inverted roofs (membrane, drainage layer, insulation, filter fabric and ballast). Evaluation was conducted with different variables including rain rates, insulation orientation, insulation gaps, and different types of drainage mats and the exclusion of drainage mat below the insulation. Later evaluations included a loose-laid moisture shedding layer above the insulation and changing the roof slope.
Evaluations have indicated that although the drainage capacity and leakage rates of different roof assemblies depend on a number of factors, the majority of rainwater drains at the membrane level in all test scenarios. Based on the analysis completed, the results show that different drainage scenarios do have an impact on the overall effective thermal performance of inverted roof assemblies. The most significant heat loss and unexpected results was the increased heat loss when the drainage mat was removed and insulation was in direct contact with the roofing membrane.
INTRODUCTION
Energy use in buildings throughout the Pacific Northwest and North America has attracted significant attention over the past decade. In British Columbia, rainwater management is also a critical aspect of designing a durable building envelope. Various drainage practices used in low slope inverted roofs (i.e. grooved insulation, drainage mat, vapour permeable water resistant barrier, etc.) are often used without much quantified information available as to the thermal performance of the systems when exposed to rainfall. The affect of water under the insulation and its impact on the thermal performance in inverted roofs is well researched over the past several decades
(Cold Region Research and Engineering Laboratory March 1976. Protected Membrane Roofs in Cold; Cold Region Research and Engineering Laboratory, April 1977. Observations and Analysis of Protected Membrane Roofing Systems).
Drainage of water within an inverted roof assembly, on the other hand, has not been extensively evaluated, including draining at insulation levels or at the membrane level and how different drainage options affect the thermal performance of the roof assembly resulting from cold rain bypassing the insulation.
Inverted roofs assemblies are commonly used within the Pacific Northwest area and are generally applied directly to concrete for a variety of reasons:
Thermal protection of the roofing membrane and minimizing thermal cycling
Eliminating roofing membrane exposure to ultra violet radiation
Speed of construction and ability to install roofing membrane shortly after roof structure is completed
This study included the following tasks:
1. Literature review of past research related to heat loss in low slope inverted roof assemblies and drainage rates
2. Evaluation of impact of different drainage scenarios on the rainfall drainage capability at the membrane level and at the insulation level
3. Assessing the impact of different drainage scenarios on the thermal performance of the roof during rain periods
METHODOLOGY AND TESTING EQUIPMENT
Hot Box Construction
In this research project, an insulated hot box was constructed and calibrated to provide a temperature difference across different inverted roof assemblies to mimic an in-situ roof (refer to Figure 1 for hot box section) . The hot box apparatus was constructed in two pieces, the base and lid, and is wood framed. The hot box is designed and constructed to reduce air leakage within the chamber and minimize thermal bridging at the sides at bottom. Continuous layers of self-adhering membrane were installed over the framed hot box with 150mm of adhered rigid extruded polystyrene insulation. To seal the lid to the base a double layer of foam gasket is installed to reduce air leakage and increase the thermal resistance.

Since the pattern or location of water flow under the insulation is unknown and cannot be confirmed, a continuous aluminum base (Figure 2) was installed prior to the roofing membrane installation to help average out and more evenly distribute the localized heat loss paths through the roof assembly.
Drains for the roof assembly (hot box lid) were provided at the membrane level and the insulation level (Figure 2), allowing for measurement of drainage and water temperature. Figure 3 shows the completed hot box with a partial inverted roof assembly installed.
Figure 2 – Hot Box Aluminum Base Figure 3 – Hot Box with Roof Insulation
Roof Assemblies and Drainage Options
Typical components of an inverted roof assembly (from bottom to top of the system) include a waterproofing membrane, drainage layer, insulation, filter fabric and ballast. Multiple variations of the above described assembly can be used depending on the design intent and/or consultant. Inverted roof assemblies and drainage options commonly used in the Pacific Northwest include:
Figure 1 – Insulated Hot Box Section
Location of aluminum base
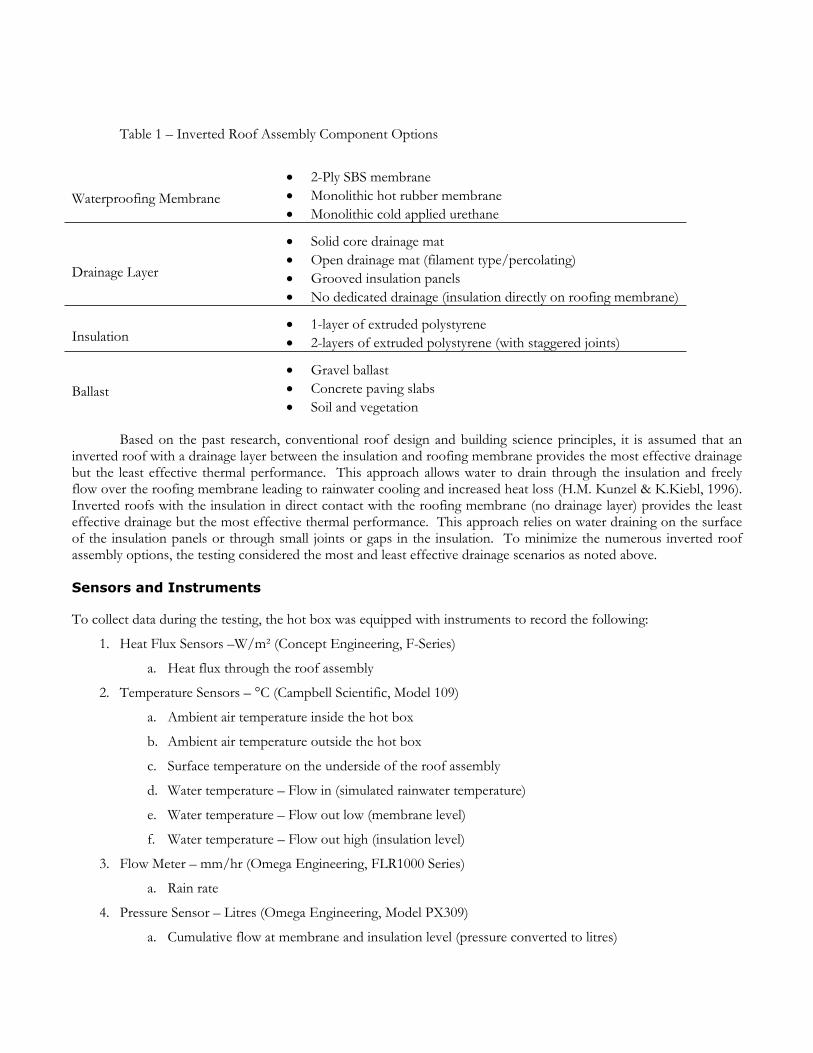
Table 1 – Inverted Roof Assembly Component Options
Waterproofing Membrane 2-Ply SBS membrane Monolithic hot rubber membrane Monolithic cold applied urethane
Drainage Layer
Solid core drainage mat Open drainage mat (filament type/percolating) Grooved insulation panels No dedicated drainage (insulation directly on roofing membrane)
Insulation 1-layer of extruded polystyrene 2-layers of extruded polystyrene (with staggered joints)
Ballast Gravel ballast Concrete paving slabs Soil and vegetation
Based on the past research, conventional roof design and building science principles, it is assumed that an inverted roof with a drainage layer between the insulation and roofing membrane provides the most effective drainage but the least effective thermal performance. This approach allows water to drain through the insulation and freely flow over the roofing membrane leading to rainwater cooling and increased heat loss (H.M. Kunzel & K.Kiebl, 1996). Inverted roofs with the insulation in direct contact with the roofing membrane (no drainage layer) provides the least effective drainage but the most effective thermal performance. This approach relies on water draining on the surface of the insulation panels or through small joints or gaps in the insulation. To minimize the numerous inverted roof assembly options, the testing considered the most and least effective drainage scenarios as noted above.
Sensors and Instruments
To collect data during the testing, the hot box was equipped with instruments to record the following:
1. Heat Flux Sensors –W/m² (Concept Engineering, F-Series)
a. Heat flux through the roof assembly
2. Temperature Sensors – °C (Campbell Scientific, Model 109)
a. Ambient air temperature inside the hot box
b. Ambient air temperature outside the hot box
c. Surface temperature on the underside of the roof assembly
d. Water temperature – Flow in (simulated rainwater temperature)
e. Water temperature – Flow out low (membrane level)
f. Water temperature – Flow out high (insulation level)
3. Flow Meter – mm/hr (Omega Engineering, FLR1000 Series)
a. Rain rate
4. Pressure Sensor – Litres (Omega Engineering, Model PX309)
a. Cumulative flow at membrane and insulation level (pressure converted to litres)
A number of measures were in place during this study to ensure the results are repeatable and to minimize the potential experimental error, they include:
Redundant sensors were installed
Multiple re-tests were completed
Heat loss through roof assembly was compared with water temperature increase (conservation of energy)
Scenarios and Variables
As noted in the Roof Assemblies and Drainage Options section (above), the most and least effective drainage options and the most efficient thermal performance options were considered in testing to determine the upper and the lower bounds of heat loss rates. Within these roof assemblies various scenarios were considered. Test scenarios were developed to isolate individual variables related to roof assembly components and installation. As previously noted, it is commonly thought that the best thermally performing inverted roof assembly is when the insulation is in intimate contact with the roof membrane. It is also commonly thought that the best drainage provision for an inverted roof assembly is when drainage mat is provided as a cavity between the roof membrane and the insulation. The primary objective of this study was to compare and evaluate the heat loss through an inverted roof assembly, including or omitting drainage space at the membrane level.
We recognize the variance in installation of individual roof components, such as insulation thickness and changes in environmental conditions, like temperature differences and rainfall rates, may impact the performance of the roof assembly differently. This study provides a comparison of varying drainage scenarios while holding all other variables and bounded conditions constant.
Construction variances in the installation of rigid extruded polystyrene insulation, such as the orientation of the boards relative to roof slope (long side of insulation panel is parallel or perpendicular direction to slope) and the tightness of insulation boards joints (no gaps or gaps) were considered. It is important to recognize that often these variables are encountered unavoidably but are within standard construction tolerances. For instance, when roofs have centrally located roof drains, half the insulation boards may run parallel to the slope and half run perpendicular. Boards may be installed with tight shiplapped joints in the summer; however, in the winter gaps would be present due to shrinkage of the insulation.
The expansion/contraction of the insulation boards was calculated using the following:
∆𝐿 = 𝛼𝐿ₒ∆𝑇
Where: ΔL = Change in length of specimen (expansion/contraction); ΔL= mm (in)
α = Coefficient of Thermal Expansion; α= 6.3 x 10ˉ² mm/m °C (3.5 x 10ˉ5 in/in °F)
L0 = Initial Length of Board; Width 600mm (24”), Length 1200mm (48”)
ΔT = Final Temperature – Initial Temperature; 21°C - 1°C= 20 °C (68°F)
The shrinkage of the board (lengthwise) was calculated to be approximately 1.5mm or (1/16”). The shrinkage of the board (widthwise) was calculated to be approximately 0.75mm (1/32”). For testing purposes, tight board joints were used to simulate best case conditions and 1.5mm gaps were used to simulate worst case conditions.
Environmental conditions like temperatures and wind may also affect the performance of the inverted roof assembly. Rainfall rates directly correlate to the amount of water running over the roof, and at different rates it was hypothesized that there may be more flow of water on top of the insulation versus at the roof membrane level.
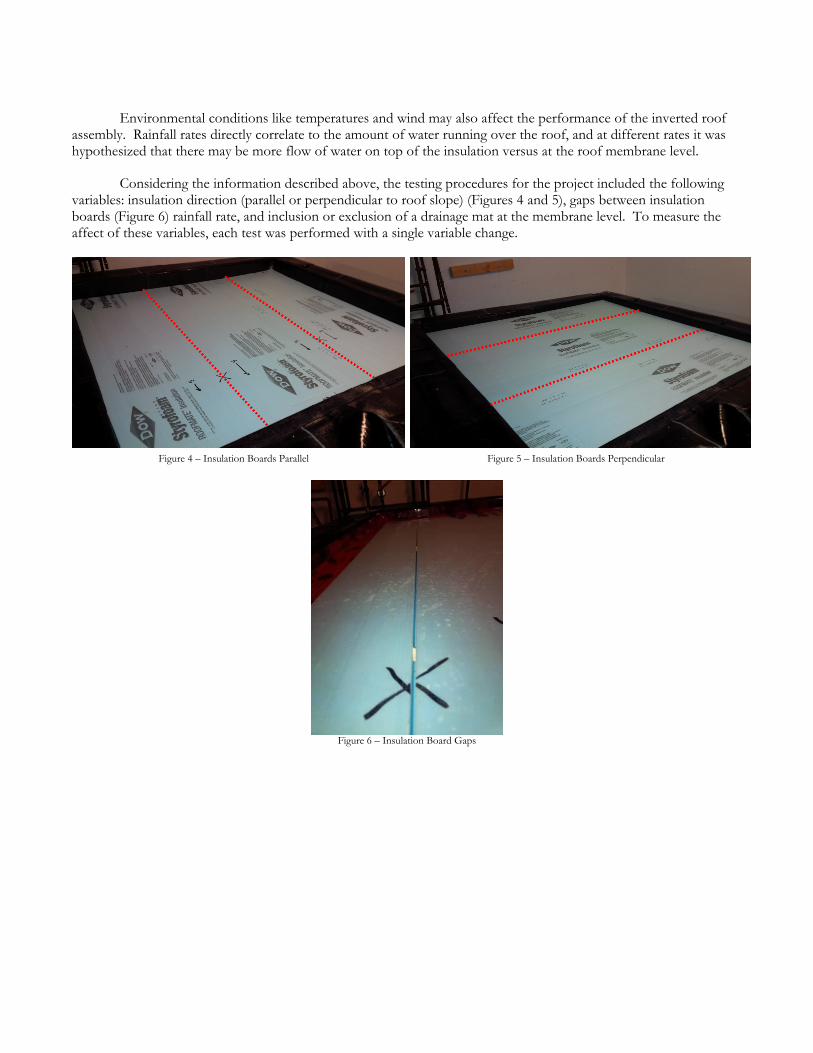
Considering the information described above, the testing procedures for the project included the following variables: insulation direction (parallel or perpendicular to roof slope) (Figures 4 and 5), gaps between insulation boards (Figure 6) rainfall rate, and inclusion or exclusion of a drainage mat at the membrane level. To measure the affect of these variables, each test was performed with a single variable change.
Figure 4 – Insulation Boards Parallel Figure 5 – Insulation Boards Perpendicular
Figure 6 – Insulation Board Gaps
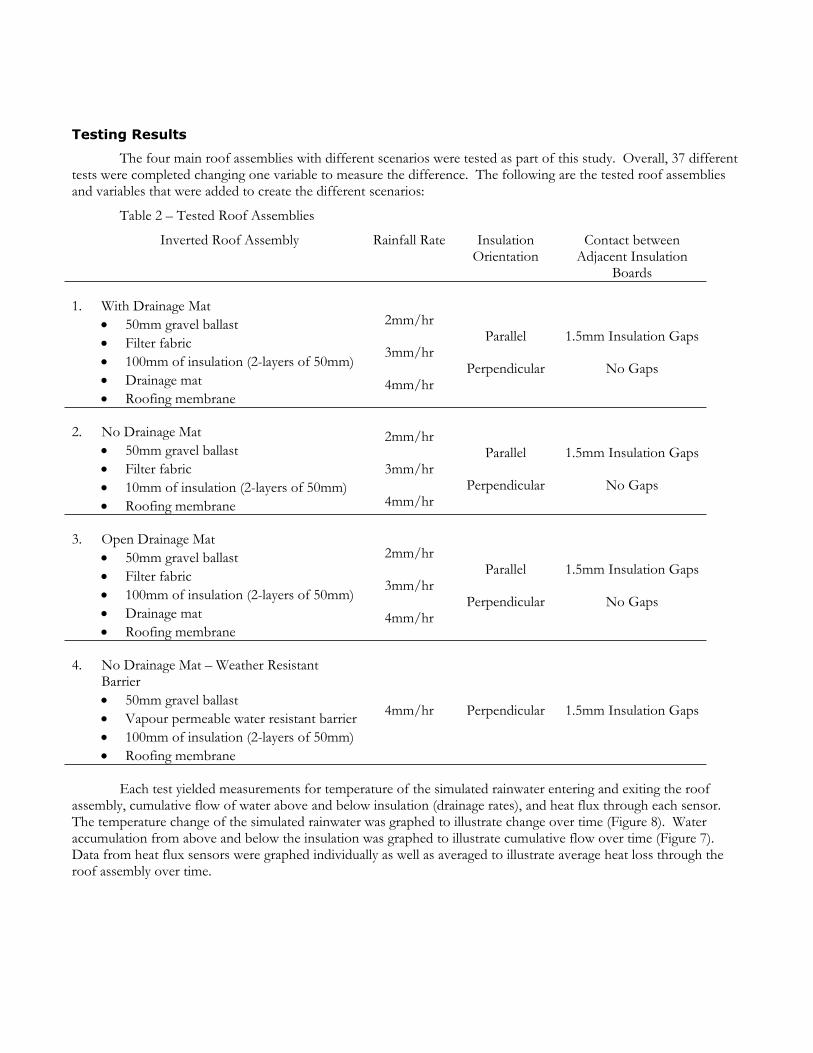
Testing Results
The four main roof assemblies with different scenarios were tested as part of this study. Overall, 37 different tests were completed changing one variable to measure the difference. The following are the tested roof assemblies and variables that were added to create the different scenarios:
Table 2 – Tested Roof Assemblies
Inverted Roof Assembly Rainfall Rate Insulation Orientation
Contact between Adjacent Insulation
Boards
1. With Drainage Mat 50mm gravel ballast Filter fabric 100mm of insulation (2-layers of 50mm) Drainage mat Roofing membrane
2mm/hr
3mm/hr
4mm/hr
Parallel
Perpendicular
1.5mm Insulation Gaps
No Gaps
2. No Drainage Mat 50mm gravel ballast Filter fabric 10mm of insulation (2-layers of 50mm) Roofing membrane
2mm/hr
3mm/hr
4mm/hr
Parallel
Perpendicular
1.5mm Insulation Gaps
No Gaps
3. Open Drainage Mat 50mm gravel ballast Filter fabric 100mm of insulation (2-layers of 50mm) Drainage mat Roofing membrane
2mm/hr
3mm/hr
4mm/hr
Parallel
Perpendicular
1.5mm Insulation Gaps
No Gaps
4. No Drainage Mat – Weather Resistant Barrier 50mm gravel ballast Vapour permeable water resistant barrier 100mm of insulation (2-layers of 50mm) Roofing membrane
4mm/hr Perpendicular 1.5mm Insulation Gaps
Each test yielded measurements for temperature of the simulated rainwater entering and exiting the roof assembly, cumulative flow of water above and below insulation (drainage rates), and heat flux through each sensor. The temperature change of the simulated rainwater was graphed to illustrate change over time (Figure 8). Water accumulation from above and below the insulation was graphed to illustrate cumulative flow over time (Figure 7). Data from heat flux sensors were graphed individually as well as averaged to illustrate average heat loss through the roof assembly over time.
Drainage Rates
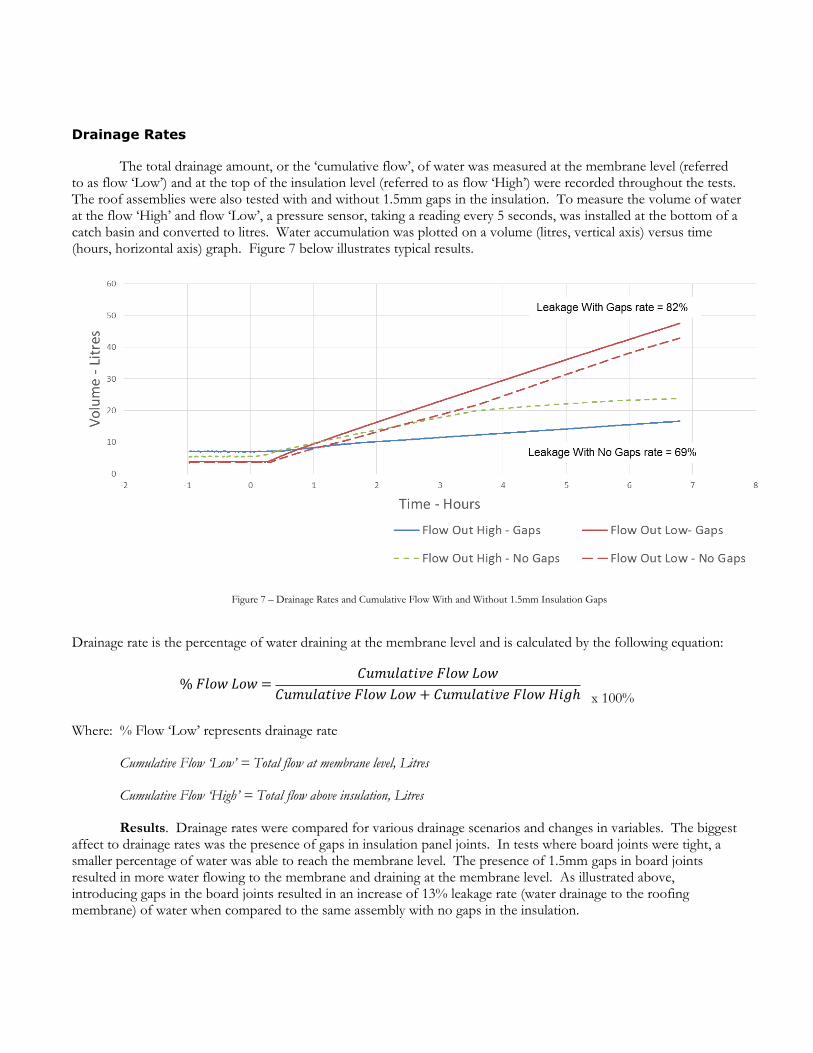
The total drainage amount, or the ‘cumulative flow’, of water was measured at the membrane level (referred to as flow ‘Low’) and at the top of the insulation level (referred to as flow ‘High’) were recorded throughout the tests. The roof assemblies were also tested with and without 1.5mm gaps in the insulation. To measure the volume of water at the flow ‘High’ and flow ‘Low’, a pressure sensor, taking a reading every 5 seconds, was installed at the bottom of a catch basin and converted to litres. Water accumulation was plotted on a volume (litres, vertical axis) versus time (hours, horizontal axis) graph. Figure 7 below illustrates typical results.
Drainage rate is the percentage of water draining at the membrane level and is calculated by the following equation:
x 100%% 𝐹𝑙𝑜𝑤 𝐿𝑜𝑤 =
𝐶𝑢𝑚𝑢𝑙𝑎𝑡𝑖𝑣𝑒 𝐹𝑙𝑜𝑤 𝐿𝑜𝑤𝐶𝑢𝑚𝑢𝑙𝑎𝑡𝑖𝑣𝑒 𝐹𝑙𝑜𝑤 𝐿𝑜𝑤 + 𝐶𝑢𝑚𝑢𝑙𝑎𝑡𝑖𝑣𝑒 𝐹𝑙𝑜𝑤 𝐻𝑖𝑔ℎ
Where: % Flow ‘Low’ represents drainage rate
Cumulative Flow ‘Low’ = Total flow at membrane level, Litres
Cumulative Flow ‘High’ = Total flow above insulation, Litres
Results. Drainage rates were compared for various drainage scenarios and changes in variables. The biggest affect to drainage rates was the presence of gaps in insulation panel joints. In tests where board joints were tight, a smaller percentage of water was able to reach the membrane level. The presence of 1.5mm gaps in board joints resulted in more water flowing to the membrane and draining at the membrane level. As illustrated above, introducing gaps in the board joints resulted in an increase of 13% leakage rate (water drainage to the roofing membrane) of water when compared to the same assembly with no gaps in the insulation.
Figure 7 – Drainage Rates and Cumulative Flow With and Without 1.5mm Insulation Gaps

It is important to note that in tests where no gaps were present the majority of water still leaked to the membrane level. This suggests that the majority of water is bypassing the insulation.
Temperature Readings
Temperatures were measured and the hot box assembly was at steady state prior to test starting, as a baseline. Temperature was plotted on a temperature (°C, vertical axis) versus time (hours, horizontal axis) graph for each sensor. The following temperature measurements were obtained throughout the tests:
Water temperature at ‘flow in’ or the water supply, (purple curve) Ambient temperature of the room, (green curve) Air temperature inside the hot box, (red and blue curves) Water temperature at the ‘High’ outflow (above insulation), (light blue curve) Water temperature at the ‘Low’ outflow (waterproofing membrane level), (orange curve)
Figure 8 - Represents temperatures during and following a simulated rainfall event on an inverted roof assembly:
Referencing Figure 8 above, there is a constant 18°C temperature difference across the roof assembly prior to the start of the rainfall event. This is visible on the left of the zero time mark. After the rainfall event starts, a short delay occurs as the water accumulates on the gravel ballast, begins to percolate and drain through the system as resistance and surface tension of water is overcome.
As the simulated rainwater drains through the roof assembly a portion is diverted to the roof membrane level through joints between the insulation boards. This water flows below the insulation and contacts the roof membrane (when no drainage mat is present). Heat is transferred from the heated space below through the roof deck resulting in
Exterior Air Temperatures & Water Temperature at Flow ‘High’
Water Temperature at Flow ‘Low’
Hot Box Temperatures
Δ18°C
Figure 8 – Temperature Readings
temperature increase. This is apparent in the spike of the ‘water temperature at flow Low’ trend line in the Figure 8 (orange line). As this water is gaining heat from the roof structure below, the interior hot box temperatures are reduced over time as visible in Figure 8 (red and blue lines).
The portion of the simulated rainfall that remains on the upper surface of the insulation boards flows to the upper drain and is identified as ‘flow-out High’. As noted in Figure 8 (light blue line) above, there is very little change in this water temperature as the rainfall event progresses. Water flowing on top of the insulation is not subject to the same surface temperature difference and therefore does not gain much heat.
It was observed that the more water remains in intimate contact with the roof membrane the greater the temperature increase of the outflow water at the membrane level (flow ‘Low’) and the greater heat flux through the test assembly.
Heat Flux
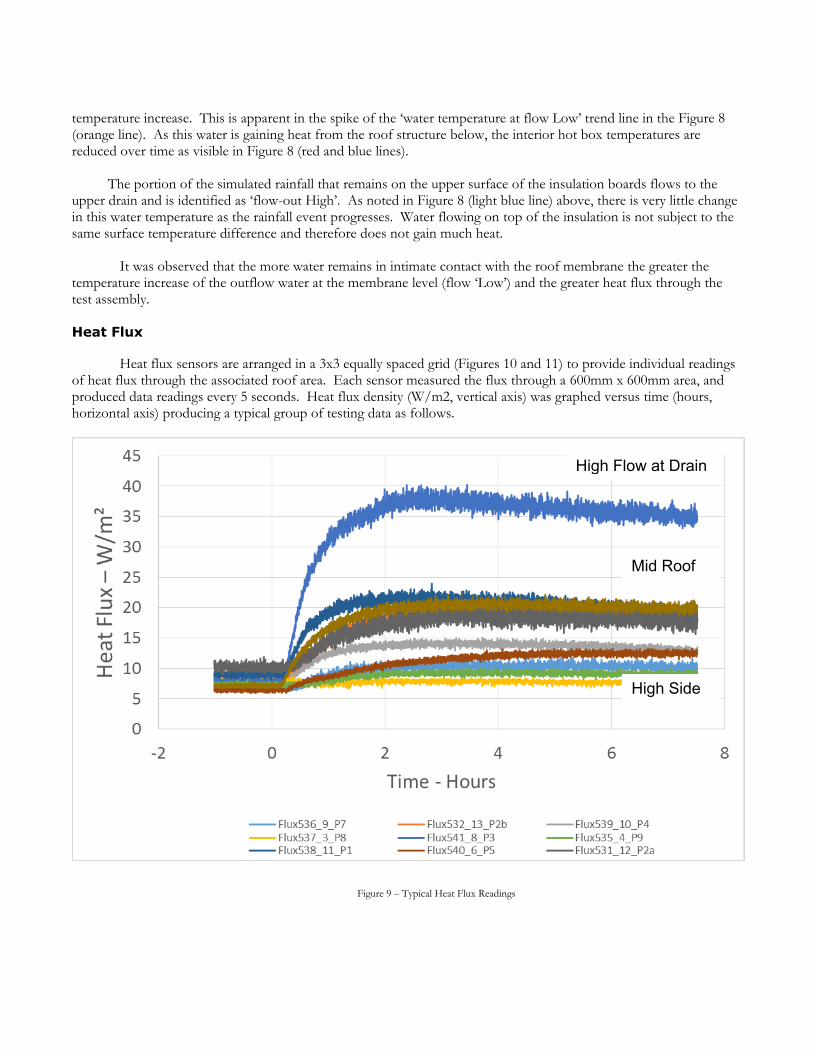
Heat flux sensors are arranged in a 3x3 equally spaced grid (Figures 10 and 11) to provide individual readings of heat flux through the associated roof area. Each sensor measured the flux through a 600mm x 600mm area, and produced data readings every 5 seconds. Heat flux density (W/m2, vertical axis) was graphed versus time (hours, horizontal axis) producing a typical group of testing data as follows.
High Flow at Drain
Mid Roof
High Side
Figure 9 – Typical Heat Flux Readings

Results. Heat flux sensors located near the scupper drain (Figure 9) on the roof assembly (low point), receive the most water flow over the sensor as this is the low-spot of the roof. Therefore, these roof areas have the highest heat flow. This is illustrated in flux sensor P8 (light blue) above. Sensors located in the mid-roof or mid-slope area receive less volume of water flow than at the drain. This is illustrated in the group of sensors labelled ‘mid roof’, above. Sensors located at the high-side of the roof receive little or no water flow over them. As such, the heat flux increase through that roof area is low.
All testing completed shows that as the simulated rainwater percolates through the roof assembly and reaches the membrane level it continually accumulates and absorbs energy (increases heat flow) as it flows over the membrane towards the drain. It was observed that the more volume of water that flows over a given roof area (at the membrane level) directly corresponds to an increase in overall heat loss.
Figure 10 – Layout of Heat Flux Sensors Figure 11 – Location of Heat Flux Sensors on Underside of Hot Lid
Average Heat Flux Increase
Ten heat flux sensors (9 locations, 1 redundant) were averaged to create a single trend line for each test. Variables between tests were then compared to determine the effects.
Insulation Board Orientation
Insulation boards were varied to be oriented either parallel to the roof slope or perpendicular (Figures 4 and 5 above). The following graph illustrates two tests, one with the insulation boards oriented parallel and the other perpendicular to the roof slope (all other variables remained the same). As noted in Drainage Rates section above, it was expected that increased simulated rainwater would reach the membrane level flow ‘Low’ when the insulation boards are perpendicular to the roof slope. As noted in Figure 12, increased heat flow was recorded through the tested roof assembly with perpendicular insulation boards.
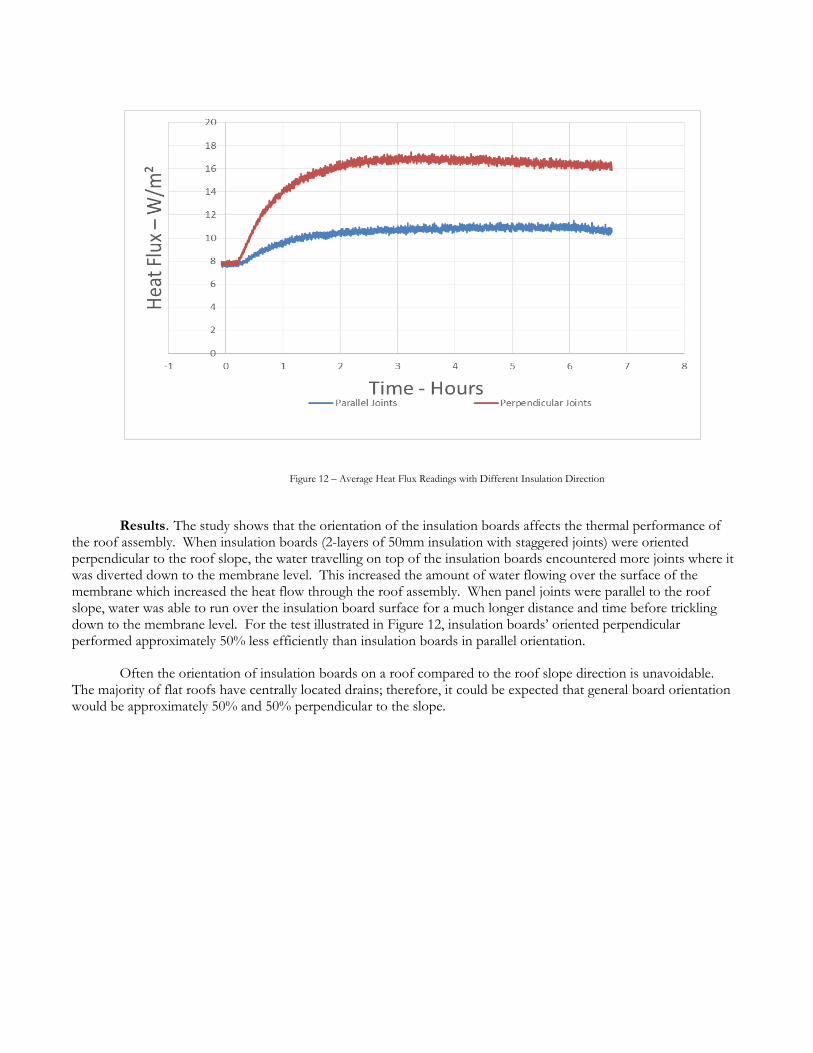
Results. The study shows that the orientation of the insulation boards affects the thermal performance of the roof assembly. When insulation boards (2-layers of 50mm insulation with staggered joints) were oriented perpendicular to the roof slope, the water travelling on top of the insulation boards encountered more joints where it was diverted down to the membrane level. This increased the amount of water flowing over the surface of the membrane which increased the heat flow through the roof assembly. When panel joints were parallel to the roof slope, water was able to run over the insulation board surface for a much longer distance and time before trickling down to the membrane level. For the test illustrated in Figure 12, insulation boards’ oriented perpendicular performed approximately 50% less efficiently than insulation boards in parallel orientation.
Often the orientation of insulation boards on a roof compared to the roof slope direction is unavoidable. The majority of flat roofs have centrally located drains; therefore, it could be expected that general board orientation would be approximately 50% and 50% perpendicular to the slope.
Figure 12 – Average Heat Flux Readings with Different Insulation Direction
Insulation Board Joints
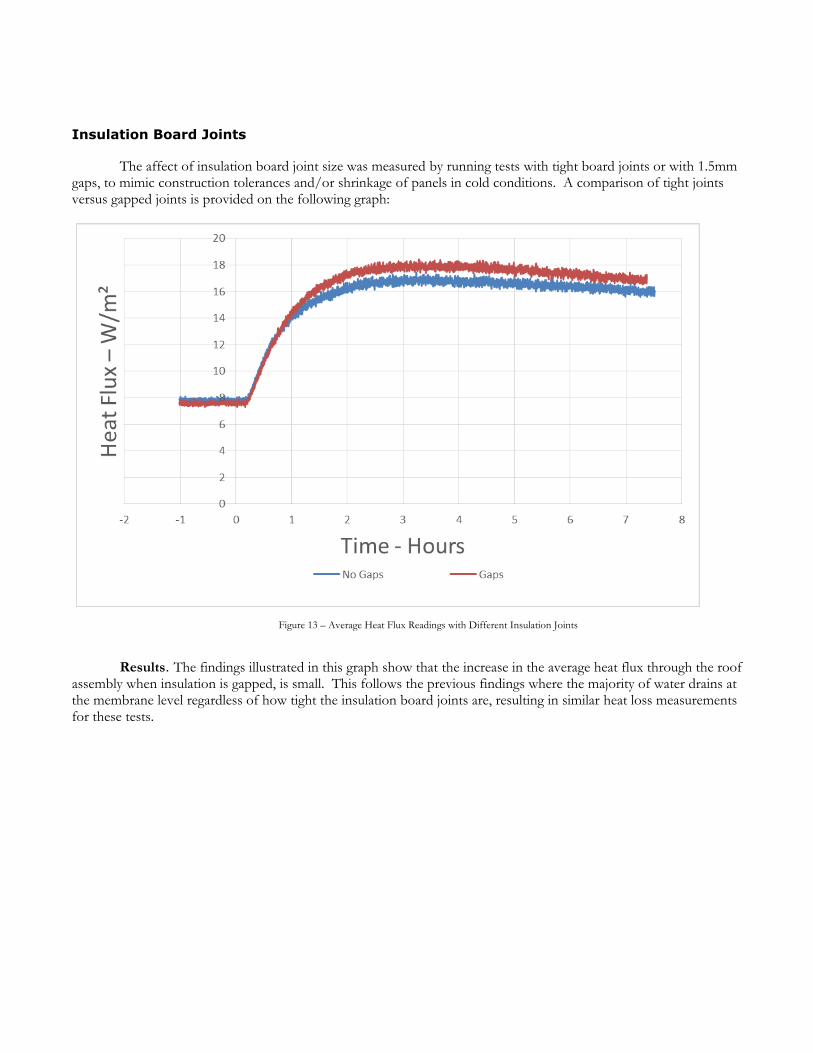
The affect of insulation board joint size was measured by running tests with tight board joints or with 1.5mm gaps, to mimic construction tolerances and/or shrinkage of panels in cold conditions. A comparison of tight joints versus gapped joints is provided on the following graph:
Results. The findings illustrated in this graph show that the increase in the average heat flux through the roof assembly when insulation is gapped, is small. This follows the previous findings where the majority of water drains at the membrane level regardless of how tight the insulation board joints are, resulting in similar heat loss measurements for these tests.
Figure 13 – Average Heat Flux Readings with Different Insulation Joints

Drainage Mat vs. No Drainage Mat
It is commonly thought that the best thermally performing inverted roof assembly has the insulation in intimate contact with the roofing membrane. The theory is that the presence of a drainage mat between the insulation and the roof membrane creates an air cavity diminishing the effective insulation value and allows a space for flow of cold rain.
The graph below illustrates typical test results for inclusion or exclusion of drainage mat. A solid-core drainage mat was used, which is comprised of a solid polyethylene dimple board and filter fabric facer.
.
Results. Contrary to expectations, it was observed that the increase in heat flux through the roof assembly during a rain event was greater if drainage mat was omitted. The red trend line in the graph is the average heat flux through the roof assembly including a solid core drainage mat, while the blue trend line is excluding a drainage mat.
For the test illustrated in Figure 14, it was observed that during the rain event the overall heat flux through the roof increased by approximately 75% with the presence of a drainage mat. When the drainage mat was excluded in the roof assembly, with all other testing parameters remaining the same, the heat flux increased an additional 40%.
It is theorized that the observed performance of included or excluded drainage mat may be associated with the direct contact between the water, flowing under the insulation and on top of the roof membrane. When a solid
Figure 14 – Average Heat Flux Readings With and Without Drainage Mat
75%
40%
core drainage mat is provided under the insulation, the water flows on the polyethylene core to the roof drains. This provides one level of separation from direct contact with the roof membrane. In the case when drainage mat is omitted, the water is in intimate contact with the roof membrane resulting in a higher heat transfer.
Open-Core (Filament Type/Percolating) Drainage Mat
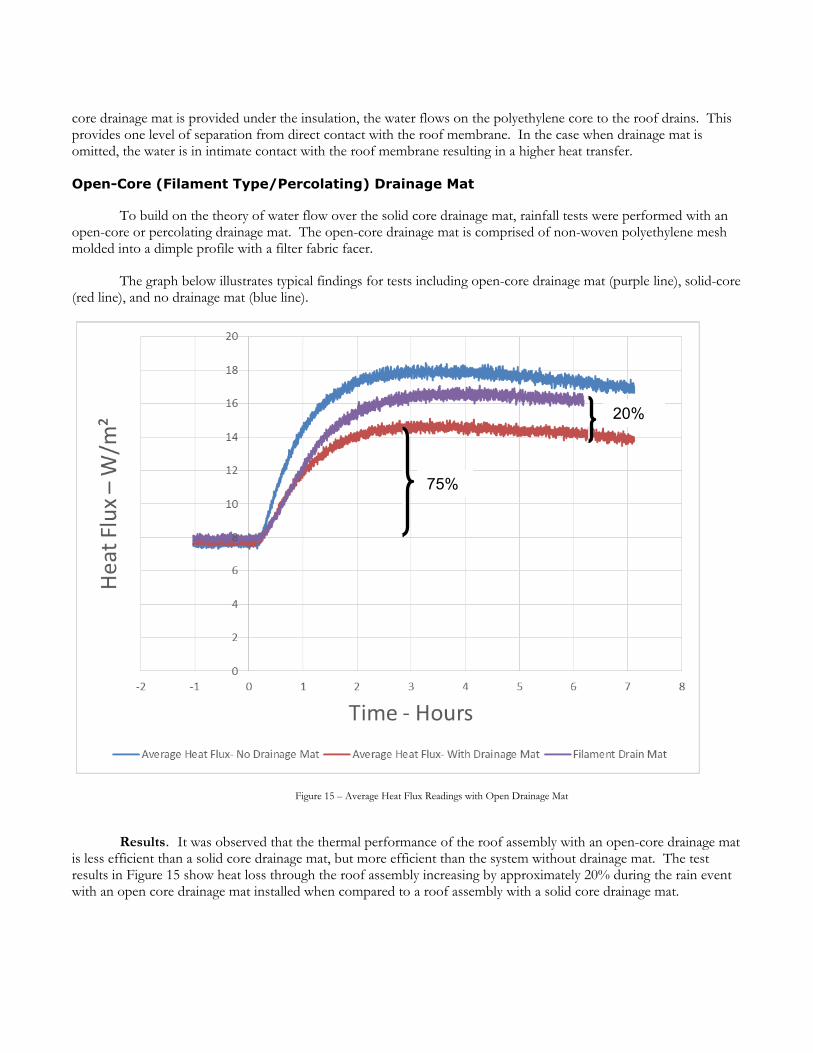
To build on the theory of water flow over the solid core drainage mat, rainfall tests were performed with an open-core or percolating drainage mat. The open-core drainage mat is comprised of non-woven polyethylene mesh molded into a dimple profile with a filter fabric facer.
The graph below illustrates typical findings for tests including open-core drainage mat (purple line), solid-core (red line), and no drainage mat (blue line).
Results. It was observed that the thermal performance of the roof assembly with an open-core drainage mat is less efficient than a solid core drainage mat, but more efficient than the system without drainage mat. The test results in Figure 15 show heat loss through the roof assembly increasing by approximately 20% during the rain event with an open core drainage mat installed when compared to a roof assembly with a solid core drainage mat.
Figure 15 – Average Heat Flux Readings with Open Drainage Mat
75%
20%
It is theorized that the solid-core drainage mat provides an additional layer of separation from the roofing membrane. Reducing the direct water contact with the roofing membrane reduces heat transfer. Where the open-core drainage allows water to flow directly over the roofing membrane thus increasing heat transfer.
Water Resistant Weather Barrier Overlay
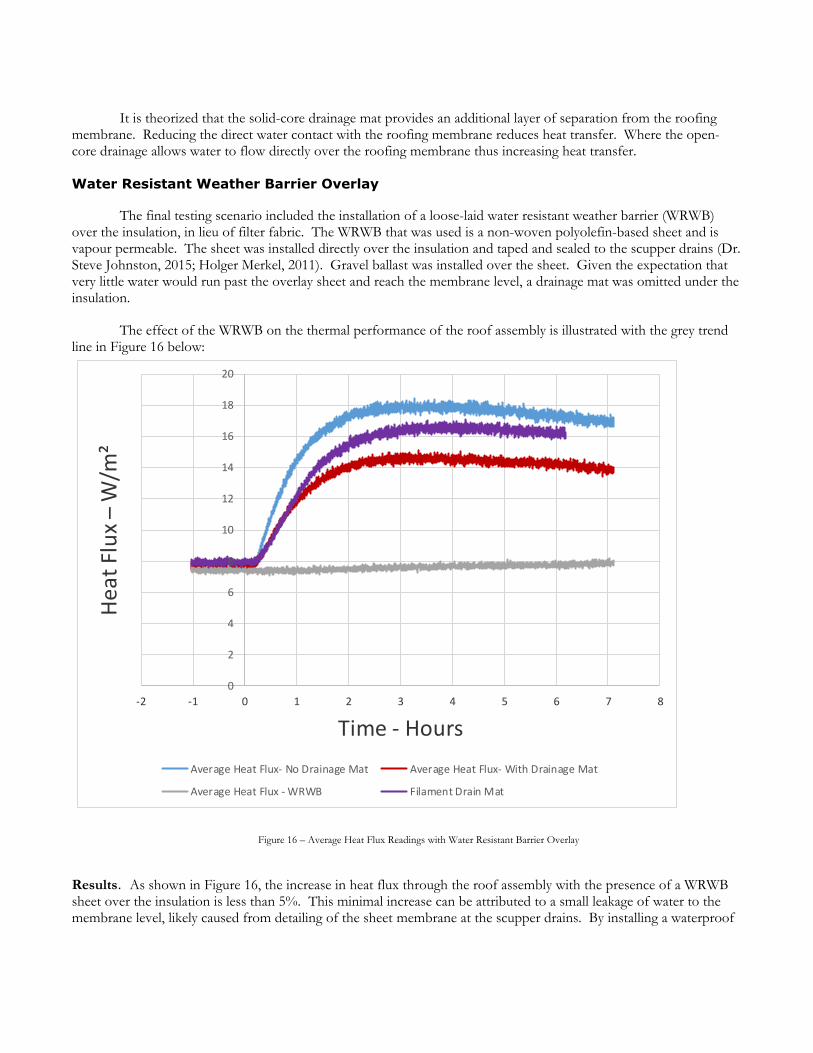
The final testing scenario included the installation of a loose-laid water resistant weather barrier (WRWB) over the insulation, in lieu of filter fabric. The WRWB that was used is a non-woven polyolefin-based sheet and is vapour permeable. The sheet was installed directly over the insulation and taped and sealed to the scupper drains (Dr. Steve Johnston, 2015; Holger Merkel, 2011). Gravel ballast was installed over the sheet. Given the expectation that very little water would run past the overlay sheet and reach the membrane level, a drainage mat was omitted under the insulation.
The effect of the WRWB on the thermal performance of the roof assembly is illustrated with the grey trend line in Figure 16 below:
0
2
4
6
8
10
12
14
16
18
20
-2 -1 0 1 2 3 4 5 6 7 8
Heat
Flu
x –W
/m²
Time - HoursAverage Heat Flux- No Drainage Mat Average Heat Flux- With Drainage Mat
Average Heat Flux - WRWB Filament Drain Mat
Results. As shown in Figure 16, the increase in heat flux through the roof assembly with the presence of a WRWB sheet over the insulation is less than 5%. This minimal increase can be attributed to a small leakage of water to the membrane level, likely caused from detailing of the sheet membrane at the scupper drains. By installing a waterproof
Figure 16 – Average Heat Flux Readings with Water Resistant Barrier Overlay
sheet above the insulation, the vast majority of water is directed to the drains and is prevented from reaching the roof membrane level.
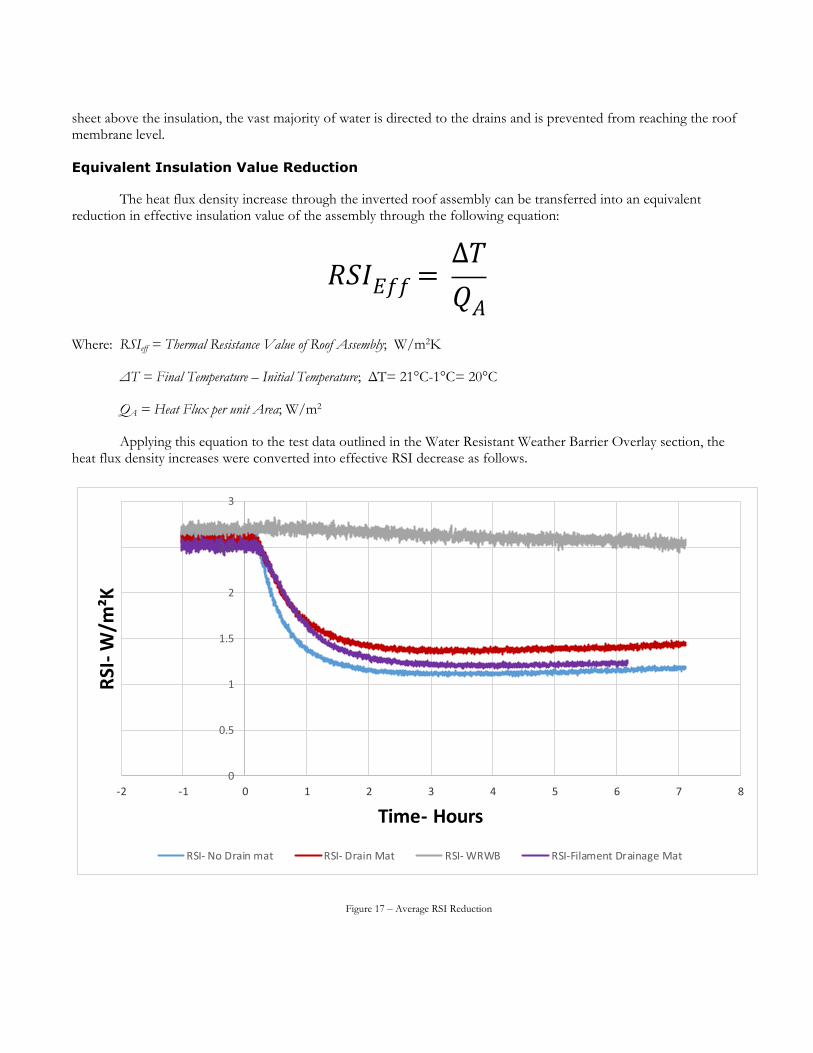
Equivalent Insulation Value Reduction
The heat flux density increase through the inverted roof assembly can be transferred into an equivalent reduction in effective insulation value of the assembly through the following equation:
𝑅𝑆𝐼𝐸𝑓𝑓 = ∆𝑇𝑄𝐴
Where: RSIeff = Thermal Resistance Value of Roof Assembly; W/m2K
ΔT = Final Temperature – Initial Temperature; ΔT= 21°C-1°C= 20°C
QA = Heat Flux per unit Area; W/m2
Applying this equation to the test data outlined in the Water Resistant Weather Barrier Overlay section, the heat flux density increases were converted into effective RSI decrease as follows.
0
0.5
1
1.5
2
2.5
3
-2 -1 0 1 2 3 4 5 6 7 8
RSI-W/m
²K
Time- Hours
RSI- No Drain mat RSI- Drain Mat RSI- WRWB RSI-Filament Drainage Mat
Figure 17 – Average RSI Reduction
The roof assembly began with an effective insulation value of approximately RSI 2.6 (R15) at steady-state, which was calculated based on the thermal resistance of the roof assembly components and losses due to thermal bridging. It is notable that the effective decrease in insulation value for the following testing scenarios are:
No drainage mat- Loss of approx. RSI 1.5 (R9)
Open-core drainage mat- Loss of approx. RSI 1.4 (R8)
Solid-core drainage mat- Loss of approx. RSI 1.2 (R7)
Waterproof sheet overlay- Loss of less than RSI 0.2 (<R1)
SUMMARY
The drainage capacity of different roof assemblies depends on a number of factors; however, in all the test scenarios the majority of rainwater runoff drains at the membrane level. The quantity of water that drains at the membrane level and from the top surface of the insulation largely depends on the following factors:
1. Insulation panel direction. The leakage rates are reduced when the insulation panels are installed parallel to the slope.
2. Gaps between insulation panels. The thermal contraction of insulation panels during colder months increases the leakage rates.
Based on the testing completed, despite the small sample size, the results show that different drainage scenarios do have an impact on the thermal performance of inverted roof assemblies. Insulation panel direction, rainfall rates and insulation board direction all affected the thermal performance of inverted roof assemblies. The most significant heat loss and unexpected result was the increased heat loss when the drainage mat was removed and the insulation was in direct contact with the roofing membrane. Prior to the testing, it was thought that a drainage mat installed under the insulation would increase air movement and water drainage at the membrane level reducing the thermal performance of the inverted roof assembly. The contact between rainwater and the roofing membrane is a significant factor that increases heat flow through inverted roofs. As expected, installing a WRWB layer over the insulation significantly reduces water drainage under the insulation and improves the thermal performance of the inverted roof.
The findings show the effective thermal performance (from most to least efficient) of inverted roof assemblies is
1. Inverted assembly with no drainage mat under the insulation and a vapour permeable layer over the insulation
2. Inverted assembly with a solid core drainage mat under the insulation
3. Inverted assembly with insulation in direct contact with the roofing membrane

ACKNOWLEDGMENTS
This research project was prepared by Morrison Hershfield and funded by the Homeowner Protection Office, a branch of BC Housing. Special thanks is extended to Dow Building Solutions for providing technical and construction expertise for the development of solutions outlined in this report. Roofing products for this project were supplied by Soprema Canada and installed by Pacific Waterproofing Ltd.
REFERENCES
1. Dr. Steve Johnson, Dow Building Solutions, September 2015. Making U-value Calculations for Inverted Flat Roofs.
2. Dow Building Solutions, Updated January 2013. Insulating Inverted Flat Roofs with STYROFOAM Solutions: Basic Principles.
3. British Board or Agreement, January 2011. Inverted Roof – Drainage and U Value Corrections.
4. H.M. Kunzel and K. Kiebl, Fraunhofer-Institute of Building Physics (Germany), 1996. Assessing Precipitation Heat Losses of Protected Membrane Roofs.
5. Holger Merkel, Ph.D. (undated). Inverted Roofs with Reduced Heat Losses Due to a Water-Repellent Separating Layer.
6. BBS Institute, University of Denmark, Fraunhofer, Vienna U. (undated) Requirements of Inverted Roofs with a Drainage Layer.
7. Cold Region Research and Engineering Laboratory, April 1977. Observations and Analysis of Protected Membrane Roofing Systems.
8. Cold Region Research and Engineering Laboratory March 1976. Protected Membrane Roofs in Cold Regions.