Embed Size (px)
Citation preview

ASQ FOX VALLEY SECTION
APRIL 4, 2017 MEETING
SPEAKER: CHUCK GATES
Pre-dinner Meeting
Supply Chain Management Overview
• Supply Chain Management Principles
• Supply Chain Strategy
• Customer Relationship Management
• Supplier Relationship Management
• ISO 9001:2015 QMS Requirements for External
Providers
1

2
SUPPLIER QUALITY
CALL FOR ACTION
Takata Air Bag
Defects
Major Recall and
Penalty
Best Buy Pays $3.8M
Lawsuit for Selling
Recalled Products
March 2017
Reported
Over 15,000
Consumer Product
Recalls in February
Keurig Pays $5.8M
Lawsuit for Selling
Defective Products
FDA Reported a
Large Number of
Recalls

U.S. Employment
• Healthcare
• Airlines
• Retail
• Food & Drug
• Telecommunications
• Education
• Financial
• Insurance
• Hotel & Entertainment
• Utilities
Services 80%
Manufacturing 8.2%
Agriculture 7.1%
Construction 4.1%
Mining 0.6%
Non-Service Sector
3

U.S. Gross Domestic Product (GDP) Wealth
Services 81.7%
Manufacturing 11.7%
Agriculture 1.0%
Construction 3.8%
Mining 1.8%
• Healthcare
• Airlines
• Retail
• Food & Drug
• Telecommunications
• Education
• Financial
• Insurance
• Hotel & Entertainment
• Utilities 4
5
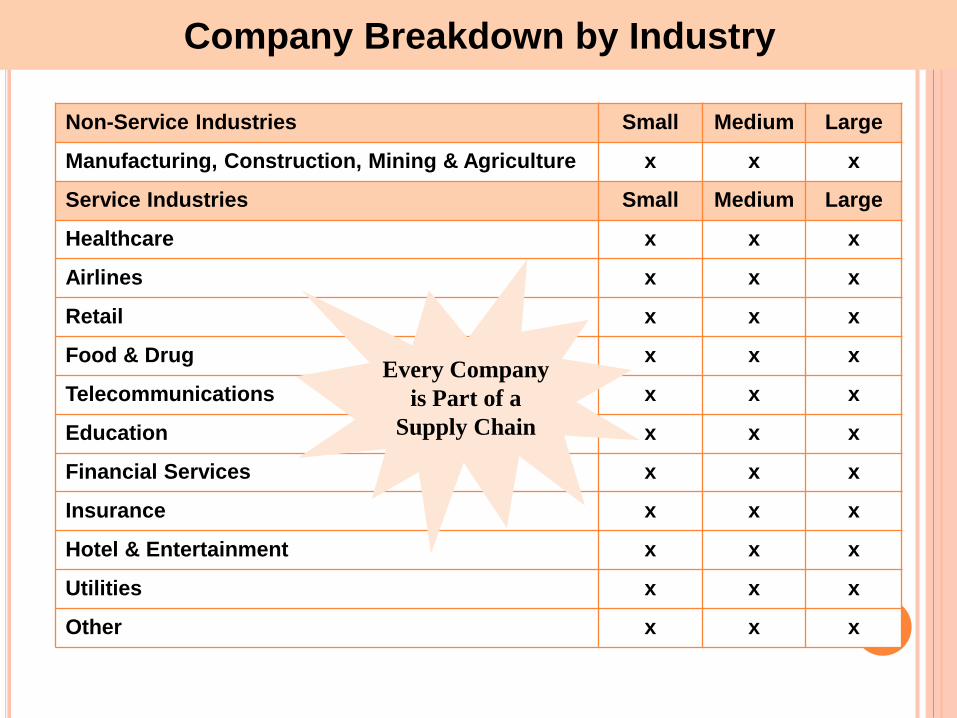
Company Breakdown by Industry
Non-Service Industries Small Medium Large
Manufacturing, Construction, Mining & Agriculture x x x
Service Industries Small Medium Large
Healthcare x x x
Airlines x x x
Retail x x x
Food & Drug x x x
Telecommunications x x x
Education x x x
Financial Services x x x
Insurance x x x
Hotel & Entertainment x x x
Utilities x x x
Other x x x
Every Company
is Part of a
Supply Chain

SUPPLY CHAIN ELEMENTS & ENTITIES
QUALITY ~ DELIVERY ~ PRICE ~ SERVICE ~ SUPPORT
6
Raw
Material
Suppliers
Fabrication
Suppliers
Component
Suppliers
Service
Suppliers
In B
ou
nd
Lo
gis
tics
Pro
vid
ers
Manufacturers
and
Service
Providers
Distribution
Network
Dealers
Retailers
Distributors
En
d U
se
rs
Information CashMaterial
Ou
t B
ou
nd
Lo
gis
tics
Pro
vid
ers
Upstream Downstream
Tie
r 2
Tie
r 1
Independent Legal
EntitiesThree Primary Flows Many Connected Processes

BASIC SUPPLY CHAIN PROCESSES
7
SUPPLIERS
INBOUND
LOGISTICS
PROVIDERS
MANUFACTURERS
and
SERVICE
PROVIDERS
DISTRIBUTION
NETWORKEND
USERS
• FORECASTING
• ORDERS MGMT
• PLANNING
• SCHEDULING
• TIER 2 SOURCING
• SUPPLIER MGMT
• QUALITY MGMT
• PRODUCTION
• INVENTORY MGMT
• RISK MGMT
• PACKAGING
• SHIPPING/DELIVERY
• COMPLIANCE
> STANDARDS
> REGULATIONS
• FORECASTING
• FREIGHT ROUTING
• PLANNING
• SCHEDULING
• QUALITY MGMT
• TRANSPORTAION
• INVENTORY INTRANSIT
• RISK MGMT
• STORAGE
• PICK UP/DELIVERY
• COMPLIANCE
> STANDARDS
> REGULATIONS
• FORECASTING
• ORDERS MGMT
• PLANNING
• SCHEDULING
• SOURCING
• SUPPLIER MGMT
• QUALITY MGMT
• OPERATIONS
• INVENTORY MGMT
• RISK MGMT
• PACKAGING
• SHIPPING/DELIVERY
• COMPLIANCE
> STANDARDS
> REGULATIONS
• FORECASTING
• ORDERS MGMT
• PLANNING
• SCHEDULING
• SUPPLIER MGMT
• QUALITY MGMT
• WAREHOUSING
• INVENTORY MGMT
• RISK MGMT
• SUPPORT
• SHIPPING/DELIVERY
• CUSTOMER SUPPORT
• COMPLIANCE
> STANDARDS
> REGULATIONS
DEALERS
DISTRIBUTORS
WHOLESELLERS
RETAILERS
AGENTS
• RESEARH
• PURCHASE
• ORDER
• FEEDBACK
8
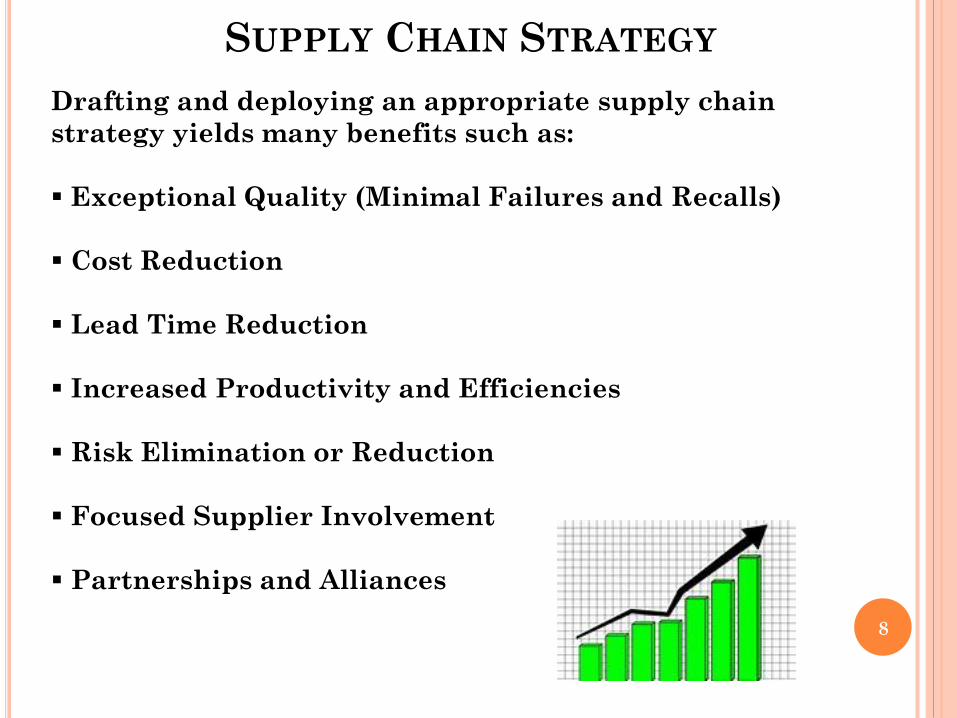
SUPPLY CHAIN STRATEGY
Drafting and deploying an appropriate supply chain
strategy yields many benefits such as:
Exceptional Quality (Minimal Failures and Recalls)
Cost Reduction
Lead Time Reduction
Increased Productivity and Efficiencies
Risk Elimination or Reduction
Focused Supplier Involvement
Partnerships and Alliances

LEVELS OF SUPPLIER PLANNING
9
Strategic
Tactical
Operational
The Certified Manager of Quality/Organizational Excellence Handbook, 3rd Edition
Overall Future Direction
Vision
Mission
Supply Chain Strategic Plan
How the Strategic Plan will
be Accomplished
Functional Plans (Financial,
Marketing, Sales, Operations,
Logistics, and Procurement)
Day-to-Day Plans
Quality Objectives & Metrics
Scheduling and Execution
Throughput Performance
Ongoing Audits

SUPPLY CHAIN VISION, MISSION, GOALS, & OBJECTIVES
10
The Certified Manager of Quality/Organizational Excellence Handbook, 3rd Edition
Tier 2
Suppliers
Tier 1
Suppliers
In Bound
Logistics
Providers
Manufacturer*
Out Bound
Logistics
ProvidersDistributors*
End
Users
Strategies
Vision
Mission
Goals
Objectives
Strategies
Vision
Mission
Goals
Objectives
S1 …..
S2 …..
S3 …..
S4 …..
Etc …..
Strategies
Vision
Mission
Goals
Objectives
IP1 …..
IP2 …..
IP3 …..
Etc …..
Strategies
Vision
Mission
Goals
Objectives
M1 …..
M2 …..
M3 …..
Etc …..
Strategies
Vision
Mission
Goals
Objectives
OP1 …..
OP2 …..
OP3 …..
Etc …..
Strategies
Vision
Mission
Goals
Objectives
D1 …..
D2 …..
D3 …..
Etc …..
Supply Chain Strategy, Vision, Mission, Goals & Objectives
*Core or Prime Entity
Develops the Supply Chain Strategy,
Vision, Mission, Goals, & Objectives
SUSTAINED COMPETITIVE ADVANTAGE
Collaboration ~ Integration ~ Seamless Processes

11
Customer Relationship Management (CRM)
Customer Relationship Management: A Strategic Imperative in the World of e-Business, Stanley A. Brown, Wiley, 2000.
One-to-One Relationship
Marketing
Four Types of Customer Relationship Management
Three Stages of Customer
Loyalty
Twelve Steps to Customer Relationship
Success
Stage 1 – Customer Acquisition
Stage 2 – Customer Retention
Identify Specific Needs,
Requirements, and Values
Stage 3 – Intimate, Strategic
Customer Care
• Lifetime Customers
• Loyal Customers
• Prospective Customers
• Past Customers
• Smaller Customer Segments
• Customized Marketing to Each Segment
• Product/Service Differentiation
1. Align the management
team and mobilize it for
action.
2. Assess the readiness for
change.
3. Address each customer
segment.
4. Identify the best
customers.
5. Listen closely to the
customers.
6. Analyze the gaps.
7. Mobilize strategic account
teams.
8. Develop the strategic
action plan.
9. Validate the action plan.
10.Train the customer care
team.
11.Implement the strategies.
12.Track results and adjust if
needed.

12
Customer Segment Map
Segment 3
Low Profit
High Sales
Segment 1
High Profit
High Sales
Segment 4
Low Profit
Low Sales
Segment 2
High Profit
Low Sales
ProfitLow High
Sale
s
High
Low
13
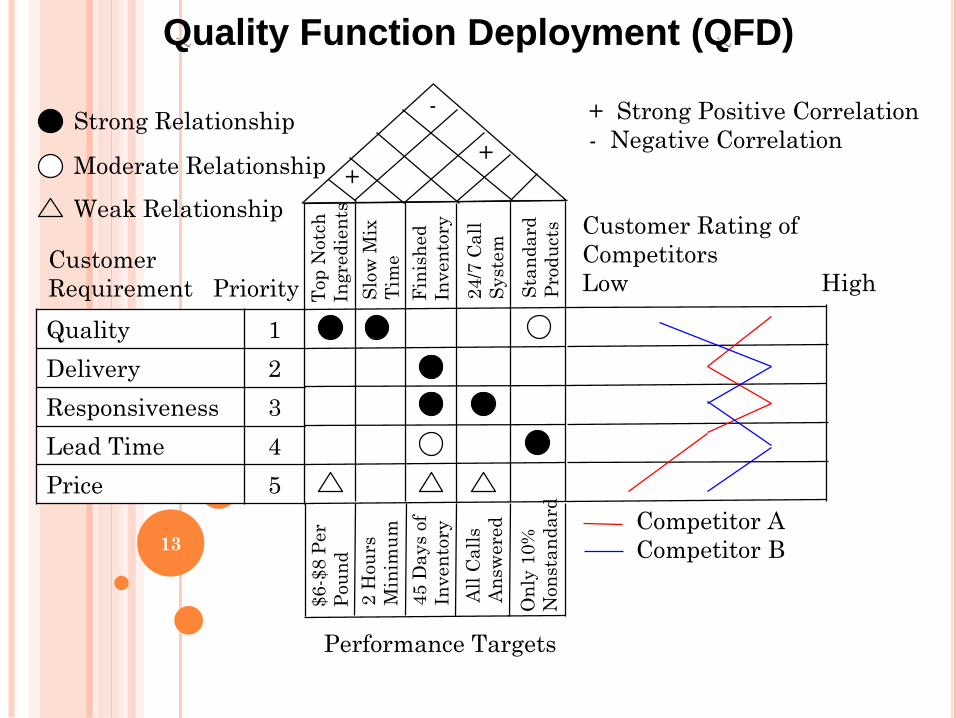
Quality Function Deployment (QFD)
Quality 1
Delivery 2
Responsiveness 3
Lead Time 4
Price 5
Customer
Requirement Priority Top
Notc
h
Ingre
die
nts
Slo
w M
ix
Tim
e
Fin
ish
ed
Inven
tory
24
/7 C
all
Syst
em
Sta
nd
ard
Pro
du
cts
Strong Relationship
Moderate Relationship
Weak Relationship
+ Strong Positive Correlation
- Negative Correlation+
-
Customer Rating of
Competitors
Low High
Competitor A
Competitor B
$6-$
8 P
er
Pou
nd
2 H
ou
rs
Min
imu
m
45
Da
ys
of
Inven
tory
All
Ca
lls
An
swere
d
On
ly 1
0%
Non
sta
nd
ard
Performance Targets
+

14
Supplier Relationship Management (SRM)
Customer Relationship Management: A Strategic Imperative in the World of e-Business, Stanley A. Brown, Wiley, 2000.
One-to-One Relationship
Four Types of Supplier
Relationship Management
Three Stages of Supplier
Loyalty
Twelve Steps to Supplier
Relationship Success
Stage 1 – Supplier Selection
Stage 2 – Supplier Retention
with Partnerships
and Alliances
Stage 3 – Intimate, Strategic
Supplier Care
• Lifetime Suppliers
• Loyal Suppliers
• Prospective Suppliers
• Past Suppliers
• Smaller Supplier Segments
• Customized Strategy for Each Segment
• Consolidation
1. Align the management
team and mobilize it for
action.
2. Assess the readiness for
change.
3. Address each supplier
segment.
4. Identify the best suppliers.
5. Listen closely to the
suppliers.
6. Analyze the gaps.
7. Mobilize strategic audit
teams.
8. Develop the strategic
action plan.
9. Validate the action plan.
10. Train the supplier care
team.
11.Implement the strategies.
12.Track results and adjust if
needed.

15
Supplier Segment Map
Segment 3
Low Results
High Spending
Segment 1
High Spending
High Results
Segment 4
Low Results
Low Spending
Segment 2
High Results
Low Spending
ResultsLow High
Sp
en
din
g
High
Low
Supplier Spend
Quality
Deliver
Price
Rating
A $0.2M Low
B $4.8M Low
C $0.7M High
D $5.3M High

16
SUPPLY CHAIN MANAGEMENT
Suppliers Manufacturers Distributors End
Users
Share Information across the supply chain
Point of sale data
Sales forecast
Increase the speed
Faster order to delivery time
Quicker responses
Reduce variation in the processes
Control, audit, and eliminate failures
Use six sigma for continuous improvement
Flexible to volume changes
Develop agile processes
Respond to customer demand
Be able to respond to changing product mix
Be sensitive to TRUE end user demands
Reduce costs in the face of changing needs

World-class Quality Expectations
Application of Technology
Shorter Development Cycle (Time to Market)
Continuous Process Improvement
Inventory Reduction
Reduced Variation
Ongoing Implementation of Statistical Process Control
The Five Vs
Visibility
Velocity
Variability
Volume Flexibility
Variety Adaptability
17
DEPLOYMENT OF STRATEGY AND EXPECTATIONS
SUPPLIER STRATEGY ELEMENTS
The Supplier Management Handbook, 6th Edition
Speed and
Accuracy

ISO 9001:2015 Clause 4 Context of the Organization
4.2 Understanding the needs and expectations of interested parties
ISO 9001:2015 Explained, 4th Edition, Cianfrani and West, ASQ, 2015
ASQ/ANSI/ISO 9001:2015 QMS Requirements, American National Standard, ASQ, 2015
Quality Management System
Customer
The OrganizationSubcontractors
Regulators
Suppliers
Internal
Divisions
Design
Consultants
External
Process
Process Process
Process
Process
Process
Process
Interested
Parties
Entire
Supply
Chain
18

19
ISO 9001:2015 QMS
Changes Related to Purchasing & Suppliers
ISO 9001:2008 ISO 9001:2015
Purchased Product Externally provided products & services
Supplier External provider
Clauses
8.4 Control of externally provided processes, products and services
8.4.1 General
The organization shall ensure that externally provided processes,
products and services conform to requirements.
8.4.2 Type and extent of control
The organization shall ensure that externally provided processes,
products and services do not adversely affect the organization’s ability to
consistently deliver conforming products and services to customers.
8.4.3 Information for external providers
The organization shall ensure the adequacy of requirements prior to their
communication to external provider.

ASQ FOX VALLEY SECTION
APRIL 4, 2017 MEETING
SPEAKER: CHUCK GATES
Post-dinner Meeting
Supplier Quality Management Best Practices
• Supplier Selection
• Supplier Contracts
• Supplier Requirements
• Supplier Partnerships and Alliances
• Supplier Performance Monitoring
• Supplier Certification
• Continuous Improvement Tools
• Risk Management
20

SUPPLIER SELECTION: STRATEGIC SOURCING
The Supplier Management Handbook, 6th Edition
21
The process of reducing the total cost of purchased materials,
goods, and services, while improving levels of operating
efficiencies, quality, technical innovation, customer service,
and system safety.
Traditional purchasing Strategic sourcing
Focus Purchase price or
landed cost
Total cost of ownership
Transactional Collaborative
Business
boundaries
Never crosses Opportunities for realigned
and collaborative processes,
data flow, and workflow
Technology Benefits from technology Applies to higher degree
Visibility Internal Entire supply chain
Certified Supply Chain Professional, 2016

GENERIC SUPPLIER SELECTION PROCESS
22
Internal
Alignment for
Supplier
Selection
Determine
Suppler
Selection
Criteria
Select
Suppliers to
Evaluate
Evaluate
Suppliers
Select
Suppliers
Form Supplier
Selection Team
Train the
Selection Team
Create a Culture
For Supplier
Selection
Objectivity
List the Potential
Supplier Selection
Criteria
Finalize the
Supplier
Selection Criteria
Determine the
Decision Making
Process
Use Strategic
Sourcing to
Select Potential
Suppliers
Involve the
Supplier
Selection Team
Talk with
Potential
Suppliers
For Open
Communications
Use the Decision
Making Tools to
Evaluate Suppliers
Exercise Care
In Selecting
Suppliers
Long-term
Relationships

SUPPLIER CONTINGENCY SOURCING STRATEGY
23
Sole
Single
Multiple
Only One Supplier is Capable
Several Qualified Suppliers
Strategic Alliance with One Supplier
Several Qualified Suppliers
More than One Supplier is Selected
High Risk to Exit
Moderate Risk to Exit
Lower Risk to Exit

SUPPLIER SELECTION: CRITERIA
Technical competence
Process capability
Quality conformance
Delivery performance
Financial control (debt, net income, cost reduction, etc.)
Past experience and performance
Risk management and corrective action process
Management involvement and commitment
Employee profile (skills, experience, training, etc.)
Tier 2 supplier relationships
Balanced Score Card Customer Focus Objectives
Process Improvement Objectives
Learning and Growth
Financial Perspective
24
The Certified Manager of Quality/Organizational Excellence Handbook, 3rd Edition
Supplier selection criteria should be defined by a cross-functional
team consisting of members from quality, purchasing, engineering,
production, and materials management.

SUPPLIER SELECTION: DECISION TOOLS
RATING MATRIX
Criteria Supplier A
1-10 High
Supplier B
1-10 High
Suppler C
1-10 High
Supplier D
1-10 High
Technical Competence
15%
5 x 0.15
0.75
8 x 0.15
1.20
9 x 0.15
1.35
7 x 0.15
1.05
Process Capability
10%
8 x 0.10
0.80
8 x 0.10
0.80
7 x 0.10
0.70
7 x 0.10
0.70
Quality Conformance
20%
8 x 0.20
1.60
9 x 0.20
1.80
8 x 0.20
1.60
7 x 0.20
1.40
Delivery Performance
10%
6 x 0.10
0.60
6 x 0.10
0.60
7 x 0.10
0.70
7 x 0.10
0.70
Financial Control
15%
7 x 0.15
1.05
8 x 0.15
1.20
9 x 0.15
1.35
7 x 0.15
1.05
Risk Management
10%
4 x 0.10
0.40
5 x 0.10
0.50
3 x 0.10
0.30
7 x 0.10
0.70
Management
Commitment 10%
6 x 0.10
0.60
7 x 0.10
0.70
8 x 0.10
0.80
7 x 0.10
0.70
Balanced Score Card 10% 6 x 0.10
0.60
7 x 0.10
0.70
6 x 0.10
0.60
7 x 0.10
0.70
Total 6.40 7.50 7.40 7.0025
The Certified Manager of Quality/Organizational Excellence Handbook, 3rd Edition

26
The Supplier Management Handbook, 6th Edition
SUPPLIER REQUIREMENTS
Customer Needs & Wants (Voice of the Customer)
Demand Forecast (Products and Services)
Customer Orders
Product Functional Requirements
Quality Management System & Quality Requirements
Delivery Requirements
Pricing and other Contractual Obligations
Supply Chain Strategies, Vision, Mission, Goals & Objectives
Corrective & Preventive Action Reporting
Product Traceability
Safety and Safeguards Needed
Environmental Standards and Regulations
Corporate Social Responsibilities
Continuous Improvement Initiatives
Integration of Customer & Supplier Relationship Management

Legal, Operational, and Financial Aspects
Statement of Work (SOW)
Part, Commodity, or Service Definitions/Scope/Specifications
Deliverables
Performance Evaluation Metrics
Bonus and Penalty Clauses
Price and Payment
Warranties
Contract Changes
Confidentiality
Software and Patents
Binding Arbitration
Termination Clauses
SUPPLIER AGREEMENTS/CONTRACTS
ELEMENTS
27
The Supplier Management Handbook, 6th Edition

28
STEPS TO ENSURE A FAIR SUPPLIER SELECTION PROCESS
The Supplier Management Handbook, 6th Edition
1. Learn as much as possible about the
potential suppliers or sub-contractors
1. Use site inspections
1. Develop a process that ensures an objective
suppler evaluation system
1. Make the selection based on all of the
quantitative and qualitative factors – not
just price

Quality Control
Product/Service Requirements and Specifications
Quality Management System
Quality Manual
Quality Policy & Procedures
Quality Objective & Metrics
Work Instructions
Process Specifications
Inspection Methods
Quality System Audits
Skills Compliance
Machine and Equipment Calibration
Nonconforming Material Separation
Traceability29
ENSURING QUALITY CONDITIONS ARE MET
The Supplier Management Handbook, 6th Edition
Co
nti
nu
ou
s I
mp
ro
vem
en
t

SUPPLIER EXIT STRATEGY
Step 1:
Negotiate a fair contractual agreement with a clause to agree to
arbitration if any disputes arise that cannot be resolved by both parties. Consider multiple suppliers to reduce risk of exiting.
Step 2:
If expectations are not met, work together to resolve any differences.
Step 3:
If there is no improvement, engage an independent arbitrator selected jointly by both parties.
Step 4 (Last Resort):
Be prepared to exit the contractual agreement and engage with
a backup supplier. 30

TYPES OF CUSTOMER-SUPPLIER RELATIONSHIPS
31
Relation-
ship
Characteristics
Proximity VisibilityCompetitor
InteractionCommunication Culture
Buy on the
market
Arm’s
length
Purchase
requirementsSignificant Computerized
Not an
issue
Ongoing
relationship
Medium
termSome sharing Some
Designated
contact pointsAware
PartnershipLonger
termFull sharing Limited
Department
interaction
Aware +
adaptive
Collaboration/
strategic
alliance
Long-term
relationship
Sharing + partners’
plans as own
Limited or
none
Extensive, high
trust, licensingMerging
Mergers/
acquisitionsOwnership
Internal, commonly
held informationNone Varies
One
culture

SUPPLIER CERTIFICATION
32
Develop Certification
Criteria
Identify Qualified Suppliers
Evaluate Qualified Suppliers
Award
Certification Status
Ongoing Monitoring
for Compliance
The Certified Manager of Quality/Organizational Excellence Handbook, 3rd Edition
Step 1
Step 2
Step 3Step 4
Step 5

KEY SUPPLIER PERFORMANCE & MONITORING METRICS
Quality
Delivery
Responsiveness Reliability
Cost
Continuous Improvement
33

34
Quality
It is expected that the suppliers have a documented quality
management system and some have adopted the ISO 9001 QMS
format. It is also expected that the contract or purchase order
clearly details the quality standards and expectations with
quantifiable metrics.
Potential Quality Metrics:
Parts per million (ppm) defects
Percent nonconforming at the supplier’s location
Document accuracy (control chart data, invoices, files received, etc.
Nonconforming products received by the customer
Cpk ≥ 1.33

35
Delivery
Potential Delivery Metrics:
Early deliveries
On time deliveries
Late deliveries
Percent of incorrect quantities delivered
It is expected that the contract or purchase order clearly
details the delivery expectations with quantifiable metrics.

36
Cost
It is expected that the contract or purchase order clearly
details the price/cost expectations with quantifiable metrics.
Potential Price/Cost Metrics:
Percentage of prices higher than agreed to
Dollar value of nonconforming product received (scrap, rework,
returns)
Cost reduction achieved as specified
Warranty costs associated with supplier’s nonconformance

37
Responsiveness
It is expected that the contract or purchase order clearly
details the responsiveness expectations with quantifiable
metrics.
Potential Responsiveness Metrics:
Timeliness in responding to any and all customer requests,
inquiries, questions, deadlines, telephone calls, e-mails, etc.
Corrective action responsiveness (timely and complete)
Agility, flexibility, and quick response to changes

38
Reliability
It is expected that the contract or purchase order clearly
details the reliability expectations with quantifiable metrics.
Potential Reliability Metrics:
Percentage of warranty expense that exceeds the goals
Mean time between failure (MTBF) that exceeds the goals
Failure rates that exceed calculated values

BALANCED SCORE CARD (BSC) METRICS
39
The Certified Manager of Quality/Organizational Excellence Handbook, 3rd Edition
Customer
Card
Quality
Delivery
Price
Service
Financial Card
Process
Card
Continuous
Process
Improvement
Learning Card: Innovation & Development

BSC OBJECTIVES EXAMPLES
Customer• Market Share
• Customer Retention
• Customer Service and Satisfaction
• Warranty & Product Returns
• Field Service Performance
• Quality, Delivery, Price
Business Processes• Cost of Quality
• Productivity
• Cost Reduction
• Cycle Time Reduction
• Innovation
• Supplier Performance
• Continuous Improvement40
The Certified Manager of Quality/Organizational Excellence Handbook, 3rd Edition
Learning and Growth
• Employee Retention
• Competency Level
• Employee Training
• Knowledge Management
Financial
• Return on Assets
• Return on Investment
• Profitability
• Cash Flow

41
SUPPLIER PERFORMANCE DATA: DASHBOARD
Delivery
QualityCost
Continuous
ImprovementReliability
Responsiveness

EXAMPLE SUPPLIER PERFORMANCE REPORT
42
The Certified Manager of Quality/Organizational Excellence Handbook, 3rd Edition

RISK MANAGEMENT STRATEGY
Risk-based approach to manage the supply base
Contingency planning
Risk mitigation plan
Minimize, monitor, and control risks
Identify and evaluate strategies and techniques
Techniques
Supply chain mapping
Avoidance
Detection
Mitigation
Prevention
Risks
Counterfeit parts, materials, and services43

44
REASONS FOR THE EMPHASIS ON RISK MANAGEMENT
The ASQ Auditing Handbook, 4th Edition
A more unstable world situation
Increased reliance on computer systems and electronic
records storage
Increased concerns about international and domestic
uncertainty
The globalization of markets and competition
A more complex regulatory environment affecting many
aspects of the organization, its operations, and its
administration
The litigious nature of our society
A heightened awareness and appreciation of
uncertainties and tenuousness of our business and
personal lives

TYPES OF RISK
Catastrophic Events
Fires, hurricanes, tornados, floods, earthquakes,
blizzards, and other natural disasters.
Quality Failures and Major Product Recalls
Safety Violations and Major Accidents
Noncompliance with Standards and Regulations
Bankruptcy
Hostile Takeover
Illegal Actions
Design Errors
Material Nonconformance
Terrorist Attack
Vandalism, Theft or Sabotage45

POTENTIAL LOSSES DUE TO RISKS
Revenue (Decreased Sales)
Lower Profit or Huge Dollar Losses
Decrease in Market Share
Falling Stock Price
Replacement Cost for Damaged Facilities and Equipment
Possible Increased Borrowing (Higher Debt)
Damaged Image or Reputation
Overall Recovery Cost Could be Significant
Recovery Period May be Very Long (Several Months or Even Years)
46

BUSINESS CONTINUITY
Business continuity encompasses planning and preparation to
ensure that an organization can continue to operate in case of
serious incidents or disasters and is able to recover to an
operational state within a reasonably short period of time.
1. Resilience
~ Unaffected critical business functions
~ Redundant systems
~ Spare capacity
2. Recovery
~ Plan in place to recover or restore critical business
functions
~ Short-term and long-term
3. Contingency
~ Capability and readiness to cope with major disruptions
~ Documented risk management plan and responses47
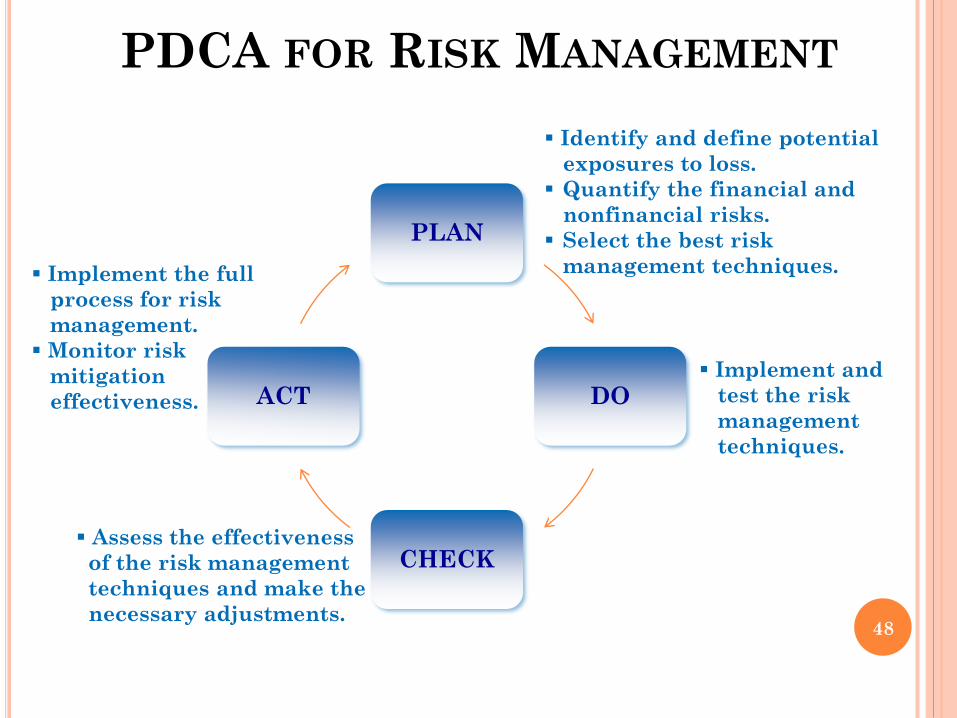
PDCA FOR RISK MANAGEMENT
PLAN
DO
CHECK
ACT
Identify and define potential
exposures to loss.
Quantify the financial and
nonfinancial risks.
Select the best risk
management techniques.
Implement and
test the risk
management
techniques.
Assess the effectiveness
of the risk management
techniques and make the
necessary adjustments.
Implement the full
process for risk
management.
Monitor risk
mitigation
effectiveness.
48
49
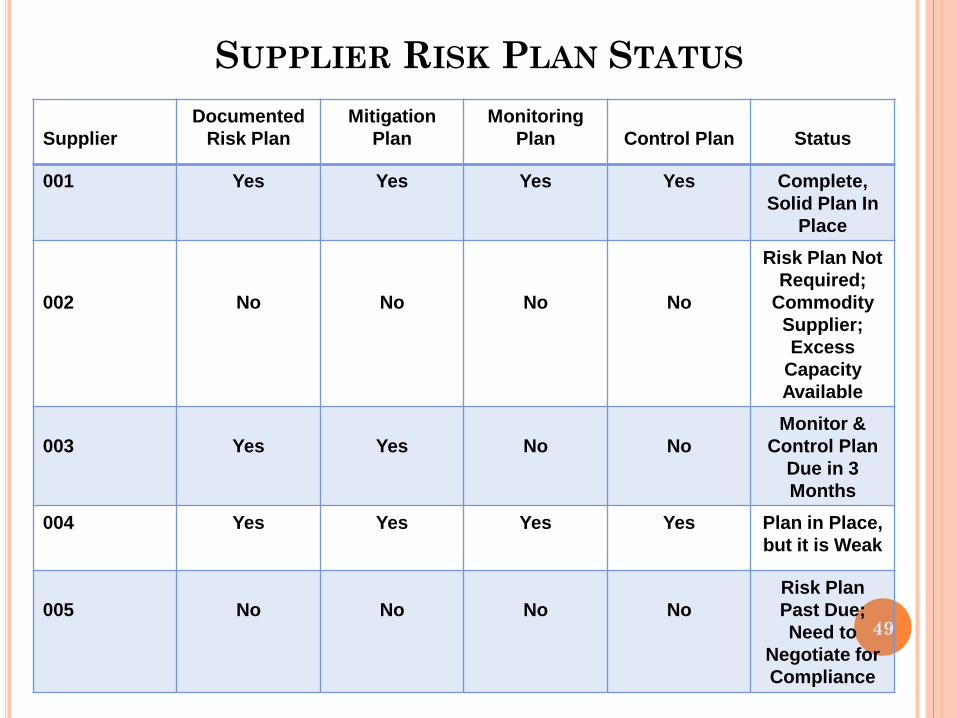
SUPPLIER RISK PLAN STATUS
Supplier
Documented
Risk Plan
Mitigation
Plan
Monitoring
Plan Control Plan Status
001 Yes Yes Yes Yes Complete,
Solid Plan In
Place
002 No No No No
Risk Plan Not
Required;
Commodity
Supplier;
Excess
Capacity
Available
003 Yes Yes No No
Monitor &
Control Plan
Due in 3
Months
004 Yes Yes Yes Yes Plan in Place,
but it is Weak
005 No No No No
Risk Plan
Past Due;
Need to
Negotiate for
Compliance

50
RISK RANKING AND FILTERING (RISK MAPPING)
Severity or Impact
Pro
ba
bil
ity
1 2 3 4 5
1
2
3
4
5
High Risk
Medium Risk
Low Risk
1-1 1-2 1-3 1-4 1-5
5-1 5-2 5-3 5-4 5-5
4-1 4-2 4-3 4-4 4-5
3-1 3-2 3-3 3-4 3-5
2-1 2-2 2-3 2-4 2-5

51
RISK TREATMENT (RESPONSES) STEPS
Step 2
Avoid Risk with
Prevention Tactics
Step 1
Prioritize the Risks
Probability & Severity
Step 3
Reduce Risk Losses
Step 4
Share the Risk
Multiple Sources
or Insurance
Step 5
Accept Risk Losses
• Prevent the Risk
• Eliminate the Root Cause
• Proactive Action
• Calculate the Probability
• Determine the Severity
• Risk Ratio =
Probability x Severity
• Minimize the Likelihood
• Minimize the Losses
• Contingency Planning
• Transfer Risk to Suppliers
• Purchase Insurance for
Financial Losses
• Multiple Sources for
Products and Services
• Accept Risk Losses that
are Less than the Prevention
or Reduction Costs
• Up to the Level of the Company’s
Risk Tolerance or Threshold

52
SUPPLIER AUDITS

53
CORRECTIVE/PREVENTIVE ACTION (CAPA)P
rob
lem
Id
en
tifi
ca
tio
n CARs: Corrective Action Requests
Complete Problem Identification
Quantitative Problem Data
Identify Process & People Involved
Fa
ilu
re A
na
lys
is FMEA
FTA
Cause and Effect Diagram
Potential Failure Causes
Ro
ot
Cau
se
A
na
lys
isVerify Root Cause(s)
Quantify the Root Cause(s)
Evaluate the Effectiveness of the RCA Process
Assure Robustness in the RCA Results
Co
rre
cti
ve
Ac
tio
n Document Who, What, When, and How to Correct Each Problem
Implement Corrective Action
Pre
ve
nti
ve
Ac
tio
n Document Who, What, When, and How to Prevent a Reoccurrence of the Problem
Implement Preventive Action
Co
ntr
ol P
lan Document the
Control Plan
Implement the Control Plan
54
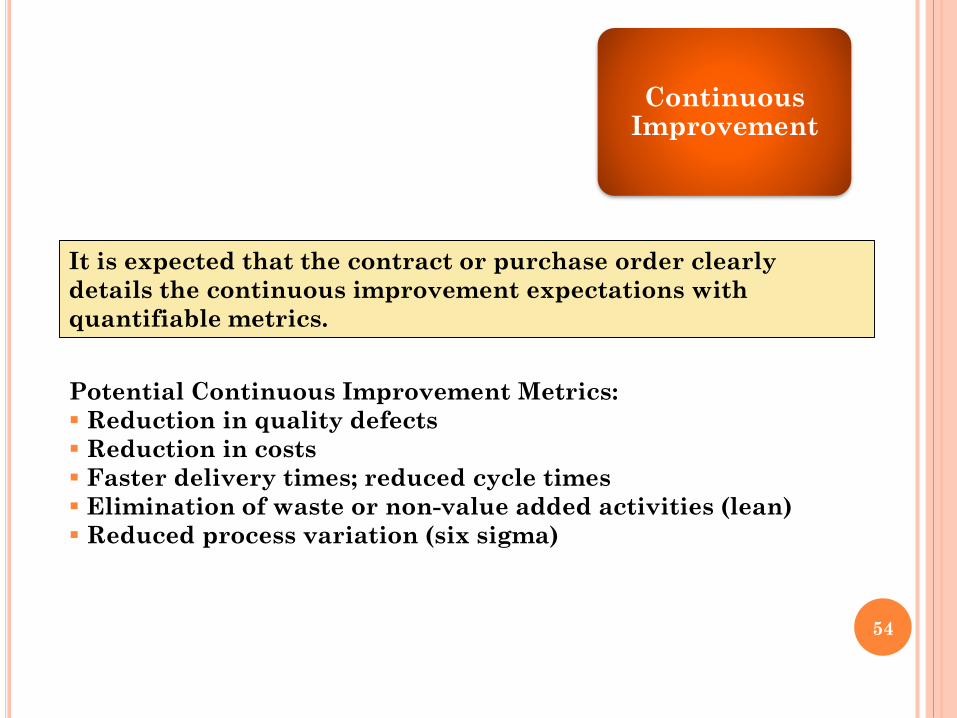
Continuous Improvement
It is expected that the contract or purchase order clearly
details the continuous improvement expectations with
quantifiable metrics.
Potential Continuous Improvement Metrics:
Reduction in quality defects
Reduction in costs
Faster delivery times; reduced cycle times
Elimination of waste or non-value added activities (lean)
Reduced process variation (six sigma)

SUPPLIER CONTINUOUS IMPROVEMENT
55
The Certified Manager of Quality/Organizational Excellence Handbook, 3rd Edition
Sustained
Competitive
Advantage
Product
Improvements
Process
ImprovementsQuality
Improvements
Value Added
Reduce Waste
Cost Reduction
Competitive
Pricing

56
Potential Supplier Improvement Projects
Goals
Market Demands
Legal Requirements
and Voluntary Standards
Technology Advances
Major Improvement
Initiatives
Customer Needs
• Strategic
• Tactical
• Operational
• New Products/Services
• Increased Competition
• Changing Economic Conditions• Changing Requirements
• More Customization
• Increased Demand
• Reduced Lead Times
• New IT Systems
• Increased Security
• Unique Platforms
• Statutory
• Regulatory
• Standards
56
Session 1-57 © APICS CONFIDENTIAL AND PROPRIETARY
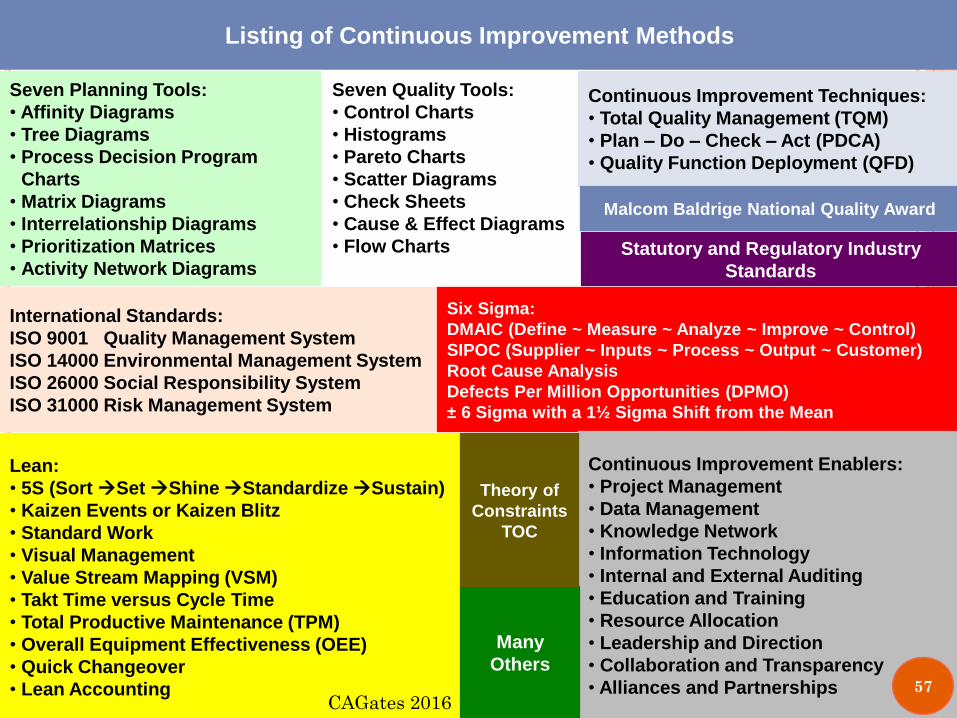
Listing of Continuous Improvement Methods
Seven Planning Tools:
• Affinity Diagrams
• Tree Diagrams
• Process Decision Program
Charts
• Matrix Diagrams
• Interrelationship Diagrams
• Prioritization Matrices
• Activity Network Diagrams
Seven Quality Tools:
• Control Charts
• Histograms
• Pareto Charts
• Scatter Diagrams
• Check Sheets
• Cause & Effect Diagrams
• Flow Charts
Continuous Improvement Techniques:
• Total Quality Management (TQM)
• Plan – Do – Check – Act (PDCA)
• Quality Function Deployment (QFD)
Malcom Baldrige National Quality Award
International Standards:
ISO 9001 Quality Management System
ISO 14000 Environmental Management System
ISO 26000 Social Responsibility System
ISO 31000 Risk Management System
Six Sigma:
DMAIC (Define ~ Measure ~ Analyze ~ Improve ~ Control)
SIPOC (Supplier ~ Inputs ~ Process ~ Output ~ Customer)
Root Cause Analysis
Defects Per Million Opportunities (DPMO)
± 6 Sigma with a 1½ Sigma Shift from the Mean
Lean:
• 5S (Sort Set Shine Standardize Sustain)
• Kaizen Events or Kaizen Blitz
• Standard Work
• Visual Management
• Value Stream Mapping (VSM)
• Takt Time versus Cycle Time
• Total Productive Maintenance (TPM)
• Overall Equipment Effectiveness (OEE)
• Quick Changeover
• Lean Accounting
Continuous Improvement Enablers:
• Project Management
• Data Management
• Knowledge Network
• Information Technology
• Internal and External Auditing
• Education and Training
• Resource Allocation
• Leadership and Direction
• Collaboration and Transparency
• Alliances and Partnerships
Many
Others
Statutory and Regulatory Industry
Standards
Theory of
Constraints
TOC
CAGates 201657

Session 1-58 © APICS CONFIDENTIAL AND PROPRIETARY
Education and/or Experience
You must have eight years of on-the-job experience in one or more of the
areas of the Certified Supplier Quality Professional Body of Knowledge. A
minimum of three years of this experience must be in a decision-making
position. “Decision-making” is defined as the authority to define, execute,
or control projects/processes and to be responsible for the outcome. This
may or may not include management or supervisory positions.
If you were ever certified by ASQ as a Quality Auditor (CQA), Reliability
Engineer (CRE), Software Quality Engineer (CSQE), or Manager of
Quality/Organizational Excellence (CMQ/OE), experience used to qualify for
certification in these fields applies to certification as a Supplier Quality
Professional.
If you have completed a degree from a college, university, or technical
school
with accreditation accepted by ASQ, part of the eight-year experience
requirement will be waived, as follows (only one of these waivers may be
claimed):
• Diploma from a technical or trade school — one year will be waived.
• Associate degree — two years waived.
• Bachelor’s degree — four years waived.
• Master’s or doctorate — five years waived.
58

Session 1-59 © APICS CONFIDENTIAL AND PROPRIETARY
ASQ CSQP
Body of Knowledge Area
Number of
Questions
I. Supplier Strategy 22
II. Risk Management 14
III. Supplier Selection & Part Qualification 30
IV. Suppler Performance Monitoring & Improvement 30
V. Supplier Quality Management 30
VI. Relationship Management 14
VII. Business Governance, Ethics, & Compliance 10
Total Multiple-Choice Questions 150
59

Session 1-60 © APICS CONFIDENTIAL AND PROPRIETARY
ASQ FOX VALLEY SECTION
WEB INTERACTIVE COURSES
Next CSQP Web Interactive Course Starts May 10, 2017
6 Wednesdays, 6:00 p.m. to 9:00 p.m. Course Fee: $1,200 members
5/10, 5/17, 5/24, 5/31, 6/7, 6/17
Another CSQP Web Interactive Course will begin in July to prepare
for the September Exam Dates
Visit www.asq-foxvalley.org to register 60

61
Thank You