Embed Size (px)
Citation preview

Aspirations and food security in rural Ethiopia
Daniel Ayalew Mekonnen and Nicolas Gerber
Invited poster presented at the 5th
International Conference of the African Association
of Agricultural Economists, September 23-26, 2016, Addis Ababa, Ethiopia
Copyright 2016 by [authors]. All rights reserved. Readers may make verbatim copies of
this document for non-commercial purposes by any means, provided that this copyright
notice appears on all such copies.

1
Aspirations and food security in rural Ethiopia
Daniel Ayalew Mekonnen and Nicolas Gerber
Center for Development Research (ZEF), University of Bonn
March 2016
Abstract
Despite some improvements in recent years, poverty and food insecurity remain widespread
and the main challenges in Ethiopia. Using individual and household level data collected in
rural Ethiopia, we examine if aspirations are strongly associated with well-being outcomes, as
posited in the aspirations failure framework articulated by Ray (2006) and others. We employ
both bivariate and multivariate analyses. We find that aspirations (particularly that of the
household head) are indeed strongly associated with various triangulating measures of
household food (in)security including per-capita calorie consumption, the food consumption
score (FCS), the household dietary diversity score (HDDS), and the household food
insecurity access scale (HFIAS). We discuss the channels through which aspirations might
affect food security. Findings in this study provide suggestive evidence that policies aimed at
improving food security might benefit from multiple effects (both direct and indirect) if they
incorporate aspirations raising strategies.
Key words: Aspirations, farm households, food security, Ethiopia

2
1. Introduction
Despite some improvements in recent years, poverty and food insecurity remain widespread
and the main challenges in Ethiopia. These challenges are further exacerbated by climatic
shocks such as failure of rainfall, which adversely affect agriculture and allied activities, the
main livelihood activities for the rural population1. In fact, following the failure of rainfall
during the 2015 agricultural seasons, estimates suggest that about 10.1 million people require
emergency food assistance as of December 2015 (EHRD, 2016). Poverty persistence had
long been recognised as a major contributing factor for the continuing vulnerability of the
food insecure group and this has led the government, jointly with development partners, to
implement a social safety net program (PSNP) since 2005. This program aims at “smoothing
consumption, reducing risks the poor face and protecting their assets” (GFDRE, 2009). In
2012, the PSNP reached over 7.6 million people and the program is complemented by a
household asset building program (HABP), which provides food insecure households with
financial services and technical support to strengthen their production systems by
diversifying income sources, and increasing productive assets so as to improve their
productivity (World Bank 2013).
Notwithstanding the potential benefits associated with policies such as the PSNP, the alleged
benefits can be realized only under a set of conditions. For example, the recent weather
related shocks highlight the level of vulnerability of the poor despite such programs. In
addition, while earlier evaluations of the PSNP (e.g. Gilligan et al., 2009; Berhane et al.,
2011, 2014; Coll-Black et al., 2011) find some positive impact of the program on food
security, asset holdings and income growth, there is little evidence of graduation2. These
studies attribute the lack of graduation, among others, to limited efficiency in program
implementation, higher food prices and the nature of the program, i.e. targeting households
which are both poor and food insecure. Yet, what is missing in these studies (and in the
broader empirical literature on the determinants of food security) is the importance of
psychological factors or ‘internal’ constraints, such as low aspirations. However, internal
constraints are also important for they could reinforce external constraints (or material
deprivations) and this may lead to a self-sustaining poverty trap and low levels of proactivity
(Appadurai, 2004, Ray, 2006; Dalton et al., 2014). Aspirations are motivators of effort, for
example, in terms of creating opportunities or exploiting available ones (Bandura, 2009;
Bernard et al., 2008), which may lead to achieving food security. In this context, we study the
effect of aspirations on food security in rural Ethiopia.
The next section presents the background and the review of related literature followed by
section 3 which presents the data and descriptive statistics. The empirical strategy and results
are discussed in section 4 and section 5 concludes.
1 According to the Central Statistics Agency of Ethiopia (CSA), the rural population is estimated to constitute
about 83 percent of the total which is estimated at 87,952, 000 as of July 2014. http://www.csa.gov.et/ (accessed
Nov 17, 2015). 2 “Graduation” is a situation where a household can meet its food needs for all 12 months and is able to
withstand modest shocks in the absence of the PSNP (GFDRE 2007).

3
2. Background and literature review
2.1. Some concepts and measurements of food insecurity
Food security is a complex concept and its definition continues to evolve. The latest
definition that refined the one adopted in the 1996 World Food Summit states that “food
security (is) a situation that exists when all people, at all times, have physical, social and
economic access to sufficient, safe and nutritious food that meets their dietary needs and food
preferences for an active and healthy life” (FAO, 2002). According to Jones et al (2013), this
definition addresses concerns related to: inequitable distribution of food not only within
countries but also within households, the ability to acquire socially and culturally acceptable
food and the ways in which to acquire it, and the food composition and micro nutrient
requirements. Food insecurity on the other hand is a state “when people do not have adequate
physical, social or economic access to food” as defined above (FAO, 2002).
To operationalize the definition of food (in)security, empirical studies often use one or some
combination of the four domains that reflect: food availability, access, utilization, and the
stability of food over time. Yet, the complexity of the concept is simply evident from the
availability of multiple approaches and tools for assessing food security. For example, in
some cases, the concept of food insecurity is used interchangeably with nutrition insecurity
even though nutrition security requires food security along with “care, health and hygiene
practices” (Jones et al, 2013). A related concept often used to measure food and nutrition
insecurity is undernutrition, which is “caused by undernourishment –defined as a level of
food intake insufficient to meet dietary energy requirements” (FAO, 2015). In the same
report, hunger is defined as synonymous with chronic undernourishment. This simply shows
that the concepts are overlapping (Jones et al, 2013, see Figure 1), and hence a diverse pool
of food and nutrition security measurements exist. Based on a systematic review of available
measurements, Jones et al (2013) and Pangaribowo et al. (2013) argue that the choice of
which measurement to use requires understanding the underlying constructs and identifying
the intended use of a tool (or the intended use of the data to be collected).
Figure 1. Overlapping concepts within the context of food and nutrition security. The figure
is from Jones et al (2013) who adapted it from Benson (2004).
Food insecurity
Under-nutrition
Nutrition insecurity
Hunger

4
2.2. Empirical evidence on the state of food (in)security and their determinants
The latest report on the State of Food Insecurity in the World (FAO, IFAD and WFP, 2015)
estimates the number of people undernourished in 2014-16 at 795 million or 10.9 percent of
the total, a reduction from 18.6 percent in 1990-92. The report notes that the vast majority of
the hungry (780 million people) live in the developing world and the overall share of the
hungry currently stands at 12.9 percent of the total population. The same report estimates that
the share of people in Ethiopia who are undernourished in 2014-16 is 32 percent, a reduction
from 74.8 percent in 1990-92. According to the report, this improvement in Ethiopia could be
attributed to several interlinked factors including the high GDP growth rate the country has
been experiencing in the recent years and the existing social protection program (PSNP). This
assertion of attribution echoes other studies such as World Bank (2015), Berhane et al (2011,
2014) and Dorosh and Rashid (2012). According to World Bank (2015), for example, real
GDP growth in the country averaged 10.9 percent between 2004 and 2014 and a significant
part of this growth comes from agriculture. If this is indeed the case, the reduction in
undernutrition may not be surprising for the majority of the people depend on agriculture, a
sector which had been found to have a high growth poverty elasticity (e.g. Christiaensen and
Demery, 2007), and poverty is arguably one of the determinants of food and nutrition
security. In this context, Tafesse (2005) estimates that a one percentage increase in
agricultural per capita value added in Ethiopia would result into a one percent decline in
poverty level of rural households.
As the concept of food and nutrition security (FNS) evolves, rigorous and national level
studies on the determinants of FNS in Ethiopia are largely lacking. A brief review of
available studies, which are mainly limited to smaller geographic areas and often associated
with project evaluations, sheds some light regarding one or the other domains of food
security. In this context, Asenso-Okyere et al.(2013), for example, study the determinants of
food security in selected agro-pastoral communities in south-eastern Ethiopia. Using
availability of food in the household as proxy indicator to food security, they find that the
most significant factors affecting household food security are: the educational level of the
spouse and that of the household head, size of farm land, availability of household assets
including livestock, peace and security. Beside household endowments such as land (Feleke
et al, 2005), Negatu (2004) report that livelihood diversification strategies such as livestock
rearing, growing cash crops, and engagement in trading are important factors for achieving
household food security (measured by calories consumption per adult-equivalent).
Food insecurity is also affected by seasonality or by irregular shocks such as weather events,
deaths or conflicts (Barret, 2010). Based on a household survey data from 15 villages in rural
Ethiopia, Dercon and Krishnan (2000), for example, find that the nutrition status, a widely
used indicator of FNS, of adults in poor households as opposed to richer households is
affected by idiosyncratic agricultural shocks. Food insecurity may be chronic or transitory
depending on the frequency of such shocks (Jones et al, 2013). In response to temporary
shocks, households may resort to the sale of assets and other coping strategies which may in
turn lead to more sever shocks, failed returns on investments, and an eventual fall into a state
of chronic food insecurity (Jones et al., 2013). In the event of such shocks, food aid through

5
different modalities is the often used policy response. In this context, a few studies (e.g.
Yamano et al., 2005; Quisumbing, 2003; and Gilligan and Hoddinott, 2007) examine the
importance of food aid programs following drought or harvest failures on food security in
Ethiopia. These studies find positive impact of such transfers on consumption or child
nutrition outcomes, but Gilligan and Hoddinott (2007) also uncover some evidence of food
aid dependency. In addition, even the achieved positive effects are considered to be short
term as the country continues to suffer from food insecurity even in good harvest years (Clay
et al, 1999), the realization of which had led to the policy shift from such “ad hoc responses”
to the more planned and systematic approach of the PSNP (GFDRE, 2009).
In general, the presence of widespread food insecurity in Ethiopia is argued to be the result of
several factors including recurrent drought and heavy reliance on nature, use of backward
agricultural technologies (or low input –low output production systems), and inappropriate
agricultural policies in the past (Devereux and Sussex, 2000). Relatedly, von Braun and
Olofinbiyi (2007) more broadly classify the major factors of food crisis in the country as:
population pressure, production failures, marketing failures, and policy, institutional, and
organizational failures.
However, what might be an important determinant and yet largely ignored in the studies
reviewed here or more generally the broader empirical literature on food security is the role
of internal constraints, specifically aspirations. This study contributes to filling the gap using
data collected from sample households in rural Ethiopia
3. Data and descriptive statistics
3.1. Data
We conduct a household survey between January and March 2014 in Ethiopia. We re-
interviewed an existing sample of agricultural households surveyed in 2006 and again in
2010 in Oromia region under an NGO project, which ended in 2010, aimed at promoting
agricultural innovations. The original survey used a mix of purposive and random sampling
procedures to select 390 households from three study sites (i.e. 130 households per site)
(Aredo, et al. 2008). The primary sampling unit (i.e. study site) consisted of a pair of
neighboring districts or woredas, namely Bakko and Sibu-Sire, Lume and Adaa, and Hettosa
and Tiyyo. The districts were chosen based on the density of cultivation of the major crop
(maize, teff or wheat) and on the presence of active farmers' cooperatives. In the second
stage, kebeles (sub-districts) with active farmers’ cooperatives were purposively selected.
Finally, using the number of participating households within a cooperative as the sampling
frame, households were randomly selected.
Our survey covered 379 households. Between one and three households in each district
dropped out of our survey for various reasons, including death, relocation to another area or
unavailability for the survey interview. Nevertheless, when compared against the full sample,
the households that dropped out of the survey did not show any statistically significant
baseline difference with regards to key indicators such as income, wealth, and landholdings
6
(results not reported but available upon request). Yet, we have also a missing data problem
with regards to some households. We exclude these from the main analysis because of the
need for complete data, which reduces the final sample size to 375 households.
In addition to the basic socio-economic indicators, the survey collected information on
individual aspirations and future expectations on four indicators including: income, wealth,
social status and children’s education. The survey also collected information about the
corresponding weight each attaches to each of the four indicators. Following Bernard and
Taffesse (2014), the aspirations level is calculated using an aggregate index based on
respondents’ answers to questions about their aspirations in the four dimensions. The
aggregate aspirations index is then used to classify individuals into low-aspirations and high-
aspirations status by comparison to the district average.
The calculation of the aggregate aspirations index (𝐴𝑖) can be represented as:
𝐴𝑖 = ∑ (𝑎𝑛
𝑖 −𝜇𝑛𝑑
𝜎𝑛𝑑 ) . 𝑤𝑛
𝑖4𝑛=1 (1)
Where:
𝑎𝑛𝑖 is the aspired outcome of individual 𝑖 on dimension 𝑛 (income, assets, education, or social
status).
𝜇𝑛𝑑 is the average aspired outcome in district 𝑑 for outcome 𝑛.
𝜎𝑛𝑑 is the standard deviation of aspired outcomes in district 𝑑 for outcome 𝑛.
𝑤𝑛𝑖 is the weight individual 𝑖 places on dimension 𝑛.
3.2. Descriptive statistics
3.2.1. Income and wealth
We begin with the descriptive statistics on income and wealth indicators to show how the
sample households have fared over time (2006-2014). Table 1 presents the mean and median
annual income of study households by income source. The data suggest that annual income
has improved between 2006 and 2014 for each income source except for livestock income,
and for income from all sources combined. The per-capita income has grown by about 23
percent during the same period. Similarly, Table 2 shows that, on average, the total value of
assets owned by households has increased during the specified period. The value of livestock
holdings take the lion’s share in the value of total asset holdings, and its significant decline in
2010 fully explains the total decline in the total value of assets for that year.

7
Table 1. Annual household income by source (Ethiopian Birr, at 2006 constant terms)3.
2006 2010 2014
Source N Mean Median N Mean Median N Mean Median
Livestock income 295 3172 1609 328 2924 1326 329 2303 1288 Crop income 387 12128 9886 383 13873 11425 376 14788 10489
Agricultural income 390 14434 11562 384 16334 13787 377 16758 12134
Business and wage labor 164 3190 942 227 2562 1236 185 4797 1795 Transfers income 5 1840 300 28 1169 562 81 2047 1077
Off-farm income 168 3169 942 236 2603 1273 230 4579 1843
Total income 390 15799 12296 384 17935 14974 379 19449 13848
Total income per-capita 390 2290 1794 384 2596 2182 379 2899 2122
Table 2. Total value of assets owned by the HH (in ETH Birr) at 2006 constant terms
2006 (n=386) 2010 (n=384) 2014 (n=379)
Mean Median Mean Median Mean Median
Value of production assets 403 100 963 129 1,743 455 Value of consumer durables 934 234 959 392 2,359 788 Value of livestock 10,273 7,865 5,752 4,413 14,969 10,630 Total value of assets 11,611 9,127 7,674 5,977 19,071 14,089
Since the data on aspirations is available only for the 2014 survey, we could not show if there
was any correlated trend between aspirations and income or wealth indicators over time. Yet,
we conduct mean comparisons across indicators including annual household income per adult
equivalent, monthly per capita expenditure, and the value of assets hold by people with
different levels of aspirations. According to Table 3, individuals with high aspirations have
on average higher income or wealth by comparison to those with low aspirations and the
difference is statistically significant at less than 1 percent (with the only exception of per-
capita expenditure for spouses with low and high aspirations). These descriptive statistics4 in
general reflect a preliminary evidence that aspiration could be one of the strong correlates of
poverty (or income) and by extension food security as poverty is one of the strong
determinants of food security, particularly in poor countries where effective social protection
programs rarely exist.
Table 3. Mean comparison of the 2014 household income and wealth (in ETB) by aspirations
level of the spouse and head of the household
Household head Spouse
Mean outcome
(High Asp.)
Mean outcome
(Low Asp.)
Mean difference: p-value
Mean outcome
(High Asp.)
Mean outcome
(Low Asp.)
Mean difference: p-
value
Total annual income per-adult equivalent 12453 8170 0.0001 14167 9825 0.0003 Monthly per-capita consumption expenditure 593 506 0.0051 572 542 0.3734 Total value of assets 77662 39991 0.0000 89702 59822 0.0008
3 The official exchange rate during the time of the survey was 1 USD=19 ETB according to the National Bank
of Ethiopia (see http://www.nbe.gov.et/market/searchdollarcurrencies.html , accessed last February 9th, 2016). 4 Descriptive statistics of other variables used in the study are presented in Table A.1. in the appendix.
8
3.2.2. Food Security
Food security, as discussed in the literature review, is a broad and complex concept and we
try to capture its multidimensionality (i.e. availability, access, utilization and stability) by
employing widely used indicators. We construct triangulating measures of food (in)security
including per-capita calorie consumption, food consumption score (FCS), household dietary
diversity score (HDDS), household food insecurity access scale (HFIAS), and the incidence
of inadequate food supply in the household in the previous 12 months. We capture intra-
household food allocations based on the information we collect by asking whether all
household members eat the same diet, and whether each of them eats a more- or less-
diversified diet and how many times a day, by age categories.
The measurement of food consumption using kilocalories (such as per-capita calorie
consumption) is referred to as the “gold standard” to measure food security but its
implementation is challenging for it requires the collection of detailed food intake data which
is time consuming (WFP, 2008). This study however benefits from the availability of such
information in the data, which also helps triangulate the result from other indicators. One of
the alternative tools to measuring food security is the WFP’s (2008) FCS that measures the
frequency of consumption of different food groups consumed by a household during the 7
days before the survey. In this approach, different food items are first categorized into 9 main
groups and a food consumption score is then calculated using weights assigned to each food
group5. Using FCS cut-offs which had been validated based on data collected from
households in different countries (e.g. Wiesmann et al, 2009), this technique categorises
households into three food security groups: poor, borderline and acceptable.
A related composite measure is the HDDS, which reflects the average household dietary
diversity and proxies for household’s food access (Swindle and Bilinsky, 2006). HDDS
differs from FCS for it does not attach any weight among different food items and also does
not take into account the frequency of consumption of a certain food. Further, it often uses a
24-hour recall period which is shorter than the seven-days recall used in FCS. The average
HDDS is calculated based on whether anyone in the household consumed any of the 12 types
of food groups6. To examine household food access, the resulting HDDS is compared among
income groups such as income-terciles.
On the other hand, household food insecurity could also be measured using the HFIAS,
which captures the household’s food insecurity (in terms of access), including the frequency
of occurrence of the event in the 4 weeks prior to the survey (Coats et al, 2007). In this
measure, three dimensions of occurrence of food insecurity are captured: “anxiety and
5 The 9 main food groups and the given corresponding weights (in parenthesis) include- Main staples: cereals,
starchy tubers and roots (2); Pulses: legumes and nuts (3); Meat and fish: beef, goat, poultry, pork, eggs and fish
(4); Vegetables (including green leaves) (1); Fruits (1); Oil: oils, fats and butter (0.5); Milk: milk, yogurt and
other diary (4); and Sugar: sugar and sugar products, honey (0.5). For details including calculation steps, see
WFP’s (2008). 6 These food groups include: cereals; root and tubers; vegetables; fruits; meat, poultry offal; eggs; fish and sea
food; pulses/legumes/nuts; milk and milk products; Oil/fats; Sugar/honey; miscellaneous. HDDS is then
calculated following Swindale and Bilinsky (2006).

9
uncertainty about the household food supply; insufficient quality (includes variety and
preferences of the type of food); and, insufficient food intake and its physical consequences”
(Coats et al, 2007: p.6). The HFIAS is then calculated by summing over the frequency-of-
occurrence of food insecurity-related conditions with higher value indicating severe food
insecurity. Following the recommended cut-offs (Coats et al, 2007), households are then
categorised into 4 levels of household food insecurity: food secure, mild, moderately and
severely food insecure. Next, we provide empirical evidence on the level of household food
(in)security among the study households using the indicators discussed above.
To begin with, based on the direct responses by the household head (and/or the spouse), the
data suggest that only about 7 percent of households had a situation where the household did
not have enough food in the previous 12 months. In terms of intra-household food
allocations, under-five children had, on average, 4 meals per-day by comparison to 3 meals
eaten by other household members. Further, about 83 percent of households reported that all
household members eat roughly the same diet while the remaining report that children eat
more diverse foods.
On the other hand, based on the recommended cut-offs to food (in)security measurements
such as FCS and HFIAS, the data suggest that the share of households in the sample who are
food insecure are between 7 and 10 percent (see Table 4 and Table 5). However, when we
investigate the calorie consumption using the 2,100 kilocalories7 per person and day dietary
energy requirement, the share of households that can be considered food insecure increases to
27 percent (Table 6). Further disaggregation of the data by calorie consumption thresholds
reveal that households who are considered greatly food insecure (<1470 kcal) and those on
the borderline (≥ 1,470 and < 2,100 kcal) are about 6 percent and 21 percent, respectively
(Table 6). These figures may seem a great underestimation of the level of food insecurity by
the country standard since FAO’s (2014) estimate puts the share of people undernourished in
2012-14 at 35 percent. However, we offer two reasons: (1) our sample households were
drawn from relatively well-off districts in terms of average land holdings and agricultural
potential, and (2) data were collected immediately after harvest. These two factors may tend
to overstate the likelihood of availability of food in the sample households. Nonetheless,
availability of food does not necessarily guarantee access to- and utilisation of- food and by
extension overall food security. To that end, we cross-tabulate one measure of diet quality
(HDDS) against per-capita food expenditure terciles. According to Figure 2, the average diet
diversity increases with the increase in expenditure. Further, consumption of food groups
such as fruits, meats, and eggs greatly vary by income group with progressive increase. For
example, the share of households that consume fruits, meats, and eggs for the lowest
expenditure group is 13%, 21%, and 33%, respectively while corresponding figures for each
food group by the middle expenditure group are roughly twice, and that by the top
expenditure group are roughly thrice. Pairwise correlation of per-capita calorie consumption,
7 The cut-off point, as the minimum caloric requirement, used by official reports in Ethiopia is 2200 kilocalories
(See MOFED, 2013). If we were to use that cut off point, the number of food insecure groups would rise to 32
percent. However, we use 2100 kcal cut-off to keep consistency with the internationally used measures and in
line with other indicators employed in this study.

10
FCS, HDDS, HFIAS and per-capita food expenditure suggests that all except HFIAS score
are statistically significantly correlated to each other (Table 7).
Table 4. Households by food consumption score (FCS)8 profile
Freq. Percent % with low-aspirations within each
food (in)security profile
FCS profile Head Spouse*
Poor (FCS<=28) 3 0.79 33 100 Borderline (28.5<= FCS<=42) 24 6.35 58 71 Acceptable (FCS<=42) 351 92.86 31 64
*Note: Corresponding statistics does not include female headed households which account about 10 percent of the total.
Table 5. Households by household food insecurity access scale (HFIAS) profile9
Freq. Percent % with low-aspirations within each food (in)security profile
HFIAS category Head Spouse*
Food secure 340 90.19 30 64 Mildly food insecure 9 2.39 78 40 Moderately food insecure 21 5.57 43 83 Severely food insecure 7 1.86 71 67
*Note: Corresponding statistics does not include female headed households.
Table 6. Households by per-capita calorie consumption profile10
Freq. Percent % with low-aspirations within each food (in)security profile
Calorie consumption thresholds Head Spouse*
Poor (<1470 kcal) 21 5.56 38 67 Borderline (≥ 1,470 – < 2,100 kcal) 82 21.69 38 61 Acceptable (>=2100 kcal) 275 72.75 31 67
*Note: Corresponding statistics does not include female headed households.
Fig. 2. Dietary diversity score (HDDS) by per-capita consumption expenditure terciles
8 FCS thresholds constructed following Wiesmann et al (2009).
9 Household Food Insecurity Access category was determined following Coates et al (2007).
10 The calorie value of foods consumed in the household calculated using FAO’s calorie conversion factors.
calorie/gmhttp://www.fao.org/docrep/003/X6877E/X6877E20.htm. Calorie consumption thresholds are based
on Wiesmann et al (2009).
0
0.2
0.4
0.6
0.8
1
1.2
Tercile 1 Tercile 2 Tercile 3

11
Table 7. Pairwise correlation of various food (in)security indicators
Per-capita calorie consumption per day FCS HDDS
HFIAS score
Per-capita monthly food expenditure
Per-capita calorie consumption per day 1 FCS 0.2658* 1
HDDS 0.2305* 0.7294* 1 HFIAS score -0.104 -0.1356 -0.1295 1
Per-capita monthly food expenditure 0.7618* 0.4392* 0.3903* -0.1634 1
One of the preliminary approaches to see the possible links between household food security
and aspirations is to examine the share of people with low-aspirations that belongs in each
food (in)security profile across indicators. Accordingly, Tables 4 to 6 present such descriptive
statistics for household heads and spouses separately. For example, Table 4 shows that
among households whose food security profile is considered “poor”, the share of household
heads with low aspirations is 33 percent while corresponding figure for spouses is 100
percent. Similarly, as Table 5 shows, among households who are considered “severely food
insecure”, the share of household heads with low aspirations is 71 percent while the
corresponding figure for spouses is 67 percent. Further, spouses with low aspirations account
for more than 50 percent of all spouses in households which are considered “food insecure”
and this is the case for almost all indicators (Tables 4 to 6). While the large proportion of
household heads that belong in households which are “food insecure” seem to have low
aspirations, there is no clear trend across various indicators. In general, these preliminary
evidences imply that it may be useful to control for the aspirations status of both the
household head and the spouse while studying food security correlates using multivariate
analysis.
4. Estimation and results
The food security status (𝑦) of the jth
household11
can be expressed in the following function:
𝑦𝑗 = 𝑓(𝐴, 𝐼, 𝐻, 𝐶) (1)
Where, A represents the aspirations status (of the household head and of the spouse), I
denotes other characteristics of the household head and of the spouse, H and C respectively
denote other household and community level characteristics. As opposed to the assumption
behind unitary household models where preferences (or decision making) of the household is
often proxied by that of the preferences of the head of the household, in this study we assume
joint decision making by the two spouses and hence income, wealth or food security of the
household is determined by the characteristics of both the head of the household and of the
spouse, in combination with other household and community characteristics. We estimate a
series of an ordinary least squares (OLS) model relating indicators of household food
(in)security with aspirations of the household head and of the spouse and a wide range of
other potential determinants. Yet, our purpose remains to see if aspirations of the two
spouses, given other factors, are strong correlates of household food security without
necessarily claiming causal relations. This is because regression results might still be
11
When the unit of analysis the individual level (e.g. if “y” is subjective well-being), A and I respectively denote
the aspirations status and other characteristics of the individual. All other variables remain the same.

12
confounded by unobserved household-specific heterogeneity which we could not account for
since we only have cross-sectional observations on the main variables of interest (i.e.
aspirations and food (in)security). Yet, some (e.g. Angrist and Pischke, 2009) argue that
strong correlations sometimes suggest causal relations and hence policy implications could
still be drawn from such analysis.
4.1. Results and discussion
We have shown in a bivariate context that aspirations and food security are positively
correlated. In this section, we examine if that relationship still holds and whether the
correlation is statistically significant after controlling for other potential determinants of the
four pillars of household food security, namely, availability, access, utilization, and stability
of food at all times. Following the existing literature and their availability in the data, we use
per-capita calorie consumption, FCS, HDDS and HFIAS as measures of food (in)security.
Table 8 presents a summary of the main correlates of food (in)security. Since it is likely that
the aspirations of the household head and the spouse are correlated, we control for that effect
using an interaction term of the aspirations index of the two spouses (see result columns 1 -
4). Results suggest that aspirations are indeed strongly associated with household food
(in)security. For example, according to column 1, a standard deviation increase in the
aspirations level of the household head is associated with a (422.4 × 0.61) = 257.7 calories
per-capita per-day increase in household consumption. This is roughly a (257.7/2997) = 8.6
percent increase over the mean calories consumption per-capita per day. Similarly, according
to columns 2 to 4 respectively, a standard deviation increase in the aspirations index of the
household head is associated with a (4.5 × 0.61) = 2.75 points increase in FCS, a (0.36 ×
0.61) = 0.22 points increase in HDDS, and a (0.34 × 0.61) = 0.21 points decrease in HFIAS
(recall that unlike other indicators, HFIAS actually measures food insecurity)12
. In reference
to the corresponding mean outcomes, these are roughly a (2.75/71.4) = 3.9 percent increase in
FCS, a (0.22/8.68) = 2.5 percent increase in HDDS, and a (0.21/0.48) = 44 percent decrease
in HFIAS.
Further, in order to check if other results would hold in a unitary household model
framework, we exclude the aspirations index and other characteristics of the spouse of the
household head from subsequent estimations (see columns 5-8) and control for the gender of
the household head. While the magnitude of the coefficient estimates for the aspirations index
of the household head slightly decline, the correlation remains statistically significant in three
out of the four indicators of the household food (in)security. This perhaps underlines the
importance of controlling for the aspirations and other characteristics of the spouse of the
household head even though the coefficient estimates of the spouse’s aspirations index are
not themselves statistically significant (columns 1-4). Doing so is further supported by not
12
Female headed households drop out from the analysis (column 1-4) when we consider the characteristics of
both the household head and the spouse. Thus, the corresponding mean values (for columns 1-4) of per-capita
calorie consumption, FCS, HDDS, and HFIAS are respectively 2997, 71.4, 8.68, and 0.48. The corresponding
mean values for the full sample regardless of household headship are 3040, 70.5, 8.6, and 0.49.

13
only other studies (e.g. see Strauss and Thomas (1995) for a survey of the literature) but also
by the statistical evidence of the spouse’s education as a statistically significant correlate of
FCS and HDDS (column 2 and 3).
Table 8. Correlation of aspirations and other factors with food (in)security
(1) (2) (3) (4) (5) (6) (7) (8)
pc_Calorie FCS HDDS HFIAS pc_Calorie_H FCS_H HDDS_H HFIAS_H
Aspirations Head 422.38*** 4.50** 0.36** -0.34** 364.38*** 2.82 0.28** -0.35**
(129.72) (1.81) (0.15) (0.16) (123.54) (1.98) (0.13) (0.16)
Aspirations Spouse -183.02 -0.88 -0.07 -0.00
(122.89) (1.76) (0.13) (0.29)
Aspirations(Head*Spouse) -82.35 -4.96*** -0.12 0.18
(92.69) (1.52) (0.13) (0.19)
Aspirat.*INChange(2006-10) 0.00 0.00 0.00 -0.00 -0.00 0.00 0.00 -0.00
(0.06) (0.00) (0.00) (0.00) (0.05) (0.00) (0.00) (0.00)
Female hh head +
6.39 -6.08* -0.57** 0.09
(254.72) (3.35) (0.24) (0.33)
HH head Age31-50+ -170.90 -2.87 -0.49 -0.59 65.69 -1.15 -0.28 -0.19
(306.19) (5.72) (0.38) (0.76) (245.55) (4.18) (0.30) (0.58)
HH head Age above51+ -267.57 -4.38 -0.62 -0.76 -48.14 -2.25 -0.48 -0.46
(337.34) (6.05) (0.40) (0.69) (258.40) (4.24) (0.32) (0.52)
Spouse Age31-50+ 103.65 1.93 0.10 0.14
(205.33) (2.97) (0.24) (0.26)
Spouse Age above51+ -92.47 3.67 0.46 -0.33
(272.30) (3.76) (0.32) (0.34)
Head education: 0-4+ -106.28 -5.99** -0.51** -0.16 107.32 -4.92* -0.46** 0.10
(209.68) (2.97) (0.22) (0.48) (191.58) (2.67) (0.20) (0.34)
Head education: 5-8+ -113.99 0.16 -0.09 -0.70* 70.13 0.45 -0.13 -0.35
(199.53) (2.64) (0.21) (0.42) (184.86) (2.42) (0.19) (0.28)
Head education: 8++ 13.05 0.82 -0.24 -0.60 3.21 0.58 -0.24 -0.15
(237.26) (3.28) (0.24) (0.41) (256.19) (2.83) (0.21) (0.38)
Spouse education: 0-4+ 199.23 2.64 0.10 0.46
(167.94) (2.59) (0.20) (0.46)
Spouse education: 5-8+ -274.66 1.36 0.21 0.42
(201.28) (2.99) (0.22) (0.38)
Spouse education: 8++ 154.56 8.61** 0.62** 0.37
(308.88) (4.15) (0.31) (0.34)
HH size(ln) -991.32*** 5.78* 0.78*** 0.68 -1,372.61*** 6.49** 0.74*** 0.40
(256.25) (3.25) (0.28) (0.49) (258.99) (2.67) (0.23) (0.34)
Dependency ratio 102.32 5.25 0.38 0.27 -210.73 2.65 0.10 0.09
(400.88) (5.44) (0.47) (0.39) (360.02) (4.37) (0.35) (0.37)
HH head in business/wage+ -334.85** -2.95 0.02 -0.12
(152.56) (2.32) (0.16) (0.28)
Spouse in business/wage+ 159.60 2.41 0.31* 0.32
(171.65) (2.24) (0.17) (0.38)
Off-farm income+
-130.53 0.06 0.05 0.19
(141.00) (1.85) (0.14) (0.20)
Change in Income (2006-10) 0.00 0.00 -0.00 -0.00* 0.01 0.00 -0.00 -0.00
(0.06) (0.00) (0.00) (0.00) (0.05) (0.00) (0.00) (0.00)
Income per-adult equiv. 0.05 0.00*** 0.00*** -0.00 0.03 0.00*** 0.00*** -0.00
(0.04) (0.00) (0.00) (0.00) (0.04) (0.00) (0.00) (0.00)
Value of assets (ln) -77.23 0.07 0.15* -0.20 -30.53 0.77 0.19*** -0.21*
(71.11) (1.00) (0.08) (0.13) (66.91) (0.87) (0.07) (0.13)
Livestock holding(TLU) 58.02*** 0.50** 0.01 0.00 47.09*** 0.30 -0.00 0.01
(17.00) (0.23) (0.02) (0.02) (16.51) (0.22) (0.02) (0.02)
Land holdings in ha(ln) 33.36 -0.77 -0.15 -0.17 170.92 2.06 -0.03 -0.26
(154.76) (1.98) (0.18) (0.20) (169.48) (2.06) (0.17) (0.18)
14
Shocks experience Too much rain or flood+ 594.27* 6.63** 0.38 0.08 493.57* 5.58* 0.49** 0.12
(356.11) (3.18) (0.25) (0.88) (275.17) (2.89) (0.20) (0.67)
Livestock diseases+ 238.35 -1.80 -0.04 0.04 426.32 -1.84 -0.14 0.45
(281.38) (3.21) (0.23) (0.66) (279.23) (2.78) (0.21) (0.58)
Increased input prices+ -79.46 -2.35 -0.14 1.22** 96.41 -2.89 -0.06 0.70
(224.08) (3.36) (0.21) (0.59) (211.23) (3.09) (0.20) (0.52)
Death or loss of livestock+ -191.19 -0.04 0.25 -0.56 -120.11 0.46 0.28 -0.34
(201.14) (3.34) (0.21) (0.53) (196.97) (3.10) (0.19) (0.52)
Illness of head/spouse+ -190.48 -3.64 -0.47* 0.86 -156.54 -0.26 -0.33 0.42
(230.75) (2.86) (0.26) (0.73) (203.55) (2.90) (0.24) (0.61)
Illness of other family+ 484.20** 4.60 0.47** 0.33 294.93 4.61 0.35* 0.39
(237.91) (3.21) (0.22) (0.64) (214.57) (2.90) (0.20) (0.58)
Average distance to services Road (minutes)(ln) -80.96** 0.10 -0.01 0.06 -42.34 0.29 0.01 0.04
(39.38) (0.42) (0.03) (0.04) (38.46) (0.45) (0.03) (0.04)
Market(minutes)(ln) -53.17 -2.85*** -0.28*** -0.05 -71.33 -2.66*** -0.25*** -0.04
(81.56) (1.06) (0.08) (0.12) (82.39) (0.97) (0.07) (0.10)
Micro-finance (minutes)(ln) 63.99 2.47* 0.12 -0.13 159.08 2.09 0.09 -0.28*
(111.41) (1.43) (0.12) (0.14) (101.01) (1.31) (0.10) (0.14)
Health center(minutes)(ln) 166.19 3.34*** 0.15 -0.11 68.41 2.67** 0.09 -0.10
(103.22) (1.23) (0.10) (0.09) (89.27) (1.10) (0.09) (0.10)
Bako-Sire -454.32*** -1.51 -0.48** 0.46 -241.10 -0.78 -0.36* 0.27
(169.15) (2.86) (0.24) (0.29) (155.23) (2.54) (0.20) (0.29)
Hitossa-Tiyo 752.40*** 6.98** 0.17 -0.15 848.16*** 7.92*** 0.26 -0.20
(194.77) (2.76) (0.22) (0.21) (189.00) (2.45) (0.19) (0.18)
Constant 4,286.69*** 37.71*** 6.01*** 2.42 4,343.51*** 32.54*** 5.97*** 3.49**
(928.07) (14.15) (1.05) (1.76) (948.31) (11.76) (0.88) (1.62)
Observations 302 302 302 302 374 374 374 375 R-squared 0.35 0.31 0.31 0.23 0.32 0.29 0.30 0.16
Robust standard errors in parentheses. * p<0.10, ** p<0.05, *** p<0.01. +Binary outcomes.
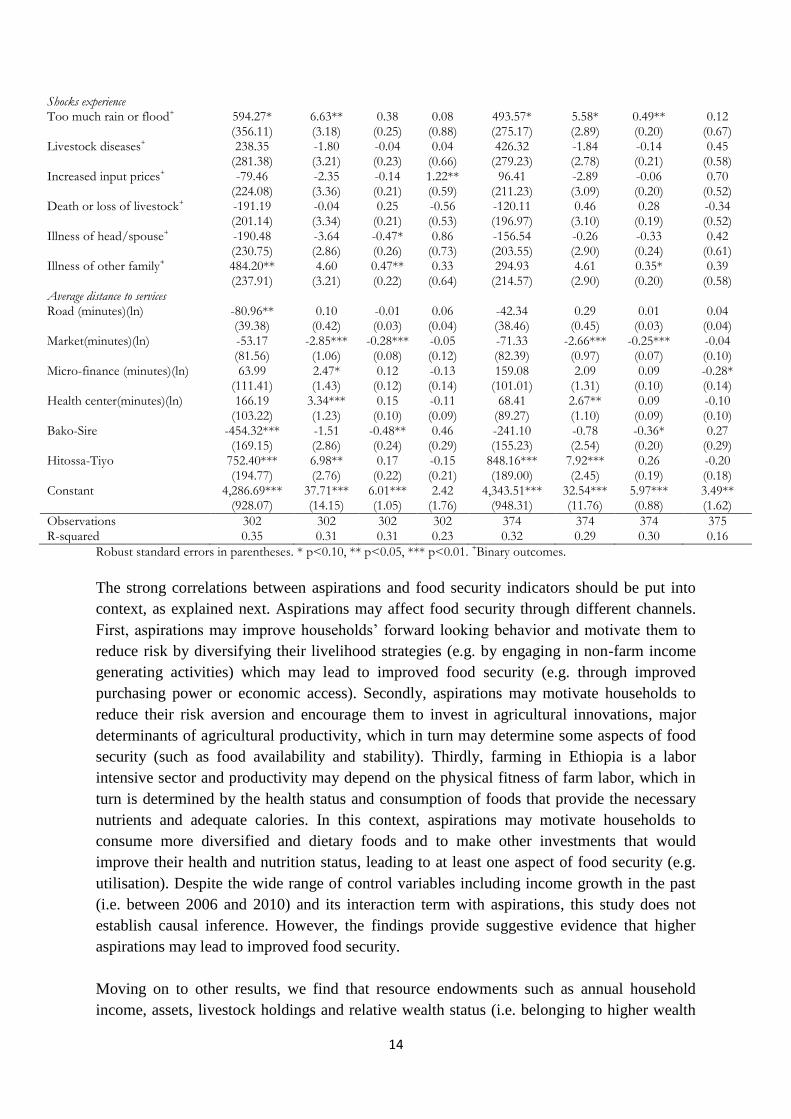
The strong correlations between aspirations and food security indicators should be put into
context, as explained next. Aspirations may affect food security through different channels.
First, aspirations may improve households’ forward looking behavior and motivate them to
reduce risk by diversifying their livelihood strategies (e.g. by engaging in non-farm income
generating activities) which may lead to improved food security (e.g. through improved
purchasing power or economic access). Secondly, aspirations may motivate households to
reduce their risk aversion and encourage them to invest in agricultural innovations, major
determinants of agricultural productivity, which in turn may determine some aspects of food
security (such as food availability and stability). Thirdly, farming in Ethiopia is a labor
intensive sector and productivity may depend on the physical fitness of farm labor, which in
turn is determined by the health status and consumption of foods that provide the necessary
nutrients and adequate calories. In this context, aspirations may motivate households to
consume more diversified and dietary foods and to make other investments that would
improve their health and nutrition status, leading to at least one aspect of food security (e.g.
utilisation). Despite the wide range of control variables including income growth in the past
(i.e. between 2006 and 2010) and its interaction term with aspirations, this study does not
establish causal inference. However, the findings provide suggestive evidence that higher
aspirations may lead to improved food security.
Moving on to other results, we find that resource endowments such as annual household
income, assets, livestock holdings and relative wealth status (i.e. belonging to higher wealth

15
quintiles) are positively correlated with some of the food security indicators (columns 1-8).
Besides having an education level higher than 8th
grade, engagement of the spouse of the
household head in non-farm income generating activities tends to improve the household’s
dietary diversity (column 3). This is because education enhances the nutrition knowledge of
the main care giver (often wives in rural Ethiopia) and their engagement in income generating
activities increases the resources that might be available at their disposal. Further, negative
shocks such as illness of the household head or the spouse and large increases in input prices
are negatively associated with food security (column 3 and 4) which is in line with the theory
and empirical studies that suggest that shocks of these nature may disrupt food security (e.g.
Barrett, 2010; and Dercon and Krishnan, 2000). As expected, remoteness of the household
from the market and asphalt road is also negatively associated with food security (columns 2,
3, 6 & 7). This is because, access to roads and markets determine accessibility and stability of
food. Surprisingly, however, results suggest that remoteness of the household from micro-
finance institution and health center, and the incidence of illness of a household member
other than the head and spouse are positively correlated with some of the indicators of food
security (columns 2, 6 & 8). Lastly, results also suggest that female headed households are
more likely to be food insecure (columns 6 & 7).
5. Summary and conclusions
This study empirically examines if aspirations are important correlates of food security in
rural Ethiopia. We establish robust evidence by employing several objective as well as
subjective measures of food (in)security that also reflect the multi-dimensionality of the
concept. Descriptive statistics suggest that individuals with high aspirations have on average
higher income or wealth by comparison to those with low aspirations and the difference is
statistically significant. Similarly, across different food security categories, the share of
people with low-aspirations increases as we move from the most food secure to the extremely
food insecure categories, and this is true for most of the indicators.
We use regressions to relate each food (in)security outcome against the aspirations indicator
and other potential drivers including human capital and the household’s access to: natural
capital, physical capital, financial capital, services (e.g. roads, markets, health center); and the
household’s experience of various shocks. To account for the unobserved factors common to
all residents in each study site, we control for district dummies. The main finding of the
study, which is robust across outcome indicators, is that the aspirations of the household head
are important predictors of household food security in rural Ethiopia. While we fail to find a
statistically significant effect of the aspirations of the spouse, their inclusion along with other
characteristics of the spouse in the regressions increase the magnitude of the coefficient
estimates for the aspirations of the household head. This perhaps indirectly underscores the
importance of the spouse’s contribution to the household decision-making and corresponding
outcomes.
Despite the cross-sectional nature of the data used in this study, which is the major limitation
for unobserved household characteristics might still affect both the aspirations and food

16
security or the possibility of reverse causation, the robustness of findings across various
indicators suggest that aspirations are indeed strong determinants. Yet, it is important to note
that we have controlled for present income and wealth, the change in income in the past (i.e.
between 2006 and 2010) and its interaction term with aspirations, and a wide range of other
factors which might affect both the aspirations and the present level of outcome indicators.
This perhaps might help minimise the influence of the error term that would result from the
unobserved heterogeneities. Further, we had also established (in other unpublished papers)
that aspirations are also strongly correlated with the adoption of agricultural innovations and
risk-taking behavior which are all underlying determinants of household food security.
Therefore, we conclude that policies aimed at improving food security should incorporate
aspirations-raising strategies for they could benefit from these multiple effects of aspirations
(i.e. direct and indirect effects). This may involve direct motivations and/or other strategies
which may target the determinants of aspirations that would help break behavioral poverty
traps. Finally, the policy relevance of findings in this study could be emphasised in the words
of Bandura (2009) who states that “failure to address the psychosocial determinants of human
behavior is often the weakest link in social policy initiatives. Simply providing ready access
to resources does not mean that people will take advantage of them.”

17
References
Appadurai, A., 2004. The capacity to aspire: Culture and the terms of recognition. Cult.
Public Action 59–84.
Aredo, D., Tsegaye, W., La Rovere, R., Mwangi, W. 2008. Methodology: CIMMYT/SG
2000 Impact Assessment (IA) Project - Ethiopia. memo.
Asenso-Okyere, K., Mekonnen, D.A., Zerfu, E., 2013. Determinants of food security in
selected agro-pastoral communities of Somali and Oromia Regions, Ethiopia. J. Food
Sci. Eng. 3, 453.
Bandura, A. (The Psychologist (2009) (eds.)). 2009. "Social Cognitive Theory goes Global"
talk by A. Bandura for the British Psychological Society’s London and Home
Counties Branch at Friends House, London, vol. 22, 6, June 504-506.
Barrett, C. 2010. Measuring Food Insecurity. Science Vol. 327 (825-828).
Berhane, G, Gilligan, D. O. Hoddinott, J., Kumar, N. and Taffesse, A. S. 2014. Can Social
Protection Work in Africa? The Impact of Ethiopia’s Productive Safety Net
Programme. Econ. Dev. Cult. Change 63, 1–26. doi:10.1086/677753
Berhane, G, Hoddinott, J., Kumar, N. and Taffesse, A. S., 2011. The Impact of Ethiopia’s
Productive Safety Net Productive Safety Nets and Household Asset Building
Programme: 2006-2010. IFPRI
Bernard, T., Taffesse, A. S., 2014. Aspirations: An Approach to Measurement with
Validation Using Ethiopian Data. J. Afr. Econ. 23, 189–224. doi:10.1093/jae/ejt030
Bernard, T., Taffesse, A.S., and Dercon, S. 2008. Aspirations Failure and Well‐Being
Outcomes in Ethiopia: Towards an Empirical Exploration. Paper presented at
Improving Institutions for Growth workshop, Oxford, UK, March 21.
Christiaensen, L. J. and Demery, L. 2007. Down to earth: agriculture and poverty reduction in
Africa. The World Bank.
Clay, D. C., Molla, D., and Habtewold, D. 1999. Food aid targeting in Ethiopia: A study of
who needs it and who gets it. Food Policy 24, pp. 391–409
Coll-Black, S., Gilligan, D.O., Hoddinott, J., Kumar, N., Taffesse, A.S., Wiseman, W., 2011.
Targeting Food Security Interventions When “Everyone is Poor”: The Case of
Ethiopia‟ s Productive Safety Net Programme. ESSP II Work. 24.
Coates, J., Swindale, A. and Bilinsky, P., 2007. Household Food Insecurity Access Scale
(HFIAS) for Measurement of Food Access: Indicator Guide. Version 3. FANTA
Dalton, P.S., Ghosal, S., Mani, A., 2014. Poverty and Aspirations Failure. Econ. J. n/a–n/a.
doi:10.1111/ecoj.12210
Dercon, S., Krishnan, P., 2000. In sickness and in health: Risk sharing within households in
rural Ethiopia. J. Polit. Econ. 108, 688–727.
Devereux, S., Sussex, I., 2000. Food insecurity in Ethiopia, in: A DFID Ethiopia Seminar,
London.
Dorosh, P & S. Rashid. (2012). Introduction. In Food and Agriculture in Ethiopia: Progress
and Policy Challenges, eds. Published for the International Food Policy Research
Institute, University of Pennsylvania Press.
EHRD (Ethiopia Humanitarian Requirements Document). 2016. Joint Government and
Humanitarian Partners’ Document.
http://www.unicef.org/ethiopia/ECO_Ethiopia_HRD_2016.pdf (accessed Jan15, 16)
FAO, IFAD and WFP. 2015. The State of Food Insecurity in the World 2015. Meeting the
2015 international hunger targets: taking stock of uneven progress. Rome, FAO.
FAO, 2002. The State of Food Insecurity in the World 2001. Rome, FAO.

18
Feleke, S. T. Kilmer, R. L. and Gladwin, C. H. 2005. Determinants of food security in
Southern Ethiopia at the household level. Agricultural Economics. Vol. 33 (3) 351-
363.
GFDRE (Government of the Federal Democratic Republic of Ethiopia). 2007. Graduation
Guidance Note. Addis Ababa: Food Security Coordination Directorate, Ministry of
Agriculture and Rural Development.
GFDRE (Government of the Federal Democratic Republic of Ethiopia). 2009. Food Security
Programme, 2010-2014. Addis Ababa: Ministry of Agriculture and Rural
Development.
Gilligan, D.O. and Hoddinott, J. 2007. Is there Persistence in the Impact of Emergency Food
Aid? Evidence on Consumption, Food Security, and Assets in Rural Ethiopia.
American Journal of Agricultural Economics, Vol. 89, No. 2, pp. 225-242
Gilligan, D.O., Hoddinott, J., Taffesse, A.S., 2009. The Impact of Ethiopia’s Productive
Safety Net Programme and its Linkages. J. Dev. Stud. 45, 1684–1706.
doi:10.1080/00220380902935907
Jones, A.D., Ngure, F.M., Pelto, G., Young, S.L., 2013. What Are We Assessing When We
Measure Food Security? A Compendium and Review of Current Metrics. Adv. Nutr.
Int. Rev. J. 4, 481–505. doi:10.3945/an.113.004119
Negatu, W. 2004. Reasons for Food Insecurity of Farm Households in South Wollo, Ethiopia:
Explanations at Grassroots. BASIS CRSP.
Pangaribowo, E.H., Gerber, N. and Torero, M., 2013. Food and nutrition security indicators:
a review. ZEF Working Paper Series N. 108.
Quisumbing, A. 2003. Food Aid and Child Nutrition In Rural Ethiopia. FCND Discussion
Paper No. 158, IFPRI.
Ray, Debraj. 2006. “Aspirations, Poverty and Economic Change”, in Banerjee, Abhijit V.,
Roland Benabou, and Dilip Mookherjee (eds.), Understanding Poverty, Oxford
University Press, Oxford.
Strauss, J. and Thomas, D. 1995. Human resources: Empirical modeling of household and
family decisions. volume 3 of Handbook of Development Economics, pp.1883–2023.
Elsevier.
Swindale and Bilinsky (2006) Household Dietary Diversity Score (HDDS) for Measurement
of Household Food Access: Indicator Guide. VERSION 2. FANTA
Tafesse, G. (2005). The Contributions of Agricultural Growth to Poverty Reduction in
Ethiopia. Ethiopian Journal of Economics Vol. 14 (1) 2005: pp. 1-26
von Braun, J., Olofinbiyi, T., 2007. Famine and Food Insecurity in Ethiopia. Pinstrup-
Andersen Fuzhi Cheng Eds Food Policy Dev. Ctries. Role Gov. Glob. Food Syst.
Case Study 7 4.
Wiesmann, D., Bassett, L., Benson, T. and Hoddinott, J. 2009. Validation of the World Food
Programme’s Food Consumption Score and Alternative Indicators of Household Food
Security. IFPRI DP 00870
World Bank. (2015). Ethiopia’s Great Run. The Growth Acceleration and How to Pace It.
Nov. 18. Draft, World Bank Group
World Bank Group. 2013. Ethiopia’s Productive Safety Net Program (PSNP) Integrating
Disaster And Climate Risk Management. Case Study. The World Bank.
WFP (World Food Programme). 2008. Food consumption analysis Calculation and use of the
food consumption score in food security analysis. Technical Guidance Sheet.
Yamano, T., Alderman, H., Christiaensen, L., 2005. Child growth, shocks, and food aid in
rural Ethiopia. Am. J. Agric. Econ. 87, 273–288.
19
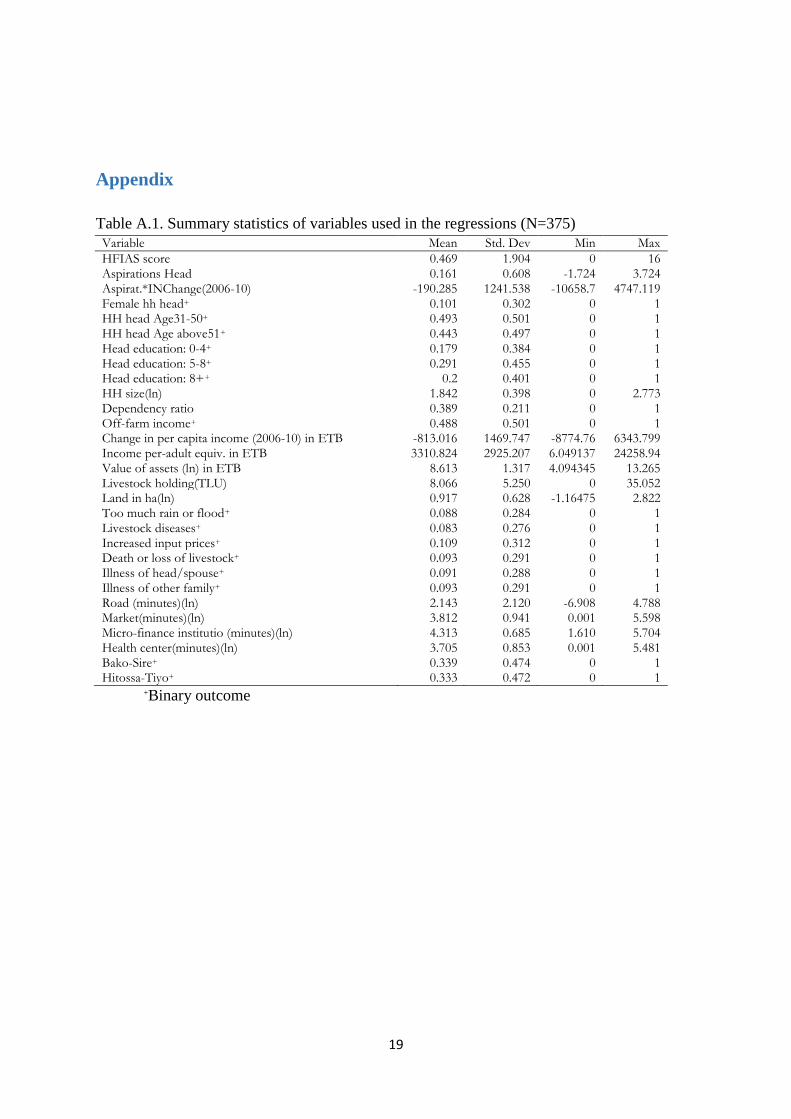
Appendix
Table A.1. Summary statistics of variables used in the regressions (N=375)
Variable Mean Std. Dev Min Max
HFIAS score 0.469 1.904 0 16 Aspirations Head 0.161 0.608 -1.724 3.724 Aspirat.*INChange(2006-10) -190.285 1241.538 -10658.7 4747.119 Female hh head+ 0.101 0.302 0 1 HH head Age31-50+ 0.493 0.501 0 1 HH head Age above51+ 0.443 0.497 0 1 Head education: 0-4+ 0.179 0.384 0 1 Head education: 5-8+ 0.291 0.455 0 1 Head education: 8++ 0.2 0.401 0 1 HH size(ln) 1.842 0.398 0 2.773 Dependency ratio 0.389 0.211 0 1 Off-farm income+ 0.488 0.501 0 1 Change in per capita income (2006-10) in ETB -813.016 1469.747 -8774.76 6343.799 Income per-adult equiv. in ETB 3310.824 2925.207 6.049137 24258.94 Value of assets (ln) in ETB 8.613 1.317 4.094345 13.265 Livestock holding(TLU) 8.066 5.250 0 35.052 Land in ha(ln) 0.917 0.628 -1.16475 2.822 Too much rain or flood+ 0.088 0.284 0 1 Livestock diseases+ 0.083 0.276 0 1 Increased input prices+ 0.109 0.312 0 1 Death or loss of livestock+ 0.093 0.291 0 1 Illness of head/spouse+ 0.091 0.288 0 1 Illness of other family+ 0.093 0.291 0 1 Road (minutes)(ln) 2.143 2.120 -6.908 4.788 Market(minutes)(ln) 3.812 0.941 0.001 5.598 Micro-finance institutio (minutes)(ln) 4.313 0.685 1.610 5.704 Health center(minutes)(ln) 3.705 0.853 0.001 5.481 Bako-Sire+ 0.339 0.474 0 1 Hitossa-Tiyo+ 0.333 0.472 0 1
+Binary outcome