Embed Size (px)
Citation preview
For comments, suggestions or further inquiries please contact:
Philippine Institute for Development StudiesSurian sa mga Pag-aaral Pangkaunlaran ng Pilipinas
The PIDS Discussion Paper Seriesconstitutes studies that are preliminary andsubject to further revisions. They are be-ing circulated in a limited number of cop-ies only for purposes of soliciting com-ments and suggestions for further refine-ments. The studies under the Series areunedited and unreviewed.
The views and opinions expressedare those of the author(s) and do not neces-sarily reflect those of the Institute.
Not for quotation without permissionfrom the author(s) and the Institute.
The Research Information Staff, Philippine Institute for Development Studies5th Floor, NEDA sa Makati Building, 106 Amorsolo Street, Legaspi Village, Makati City, PhilippinesTel Nos: (63-2) 8942584 and 8935705; Fax No: (63-2) 8939589; E-mail: [email protected]
Or visit our website at http://www.pids.gov.ph
April 2013
Aspirations and Challengesfor Economic and Social Development
in the Philippines Toward 2030
DISCUSSION PAPER SERIES NO. 2013-27
Josef T. Yap and Ruperto P. Majuca
PIDS Discussion Paper version, April 04, 2013
Aspirations and Challenges for Economic and Social Development
in the Philippines Towards 2030
Josef T. Yap and Ruperto P. Majuca Abstract The Philippines continues to demonstrate a development puzzle. Despite abundant natural and human resources, its development record pales in comparison with its neighbors in East Asia. This study presents a SWOT analysis to explain the economic development of the Philippines. To overcome the threats and weaknesses, the Philippines should aspire for BRISK development: balanced, rapid, inclusive, sustainable and capital-intensive economic growth. Policy recommendations include standard reforms related to expanding fiscal space and improving infrastructure. However, Philippine history requires that special attention be given to strengthening institutions and weakening the grip of oligarchs. The rapid rise of China and India and the establishment of the ASEAN Economic Community provide an opportunity to attract more foreign direct investment, diversify the productions base, and expand the role of small and medium sized enterprises. Keywords: Development puzzle; SWOT analysis; critical development constraints; ASEAN Economic Community; balanced, rapid, sustainable, inclusive and capital-intensive economic growth
ii
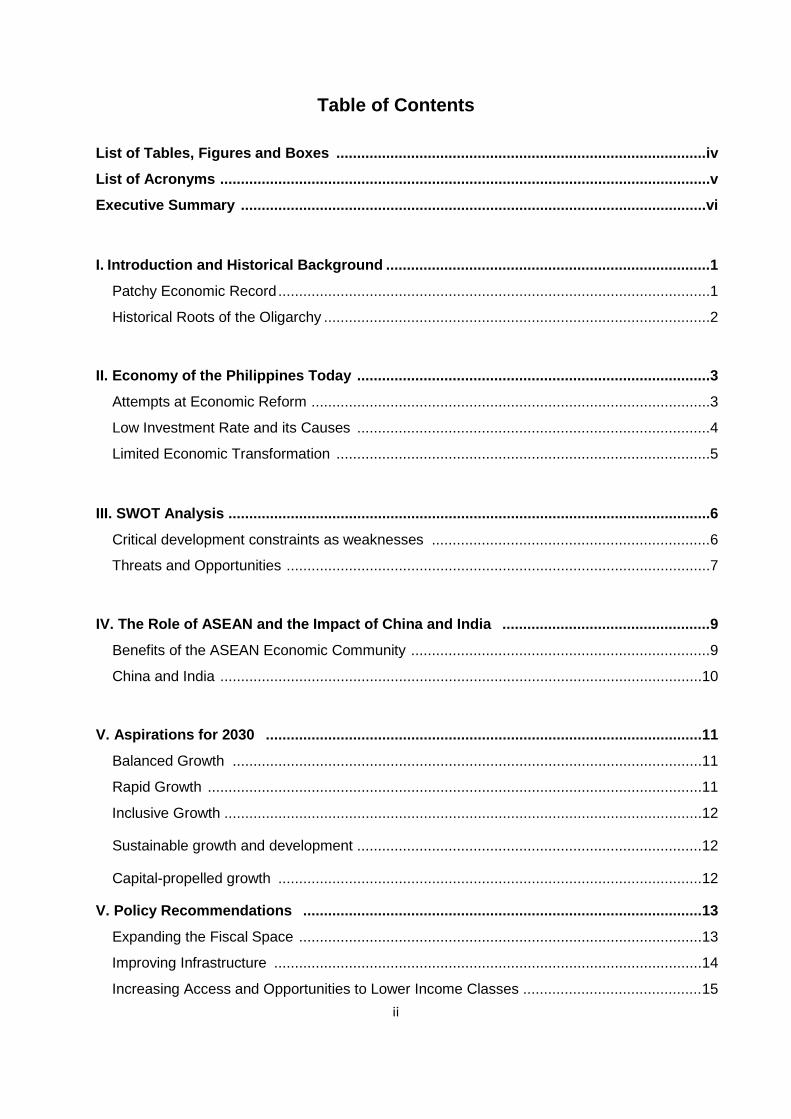
Table of Contents
List of Tables, Figures and Boxes ......................................................................................... iv
List of Acronyms ...................................................................................................................... v
Executive Summary ................................................................................................................ vi
I. Introduction and Historical Background .............................................................................. 1
Patchy Economic Record ........................................................................................................ 1
Historical Roots of the Oligarchy ............................................................................................. 2
II. Economy of the Philippines Today ..................................................................................... 3
Attempts at Economic Reform ................................................................................................ 3
Low Investment Rate and its Causes ..................................................................................... 4
Limited Economic Transformation .......................................................................................... 5
III. SWOT Analysis .................................................................................................................... 6
Critical development constraints as weaknesses ................................................................... 6
Threats and Opportunities ...................................................................................................... 7
IV. The Role of ASEAN and the Impact of China and India .................................................. 9
Benefits of the ASEAN Economic Community ........................................................................ 9
China and India .................................................................................................................... 10
V. Aspirations for 2030 ......................................................................................................... 11
Balanced Growth ................................................................................................................. 11
Rapid Growth ....................................................................................................................... 11
Inclusive Growth ................................................................................................................... 12
Sustainable growth and development ................................................................................... 12
Capital-propelled growth ...................................................................................................... 12
V. Policy Recommendations ................................................................................................ 13
Expanding the Fiscal Space ................................................................................................. 13
Improving Infrastructure ....................................................................................................... 14
Increasing Access and Opportunities to Lower Income Classes ........................................... 15
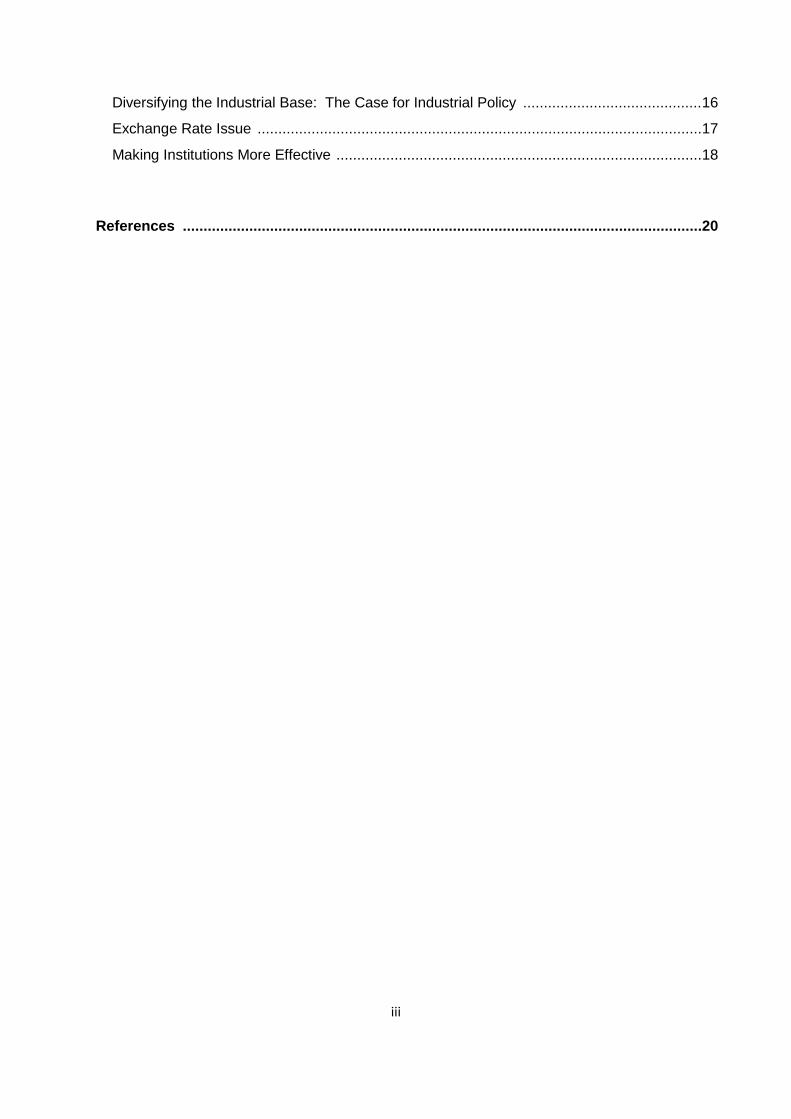
iii
Diversifying the Industrial Base: The Case for Industrial Policy ........................................... 16
Exchange Rate Issue ........................................................................................................... 17
Making Institutions More Effective ........................................................................................ 18
References ............................................................................................................................. 20
iv
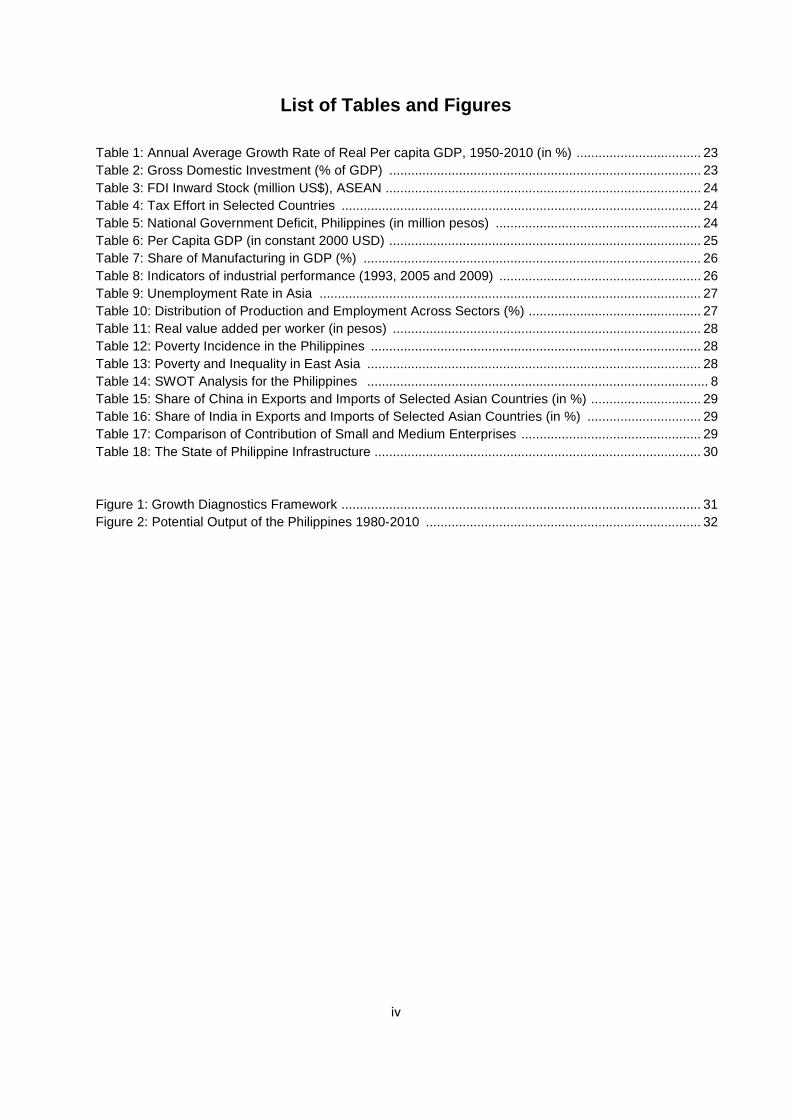
List of Tables and Figures
Table 1: Annual Average Growth Rate of Real Per capita GDP, 1950-2010 (in %) .................................. 23 Table 2: Gross Domestic Investment (% of GDP) ..................................................................................... 23 Table 3: FDI Inward Stock (million US$), ASEAN ...................................................................................... 24 Table 4: Tax Effort in Selected Countries .................................................................................................. 24 Table 5: National Government Deficit, Philippines (in million pesos) ........................................................ 24 Table 6: Per Capita GDP (in constant 2000 USD) ..................................................................................... 25 Table 7: Share of Manufacturing in GDP (%) ............................................................................................ 26 Table 8: Indicators of industrial performance (1993, 2005 and 2009) ....................................................... 26 Table 9: Unemployment Rate in Asia ........................................................................................................ 27 Table 10: Distribution of Production and Employment Across Sectors (%) ............................................... 27 Table 11: Real value added per worker (in pesos) .................................................................................... 28 Table 12: Poverty Incidence in the Philippines .......................................................................................... 28 Table 13: Poverty and Inequality in East Asia ........................................................................................... 28 Table 14: SWOT Analysis for the Philippines ............................................................................................. 8 Table 15: Share of China in Exports and Imports of Selected Asian Countries (in %) .............................. 29 Table 16: Share of India in Exports and Imports of Selected Asian Countries (in %) ............................... 29 Table 17: Comparison of Contribution of Small and Medium Enterprises ................................................. 29 Table 18: The State of Philippine Infrastructure ......................................................................................... 30 Figure 1: Growth Diagnostics Framework .................................................................................................. 31 Figure 2: Potential Output of the Philippines 1980-2010 ........................................................................... 32
v
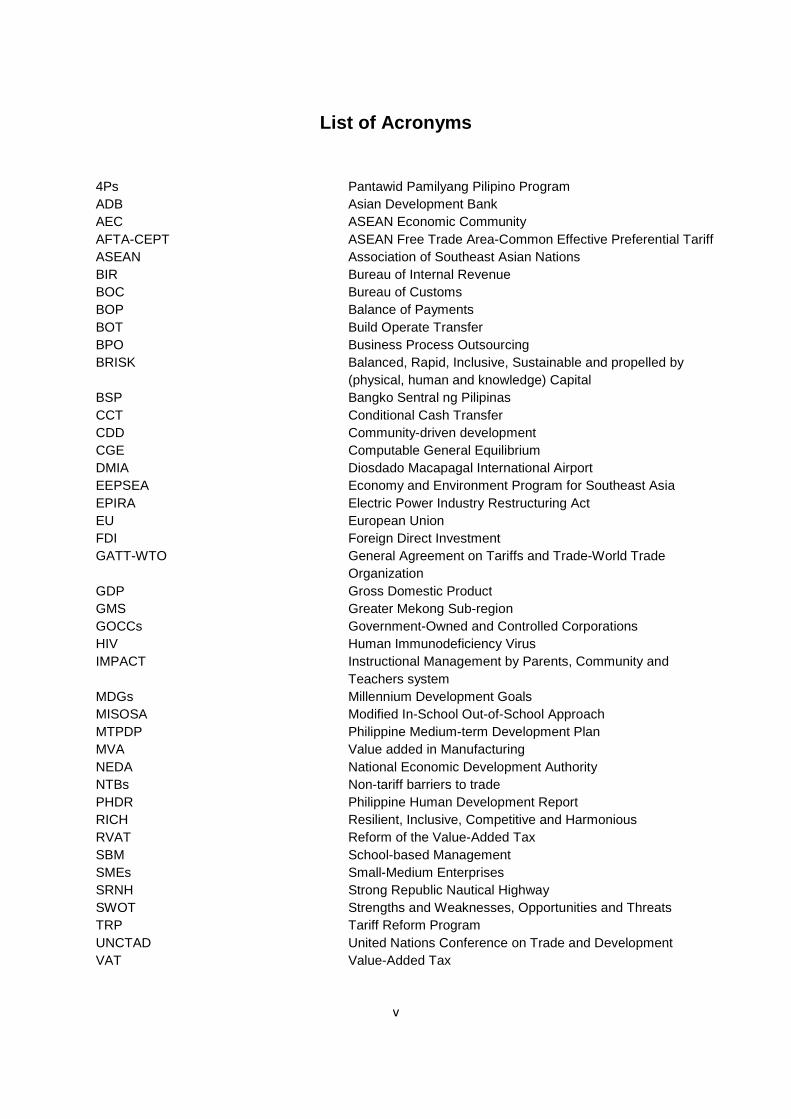
List of Acronyms 4Ps Pantawid Pamilyang Pilipino Program ADB Asian Development Bank AEC ASEAN Economic Community AFTA-CEPT ASEAN Free Trade Area-Common Effective Preferential Tariff ASEAN Association of Southeast Asian Nations BIR Bureau of Internal Revenue BOC Bureau of Customs BOP Balance of Payments BOT Build Operate Transfer BPO Business Process Outsourcing BRISK Balanced, Rapid, Inclusive, Sustainable and propelled by
(physical, human and knowledge) Capital BSP Bangko Sentral ng Pilipinas CCT Conditional Cash Transfer CDD Community-driven development CGE Computable General Equilibrium DMIA EEPSEA
Diosdado Macapagal International Airport Economy and Environment Program for Southeast Asia
EPIRA Electric Power Industry Restructuring Act EU European Union FDI Foreign Direct Investment GATT-WTO General Agreement on Tariffs and Trade-World Trade
Organization GDP Gross Domestic Product GMS Greater Mekong Sub-region GOCCs Government-Owned and Controlled Corporations HIV Human Immunodeficiency Virus IMPACT
Instructional Management by Parents, Community and Teachers system
MDGs Millennium Development Goals MISOSA Modified In-School Out-of-School Approach MTPDP Philippine Medium-term Development Plan MVA Value added in Manufacturing NEDA National Economic Development Authority NTBs Non-tariff barriers to trade PHDR Philippine Human Development Report RICH Resilient, Inclusive, Competitive and Harmonious RVAT Reform of the Value-Added Tax SBM School-based Management SMEs SRNH
Small-Medium Enterprises Strong Republic Nautical Highway
SWOT TRP
Strengths and Weaknesses, Opportunities and Threats Tariff Reform Program
UNCTAD United Nations Conference on Trade and Development VAT Value-Added Tax
vi
Executive Summary Aspirations of the Philippines for 2030 Background: Among the countries in Southeast Asia, the Philippines has the most profound development puzzle. With its abundant natural resources, relatively high educational standards, fairly advanced civil institutions, and democratic system of government, it is quite surprising that the Philippine economy has lagged considerably behind those of many of its neighbors. It has never outgrown the moniker “the sick man of Asia.” Overall Goal: The main goal for 2030 is to achieve BRISK growth and development. That is, growth and development that is balanced, rapid, inclusive, sustainable and propelled by (physical, human, and knowledge) capital. 1. Balanced Growth The Philippine economy is characterized by several imbalances: 1) imbalance in productivity across sectors; 2) imbalance between large firms and small and medium enterprises (SMEs) in terms of share in output; and 3) heavy concentration of production in national capital region where only 13 percent of the population resides. These imbalances have to be corrected in order to ensure a more equitable distribution of income. 2. Rapid Growth The main goal is that by 2030, the Philippines will have achieved a GDP per capita of at least USD 3,500 in constant 2000 prices from the USD1,378 level in 2010. This can be achieved if the country’s per capita GDP grows at an average of 4.8 percent per annum between 2010 and 2030, much higher than the average during 1951-2010 which is 2.1 percent. This translates to an average GDP growth of 6.3 – 6.5 percent per year and a population growth rate around 1.5 – 1.7 percent on average. 3. Inclusive Growth Poverty incidence in the Philippines is among the highest in Southeast Asia. Moreover, the elasticity of poverty reduction with respect to economic growth has significantly declined. There is a need to make economic growth more inclusive. This can be achieved through several measures such as: i) Social protection programs; ii) Increasing participation of SMEs which have greater employment potential than large scale firms; and iii) Greater access to education and health care, and at the same time improving their quality. 4. Sustainable Growth For growth to be sustainable within the long-term horizon envisioned in this study, the major environmental problems have to be addressed: deforestation, fisheries depletion, land and water system degradation, and urban pollution. The Philippines has also been determined to be among the most vulnerable regions in Southeast Asia to climate change. It is important that measures to adapt to climate change be mainstreamed in development plans. Another important consideration is the rapid population growth which adds to the pressure on the environment apart from its contribution to the demands on resources for education and health.
vii
5. Capital-led Economic Growth This refers primarily to the low-investment rate in the Philippines. Increased capital spending should initially address the poor physical infrastructure. Thereafter, it should focus on diversifying the industrial base of the Philippine economy. This can be assisted by an industrial policy that is largely based on technological upgrading. The latter creates spillover effects that enable the economy to avoid diminishing marginal returns. Challenges and Constraints to Aspirations Major Challenges
• Low investment rate and lack of entrepreneurship; • Inadequate infrastructure, particularly in electricity and transportation; and • Weak institutions that give rise to governance concerns.
Secondary Challenges
• Inability to address market failures leading to a small and narrow industrial base; • Inequitable access to development opportunities, especially education, health,
infrastructure, and productive assets; and • Tight fiscal situation.
The Philippines and RICH (Resilient, Inclusive, Competitive and Harmonious) ASEAN The Philippines will benefit from a more integrated ASEAN economy in several ways:
• Foremost is that the ASEAN Economic Community will create a large, contiguous production base that will attract more FDI to the region..
• A more integrated ASEAN will enhance the Philippines’ participation in the regional production chain and increase its access to the global market
• The AEC’s free flow of skilled services is expected to result in, among others, the acquisition of human capital and spillovers across borders. The Philippines has a distinct comparative advantage in terms of exporting labor.
The Philippines can contribute to RICH ASEAN in several ways:
• As a reliable trading partner of other countries in the region.
• As a transshipment point and gateway to the Pacific
• As a BPO hub in East Asia owing to its comparative advantage in services
• Participation in regional value chains and production networks
• As a leader in capacity building in several key sectors
viii
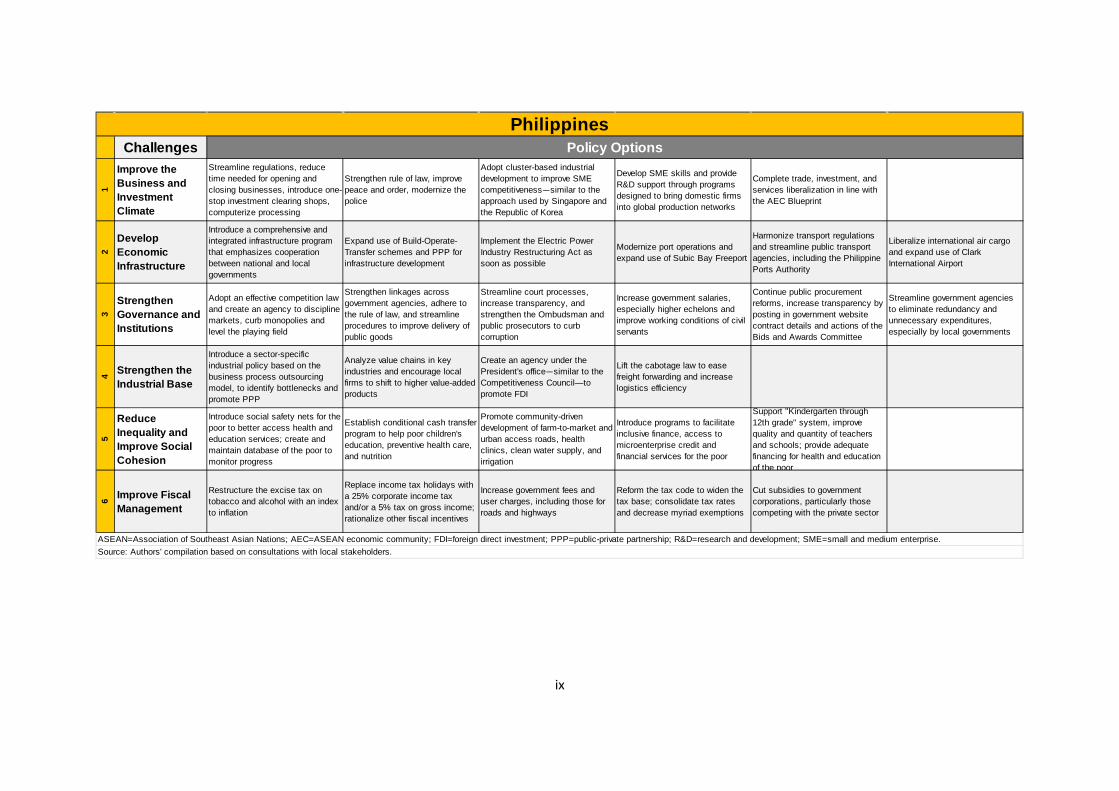
Opportunities and Threats from the rise of China and India Opportunities China’s rapid economic growth—and by extension that of India—is actually be a boon for developing countries: the rise in two-way trade, growth in global product sharing, and product diversification that comes with trade expansion. Data show that trade between ASEAN and China has grown rapidly since 1995. Consistent with the trade picture, it has been pointed out that despite fears that China is diverting FDI from other Asian economies, there is little evidence of this. Related to this is the emergence of China as a source of FDI. It is likely that China will eventually play the role Japan did in the late 1980s to mid 1990s. Threats Export-oriented firms in China will have a competitive edge over export-oriented firms located in ASEAN. This will be enforced by an undervalued yuan. ASEAN firms will likely lose market share. With the trend toward globalization, firms oriented towards the domestic market may lose market share to imports from China. India is a major competitor with the Philippines in terms of the BPO industry. Policy Recommendations for Realizing the Goals for 2030 (Summary Table)
ix
Challenges
1
Improve the Business and Investment Climate
Streamline regulations, reduce time needed for opening and closing businesses, introduce one-stop investment clearing shops, computerize processing
Strengthen rule of law, improve peace and order, modernize the police
Adopt cluster-based industrial development to improve SME competitiveness—similar to the approach used by Singapore and the Republic of Korea
Develop SME skills and provide R&D support through programs designed to bring domestic firms into global production networks
Complete trade, investment, and services liberalization in line with the AEC Blueprint
2
Develop Economic Infrastructure
Introduce a comprehensive and integrated infrastructure program that emphasizes cooperation between national and local governments
Expand use of Build-Operate-Transfer schemes and PPP for infrastructure development
Implement the Electric Power Industry Restructuring Act as soon as possible
Modernize port operations and expand use of Subic Bay Freeport
Harmonize transport regulations and streamline public transport agencies, including the Philippine Ports Authority
Liberalize international air cargo and expand use of Clark International Airport
3
Strengthen Governance and Institutions
Adopt an effective competition law and create an agency to discipline markets, curb monopolies and level the playing field
Strengthen linkages across government agencies, adhere to the rule of law, and streamline procedures to improve delivery of public goods
Streamline court processes, increase transparency, and strengthen the Ombudsman and public prosecutors to curb corruption
Increase government salaries, especially higher echelons and improve working conditions of civil servants
Continue public procurement reforms, increase transparency by posting in government website contract details and actions of the Bids and Awards Committee
Streamline government agencies to eliminate redundancy and unnecessary expenditures, especially by local governments
4 Strengthen the Industrial Base
Introduce a sector-specific industrial policy based on the business process outsourcing model, to identify bottlenecks and promote PPP
Analyze value chains in key industries and encourage local firms to shift to higher value-added products
Create an agency under the President's office—similar to the Competitiveness Council—to promote FDI
Lift the cabotage law to ease freight forwarding and increase logistics efficiency
5
Reduce Inequality and Improve Social Cohesion
Introduce social safety nets for the poor to better access health and education services; create and maintain database of the poor to monitor progress
Establish conditional cash transfer program to help poor children's education, preventive health care, and nutrition
Promote community-driven development of farm-to-market and urban access roads, health clinics, clean water supply, and irrigation
Introduce programs to facilitate inclusive finance, access to microenterprise credit and financial services for the poor
Support "Kindergarten through 12th grade" system, improve quality and quantity of teachers and schools; provide adequate financing for health and education of the poor
6 Improve Fiscal Management
Restructure the excise tax on tobacco and alcohol with an index to inflation
Replace income tax holidays with a 25% corporate income tax and/or a 5% tax on gross income; rationalize other fiscal incentives
Increase government fees and user charges, including those for roads and highways
Reform the tax code to widen the tax base; consolidate tax rates and decrease myriad exemptions
Cut subsidies to government corporations, particularly those competing with the private sector
Source: Authors' compilation based on consultations with local stakeholders.
Policy OptionsPhilippines
ASEAN=Association of Southeast Asian Nations; AEC=ASEAN economic community; FDI=foreign direct investment; PPP=public-private partnership; R&D=research and development; SME=small and medium enterprise.
1
Aspirations and Challenges for Economic and Social Development in the Philippines Towards 2030
Josef T. Yap and Ruperto P. Majuca∗
I. Introduction and Historical Background Patchy Economic Record Sustained economic development continues to be elusive for the Philippines. Compared with other economies in East Asia, the Philippines’ economic growth record has been disappointing (Table 1). Mainstream economists attribute this situation largely to economic protectionism and the import-substitution policy that were in place after World War II up to the 1970s. However, a closer analysis of Philippine economic history shows that there are other important factors that contributed to the development puzzle. Import substitution was largely a by-product of exchange controls that were imposed in response to a balance-of-payments crisis that emerged as a result of the rise in expenditures related to economic rehabilitation after the Second World War. Import substitution was not pursued as a development strategy but nevertheless the exchange controls spurred the expansion of the manufacturing sector, with value added from the latter rising from 12.5 percent of GDP in 1950 to 17.5 percent in 1960 (O’Connor,1990). Per capita GDP growth was highest during this period (Table 1). To sustain this type of development, the economy should have moved into the second-stage of import substitution which involves backward integration into intermediate and capital goods. However, given the small scale of operations of many of the consumer goods manufacturers, and the scale requirements of many intermediate goods, components, and raw materials, backward integration would not have been possible at efficient levels. This constraint could have been overcome by a shift to an export-oriented strategy. Unfortunately, as O’Connor (1990) argued, a new political power bloc coalesced around the consumer-goods industries which strongly favored continued access to imported, relatively low-cost raw materials and intermediate goods. Economic difficulties emerged largely as a result of an overvalued currency and the need to import intermediate and capital goods. Exchange controls were scrapped and the peso depreciated against the dollar by almost 50 percent, from ₱2 per dollar in January, 1962 to ₱3.90 in November, 1965. This heralded the boom-bust cycle of the Philippine economy over the next 50 years. The next significant economic upturn was fueled by a surge in external borrowing in the mid-1970s. The massive expansion of externally-financed public investment was concentrated in public enterprises and partly followed a program which consolidated the regime of Ferdinand Marcos. The build-up of external debt created vulnerabilities in key sectors, particularly
∗Josef Yap is President of the Philippine Institute for Development Studies (PIDS). Ruperto Majuca is an Associate Professor at the Department of Economics, De La Salle University. Previously he was a Senior Research Fellow at PIDS and Assistant Director General at the National Economic and Development Authority (NEDA). Aubrey D. Tabuga, Senior Research Specialist at PIDS, contributed to the sections on poverty and demographic transition. The authors gratefully acknowledge the excellent research assistance provided by Kris A. Francisco and Winona Rei R. Bolislis, Research Analysts II at PIDS. This study was conducted under the ASEAN 2030 research program of the Asian Development Bank Institute (ADBI). The usual disclaimer applies.
2
public financial institutions. The steep rise in world interest rates and recession in industrialized countries led to a crisis among major debtor countries. This pushed the Philippine economy to the brink in the early 1980s. The assassination of a key political figure on August 21, 1983 was the “straw that broke the camel’s back”. A major BOP crisis emerged and the economy plunged into a deep recession in 1984-85. It took nearly two decades for the Philippine economy to recover from this crisis and until now the scars are still visible. The post-war development of the Philippine economy had an underlying theme: the socio-political structure constrained the reform process and whatever reforms were implemented had limited benefits for the lower income classes. This contributed to the dismal poverty situation in the country. Historical Roots of the Oligarchy The Philippines, Thailand, and Indonesia went through a phase of agricultural commercialization, mainly in the 19th century. The Philippine experience, however, differed from the other two countries in one important aspect. Agricultural commercialization strengthened the bureaucratic-aristocratic elites in Indonesia and Thailand. However, the same process gave rise to a new class of landowners in the Philippines the economic base of which was firmly outside the state (De Dios and Hutchcroft, 2003). This group of relatively autonomous land owners would form the primary social base of the first Philippine republic and eventually evolve into the present-day oligarchs. Their power base was strengthened during the American occupation as part of the usual “divide and conquer” policy of colonizers. Consequently, what evolved in the Philippines was a semi-feudal economy dominated by elite factions. Instead of encouraging competitive behavior, a culture of ‘rent-seeking’ was engendered. This is the context in which the absence of a “culture of competition” can be explained. It was deemed that more money could be made by redistributing wealth through the political process than by actually creating wealth (De Dios and Hutchcroft, 2003). Over the years there has been greater overlap between political and business oligarchs. The political and economic elite used state institutions as instruments of wealth. Many reform programs including genuine land reform were sacrificed at the altar of particularistic interests.1 In the context of the import substitution period, controls were far less a tool of state industrial planning than an object of oligarchic plunder. During the Martial law period, the government took steps to limit the power and influence of oligarchs but ended creating a new breed of elites, who were described as “cronies” of President Marcos. The quality of political and social institutions was also adversely affected by the colonial experience and emergence of oligarchs. Formal institutions were undermined by a parallel network of informal, personal, and kin-based institutions (De Dios and Hutchcroft, 2003). As a result, formal institutions have not been given the proper respect and instead what became
1 De Dios and Hutchcroft (2003), page 48. This was a description of the situation in the Philippines in the mid-1950s but is applicable to the present day. Their footnote describes the system more aptly: “This influence endures in the midst of continuing change in the oligarchy's composition, as new families appear out of nowhere and some of the old families fall by the wayside. Unlike an aristocracy, an oligarchy has little stability in its composition; there is a constant stream of new entrants as new wealth is created. As a system of government, oligarchy is rule ‘for the benefit of the men of means,’ not rule for the ‘common interest.’”
3
dominant almost by default were primordial institutions, such as the clan or family, or religious and ethnic affiliations, with their workings being superimposed upon the formal political process (De Dios 2008). Weak institutions and an oligarchic private sector are two sides of the same coin. A gridlock has evolved wherein stronger institutions are required to loosen the grip of the oligarchs but at the same time the influence of oligarchs has to be reduced in order to strengthen institutions. Admittedly previous reforms have yielded favorable outcomes in terms of less monopolistic power, more diversified economic activities, and a healthier policy debate. However, unless there are major political and social reforms, significant economic transformation will not be possible. II. Economy of the Philippines Today Attempts at Economic Reform Like many other developing countries, the Philippines adopted the “openness model” of development. This reform package began modestly in the early 1970s and was interrupted by the debt crisis in 1983-85. The reform program, however, was accelerated in the late 1980s and has been the government mantra since. The general thrust of the reforms was closer global economic integration underpinned by liberalization, deregulation and privatization. Similar to reform programs in other developing countries, attention was also given to macroeconomic stability and exchange rate movements; appropriate sequencing of liberalization of the trade, financial and capital-account regimes, supported by prudential regulation and financial sector reform; strengthening domestic institutional capacity; and attracting foreign direct investment (UNCTAD 2004). In the area of trade liberalization, the following reforms were pursued from the 1980s till the present. The first Tariff Reform Program (TRP I) initiated in 1981 reduced tariff from a range of 70-100 percent to 0-50 percent. This was followed by TRP II in 1991 which reduced tariff further to the 3-30 percent range and converted quantitative restrictions to tariffs. TRP III launched in 1995 introduced further changes towards a 5 percent uniform tariff. Meanwhile, the Philippines also signed a series of multilateral free trade treaties, e.g. GATT-WTO 1995; bilateral/regional free trade agreements—AFTA-CEPT 1993, China-ASEAN 2004, ASEAN-Korea 2006, ASEAN-Japan 2008, Philippine-Japan Economic Partnership Agreement 2007; and trade facilitation initiatives, e.g. Revised Kyoto Convention 2009, and the National Single Window 2010. These agreements provided domestic firms access to markets abroad and leverage to policymakers that allowed them to pursue economic reforms more aggressively. In the area of investment, the country has pursued several investment liberalization and facilitation initiatives since the late 1980s. In 1987, the Omnibus Investment Code simplified and consolidated past investment laws. In 1991, the Foreign Investment Act permitted foreign equity participation up to 100 percent, except those in the negative list (List A, B, C). List C—restriction in areas where adequate number of establishments already serves the economy’s needs—was abolished in 1996, so the remaining restrictions are those in List A (restrictions imposed by the Constitution and specific laws), and List B (restriction for reasons of defense, risk to health and moral, and protection of SMEs). Several other liberalization laws were also passed, including the Foreign Bank Liberalization Act in 1994, the 2000 Retail Trade Liberalization Act, which allows 100 percent foreign investment in retail business subject to minimum equity of US$7.5 million, and the 1995 Special Economic Zone Act. These measures are intended to attract more foreign direct investment.
4
Low Investment Rate and its Causes Despite these reforms, the investment rate in the Philippines remains to be one of the lowest in the region (Table 2). FDI inflows into the Philippines pale in comparison to its neighbors. Data on FDI stock between 1990 and 2011 show that the Philippines even lags Viet Nam (Table 3). Political and economic instability were the main reasons the country did not benefit greatly from Japanese investments that were out-sourced throughout the region following the sharp appreciation of the yen that resulted from the Plaza Accord in 1985 and the Louvre Accord of 1987. The economy contracted sharply in 1984-85 owing to the BOP crisis. Meanwhile, the Marcos regime fell in 1986 and this was followed by several attempted putsches, the major ones occurring in August 1987 and December 1989. Over time, poor physical infrastructure discouraged foreign and domestic investment. This was largely due to a fiscal constraint that prevented the Government from providing its share of infrastructure spending. The fiscal position of the Philippines was more often than not in a fragile state since 1980, largely a result of the international debt crisis that erupted in 1982 leading to a large external debt overhang. Not only did the Philippine government borrow heavily between 1976 and 1980, it assumed responsibility over many debts extended to the private sector. This was facilitated by President Corazon Aquino’s Proclamation 50, which mandated the government to honor all Philippine debt and thus legitimized the assumption of debts by the national government including private loans. This policy dovetails with Presidential Decree 1177 which appropriates debt service automatically into the national budget. The other factor that has contributed to the country’s fiscal bind is weak revenue collection. The Philippines has one of the lowest tax efforts in East Asia (Table 4). Meanwhile, government owned and controlled corporations (GOCCs) have exacerbated the country’s fiscal position as many of them suffer from poor cost recovery due to inadequate tariff adjustments, political interference in tariff setting, government intervention in pricing policy, liabilities that they had contracted through the years, poor revenue generation performance, and overstaffed structures with grossly overpaid staff. Despite these problems the Philippines was able to consolidate its fiscal balance in the early 1990s partly because of proceeds from privatization of government assets and an improvement in tax effort. The result was surpluses of less than 1 percent of GDP in 1994-1997 (Table 5), a stark contrast from years of fiscal deficit in the 1980s up to the early 1990s. However, while the Philippines did not suffer as much as other East Asian countries, one visible mark left by the 1997 financial crisis is that the fiscal gains achieved in the 1990s were squandered. Deficits persistently grew, from 1.9 percent of GDP in 1998 to 4 percent in 2000, reaching a peak of 5.2 percent in 2002 (Table 5).The level subsequently fell from 2005 to 2008 largely a result of reforms aimed at increasing revenues.2 The improvement was short-lived, however, as tax effort declined and expenditures had to be raised to offset the adverse impacts of the 2008 global financial and economic crisis.
2 In 2005, the Attrition Act (Republic Act No. 9335) was implemented. It provides for a system of rewards and sanctions to encourage revenue and customs officials and employees to exceed their revenue targets, creates a rewards and incentives funds, draws specific measures for employees who fail to meet the revenue targets, and creates the Revenue Performance Evaluation Board for the purpose. Meanwhile, in 2006, Reform of the Value-Added Tax (RVAT- Republic Act No. 9337) was enacted. It substantially expanded the scope of the VAT and gave powers to the President to increase the VAT rate based on specific criteria. RVAT also institutes mitigating measures such as reduction in excise tax on certain petroleum products, and increases corporate income tax from 32% to 35%, subsequently to be reduced to 30% in 2009.
5
Other factors are also important in explaining the investment record. For example, Bocchi (2008) cites institutional factors when he explains why investment in the Philippines did not respond to higher economic growth in 2005-2007. One major reason is the dominance of corporate conglomerates in strategic sectors such as agriculture, maritime and air transport, power, cement, and banking. These corporate conglomerates do not have an incentive to invest and expand their operations since their main source of profitability is a captured market. In turn the resulting higher costs in these sectors discourage investment in sectors that have strong backward and forward linkages with them, particularly in manufacturing. Hence, the oligarchic structure of the economy is also an important consideration in explaining the low investment rate. Limited Economic Transformation The low investment rate contributed to the widening gap between the Philippines and its neighbors with a comparative level of development. This can be gleaned not only from per capita GDP figures (Table 6) but also in the lack of transformation of the economy. One of the most striking features of the Philippine economy is the stagnation in the share of manufacturing value added (MVA) to GDP over the past three decades (Table 7). The MVA-GDP ratio even declined between 1980 and 2010 while it rose significantly in Indonesia, Malaysia, and Thailand. The fall in the MVA-GDP ratio also occurred at the time the share of manufactured exports to total exports increased sharply (Table 8). The data show that the share of manufactured exports increased from 61 percent in 1993, to 96 percent in 2005, before stabilizing at 93 percent in 2009. The share of medium and high-technology exports also increased dramatically between 1993 and 2005, from 39 percent to 81 percent. However, this is not reflected in the domestic manufacturing sector, where the production of medium-to-high technology products only increased from 30 to 40 percent in the same period. The dichotomy between the export sector and domestic manufacturing sector is a symptom of the narrow base of the industry sector. This dichotomy and lack of economic transformation becomes more inexplicable given the economic reforms implemented during this period and only serves to add to the development puzzle surrounding the Philippines. Low investment and lack of economic transformation has also implications for employment. In 1996, the Philippines had the second highest unemployment rate among the Asian Development Bank’s developing member countries (Table 9). However, this situation improved owing primarily to faster economic growth between 2000 and 2010. Because of the lack of economic transformation, the services sector absorbed surplus workers from agriculture while the share of manufacturing employment has been stagnant. The lack of employment opportunities in the country is the reason for the increasing number of Filipinos working abroad. Felipe and Lanzona (2006) pointed out that the goal in the 2004-2010 Medium-Term Philippine Development Plan of generating 1.5 million jobs a year in that period or a total of 10 million jobs would not be enough to solve the unemployment problem. Lack of economic transformation also resulted in an imbalance in terms of production and employment. For example, in 2011 the agriculture sector accounted for only 11 percent of output but 33 percent of employment (Table 10). This also shows the inability to allocate resources to the more productive sectors of the economy and it can be argued that this is a result of the lack of a coherent industrial policy. The more glaring imbalance is in terms of productivity as measured by real value added per worker (Table 11). This reflects the dualistic nature of the Philippine economy. While there
6
has been some convergence over time, it has been slow in coming. In 2009, industry still had 4.3 times the level of productivity in agriculture and 2.3 times the level of services. Relatively high unemployment and the imbalance in productivity have contributed to the disappointing poverty record of the Philippines. After falling between 1991 and 2003, poverty incidence increased in 2006 and also in 2009 (Table 12). The number of poor people has increased between 2003 and 2009 despite GDP growth rate of nearly 6 percent between 2004 and 2007. Compared with its neighbors, the poverty incidence in the Philippines is high (Table 13). III. SWOT Analysis Critical development constraints as weaknesses The weaknesses of the Philippine economy can be related to the critical development constraints facing the country. A study by the Asian Development Bank (2007) applied the growth diagnostics model of Hausmann, Rodrik, and Velasco (2005) to the Philippines. The advantage of this approach is that it provides a consistent framework for identifying the most critical and binding constraints to economic growth and for discerning the priorities and sequence of policies required to stimulate and sustain growth.3 In Figure 1, the most critical factor for the Philippines was determined to be the low level of private investment and entrepreneurship. This is consistent with the observation that the Philippines has one of the lowest investment rates in the region (Table 2). The ADB study reveals the following critical constraints to private investment and entrepreneurship:4
• Tight fiscal situation; • Inadequate infrastructure, particularly in electricity and transportation; • Weak investor confidence due to governance concerns, in particular corruption and
political instability; and • Inability to address market failures leading to a small and narrow industrial base.
Meanwhile, the critical constraints to poverty reduction are:
• Lack and slow growth of productive employment opportunities, primarily due to low private investment and entrepreneurship;
• Inequitable access to development opportunities, especially education, health, infrastructure, and productive assets; and
• Inadequate social protection and social safety nets. If a long term perspective is adopted and three factors have to be prioritized, these critical constraints can be compressed into the following areas:
• Low investment rate and lack of entrepreneurship; 3 ADB (2007), page 1. 4 ADB (2007), pages 49-50. There are some experts who would disagree with these priorities. For example, Nye (2011) questions the prioritization of fiscal reform and infrastructure development. “There is never a clear link made between the more fundamental distortions in the Philippine economy and these proposals” (pages 11-12). Nevertheless, it is clear from the historical account of the Philippine economy in Section I.A how the fiscal constraint evolved from the debt overhang. The fiscal constraint then largely contributed to the backlog in physical infrastructure.
7
• Inadequate infrastructure, particularly in electricity and transportation; and • Weak institutions that give rise to governance concerns.
These three factors are considered as the major constraints. The secondary tier of factors will be as follows:
• Inability to address market failures leading to a small and narrow industrial base; • Inequitable access to development opportunities, especially education, health,
infrastructure, and productive assets; and • Tight fiscal situation.
There are two important modifications made in the lists prepared by ADB. First, the concept of governance was expanded to “weak institutions.” The latter is the primary source of poor governance. Second, “tight fiscal situation” was relegated to the second tier of factors since relative to other challenges this is a short-to-medium term concern. Threats and Opportunities Table 14 juxtaposes these weaknesses with the strengths, opportunities and threats for the Philippines. Two of the major threats are: environmental vulnerability and the armed conflicts stemming from the insurgency on the communist front and the secessionist movement on the Moro front. There are several important environmental issues that the country has to address: 1) improving the enforcement of various environmental laws; 2) strengthening environmental advocacy by various stakeholders; 3) establishing enabling conditions to protect and preserve natural resources; 4) performing multi-party audit of environmental statistics; 5) encouraging private sector involvement; 6) creating a clear national policy on water and sanitation; and 7) addressing key issues in urban development and housing due to rising number of informal settlers. A growing concern is the vulnerability of the Philippines to climate change. A study by Yusuf and Francisco (2009) determined that the entire Philippines was among the regions in Southeast Asia most vulnerable to climate change. There are no effective safety nets that could support the most vulnerable of groups during natural crises. In its Country Environmental Analysis for the Philippines, the World Bank identified the need to mainstream climate change risk management in national, local, and sector decision-making processes. Moreover, the enabling environment for climate risk management would benefit from improvements in awareness raising and advocacy, financing, technology transfer, and coordination (World Bank, 2009). The 2005 Philippine Human Development Report has an extensive discussion of the two armed conflicts in the Philippines.5 This includes a section on the economic cost of the conflict. It is clear from the analysis that a protracted conflict will be drag to economic growth and development. The Report contains proposals on how to resolve the two conflicts. Meanwhile, the strengths of the economy are mainly those aspects that contribute to the Philippine development puzzle. The aspects that are brought up only in this section are i) Philippine civil society which is one of the more vigilant in East Asia, and ii) the advantage of the geographic location of the Philippines.
5 Human Development Network (2005).
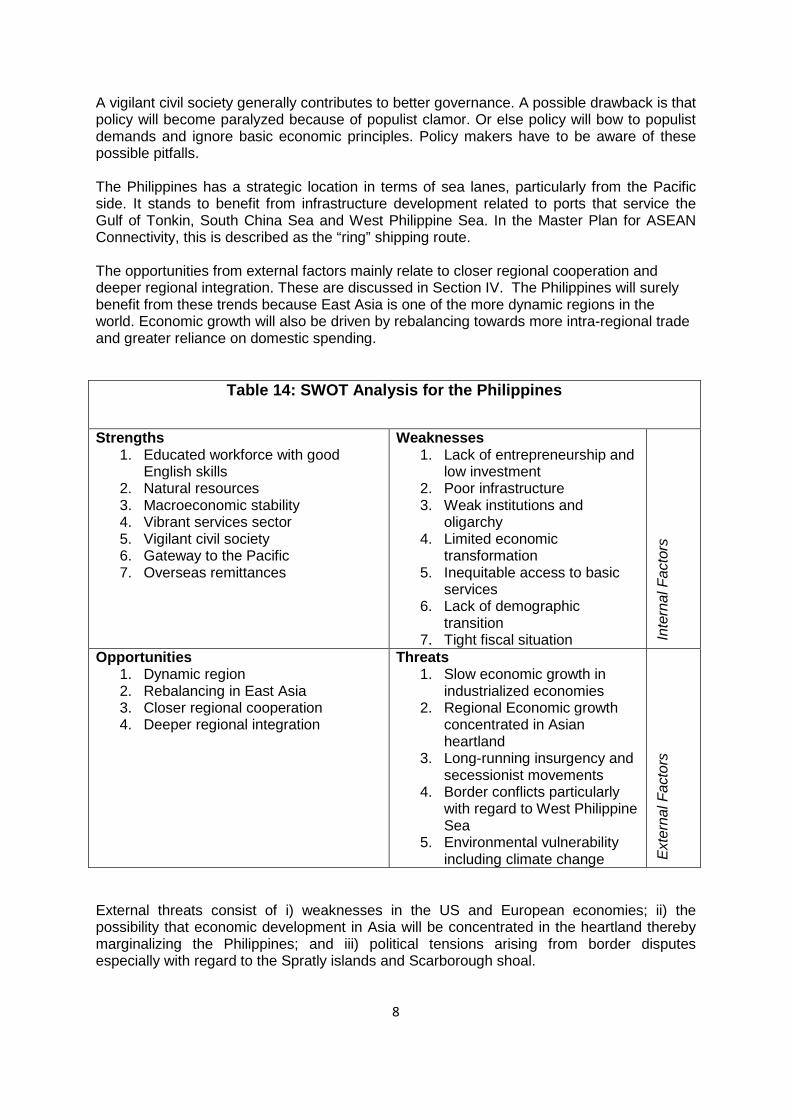
8
A vigilant civil society generally contributes to better governance. A possible drawback is that policy will become paralyzed because of populist clamor. Or else policy will bow to populist demands and ignore basic economic principles. Policy makers have to be aware of these possible pitfalls. The Philippines has a strategic location in terms of sea lanes, particularly from the Pacific side. It stands to benefit from infrastructure development related to ports that service the Gulf of Tonkin, South China Sea and West Philippine Sea. In the Master Plan for ASEAN Connectivity, this is described as the “ring” shipping route. The opportunities from external factors mainly relate to closer regional cooperation and deeper regional integration. These are discussed in Section IV. The Philippines will surely benefit from these trends because East Asia is one of the more dynamic regions in the world. Economic growth will also be driven by rebalancing towards more intra-regional trade and greater reliance on domestic spending.
Table 14: SWOT Analysis for the Philippines
Strengths 1. Educated workforce with good
English skills 2. Natural resources 3. Macroeconomic stability 4. Vibrant services sector 5. Vigilant civil society 6. Gateway to the Pacific 7. Overseas remittances
Weaknesses 1. Lack of entrepreneurship and
low investment 2. Poor infrastructure 3. Weak institutions and
oligarchy 4. Limited economic
transformation 5. Inequitable access to basic
services 6. Lack of demographic
transition 7. Tight fiscal situation In
tern
al F
acto
rs
Opportunities 1. Dynamic region 2. Rebalancing in East Asia 3. Closer regional cooperation 4. Deeper regional integration
Threats 1. Slow economic growth in
industrialized economies 2. Regional Economic growth
concentrated in Asian heartland
3. Long-running insurgency and secessionist movements
4. Border conflicts particularly with regard to West Philippine Sea
5. Environmental vulnerability including climate change E
xter
nal F
acto
rs
External threats consist of i) weaknesses in the US and European economies; ii) the possibility that economic development in Asia will be concentrated in the heartland thereby marginalizing the Philippines; and iii) political tensions arising from border disputes especially with regard to the Spratly islands and Scarborough shoal.
9
Stagnation in the major industrialized economies will affect export growth. This can be offset by rebalancing in East Asia. The issue then becomes whether the Philippine firms are nimble and flexible enough to adjust to major changes in the global economy. Rebalancing in East Asia may also be concentrated in the Asia heartland, primarily in the Greater Mekong Sub-region. One reason for this is that regional infrastructure development in the past two decades has been focused on the connectivity in GMS. However, as discussed earlier the Philippines still has a strategic location as the gateway to the Pacific. The third external threat may lead to friction with China. This may dilute the benefits from deeper economic integration with the region. However, it is expected that the issue will be resolved peacefully through diplomatic channels. IV. The Role of ASEAN and the Impact of China and India Benefits of the ASEAN Economic Community The participation of the Philippines in deeper ASEAN economic integration will generate significant benefits and significant cost reductions to the Philippine economy. The reduction or elimination of tariff and non-tariff barriers (NTBs) will enhance the Philippines’ participation in the regional production chain and increase its access to the global market. ASEAN integration is also expected to reduce transaction costs associated with physical barriers to movement of goods (e.g. customs stoppages) with the coordinated efforts to simplify procedures and facilitate trade. At present, there are varying technical regulations and product across member states. This results in added costs to consumer and firms which have to tailor their products to suit several standards. The harmonization of products and technical standards that accompanies deeper ASEAN integration can thus result in substantial reduction of these costs. Studies have shown that for individual ASEAN economies, the trade creating-effects of being part of a single market and production base, as well as the increased competitiveness associated with economies of scale and productivity spillover effects of trade, are large. For the Philippines, a computable general equilibrium (CGE) study has conservatively estimated that the liberalization of tariff and NTBs aspect of AEC alone, will increase the country’s exports and imports by 45.5 percent and 34 percent, respectively, increase manufacturing output, and increase the country’s GDP by 3.2 percent (Rashid, et al. 2009). The liberalization of the services sector also is expected to result in lower-priced services, higher service exports, improved access to foreign investment and technology, better services sector efficiency and competitiveness, and improved access for SMEs and workers to the expanded services market. The removal of cabotage rules in the domestic maritime shipping sector, for example, has the potential of substantially improving Philippine transport infrastructure as well as invigorating inter-island shipping, trade, and tourism, in addition to lower prices and higher service quality, and increased safety in the country’s shipping sector. The AEC’s free flow of skilled services is expected to result in, among others, the acquisition of human capital and spillovers across borders. The Philippines has been successful in terms of exporting labor. In this context, the Philippines can aim to be the hub of the BPO sector in Southeast Asia. Integration is likewise likely to attract FDI since most of ASEAN’s foreign investment inflows are associated with production networks, in which case FDI and trade are
10
complements. Also, a large regional market, which is associated with an agglomeration of suppliers and support institutions and services, as well as economies of scale, is a natural magnet for investment sites. Other benefits of FDI include increased competitiveness due to transfer of technology, strengthening of institutions, creation of supply capabilities, access to foreign markets and employment and human capital generation, and linkages to upstream and downstream industries including SMEs. Overall, some authors have estimated that as a result of regional integration, the Philippines’ FDI stock, which was US$ 23.6 billion in 2009, could increase to as much as US$57.4 billion (Aldaba, Yap and Petri 2009). China and India There is concern that the rise of China and India will impede the development of ASEAN member countries. For example, export-oriented firms in China will have a competitive edge over export-oriented firms located in ASEAN largely because of an advantage in cost structure. This advantage is enforced by an undervalued yuan. ASEAN firms will therefore likely lose market share. Moreover, local firms oriented towards the domestic market may lose market share to imports from China. China’s rapid economic growth—and by extension that of India—is actually be a boon for developing countries. This is succinctly explained by Dimaranan, et al (2006):
“…three recent developments have the potential to at least attenuate these stark scenarios of relentless competition. One is the rise of two-way trade in manufactures, which makes the recipient the beneficiaries of improvements in efficiency in their trading partners. Another is the growth of global product sharing, where part of the production process is undertaken in one economy, and subsequent stages are undertaken in another. This process, fuelled by improvements in transport and trade facilitation, and in communications, and frequently involving foreign domestic investment linkages, makes participants in this process beneficiaries from, rather than victims of, improvements in the competitiveness of their partners. A third is recognition that trade expansion does not typically involve more increases in the volumes of exports of products currently exported to existing markets. Rather, developing countries typically expand the range of products they export, improve product quality, and export to additional markets as their exports grow.”
Data show that trade between ASEAN and China has grown rapidly since 1995 (Table 15). In the case of the Philippines, the share of its total exports to China increased from 1.2 percent in 1995 to 11.1 percent in 2010. In that same year, the Philippines even posted a $1.096 billion trade surplus with China. It has also been pointed out that the trade structure of China and ASEAN is different (Yap 2006). For example in 2005, China exported virtually zero amount of the top two Philippine exports. The key would be for Philippine firms to enhance their competitiveness in order to climb up the value chain. India is not yet a major trading partner for most Southeast Asian countries (Table 16). Nevertheless, the same analysis as with China would apply except that specific services sectors are more important. The Philippines and India are key players in the Business Process Outsourcing (BPO) industry. There is no evidence, however, that the rise of India is crowding out the BPO sector in the Philippines. Similar to trade in goods, the key would be for Philippine BPO firms to enhance their competitiveness. They could even emulate some of the successful practices of Indian BPO firms.
11
V. Aspirations for 2030 Having looked at the background of the current state of the economy, as well as anticipating the key areas that need to analyzed for long-term sustainability of development strategies, the economic, social, and institutional aspirations that are envisioned for the Philippines in the year 2030 can now be articulated. The main goal is that by 2030, the Philippines will have achieved a GDP per capita of at least USD 3,500 in constant 2000 prices. The per capita income of the Philippines in 2010 using the same metric is USD 1,378. The goal of USD3,500 is between the level of Thailand (USD2,751) and Malaysia (USD5,264) in 2010. This can be achieved if the country’s per capita GDP grows at an average of 4.8 percent per annum between 2010 and 2030. This translates to an average GDP growth of 6.3 – 6.5 percent per year and a population growth rate around 1.5 – 1.7 percent on average. In order to achieve this goal, Philippine society should adopt the mantra of BRISK growth and development. That is, growth and development that is balanced, rapid, inclusive, sustainable and propelled by (physical, human, and knowledge) capital. Each aspect will be explained in this section. Balanced Growth As discussed earlier, the Philippine economy is characterized by many imbalances. Related to the imbalance in employment, is the imbalance with regard to role of small and medium enterprises vis-à-vis large firms. Common to many countries, SMEs in the Philippines account for about 99 percent of total firms. But SMEs account for only 35 percent of output in the Philippines (Table 17). This stands in contrast with Japan and Korea, where SMEs account for about half of total output. Meanwhile, 61 percent of employment in the Philippines is generated by SMEs. Their counterparts in Japan and Korea account for 70-85 percent of employment. SMEs in the Philippines also account for about 99 percent of total firms. The key to providing better balance will be reforms that enhance the productivity of SMEs, allowing them to grow and provide higher paying jobs. Another prominent imbalance is in terms of regional distribution of income and output. The National Capital Region accounts for 32.5 percent of Philippine GDP. The population of NCR is 11.5 million or 13 percent of the total population of the Philippines. One source of the regional imbalance is the archipelagic structure of the Philippines which is composed of 7,107 islands. The problem is compounded by poor infrastructure, which results in weak connectivity. One outcome is that goods and services are not readily transported from lower-income regions to higher-income ones, thereby exacerbating the income imbalance across regions. These imbalances result in an inequitable distribution of income (Table 13). Recent studies have shown that a more equitable distribution of income promotes economic growth. In the long-run, these imbalances have to be corrected through implementation of appropriate policies. This will generate both equity and economic growth. Rapid Growth. An average per capita GDP growth of 4.8 percent per annum should be achieved during the 20-year planning period. This is much higher than the rates recorded in the past 60 years (Table 1). This growth rate can be achieved by successive increases of average yearly growth for the different future medium-term plans, starting from the goal of 7-8 percent annual average GDP growth rate of the 2011-2016 Philippine Development Plan (PDP).
12
Figure 2 shows potential GDP calculated using both Hodrick-Prescott and Markov-switching techniques.6 It shows that the permanent output of the country has been increasing at an increasing rate. The nonlinear trend of Philippine potential GDP can be interpreted to mean that the effect of previous reforms on the economy accumulate. This implies that additional reforms generate a bigger “bang for buck”. It would therefore appear that the economic reforms undertaken post-Marcos years have caused growth to pick up; a continuation and deepening of the unfinished reform programs, especially the ones identified in Section VI below, will only serve to raise Philippine growth prospects. This pattern also shows that subsequent reforms would be more effective, if previous reforms are already in place. For example, infrastructure development would be more effective if there were stronger institutions.
Inclusive Growth This goal means that the lower income classes contribute to and at the same time share in the gains from economic growth and development. The result is that poverty and inequality are both reduced. In order to achieve this, policies have to be implemented in order to ensure that employment elasticity is fairly high. Jobless growth should not accompany higher levels of GDP. Inclusive growth requires a consolidated effort. One aspect of this would be to use the Millennium Development Goals (MDGs) to broadly track progress. While the MDGs are targeted to 2015, their scope lends themselves to monitoring inclusive growth. Balanced growth will also ensure greater employment through a stronger SME sector. SMEs have a greater capacity to create employment. During the transition towards the long-term, the government can also implement social protection programs to alleviate the poverty situation. This should also include policies to modernize the agriculture sector and the agrarian reform program.
Sustainable growth and development. For growth to be sustainable within the long-term horizon envisioned in this study, the major environmental problems have to be addressed: deforestation, fisheries depletion, land and water system degradation, and urban pollution. Environmental considerations should also encompass vulnerability to climate change and disaster preparedness. An important consideration is the rapid population growth which adds to the pressure that emanates from economic growth. Capital-propelled growth Economic growth will be driven by both physical, and human, capital formation, through massive investment in infrastructure and other physical investment. Substantial investment in human capital—through education, training, and health—will increase the country’s total factor productivity. At the same time, investments in physical and human capital not only increase GDP growth, but also enhances the access to growth. In traditional models increasing capital is subject to diminishing marginal returns. This is largely avoided through parallel investment in human capital. More educated and presumably, more productive workers not only produce more at their own tasks, but they 6 The data and methodology are described in Park, et al. (2011).
13
also interact synergistically with their workmates so that the productivity of other workers also rises, though their level of education remains unchanged. Apart from also investing in human capital, there should be investment in new knowledge, which usually creates spillover effects across sectors. This framework can explain the importance of one critical constraint identified earlier: “Inability to address market failures leading to a small and narrow industrial base.” One important market failure is with regard to encouraging R&D. It has been observed that “firms may be reluctant to undertake R&D because the benefits accrue readily spillover into other firms in the same sector” (Cypher and Dietz, 2009). Another market failure is related to acquisition of technology which has been described as non-tradable. An appropriate industrial policy has to be considered. Addressing these issues leads to important policy recommendations that will be discussed more fully in the section on key challenges. VI. Policy Recommendations The six major development constraints or challenges listed in Section III are all inter-related. Policy recommendations can overlap. Since the challenges are inter-related, there has to be simultaneous or parallel improvements in each area. This is explained succinctly by the ADB (2007):7
“Many of these critical constraints are interlinked. Only when the fiscal situation sufficiently improves will the Government be in a position to allocate more resources to infrastructure investment. However, improved infrastructure alone is not enough to lower the cost of doing business and to stimulate private investment. Better infrastructure has to be accompanied by significant improvements in investor confidence, which can be done through the Government adequately addressing governance concerns by implementing initiatives aimed at reducing corruption and improving political stability. Removing these three constraints (e.g., tight fiscal space, inadequate infrastructure, and weak investor confidence) will result in increased private investments from domestic and foreign sources. But, to ensure that growth can be sustained at a high level similar to that achieved by many Southeast and East Asian economies in recent decades, the Government will also need to address the market failures (such as information and coordination externalities) in order to encourage investments in diversifying and expanding the manufacturing sector and exports, and in upgrading the level of technology.”
Strengthening of institutions may be the lynchpin in the entire process. In other words, structural changes in institutions may lead simultaneously to improved tax administration, higher investment, better infrastructure and lower poverty incidence. Many studies have already been conducted to analyze the major problems in each area and come up with appropriate policy recommendations. This section aims to highlight key analyses and recommendations. 7ADB (2007), Page 50.
14
Expanding the Fiscal Space The recommendations from the ADB (2007) study come in the following headings:
• Institute efficient tax collection machinery • Streamline the tax incentive program • Rationalize the rate structure of the tax system • Cut losses of and subsidies to Government corporations • Strengthen expenditure management
A more recent assessment of the fiscal situation is provided by Manasan (2010). The administration of President Benigno Aquino III has declared that it will rely on improvements in tax administration to generate more revenue rather than from imposing new taxes or increases in the rate of imposition of existing taxes. However, the record of the BIR and BOC in increasing their revenue effort through improvements in tax administration does not support this plan. Manasan argues that there is therefore a need for government to consider the imposition of new tax measures if fiscal consolidation is to be achieved without sacrificing the financing of MDGs and inclusive growth. In December 2012, Republic Act No. 10351 or “An Act Restructuring the Excise Tax on Alcohol and Tobacco” was signed into law. The new excise taxes are expected to generate substantial government revenue as well as lower the incidence of smoking-related non-communicable illnesses and diseases associated with excessive drinking. The government should also consider the simplification of tax structure by reducing the number of rates at which various taxes are levied or by reducing the number of taxpayers/ transactions/ types of income which are exempt from any given tax. Improving Infrastructure The state of infrastructure in the Philippines is depicted in Table 18. Almost all ASEAN member countries outrank the Philippines in terms of the quality of infrastructure. The ADB study concludes that “low levels of investment in and poor conditions of infrastructure in the Philippines have increased the cost of doing business in the country and has had significant adverse impact on the perceived competitiveness and attractiveness of the Philippines as an investment destination.”8 In other words poor infrastructure has adversely affected the provision of logistics services and the competitiveness of domestic firms. Policies to address this problem have been the subject of many studies (Llanto, 2004; ADB, 2007). Some of the recommendations include: catching up with the Electric Power Industry Restructuring Act (EPIRA); increasing reliance on public-private partnerships under the build-operate-transfer (BOT) law and its variants; and enhancing the partnership and coordination between national and local governments in adequately developing and improving infrastructure. Greater fiscal space will also allow the government to make a greater contribution to better physical infrastructure. The Philippine Nautical Highway which was constructed in 2003 is one of the more successful infrastructure projects. The Nautical Highway—formally known as the Strong Republic Nautical Highway—is an integrated set of highway segments and vehicular ferry routes which, considered in combination with other road and ferry routes not formally part of the SRNH, forms the backbone of a nationwide vehicle-accessible transport system. This
8 ADB (2007), page 5.
15
system reduces the usual travel time by 17 hours to the different key cities, enhances the accessibility of the prime tourist destinations, and minimizes the handling expenses of goods, all over the country. The joint study of PIDS and the Economic Research Institute for ASEAN and East Asia (Aldaba, et al. 2010) focused on the poor state and performance of ports in the country. Among the recommendations to improve logistics services in the Philippines are:
• Investing in modern ports operation in the Philippines. • Greater utilization of the Subic Bay Port and the Batangas Port. • Related to the first recommendation is to allow other international airlines to land and
pick cargo business from the Diosdado Macapagal International Airport (DMIA) in Clark, Pampanga.
Increasing Access and Opportunities to Lower Income Classes The fight against poverty should be a systematic, holistic, and sustainable program. It should therefore go beyond the time horizon of the MDGs. In the long-term, the anti-poverty program should be anchored on the pillars of job-generation, education, and health. In relation to this, a combination of macroeconomic tools like public spending and tax policy, monetary and exchange rate policies, technology and industrial policies should be pursued towards attaining the objectives of inclusive growth and employment. The strategy should have the following medium-term components:
1. Conditional cash transfers (CCT) 2. Community-driven development (CDD) projects which are labor-based infrastructure
projects 3. Microenterprise development/Microfinance 4. Basic education and health services 5. Post-basic education scholarships/ vocational/technical training
One of the main ingredients of the medium-term strategy against poverty is the CCT program,9 which provides cash transfers to the poor conditioned upon (a) their children attending school and (b) their use of preventive health care and nutrition services. In short, the cash transfer is linked to the poor’s investment in human capital (education and health), which makes the program very effective in reducing poverty both immediately and longer- term.10 A comprehensive anti-poverty plan should include the provision of complementary programs such as the microenterprise/microfinance development strategy once the CCT beneficiaries “graduate”.11 Enabling and preparing the poor to take on microenterprise ventures, including
9 This is dubbed as “Pantawid Pamilyang Pilipino Program (4Ps)” under the present administration. 10 Studies have shown that the poor are discouraged from availing state-provided education and health services because the out-of-pocket (e.g., textbooks, school supply, transport, uniforms, etc.) and opportunity costs (foregone income of their child going to school or health center, rather than work) serve as barriers to the poor’s access to education and health care. The provision of CCTs would boost the poor’s demand for education and health services. 11CCT transfers are envisioned to stop after a certain period (e.g. 5 years) in order to prevent the creation of the so-called “moral hazard”, that is, to prevent a poor household’s dependency on the program.
16
access to microenterprise credit and financial services will be a complementary program to enable the poor to move out of poverty. Supply-side measures should also be undertaken the address the massive underinvestment in social protection measures and infrastructure. The country’s expenditure in education, health, infrastructure, and social protection, not only lags that of its neighbors, but has also been decreasing. Public spending on basic education, for example, was 3.4 percent of GDP in 1998, but decreased to 2.9 percent in 2002 and continued to slide down to 2.2 percent in 2008. As a comparison, the other East Asian countries have increased their public expenditure on education to 3.9 percent of GDP in 2007. Meanwhile, important reform measure with long-term effects is the K-to-12 program that extends basic education from 10 years to 12 years. The changes to the curriculum were introduced in 2012 and the required legislation has made progress in Congress. Diversifying the Industrial Base: The Case for Industrial Policy There is a need for economic diversification in all three major sectors of the economy. In order to achieve this, the more important considerations are an effective industrial policy and maintaining a realistic exchange rate. Apart from the low investment rate, a set of reasons that explains the lack of economic transformation is relates to problems of market failure. Memiş and Montes (2008) cite three factors why the Washington Consensus developmental approach of relying on price signals to private investment is misleading. The first is the existence of dynamic scale economies and knowledge spillovers. Second, some agency, such as the State, might be needed to address coordination failures in private investment activities. Third, there are important informational externalities in the process of industrial investment. Industrial policies are those that address market failure and at the same time promote diversification of production activities into new areas, facilitate restructuring of existing activities, and foster coordination between public and private entities to make all of this happen. These policies need not be restricted to the industry sector. They also apply to the development of nontraditional activities in agriculture and services. The use of industrial policies need not imply that governments make production and employment decisions. Instead, it requires that governments play a ‘strategic and coordinating role’ in the development of nontraditional activities—activities where the underlying costs and opportunities are unknown to begin with and unfold only when such activities start (Rodrik 2004). A success case in the Philippines is the business process outsourcing (BPO) sector wherein the representations made by the Government to US companies facilitated FDI in BPO activities. Following this example, an office similar to the Competitiveness Council can be established with the main responsibility of attracting FDI. But to maximize the gains, there should be spillover effects on the domestic sector. The Singaporean government implemented a Local Industries Upgrading Program that encouraged multinational firms to source their inputs from domestic firms. While the main objective was technology transfer, it had the effect of turning domestic small and medium enterprises (SMEs) into attractive input and service suppliers. The overall effect was to increase the demand for domestic labor. The success of this program is clearly indicated by the increasing employment elasticity of Singapore in the 1990s and beyond. This type of policy can also be used to integrate domestic SMEs—which are more labor-intensive than large firms—to growth areas. In cases where globalization and competition
17
have left no other recourse for exporting firms but to employ capital-intensive production technologies developed in industrial countries, these firms can turn around and engage domestic SMEs for support production services. Such a policy can be considered by economic managers in their attempt to generate more employment. In the context of long-term development strategy, industrial policy would have two major objectives. One is to generate more employment by involving SMEs in global and domestic production networks and supply chains. This can be facilitated by improving their technological capability. The latter together with improving technological capability of larger firms would be the second objective of industrial policy. This would improve firm-level competitiveness by improving product design and product development thereby facilitating product diversification. Exchange Rate Issue A major reason for the lack of economic transformation following the implementation of the openness model in the Philippines is the unsupportive exchange rate policy. Conventional wisdom states that an overvalued currency will be disadvantageous to industrialization because it penalizes exporters and domestic manufacturers. Moreover it encourages consumption spending over investment. In a recent study, Rodrik (2008) formalized and consolidated the discussion on the impact of the real exchange rate on economic growth. Empirical results indicate that an undervaluation of the currency works its way through the tradable sector—particularly industry—in order to stimulate economic growth. The analysis suggests that the tradable goods sector suffers disproportionately from institutional weaknesses and product-market failures. In both cases, a real currency depreciation—or equivalently the relative rise in the price of tradables—acts as a second-best mechanism to alleviate the effects of the aforementioned distortions. The post-World War II travails of the Philippines with respect to the exchange rate can be traced to the Dodge line and the Bell Trade Act. The Dodge Line was a financial and monetary contraction policy drafted by Joseph Dodge for Japan which fixed the exchange rate to 360 yen to one US dollar mainly in order to keep Japanese export prices low.12 Meanwhile, the Bell Trade Act of 1946, also known as the Philippine Trade Act, was legislation passed by the United States Congress specifying the economic conditions governing the independence of the Philippines from the United States. One of the stipulations was that the peso exchange rate—which was then set at 2 pesos per US dollar—would be pegged to the US dollar and could not be changed without the approval of the US government. While these conditions changed over time—the control of the exchange rate was passed on to the International Monetary Fund—laws of physics and economics dictate that initial conditions matter a great deal. The combination of the Dodge Line and Bell Trade Act led to an overvalued peso which became the penchant of the Central Bank of the Philippines and the current Bangko Sentral ng Pilipinas (BSP). For example, between 1987 and 1997—at the time FDI from Japan was flowing into Southeast Asia—the peso appreciated in real
12 For example, see http://en.wikipedia.org/wiki/Dodge_Line. This line of analysis is collaborated by the late Salvador Araneta in his book America's Double-Cross of the Philippines: A Democratic Ally in 1899 and 1946. Araneta states: “The indifferent economic development of the country ... was due to America's policy toward Japan and the Philippines. This policy was the result of the Dodds Report which Truman accepted and which had as its objective to make Japan the industrial workshop of Asia and the Philippines a mere supplier of raw materials”, page 55. It is not clear in the book whether Dr. Araneta misspelled “Dodds” and may have actually been referring to the Dodge Line.
18
terms while the ringgit, baht, and rupiah all depreciated in real terms. Hence, it would be useful for the BSP to change this policy stance, even if implemented subtly. Another case in point would be the surge in capital inflows to emerging markets including the Philippines as a result of the economic malaise in the US and Europe during the period 2008-2011. The BSP has to manage capital flows without allowing the peso to become overvalued. While this is not an easy task, what is important is the attitude and mindset that monetary authorities and other policymakers adopt in approaching this problem. Making Institutions More Effective Many studies overlook the fact that recommendations to strengthen and improve institutions do not readily flow from mainstream or neoclassical economic analysis. A political economy framework must be adopted along with a variant of the new institutional economics. For example, De Dios (2008) emphasizes the need to nurture and reinforce existing groups and constituents that adhere strongly to democratic principles. Meanwhile, Nye (2011) outlines a framework for incorporating institutions in the reform process. For example, the oligarchy will support reforms only if a critical subset of the coalitions that form the oligarchy will see that the changes are in their best interests. “Ideally reforms are started where resistance is weakest and where changes become self-sustaining and hard to resist once under way.”13 The 2008-2009 Philippine Human Development Report focuses on institutions in the Philippines.14 The discussion deals mainly with reforms that will allow the government to deliver better-quality public goods. The proposals contained in the PHDR aim to change institutions by i) updating or improving the scope and content of formal rules; and ii) realigning norms and beliefs so that compliance with formal rules is better effected. Future analysis of economic development constraints should consider a multi-disciplinary approach which can put more emphasis on the “deep parameters” affecting economic performance. For example, related to the institutional dimension, culture and values can partly explain the lack of social cohesion, spotty entrepreneurship, and general inability to establish a credible and selfless political leadership in the Philippines. A Weberian framework would certainly cite the inconsistency between religion and capitalist development in the Philippines. Meanwhile, values such as ningas cogon15 have definitely adversely affected economic growth. However, even if this analysis was accurate, effective policy prescriptions would still be elusive. At best, the analysis would yield guidelines that will make policymakers aware of the limitations of economic reforms and enable them to contextualize these reforms. If values are indeed a major factor, then the education system has to part of the reform process. For example, some schools now offer courses in entrepreneurship. Civil society can be active in voter education in order that more capable and progressive-minded leaders are elected. This leads to greater respect of formal institutions and better governance. Nevertheless, it would still be useful for the government to pursue laws that can weaken the grip of oligarchs. For example, to effectively protect the Filipino consumers in the overall
13 Nye (2011), page 18. 14 Human Development Network (2009). 15"Ningas Cogon" is an old Filipino expression, which literally means "grass flash-fire". It refers to cogon dry grass which blazes furiously when set alight, but only for a few minutes before turning to cold ashes. When applied to society, it refers to people who are enthusiastic about something but then lose interest quickly. It applies particularly to personal effort and business ventures. Some sociologists have cited this as a general weakness of Philippine society which is inconsistent with successful entrepreneurship.
19
competition process, the first step is to legislate and enforce a good competition law. The latter will keep markets competitive by disciplining abusive exercises of market power. More specific recommendations include:
• Strengthen linkages across government agencies, adhere to the rule of law, and streamline procedures to improve delivery of public goods;
• Streamline court processes, increase transparency, and strengthen the Ombudsman
and public prosecutors to curb corruption; and
• Continue public procurement reforms, increase transparency by posting in government website contract details and actions of the Bids and Awards Committee.
Demographic Transition One of the key challenges that slows down the country’s ability to realize sustained economic growth is a relatively high population growth rate. Data from the World Bank shows that in 2009, the population growth rate of the Philippines is 1.79 percent.16 Although this rate is lower than 3.08 percent in the 1960s and 2.35 percent in the 1980s, it remains to be one of the highest in the region. At the current population growth rate, the Philippines needs to sustain a very high level of economic growth in order to achieve its goal of becoming a high middle income country by 2030. The Philippines’ vision to become a high middle income economy by 2030 can be achieved only if per capita GDP growth is in the order of at least 4.8 percent. The country’s GDP should therefore grow at an average of 6.3 to 6.6 percent per year and with a population growth of around 1.5 to 1.8 percent on average. This means that the Philippines has to reduce its population growth rate by at least 0.24 percentage point. The desire to reduce population growth does not only come from the need to achieve higher living standards but it is also important from the social development aspect. Pernia (2003) provides a note on why an old issue such as population really matters while Orbeta (2006) provides empirical evidence that to larger families are have a higher incidence of poverty.17 To effectively reduce the population growth rate, the country has to adopt several key measures.18 One of these is to reduce unwanted fertility or meet unmet needs for contraception. This can be done through a strong national family planning program, one that includes both traditional (natural) and modern (artificial) methods of contraception. Between the two methods, there is really a need to increase the adoption of modern contraception by the poor. This is based on evidence that poor households have larger family size and this was found to be caused by ineffective fertility control measures and not due to demand for 16 Annual population growth rate for year t is the exponential rate of growth of midyear population from year t-1 to t, expressed as a percentage. Population is based on the de facto definition of population, which counts all residents regardless of legal status or citizenship—except for refugees not permanently settled in the country of asylum, who are generally considered part of the population of the country of origin (The World Bank). 17 Orbeta (2006) explains why larger families are poorer than smaller ones. Having more children in a family reduces the wage income of parents, enrolment of children particularly in secondary and tertiary levels, expenditure per child who remains in school, and savings of households. The negative impact is consistently much bigger among poorer households, which implies that besides the continued high poverty incidence, there will also be a perpetuation or even worsening of income inequality. 18 Key strategies for reducing the population growth were obtained from studies by Herrin and Pernia (2003), Orbeta (2006), and Orbeta (2005). It should be noted that the Responsible Parenthood and Reproductive Health Act of 2012 was signed by President Aquino on December 28, 2012.
20
more children (Orbeta, 2006b). The passage of the controversial Reproductive Health bill will be a major leap in achieving a strong national family planning program. In the effort to assist the poor in achieving their fertility goals, the government must provide subsidies to them for modern methods. In doing so, it is essential for the government to lower the reliance of richer households on public subsidies. The demand for modern methods of family planning among poorer households is lower partly because of the crowding out of women from poor households by a significant percentage of women from richer households who are getting their supplies of modern contraception also from public sources. References Aldaba, R. M., J. T. Yap, and P. A. Petri (2009): “The AEC and Investment and Capital
Flows” in M. G. Plummer and S. Y. Chia (eds.) Realizing the ASEAN Economic Community: A Comprehensive Assessment. Singapore: ISEAS Publishing.
Asian Development Bank (2007): Philippines: Critical Development Constraints.
Economics and Research Department, Asian Development Bank, Mandaluyong City (December).
Bocchi, A. M. (2008): “Rising Growth, Declining Investment: The Puzzle of the Philippines.”
World Bank Policy Research Working Paper 4472 (January). Cypher, J. M. and J. L. Dietz (2009): The Process of Economic Development (3rd
Edition). New York: Routledge. De Dios, E. S. (2008): “Institutional Constraints on Philippine Growth”. UP School of
Economics Discussion Paper 0806 (July). De Dios, E. S. and P. D. Hutchcroft. “Political Economy.” Chapter 2 in A. M. Balisacan and
H. Hill (eds.). The Philippine Economy: Development, Policies and Challenges. Quezon City: Ateneo de Manila University Press, 2003.
Dimaranan, Betina, Elena Ianchovichina, and Will Martin (2006): “Competing with Giants:
Who Wins, Who Loses?” In A. L. Winters and S. Yusuf (eds.) Dancing with Giants: China, India, and the Global Economy. Conference Edition. The World Bank and the Institute of Policy Studies.
Felipe, J. and L. Lanzona (2006): “Unemployment, Labor Laws, and Economic Policies in
the Philippines,” in J. Felipe and R. Hasan, eds. (2006) Labor Markets in Asia: Issues and Perspectives. London: Palgrave Macmillan for the Asian Development Bank.
Hausmann, R., D. Rodrik, and A. Velasco (2005): Growth Diagnostics. John F. Kennedy
School of Government, Harvard University, Cambridge. Herrin, A.N. and E.M. Pernia (2003): “Population, human resources, and employment”.
Chapter 9 in A. M. Balisacan and H. Hill (eds.). The Philippine Economy: Development, Policies and Challenges. Quezon City: Ateneo de Manila University Press.
21
Human Development Network (2005): Philippine Human Development Report 2005: Peace, Human Security and Human Development in the Philippines. Manila: HDN.
Human Development Network (2009): Philippine Human Development Report 2008/2009:
Institutions, Politics and Human Development. Manila: HDN. Llanto, G. M. (2004): Infrastructure Development: Experience and Policy Options for
the Future. Perspective Paper Series No. 7. Philippine Institute for Development Studies, Makati City.
Manasan, R. G. (2010): “Financing the MDGs and Inclusive Growth in the Time of Fiscal
Consolidation” Philippine Institute for Development Studies Discussion Paper 2010-34.
Memiş, E. and M. F. Montes (2008): “Who’s Afraid of Industrial Policy?” Discussion Paper,
Asia Pacific Trade and Investment Initiative, UNDP Regional Centre in Colombo (May).
Nye, J. V. C. (2011): “Taking Institutions Seriously: Rethinking the Political Economy of
Development in the Philippines.” Asian Development Review 28, 1, 1-21. O’Connor, D. C. (1990): “Industry in a Mixed Economy” in E. S. De Dios and L. G. Villamil
(eds.) Plans, Markets, and Relations: Studies for a Mixed Economy. Manila: Philippine Center for Policy Studies.
Orbeta, A.C. Jr. (2005): “Children and the labor force participation and earning of parents in
the Philippines.” Philippine Journal of Development, 32(1), 19-52. Orbeta, A. C. Jr. (2006): “Population: The more the poorer: Why large family size causes
poverty.” (PIDS Policy Notes No. 2006-06). Retrieved from http://dirp4.pids.gov.ph/ris/pn/pidspn0606.pdf
Orbeta, A.C. Jr. (2006b): “Poverty, Fertility Preferences, and Family Planning Practices in
the Philippines.” Philippine Journal of Development, 33(1& 2), 129-160. Park, C. Y., R. P. Majuca, and J. T. Yap (2011): “The 2008 Financial Crisis and Potential
Output in Asia: Impact and Policy Implications.” Korea and the World Economy, 12, 2 (August), 239-280.
Rashid, Z. et al (2009): “Regional Market for Goods, Services, and Skilled Labor” in M. G.
Plummer and S. Y. Chia (eds.) Realizing the ASEAN Economic Community: A Comprehensive Assessment. Singapore: ISEAS Publishing.
Rodrik, Dani (2004): “Industrial Policy for the Twenty-First Century” (September).
Downloaded from http://ksghome.harvard.edu/~drodrik/UNIDOSep.pdf. Rodrik, D. (2008): “The Real Exchange Rate and Economic Growth”. Downloaded from
http://ksghome.harvard.edu/~drodrik/RER%20and%20growth.pdf (October). UNCTAD (2004): Trade Development Report: Policy coherence, development
strategies and integration into the world economy. Geneva: UNCTAD.
22
World Bank (2009): The Philippines: Country Environmental Analysis (October). Available at http://www.worldbank.org.ph/WBSITE/EXTERNAL/COUNTRIES/EASTASIAPACIFICEXT/PHILIPPINESEXTN/0,,contentMDK:21832777~pagePK:141137~piPK:141127~theSitePK:332982,00.html.
Yap, J. T. (2006): “Should Southeast Asia fear the Chinese juggernaut? The view from the
Philippines.” PIDS Policy Notes No. 2006-08 (December). Yusuf, A. A. and H. A. Francisco (2009): “Climate Change Vulnerability Mapping for
Southeast Asia.” Economy and Environment Program for Southeast Asia (EEPSEA) Special and Technical Paper (January). Available at http://web.idrc.ca/uploads/user-S/12324196651Mapping_Report.pdf
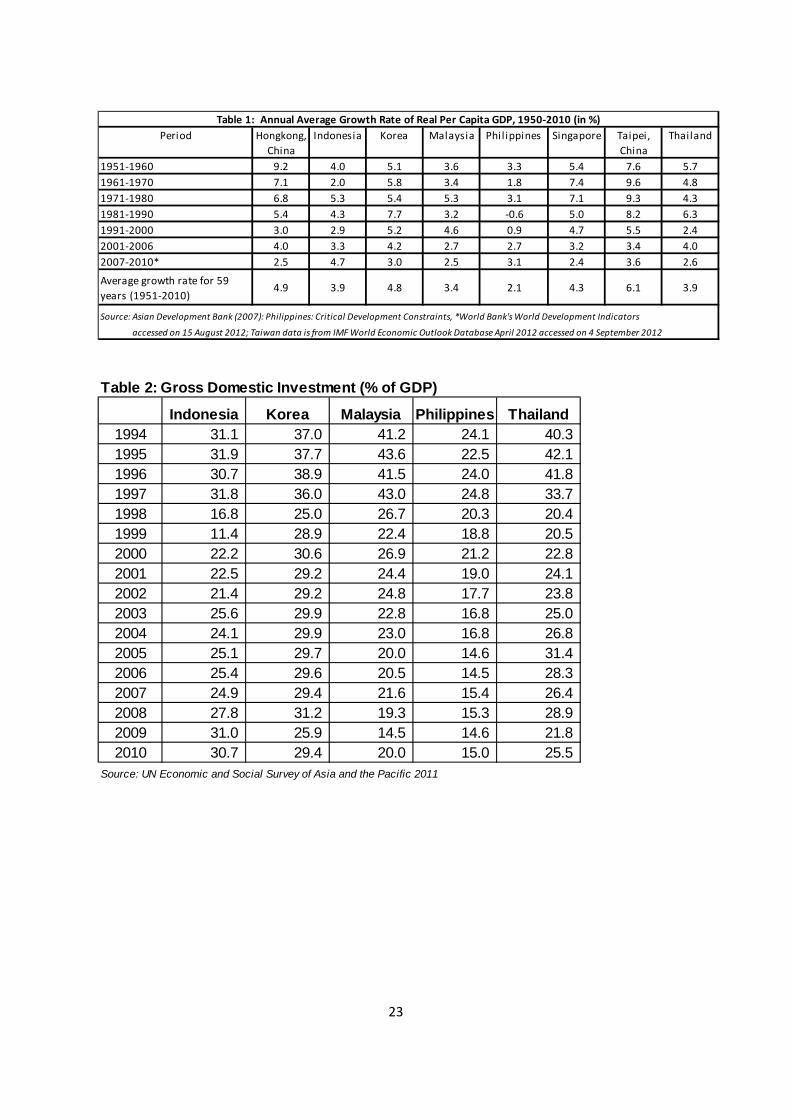
23
Period Hongkong, China
Indonesia Korea Malaysia Phil ippines Singapore Taipei, China
Thailand
1951-1960 9.2 4.0 5.1 3.6 3.3 5.4 7.6 5.71961-1970 7.1 2.0 5.8 3.4 1.8 7.4 9.6 4.81971-1980 6.8 5.3 5.4 5.3 3.1 7.1 9.3 4.31981-1990 5.4 4.3 7.7 3.2 -0.6 5.0 8.2 6.31991-2000 3.0 2.9 5.2 4.6 0.9 4.7 5.5 2.42001-2006 4.0 3.3 4.2 2.7 2.7 3.2 3.4 4.02007-2010* 2.5 4.7 3.0 2.5 3.1 2.4 3.6 2.6
Average growth rate for 59 years (1951-2010)
4.9 3.9 4.8 3.4 2.1 4.3 6.1 3.9
Table 1: Annual Average Growth Rate of Real Per Capita GDP, 1950-2010 (in %)
Source: Asian Development Bank (2007): Philippines: Critical Development Constraints, *World Bank's World Development Indicators
accessed on 15 August 2012; Taiwan data is from IMF World Economic Outlook Database April 2012 accessed on 4 September 2012
Table 2: Gross Domestic Investment (% of GDP)
Indonesia Korea Malaysia Philippines Thailand1994 31.1 37.0 41.2 24.1 40.3 1995 31.9 37.7 43.6 22.5 42.1 1996 30.7 38.9 41.5 24.0 41.8 1997 31.8 36.0 43.0 24.8 33.7 1998 16.8 25.0 26.7 20.3 20.4 1999 11.4 28.9 22.4 18.8 20.5 2000 22.2 30.6 26.9 21.2 22.8 2001 22.5 29.2 24.4 19.0 24.1 2002 21.4 29.2 24.8 17.7 23.8 2003 25.6 29.9 22.8 16.8 25.0 2004 24.1 29.9 23.0 16.8 26.8 2005 25.1 29.7 20.0 14.6 31.4 2006 25.4 29.6 20.5 14.5 28.3 2007 24.9 29.4 21.6 15.4 26.4 2008 27.8 31.2 19.3 15.3 28.9 2009 31.0 25.9 14.5 14.6 21.8 2010 30.7 29.4 20.0 15.0 25.5
Source: UN Economic and Social Survey of Asia and the Pacific 2011
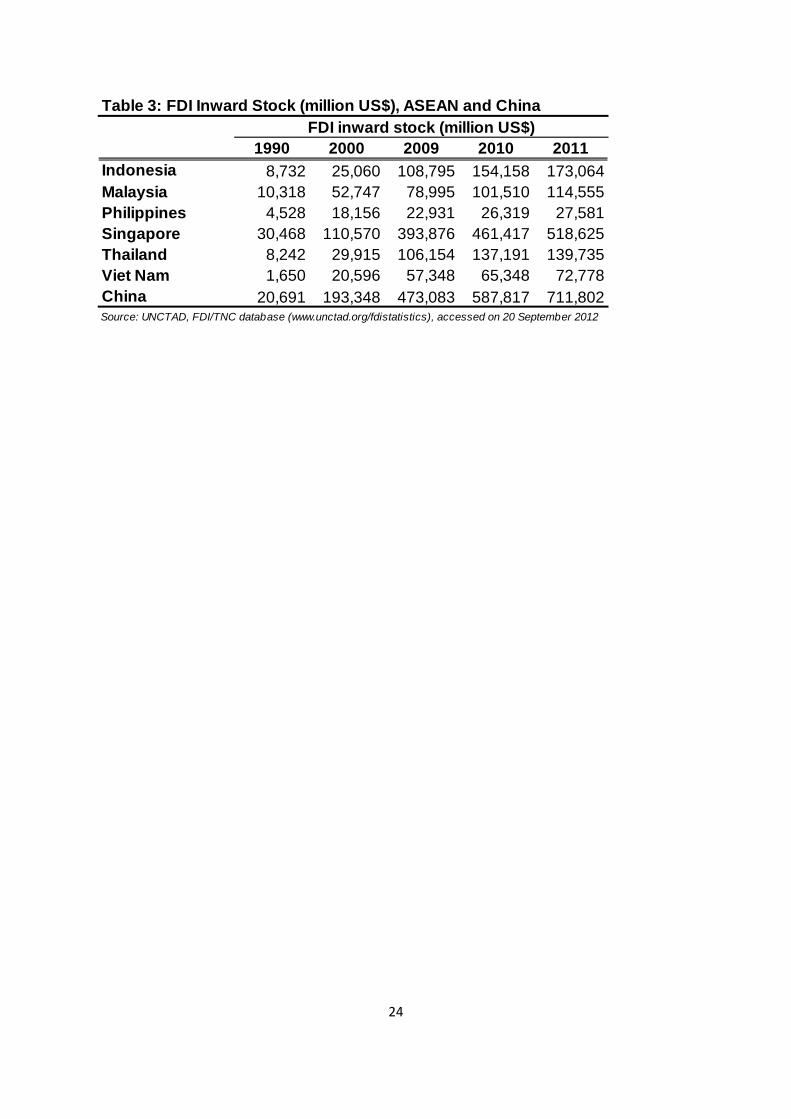
24
Table 3: FDI Inward Stock (million US$), ASEAN and ChinaFDI inward stock (million US$)
1990 2000 2009 2010 2011Indonesia 8,732 25,060 108,795 154,158 173,064Malaysia 10,318 52,747 78,995 101,510 114,555Philippines 4,528 18,156 22,931 26,319 27,581Singapore 30,468 110,570 393,876 461,417 518,625Thailand 8,242 29,915 106,154 137,191 139,735Viet Nam 1,650 20,596 57,348 65,348 72,778China 20,691 193,348 473,083 587,817 711,802Source: UNCTAD, FDI/TNC database (www.unctad.org/fdistatistics), accessed on 20 September 2012
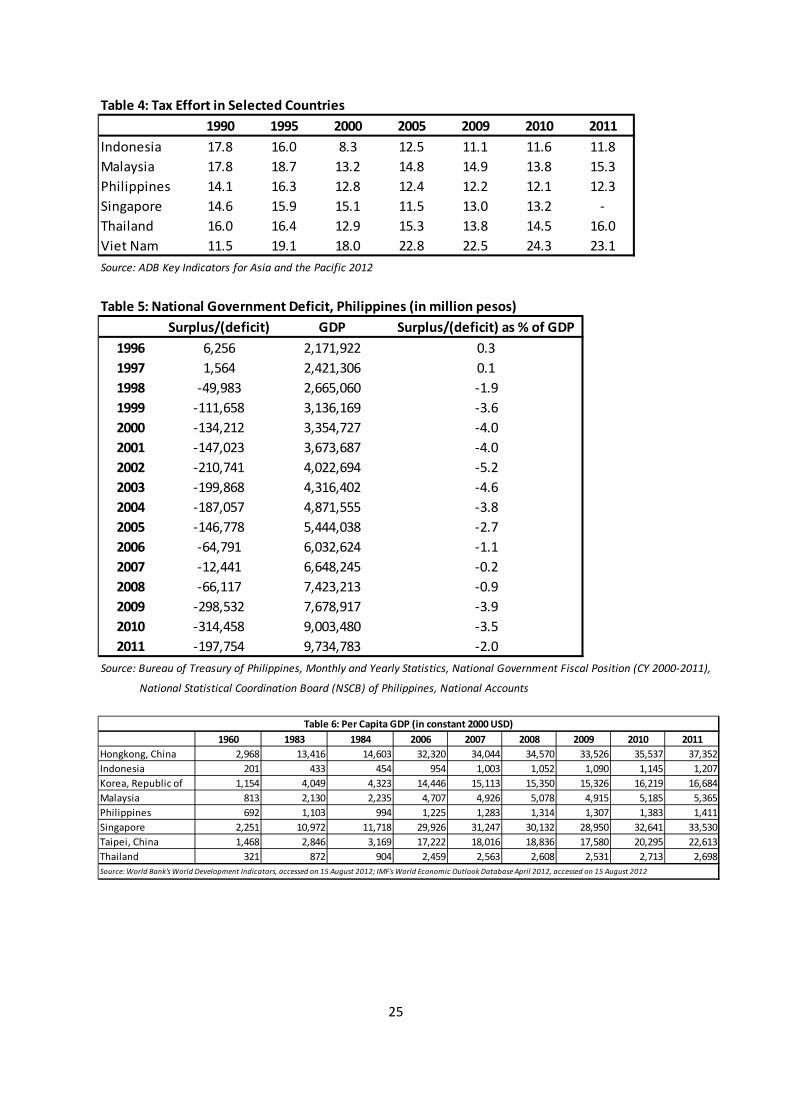
25
Table 4: Tax Effort in Selected Countries1990 1995 2000 2005 2009 2010 2011
Indonesia 17.8 16.0 8.3 12.5 11.1 11.6 11.8Malaysia 17.8 18.7 13.2 14.8 14.9 13.8 15.3Philippines 14.1 16.3 12.8 12.4 12.2 12.1 12.3Singapore 14.6 15.9 15.1 11.5 13.0 13.2 -Thailand 16.0 16.4 12.9 15.3 13.8 14.5 16.0Viet Nam 11.5 19.1 18.0 22.8 22.5 24.3 23.1Source: ADB Key Indicators for Asia and the Pacific 2012
Table 5: National Government Deficit, Philippines (in million pesos)Surplus/(deficit) GDP Surplus/(deficit) as % of GDP
1996 6,256 2,171,922 0.31997 1,564 2,421,306 0.11998 -49,983 2,665,060 -1.91999 -111,658 3,136,169 -3.62000 -134,212 3,354,727 -4.02001 -147,023 3,673,687 -4.02002 -210,741 4,022,694 -5.22003 -199,868 4,316,402 -4.62004 -187,057 4,871,555 -3.82005 -146,778 5,444,038 -2.72006 -64,791 6,032,624 -1.12007 -12,441 6,648,245 -0.22008 -66,117 7,423,213 -0.92009 -298,532 7,678,917 -3.92010 -314,458 9,003,480 -3.52011 -197,754 9,734,783 -2.0
Source: Bureau of Treasury of Philippines, Monthly and Yearly Statistics, National Government Fiscal Position (CY 2000-2011),
National Statistical Coordination Board (NSCB) of Philippines, National Accounts
1960 1983 1984 2006 2007 2008 2009 2010 2011Hongkong, China 2,968 13,416 14,603 32,320 34,044 34,570 33,526 35,537 37,352Indonesia 201 433 454 954 1,003 1,052 1,090 1,145 1,207Korea, Republic of 1,154 4,049 4,323 14,446 15,113 15,350 15,326 16,219 16,684Malaysia 813 2,130 2,235 4,707 4,926 5,078 4,915 5,185 5,365Philippines 692 1,103 994 1,225 1,283 1,314 1,307 1,383 1,411Singapore 2,251 10,972 11,718 29,926 31,247 30,132 28,950 32,641 33,530Taipei, China 1,468 2,846 3,169 17,222 18,016 18,836 17,580 20,295 22,613Thailand 321 872 904 2,459 2,563 2,608 2,531 2,713 2,698Source: World Bank's World Development Indicators, accessed on 15 August 2012; IMF's World Economic Outlook Database April 2012, accessed on 15 August 2012
Table 6: Per Capita GDP (in constant 2000 USD)
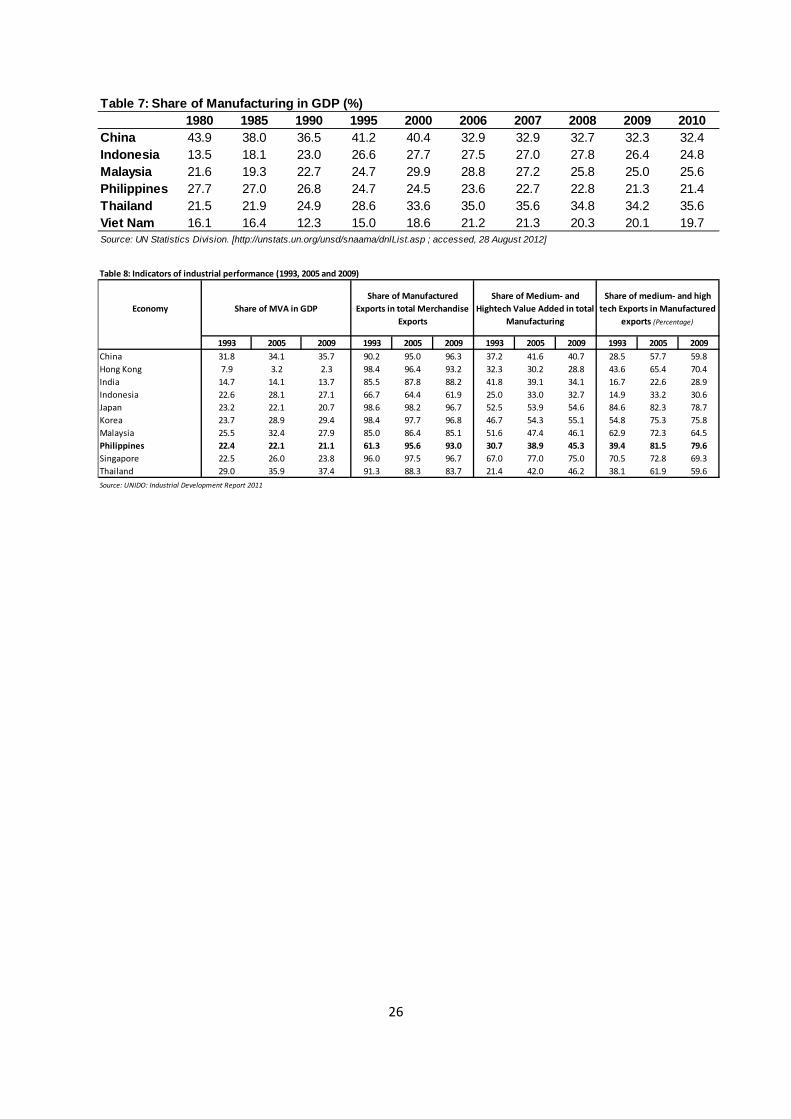
26
Table 7: Share of Manufacturing in GDP (%)1980 1985 1990 1995 2000 2006 2007 2008 2009 2010
China 43.9 38.0 36.5 41.2 40.4 32.9 32.9 32.7 32.3 32.4Indonesia 13.5 18.1 23.0 26.6 27.7 27.5 27.0 27.8 26.4 24.8Malaysia 21.6 19.3 22.7 24.7 29.9 28.8 27.2 25.8 25.0 25.6Philippines 27.7 27.0 26.8 24.7 24.5 23.6 22.7 22.8 21.3 21.4Thailand 21.5 21.9 24.9 28.6 33.6 35.0 35.6 34.8 34.2 35.6Viet Nam 16.1 16.4 12.3 15.0 18.6 21.2 21.3 20.3 20.1 19.7Source: UN Statistics Division. [http://unstats.un.org/unsd/snaama/dnlList.asp ; accessed, 28 August 2012]
Table 8: Indicators of industrial performance (1993, 2005 and 2009)
Economy Share of MVA in GDPShare of Manufactured
Exports in total Merchandise Exports
Share of Medium- and Hightech Value Added in total
Manufacturing
Share of medium- and high tech Exports in Manufactured
exports (Percentage)
1993 2005 2009 1993 2005 2009 1993 2005 2009 1993 2005 2009China 31.8 34.1 35.7 90.2 95.0 96.3 37.2 41.6 40.7 28.5 57.7 59.8Hong Kong 7.9 3.2 2.3 98.4 96.4 93.2 32.3 30.2 28.8 43.6 65.4 70.4India 14.7 14.1 13.7 85.5 87.8 88.2 41.8 39.1 34.1 16.7 22.6 28.9Indonesia 22.6 28.1 27.1 66.7 64.4 61.9 25.0 33.0 32.7 14.9 33.2 30.6Japan 23.2 22.1 20.7 98.6 98.2 96.7 52.5 53.9 54.6 84.6 82.3 78.7Korea 23.7 28.9 29.4 98.4 97.7 96.8 46.7 54.3 55.1 54.8 75.3 75.8Malaysia 25.5 32.4 27.9 85.0 86.4 85.1 51.6 47.4 46.1 62.9 72.3 64.5Philippines 22.4 22.1 21.1 61.3 95.6 93.0 30.7 38.9 45.3 39.4 81.5 79.6Singapore 22.5 26.0 23.8 96.0 97.5 96.7 67.0 77.0 75.0 70.5 72.8 69.3Thailand 29.0 35.9 37.4 91.3 88.3 83.7 21.4 42.0 46.2 38.1 61.9 59.6Source: UNIDO: Industrial Development Report 2011
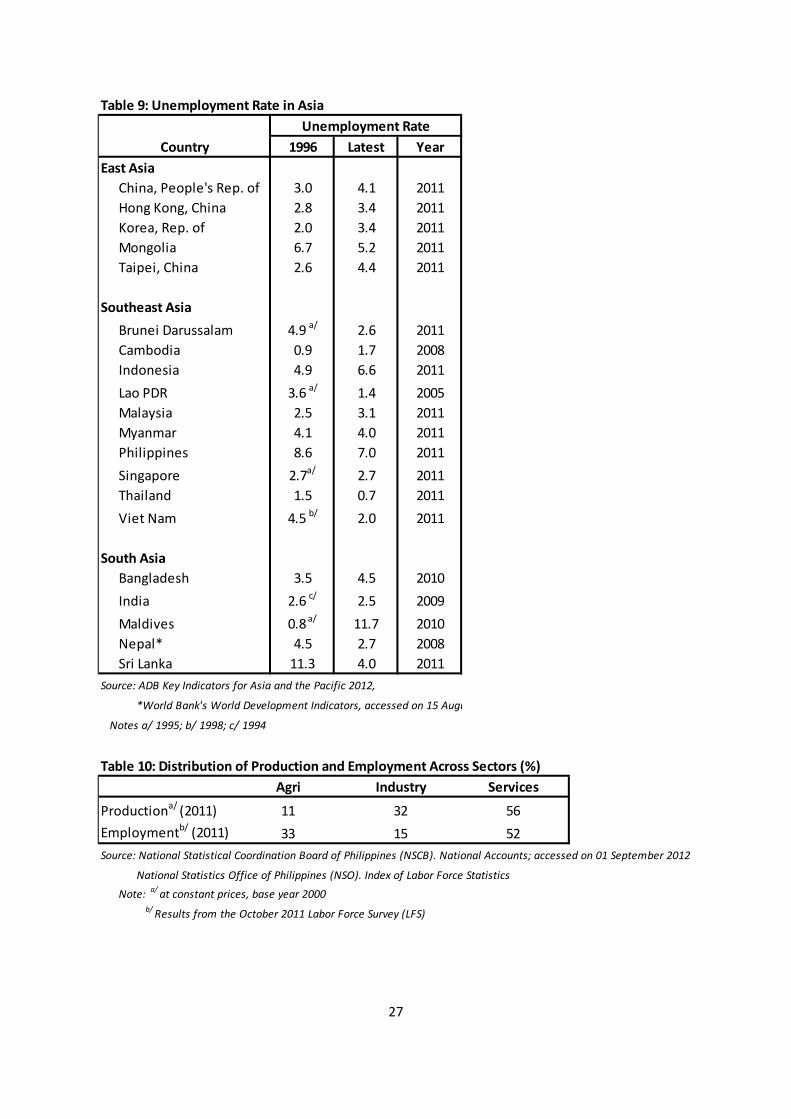
27
Table 9: Unemployment Rate in AsiaUnemployment Rate
Country 1996 Latest YearEast Asia
China, People's Rep. of 3.0 4.1 2011Hong Kong, China 2.8 3.4 2011Korea, Rep. of 2.0 3.4 2011Mongolia 6.7 5.2 2011Taipei, China 2.6 4.4 2011
Southeast Asia
Brunei Darussalam 4.9 a/ 2.6 2011Cambodia 0.9 1.7 2008Indonesia 4.9 6.6 2011
Lao PDR 3.6 a/ 1.4 2005Malaysia 2.5 3.1 2011Myanmar 4.1 4.0 2011Philippines 8.6 7.0 2011
Singapore 2.7a/ 2.7 2011Thailand 1.5 0.7 2011
Viet Nam 4.5 b/ 2.0 2011
South AsiaBangladesh 3.5 4.5 2010
India 2.6 c/ 2.5 2009
Maldives 0.8 a/ 11.7 2010Nepal* 4.5 2.7 2008Sri Lanka 11.3 4.0 2011
Source: ADB Key Indicators for Asia and the Pacific 2012,
*World Bank's World Development Indicators, accessed on 15 Augu
Notes a/ 1995; b/ 1998; c/ 1994
Table 10: Distribution of Production and Employment Across Sectors (%)Agri Industry Services
Productiona/ (2011) 11 32 56
Employmentb/ (2011) 33 15 52Source: National Statistical Coordination Board of Philippines (NSCB). National Accounts; accessed on 01 September 2012
National Statistics Office of Philippines (NSO). Index of Labor Force Statistics
Note: a/ at constant prices, base year 2000b/ Results from the October 2011 Labor Force Survey (LFS)
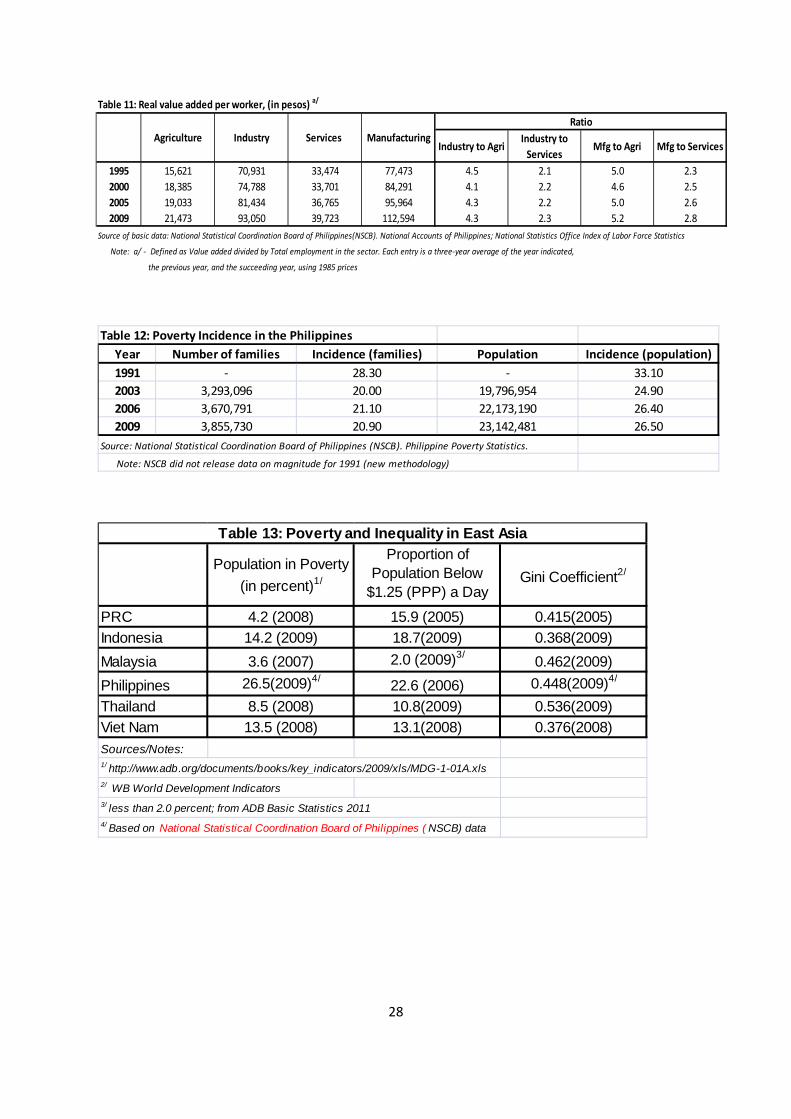
28
Table 11: Real value added per worker, (in pesos) a/
Ratio
Industry to AgriIndustry to
ServicesMfg to Agri Mfg to Services
1995 15,621 70,931 33,474 77,473 4.5 2.1 5.0 2.32000 18,385 74,788 33,701 84,291 4.1 2.2 4.6 2.52005 19,033 81,434 36,765 95,964 4.3 2.2 5.0 2.62009 21,473 93,050 39,723 112,594 4.3 2.3 5.2 2.8
Source of basic data: National Statistical Coordination Board of Philippines(NSCB). National Accounts of Philippines; National Statistics Office Index of Labor Force Statistics
Note: a/ - Defined as Value added divided by Total employment in the sector. Each entry is a three-year average of the year indicated,
the previous year, and the succeeding year, using 1985 prices
Agriculture Industry Services Manufacturing
Table 12: Poverty Incidence in the PhilippinesYear Number of families Incidence (families) Population Incidence (population)1991 - 28.30 - 33.102003 3,293,096 20.00 19,796,954 24.902006 3,670,791 21.10 22,173,190 26.402009 3,855,730 20.90 23,142,481 26.50
Source: National Statistical Coordination Board of Philippines (NSCB). Philippine Poverty Statistics.
Note: NSCB did not release data on magnitude for 1991 (new methodology)
PRC 4.2 (2008) 15.9 (2005) 0.415(2005)Indonesia 14.2 (2009) 18.7(2009) 0.368(2009)Malaysia 3.6 (2007) 2.0 (2009)3/ 0.462(2009)Philippines 26.5(2009)4/ 22.6 (2006) 0.448(2009)4/
Thailand 8.5 (2008) 10.8(2009) 0.536(2009)Viet Nam 13.5 (2008) 13.1(2008) 0.376(2008)Sources/Notes:1/ http://www.adb.org/documents/books/key_indicators/2009/xls/MDG-1-01A.xls2/ WB World Development Indicators3/ less than 2.0 percent; from ADB Basic Statistics 20114/ Based on National Statistical Coordination Board of Philippines ( NSCB) data
Table 13: Poverty and Inequality in East Asia
Population in Poverty (in percent)1/ Gini Coefficient2/
Proportion of Population Below
$1.25 (PPP) a Day (%)
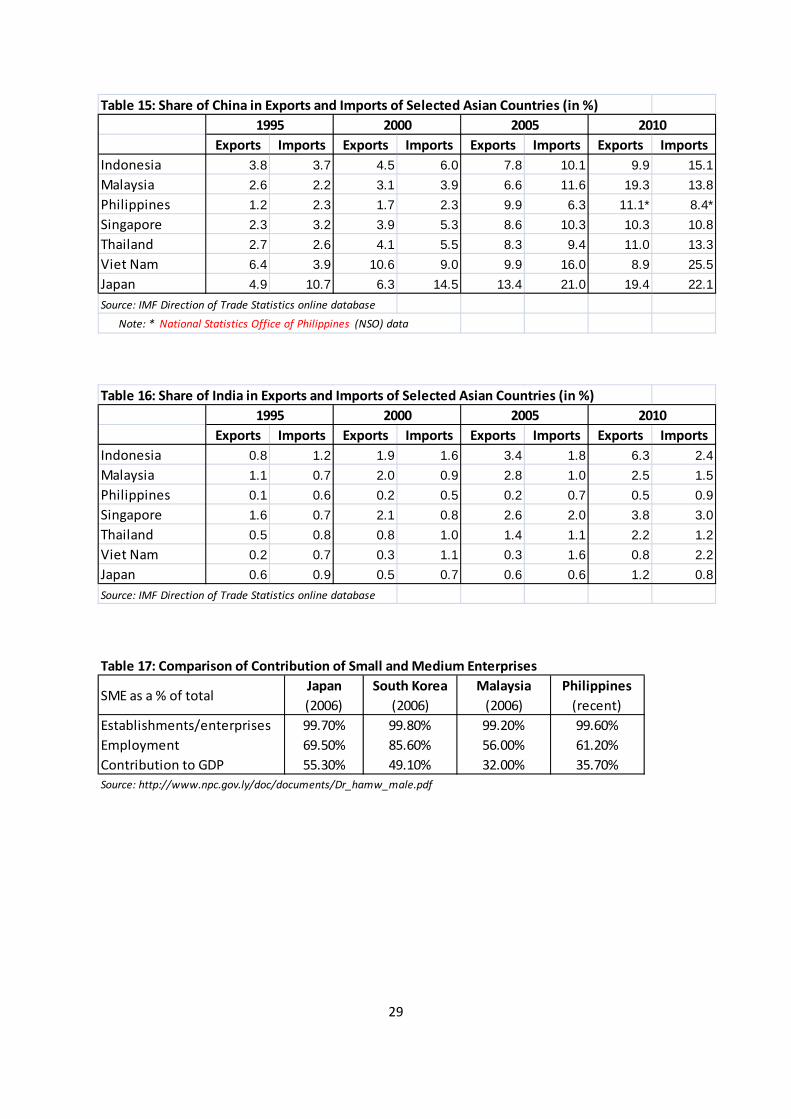
29
Table 15: Share of China in Exports and Imports of Selected Asian Countries (in %)1995 2000 2005 2010
Exports Imports Exports Imports Exports Imports Exports ImportsIndonesia 3.8 3.7 4.5 6.0 7.8 10.1 9.9 15.1Malaysia 2.6 2.2 3.1 3.9 6.6 11.6 19.3 13.8Philippines 1.2 2.3 1.7 2.3 9.9 6.3 11.1* 8.4*Singapore 2.3 3.2 3.9 5.3 8.6 10.3 10.3 10.8Thailand 2.7 2.6 4.1 5.5 8.3 9.4 11.0 13.3Viet Nam 6.4 3.9 10.6 9.0 9.9 16.0 8.9 25.5Japan 4.9 10.7 6.3 14.5 13.4 21.0 19.4 22.1Source: IMF Direction of Trade Statistics online database
Note: * National Statistics Office of Philippines (NSO) data
Table 16: Share of India in Exports and Imports of Selected Asian Countries (in %)1995 2000 2005 2010
Exports Imports Exports Imports Exports Imports Exports ImportsIndonesia 0.8 1.2 1.9 1.6 3.4 1.8 6.3 2.4Malaysia 1.1 0.7 2.0 0.9 2.8 1.0 2.5 1.5Philippines 0.1 0.6 0.2 0.5 0.2 0.7 0.5 0.9Singapore 1.6 0.7 2.1 0.8 2.6 2.0 3.8 3.0Thailand 0.5 0.8 0.8 1.0 1.4 1.1 2.2 1.2Viet Nam 0.2 0.7 0.3 1.1 0.3 1.6 0.8 2.2Japan 0.6 0.9 0.5 0.7 0.6 0.6 1.2 0.8Source: IMF Direction of Trade Statistics online database
Table 17: Comparison of Contribution of Small and Medium Enterprises
SME as a % of totalJapan (2006)
South Korea (2006)
Malaysia (2006)
Philippines (recent)
Establishments/enterprises 99.70% 99.80% 99.20% 99.60%Employment 69.50% 85.60% 56.00% 61.20%Contribution to GDP 55.30% 49.10% 32.00% 35.70%Source: http://www.npc.gov.ly/doc/documents/Dr_hamw_male.pdf
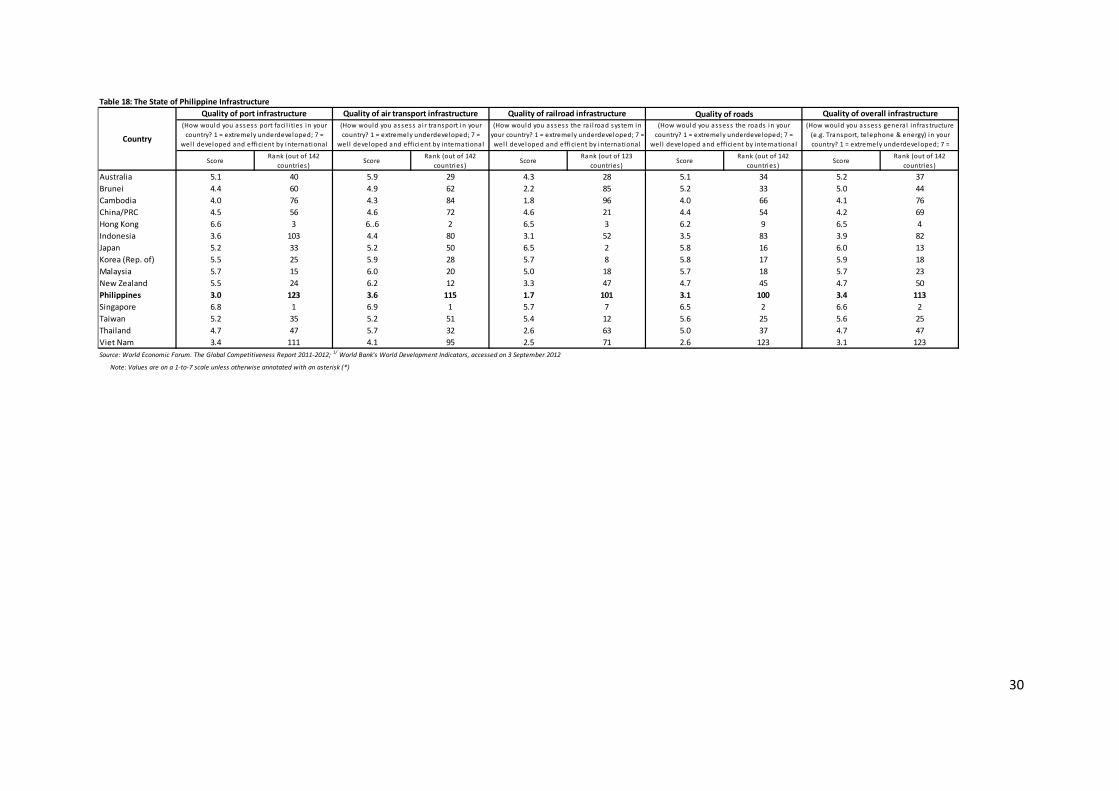
30
Table 18: The State of Philippine InfrastructureQuality of port infrastructure Quality of air transport infrastructure Quality of railroad infrastructure Quality of roads Quality of overall infrastructure
ScoreRank (out of 142
countries )Score
Rank (out of 142 countries )
ScoreRank (out of 123
countries )Score
Rank (out of 142 countries )
ScoreRank (out of 142
countries )
Australia 5.1 40 5.9 29 4.3 28 5.1 34 5.2 37Brunei 4.4 60 4.9 62 2.2 85 5.2 33 5.0 44Cambodia 4.0 76 4.3 84 1.8 96 4.0 66 4.1 76China/PRC 4.5 56 4.6 72 4.6 21 4.4 54 4.2 69Hong Kong 6.6 3 6..6 2 6.5 3 6.2 9 6.5 4Indonesia 3.6 103 4.4 80 3.1 52 3.5 83 3.9 82Japan 5.2 33 5.2 50 6.5 2 5.8 16 6.0 13Korea (Rep. of) 5.5 25 5.9 28 5.7 8 5.8 17 5.9 18Malaysia 5.7 15 6.0 20 5.0 18 5.7 18 5.7 23New Zealand 5.5 24 6.2 12 3.3 47 4.7 45 4.7 50Philippines 3.0 123 3.6 115 1.7 101 3.1 100 3.4 113Singapore 6.8 1 6.9 1 5.7 7 6.5 2 6.6 2Taiwan 5.2 35 5.2 51 5.4 12 5.6 25 5.6 25Thailand 4.7 47 5.7 32 2.6 63 5.0 37 4.7 47Viet Nam 3.4 111 4.1 95 2.5 71 2.6 123 3.1 123Source: World Economic Forum. The Global Competitiveness Report 2011-2012; 1/ World Bank's World Development Indicators, accessed on 3 September 2012
Note: Values are on a 1-to-7 scale unless otherwise annotated with an asterisk (*)
(How would you assess genera l infrastructure (e.g. Transport, telephone & energy) in your country? 1 = extremely underdeveloped; 7 =
Country
(How would you assess port faci l i ties in your country? 1 = extremely underdeveloped; 7 =
wel l developed and efficient by international
(How would you assess a i r transport in your country? 1 = extremely underdeveloped; 7 =
wel l developed and efficient by international
(How would you assess the ra i l road system in your country? 1 = extremely underdeveloped; 7 = wel l developed and efficient by international
(How would you assess the roads in your country? 1 = extremely underdeveloped; 7 =
wel l developed and efficient by international
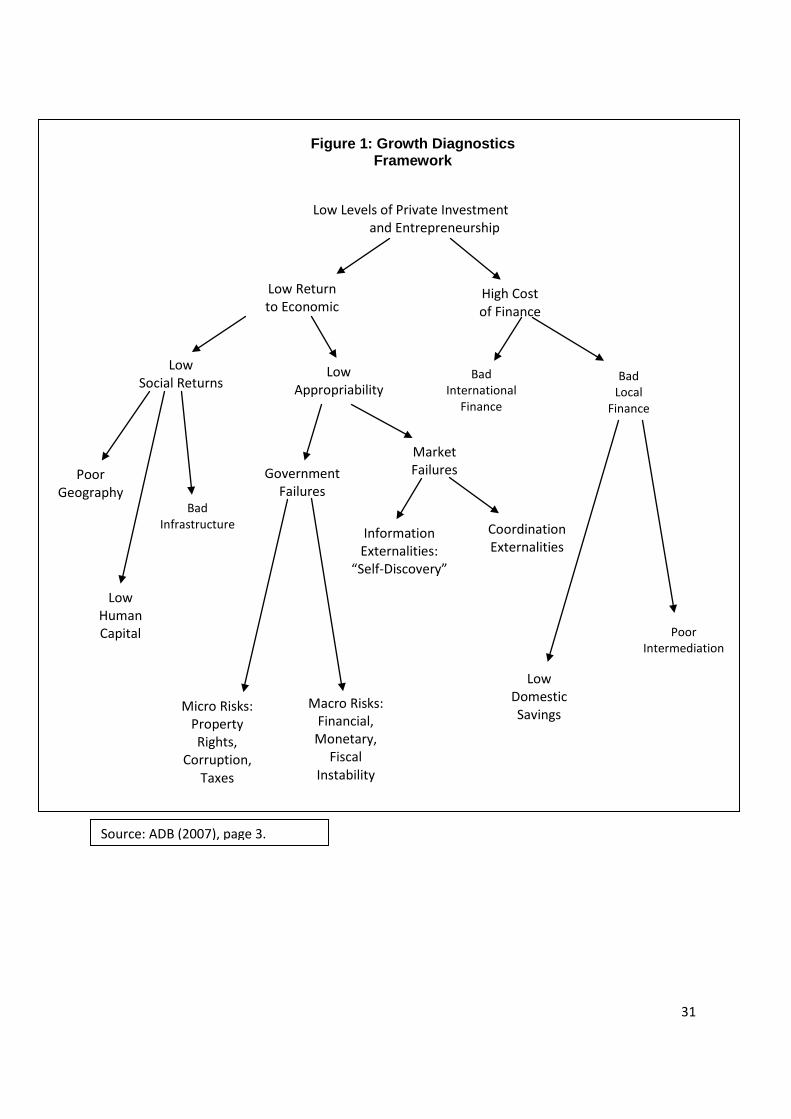
31
Low Return to Economic
High Cost of Finance
Low Social Returns
Low Appropriability
Bad International
Finance
Bad Local
Finance
Poor Geography
Low Human Capital
Bad Infrastructure
Government Failures
Market Failures
Information Externalities:
“Self-Discovery”
Coordination Externalities
Micro Risks: Property Rights,
Corruption, Taxes
Macro Risks: Financial,
Monetary, Fiscal
Instability
Low Domestic Savings
Poor Intermediation
Low Levels of Private Investment and Entrepreneurship
Figure 1: Growth Diagnostics Framework
Source: ADB (2007), page 3.
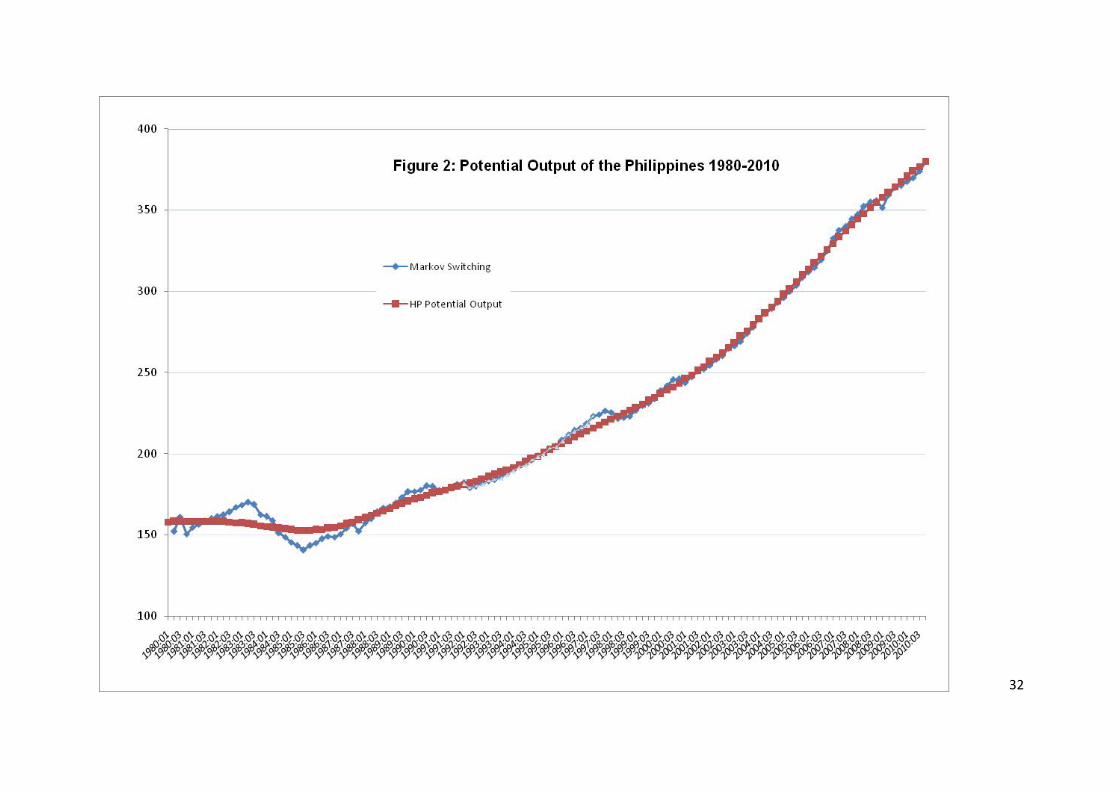
32