Embed Size (px)
Citation preview
1
WWW.ZARGON.CA
ASP Project Update
April 18, 2013
Advisory – Forward-Looking Information
Forward-Looking Statements - This presentation offers our assessment of Zargon's future plans and operations as at April 18, 2013, and contains forward-looking statements. Such statements are generally identified by the use of words such as "anticipate", "continue", "estimate", "expect", "forecast", "may", "will", "project", "should", "plan", "intend", "believe" and similar expressions (including the negatives thereof). In particular, this presentation contains forward-looking information as to Zargon’s corporate strategy and business plans, Zargon’s oil exploration project inventory and development plans, Zargon’s dividend policy and the amount of future dividends, future commodity prices, Zargon’s expectation for uses of funds from financing, Zargon’s capital expenditure program and the allocation and the sources of funding thereof, Zargon’s cash flow and dividend model and the assumptions contained therein and the results there from, anticipated payout rates, 2012 production and other guidance and the assumptions contained therein, estimated tax pools, Zargon’s reserve estimates, Zargon’s hedging policies, Zargon’s drilling, development and exploitation plans and projects and the results there from and Zargon’s ASP project plans, capital expenditures, costs and the results therefrom. By their nature, forward-looking statements are subject to numerous risks and uncertainties, some of which are beyond our control, including such as those relating to results of operations and financial condition, general economic conditions, industry conditions, changes in regulatory and taxation regimes, volatility of commodity prices, escalation of operating and capital costs, currency fluctuations, the availability of services, imprecision of reserve estimates, geological, technical, drilling and processing problems, environmental risks, weather, the lack of availability of qualified personnel or management, stock market volatility, the ability to access sufficient capital from internal and external sources and competition from other industry participants for, among other things, capital, services, acquisitions of reserves, undeveloped lands and skilled personnel. Risks are described in more detail in our Annual Information Form, which is available on our website. Forward-looking statements are provided to allow investors to have a greater understanding of our business.
You are cautioned that the assumptions, including, among other things, future oil and natural gas prices; future capital expenditure levels; future production levels; future exchange rates; the cost of developing and expanding our assets; our ability to obtain equipment in a timely manner to carry out development activities; our ability to market our oil and natural gas successfully to current and new customers; the impact of increasing competition; our ability to obtain financing on acceptable terms; and our ability to add production and reserves through our development and acquisition activities used in the preparation of such information, although considered reasonable at the time of preparation, may prove to be imprecise and, as such, undue reliance should not be placed on forward-looking statements. Our actual results, performance, or achievement could differ materially from those expressed in, or implied by, these forward-looking statements. We can give no assurance that any of the events anticipated will transpire or occur, or if any of them do, what benefits we will derive from them. The forward-looking information contained in this presentation is expressly qualified by this cautionary statement. Our policy for updating forward-looking statements is that Zargon disclaims, except as required by law, any intention or obligation to update or revise any forward-looking statements, whether as a result of new information, future events or otherwise.
Barrels of Oil Equivalent - Natural gas is converted to a barrel of oil equivalent (“Boe”) using six thousand cubic feet of gas to one barrel of oil. In certain circumstances, natural gas liquid volumes have been converted to a thousand cubic feet equivalent (“Mcfe”) on the basis of one barrel of natural gas liquids to six thousand cubic feet of gas. Boes and Mcfes may be misleading, particularly if used in isolation. A conversion ratio of one barrel to six thousand cubic feet of natural gas is based on an energy equivalency conversion method primarily applicable at the burner tip and does not represent a value equivalency at the wellhead. Given that the value ratio based on the current price of crude oil as compared to natural gas is significantly different from the energy equivalency of 6:1, utilizing a conversion ratio on a 6:1 basis may be misleading as an indication of value.
The estimates of reserves and future net revenue for individual properties may not reflect the same confidence level as estimates of reserves and future net revenue for all properties, due to the effects of aggregation. Estimated reserve values disclosed in this presentation do not represent fair market value. Discovered Petroleum Initially-In-Place (“DPIIP”) is that quantity of petroleum that is estimated, as of a given date, to be contained in known accumulations prior to production. The recoverable portion of discovered petroleum initially in place includes production, reserves, and contingent resources; the remainder is unrecoverable.
The aggregate of the exploration and development costs incurred in the most recent financial year and the change during that year in estimated future development costs generally will not reflect total finding and development costs related to reserves additions for that year.
2
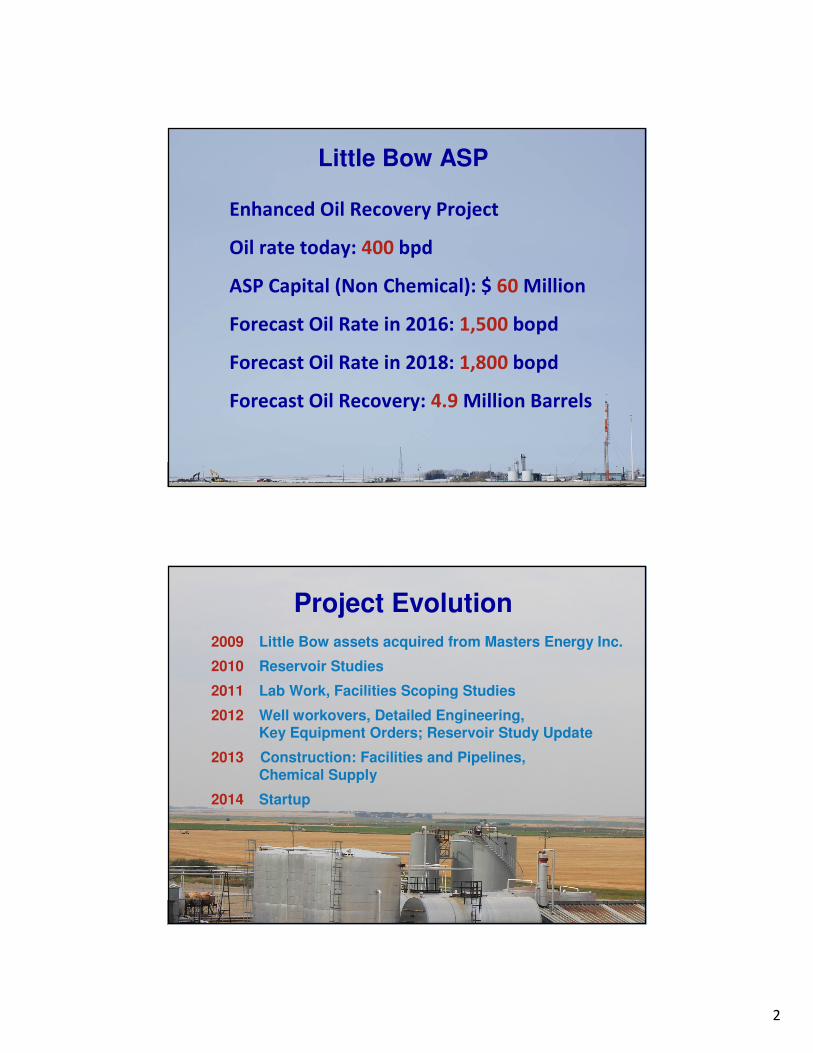
Little Bow ASP
Enhanced Oil Recovery Project
Oil rate today: 400 bpd
ASP Capital (Non Chemical): $ 60 Million
Forecast Oil Rate in 2016: 1,500 bopd
Forecast Oil Rate in 2018: 1,800 bopd
Forecast Oil Recovery: 4.9 Million Barrels
2009 Little Bow assets acquired from Masters Energy Inc.
2010 Reservoir Studies
2011 Lab Work, Facilities Scoping Studies
2012 Well workovers, Detailed Engineering,Key Equipment Orders; Reservoir Study Update
2013 Construction: Facilities and Pipelines, Chemical Supply
2014 Startup
Project Evolution
3
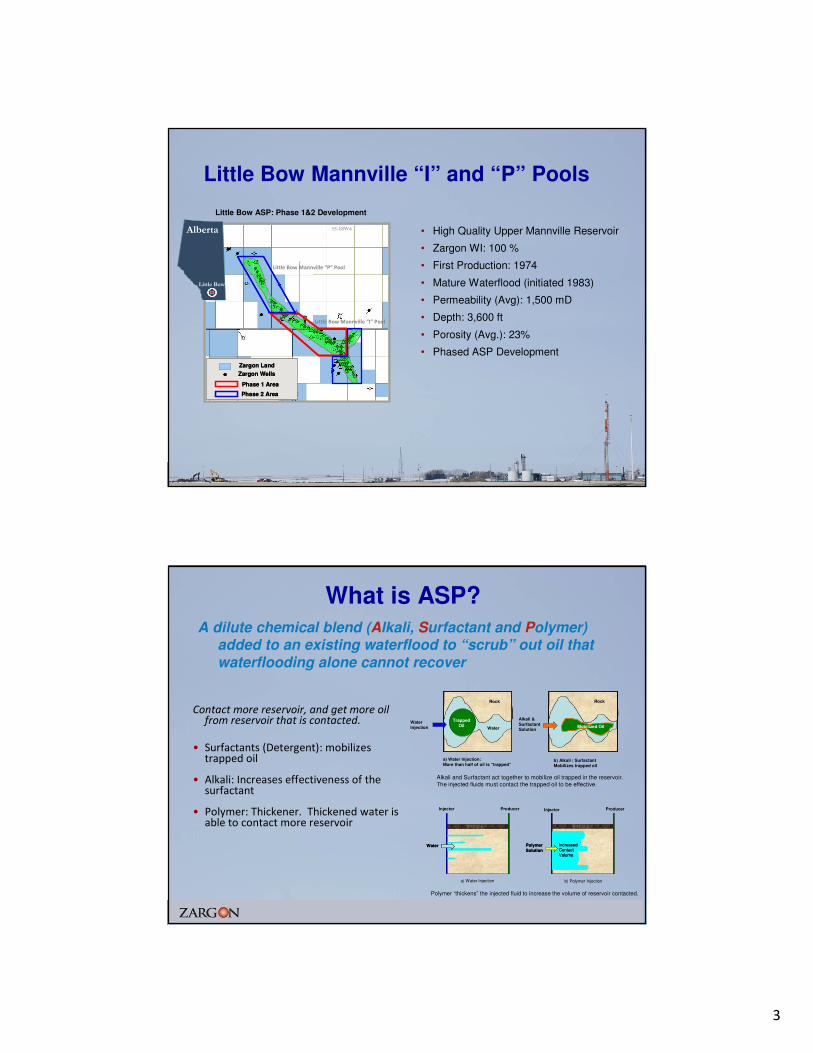
Little Bow Mannville “I” and “P” Pools
Little Bow ASP: Phase 1&2 Development
Little Bow
Alberta 15-18W4
Zargon Land
Zargon Wells
Zargon Land
Zargon Wells
Phase 1 Area
Phase 2 Area
Phase 1 Area
Phase 2 Area
Little Bow Mannville “P” Pool
Little Bow Mannville “I” Pool
• High Quality Upper Mannville Reservoir
• Zargon WI: 100 %
• First Production: 1974
• Mature Waterflood (initiated 1983)
• Permeability (Avg): 1,500 mD
• Depth: 3,600 ft
• Porosity (Avg.): 23%
• Phased ASP Development
What is ASP?
Contact more reservoir, and get more oil from reservoir that is contacted.
• Surfactants (Detergent): mobilizes trapped oil
• Alkali: Increases effectiveness of the surfactant
• Polymer: Thickener. Thickened water is able to contact more reservoir
Polymer “thickens” the injected fluid to increase the volume of reservoir contacted.
Injector Producer
WaterWater
Injector Producer
Polymer
Solution
IncreasedContactVolume
Polymer
Solution
IncreasedContactVolume
a) Water Injection b) Polymer Injection
RockRock
a) Water Injection:More than half of oil is “trapped”
b) Alkali / SurfactantMobilizes trapped oil
Alkali and Surfactant act together to mobilize oil trapped in the reservoir. The injected fluids must contact the trapped oil to be effective.
Water Injection
TrappedOil
Water
RockRock
Mobilized Oil
Alkali & SurfactantSolution
A dilute chemical blend (Alkali, Surfactant and Polymer) added to an existing waterflood to “scrub” out oil that waterflooding alone cannot recover

4
ASP Chemical Flooding – Injection Sequence
Injection Sequence
1) ASP: A blend of Alkali, Surfactant and Polymer mobilizes trapped oil
2) Polymer “Push”: Polymer solution displaces mobilized oil to producing wells
3) Terminal Waterflood: Completes the displacement
Phase 1 ASP Polymer Waterflood
Phase 2 ASP Polymer Waterflood
20212017 2018 2019 20202013 2014 2015 2016
Canadian ASP Projects
In Progress
Scheme Approved
Edmonton
Lethbridge
Calgary
Medicine Hat
Grande Prairie Mooney
(Black Pearl)
2011
Coleville
(Penn West)
2011Suffield
(Cenovus)
2007
Taber South (Husky)
2006
Taber (Husky)
2008
Grand Forks
(CNRL)
Strathmore
(Terrex)
Battrum
(Hyak Energy)Fosterton
(Husky)
2012 Gull Lake
(Husky)
2009
Instow
(Talisman)
2007/11
Little Bow (Zargon)
Alberta Sask.
Bone Creek
(Husky)
5
100
1,000
10,000
100,000
1964 1968 1972 1976 1980 1984 1988 1992 1996 2000 2004 2008 2012
Oil
Pro
du
ctio
n &
Wa
ter
Inje
ctio
n (b
pd
)
0%
1%
10%
100%
Oil C
ut (%
)
Data to Jan - 2013
Injection
Oil Cut
Oil Rate
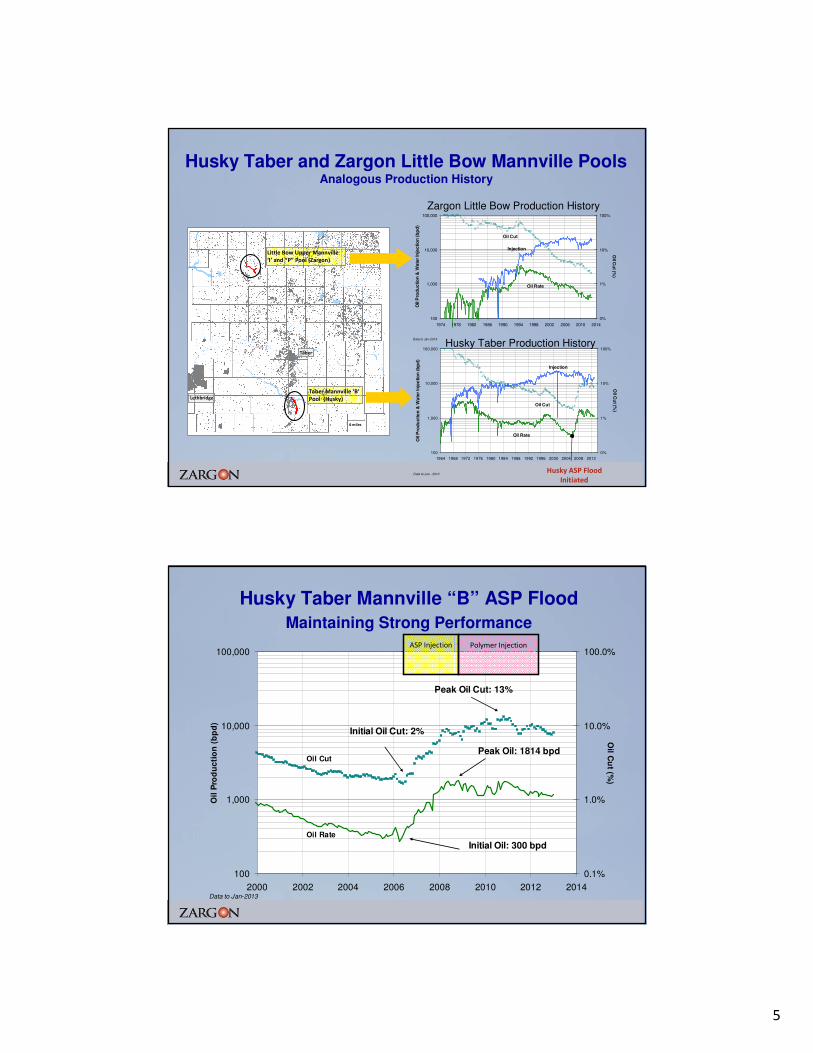
Husky Taber and Zargon Little Bow Mannville PoolsAnalogous Production History
Lethbridge
Taber Mannville ‘B’
Pool (Husky)
Little Bow Upper Mannville
‘I’ and “P” Pool (Zargon)
6 miles
Taber
Lethbridge
Taber Mannville ‘B’
Pool (Husky)
Little Bow Upper Mannville
‘I’ and “P” Pool (Zargon)
6 miles
Taber
Zargon Little Bow Production History
Husky ASP Flood
Initiated
Husky Taber Production History
100
1,000
10,000
100,000
1974 1978 1982 1986 1990 1994 1998 2002 2006 2010 2014
Oil
Pro
du
cti
on
& W
ate
r In
jec
tio
n (
bp
d)
0%
1%
10%
100%
Oil C
ut (%
)
Data to Jan-2013
Injection
Oil Cut
Oil Rate
100
1,000
10,000
100,000
2000 2002 2004 2006 2008 2010 2012 2014
Oil
Pro
du
cti
on
(b
pd
)
0.1%
1.0%
10.0%
100.0%
Oil C
ut (%
)
Data to Jan-2013
Oil Cut
Oil Rate
Initial Oil: 300 bpd
Peak Oil: 1814 bpd
Peak Oil Cut: 13%
Initial Oil Cut: 2%
ASP Injection Polymer Injection
Husky Taber Mannville “B” ASP Flood
Maintaining Strong Performance
6
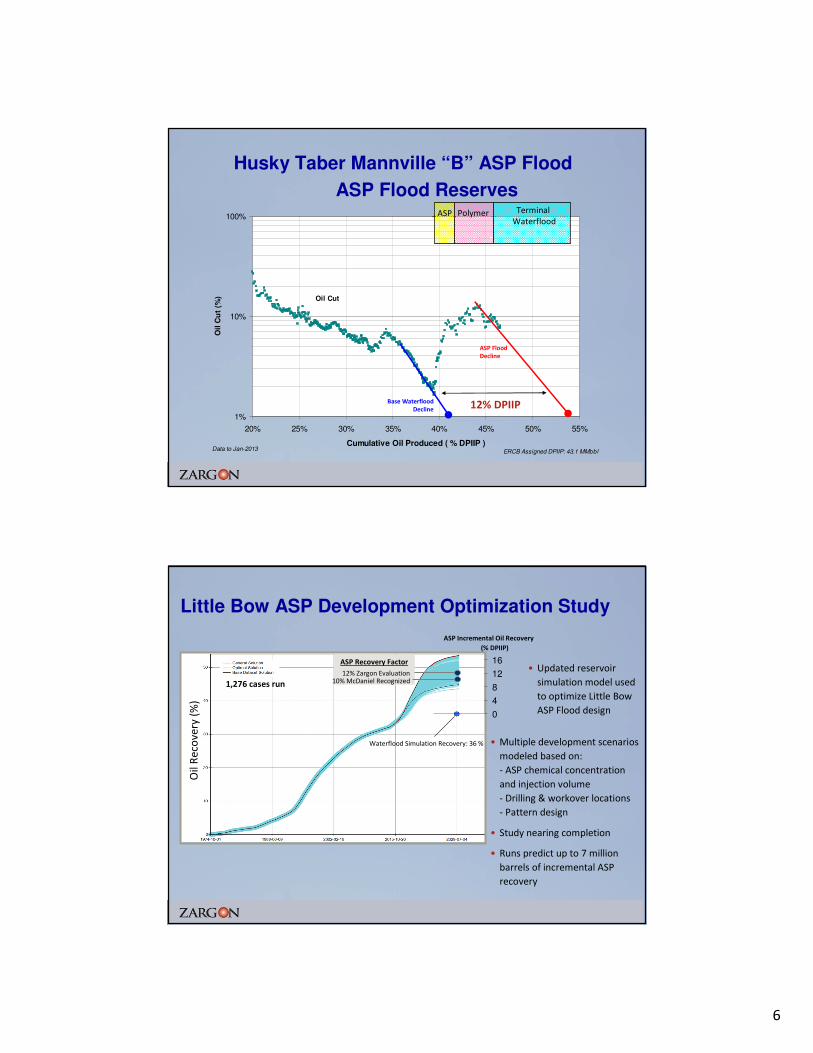
1%
10%
100%
20% 25% 30% 35% 40% 45% 50% 55%
Cumulative Oil Produced ( % DPIIP )
Oil
Cu
t (%
)
Data to Jan-2013
Oil Cut
ERCB Assigned DPIIP: 43.1 MMbbl
Terminal
WaterfloodASP Polymer
12% DPIIPBase Waterflood
Decline
ASP Flood
Decline
Husky Taber Mannville “B” ASP Flood
ASP Flood Reserves
• Multiple development scenarios
modeled based on:
- ASP chemical concentration
and injection volume
- Drilling & workover locations
- Pattern design
• Study nearing completion
• Runs predict up to 7 million
barrels of incremental ASP
recovery
Little Bow ASP Development Optimization Study
Oil
Re
cove
ry (
%)
Waterflood Simulation Recovery: 36 %
1,276 cases run
ASP Recovery Factor
10% McDaniel Recognized12% Zargon Evaluation
0
4
8
12
16
ASP Incremental Oil Recovery
(% DPIIP)
• Updated reservoir
simulation model used
to optimize Little Bow
ASP Flood design
7
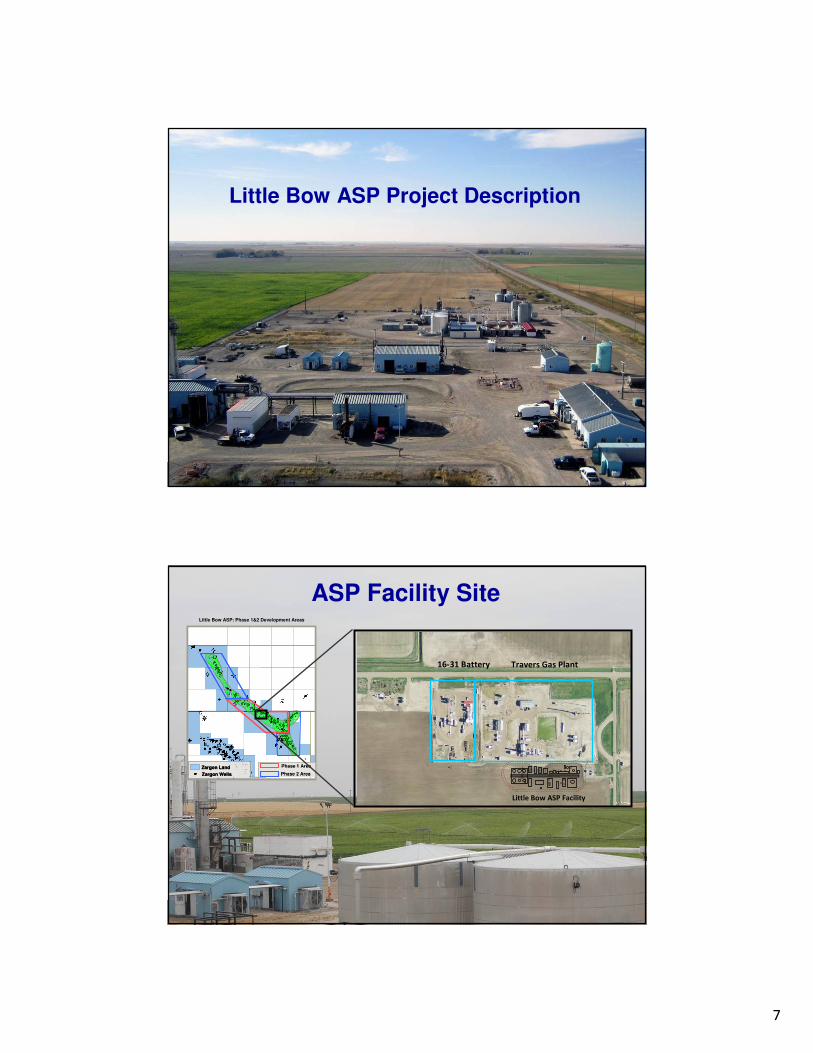
Little Bow ASP Project Description
ASP Facility Site
Travers Gas Plant16-31 Battery
Zargon Land
Zargon Wells
Zargon Land
Zargon Wells
Zargon Land
Zargon Wells
Phase 1 Area
Phase 2 Area
Phase 1 Area
Phase 2 Area
Little Bow ASP: Phase 1&2 Development Areas
Little Bow ASP Facility
8
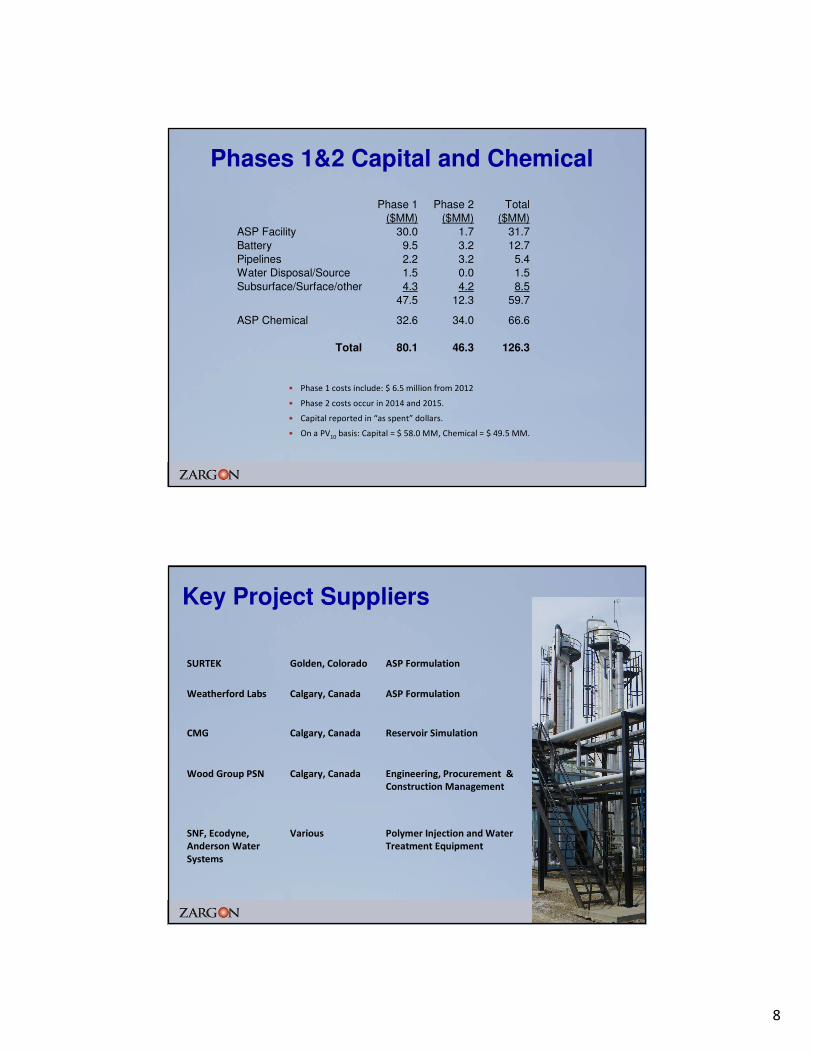
Phases 1&2 Capital and Chemical
• Phase 1 costs include: $ 6.5 million from 2012
• Phase 2 costs occur in 2014 and 2015.
• Capital reported in “as spent” dollars.
• On a PV10 basis: Capital = $ 58.0 MM, Chemical = $ 49.5 MM.
Phase 1 Phase 2 Total($MM) ($MM) ($MM)
ASP Facility 30.0 1.7 31.7
Battery 9.5 3.2 12.7
Pipelines 2.2 3.2 5.4Water Disposal/Source 1.5 0.0 1.5
Subsurface/Surface/other 4.3 4.2 8.5
47.5 12.3 59.7
ASP Chemical 32.6 34.0 66.6
Total 80.1 46.3 126.3
Key Project Suppliers
Polymer Injection and Water
Treatment Equipment
VariousSNF, Ecodyne,
Anderson Water
Systems
Engineering, Procurement &
Construction Management
Calgary, CanadaWood Group PSN
Reservoir SimulationCalgary, CanadaCMG
ASP FormulationCalgary, CanadaWeatherford Labs
ASP FormulationGolden, ColoradoSURTEK
9
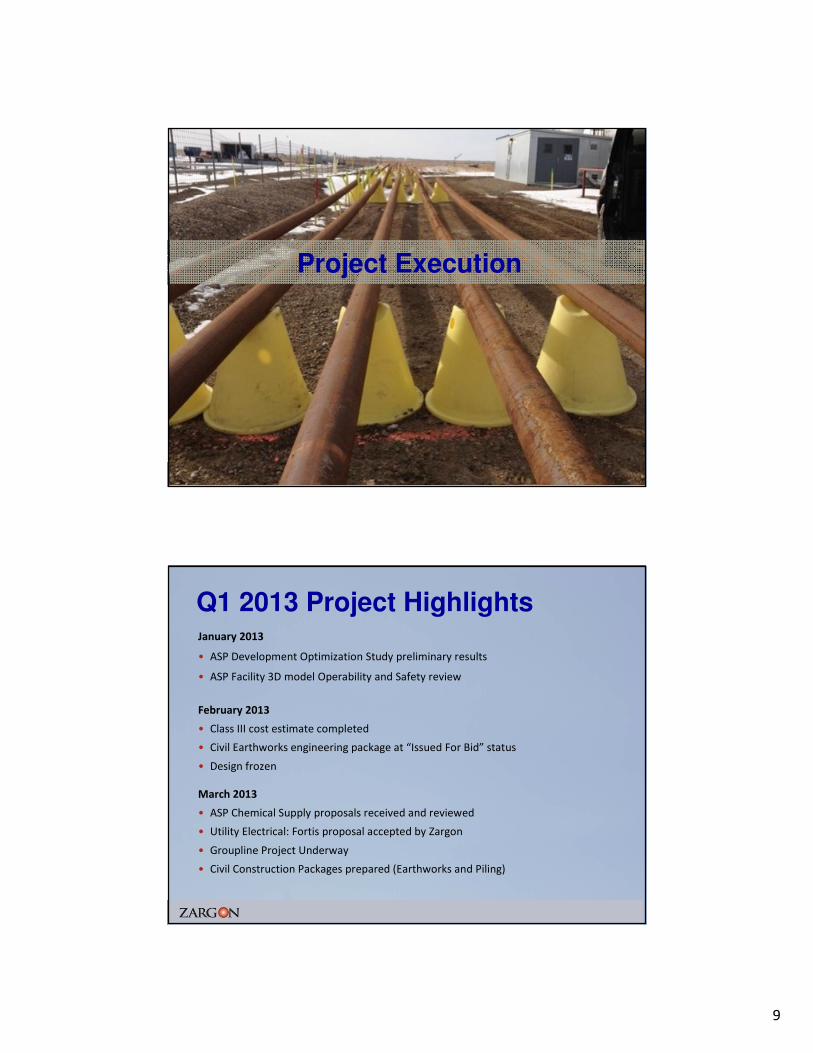
Project Execution
January 2013
• ASP Development Optimization Study preliminary results
• ASP Facility 3D model Operability and Safety review
February 2013
• Class III cost estimate completed
• Civil Earthworks engineering package at “Issued For Bid” status
• Design frozen
March 2013
• ASP Chemical Supply proposals received and reviewed
• Utility Electrical: Fortis proposal accepted by Zargon
• Groupline Project Underway
• Civil Construction Packages prepared (Earthworks and Piling)
Q1 2013 Project Highlights

10
Zargon Little Bow ASP Facility16-31-014-18W4April 2013
• ERCB regulatory approval
for construction
• Award Civil earthworks and
piling contracts
• Civil earthworks commences
• Groupline project completed
• Positioned to award ASP chemical contracts
May 2013
• Award Mechanical/Electrical contact
• Piling commences
Upcoming Milestones
Project Economics
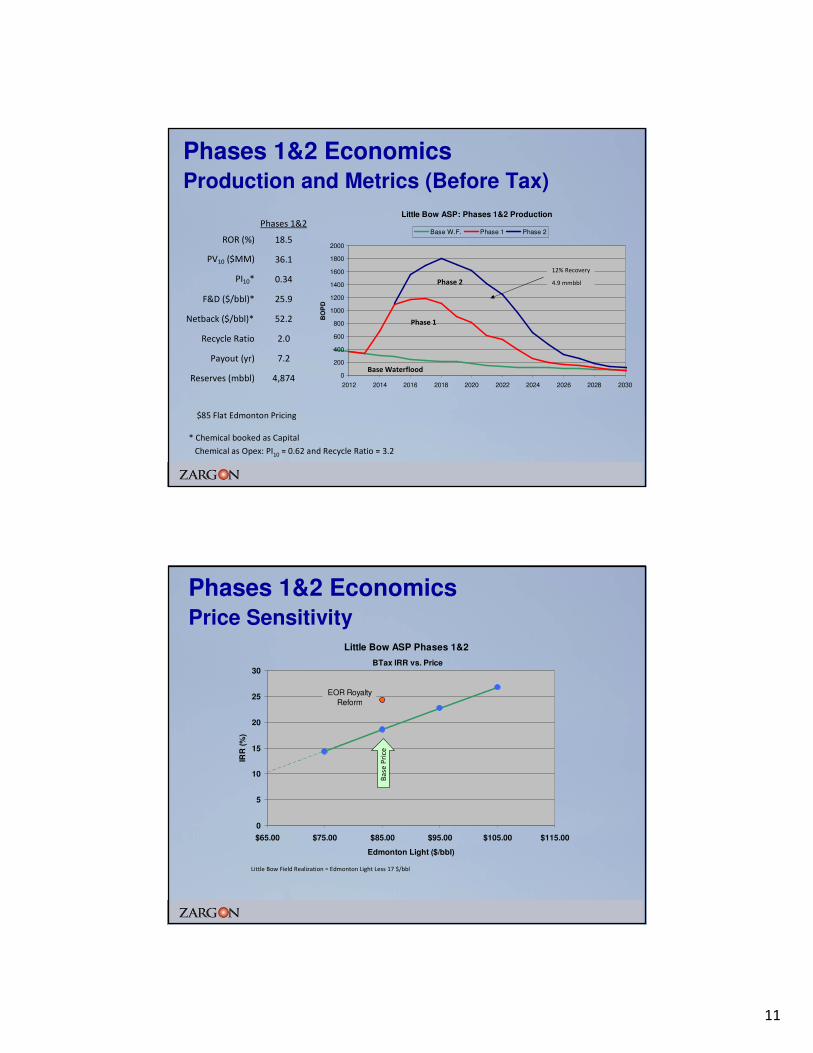
11
Little Bow ASP: Phases 1&2 Production
0
200
400
600
800
1000
1200
1400
1600
1800
2000
2012 2014 2016 2018 2020 2022 2024 2026 2028 2030
BO
PD
Base W.F. Phase 1 Phase 2
Phases 1&2 Economics Production and Metrics (Before Tax)
* Chemical booked as Capital
$85 Flat Edmonton Pricing
Chemical as Opex: PI10 = 0.62 and Recycle Ratio = 3.2
12% Recovery
4.9 mmbbl
Phase 1
Phase 2
Base Waterflood
Phases 1&2
ROR (%) 18.5
PV10 ($MM) 36.1
PI10* 0.34
F&D ($/bbl)* 25.9
Netback ($/bbl)* 52.2
Recycle Ratio 2.0
Payout (yr) 7.2
Reserves (mbbl) 4,874
BTax IRR vs. Price
0
5
10
15
20
25
30
$65.00 $75.00 $85.00 $95.00 $105.00 $115.00
Edmonton Light ($/bbl)
IRR
(%
)
Little Bow ASP Phases 1&2
EOR Royalty
Reform
Phases 1&2 EconomicsPrice Sensitivity
Ba
se P
rice
Little Bow Field Realization = Edmonton Light Less 17 $/bbl
12
Followup Development: Phases 3&4
Phases 1 & 2
8100LB “P” Pool
Followup
781C8C / X8X
1968U&W Unit
70Total
5100 MM Unit
31100LB “I” Pool
W.I. DPIIP*
(mmbbl)ZAR
W.I. (%)
* ERCB DPIIP Data
Little Bow Phases 1 - 4 Injection Schedule
Phase 1 ASP Polymer Waterflood
Phase 2 ASP Polymer Waterflood
Phase 3 ASP Polymer Waterflood
Phase 4 ASP Polymer
2021 2022 20232017 2018 2019 20202013 2014 2015 2016
ASP Development Forecast - Phases 1- 4
0
500
1000
1500
2000
2500
3000
2012 2014 2016 2018 2020 2022 2024 2026 2028 2030
BO
PD
Base W.F. Phase 1 Phase 2 Phase 3 Phase 4
Zargon W.I. Production
Phases 3&4 Benefit From Existing Facility
Phases 1&2
12% Recovery
Phases 3&4
11% Recovery
Working Interest Capital and Chemical Costs ($ Millions)
Phases 1&2 Phases 3&4
Capital 59.8 15.6
Chemical 66.6 53.4
Little Bow ASP: Phases 1&2 and 1-4
Phases 1&2 Phases 1-4
IRR (%) 18.5 21.1
PV10 ($MM) 36.1 67.0
PI10* 0.34 0.46
F&D ($/bbl)* 25.9 23.8
Netback ($/bbl)* 52.2 53.0
Recycle Ratio* 2.0 2.2
Payout (yr) 7.2 7.9
Reserves (mbbl) 4,874 8,189
* Injectant booked as Capital
EDM Flat 85 Pricing
Zargon Net W.I.
13
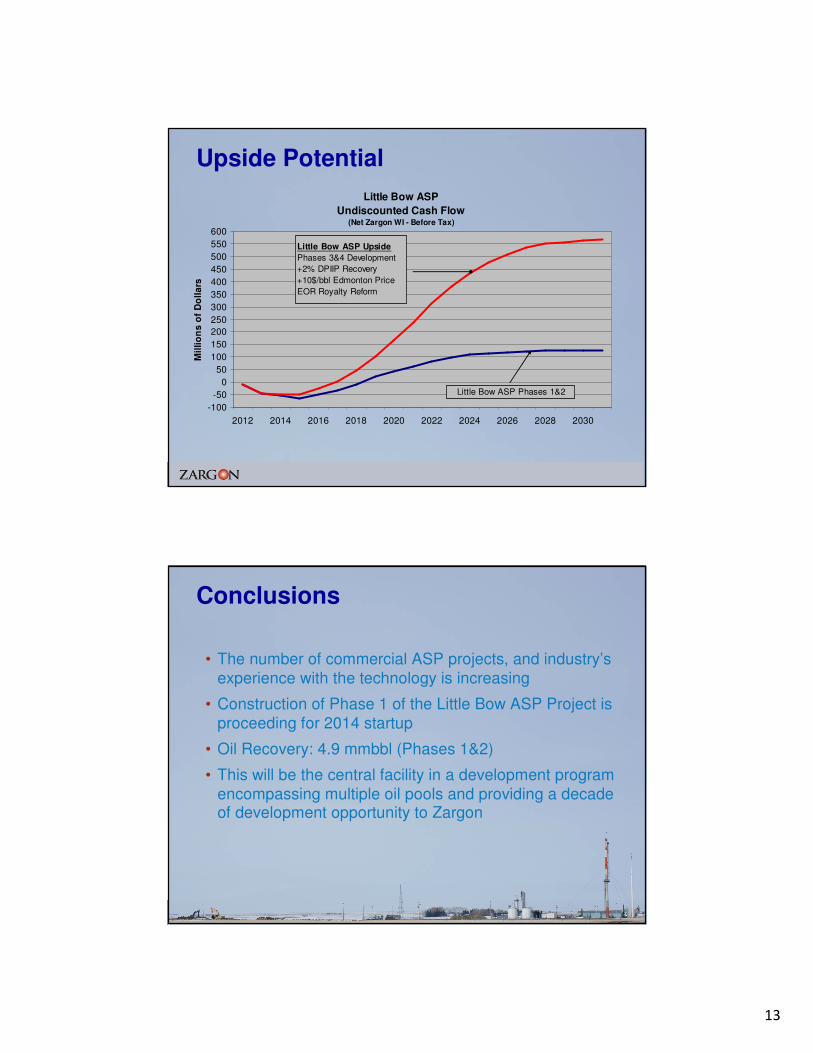
Upside Potential
Little Bow ASP
Undiscounted Cash Flow (Net Zargon WI - Before Tax)
-100
-50
0
50
100
150
200
250
300
350
400
450
500
550
600
2012 2014 2016 2018 2020 2022 2024 2026 2028 2030
Mil
lio
ns
of
Do
lla
rs
Little Bow ASP Phases 1&2
Little Bow ASP Upside
Phases 3&4 Development
+2% DPIIP Recovery
+10$/bbl Edmonton Price
EOR Royalty Reform
Conclusions
• The number of commercial ASP projects, and industry’s experience with the technology is increasing
• Construction of Phase 1 of the Little Bow ASP Project is proceeding for 2014 startup
• Oil Recovery: 4.9 mmbbl (Phases 1&2)
• This will be the central facility in a development program encompassing multiple oil pools and providing a decade of development opportunity to Zargon

14
WWW.ZARGON.CA
ASP Project Update
April 18, 2013
![SAI Life Forum May 2007[1] · • Consultation on ASP LA-11 and ASP LA-12 . Update on Committees Richard O’Sullivan. ... • Profession commitment ( e.g. papers exist) ... Stephen](https://img.pdfslide.us/doc/110x75/5f48ba8ed9814d2e693a71b9/sai-life-forum-may-20071-a-consultation-on-asp-la-11-and-asp-la-12-update.jpg)