Embed Size (px)
Citation preview

ASN DIALYSIS CURRICULUM
Insert Graphic for DAG curriculum on first slide

This image cannot currently be displayed.
Monitoring and Surveillance of Vascular Access
Tushar Vachharajani, MD, FASNChief, Nephrology SectionProfessor of NephrologyW. G. (Bill) Hefner VA Medical CenterNorth Carolina
2

This image cannot currently be displayed.
Objectives
• Define Monitoring of vascular access and differentiate from Surveillance
• Discuss surveillance techniques• Discuss available evidence on access
assessment tools

This image cannot currently be displayed.
Current Vascular Access Options
• AV fistula and AV graft are considered superior to catheter access
• Remarkable success has been achieved in increasing prevalence of AV fistula
• However, vascular access complications are common and result in hospitalization, mortality and expense
• Guidelines suggest various methods to maintain patency of vascular access

This image cannot currently be displayed.
Common Issues With Vascular Access
• Primary failure due to poor maturation of AVF• ~ 60% failure rate -NIH sponsored DAC study, JAMA 2008
• Stenosis due to neo-intimal hyperplasia in established access
• AVG: Mainly at the venous anastomosis• AVF: Arterial (inflow) anastomosis, venous (outflow) track
• Thrombosis as a result of stenosis• AVG >AVF• Each thrombotic event reduces the survival of the access
• Central vein stenosis:• ‘ ‘ incidence with subclavian catheters• ‘ with number of central catheters• Needs recurrent intervention to maintain patency

This image cannot currently be displayed.
Definitions
Monitoring— evaluation of the vascular access by means of physical examination to detect physical signs that suggest the presence of dysfunction
Surveillance— Involves periodic evaluation of access by special tests requiring special instruments to detect dysfunction
•Access flow •Intra access pressure and resistance•Doppler duplex ultrasound imaging

This image cannot currently be displayed.
Rationale for Access Assessment
• Stenosis is almost always a prerequisite for access thrombosis
• Preemptive detection and correction of stenosis should reduce likelihood of access thrombosis
• Results of intervention after thrombosis of access are inferior to the results of pre-emptive intervention (angioplasty)
• Non invasive monitoring can predict such stenosis with a high positive predictive value

This image cannot currently be displayed.
Goals of Access Assessment
• Early detection of anatomically severe, and physiologically significant stenosis within the access
• To be able to correct the stenosis and prevent thrombosis- which requires diagnostic testing and intervention

This image cannot currently be displayed.
K/DOQI Clinical Practice Guideline 4 – Treatment of Stenosis
Clinical criteria•“ Qa <600 ml/min AVG•“Qa <500 ml/min AVF•Elevated intra-access venous pressures
•Abnormal PE
Angiogram •>50% stenosis
Prospective trend analysis can detect dysfunctionbetter compared to single test value

This image cannot currently be displayed.
Potential Advantages with Access Assessment
• Keep permanent vascular access patent• Improve dialysis clearance • Minimize or avoid central venous catheter use• Improve Quality of Life for patients and
dialysis staff

This image cannot currently be displayed.
Goals of Monitoring and Surveillance
• New AVF• Identify primary failures• Plan for early interventions• Plan for surgical revision/new access
• Established AVF/AVG• Early detection of problem to prevent
• Thrombosis
• Prolong patency
• Inadequate dialysis treatment

This image cannot currently be displayed.
When to Start Monitoring
• Soon after creation of AVF to follow maturation
• Throughout the life of AV access (both AVF and AVG)- to maintain patency and adequate function

This image cannot currently be displayed.
Methods of Monitoring
• Physical Examination • (inspection, palpation, auscultation) to detect physical signs of
dysfunction or loss of patency
• Measurement of delivery of dialysis dose• Presence of clinical evidence of dysfunction
• difficult cannulation, prolonged bleeding after dialysis, swelling of
extremity, aneurysm formation of access
This image cannot currently be displayed.
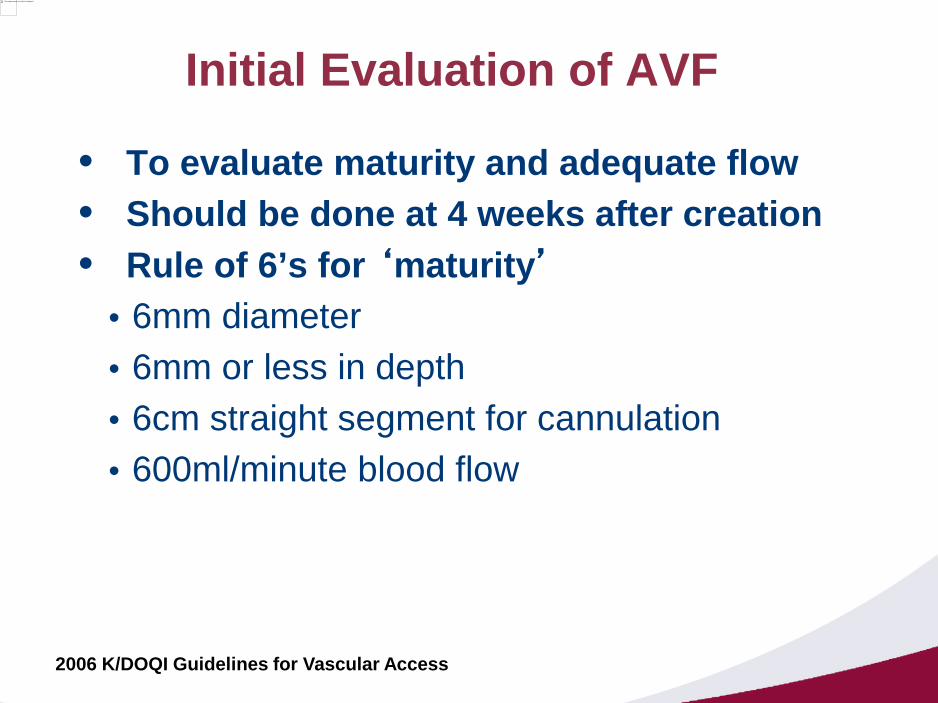
Initial Evaluation of AVF
• To evaluate maturity and adequate flow• Should be done at 4 weeks after creation• Rule of 6’s for ‘maturity’
• 6mm diameter• 6mm or less in depth• 6cm straight segment for cannulation• 600ml/minute blood flow
2006 K/DOQI Guidelines for Vascular Access

This image cannot currently be displayed.
Markers of an Adequate AVF
• Fistula size >4mm has 89% chance of successful use vs. 44% if smaller in size
• Fistula flow >500ml has 84% chance of successful use vs. 43% if less
• Combining the two- 95% vs. 33% success if criteria were not met
Robbin et al. Radiology 225:59-64, 2002

This image cannot currently be displayed.
Sensitivity and Specificity of Monitoring (Physical Examination)
Diagnosis Sens Spec PE + Angio
Inflow stenosis 85% 71% 83%
Outflow Stenosis 92% 86% 89%
Coexisting inflow-outflow stenosis
68% 84% 79%
Central vein stenosis 13% 99% poor
• 142 consecutive patients• Upper arm AVF 95 (67%)• Forearm AVF 47 (33%)
Asif et al CJASN 2:1191;2007
This image cannot currently be displayed.
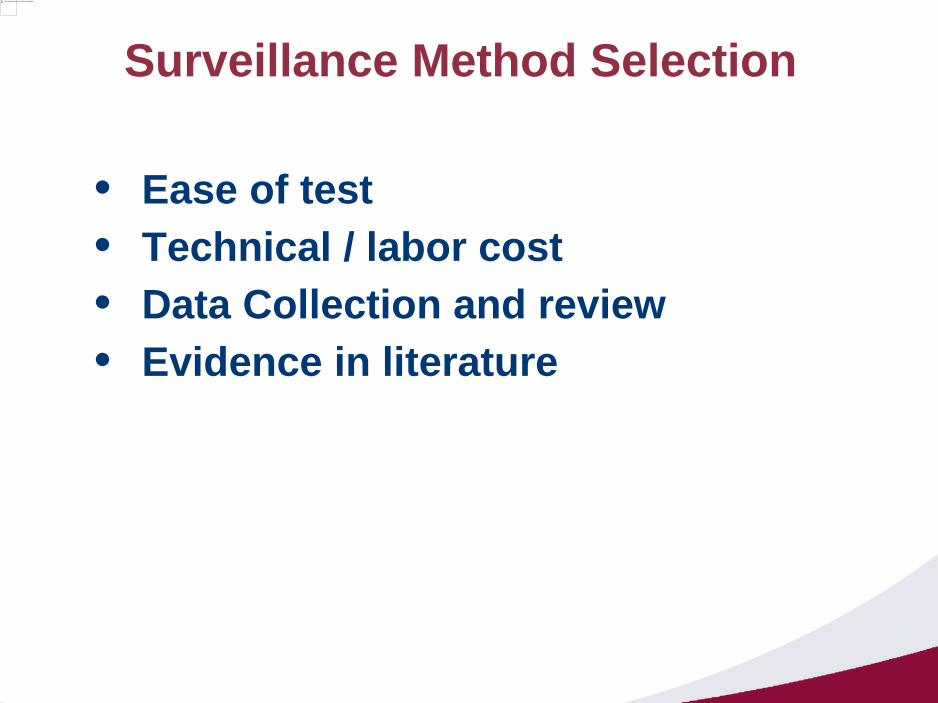
Surveillance Method Selection
• Ease of test• Technical / labor cost• Data Collection and review• Evidence in literature

This image cannot currently be displayed.
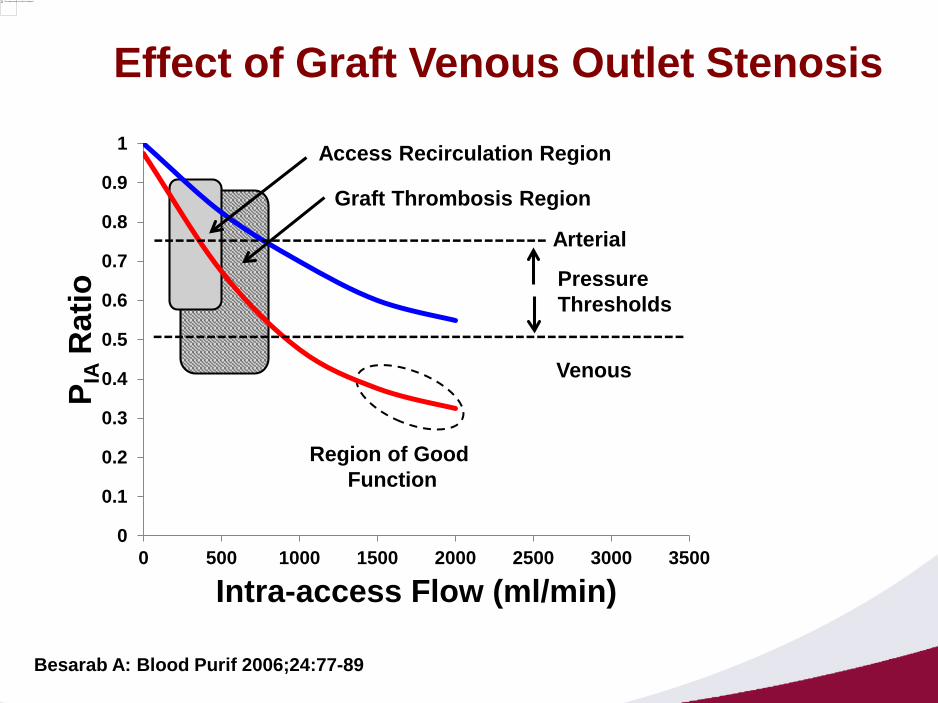
Flow – Pressure Relationships
• ‘ access pressures indicates development of stenosis
• Venous access pressures can change with MAP• VAPR = VAP/MAP
2006 K/DOQI Guidelines for Vascular Access
This image cannot currently be displayed.
Besarab A: Blood Purif 2006;24:77-89
0
0.1
0.2
0.3
0.4
0.5
0.6
0.7
0.8
0.9
1
0 500 1000 1500 2000 2500 3000 3500
PIA
Rat
io
Intra-access Flow (ml/min)
Effect of Graft Venous Outlet Stenosis
--------------------------------------------------
-------------------------------------
Access Recirculation Region
Graft Thrombosis Region
Arterial
Venous
Pressure Thresholds
Region of Good Function
This image cannot currently be displayed.
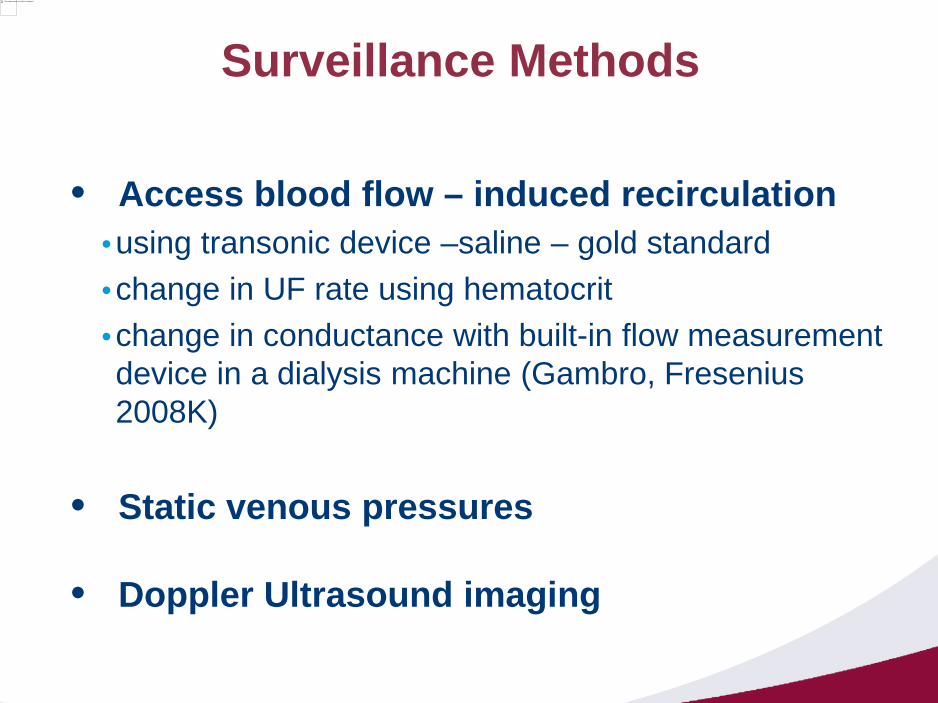
Surveillance Methods
• Access blood flow – induced recirculation•using transonic device –saline – gold standard•change in UF rate using hematocrit• change in conductance with built-in flow measurement device in a dialysis machine (Gambro, Fresenius 2008K)
• Static venous pressures
• Doppler Ultrasound imaging

This image cannot currently be displayed.
0.61
0.50.48
0.7
0.49
0.2
0.28
0.17
0.28 0.29
0
0.1
0.2
0.3
0.4
0.5
0.6
0.7
0.8
Schwab 1989DynamicPressure
Besarab 1995Static
Pressure
Safa 1996Doppler US
Allon 1998Flow andPressure
Cayco 1998DynamicPressure
Th
orm
bo
sis
Rat
e (p
er-g
raft
Yea
r
Historical Monitoring
Surveillance for Stenosis
Compilation of Studies using Historical Controls Showing the Effect of Surveillance vs Monitoring
Besarab A: Blood Purif 2006;24:77-89

This image cannot currently be displayed.
Tessitore N et al. Nephrol. Dial. Transplant. 2008;23:3578-3584
Unadjusted Thrombosis-free Survival
• 5 year randomized controlled trial compared blood flow surveillance and preemptive repair of subclinical stenoses(one or both of angioplasty and open surgery) with standard monitoring and intervention based upon clinical criteria alone to determine if the former prolonged the longevity of mature forearm AVFs
• Surveillance with blood pump flow (Qb) monitoring during dialysis sessions and quarterly shunt blood flow (Qa) or recirculation measurements identified 79 AVFs with angiographically proven, significant (>50%) stenosis
• AVFs were randomized to either a control group (intervention done in response to a decline in the delivered ialysis dose or thrombosis; n= 36) or to a pre-emptive treatment group (n=43)

This image cannot currently be displayed.
Tessitore N et al. Nephrol. Dial. Transplant. 2008;23:3578-3584
Unadjusted Thrombosis-free Survival • A Kaplan–Meier analysis showed that preemptive treatment reduced failure
rate (P=0.003) and the Cox hazards model identified treatment (P=0.009) and higher baseline Qa (P. 0.001) as the only variables associated with favourable outcome
• Primary patency rates were higher in treatment than in control AVFs in both functional (P=0.021) and failing subgroups (P=0.005).
• Access survival was significantly higher in pre-emptively treated than in control AVFs (P=0.050), a higher post-intervention Qa being the only variable associated with improved access longevity (P= 0.044).
• Secondary patency rates were similar in pre-emptively treated and control AVFs in both functional (P= 0.059) and failing subgroups (P=0.394).
• Secondary patency was also similar in functional and failing AVFs in controls (P. 0.082), but were higher in pre-emptively treated functional AVFs than in pre-emptively treated failing AVFs (P. 0.033) or in the entire control group (P. 0.019).

This image cannot currently be displayed.
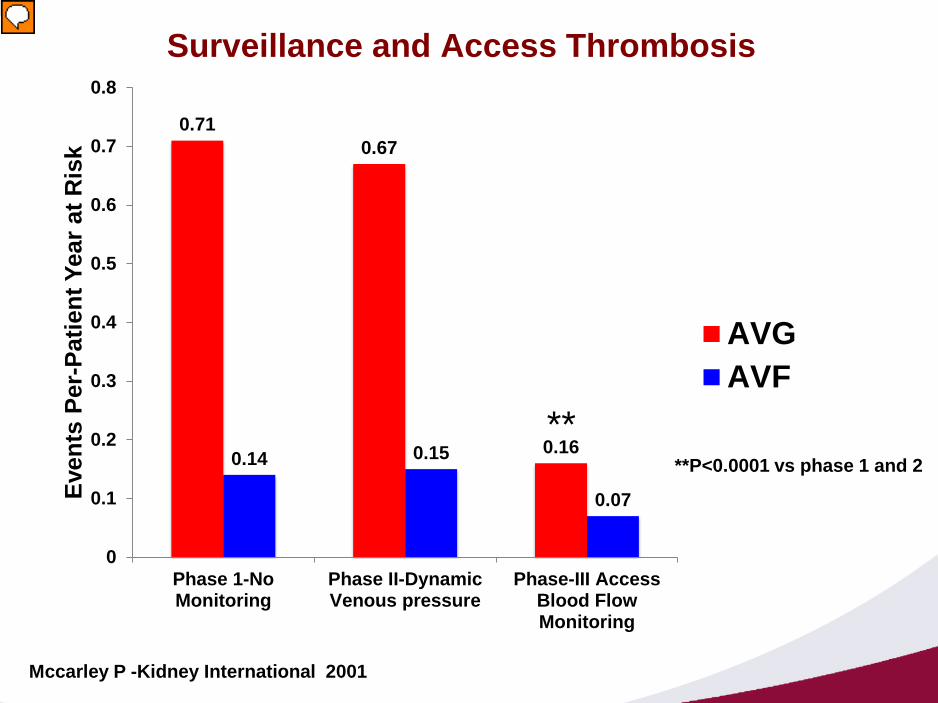
Mccarley P -Kidney International 2001
Surveillance and Access Thrombosis
• A total of 132 chronic hemodialysis patients were treatments, and surgical interventions. Vascular access blood followed prospectively for three consecutive study phases
• Phase 1- 11 months of no monitoring
• Phase 2- 12 months of dynamic venous pressure monitoring
• Phase 3- 10 months of vascular access blood flow monitoring
• All vascular access-related information (thrombosis rate, hospitalization, angiogram, angioplasty, access surgery, thrombectomy, catheter placement, missed treatments) collected during the three study periods
This image cannot currently be displayed.
Mccarley P -Kidney International 2001
Surveillance and Access Thrombosis
0.710.67
0.160.14 0.15
0.07
0
0.1
0.2
0.3
0.4
0.5
0.6
0.7
0.8
Phase 1-NoMonitoring
Phase II-DynamicVenous pressure
Phase-III AccessBlood FlowMonitoring
Eve
nts
Per
-Pat
ien
t Yea
r at
Ris
k
AVGAVF
****P<0.0001 vs phase 1 and 2

This image cannot currently be displayed.
Access Related Event Rates - AVG
1.8
1.6
0.4
0.98
0.86
0.260.29
0.170.07
0
0.2
0.4
0.6
0.8
1
1.2
1.4
1.6
1.8
2
Phase 1 Phase 2 Phase 3
Hospitalization Rate
Dialysis CatheterRateMissed Treatments
*p<0.05 vs Phase 1
** p<0.001 vs Phase 1 and 2
Mccarley P -Kidney International 2001
****
*

This image cannot currently be displayed.
Access related event rates - AVF
0.72
0.47
0.1
0.39
0.27
0.07
0.18
0.06
00
0.1
0.2
0.3
0.4
0.5
0.6
0.7
0.8
Phase 1 Phase 2 Phase 3
Hospitalization RateDialysis Catheter RateMissed Treatments
Mccarley P -Kidney International 2001
** **p<0.05 vs phase 1
**p<0.05 vs phase 1 and 2

This image cannot currently be displayed.
Access Pressure for Surveillance

This image cannot currently be displayed.
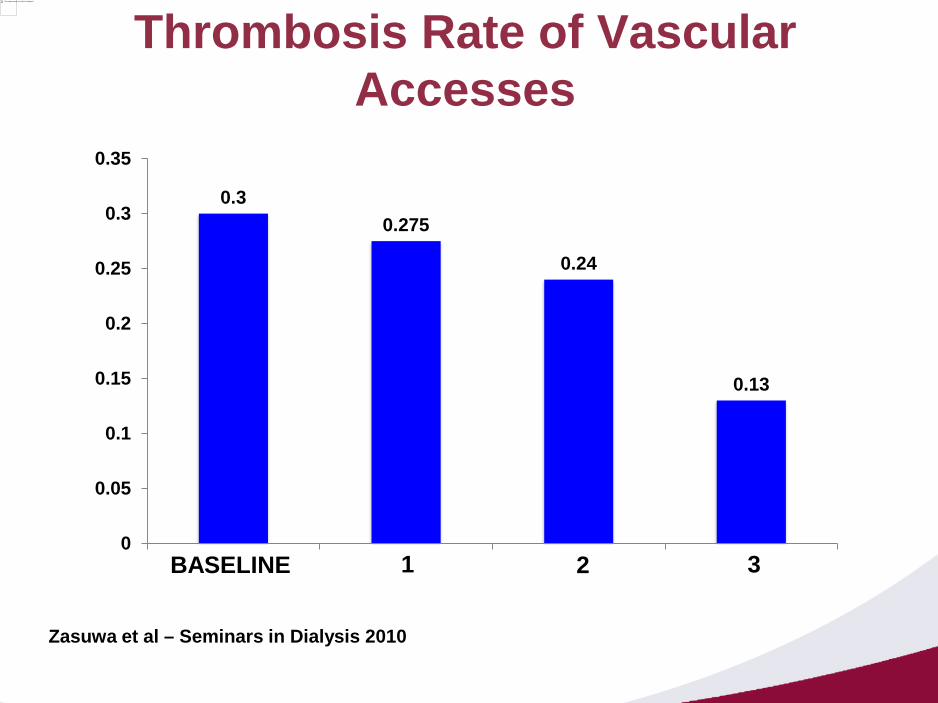
Automated non-invasive Surveillance
• 24 month study study comparing thrombosis rates during a baseline
6-month interval to three subsequent 6-month periods of active surveillance
• Vascular access pressure ratios (VAPR) measured during each dialysis treatment
• Trends were monitored generating alerts
• VAPR > 0.55 was considered significant and referred for interventions
• No special instrument or technical staff was needed
• Thrombosis rate decreased 57% with timely intervention

This image cannot currently be displayed.
Thrombotic Events with Automation
Zasuwa et al – Seminars in Dialysis 2010
26
31
23
11
2119
8 8
5
12
15
3
0
5
10
15
20
25
30
35
40
Baseline 1 2 3
Th
rom
bo
sis
Eve
nts
BIANNUAL INTERVALS
TOTALAVGAVF
This image cannot currently be displayed.
Thrombosis Rate of Vascular Accesses
Zasuwa et al – Seminars in Dialysis 2010
0.30.275
0.24
0.13
0
0.05
0.1
0.15
0.2
0.25
0.3
0.35
BASELINE 1 2 3

This image cannot currently be displayed.
Observational Studies
• Thrombosis rate• Beasarb et al (KI-1995)– 70% “ -static VP• Sands et al (ASAIO-1999)- 6.5 fold “ -Doppler • Hoeben et al (Am J Nep -2003)- 2-fold “ - flow surveillance
• Glazer et al (Ann Vas Surg – 2006) 2-fold “ -flow surveillance
•Improved QOL•Not necessarily prolonged the access life

This image cannot currently be displayed.
Randomized Controlled StudiesName Total No. of
patientsControl Study
PatientsSurveillance
methods tested
Primary Outcome
Results
Sands et al, 1999, ASAIO J
103 41 62 Access Flow, Static venous
pressure
Access thrombosis
Positive
Moist et al, 2003, J Am Soc Nephrol
112 53 59 Access flow, dynamic venous
pressure
Access thrombosis,
loss
Negative
Ram et al, 2003, Am J Kidney Dis
101 34 67 Access flow, stenosis
Access thrombosis,
survival
Negative
Roca-Tey et al, 2004*,
Nefrologia
159 65 94 Access Flow Access Thrombosis
Positive
Malik et al, 2005, Kidney
Int.
192 92 97 Ultrasound Cumulative patency
Positive
Plantinga et al, 2006*, J Vasc
Access.
363 185 178 Multiple Multiple outcomes
Positive
Polkinghorne et al, 2006,
Nephrol Dial Transplant
126 61 65 Ultrasound >50% stenosis Negative
Robbin et al, 2006, Kidney
Int
126 61 65 Ultrasound Graft survival Negative
*Prospective nonrandomized studies

This image cannot currently be displayed.
Randomized Trials with Abnormal Surveillance Results Comparing Intervention vs Observation
Name Total no. of patients
Intervention Observation Surveillancemethods used
Primary outcome
Result
Lumsden et al, 1997, J Vasc Surg.
64 32 32 Color flow duplexscan
Cumulative patency
Negative
Martin et al, 1999, J
Vasc IntervRadiol.
21 8 13 Color flow duplex scan
Virgin graft patency
Positive
Dember et al, 2004,
Kidney Int.
64 32 32 Pressure/systolic blood pressure ratio
Accesssurvival
Negative
Tessitore et al, 2004,
Nephrol Dial Transplant.
79 43 36 Access flow Access survival,
thrombosis
Positive
Scaffaro et al, 2009, J Ultrasound
Med.
108 53 58 Duplex scan Thrombosis Negative

This image cannot currently be displayed.
Drawbacks of Randomized Trials
• Total 12 RCT, 8 AVG and 4 AVF• Small sample size• Population characteristics are not uniform• Variable method of surveillance• Recruitment criteria and randomization is
unclear and not uniform• Primary end point studied is variable

This image cannot currently be displayed.
Summary
• AV access become dysfunctional due to occurrence of stenosis
• Clinical monitoring, primarily through evidence of access dysfunction and physical examination can provide clues to the presence of stenosis
• Monitoring alone is relatively inexpensive and accurate in experienced hands

This image cannot currently be displayed.
Summary
• Conflicting results from observational and RCT studies
• Surveillance works in reducing thrombotic events
• Surveillance works in reducing hospitalization, CVC and missed HD treatment rates
• No definite evidence to suggest that it prolongs access life
• Need adequately powered RCT with a larger sample size

This image cannot currently be displayed.
Final Take Home Message
• Monitoring and surveillance are to be used in combination to achieve the ultimate goal of maintaining access patency
• When done by expert staff on a routine basis, monitoring itself may be sufficient in detecting stenosis, potentially making added surveillance redundant