Embed Size (px)
Citation preview

AS Micro: Showing Good Analysis Skills in the Exam

Be Clear about the Command Words!
Define, Explain, Analyse, ‘Dis/nguish between’ and ‘Outline’ require no evaluaBon! Evaluate, Assess, Discuss, To what extent, Examine do require evaluaBon!

What does analysis mean?
Analysis means explaining a theory or a relaBonship. Or explaining cause and effect Best to analyse step-‐by-‐step using connecBves In doing so, you demonstrate that you are confident in handling some economic theory
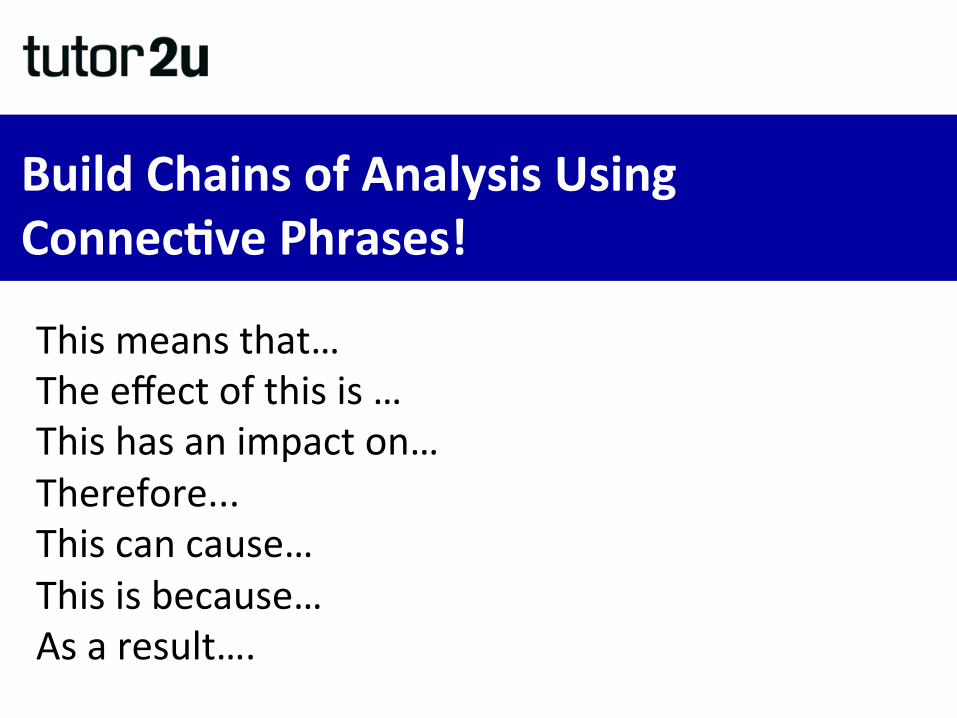
Build Chains of Analysis Using ConnecBve Phrases!
This means that… The effect of this is … This has an impact on… Therefore... This can cause… This is because… As a result….

ConnecBve words – always help analysis and evaluaBon in economics Cause and Effect ContrasBng Qualifying Sequencing Comparing IllustraBng
consequently but however meanwhile likewise such as
because despite unless aGer as in the case of
therefore on the other hand but then equally for instance
thus otherwise if when similarly for example
so unlike although eventually in the same way
instead of on the other hand while
alterna/vely next
whereas before

Analysis Diagrams
Analysis diagrams help to explain the theory Accurate, neat, well-‐drawn analysis diagrams can make a big difference to your script. Take care with them and do lots of pracBce!

Analyse two possible effects of a decision to introduce rent controls into the UK housing market

Analyse two possible effects of a decision to introduce rent controls into the UK housing market
A rent cap is a legally imposed price ceiling limiBng what a landlord can charge. To be effecBve it must be set below the normal free market equilibrium rent. One possible effect is that the supply of properBes available might contract. This is because a rent cap lowers the financial incenBves to let out a property. Then if available supply falls, the rental market will experience excess demand as shown in my analysis diagram. More people wish to rent at these low prices than there are houses available. This is called a disequilibrium. A second effect might be to cause a shadow market to emerge, with tenants paying the legal maximum rent but also being charged extra by landlords for ancillary services such as keys and decoraBon. The landlords want to claw back extra revenue and therefore increase their producer surplus. Consequently the maximum rent may be less than the actual cost of renBng the property.
Knowledge ApplicaBon
Analysis EvaluaBon

Analyse two possible effects of a decision to introduce rent controls into the UK housing market
A rent cap is a legally imposed price ceiling limiBng what a landlord can charge. To be effecBve it must be set below the normal free market equilibrium rent.
Knowledge ApplicaBon
Analysis EvaluaBon

Analyse two possible effects of a decision to introduce rent controls into the UK housing market
A rent cap is a legally imposed price ceiling limiBng what a landlord can charge. To be effecBve it must be set below the normal free market equilibrium rent. One possible effect is that the supply of properBes available might contract. This is because a rent cap lowers the financial incenBves to let out a property. Then if available supply falls, the rental market will experience excess demand as shown in my analysis diagram. More people wish to rent at these low prices than there are houses available. This is called a disequilibrium.
Knowledge ApplicaBon
Analysis EvaluaBon

Analyse two possible effects of a decision to introduce rent controls into the UK housing market
A rent cap is a legally imposed price ceiling limiBng what a landlord can charge. To be effecBve it must be set below the normal free market equilibrium rent. One possible effect is that the supply of properBes available might contract. This is because a rent cap lowers the financial incenBves to let out a property. Then if available supply falls, the rental market will experience excess demand as shown in my analysis diagram. More people wish to rent at these low prices than there are houses available. This is called a disequilibrium. A second effect might be to cause a shadow market to emerge, with tenants paying the legal maximum rent but also being charged extra by landlords for ancillary services such as keys and decoraBon. The landlords want to claw back extra revenue and therefore increase their producer surplus. Consequently the maximum rent may be less than the actual cost of renBng the property.
Knowledge ApplicaBon
Analysis EvaluaBon

Analyse two possible effects of a decision to introduce rent controls into the UK housing market
Quan/ty of rental housing
Free market rent
Q1
Market Demand
Max Price
Q2
Rent £s per week
Q3
Market Supply
Rent Ceiling (£ per week)
Free Market Equilibrium

Analyse two possible effects of a decision to introduce rent controls into the UK housing market (Edexcel)
Quan/ty supplied Q1
Market Demand
Q2 Q3
Max Rent
P2 Market Supply
Extracted consumer surplus above the official price ceiling
Possible unofficial price above the ceiling
Some ra/oning or auc/on process may be needed if output = Q3
Rent £s per week
Free market rent
Max Price
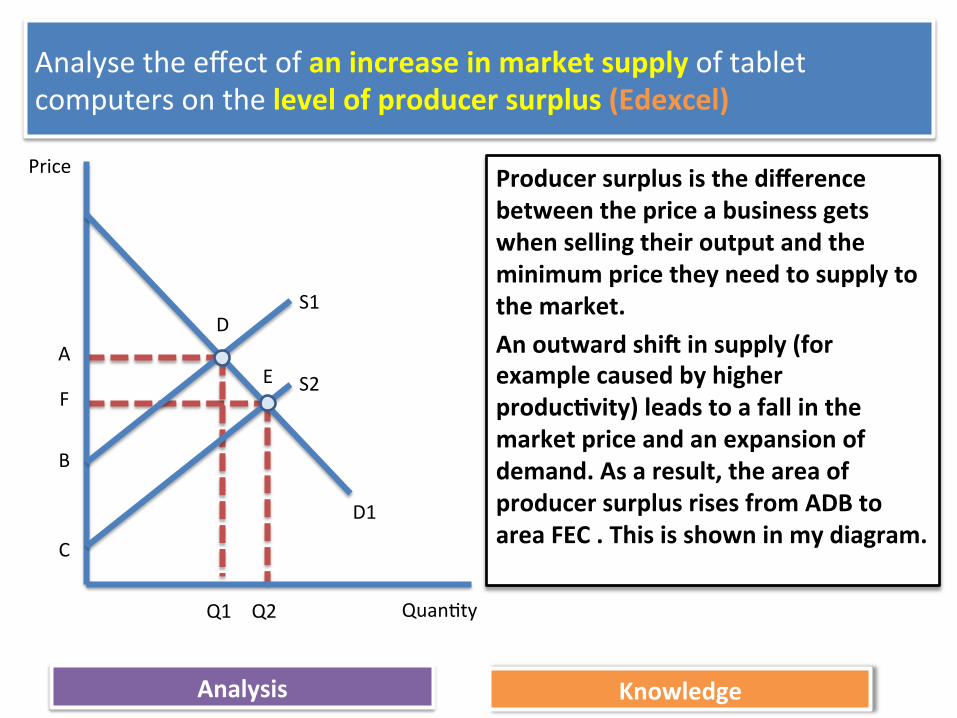
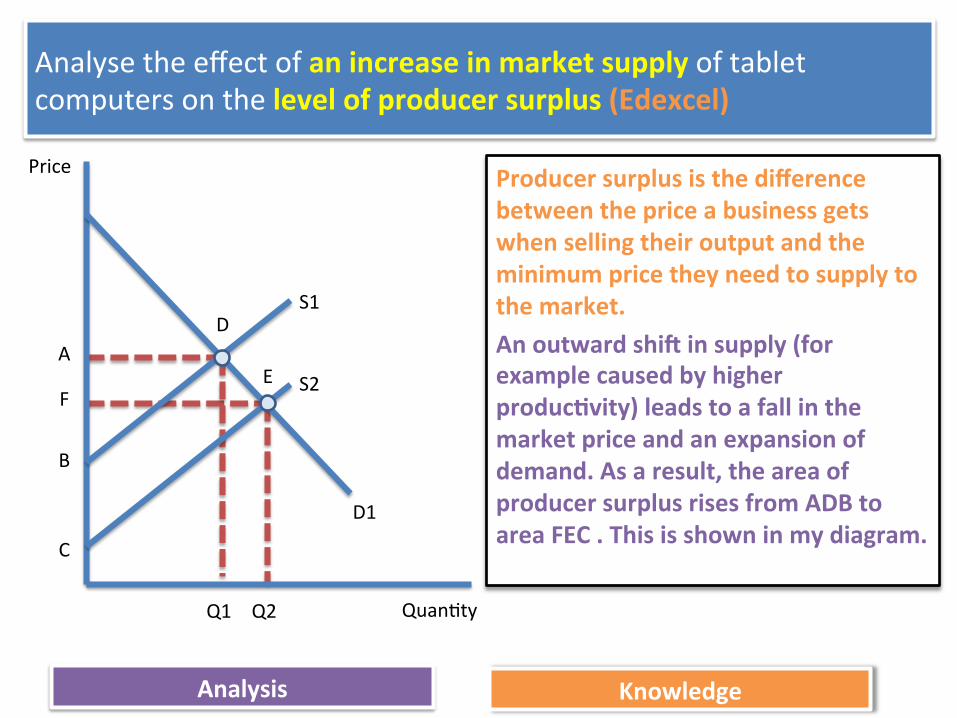
Analyse the effect of an increase in market supply of tablet computers on the level of producer surplus (Edexcel)
Producer surplus is the difference between the price a business gets when selling their output and the minimum price they need to supply to the market. An outward shiV in supply (for example caused by higher producBvity) leads to a fall in the market price and an expansion of demand. As a result, the area of producer surplus rises from ADB to area FEC . This is shown in my diagram.
Price
Quan/ty Q2
D1
B
Q1
S1
S2 A
C
D
E F
Analysis Knowledge

Analyse the effect of an increase in market supply of tablet computers on the level of producer surplus (Edexcel)

Analyse the effect of an increase in market supply of tablet computers on the level of producer surplus (Edexcel)
Producer surplus is the difference between the price a business gets when selling their output and the minimum price they need to supply to the market. An outward shiV in supply (for example caused by higher producBvity) leads to a fall in the market price and an expansion of demand. As a result, the area of producer surplus rises from ADB to area FEC . This is shown in my diagram.
Price
Quan/ty Q2
D1
B
Q1
S1
S2 A
C
D
E F
Analysis Knowledge

Analyse the effect of an increase in market supply of tablet computers on the level of producer surplus (Edexcel)
Producer surplus is the difference between the price a business gets when selling their output and the minimum price they need to supply to the market.
Price
Quan/ty Q2
D1
B
Q1
S1
S2 A
C
D
E F
Analysis Knowledge
Analyse the effect of an increase in market supply of tablet computers on the level of producer surplus (Edexcel)
Producer surplus is the difference between the price a business gets when selling their output and the minimum price they need to supply to the market. An outward shiV in supply (for example caused by higher producBvity) leads to a fall in the market price and an expansion of demand. As a result, the area of producer surplus rises from ADB to area FEC . This is shown in my diagram.
Price
Quan/ty Q2
D1
B
Q1
S1
S2 A
C
D
E F
Analysis Knowledge

Analyse the effect of an indirect tax on the market if demand is price inelas/c (EdExcel)

Analyse the effect of an indirect tax on the market if demand is price inelas/c (EdExcel)
An indirect tax is a tax imposed on producers by the government. The effect of a tax is to cause an inward shiV of supply and the amount of the tax is shown by the verBcal distance between the pre and post-‐tax supply curves. A low price elasBcity means that Ped < 1. As a result, when a tax is imposed, the producer can pass on most of this tax to the consumer in the form of a higher price. In this way the producer is able to protect some of their revenues and profits. Analysis Knowledge

Analyse the effect of an indirect tax on the market if demand is price inelas/c (Edexcel)
An indirect tax is a tax imposed on producers by the government. The effect of a tax is to cause an inward shiV of supply and the amount of the tax is shown by the verBcal distance between the pre and post-‐tax supply curves. A low price elasBcity means that Ped < 1. As a result, when a tax is imposed, the producer can pass on most of this tax to the consumer in the form of a higher price. In this way the producer is able to protect some of their revenues and profits. Analysis Knowledge
Qty
P2
Demand
P1
Q2
S1
S1 + tax
Q1
P3 Paid by consumer
Paid by supplier
Tax Per Unit

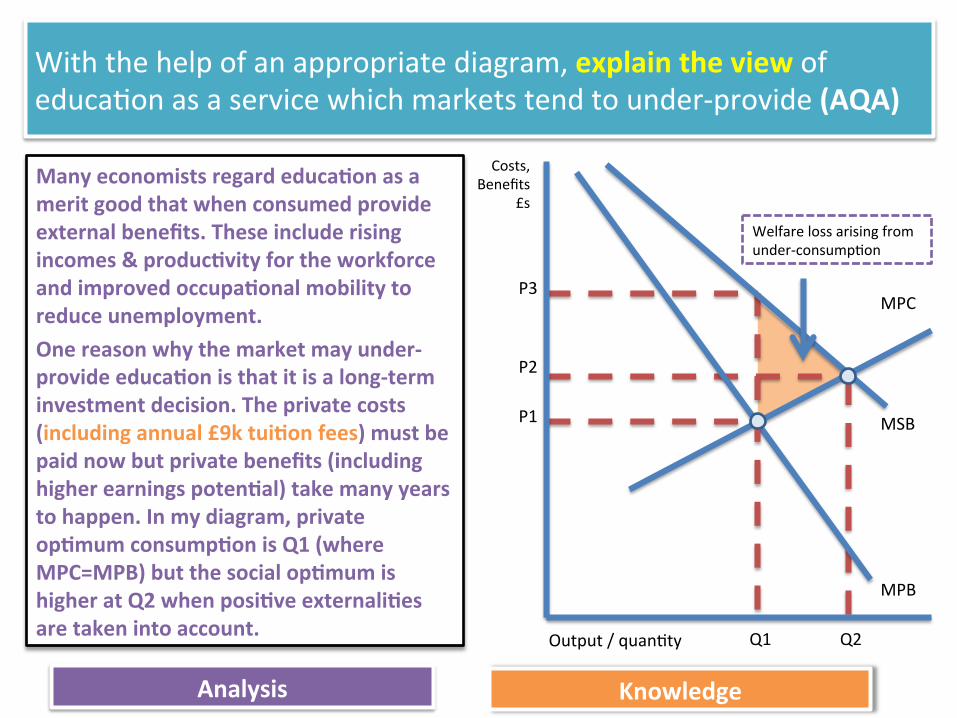
With the help of an appropriate diagram, explain the view of educa/on as a service which markets tend to under-‐provide (AQA)
With the help of an appropriate diagram, explain the view of educa/on as a service which markets tend to under-‐provide (AQA)
Many economists regard educaBon as a merit good that when consumed provide external benefits. These include rising incomes & producBvity for the workforce and improved occupaBonal mobility to reduce unemployment. One reason why the market may under-‐provide educaBon is that it is a long-‐term investment decision. The private costs (including annual £9k tuiBon fees) must be paid now but private benefits (including higher earnings potenBal) take many years to happen. In my diagram, private opBmum consumpBon is Q1 (where MPC=MPB) but the social opBmum is higher at Q2 when posiBve externaliBes are taken into account.
Analysis Knowledge
Costs, Benefits
£s
Output / quan/ty
MPC
P1
Q1
MPB
MSB
P2
Q2
P3
Welfare loss arising from under-‐consump/on

With the help of an appropriate diagram, explain the view of educa/on as a service which markets tend to under-‐provide
Costs, Benefits
£s
Quan/ty of educa/on
MPC
P1
Q1
MPB (limited informa/on)
P2
Q2
Another cause of the market under-‐providing educaBon is informaBon failure. This means that individuals may have imperfect informaBon about their own private benefits of staying in educaBon for example beyond the minimum school-‐leaving age of 17. If people had be`er informaBon on the benefits to themselves of consuming a good or service, then the marginal private benefit curve would shiV outwards leading to a higher equilibrium quanBty and therefore less risk of a market failure.
MPB (fuller informa/on)
Market demand would be higher if consumers had be^er informa/on
Linking back to quesBon

With the help of an appropriate diagram, explain how rising incomes in China and India have affected the global price of wheat. (AQA)

With the help of an appropriate diagram, explain how rising incomes in China and India have affected the global price of wheat. (AQA)
Rising real incomes in China and India have increased demand for cars and motor bikes and contributed to higher world oil prices. Because crude oil and bio-‐fuels are subsBtutes, rising oil prices has caused an increase in the demand for bio-‐fuels. Extract B says that this has caused farmers to switch producBon of wheat away from food towards bio-‐fuels. And the higher cost of oil will have increased their costs. In the short term the supply of wheat is likely to be inelasBc because of producBon lags and low stocks and spare capacity. Therefore an outward shiV of demand for wheat in use for bio-‐fuel will bring about a large increase in price. This is added to by rising costs for wheat farmers.
Price of wheat
Quan/ty of wheat
P1
S1
D1 D2
P2
Q1 Q2
S2
Q3
P3

AS Micro: Good Analysis Skills


![Micro Exam 3 [Weston]](https://img.pdfslide.us/doc/110x75/5536b5cf550346640d8b4a12/micro-exam-3-weston.jpg)