Embed Size (px)
Citation preview

Vehicle #7
ASME HPVC 2008 Design Competition Report
Cougar Shadow
Human Powered Vehicle Team
Report Prepared by:
Alan Rathbun Nathan Staufer Gabriel Castro
Faculty Advisors:
Dr. Hamid Rad
Dr. Linda Chen
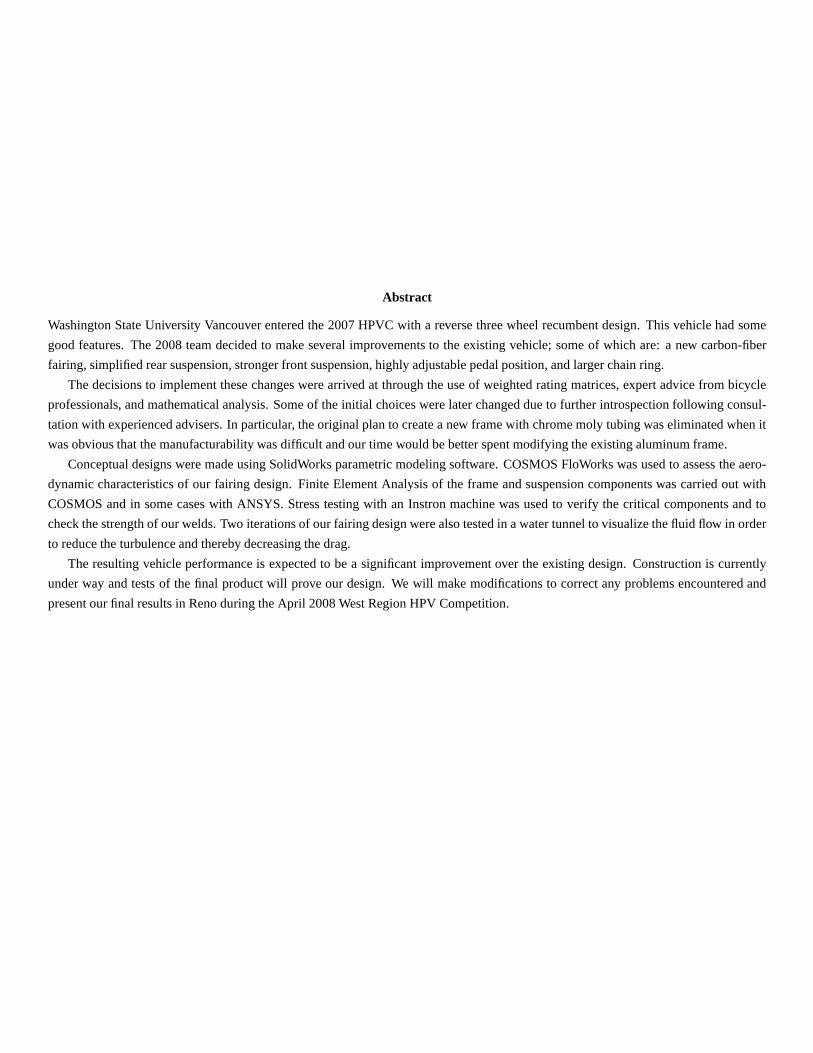
Abstract
Washington State University Vancouver entered the 2007 HPVC with a reverse three wheel recumbent design. This vehicle had some
good features. The 2008 team decided to make several improvements to the existing vehicle; some of which are: a new carbon-fiber
fairing, simplified rear suspension, stronger front suspension, highly adjustable pedal position, and larger chain ring.
The decisions to implement these changes were arrived at through the use of weighted rating matrices, expert advice frombicycle
professionals, and mathematical analysis. Some of the initial choices were later changed due to further introspectionfollowing consul-
tation with experienced advisers. In particular, the original plan to create a new frame with chrome moly tubing was eliminated when it
was obvious that the manufacturability was difficult and ourtime would be better spent modifying the existing aluminum frame.
Conceptual designs were made using SolidWorks parametric modeling software. COSMOS FloWorks was used to assess the aero-
dynamic characteristics of our fairing design. Finite Element Analysis of the frame and suspension components was carried out with
COSMOS and in some cases with ANSYS. Stress testing with an Instron machine was used to verify the critical components andto
check the strength of our welds. Two iterations of our fairing design were also tested in a water tunnel to visualize the fluid flow in order
to reduce the turbulence and thereby decreasing the drag.
The resulting vehicle performance is expected to be a significant improvement over the existing design. Construction iscurrently
under way and tests of the final product will prove our design.We will make modifications to correct any problems encountered and
present our final results in Reno during the April 2008 West Region HPV Competition.
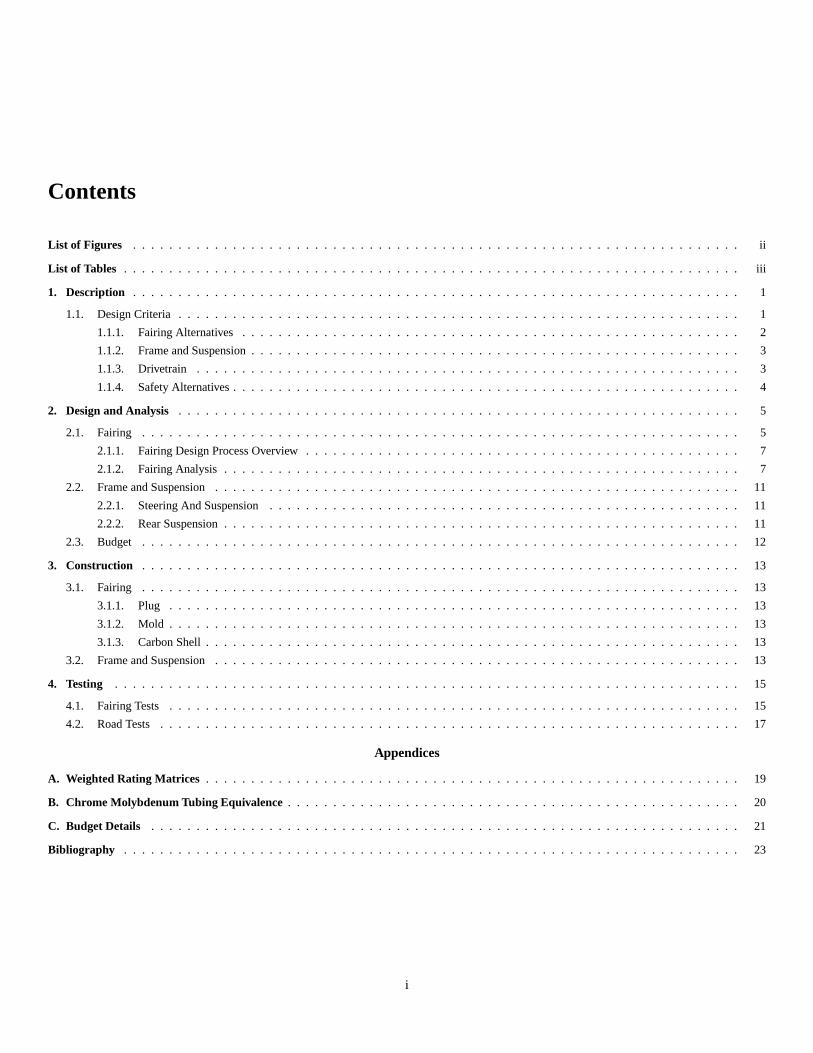
Contents
List of Figures . . . . . . . . . . . . . . . . . . . . . . . . . . . . . . . . . . . . . . . . . . . . . . . . . . .. . . . . . . . . . . . . . . . ii
List of Tables . . . . . . . . . . . . . . . . . . . . . . . . . . . . . . . . . . . . . . . . . . . . . . . . . . .. . . . . . . . . . . . . . . . . iii
1. Description . . . . . . . . . . . . . . . . . . . . . . . . . . . . . . . . . . . . . . . . . . . . . . . . . . .. . . . . . . . . . . . . . . . 1
1.1. Design Criteria . . . . . . . . . . . . . . . . . . . . . . . . . . . . . . . . .. . . . . . . . . . . . . . . . . . . . . . . . . . . . . 1
1.1.1. Fairing Alternatives . . . . . . . . . . . . . . . . . . . . . . . . . .. . . . . . . . . . . . . . . . . . . . . . . . . . . . . 2
1.1.2. Frame and Suspension . . . . . . . . . . . . . . . . . . . . . . . . . . .. . . . . . . . . . . . . . . . . . . . . . . . . . . 3
1.1.3. Drivetrain . . . . . . . . . . . . . . . . . . . . . . . . . . . . . . . . . . .. . . . . . . . . . . . . . . . . . . . . . . . . 3
1.1.4. Safety Alternatives . . . . . . . . . . . . . . . . . . . . . . . . . . .. . . . . . . . . . . . . . . . . . . . . . . . . . . . . 4
2. Design and Analysis . . . . . . . . . . . . . . . . . . . . . . . . . . . . . . . . . . . . . . . . . . . . . . . . . . .. . . . . . . . . . . 5
2.1. Fairing . . . . . . . . . . . . . . . . . . . . . . . . . . . . . . . . . . . . . . . .. . . . . . . . . . . . . . . . . . . . . . . . . . 5
2.1.1. Fairing Design Process Overview . . . . . . . . . . . . . . . . .. . . . . . . . . . . . . . . . . . . . . . . . . . . . . . . 7
2.1.2. Fairing Analysis . . . . . . . . . . . . . . . . . . . . . . . . . . . . . .. . . . . . . . . . . . . . . . . . . . . . . . . . . 7
2.2. Frame and Suspension . . . . . . . . . . . . . . . . . . . . . . . . . . . . .. . . . . . . . . . . . . . . . . . . . . . . . . . . . . 11
2.2.1. Steering And Suspension . . . . . . . . . . . . . . . . . . . . . . . .. . . . . . . . . . . . . . . . . . . . . . . . . . . . 11
2.2.2. Rear Suspension . . . . . . . . . . . . . . . . . . . . . . . . . . . . . . .. . . . . . . . . . . . . . . . . . . . . . . . . . 11
2.3. Budget . . . . . . . . . . . . . . . . . . . . . . . . . . . . . . . . . . . . . . . . .. . . . . . . . . . . . . . . . . . . . . . . . . 12
3. Construction . . . . . . . . . . . . . . . . . . . . . . . . . . . . . . . . . . . . . . . . . . . . . . . . . . .. . . . . . . . . . . . . . . 13
3.1. Fairing . . . . . . . . . . . . . . . . . . . . . . . . . . . . . . . . . . . . . . . .. . . . . . . . . . . . . . . . . . . . . . . . . . 13
3.1.1. Plug . . . . . . . . . . . . . . . . . . . . . . . . . . . . . . . . . . . . . . . . .. . . . . . . . . . . . . . . . . . . . . . 13
3.1.2. Mold . . . . . . . . . . . . . . . . . . . . . . . . . . . . . . . . . . . . . . . . .. . . . . . . . . . . . . . . . . . . . . . 13
3.1.3. Carbon Shell . . . . . . . . . . . . . . . . . . . . . . . . . . . . . . . . . .. . . . . . . . . . . . . . . . . . . . . . . . . 13
3.2. Frame and Suspension . . . . . . . . . . . . . . . . . . . . . . . . . . . . .. . . . . . . . . . . . . . . . . . . . . . . . . . . . . 13
4. Testing . . . . . . . . . . . . . . . . . . . . . . . . . . . . . . . . . . . . . . . . . . . . . . . . . . .. . . . . . . . . . . . . . . . . . 15
4.1. Fairing Tests . . . . . . . . . . . . . . . . . . . . . . . . . . . . . . . . . . .. . . . . . . . . . . . . . . . . . . . . . . . . . . . 15
4.2. Road Tests . . . . . . . . . . . . . . . . . . . . . . . . . . . . . . . . . . . . . .. . . . . . . . . . . . . . . . . . . . . . . . . . 17
Appendices
A. Weighted Rating Matrices . . . . . . . . . . . . . . . . . . . . . . . . . . . . . . . . . . . . . . . . . . . . . . . . . . .. . . . . . . . 19
B. Chrome Molybdenum Tubing Equivalence . . . . . . . . . . . . . . . . . . . . . . . . . . . . . . . . . . . . . . . . . . . . . . . . . . 20
C. Budget Details . . . . . . . . . . . . . . . . . . . . . . . . . . . . . . . . . . . . . . . . . . . . . . . . . . .. . . . . . . . . . . . . . 21
Bibliography . . . . . . . . . . . . . . . . . . . . . . . . . . . . . . . . . . . . . . . . . . . . . . . . . . .. . . . . . . . . . . . . . . . . 23
i
List of Figures
2.1. Roll-Bar Measurements . . . . . . . . . . . . . . . . . . . . . . . . . . .. . . . . . . . . . . . . . . . . . . . . . . . . . . . . . . . . 5
2.2. Side View Profile . . . . . . . . . . . . . . . . . . . . . . . . . . . . . . . . .. . . . . . . . . . . . . . . . . . . . . . . . . . . . . . 6
2.3. Top View Profile . . . . . . . . . . . . . . . . . . . . . . . . . . . . . . . . . .. . . . . . . . . . . . . . . . . . . . . . . . . . . . . 6
2.4. 97-inch Fairing . . . . . . . . . . . . . . . . . . . . . . . . . . . . . . . . .. . . . . . . . . . . . . . . . . . . . . . . . . . . . . . . 6
2.5. 107.5-inch Fairing (Final Fairing Design) . . . . . . . . . .. . . . . . . . . . . . . . . . . . . . . . . . . . . . . . . . . . . . . . . . 7
2.6. COSMOS FloWorks Isometric View of Final Fairing Design. . . . . . . . . . . . . . . . . . . . . . . . . . . . . . . . . . . . . . . . . 7
2.7. Final Design Under 15 mph Cross Winds . . . . . . . . . . . . . . . .. . . . . . . . . . . . . . . . . . . . . . . . . . . . . . . . . . . 8
2.8. Boundary Layer Velocity . . . . . . . . . . . . . . . . . . . . . . . . . .. . . . . . . . . . . . . . . . . . . . . . . . . . . . . . . . . 9
2.9. Pressure Coefficient vs. Position . . . . . . . . . . . . . . . . . .. . . . . . . . . . . . . . . . . . . . . . . . . . . . . . . . . . . . . 10
2.10. Ackerman . . . . . . . . . . . . . . . . . . . . . . . . . . . . . . . . . . . . . .. . . . . . . . . . . . . . . . . . . . . . . . . . . . . 11
4.1. Trimetric View of The First Design . . . . . . . . . . . . . . . . . .. . . . . . . . . . . . . . . . . . . . . . . . . . . . . . . . . . . . 15
4.2. Side and Top Views of the Water Tunnel Test . . . . . . . . . . . .. . . . . . . . . . . . . . . . . . . . . . . . . . . . . . . . . . . . . 16
4.3. Side and Top View SolidWorks Velocity Profile . . . . . . . . .. . . . . . . . . . . . . . . . . . . . . . . . . . . . . . . . . . . . . . 16
4.4. First Design at 1 Hz (a); and at 10 Hz (b) . . . . . . . . . . . . . . .. . . . . . . . . . . . . . . . . . . . . . . . . . . . . . . . . . . . 16
ii

List of Tables
2.1. Boundary Layer Velocity atx = 0.254 m . . . . . . . . . . . . . . . . . . . . . . . . . . . . . . . . . . . . . . . . . . . . . . . . . . 9
2.2. Pressure Coefficient . . . . . . . . . . . . . . . . . . . . . . . . . . . . .. . . . . . . . . . . . . . . . . . . . . . . . . . . . . . . . . 10
iii

1. Description
1.1. Design Criteria
Design constraints for the ASME HPVC are broad and open endedyet also include very specific criteria. The first and foremost set
of criteria is the safety requirements established in the competition rules. Next are dimensional and ergonomic considerations for the
riders. Finally, the desired performance output of the vehicle is considered. These criteria are detailed as follows:
1. ASME Minimum Requirements
a) 100 ftstraight line travel.b) 25 ftturning radius.c) Roll-bar protection of equal or greater than1.5 × 0.049 inch Chrome Moly Tubing, evaluated with test results.d) Safety harness.e) Fairing that covers1/3 of the frontal area.
2. Ergonomic and Dimensional Constraints:
a) Rider Dimensions
i. Seated Leg Length: between 37 and 48 inchesii. Seated Torso Length: between 23 and 27inchesiii. Shoulder Width: between 16 and 21inchesiv. Hip Width: between 14 and 17 inchesv. Total Seated Height: between 32 and 38 inches
b) Ergonomic Factors
i. Convenient Steering positionii. Easy Entry and Exitiii. Comfortable Torso to Leg Angle
3. Performance Criteria
a) Speed
i. Sprint40 +mphii. Endurance20-30mph
b) Cornering Radius:20 ftc) Minimize Frictional Resistance
i. Center of Gravity Balance
1

ii. Neutral Steeriii. Cornering Resistanceiv. Equal Front and Rear Slip Angles
d) Performance to Weight Tradeoff
i. Drag Reduction VS Acceleration Lossii. Ergonomicsiii. Steering Forceiv. Actuator Positionv. Actuator Motion
Based on these criteria there were several features from the2007 vehicle that needed improvement. Obvious flaws in the previous design
included a warped brake disk, chain rubbing on the frame, andstripped out threads on some fasteners. Some systems were identified
as potential performance enhancements. A new fairing wouldbe likely to increase our sprint speed. While last year’s design team had
intended to use a full fairing, they were only able to use the upper half due to a miscalculation. This proved to be a detriment as the
vehicle was shown to have less rolling resistance without it.
Lightening the frame would reduce road resistance and the amount of power needed to accelerate the vehicle. An adjustable seat
would add to the comfort of the rider and allow for the optimalposition for power transmission. The bell crank and chainring could be
selected for the best ratio for the sprint and endurance competitions.
Improvements in the safety features might include a chain guard and a faster acting safety harness. All of the minimum safety
features were met, though some by a small margin. The turningradius was measured to be24 ft, which is just barely within the
maximum allowed. Due to the three wheel design and good steering geometry there was no problem riding in a straight line indefinitely.
The handling characteristics were very good, especially athigher speeds, but the position of the steering interface prevented easy entry
and exit. Both the Short-Long Arm (SLA) front suspension as well as the Four Bar Linkage rear suspension were found to be too stiff to
function properly and were consequently not engaging during the course of normal riding.
Several tools were used to evaluate the merits of each alternative design suggested. First, a morphological matrix was created to
enable us to see how the systems would combine: choices that were incompatible were discarded. Next, several weighted rating matrices
were set up to find the optimum design alternatives for each subsystem[1]. Detailed charts with requirements of cost, manufacturability,
weight, performance, and safety are presented in Appendix A.
This phase in the process forced us to research many of the systems in greater detail. None of this year’s team had any serious
background in bicycles, and since the majority of these vehicles utilize bicycle parts, we would need to start learning very quickly. A
book that was very helpful for its general content was The Recumbent Bicycle by Gunnar Fehleu[2]. From suggestions in this book, we
learned that aerodynamics would play a significant role at high speeds, however, at low speeds the rolling resistance would dominate.
Since we are performing in both types of race, the design would need to be robust.
1.1.1. Fairing Alternatives
The option of having two fairings was explored. Since we can modify the bicycle up to 65% between races, using a full fairing for
the sprint and a partial fairing for the endurance would makesense. The partial fairing would satisfy the rule that one-third of the front is
fared, while maximizing the air flow to the rider which will allow more heat to be dissipated from the rider’s body. Our fitness adviser, a
certified USA Cycling Coach, informed us that the power we areable to generate is strongly related to the ability to rejectheat from our
bodies. The problem with using two fairings would be cost andtime to design and manufacture both fairings. Another problem would
be the ability to incorporate the mounting of both fairings that would be made from different materials and geometries.
A second alternative was to make the fairing modular, so thatthe rear portion could be moved for the endurance competition. This
option has the obvious advantage of being easy to change during the race and the cost would be lower than when using two separate
2

fairings. The problems would be complexity of the design andmanufacture. Also, getting the modules to mate smoothly would pose yet
another challenge.
Our third alternative was to make a single fairing with a cockpit opening. This would greatly reduce the aerodynamic advantage
needed for the sprint competition, but the cost would be low and the design and manufacturability would remain simple.
The last option, which is the one we chose, was to make a singlefairing with an opening door. This would allow us to keep the design
and manufacturability simple, while allowing for full aerodynamics in the sprint and the ability to remove the door if the temperatures
were high during the endurance competition. Creating the door in a way that it is easy to mount might be a problem, but we felt that our
concept for accomplishing this design would make it fairly easy.
Fairing material was also put into consideration. Cloth fairings are the least expensive and the lightest alternative.Cloth fairings
are usually made from tough materials such as the cloth used in sails or parachutes. They are also easy to put over a bike. Another
advantage would be the fact that they also do not generate sound resonance. There are two major downfalls to cloth fairings. One, they
lack aerodynamic efficiency. Two, they perform very poorly in crosswinds. This is due to the fact that fabrics will stretch.
The third major option, composite fairings cost between thefoam fairing and the cloth fairing. It is the most aerodynamically efficient
fairing material as the surfaces can be very smooth. The disadvantage to this alternative is the weight. It can be the heaviest alternative.
In the end, carbon-fiber composite material was chosen for the fairing. With the majority of the material being constructed from
one-ply carbon-fiber, the weight of the carbon-fiber should be light. The lighter the material, the more competitive the vehicle can be.
The major weight of the fairing will be due to the support material.
1.1.2. Frame and Suspension
Our first thought was to design and build a completely new vehicle. One of the reasons, based on the opinions of mechanics from
several bicycle shops, that aluminum frames are too stiff. The existing frame design is made of aluminum tubing, and has shock absorbers
to reduce vibration. Our thought was to eliminate the shock absorbers and related mounting hardware to reduce weight andmake the new
vehicle more stable (the rear suspension assembly would move laterally and cause the vehicle to become unstable during fast pedaling).
We designed a chrome moly frame in SolidWorks and found that the weight savings were minimal. The cost and time to manufacture
were both factors in deciding that this may not be the best alternative. So, we decided to modify the existing frame by removing the
shock absorbers and just live with the rough ride that may be encountered.
The steering system of the old vehicle was difficult to control. The handles would push up against the rider’s leg when a sharp turn
was attempted. One solution for this was proposed that wouldsimply move the location of the handles forward and up so the rider’s
legs would not interfere with steering. However, another problem with the steering was the way it had to pass through the fairing by
a large opening. To keep this opening from being necessary and create an unobstructed motion for the controls, we decidedon a lever
and linkage system. There would be two levers, one on each side of the driver, connected to push rods that transfer the force to tie rods
through a pivoting mechanism. The tie rods push the wheel hubs causing them to rotate in the desired amount to complete a turn. The
rods will have threaded adjusters to tune the steering for best results. The way the control levers move parallel to the rider’s legs allow
free movement for the full turning motion.
1.1.3. Drivetrain
The existing system had a few drawbacks in the drivetrain. The chain was rubbing against the frame in one location. Another
problem was the position of the pedals in relation to the rider. Everyone on last year’s team noticed that the pedals needed to be higher.
Although this would reduce the driver’s field of vision, we felt that the increase in comfort that would translate to more endurance for
the long haul warranted a higher pedal position. Since our riders varied in height from five foot tall to over six foot tall,we decided to
make the pedals movable both in height and in extension. Thiscreated a new question; how would we account for the huge difference in
3

chain length required. One way is to make the seat slide back and forth. This would make a lot of added weight and our existing frame
constrained the distance allowed for such an arrangement. Our solution was to incorporate two chain tensioners workingin tandem.
The selection of hardware for this project would need to keepfriction to a minimum. Ceramic sprockets were suggested by abicycle
mechanic. Our research indicated that the cost might be too high, but if we could get some donated by a sponsor, these wouldbe the
choice to use. Another thing to consider in this category wasa better quality chain. Recommendations were that a high quality chain
would improve our performance in the drivetrain. Also, better tires were chosen to reduce resistance to rolling.
For the sprint competition, the existing front chainring was too small, preventing the full speed potential from being reached. The
gear ratio was too small and the rider was pedaling at their maximum long before the timed section of the course. To alleviate this
problem it was decided to increase the diameter of the chainring. Unfortunately, the largest commercially available chainring was still
too small. Gaining full advantage in the sprint competitionwith our vehicle would require a custom built chainring. Since time was
against us, we chose the largest commercially available chainring we could find rather than trying to design and manufacture a new one.
1.1.4. Safety Alternatives
Our safety considerations included a faster acting harness, new brakes, a chain guard, and Kevlar reinforcement in the fairing. The
existing harness is safe. If we have time at the end of major modifications, we will look into a better harness system. The brakes
on last year’s vehicle had a problem with warping of the disc on one side. Our decision is to purchase a better quality brakesystem.
Several options were researched and a brand was selected. There was no chain guard on the existing vehicle. None of the riders were
harmed by the chain or chainring during the last competition, however, it was decided that a guard would insure a safer environment.
Since carbon-fiber can be dangerous if broken, our decision was to use Kevlar to reinforce some of the key locations on the fairing that
were vulnerable to splintering in case of impact. The weightaddition incurred would be a sacrifice well worth making to prevent the
possibility of an injury. Our final vehicle will be closely inspected for sharp edges or dangerous protrusions that mightcause injury to a
rider or anyone working in the pit.

2. Design and Analysis
2.1. Fairing
The aerodynamics of a fairing greatly affects the performance of a Human Powered Vehicle (HPV). One goal behind the fairing
design is to make the pressure more uniform across the body, thus allowing for a boundary layer to stick to the surface (i.e. laminar
flow). When a boundary layer is no longer able to stick, the flowbecomes turbulent and would defeat the purpose of having a fairing.
The first step was to measure the dimensions of the frame from last year’s team (Fig. 2.1) since the frame was readily accessible.
Figure 2.1. Roll-Bar Measurements
This was to get a grasp of how large a fairing might be and what minimal dimensions would be required to fit onto the old frame.
The fairing design was quite simple. The nose was constructed from an ellipse due to the aerodynamic properties of the geometry.
5

Figure 2.2. Side View Profile
Figure 2.3. Top View Profile
Figure 2.2 represents the side view of the fairing. The mean-curve-line curves towards the top of the fairing; the purpose of this is
to create less airflow at the bottom to reduce ground effects.The major problem was creating a profile that can have a fast performance
and will fit over the current frame (refer to Figures 2.3 and 2.1). The length of the fairing also had to be considered. A shorter fairing
(97 inches) would allow for more control, but at the risk of more drag (Fig. 2.4).
Figure 2.4. 97-inch Fairing
The steeper angle at the back would cause the boundary layer to separate, thus creating vortices.
A slightly longer (107 inches) fairing (Fig. 2.5) would require a higher speed for the boundary layer to separate; however, it would
have slightly more surface area.
6

Figure 2.5. 107.5-inch Fairing (Final Fairing Design)
The suction caused by turbulence would be worse than the dragcaused by the extra surface area as determined by analysis (Section
2.1.2).
2.1.1. Fairing Design Process Overview
The recommendation of using four-point-splines in SolidWorks was provided by Chris Bailey from ProTech Composites. Using
four-point-splines greatly simplified the construction ofthe fairing design and provided a more uniform surface. The time to accommo-
date any significant changes in the frame was reduced by four hours for each further change. Shortly after this method was implemented,
the SolidWorks 2006 software at WSU Vancouver was upgraded to version 2007 and COSMOS FloWorks was installed which greatly
improved our productivity.
2.1.2. Fairing Analysis
The fairing designs were analyzed in COSMOS FloWorks with a wind speed of30 mph coming from the front. As illustrated in Fig.
2.6, there are two major pressure drops located by the royal blue color (101.30 kPa) sections and pressure spikes at the front and end
of the fairing (101.40 kPa and10135 kPa respectively). The pressure in the center of the side profile(101.31 kPa) and the pressure
at the pressure drops are nearly uniform. The lowest pressure value is located by the navy blue color at the back end; the pressure drop
is measured to be around101.28 kPa. Since the pressure through the majority of the body is uniform in the simulated30 mph winds,
the boundary layer should adhere to the surface allowing forlaminar flow. The pressure drop at the end suggests the airflowleaving the
fairing to be laminar since it is well between the pressure ofthe side profile and the front tip.
Figure 2.6. COSMOS FloWorks Isometric View of Final FairingDesign
7

Figure 2.7. Final Design Under 15 mph Cross Winds
The drag coefficient is made up of two components, the frictional drag coefficient and the pressure drag coefficient (pressure drag is
also known as form drag). The theory involved in solving for the frictional drag includes the following equations[3]:
g (Y ) =u
U(2.1)
Y =y
δ(2.2)
C1 =
∫
1
0
g (Y ) [1 − g (Y )]dY (2.3)
C2 =dg
dY(2.4)
τw = U3
2
√
C1C2
2
√
ρµ
x(2.5)
In the relations above,u is the velocity at a given location,U is the maximum velocity (assumeU = 30 mph = 13.4 m/s), y is the
normal distance from a surface, andδ is the boundary layer thickness. The shear stress at the wall, τw, is defined in terms of the distance
from the front of the fairing,x. For Example:τw1 = 0.00146/√
x whereτw1 is the shear stress estimated fromx = 0.254 m to 0.889 m.
The frictional drag was estimated through three parts, meaning three graphs are needed to determine the drag.
D =
∫
τw1dA +
∫
τw2dA +
∫
τw3dA (2.6)
Table 2.1 is a sample of the data collected from COSMOS FloWorks (Fig. 2.8). The velocities at varying distances, rangingfrom zero to
the calculated boundary thickness, perpendicular to a point on the surfaces are recorded then nondimensionalized. Thenondimension-
alized values are then graphed. A function can be generated from the graph; once the function is generated, the wall shearstress can be
determined through coefficients generated from an integralEq. (2.3) and derivative Eq. (2.4) of the functions (Refer toequations 2.1
through 2.5).
8

Table 2.1. Boundary Layer Velocity atx = 0.254 m
u (m/s) d (m) y y/d (= Y ) u/U (= g(Y ))
12.7867 0.00259 0.00259 1 0.95343412.7839 0.00259 0.0025 0.9650594 0.95322612.7811 0.00259 0.00194 0.7488861 0.95301712.7783 0.00259 0.00161 0.6214983 0.95280812.7755 0.00259 0.0013 0.5018309 0.95259912.7727 0.00259 0.00099 0.3821635 0.95239112.7699 0.00259 0.00066 0.2547757 0.95218212.7671 0.00259 0.00034 0.1312481 0.95197312.7643 0.00259 0 0 0.951764
Figure 2.8. Boundary Layer Velocity
Ultimately, the frictional drag force was found to be0.00489 N from Eq. (2.6). The frictional drag coefficient was found to be
1.912 × 10⁻⁵ through the governing equation:
CD =D
1
2ρU2A
(2.7)
The frictional drag coefficient can often be considered negligible.
The pressure drag coefficient is more easily obtainable. Thegoverning equations are:
CDp=
∫
Cp cos θdA
A(2.8)
Cp =p − p0
(ρU2/2)(2.9)
whereCp is known as the pressure coefficient. The data are presented in Table 2.2 and depicted in Fig. 2.9.
9

Table 2.2. Pressure Coefficient
θ (deg) x (m) p (Pa) Cp Cpcosθ Cpcosθh
8.61 0.00151 101394 0.720381968 0.712263455 25.9976161235.8 0.03259 101381 0.600318306 0.486896458 17.7717207247.47 0.0695 101368 0.480254645 0.324640687 11.8493850854.66 0.10783 101355 0.360190984 0.208344282 7.60456629459.35 0.14376 101342 0.240127323 0.122415075 4.46815022662.51 0.17489 101329 0.120063661 0.055420641 2.02285339266.8 0.22841 101316 0 0 078.56 0.27626 101303 -0.120063661 -0.023813625 -0.86919730386.75 0.75968 101303 -0.120063661 -0.006806744 -0.24844614394.17 1.75333 101303 -0.120063661 0.008730549 0.318665021106.7 2.06096 101303 -0.120063661 0.034501556 1.259306798111.45 2.19533 101316 0 0 0111.65 2.32764 101329 0.120063661 -0.044295782 -1.616796057111.77 2.53944 101342 0.240127323 -0.089058813 -3.250646672
Figure 2.9. Pressure Coefficient vs. Position
A graph was created from the data and separated into three equations for better correlation:
y1(x) = 11.392x2 − 5.6732x + 0.6887 (2.10)
y2(x) = 0.0368x3 − 0.1157x2 + 0.1234x− 0.0498 (2.11)
y3(x) = 1.3612x3 − 9.2545x2 + 20.633x− 15.095 (2.12)
Assuming a constant width of36.5 inches (0.927 m), and a frontal cross-sectional area of814 in2 (0.525 m2) for our fairing, the
drag pressure coefficient can be found by solving Eq. (2.8). This results in a drag pressure coefficient of0.0786.
Now that both components have been determined, they can be added: CD = CP + CF to determine the final drag coefficient of
0.0786. (Note that the friction coefficient was indeed negligible.)
10
2.2. Frame and Suspension
This year’s team of riders spans a diverse range of body sizes. A leg length range of11 inches was the first and primary difficulty
to overcome regardless of the chosen vehicle. Last year’s vehicle did not have any adjustment for the torso to leg angle which was fixed
around 135◦. This angle was uncomfortable and limited the power transmission from the rider.
The 2007 frame incorporated a1.75 × 0.125 inch roll-bar that was firmly secured into the rest of the frame. Although hand
calculations were performed by last year’s team to show equivalency with the specified standard (Appendix B), no testingwas carried
out to back up those assertions[4].
The issues previously discussed have been addressed with the following modifications:
1. The steering and control system were redesigned with a lever bell-crank layout. Much of the original steering geometry was preserved
due to its excellent handling characteristics, though the components were redesigned with greater strength and adjustability.
2. A fully adjustable bottom bracket assembly that allows for both varying torso to leg angles and can accommodate for thefull range
of leg lengths was designed.
3. The wide adjustment in leg length required a technique to account for a large amount of extra chain. This was accomplished with a
specially designed chain tensioner that could remove up to24 inches of extra slack in the chain.
4. The suspension was removed from the vehicle to save weightwhen it was proven that it was not affecting the performance,though
the SLA style was kept due to its light weight and wide range ofadjustability.
2.2.1. Steering And Suspension
There are many factors affecting the performance and handling characteristics of a vehicle, however, only a few of the basics were
investigated in this project. The principals of Ackermann steering geometry and center of gravity placement were the primary design
criteria used here[5].
As a tire travels along a curved path, the tread is deflected bythe static interface with the road and the force exerted by the vehicle.
This is because the actual turning radius of the tire is widerthan the path predicted by pure Ackermann geometry. This effect slip angle
is a function of the tire, input steering angle, speed, and loading conditions. In order to accurately predict the behavior of a vehicle
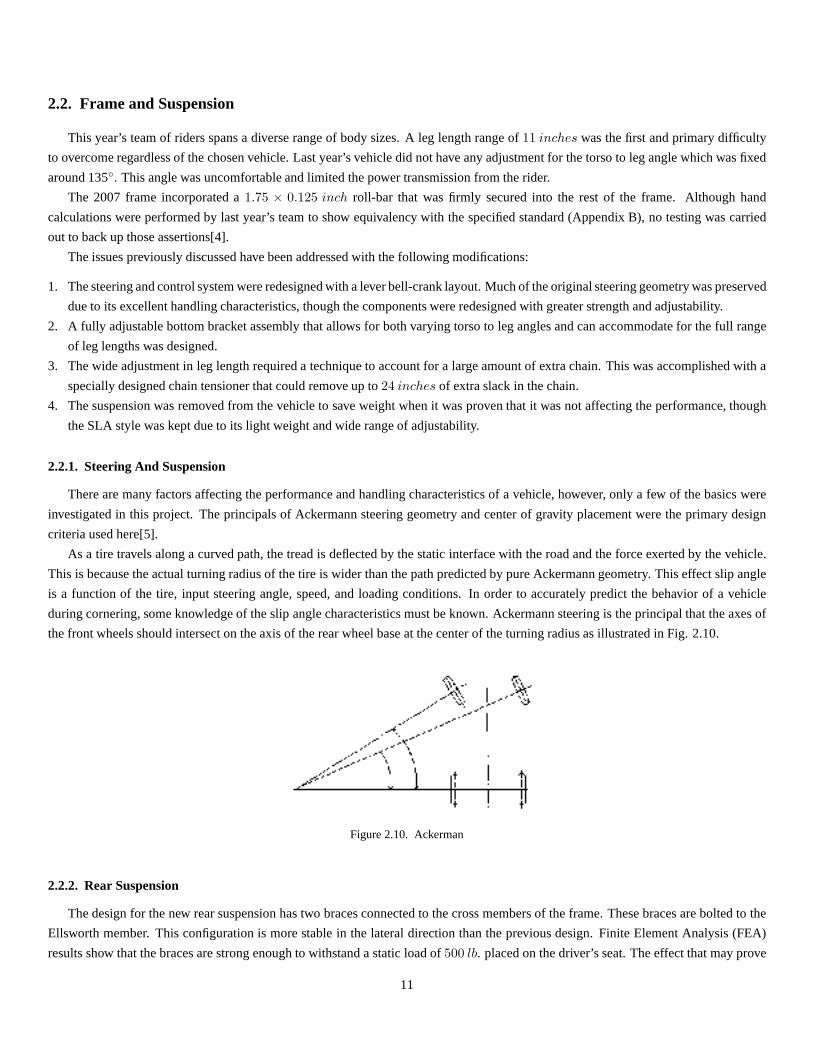
during cornering, some knowledge of the slip angle characteristics must be known. Ackermann steering is the principal that the axes of
the front wheels should intersect on the axis of the rear wheel base at the center of the turning radius as illustrated in Fig. 2.10.
Figure 2.10. Ackerman
2.2.2. Rear Suspension
The design for the new rear suspension has two braces connected to the cross members of the frame. These braces are bolted to the
Ellsworth member. This configuration is more stable in the lateral direction than the previous design. Finite Element Analysis (FEA)
results show that the braces are strong enough to withstand astatic load of500 lb. placed on the driver’s seat. The effect that may prove
11

to cause a problem is fatigue caused by flexing the frame whiletraveling over bumps. Since the roughness of the competition track is
unknown, the number of cycles encountered will have to be assumed. The vibration amplitude applied to the frame is also unknown.
Some estimates have been made by measuring the pavement around the WSU Vancouver campus. The average bump is found to be
0.125 inch in height and the wavelength that these bumps occur is around0.45 inch. With a load of500 lb on the seat of the vehicle
and traveling a distance of100 km, 8.75× 10⁶ cycles would be placed on the frame. Using COSMOSWorks to assess fatigue with these
parameters resulted in a minimum factor of safety of2.24 for the brace which seems adequate.
2.3. Budget
It was important to keep the cost of the overall vehicle as lowas possible in order to stay within the budget (see Appendix C). The
fairing materials were the most costly item in the system. Tooling foam is very expensive; to improvise, expanding foam was used to
build the plug. In addition, our method of building and covering ribs with paper as a void in the interior space created even more savings.
Due to our lack of experience it took 30 hours to build the plugblanks. However, with experienced workers and refinements to the
process, this time would surely be reduced considerably. Given the cost of tooling foam at over $3000.00 for the amount needed for our
plug (expanding foam cost was $462.00), it is easy to see thatthis method has excellent potential for savings.
Our estimated cost to produce a single vehicle would be $5388. This estimate is based on labor of 80 hours at $20 per hour. The
estimate for a production run of 10 vehicles per month would be $3488. This estimate is reached by reducing the hours for labor to 30
and averaging the cost of the mold and fixtures over a year.
The project was funded by a $5000 grant from Associated Students of Washington State University at Vancouver, a donationfrom
ASME Oregon Section for $500, a sponsorship from Battleground Bicycle for bicycle parts, and a sponsorship from Pro-Tech Compos-
ites of shop space and technical guidance in building the carbon-fiber fairing.

3. Construction
3.1. Fairing
An approach to constructing the fairing that has a mix of several methods combined with some of our own novel concepts was taken.
Some phases are similar to the method depicted in a video by Fiber Glast Corporation[6]. Some ideas were taken from steps that other
colleges have used in the past as found on their websites and previous year design reports. Then, some were taken from websites that
show how to build aircraft bodies and wings.
3.1.1. Plug
This is based on our most original idea. Although the conceptis similar to other methods, a new one was developed. The firststep
was to print out profiles of the fairing surface, including a2 inch offset inside and a1.5 inch offset outside of the intended surface. The
inside profiles are then cut from Styrofoam and the outsides from 1
8inch hardboard. The inside profiles are glued to a board that becomes
a base. Then the hardboard profiles are used to pour sections of expanding foam. This method saves on the volume of expanding foam
necessary, thereby saving money.
The foam is formed1.5 inches over the intended surface. Since it is not very uniform, it isbuilt up enough to insure a uniform
consistency at the intended surface. Then the foam is milleddown to the surface using CNC code generated by FeatureCAM. It was
necessary to build the plug in four sections in order to make them small enough to fit on the milling table.
The foam is sprayed with resin diluted with acetone. This seals the foam and creates a base that can be sanded to a smooth finish.
Then the surface is waxed and sprayed with mold release agent.
3.1.2. Mold
Three coats of gelcoat are applied to the plug. When the final coat has cured enough to stop tacking, three layers of fiberglass mat
are laid up. One layer of woven roving 18 ounce fiberglass is laid up and one more layer of mat is applied over the woven roving. When
this has cured the mold can be pried loose, washed, inspectedfor imperfections, and repaired if necessary. The mold is waxed and mold
release agent is sprayed on.
3.1.3. Carbon Shell
Vacuum bag forming is used to lay up a single ply of carbon-fiber. As soon as the epoxy has set, foam strips are positioned
strategically and strips of carbon or Kevlar (which is used where there might be a need for higher strength since carbon-fiber might
shatter on impact) are laid up over the foam. Aluminum brackets for mounting the fairing to the frame are positioned and Kevlar is laid
up over them. These are vacuum bag formed and become support structures for rigidity and for mounting the frame
3.2. Frame and Suspension
It was necessary to generate CNC code by importing SolidWorks files into FeatureCAM for many of the parts. Some parts were
milled and/or turned on a lathe manually. Some parts had jigsbuilt to facilitate alignment during welding. The old mounting structures
13

were cut off with a saws-all and ground down to the frame tubing. The new parts will be carefully positioned, clamped into place, and
welded. All subsystems will be assembled to complete the newvehicle.
14

4. Testing
4.1. Fairing Tests
A scaled prototype of the fairing design illustrated in section 2.1 was created through a Rapid Prototype (RP) machine. Asimilar
prototype of the previous year’s fairing, as shown in Fig. 4.1, was also created. The prototypes were scaled at 1:30 ratioand tested in a
water tunnel.
Figure 4.1. Trimetric View of The First Design
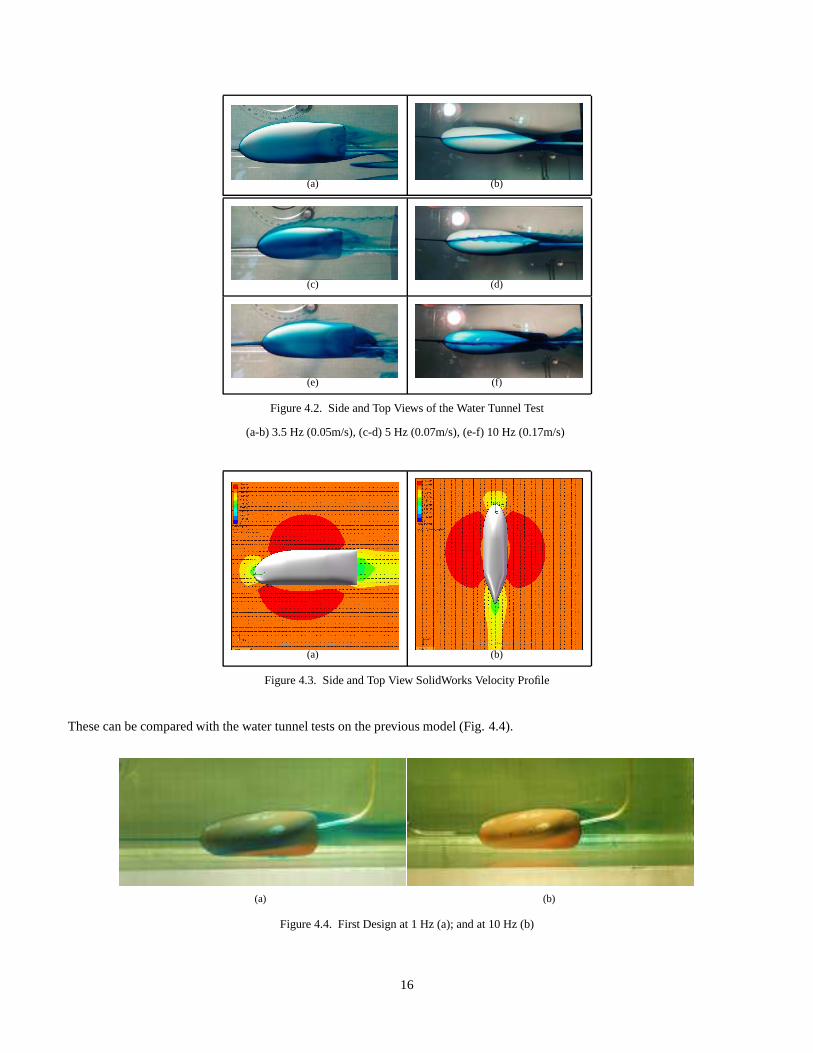
The frequency that the water passes through the tunnel ranges from3.5 Hz (0.05m/s) to 10 Hz (0.17 m/s); the water becomes too
turbulent beyond10 Hz. The objective of the water tunnel test is to compare the quality of the flow around the scaled rapid prototype
fairing. The water tunnel releases ink to flow across the surface of an object to provide visualization of the streamlines. This allows for
qualitative analysis.
Comparing the water tunnel test results (Fig. 4.2) with the SolidWorks velocity profile (Fig. 4.3), the change in the velocity in the
back results with the formation of vortices at the top and bottom corners.
15
(a) (b)
(c) (d)
(e) (f)
Figure 4.2. Side and Top Views of the Water Tunnel Test
(a-b) 3.5 Hz (0.05m/s), (c-d) 5 Hz (0.07m/s), (e-f) 10 Hz (0.17m/s)
(a) (b)
Figure 4.3. Side and Top View SolidWorks Velocity Profile
These can be compared with the water tunnel tests on the previous model (Fig. 4.4).
(a) (b)
Figure 4.4. First Design at 1 Hz (a); and at 10 Hz (b)
16

4.2. Road Tests
When the vehicle construction is completed, the effectiveness of our modifications will need to be checked under field conditions.
These tests also give our team a chance to record the required30 minutes riding time as stated in Appendix 4 Part (7) of the 2008 Rules
prior to the competition[7]. The method is simply to drive the vehicle while noting the handling and performance. The vehicle will
be driven at progressively increasing intensity until the maximum output of our riders is reached. Each test will be followed by close
inspection of the frame and all subsystems for defects. Results of these tests will be used to make modifications if needed. The results
and any modifications necessary will be presented at the competition in Reno.

Appendices
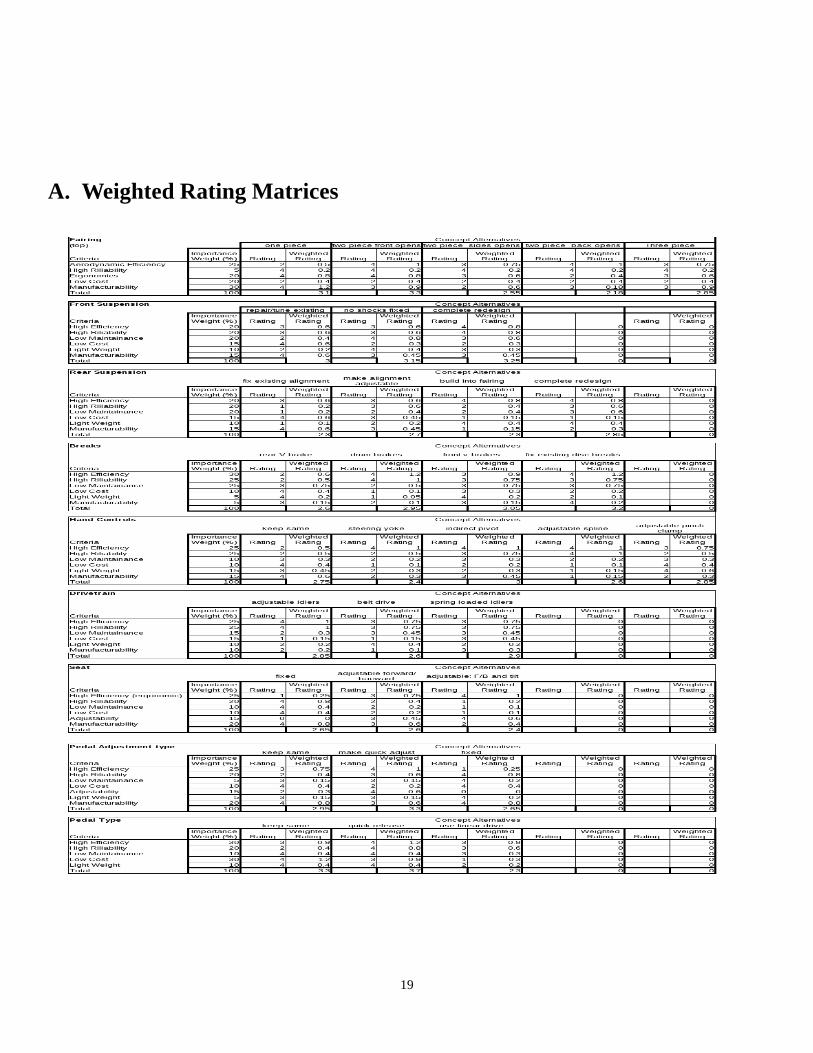
A. Weighted Rating Matrices
19

B. Chrome Molybdenum Tubing Equivalence
ASME specified minimum safety requirements for the roll bar.The following calculations show that a 134
inch T6061 aluminum
with a 1/8 inch wall exceeds the minimum safety requirementsas shown below. (These calculations are from the WashingtonState
University Vancouver 2007 HPV Team report.)
Yield Tensile Strength :Chrome Molybdenum T6061 Aluminum
91200 psi 39885 psi
σ =32 · M · c
I⇒ M =
σ · I
C
I =π
(
D4
o − D4
i
)
64
C =Do
2
M =σ
π(D4
o−D4
i )64
Do
2
= σπ
(
D4o − D4
i
)
32 · Do
Doal= 1.75 in
Dial= 1.5 in
σyal= 39885 psi
Mal = 39885π
(
1.754 − 1.54)
32 · 1.75= 9658 lb · in
Dicr= 1.402 in
σycr= 92100 psi
Mcr = 92100π
(
1.54 − 1.4024)
32 · 1.5= 7227 lb · in
20
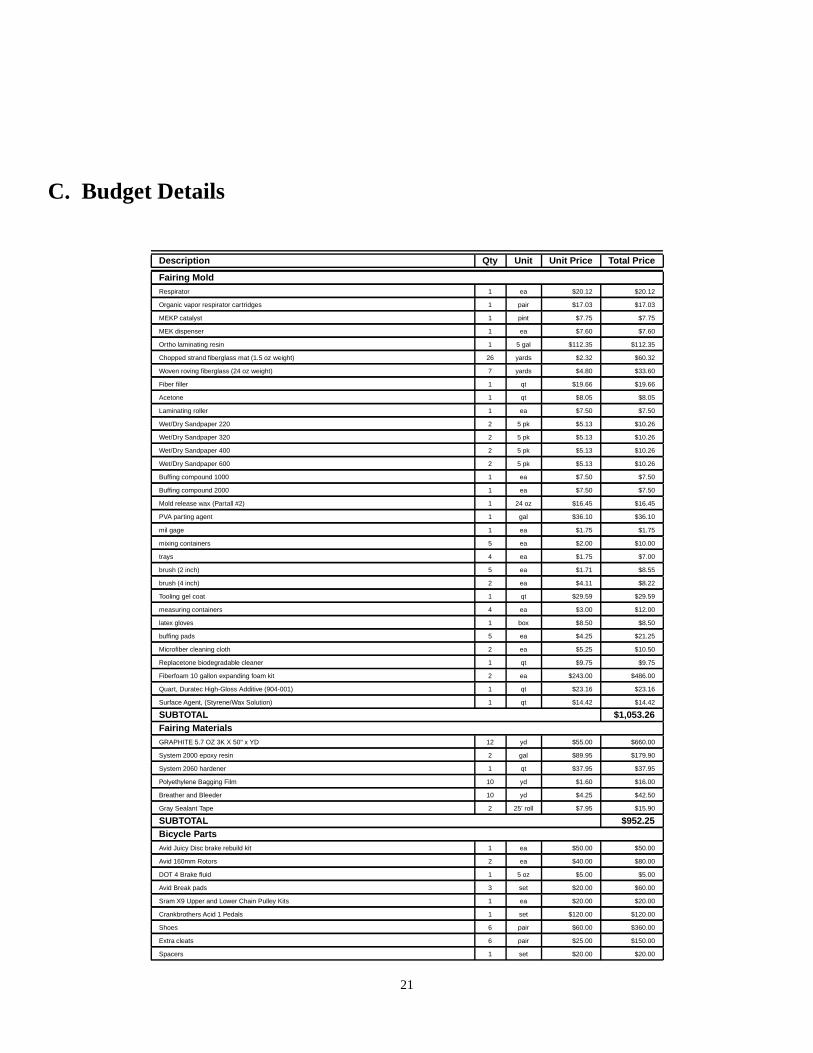
C. Budget Details
Description Qty Unit Unit Price Total Price
Fairing MoldRespirator 1 ea $20.12 $20.12
Organic vapor respirator cartridges 1 pair $17.03 $17.03
MEKP catalyst 1 pint $7.75 $7.75
MEK dispenser 1 ea $7.60 $7.60
Ortho laminating resin 1 5 gal $112.35 $112.35
Chopped strand fiberglass mat (1.5 oz weight) 26 yards $2.32 $60.32
Woven roving fiberglass (24 oz weight) 7 yards $4.80 $33.60
Fiber filler 1 qt $19.66 $19.66
Acetone 1 qt $8.05 $8.05
Laminating roller 1 ea $7.50 $7.50
Wet/Dry Sandpaper 220 2 5 pk $5.13 $10.26
Wet/Dry Sandpaper 320 2 5 pk $5.13 $10.26
Wet/Dry Sandpaper 400 2 5 pk $5.13 $10.26
Wet/Dry Sandpaper 600 2 5 pk $5.13 $10.26
Buffing compound 1000 1 ea $7.50 $7.50
Buffing compound 2000 1 ea $7.50 $7.50
Mold release wax (Partall #2) 1 24 oz $16.45 $16.45
PVA parting agent 1 gal $36.10 $36.10
mil gage 1 ea $1.75 $1.75
mixing containers 5 ea $2.00 $10.00
trays 4 ea $1.75 $7.00
brush (2 inch) 5 ea $1.71 $8.55
brush (4 inch) 2 ea $4.11 $8.22
Tooling gel coat 1 qt $29.59 $29.59
measuring containers 4 ea $3.00 $12.00
latex gloves 1 box $8.50 $8.50
buffing pads 5 ea $4.25 $21.25
Microfiber cleaning cloth 2 ea $5.25 $10.50
Replacetone biodegradable cleaner 1 qt $9.75 $9.75
Fiberfoam 10 gallon expanding foam kit 2 ea $243.00 $486.00
Quart, Duratec High-Gloss Additive (904-001) 1 qt $23.16 $23.16
Surface Agent, (Styrene/Wax Solution) 1 qt $14.42 $14.42
SUBTOTAL $1,053.26Fairing MaterialsGRAPHITE 5.7 OZ 3K X 50" x YD 12 yd $55.00 $660.00
System 2000 epoxy resin 2 gal $89.95 $179.90
System 2060 hardener 1 qt $37.95 $37.95
Polyethylene Bagging Film 10 yd $1.60 $16.00
Breather and Bleeder 10 yd $4.25 $42.50
Gray Sealant Tape 2 25’ roll $7.95 $15.90
SUBTOTAL $952.25Bicycle PartsAvid Juicy Disc brake rebuild kit 1 ea $50.00 $50.00
Avid 160mm Rotors 2 ea $40.00 $80.00
DOT 4 Brake fluid 1 5 oz $5.00 $5.00
Avid Break pads 3 set $20.00 $60.00
Sram X9 Upper and Lower Chain Pulley Kits 1 ea $20.00 $20.00
Crankbrothers Acid 1 Pedals 1 set $120.00 $120.00
Shoes 6 pair $60.00 $360.00
Extra cleats 6 pair $25.00 $150.00
Spacers 1 set $20.00 $20.00
21

Description Qty Unit Unit Price Total Price
Cateye Strata Cadence Computer 1 ea $45.00 $45.00
Spoke Adjustment Tool 1 ea $10.00 $10.00
Foot Pump 1 ea $40.00 $40.00
CO2 System 1 ea $30.00 $30.00
Flat Kit 3 ea $3.00 $9.00
Chain tool 1 ea $12.00 $12.00
SUBTOTAL $1,011.00Frame Metal1.75" OD x 0.125" WALL x 1.5" ID 6061 T6 TUBE X 6ft 1 ea $58.00 $58.00
1.5" OD x 0.125" WALL x 1.25" ID 6061 T6 TUBE X 6ft 1 ea $23.40 $23.40
0.875" OD x 0.065" WALL x 0.745" ID 6061 T6 TUBE X 6ft 1 ea $15.00 $15.00
0.625" OD x 0.058" WALL x 0.509" ID 4130 TUBE X 4ft 1 ea $15.14 $15.14
0.75" X 1.5" ALUMINUM 6061-T6 EXTRUDED RECTANGLE X 2ft 1 ea $13.85 $13.85
Shipping $16.22
Subtotal $141.61Steering and Suspension Parts302 Stainless Steel Torsion Spring 270Deg Angle, 1.342" Coil OD,.106" Wire, Cw/Lh (Same as 9287K94) 2 ea $8.60 $17.20
PTFE Flanged Sleeve Bearing for 3/8" Shaft Dia, 1/2" OD, 3/8" Length 1 ea $3.93 $3.93
Alloy Steel Shoulder Screw 3/8" Shoulder Dia, 3/8" L Shoulder, 5/16"-18 Thread 2 ea $1.33 $2.66
Easy-Adjust Threaded Connecting Rod 12" Overall Length, 1/4"-28 Threaded Female Ends 1 ea $14.96 $14.96
Alloy Steel Shoulder Screw 3/8" Shoulder Dia, 1/2" L Shoulder, 5/16"-18 Thread 3 ea $1.36 $4.08
PTFE Flanged Sleeve Bearing for 3/8" Shaft Dia, 1/2" OD, 1/2" Length 2 ea $4.12 $8.24
Easy-Adjust Threaded Connecting Rod 3" Overall Length, 1/4"-28 Threaded Female Ends 0 ea $13.85 $0.00
High-Strength Ball Joint Rod End 1/4"-28 Female Shank, 3250 lb Load Capacity (Right Handed Threads) 2 ea $3.65 $7.30
High-Strength Ball Joint Rod End 1/4"-28 Female Shank, 3250 lb Load Capacity (Left Handed Threads) 2 ea $3.65 $7.30
Right-Hand/Left-Hand Threaded Stud Black Oxide Steel, 1/4"- 20 Thread, 3" Length 4 ea $1.68 $6.72
Nylon Bearing Flanged, for 5/8" Shaft Dia, 3/4" OD, 3/4" Length 2 ea $4.80 $9.60
MDS-FILLED Nylon Bearing Sleeve, for 5/16" Shaft Dia, 7/16" OD, 5/8" Length 2 ea $2.05 $4.10
18-8 Stainless Steel Socket Head Cap Screw 5/16"-24 Thread, 2-1/2" Length 1 ea $11.57 $11.57
4130 Alloy Steel Sheet .125" Thick, 12" X 12" 1 ea $24.23 $24.23
Easy-Adjust Threaded Connecting Rod 6" Overall Length, 3/8"-24 Threaded Female Ends 2 ea $14.96 $29.92
High-Strength Ball Joint Rod End 3/8"-24 Male Shank, 5100 lb Load Capacity (Right Handed Threads) 2 ea $4.32 $8.64
High-Strength Ball Joint Rod End 3/8"-24 Male Shank, 5100 lb Load Capacity (Left Handed Threads) 2 ea $4.32 $8.64
Alloy 6061 Aluminum Rectangular Bar 3/8" Thick X 8" Wide X 3’ Length 1 ea $58.41 $58.41
Alloy Steel Shoulder Screw 3/8" Shoulder Dia, 3/8" L Shoulder, 5/16"-18 Thread 2 ea $1.33 $2.66
Subtotal $230.16Grand Total $3388.28

Bibliography
[1] Eggert, Rudolph. Engineering Design. New Jersey: Printice-Hall, 2004.
[2] Fehleu, Gunnar. The Recumbent Bicycle. 2nd ed. Grande Rapids, MI: OYB Press, 2003.
[3] Crowe, Clayton T, et al. Engineering Fluid Mechanics. 7th ed. New York: John Wiley and Sons, Inc., 2001.
[4] Ultman, David G. The Mechanical Design Process. 3rd ed. New York: The McGraw-Hill Companies, 2003.
[5] Milliken, William F, et al. Race Car Vehicle Dynamics. Warrendale, PA: SAE Press, 1995.
[6] Fibre Glast Developments. ADVANCED MOLDMAKING AND PLUG CONSTRUCTION. DVD Video.
[7] American Society of Mechanical Engineers, Rules for the2004 Human Powered Vehicle Competition, http://www.asme.org/hpv, 2008.
23