Embed Size (px)
Citation preview

Hindawi Publishing CorporationInternational Journal of ElectrochemistryVolume 2012, Article ID 264035, 5 pagesdoi:10.1155/2012/264035
Research Article
A Single Platinum Microelectrode for Identifying SoftDrink Samples
Lıgia Bueno1 and Thiago R. L. C. Paixao1, 2
1 Centro de Ciencias Naturais e Humanas, Universidade Federal do ABC, Santo Andre, SP, 09210-170, Brazil2 Instituto de Quımica, Universidade de Sao Paulo, Sao Paulo, SP, 05508-900, Brazil
Correspondence should be addressed to Thiago R. L. C. Paixao, [email protected]
Received 25 September 2011; Revised 1 November 2011; Accepted 1 November 2011
Academic Editor: Rubin Gulaboski
Copyright © 2012 L. Bueno and T. R. L. C. Paixao. This is an open access article distributed under the Creative CommonsAttribution License, which permits unrestricted use, distribution, and reproduction in any medium, provided the original work isproperly cited.
Cyclic voltammograms recorded with a single platinum microelectrode were used along with a non-supervised pattern recognition,namely, Principal Component Analysis, to conduct a qualitative analysis of sixteen different brands of carbonated soft drinks (Kuat,Soda Antarctica, H2OH!, Sprite 2.0, Guarana Antarctica, Guarana Antarctica Zero, Coca-Cola, Coca-Cola Zero, Coca-Cola Plus,Pepsi, Pepsi Light, Pepsi Twist, Pepsi Twist Light, Pepsi Twist 3, Schin Cola, and Classic Dillar’s). In this analysis, soft drink sampleswere not subjected to pre-treatment. Good differentiation among all the analysed soft drinks was achieved using the voltammetricdata. An analysis of the loading plots shows that the potentials of −0.65 V, −0.4 V, 0.4 V, and 0.750 V facilitated the discriminationprocess. The electrochemical processes related to this potential are the reduction of hydrogen ions and inhibition of the platinumoxidation by the caffeine adsorption on the electrode surface. Additionally, the single platinum microelectrode was useful for thequality control of the soft drink samples, as it helped to identify the time at which the beverage was opened.
1. Introduction
The food market is one of the fastest growing economic sec-tors in the world. The development of new smart devices foridentifying adulteration, detecting alteration of organolepticproperties, and consistently implementing storage processes[1–4] could enhance the value of food products and therebyprevent product losses. For some food products, authenticityis also very important, especially when companies that dis-tribute them seek market exclusivity. Thus, the developmentof devices that could be used to identify the origins of foodproducts would be very useful. Much work has already beencarried out on the quantification of individual compounds infood samples [5, 6] using expensive and complex techniques.In addition, the use of techniques to differentiate betweenfood products based on fingerprints of food samples has beenincreasing over the last ten years [1, 4, 7–10].
Array of nonspecific, low-selective, chemical sensors withan appropriate method of pattern recognition (called elec-tronic tongue) [11] can make the analysis of foods faster andeasier. An electronic tongue does not require the sample to be
treated beforehand and does not destroy the sample duringthe analysis, as is the case with spectrometric techniques[5, 12]. In addition, its operation is based on the globalselectivity concept. Therefore, it does not necessarily quantifythe analytes in a sample; rather, it collects fingerprint dataof the sample, such as UV-Vis spectra or voltammetric orcapacitance versus frequency behaviour [13–16].
Even though the use of intelligent devices in the liquidphase is a relatively new practice, a variety of samples havebeen analysed [3, 10, 11, 17–20]. Electronic tongues facilitatedifferentiation within short times, result in low costs, andhave nondestructive characteristics. Therefore, they have at-tracted the attention of companies in the food industry, aswell as researchers in the pharmaceutical and environmentalsciences.
The market share of soft drink consumption was 46.8%for the nonalcoholic drinks industry in 2005 [21], and thetotal market value of soft drinks reached $307.2 billionin 2004, with a market value forecast of $367.1 billion in2009. Clearly, the soft drink market is lucrative and has thepotential for high profits. Therefore, this study is aimed at
2 International Journal of Electrochemistry
developing a low-cost analytical method that can be appliedin the field to discriminate the origin of these nonalcoholicdrinks using voltammetric data recorded by employing onlya single working electrode (platinum microelectrode) alongwith unsupervised pattern recognition instead of an array ofsensors (electronic tongue). To the authors’ knowledge, onlytwo prior studies have focused on differentiation betweencarbonated soft drinks using an electronic tongue with col-orimetric detection [22] and 12 different highly cross-sensi-tive potentiometric sensors [23].
2. Experimental Section
2.1. Chemicals and Materials. Sulphuric acid was purchasedfrom Merck (Darmstadt, Germany) and was used withoutfurther purification. Deionised water was produced using awater purification system (Direct-Q 5 Ultrapure Water Sys-tems, Millipore, USA).
2.2. Electrodes and Instrumentation. A µAutolab (Eco Chem-ie, Netherlands) with GPES 4.8 software was used to takeelectrochemical measurements. In experiments that werecarried out using a platinum disk working electrode (d =3 mm), a homemade Ag/AgCl (saturated KCl) electrode [24]and platinum coil counter electrode were used. Platinummicroelectrodes with a diameter of 25 µm were constructedusing a pipette puller machine according to a technique re-ported in the literature [25]. The working electrode surfacewas polished with alumina (0.3 µm) and then washed thor-oughly with deionised water before taking electrochemicalmeasurements.
2.3. Soft Drink Samples. Sixteen different brands of softdrinks (Kuat, Soda Antarctica, H2OH!, Sprite 2.0, GuaranaAntarctica, Guarana Antarctica Zero, Coca-Cola Classic,Coca-Cola Zero, Coca-Cola Plus, Pepsi Classic, Pepsi Light,Pepsi Twist, Pepsi Twist Light, Pepsi Twist 3, Schin Cola,and Classic Dillar’s) purchased from different supermarketsin Santo Andre, Brazil, were used in this study. The meas-urements were performed directly on the soft drink sampleswithout the addition of other chemicals.
2.4. Chemometrics. Principal component analysis (PCA) andhierarchical cluster analysis (HCA) were performed usingStatistica 10.0 (StatSoft Inc., USA). The analyses were carriedout using the current values recorded without any prepro-cessing of the input. A range of potentials from 0.8 to −0.8 Vwere recorded in triplicate for each independent sampleusing previously polished working electrodes.
3. Results and Discussion
Initially, in order to discriminate between cola soft drinks,cyclic voltammograms were recorded using a platinumworking macroelectrode that had been placed directly inthe untreated beverages. The voltammograms (not shown)showed that the CO2 present in each beverage interferedwith the measurements, resulting in very noisy and irrepro-ducible voltammetric behaviour. Therefore, it was difficult
−0.8 −0.4 0 0.4 0.8
−1.8
−1.2
−0.6
0
CocaPepsiSchin
E/V versus Ag/AgCl
I/µ
A
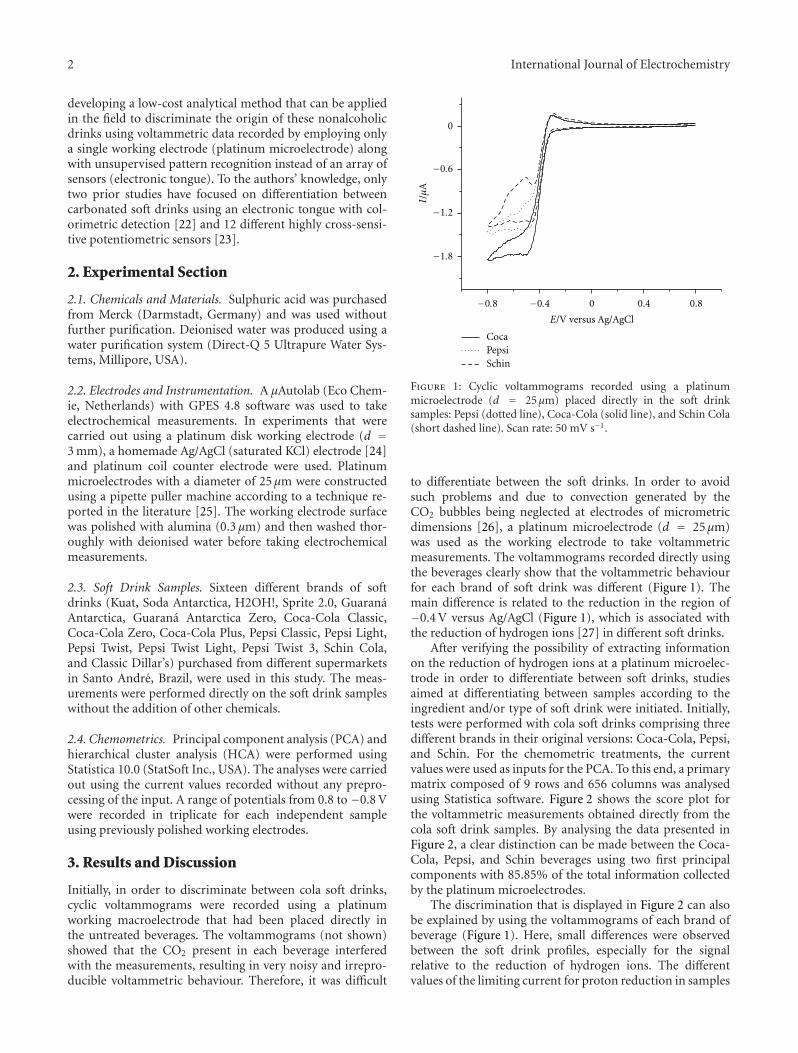
Figure 1: Cyclic voltammograms recorded using a platinummicroelectrode (d = 25µm) placed directly in the soft drinksamples: Pepsi (dotted line), Coca-Cola (solid line), and Schin Cola(short dashed line). Scan rate: 50 mV s−1.
to differentiate between the soft drinks. In order to avoidsuch problems and due to convection generated by theCO2 bubbles being neglected at electrodes of micrometricdimensions [26], a platinum microelectrode (d = 25µm)was used as the working electrode to take voltammetricmeasurements. The voltammograms recorded directly usingthe beverages clearly show that the voltammetric behaviourfor each brand of soft drink was different (Figure 1). Themain difference is related to the reduction in the region of−0.4 V versus Ag/AgCl (Figure 1), which is associated withthe reduction of hydrogen ions [27] in different soft drinks.
After verifying the possibility of extracting informationon the reduction of hydrogen ions at a platinum microelec-trode in order to differentiate between soft drinks, studiesaimed at differentiating between samples according to theingredient and/or type of soft drink were initiated. Initially,tests were performed with cola soft drinks comprising threedifferent brands in their original versions: Coca-Cola, Pepsi,and Schin. For the chemometric treatments, the currentvalues were used as inputs for the PCA. To this end, a primarymatrix composed of 9 rows and 656 columns was analysedusing Statistica software. Figure 2 shows the score plot forthe voltammetric measurements obtained directly from thecola soft drink samples. By analysing the data presented inFigure 2, a clear distinction can be made between the Coca-Cola, Pepsi, and Schin beverages using two first principalcomponents with 85.85% of the total information collectedby the platinum microelectrodes.
The discrimination that is displayed in Figure 2 can alsobe explained by using the voltammograms of each brand ofbeverage (Figure 1). Here, small differences were observedbetween the soft drink profiles, especially for the signalrelative to the reduction of hydrogen ions. The differentvalues of the limiting current for proton reduction in samples

International Journal of Electrochemistry 3
−20
−10
0
10
20
−20 −10 0 10 20
PC1 (65.98%)
PC
2(1
9.87
%)
Pepsi
Schin
Coca-Cola
Figure 2: A PCA score biplot for cola soft drinks (Pepsi, Coca-Cola, and Schin Cola). The biplot was obtained using current valuesrecorded with a platinum microelectrode. Number of replicates persample: 3.
could be related to the interference of various substancein the reduction process of H+, which could result in thedifferentiation of sample with the same pH values of eachdrink (Coca-Cola Classic (pH = 2.50) and Pepsi (pH = 2.47)[22]), validate the idea that each type of soft drink has aunique fingerprint [28].
Additionally, the loading plots in Figure 2 (not shown)were analysed to determine the weights of the different partsof the voltammograms (current values measured at differentpotentials) in relation to the extent of their influence onthe direction of the principal components considered in thedifferentiation process. According to this analysis, the cur-rents obtained for the potentials −0.65 V, −0.4 V, 0.4 V, and0.750 V facilitated the differentiation shown in Figure 2. Thissupports the assumption that differentiation can be achievedbased on the current for the reduction of the hydrogen ions atthe potentials −0.65 V and −0.4 V. The other two potentialsare discussed at a subsequent point in this article.
After confirming that it is possible to discriminate be-tween cola soft drinks of different brands, the possibilityof differentiating between different types of soft drinks ofthe same or different brands was evaluated. The brandsand types studied were Pepsi Classic, Pepsi Light, PepsiLight Twist, Pepsi Twist, Coca-Cola Classic, Coca-ColaZero, and Coca-Cola Plus. A similar procedure to the onereported for the results in Figure 2 was employed. Thescore plot obtained is shown in Figure 3. In this case,the voltammetric data recorded with a single platinummicroelectrode with unsupervised pattern recognition wasable to differentiate between the brands Coca-Cola andPepsi, which are represented on opposite sides of thescore plot. This emphasizes the possibility of differentiatingbetween samples using the proposed method. In order toshow the degree of similarity of the PCA score plots morequantitatively, HCA was performed using the data’s fulldimensionality of the data reported in the Figure 3 (resultsnot shown). No misclassifications (0% error rate) were found
30
−30 −15 0 15 30
PC1 (55.54%)
PC
2(3
3.94
%)
CC
CZ
CP
PC PL
PLTPT
−20
−10
0
10
20
Figure 3: A PCA score biplot for different brands of cola softdrinks. The biplot was obtained using current values recorded witha platinum microelectrode. Number of replicates per sample: 3.Abbreviations: Pepsi Classic (PC), Pepsi Light (PL), Pepsi LightTwist (PLT), Pepsi Twist (PT), Coca-Cola Classic (CC), Coca-ColaZero (CZ), and Coca-Cola Plus (CP).
and the discrimination was consistent with the PCA results(Figure 3).
Once the possibility of differentiating between the colasoft drink samples was demonstrated, new samples weretested. They were Kuat, Soda Antarctica, H2OH!, Sprite2.0, Guarana Antarctica, Guarana Antarctica Zero, Coca-Cola, Coca-Cola Zero, Pepsi, Pepsi Light, Pepsi Twist, PepsiTwist Light, Pepsi Twist 3, Schin Cola, and Classic Dillar’s.A similar procedure to the one for producing the data inFigures 2 and 3 was employed (Figure 4). Separation of thebrands was notable, and proved that our device can be usedto differentiate between samples with and without cola intheir formulation. Samples containing cola were oppositeto those that did not contain cola, which shows that theseparation was not a result of only the pH values of beverages.This result corroborates the result obtained using the deviceproposed by Zhang and Suslick [22], which was based oncolorimetric device. Applying an HCA model (not shown)there is only a single case of misclassification in the 45samples analysed (one Guarana Antarctica sample did notsimilar to the other 2 samples of the same soft drink), that is,a misclassification rate of 2.2%.
To understand which species were responsible for the dif-ferences between soft drinks and why the currents recordedat 0.4 V and 0.750 V were important for differentiation,new studies were performed. In particular, the studies wereperformed to verify whether caffeine content, which differsbetween cola and non-cola soft drinks, facilitates the differ-entiation. Caffeine interacts with the surface of the platinumelectrode [29]. Hence, cyclic voltammograms were recordedin the presence and absence of caffeine (Figure 5). Blockingof the platinum surface by adsorbed caffeine molecules wasobserved (Figure 5). In other words, there was a reductionin the electroactive platinum area and consequent reduction
4 International Journal of Electrochemistry
H2OH
−20
−10
0
10
20
30
−30 −20 −10 0 10 20 30 40
PC1 (60.13%)
PC
2(2
2.86
%)
S
SC
PT3
CD
K
GASA
GAZ
CC
CZ
PC
PL PLT
PT
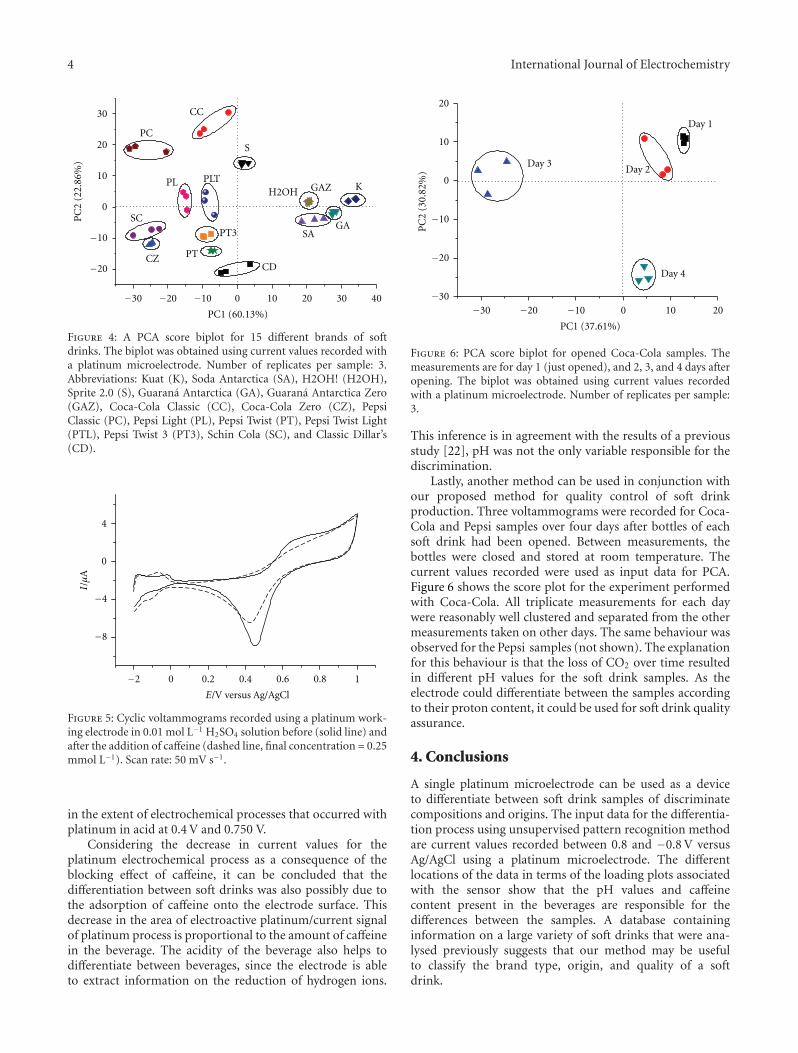
Figure 4: A PCA score biplot for 15 different brands of softdrinks. The biplot was obtained using current values recorded witha platinum microelectrode. Number of replicates per sample: 3.Abbreviations: Kuat (K), Soda Antarctica (SA), H2OH! (H2OH),Sprite 2.0 (S), Guarana Antarctica (GA), Guarana Antarctica Zero(GAZ), Coca-Cola Classic (CC), Coca-Cola Zero (CZ), PepsiClassic (PC), Pepsi Light (PL), Pepsi Twist (PT), Pepsi Twist Light(PTL), Pepsi Twist 3 (PT3), Schin Cola (SC), and Classic Dillar’s(CD).
4
0
−4
−8
−2 0 0.2 0.4 0.6 0.8 1
E/V versus Ag/AgCl
I/µ
A
Figure 5: Cyclic voltammograms recorded using a platinum work-ing electrode in 0.01 mol L−1 H2SO4 solution before (solid line) andafter the addition of caffeine (dashed line, final concentration = 0.25mmol L−1). Scan rate: 50 mV s−1.
in the extent of electrochemical processes that occurred withplatinum in acid at 0.4 V and 0.750 V.
Considering the decrease in current values for theplatinum electrochemical process as a consequence of theblocking effect of caffeine, it can be concluded that thedifferentiation between soft drinks was also possibly due tothe adsorption of caffeine onto the electrode surface. Thisdecrease in the area of electroactive platinum/current signalof platinum process is proportional to the amount of caffeinein the beverage. The acidity of the beverage also helps todifferentiate between beverages, since the electrode is ableto extract information on the reduction of hydrogen ions.
Day 1
Day 2
Day 4
Day 3
PC1 (37.61%)
PC
2(3
0.82
%)
−30 −20 −10 0 10 20−30
−20
−10
0
10
20
Figure 6: PCA score biplot for opened Coca-Cola samples. Themeasurements are for day 1 (just opened), and 2, 3, and 4 days afteropening. The biplot was obtained using current values recordedwith a platinum microelectrode. Number of replicates per sample:3.
This inference is in agreement with the results of a previousstudy [22], pH was not the only variable responsible for thediscrimination.
Lastly, another method can be used in conjunction withour proposed method for quality control of soft drinkproduction. Three voltammograms were recorded for Coca-Cola and Pepsi samples over four days after bottles of eachsoft drink had been opened. Between measurements, thebottles were closed and stored at room temperature. Thecurrent values recorded were used as input data for PCA.Figure 6 shows the score plot for the experiment performedwith Coca-Cola. All triplicate measurements for each daywere reasonably well clustered and separated from the othermeasurements taken on other days. The same behaviour wasobserved for the Pepsi samples (not shown). The explanationfor this behaviour is that the loss of CO2 over time resultedin different pH values for the soft drink samples. As theelectrode could differentiate between the samples accordingto their proton content, it could be used for soft drink qualityassurance.
4. Conclusions
A single platinum microelectrode can be used as a deviceto differentiate between soft drink samples of discriminatecompositions and origins. The input data for the differentia-tion process using unsupervised pattern recognition methodare current values recorded between 0.8 and −0.8 V versusAg/AgCl using a platinum microelectrode. The differentlocations of the data in terms of the loading plots associatedwith the sensor show that the pH values and caffeinecontent present in the beverages are responsible for thedifferences between the samples. A database containinginformation on a large variety of soft drinks that were ana-lysed previously suggests that our method may be usefulto classify the brand type, origin, and quality of a softdrink.

International Journal of Electrochemistry 5
Acknowledgments
The authors are grateful to FAPESP (Fundacao de Amparo aPesquisa do Estado de Sao Paulo; Grant number 2009/07859-1), CAPES, and CNPq (Conselho Nacional de Desenvolvi-mento Cientıfico e Tecnologico) for financial support and,once again, to CAPES for the fellowship awarded to L.Bueno.
References
[1] L. Escuder-Gilabert and M. Peris, “Review: highlights in recentapplications of electronic tongues in food analysis,” AnalyticaChimica Acta, vol. 665, no. 1, pp. 15–25, 2010.
[2] P. Ciosek and W. Wroblewski, “Potentiometric electronic ton-gues for foodstuff and biosample recognition-an overview,”Sensors, vol. 11, no. 5, pp. 4688–4701, 2011.
[3] J. Gallardo, S. Alegret, and M. Del Valle, “Application of a po-tentiometric electronic tongue as a classification tool in foodanalysis,” Talanta, vol. 66, no. 5, pp. 1303–1309, 2005.
[4] A. Legin, A. Rudnitskaya, Y. G. Vlasov, C. Di Natale, F. Davide,and A. D’Amico, “Tasting of beverages using an electronictongue,” Sensors and Actuators B, vol. 44, no. 1–3, pp. 291–296,1997.
[5] O. L. A. D. Zucchi, S. Moreira, M. J. Salvador, and L. L. Santos,“Multielement analysis of soft drinks by x-ray fluorescencespectrometry,” Journal of Agricultural and Food Chemistry, vol.53, no. 20, pp. 7863–7869, 2005.
[6] M. S. Garcıa-Falcon and J. Simal-Gandara, “Determination offood dyes in soft drinks containing natural pigments by liquidchromatography with minimal clean-up,” Food Control, vol.16, no. 3, pp. 293–297, 2005.
[7] Q. Chen, J. Zhao, and S. Vittayapadung, “Identification of thegreen tea grade level using electronic tongue and pattern rec-ognition,” Food Research International, vol. 41, no. 5, pp. 500–504, 2008.
[8] P. Ciosek and W. Wroblewski, “Miniaturized electronic tonguewith an integrated reference microelectrode for the recogni-tion of milk samples,” Talanta, vol. 76, no. 3, pp. 548–556,2008.
[9] A. L. A. Rudnitskaya, B. Seleznev, and Y. Vlasov, “Recognitionof liquid and flesh food using an ’electronic tongue’,” Interna-tional Journal of Food Science and Technology, vol. 37, no. 4, pp.375–385, 2002.
[10] E. A. Baldwin, J. Bai, A. Plotto, and S. Dea, “Electronic nosesand tongues: applications for the food and pharmaceutical in-dustries,” Sensors, vol. 11, no. 5, pp. 4744–4766, 2011.
[11] Y. Vlasov, A. Legin, A. Rudnitskaya, C. Di Natale, and A.D’Amico, “Nonspecific sensor arrays (”electronic tongue”) forchemical analysis of liquids: (IUPAC technical report),” Pureand Applied Chemistry, vol. 77, no. 11, pp. 1965–1983, 2005.
[12] A. Stoj, “Methods of detecting adulteration of wines,” Zywn-osc-Nauka Technologia Jakosc, vol. 18, no. 2, pp. 17–26, 2011.
[13] M. Casale, P. Oliveri, C. Armanino, S. Lanteri, and M. Forina,“NIR and UV-vis spectroscopy, artificial nose and tongue:comparison of four fingerprinting techniques for the charac-terisation of Italian red wines,” Analytica Chimica Acta, vol.668, no. 2, pp. 143–148, 2010.
[14] E. S. Medeiros, R. Gregorio Jr., R. A. Martinez, and L. H. C.Mattoso, “A taste sensor array based on polyaniline nanofibersfor orange juice quality assessment,” Sensor Letters, vol. 7, no.1, pp. 24–30, 2009.
[15] R. H. Labrador, J. Olsson, F. Winquist, R. Martınez-Manez,and J. Soto, “Determination of bisulfites in wines with an elec-tronic tongue based on pulse voltammetry,” Electroanalysis,vol. 21, no. 3–5, pp. 612–617, 2009.
[16] F. Winquist, R. Bjorklund, C. Krantz-Rulcker, I. Lundstrom, K.Ostergren, and T. Skoglund, “An electronic tongue in the dairyindustry,” Sensors and Actuators B, vol. 111-112, pp. 299–304,2005.
[17] W. Novakowski, M. Bertotti, and T. R. L. C. Paixao, “Use ofcopper and gold electrodes as sensitive elements for fabrica-tion of an electronic tongue: discrimination of wines andwhiskies,” Microchemical Journal, vol. 99, no. 1, pp. 145–151,2011.
[18] L. M. I. Codinachs, J. P. Kloock, M. J. Schoning et al., “Elec-tronic integrated multisensor tongue applied to grape juiceand wine analysis,” Analyst, vol. 133, no. 10, pp. 1440–1448,2008.
[19] F. Winquist, C. Krantz-Rulcker, P. Wide, and I. Lundstrom,“Monitoring of freshness of milk by an electronic tongue onthe basis of voltammetry,” Measurement Science and Technol-ogy, vol. 9, no. 12, pp. 1937–1946, 1998.
[20] T. R. L. C. Paixao and M. Bertotti, “Fabrication of disposablevoltammetric electronic tongues by using Prussian Blue filmselectrodeposited onto CD-R gold surfaces and recognition ofmilk adulteration,” Sensors and Actuators B, vol. 137, no. 1, pp.266–273, 2009.
[21] Datamonitor, “Global Soft Drinks: Industry Profile,” NewYork, NY, USA. Reference Code: 0199-0802, 2005.
[22] C. Zhang and K. S. Suslick, “Colorimetric sensor array for softdrink analysis,” Journal of Agricultural and Food Chemistry,vol. 55, no. 2, pp. 237–242, 2007.
[23] L. Lvova, S. S. Kim, A. Legin et al., “All-solid-state electronictongue and its application for beverage analysis,” AnalyticaChimica Acta, vol. 468, no. 2, pp. 303–314, 2002.
[24] J. J. Pedrotti, L. Angnes, and I. G. R. Gutz, “Miniaturized ref-erence electrodes with microporous polymer junctions,” Elec-troanalysis, vol. 8, no. 7, pp. 673–675, 1996.
[25] P. N. Bartlett and D. J. Caruana, “Electrochemical immobili-zation of enzymes part V.∗ Microelectrodes for the detec-tion of glucose based on glucose oxidase immobilized in apoly(phenol) film,” The Analyst, vol. 117, no. 8, pp. 1287–1292,1992.
[26] C. Amatore, C. Pebay, L. Thouin, A. Wang, and J. S. Wark-ocz, “Difference between ultramicroelectrodes and microelec-trodes: influence of natural convection,” Analytical Chemistry,vol. 82, no. 16, pp. 6933–6939, 2010.
[27] Z. Yoshida, “Preparation of an ideal thin mercury film elec-trode and its electrochemical property,” Bulletin of the Chemi-cal Society of Japan, vol. 54, no. 2, pp. 562–567, 1981.
[28] A. Riul, D. S. Dos Santos, K. Wohnrath et al., “Artificial tastesensor: efficient combination of sensors made from Langmuir-Blodgett films of conducting polymers and a ruthenium com-plex and self-assembled films of an azobenzene-containingpolymer,” Langmuir, vol. 18, no. 1, pp. 239–245, 2002.
[29] P. Saba, W. A. Brown, and S. Omanovic, “Interactive behaviorof caffeine at a platinum electrode surface,” Materials Chem-istry and Physics, vol. 100, no. 2-3, pp. 285–291, 2006.

Submit your manuscripts athttp://www.hindawi.com
Hindawi Publishing Corporationhttp://www.hindawi.com Volume 2014
Inorganic ChemistryInternational Journal of
Hindawi Publishing Corporation http://www.hindawi.com Volume 2014
International Journal ofPhotoenergy
Hindawi Publishing Corporationhttp://www.hindawi.com Volume 2014
Carbohydrate Chemistry
International Journal of
Hindawi Publishing Corporationhttp://www.hindawi.com Volume 2014
Journal of
Chemistry
Hindawi Publishing Corporationhttp://www.hindawi.com Volume 2014
Advances in
Physical Chemistry
Hindawi Publishing Corporationhttp://www.hindawi.com
Analytical Methods in Chemistry
Journal of
Volume 2014
Bioinorganic Chemistry and ApplicationsHindawi Publishing Corporationhttp://www.hindawi.com Volume 2014
SpectroscopyInternational Journal of
Hindawi Publishing Corporationhttp://www.hindawi.com Volume 2014
The Scientific World JournalHindawi Publishing Corporation http://www.hindawi.com Volume 2014
Medicinal ChemistryInternational Journal of
Hindawi Publishing Corporationhttp://www.hindawi.com Volume 2014
Chromatography Research International
Hindawi Publishing Corporationhttp://www.hindawi.com Volume 2014
Applied ChemistryJournal of
Hindawi Publishing Corporationhttp://www.hindawi.com Volume 2014
Hindawi Publishing Corporationhttp://www.hindawi.com Volume 2014
Theoretical ChemistryJournal of
Hindawi Publishing Corporationhttp://www.hindawi.com Volume 2014
Journal of
Spectroscopy
Analytical ChemistryInternational Journal of
Hindawi Publishing Corporationhttp://www.hindawi.com Volume 2014
Journal of
Hindawi Publishing Corporationhttp://www.hindawi.com Volume 2014
Quantum Chemistry
Hindawi Publishing Corporationhttp://www.hindawi.com Volume 2014
Organic Chemistry International
ElectrochemistryInternational Journal of
Hindawi Publishing Corporation http://www.hindawi.com Volume 2014
Hindawi Publishing Corporationhttp://www.hindawi.com Volume 2014
CatalystsJournal of


![EthanolElectrooxidationonPtwithLanthanumOxideas ...downloads.hindawi.com/journals/ijelc/2012/674150.pdf · (Merck) was employed as solvent and reducing agent [17– 19]. The reduction](https://img.pdfslide.us/doc/110x75/605a907f4d5adf76f00063b7/ethanolelectrooxidationonptwithlanthanumoxideas-merck-was-employed-as-solvent.jpg)


![ElectrochemicalSensorforDeterminationofParathionBasedon ...downloads.hindawi.com/journals/ijelc/2011/986494.pdf · matography (GC),oftencoupledto mass spectroscopy (MS) [1, 2]. Direct](https://img.pdfslide.us/doc/110x75/5eaf040f96c164225e734be1/electrochemicalsensorfordeterminationofparathionbasedon-matography-gcoftencoupledto.jpg)


![EffectofElementalCompositionontheStructure ...downloads.hindawi.com/journals/ijelc/2011/240837.pdf · substrates using the synthetic route reported by Wang et al. [30]. The correlation](https://img.pdfslide.us/doc/110x75/5e77c4704347495c951653e0/effectofelementalcompositiononthestructure-substrates-using-the-synthetic-route.jpg)


![ElectrochemicalBehaviorofBiologically …downloads.hindawi.com/journals/ijelc/2011/154804.pdfcancer [2], antioxidant [3], antirheumatoidal [4], and anti-HIV [5, 6]. Studies showed](https://img.pdfslide.us/doc/110x75/5f61e87cd8a3b055dd17da94/electrochemicalbehaviorofbiologically-cancer-2-antioxidant-3-antirheumatoidal.jpg)


