Embed Size (px)
Citation preview

Management and Development: Evidence
from Pakistan
Asif Bajwa (Pakistan Statistical Bureau ), Ali Choudhary (SBP - State Bank of Pakistan), Renata Lemos (World Bank) and John Van Reenen (CEP &
LSE)
IGC Growth Week, June 2016
Ohio, USA Sialkot, Pakistan
2
LARGE PRODUCTIVITY DIFFERENCES BETWEEN COUNTRIES
Source: Jones and Romer (2010). US=1
Findings from 10+ years of management research
1) Aspects of core management practices can be measured
2) Developing country management poor by global standards
3) Management practices play a key role in performance
Very positive: huge potential for faster growth.
Thank IGC, PEDL and SBP for funding this research
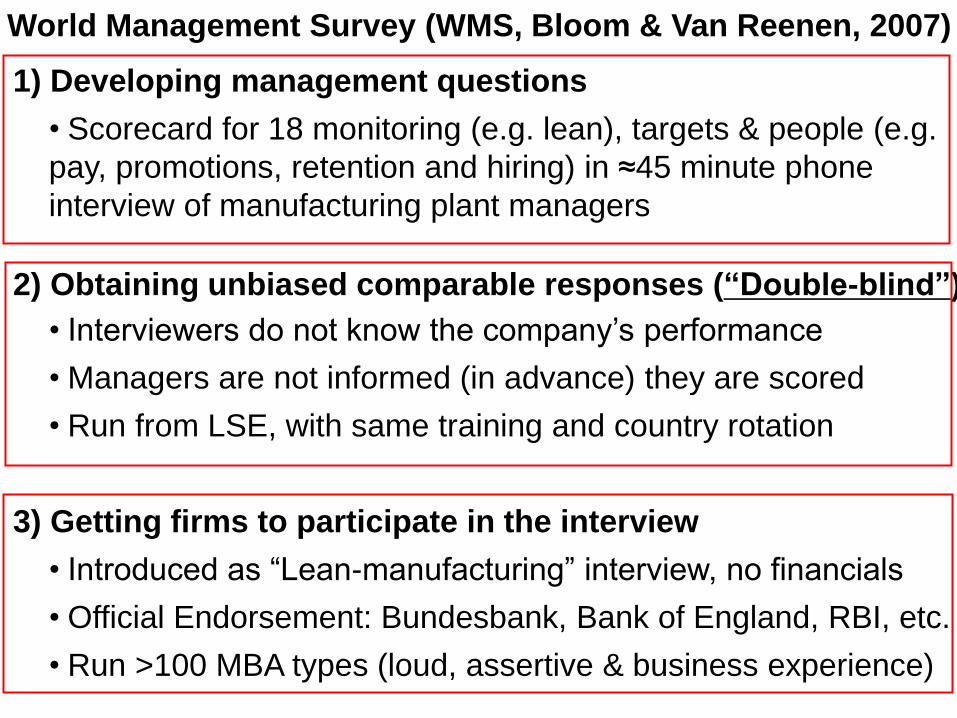
1) Developing management questions
• Scorecard for 18 monitoring (e.g. lean), targets & people (e.g.
pay, promotions, retention and hiring) in ≈45 minute phone
interview of manufacturing plant managers
2) Obtaining unbiased comparable responses (“Double-blind”)
• Interviewers do not know the company’s performance
• Managers are not informed (in advance) they are scored
• Run from LSE, with same training and country rotation
3) Getting firms to participate in the interview
• Introduced as “Lean-manufacturing” interview, no financials
• Official Endorsement: Bundesbank, Bank of England, RBI, etc.
• Run >100 MBA types (loud, assertive & business experience)
World Management Survey (WMS, Bloom & Van Reenen, 2007)

Score (1): Measures
tracked do not
indicate directly
if overall
business
objectives are
being met.
Certain
processes aren’t
tracked at all
(3): Most key
performance
indicators
are tracked
formally.
Tracking is
overseen by
senior
management
(5): Performance is
continuously
tracked and
communicated,
both formally and
informally, to all
staff using a range
of visual
management tools
Example monitoring question, scored based on a number of
questions starting with “How is performance tracked?”
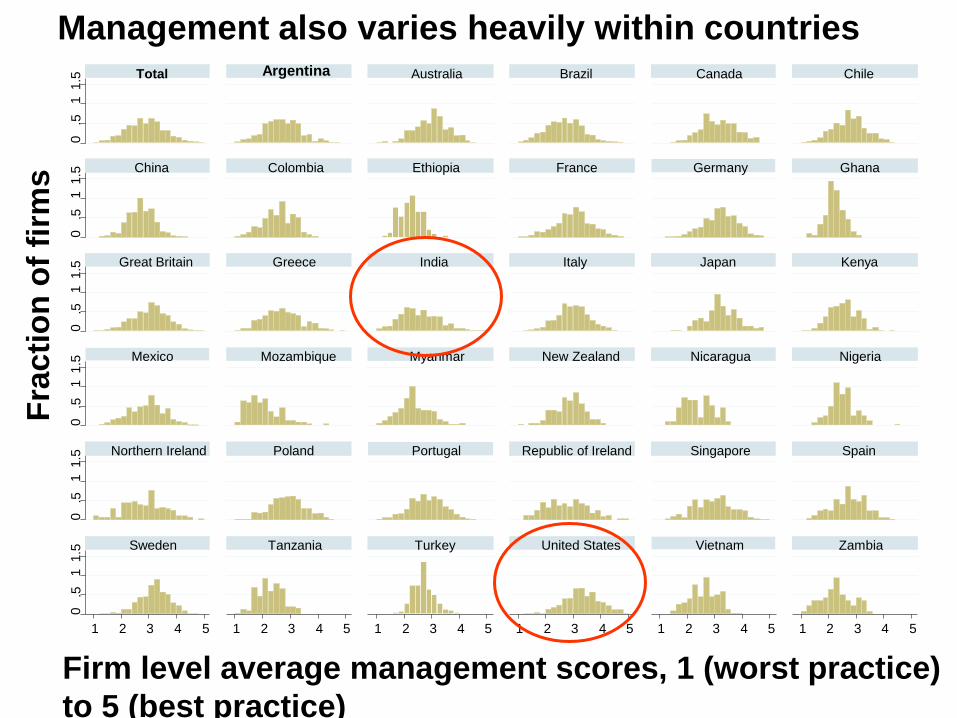
Fra
cti
on
of
firm
s
Firm level average management scores, 1 (worst practice)
to 5 (best practice)
0
.5
1 1.5
0
.5
1 1.5
0
.5
1 1.5
0
.5
1 1.5
0
.5
1 1.5
0
.5
1 1.5
1 2 3 4 5 1 2 3 4 5 1 2 3 4 5 1 2 3 4 5 1 2 3 4 5 1 2 3 4 5
Total Argentina Australia Brazil Canada Chile
China Colombia Ethiopia France Germany Ghana
Great Britain Greece India Italy Japan Kenya
Mexico Mozambique Myanmar New Zealand Nicaragua Nigeria
Northern Ireland Poland Portugal Republic of Ireland Singapore Spain
Sweden Tanzania Turkey United States Vietnam Zambia
Management also varies heavily within countries

WMS Expensive! Developed more traditional “closed
answer” questions: Management and Organizational
Practices survey (MOPS)
Worked with US Census
Bureau. Delivered to 47,534
manufacturing plants in 2011
(asking about 2010 & 2005)
Quick & easy to fill out. Also
mandatory - so ~80% of
plants responded, covering
>50% of manufacturing
employment
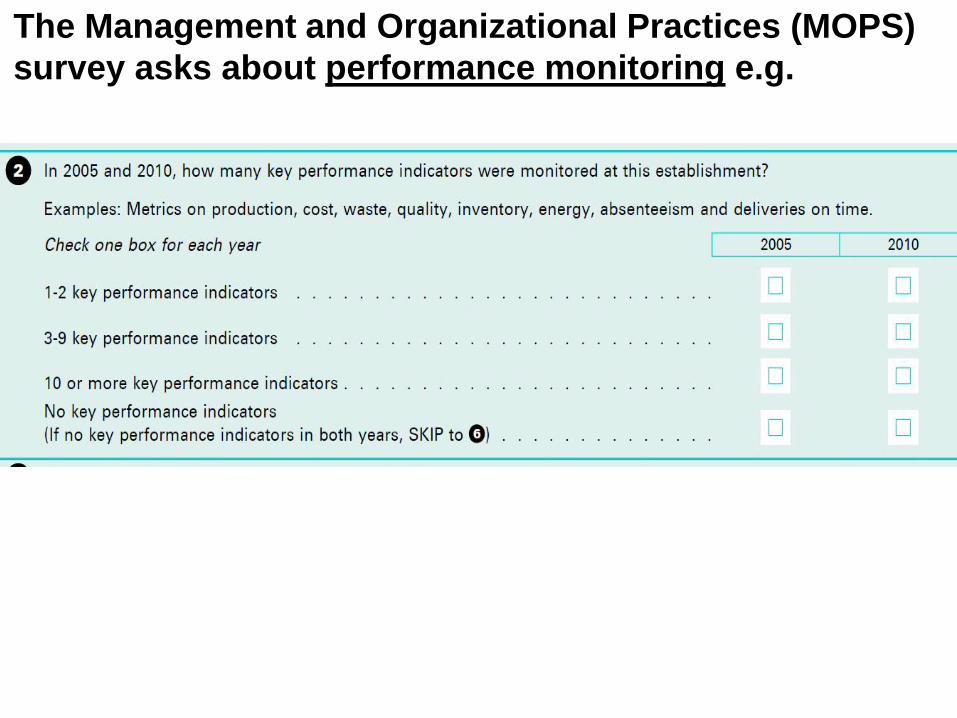
The Management and Organizational Practices (MOPS)
survey asks about performance monitoring e.g.
Findings from 10+ years of management research
1) Aspects of core management practices can be measured
2) Developing country management poor by global standards
3) Management practices play a key role in performance
Very positive: huge potential for faster growth.
Thank IGC, PEDL and SBP for funding this research

Average Management Scores by Country
Note: Unweighted average management scores; # interviews in right column (total = 15,489); all waves pooled (2004-2014)
2.027 2.221 2.225
2.254 2.316
2.372 2.397
2.516 2.549
2.578 2.608 2.611
2.684 2.699 2.706 2.712 2.720
2.748 2.752 2.762
2.826 2.839 2.851 2.861
2.887 2.899
2.978 2.997 3.015 3.033
3.142 3.188
3.210 3.230
3.308
1.5 2 2.5 3 3.5 Average Management Scores, Manufacturing
Mozambique Ethiopia
Ghana Tanzania
Zambia Myanmar
Nicaragua Nigeria Kenya
Colombia Vietnam
India Brazil
Argentina Turkey China
Greece Spain Chile
Republic of Ireland Portugal
Northern Ireland New Zealand
Singapore Poland Mexico
Italy Australia
France Great Britain
Canada Sweden
Germany Japan
United States
Africa
Asia
Oceania
Europe
Latin America
North America
1564
178
749
404
419
1540
780
473
632
406
525
364
151
137
410
161
611
214
585
763
332
568
1151
151
170
937
185
118
97
147
69
150
108
131
109
Interviews
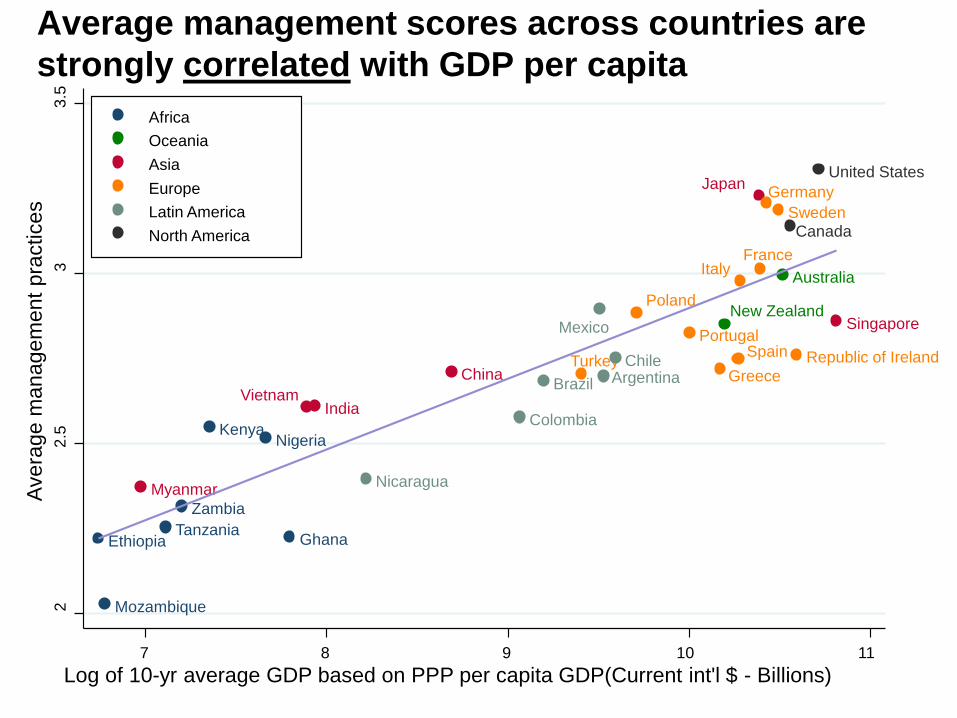
Average management scores across countries are
strongly correlated with GDP per capita
Ethiopia Ghana
Kenya
Mozambique
Nigeria
Tanzania
Zambia
Australia
New Zealand
China
India
Japan
Myanmar
Singapore
Vietnam
France
Germany
Greece
Italy
Poland
Portugal
Republic of Ireland Spain
Sweden
Turkey Argentina Brazil
Chile
Colombia
Mexico
Nicaragua
Canada
United States
2
2.5
3
3
.5
Avera
ge m
anage
ment
pra
ctices
7 8 9 10 11
Log of 10-yr average GDP based on PPP per capita GDP(Current int'l $ - Billions)
Africa
Oceania
Asia
Europe
Latin America
North America

Findings from 10+ years of management research
1) Aspects of core management practices can be measured
2) Developing country management poor by global standards
3) Management practices play a key role in performance
Very positive: huge potential for faster growth.
Thank IGC, PEDL and SBP for funding this research

Management scores are associated with
significantly better performance
Management score decile
Pro
du
cti
vit
y
Pro
fit
Ou
tpu
t g
row
th
Ex
po
rte
rs
R&
D p
er
em
plo
ye
e
Pa
ten
ts p
er
em
plo
ye
e
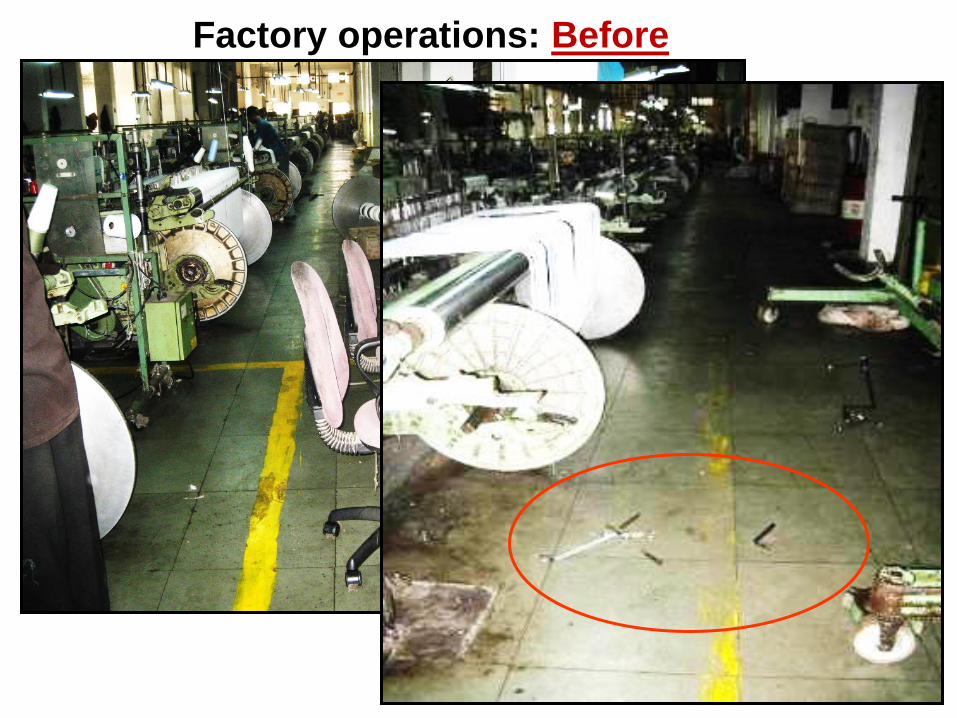
Factory operations: Before
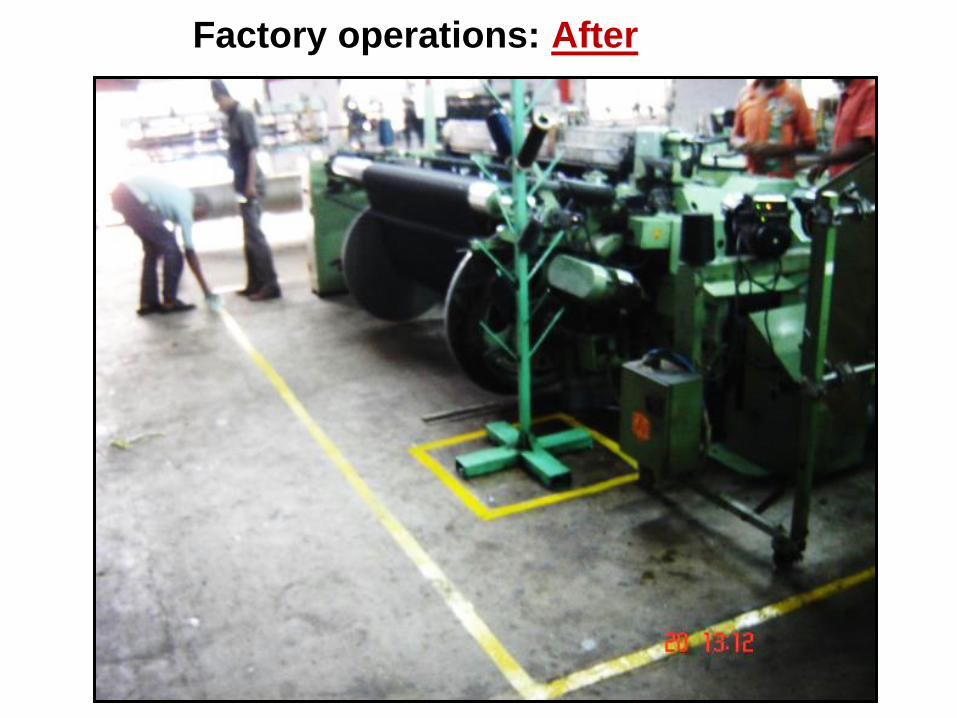
Factory operations: After
80
100
120
140
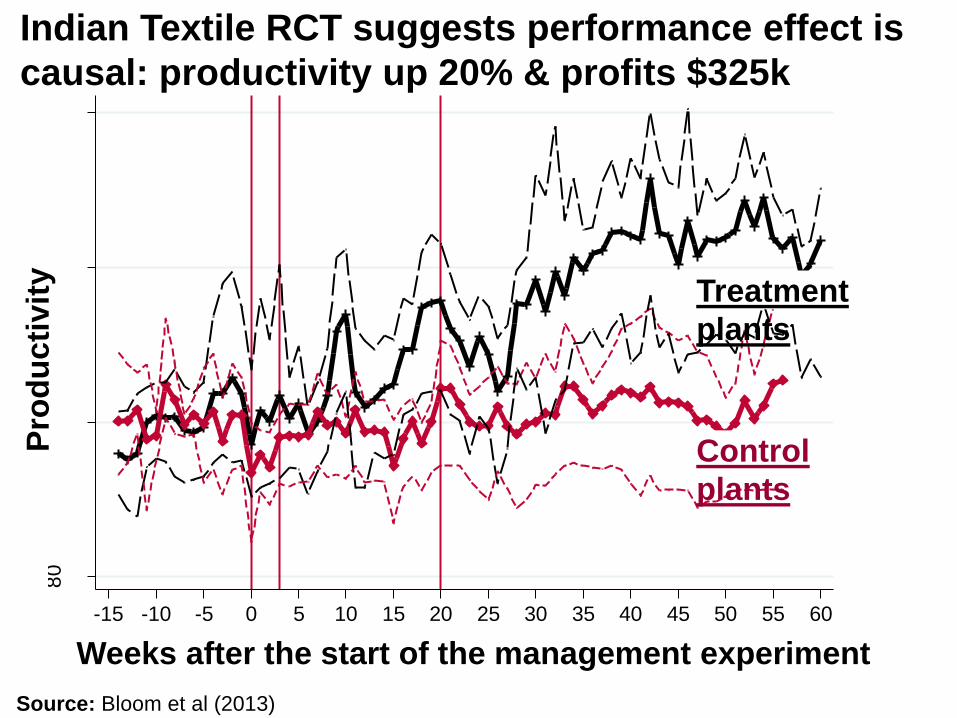
-15 -10 -5 0 5 10 15 20 25 30 35 40 45 50 55 60
Indian Textile RCT suggests performance effect is
causal: productivity up 20% & profits $325k
Control
plants
Treatment
plants
Weeks after the start of the management experiment
Pro
du
cti
vit
y
Source: Bloom et al (2013)
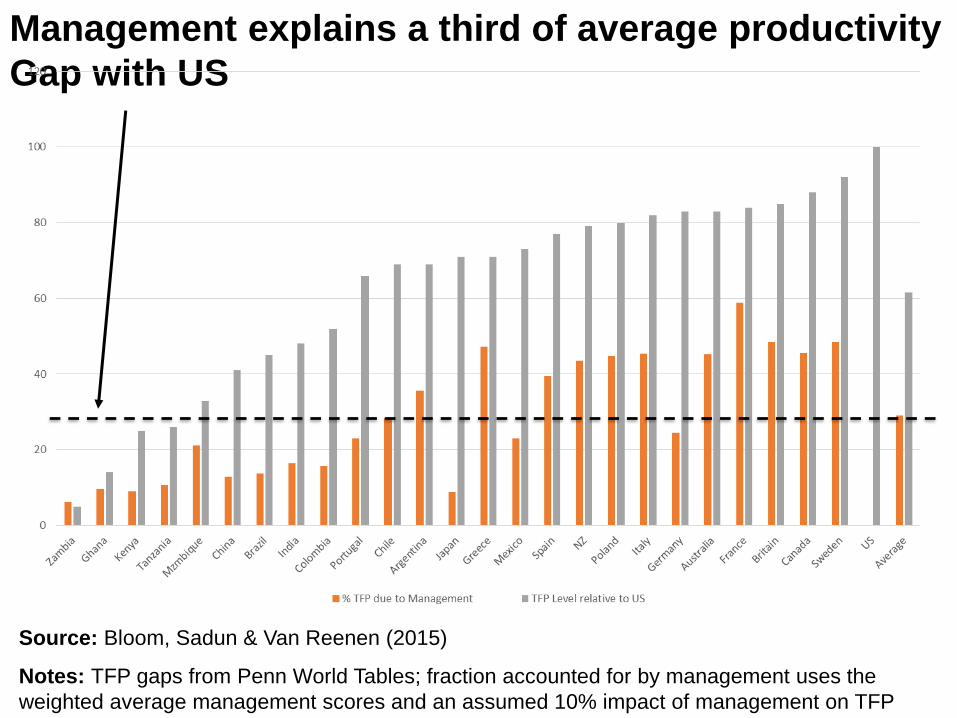
Management explains a third of average productivity
Gap with US
Source: Bloom, Sadun & Van Reenen (2015)
Notes: TFP gaps from Penn World Tables; fraction accounted for by management uses the
weighted average management scores and an assumed 10% impact of management on TFP
NEXT STEPS
• Can MOPs be successfully carried out in emerging
economy like Pakistan?
• How are the findings the same or different than the US
and other countries?
• Ali and Renata will briefly talk about this shortly..

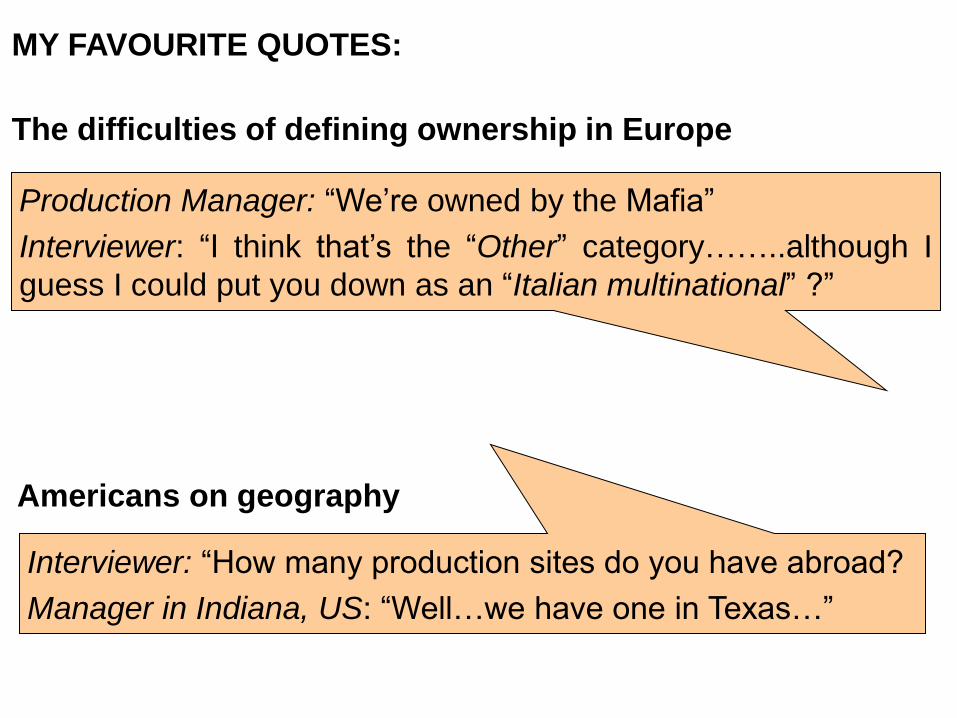
MY FAVOURITE QUOTES:
[Male manager speaking to an Australian female interviewer]
Production Manager: “Your accent is really cute and I love the
way you talk. Do you fancy meeting up near the factory?”
Interviewer “Sorry, but I’m washing my hair every night for the
next month….”
The traditional British Chat-Up
MY FAVOURITE QUOTES:
Interviewer: “How many production sites do you have abroad?
Manager in Indiana, US: “Well…we have one in Texas…”
Americans on geography
Production Manager: “We’re owned by the Mafia”
Interviewer: “I think that’s the “Other” category……..although I
guess I could put you down as an “Italian multinational” ?”
The difficulties of defining ownership in Europe
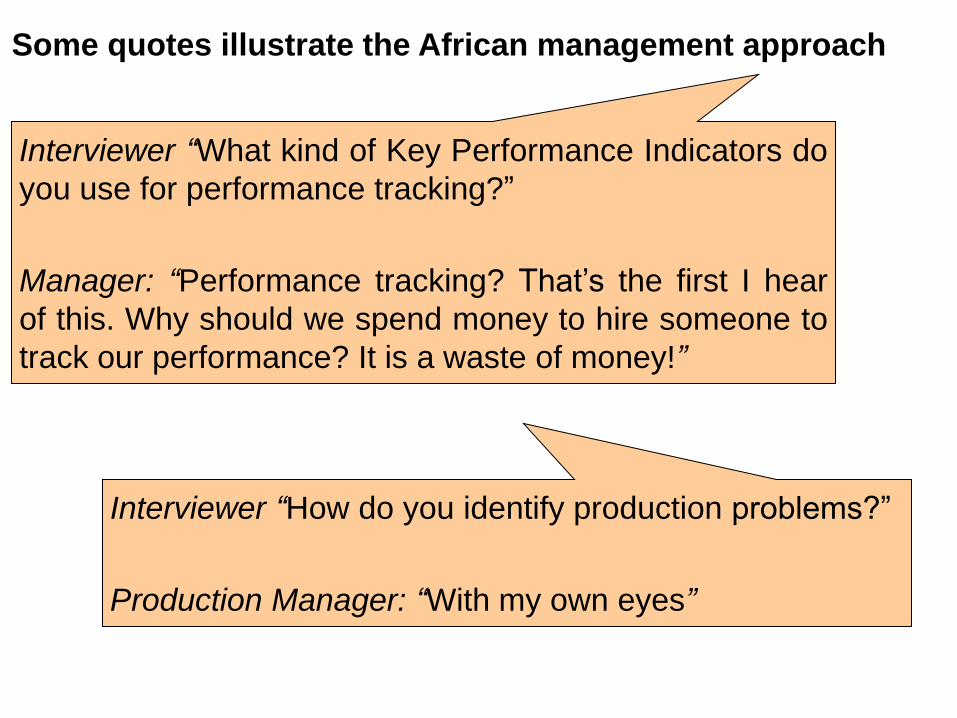
Some quotes illustrate the African management approach
Interviewer “What kind of Key Performance Indicators do
you use for performance tracking?”
Manager: “Performance tracking? That’s the first I hear
of this. Why should we spend money to hire someone to
track our performance? It is a waste of money!”
Interviewer “How do you identify production problems?”
Production Manager: “With my own eyes”

More research, policy briefs & media available here
www.worldmanagementsurvey.com
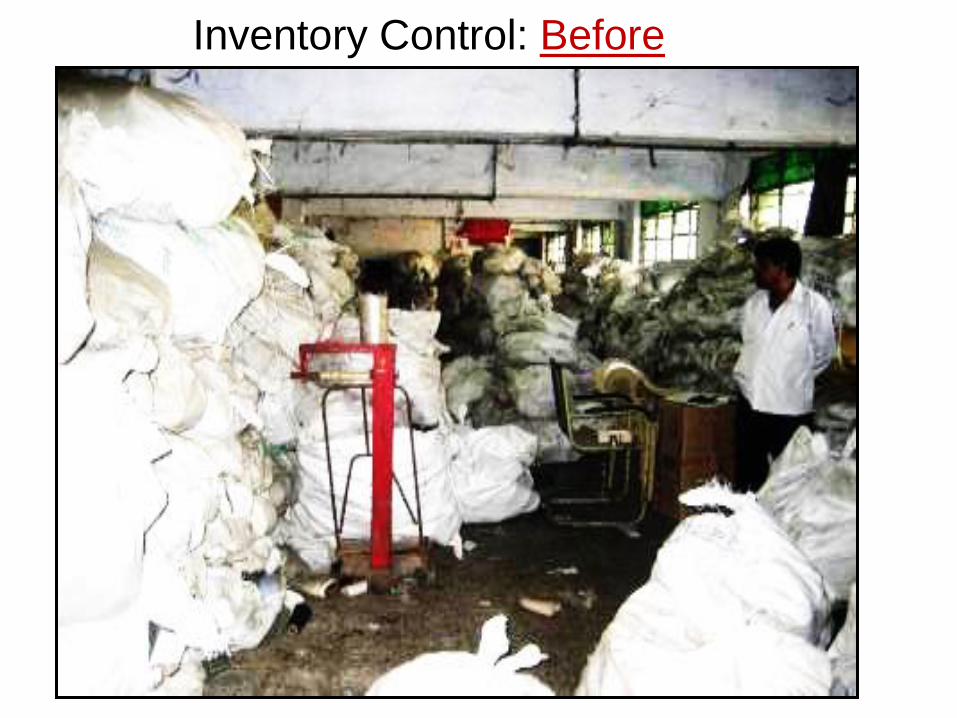
Inventory Control: Before
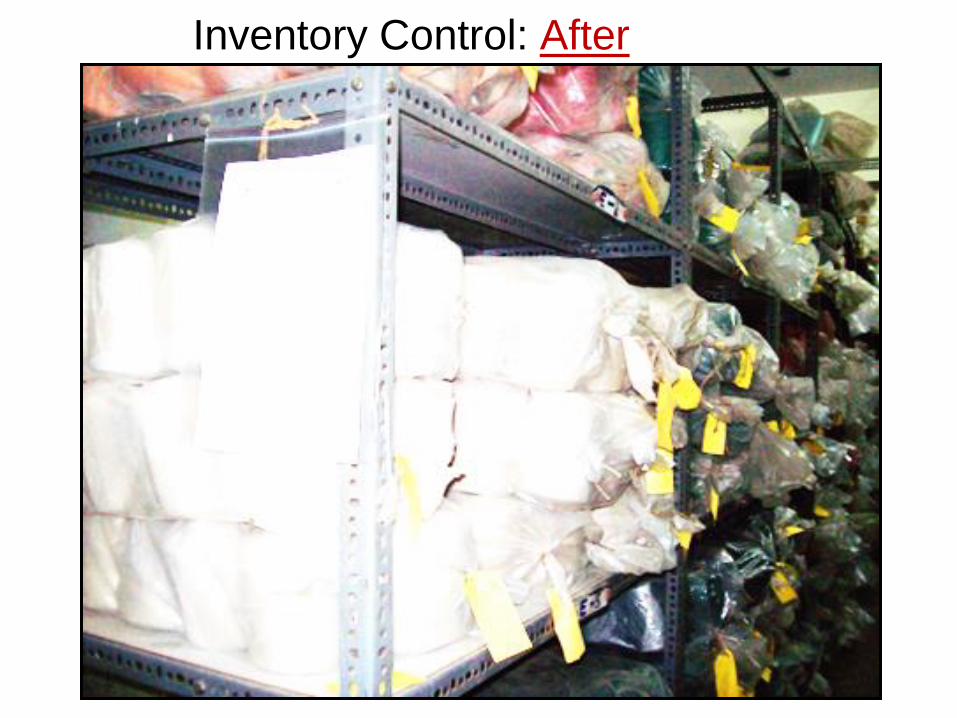
Inventory Control: After

Bigger manufacturing firms (& plants) tend to have
better management practices M
an
ag
em
en
t s
co
re
Number of firm employees
10 100 1000 10,000 5,000
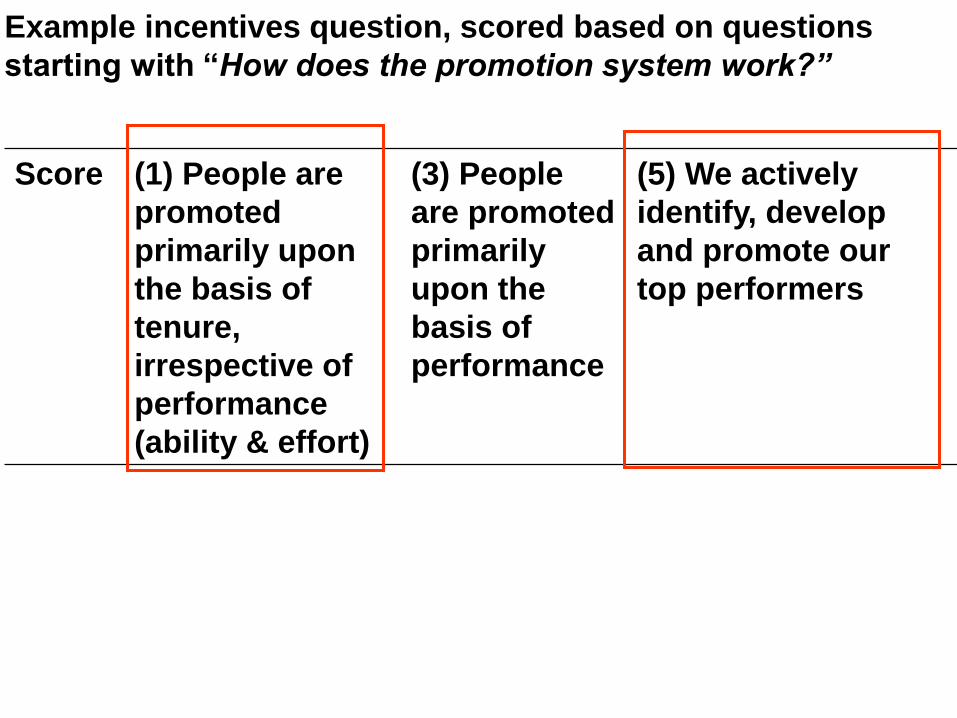
Score (1) People are
promoted
primarily upon
the basis of
tenure,
irrespective of
performance
(ability & effort)
(3) People
are promoted
primarily
upon the
basis of
performance
(5) We actively
identify, develop
and promote our
top performers
Example incentives question, scored based on questions
starting with “How does the promotion system work?”
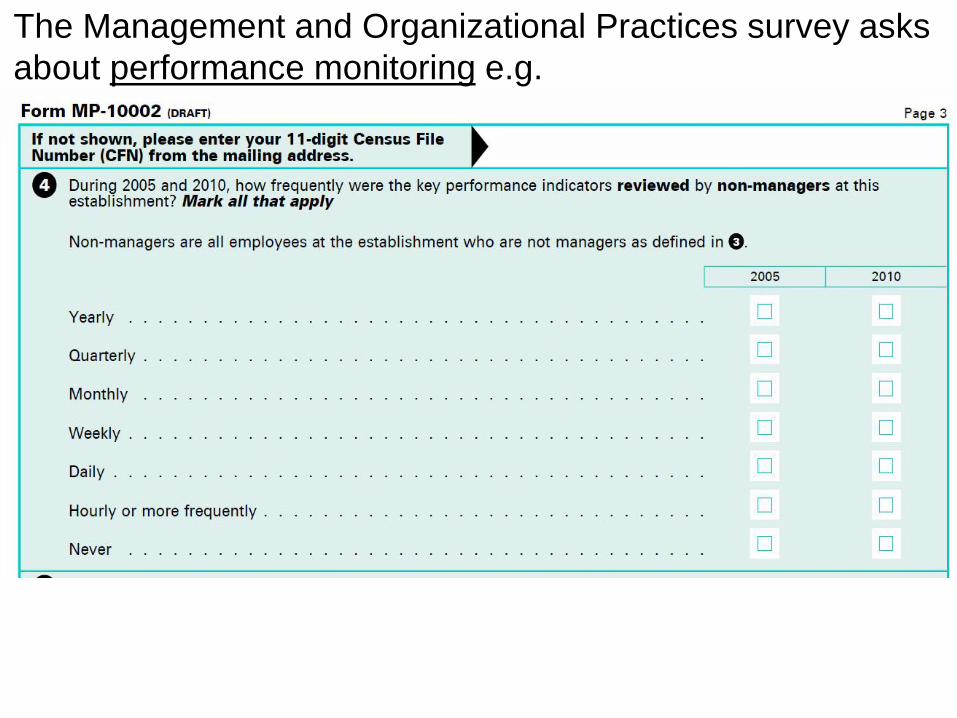
The Management and Organizational Practices survey asks
about performance monitoring e.g.