Embed Size (px)
Citation preview
J Econ Growth (2014) 19:439–470DOI 10.1007/s10887-014-9108-6
Asia’s little divergence: state capacity in China and Japanbefore 1850
Tuan-Hwee Sng · Chiaki Moriguchi
Published online: 12 September 2014© Springer Science+Business Media New York 2014
Abstract This paper explores the role of state capacity in the comparative economic develop-ment of China and Japan. Before 1850, both nations were ruled by stable dictators who reliedon bureaucrats to govern their domains. We hypothesize that agency problems increase withthe geographical size of a domain. In a large domain, the ruler’s inability to closely monitorbureaucrats creates opportunities for the bureaucrats to exploit taxpayers. To prevent overex-ploitation, the ruler has to keep taxes low and government small. Our dynamic model showsthat while economic expansion improves the ruler’s finances in a small domain, it could leadto lower tax revenues in a large domain as it exacerbates bureaucratic expropriation. To checkthese implications, we assemble comparable quantitative data from primary and secondarysources. We find that the state taxed less and provided fewer local public goods per capita inChina than in Japan. Furthermore, while the Tokugawa shogunate’s tax revenue grew in tan-dem with demographic trends, Qing China underwent fiscal contraction after 1750 despitedemographic expansion. We conjecture that a greater state capacity might have preparedJapan better for the transition from stagnation to growth.
Keywords Comparative institutional analysis · Geography · Principal–agent problem ·Institutions and growth
JEL Classification D73 · N15 · N40 · O43 · P52
1 Introduction
Why was Japan the first non-Western nation to industrialize? Why did China take longer tomodernize? At first glance, China’s later industrialization appears puzzling. Unified growth
T.-H. Sng (B)Department of Economics, National University of Singapore, Singapore, Singaporee-mail: [email protected]
C. MoriguchiInstitute of Economic Research, Hitotsubashi University, Tokyo, Japane-mail: [email protected]
123
440 J Econ Growth (2014) 19:439–470
theory suggests that the transition from stagnation to growth is driven by the positive interac-tion between population expansion and technological progress and its impact on the demandfor human capital and the onset of the demographic transition (Galor 2005, 2011). All elseequal, China, one of the most technologically advanced and certainly the most populousnation in the world throughout most of history, should be an early industrializer. While dif-ferences in geographical endowment, institutions, culture, and diversity could help explainthe Great Divergence between China and Europe (Jones 1981; Landes 1998; Pomeranz 2000;Ashraf and Galor 2013), these differences seem unsatisfactory in explaining the economicdivergence between China and Japan.
Traditional accounts typically attribute Japan’s earlier industrialization to the MeijiRestoration. According to this view, Qing China (1644–1911) and Tokugawa Japan (1600–1868) were both governed by despotic rulers who were uninterested in promoting economicgrowth.1 Their paths diverged only after 1868, when the Tokugawa regime was overthrownand the new Meiji government introduced drastic reforms that transformed Japan. As Beasley(1972) put it,
During the middle decades of the nineteenth century China and Japan both facedpressure from an intrusive, expanding West. ... Emotionally and intellectually, Chineseand Japanese reacted to the threat in similar ways. ... Yet they differed greatly in thekind of actions that this response induced. ... The Meiji Restoration is at the heart ofthis contrast, since it was the process by which Japan acquired a leadership committedto reform and able to enforce it. For Japan, therefore, the Restoration has something ofthe significance that the English Revolution has for England or the French Revolutionfor France; it is the point from which modern history can be said to begin.
Recent reassessments have put the Chinese and Japanese economies on the eve of themodern age in better standing. It has been shown that, like Western Europe, China andJapan experienced widespread commercialization and proto-industrialization during the earlymodern period (Pomeranz 2000). However, the revisionist view, too, tends to play downthe differences between pre-1850 China and Japan, and focus instead on their similarities(Pomeranz 2000; He 2013).
Indeed, early modern China and Japan had much in common. Both depended heavilyon small-scale, labor-intensive, and rice-based agriculture. Both were ruled by stable andsophisticated governments long before the arrival of the West. Furthermore, they shared acommon cultural, institutional, and technological heritage. As a result of active cultural bor-rowing from China, Tokugawa Japan was also deeply influenced by Confucianism. Chineseadministrative codes played an important role in shaping the way that the Tokugawa shogu-nate was run (Jansen 1992). Existing evidence suggests that living standards in China andJapan were comparable during this period (Maddison 2001; Baten et al. 2010; Allen et al.2011; Broadberry 2013).2
We point to an important empirical observation that fits neither traditional nor revisionistperspectives, however. As Figure 1 illustrates, from 1650 to 1850, tax revenue per capita was
1 See, for example, Wittfogel (1957) and Balazs (1964) on China; Alcock (1863) and Reischauer (1970) onJapan.2 Most of these studies show that living standards in China and Japan were low and stable from 1700 to 1850.The exception is Broadberry (2013), who shows a declining GDP per capita in China. Our findings beloware qualitatively the same regardless of which set of estimates we use. If we use Broadberry’s estimates, theTokugawa shogunate’s tax-to-GDP ratio would be 1.6 times higher than China’s in 1700 and 3.9 times higherby 1850.
123
J Econ Growth (2014) 19:439–470 441
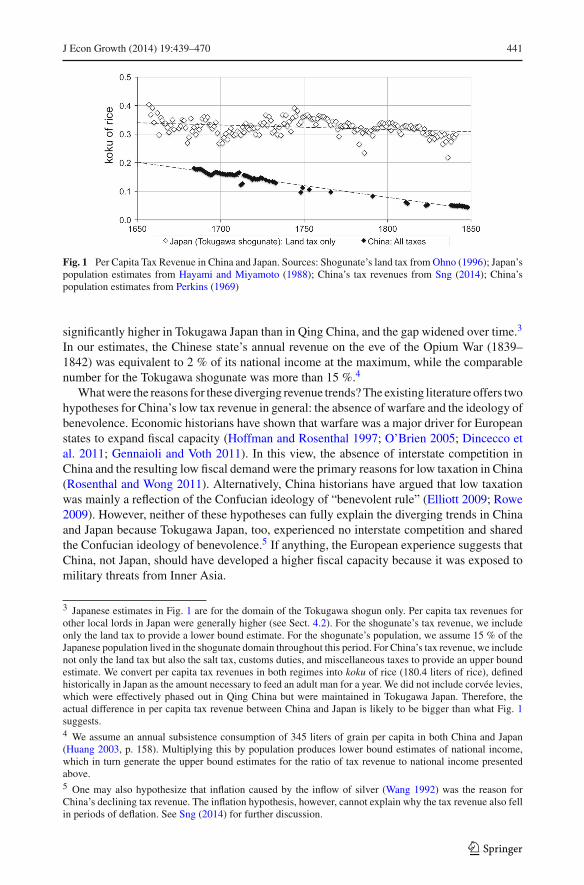
Fig. 1 Per Capita Tax Revenue in China and Japan. Sources: Shogunate’s land tax from Ohno (1996); Japan’spopulation estimates from Hayami and Miyamoto (1988); China’s tax revenues from Sng (2014); China’spopulation estimates from Perkins (1969)
significantly higher in Tokugawa Japan than in Qing China, and the gap widened over time.3
In our estimates, the Chinese state’s annual revenue on the eve of the Opium War (1839–1842) was equivalent to 2 % of its national income at the maximum, while the comparablenumber for the Tokugawa shogunate was more than 15 %.4
What were the reasons for these diverging revenue trends? The existing literature offers twohypotheses for China’s low tax revenue in general: the absence of warfare and the ideology ofbenevolence. Economic historians have shown that warfare was a major driver for Europeanstates to expand fiscal capacity (Hoffman and Rosenthal 1997; O’Brien 2005; Dincecco etal. 2011; Gennaioli and Voth 2011). In this view, the absence of interstate competition inChina and the resulting low fiscal demand were the primary reasons for low taxation in China(Rosenthal and Wong 2011). Alternatively, China historians have argued that low taxationwas mainly a reflection of the Confucian ideology of “benevolent rule” (Elliott 2009; Rowe2009). However, neither of these hypotheses can fully explain the diverging trends in Chinaand Japan because Tokugawa Japan, too, experienced no interstate competition and sharedthe Confucian ideology of benevolence.5 If anything, the European experience suggests thatChina, not Japan, should have developed a higher fiscal capacity because it was exposed tomilitary threats from Inner Asia.
3 Japanese estimates in Fig. 1 are for the domain of the Tokugawa shogun only. Per capita tax revenues forother local lords in Japan were generally higher (see Sect. 4.2). For the shogunate’s tax revenue, we includeonly the land tax to provide a lower bound estimate. For the shogunate’s population, we assume 15 % of theJapanese population lived in the shogunate domain throughout this period. For China’s tax revenue, we includenot only the land tax but also the salt tax, customs duties, and miscellaneous taxes to provide an upper boundestimate. We convert per capita tax revenues in both regimes into koku of rice (180.4 liters of rice), definedhistorically in Japan as the amount necessary to feed an adult man for a year. We did not include corvée levies,which were effectively phased out in Qing China but were maintained in Tokugawa Japan. Therefore, theactual difference in per capita tax revenue between China and Japan is likely to be bigger than what Fig. 1suggests.4 We assume an annual subsistence consumption of 345 liters of grain per capita in both China and Japan(Huang 2003, p. 158). Multiplying this by population produces lower bound estimates of national income,which in turn generate the upper bound estimates for the ratio of tax revenue to national income presentedabove.5 One may also hypothesize that inflation caused by the inflow of silver (Wang 1992) was the reason forChina’s declining tax revenue. The inflation hypothesis, however, cannot explain why the tax revenue also fellin periods of deflation. See Sng (2014) for further discussion.
123
442 J Econ Growth (2014) 19:439–470
In this paper we focus on geography as a primary factor. China was a sprawling landempire with vast inner frontiers, while Japan was a small island nation. We propose that thedifference in their geographical size and heterogeneity led to a much more acute problemof political control in the former than in the latter.6 In pursuing our research, we follow themethodology of comparative and historical institutional analysis proposed by Greif (1998).That is, we first develop a context-specific model based on historical details to theoreticallyexamine the nature of the problems that the rulers in China and Japan faced and then checkits implications using comparative historical evidence.
Between 1650 and 1850, both nations were ruled by stable dictatorships. Following Olson(1993), we model stable dictators as “stationary bandits” who understand that excessiveexaction in the short run would be counterproductive in the long run.7 However, the ruler’sencompassing interest is by itself insufficient to guarantee good governance. Because dic-tators cannot rule alone and have to rely on agents to govern, a principal–agent problem isinherent in dictatorships.8 Unless the interests of the ruler and the agents are well-aligned, inthe absence of perfect monitoring, the agents tend to pursue their self-interest at the ruler’sexpense. For example, they may extort the taxpayers and thereby increase the likelihood ofrebellion.
We hypothesize that in a stable dictatorship, agency problems increase with its geograph-ical size and heterogeneity. Given premodern information technologies, it is costly for theruler of a large domain to monitor the agents closely. This gives the agents strong incentivesto extort the taxpayers. To prevent overexploitation that could foment rebellion, the ruler hasto keep taxes low and government small. By contrast, in a smaller domain, lower monitoringcosts allow the ruler to impose heavier taxes without risking popular resistance.
If the sole purpose of taxation is to support the consumption of the ruling class, whether itenriches the ruler or his agents will not matter to the taxpayers. However, unlike corruption,taxation is rarely a pure rent-seeking activity. The ruler, as the owner of his domain, may usethe tax receipts to invest in public goods to keep his property productive. If so, the competitionbetween the ruler and the agents over the economic surplus may have an impact on socialwelfare, especially in the long run.
To formalize our hypothesis, we build a dynamic principal-agent model and analyzeoptimal taxation and public goods provision in a stable dictatorship. The ruler taxes thepeasants through agents and invests part of the tax revenue in a local public good that protectsthe economy from exogenous shocks (e.g., natural disasters). If the ruler under-invests in thepublic good, the risk of a large shock destroying the economy increases.
The static predictions of the model are straightforward: holding monitoring technologyconstant, as the geographical size of the ruler’s domain increases, bureaucratic expropriationworsens and per capita tax revenue falls due to managerial diseconomies of scale.
New insights come from the dynamic implications. While one may expect economicexpansion to generate more tax revenues and higher public good investments, this is notalways the case. The model predicts that economic expansion could actually hurt the ruler
6 We do not claim that geography is the only determinant of state capacity (defined as the ability of the state toraise taxes and provide public goods), as other factors such as governance structure, culture, and technologyalso influence state capacity. The aim of this study is to isolate the impact of geography on state capacity byholding these factors “constant,” taking advantage of the institutional, cultural, and technological similaritiesbetween premodern China and Japan.7 In contrast, unstable dictators behave like “roving bandits” due to their short time horizons.8 In Levi’s words (1988, p. 14), “Absolute monarchs are rulers who possess a virtual monopoly over coercivecapacity but not necessarily a perfect monitoring capacity.” See Kiser and Tong (1992), Ma (2011), and Sng(2014) for more discussions on agency problems in imperial China.
123
J Econ Growth (2014) 19:439–470 443
because it also exacerbates agency problems. When monitoring cost is sufficiently high,bureaucratic expropriation will outpace economic expansion. It is only when monitoringcost is low that economic change is likely to bring net benefits to the ruler as well as thepopulation.
Our model provides a potential explanation for the tax revenue dynamics in China andJapan documented in Fig. 1. To further check its implications, we examine the provision oflocal public goods (coinage, transportation network, urban management, forest protection,famine relief) in the two regimes. In line with the model’s prediction, we find that, comparedto the Chinese emperor, the Tokugawa shogun displayed a greater capability to provide thesepublic goods over a longer period of time.
We take the size of domains in China and Japan as exogenous in our analysis. Given thehigh agency costs, one may ask if China’s vast size was ever optimal. In a broader framework,such as Alesina and Spolaore (1997), the ruler determines the size of his domain by balancingthe accompanying costs and benefits, where agency costs are just one such factor. In the caseof China, we conjecture that the benefits of political integration—peace and risk sharingamong contiguous regions—outweighed high agency costs, thereby justifying its size. Wedo not model this, however, to keep the scope of our analysis manageable.9
To our knowledge, this study is the first comparative analysis of state capacity in preindus-trial Asia.10 The European experience indicates that most states had a strong fiscal system inplace before industrializing (Dincecco 2011; Johnson and Koyama 2014a, b). Indeed, thereis a growing body of theoretical and empirical research highlighting the importance of statecapacity in facilitating modern economic growth (Acemoglu 2005; Besley and Persson 2009,2013; Dincecco and Prado 2012; Dincecco and Katz 2014). Studies also show that a proactivestate could accelerate the transition from stagnation to growth by implementing policies thatpromote human capital formation (Doepke 2004; Doepke and Zilibotti 2005; Galor and Moav2006; Galor et al. 2009).11 In light of these works, our finding of an increasingly weak statein China in contrast to Japan might help explain the puzzle of China’s late industrialization.
This paper builds directly upon Sng (2014), who studies the impact of geographical size onthe principal–agent problem in late imperial China. Our work significantly extends his modelby incorporating public goods provision and offers new comparative empirical evidence bybringing Japan into the picture. Our approach is complementary to Brandt et al. (2014), whoprovide a comprehensive survey of the long-run evolution of the Chinese political economysince the tenth century.
Importantly, four recent contributions also explore the impact of geographical proxim-ity and size on the quality of political and corporate governance. Stasavage (2011) findsthat in preindustrial Europe, high communication and travel costs prevented representativeassemblies in large polities from convening regularly and functioning effectively. Using con-temporary data from 127 countries, Olsson and Hansson (2011) detect strong negative effectsof territorial size on the rule of law. Giroud (2013) shows that a reduction of travel time (aproxy for monitoring costs) between company headquarters and plants has positive effects
9 Ko and Sng (2013) and Ko et al. (2014) model the tradeoff and argue that a large empire could be a constrainedoptimum for China due to its geography.10 In a concurrent study, Sakane (2011a) offers a brief but insightful discussion comparing the systems oftax collection in nineteenth-century Japan and China (pp. 235–239). More recently, Aoki (2014) analyzes thecoevolution of political and economic institutions in the two countries.11 State capacity is important in this context not only to finance these policies but also to overcome theresistance from entrenched interest groups. For example, Galor et al. (2009) show that powerful landlords tendto oppose the expansion of public education, and therefore successful land reforms could accelerate economicmodernization.
123

444 J Econ Growth (2014) 19:439–470
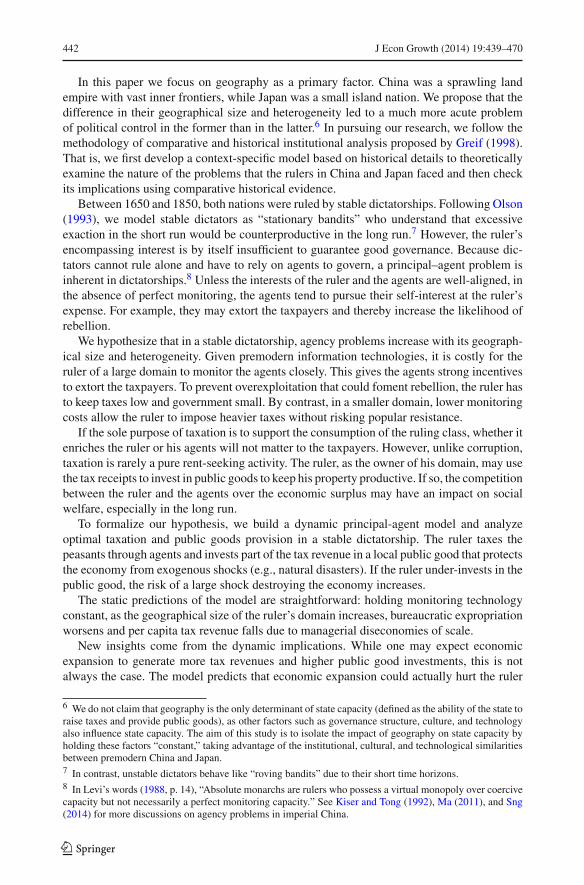
Fig. 2 Early modern China and Japan. Source: CHGIS, Version 4, Cambridge: Harvard Yenching Institute,January 2007
on plant-level productivity and profits. Campante and Do (2014) provide strong evidence thatisolated capital cities in US states are associated with lower accountability, greater levels ofcorruption, and worse public goods provision. These studies show that distance and size area challenge to good governance not only in premodern regimes in Asia and Europe, but alsoin modern states and corporations.
The rest of the paper is organized as follows: Section. 2 provides the historical background.Section 3 presents the model and derives predictions. Section 4 provides comparative histor-ical evidence. Section 5 concludes.
2 Historical background
In this section, we compare the geography, administrative structure, and system of tax col-lection in Qing China and Tokugawa Japan to motivate our theoretical model.
2.1 Geography
Tokugawa Japan was an archipelago comprising three main islands,12 while China was acontinental empire (Fig. 2). At its peak, China under the Qing dynasty (1644–1911) controlleda landmass larger than China or the United States today. Even if we disregard the thinlypopulated Inner Asian borderlands, the region known as China proper—the 18 provinces
12 During the Tokugawa period, Hokkaido was populated by the indigenous Ainu people and Japan’s controlwas restricted to the southern tip of the island.
123

J Econ Growth (2014) 19:439–470 445
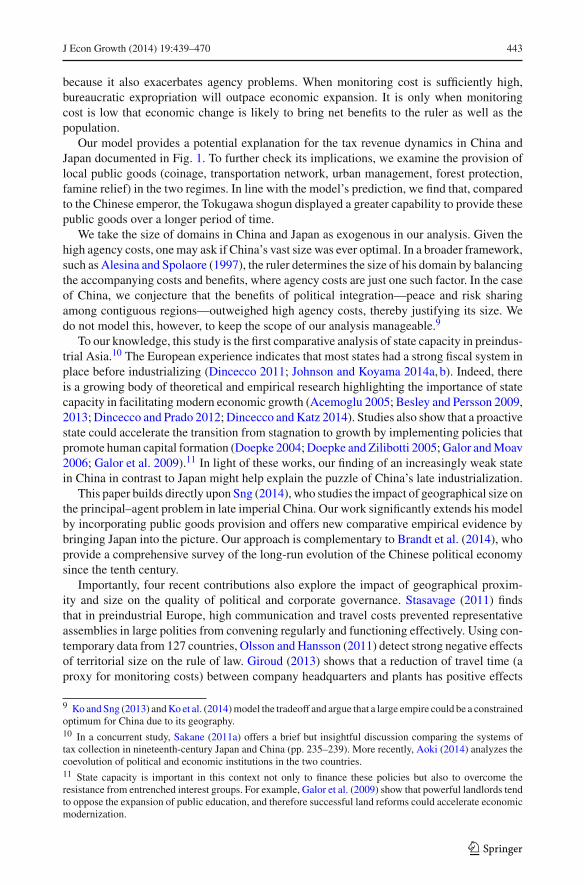
Fig. 3 Tokugawa Japan in 1664. Source: China Historical GIS Project,“Tokugawa Japan GIS, Demo Version.”Feb 2004
between the Great Wall and the South China Sea, which accounted for about 98 % of theempire’s population—was still 12 times the size of Tokugawa Japan.
If information transmission posed any challenge to effective public administration, thischallenge was clearly more acute in China than in Japan. To send a high-priority officialdocument from Beijing 1000 kilometers down south to Shanghai would take up to 10 days(Xie 2002). By contrast, a similar trip between Japan’s two biggest cities, Edo (Tokyo) andOsaka, about 520 km apart, would only require 4 days (Nakane and Oishi 1990). It is alsoworth noting that no one in Japan lived more than 120 kilometers from the sea, which offereda cheap mode of transportation in an age before railroads.
2.2 Administrative structure
Both China and Japan were ruled by a succession of stable dictators between 1650 and 1850.However, while China was ruled by one dictator—the emperor of the Qing dynasty—duringthis period, multiple dictatorships coexisted in Japan.
Nominally, Japan was led by the shogun of the Tokugawa house, who controlled 15 % ofthe arable land (Fig. 3). The bulk of the remaining land was divided into 260-odd mutuallyexclusive domains, each headed by a daimyo (local lord).13 While a daimyo had to swearallegiance to the shogun and subject himself to a system of controls aimed to prevent dissent,
13 The size of domains varied widely. The shogunate was rated at 4 million koku, but most domains weremuch smaller. The average size of a domain was only about 100,000 koku.
123
446 J Econ Growth (2014) 19:439–470
he retained virtually complete autonomy over his domain.14 As such, instead of treatingTokugawa Japan as a unified but decentralized empire, we interpret it as a league of dictator-ships and treat each daimyo as a dictator.15 We focus primarily on the shogunate, for whichhistorical records are most abundant, and compare it with China proper.16
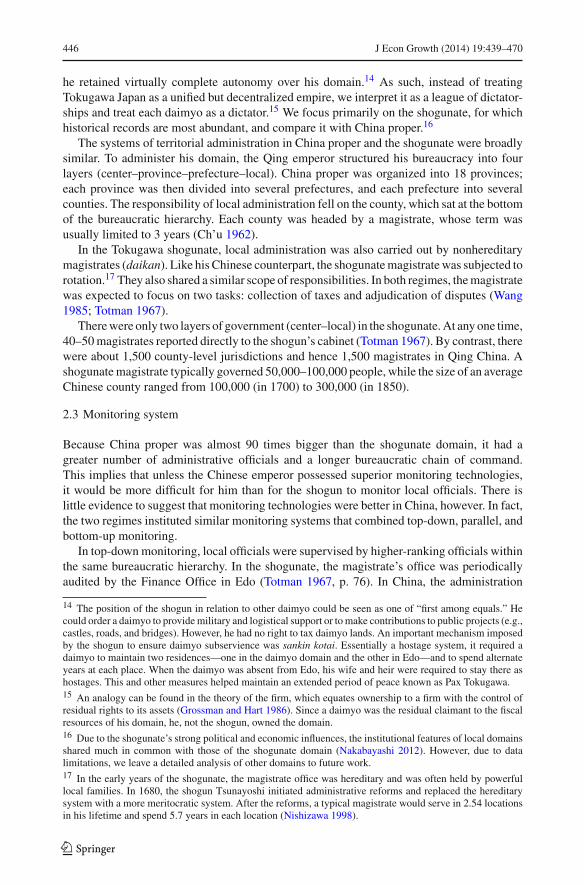
The systems of territorial administration in China proper and the shogunate were broadlysimilar. To administer his domain, the Qing emperor structured his bureaucracy into fourlayers (center–province–prefecture–local). China proper was organized into 18 provinces;each province was then divided into several prefectures, and each prefecture into severalcounties. The responsibility of local administration fell on the county, which sat at the bottomof the bureaucratic hierarchy. Each county was headed by a magistrate, whose term wasusually limited to 3 years (Ch’u 1962).
In the Tokugawa shogunate, local administration was also carried out by nonhereditarymagistrates (daikan). Like his Chinese counterpart, the shogunate magistrate was subjected torotation.17 They also shared a similar scope of responsibilities. In both regimes, the magistratewas expected to focus on two tasks: collection of taxes and adjudication of disputes (Wang1985; Totman 1967).
There were only two layers of government (center–local) in the shogunate. At any one time,40–50 magistrates reported directly to the shogun’s cabinet (Totman 1967). By contrast, therewere about 1,500 county-level jurisdictions and hence 1,500 magistrates in Qing China. Ashogunate magistrate typically governed 50,000–100,000 people, while the size of an averageChinese county ranged from 100,000 (in 1700) to 300,000 (in 1850).
2.3 Monitoring system
Because China proper was almost 90 times bigger than the shogunate domain, it had agreater number of administrative officials and a longer bureaucratic chain of command.This implies that unless the Chinese emperor possessed superior monitoring technologies,it would be more difficult for him than for the shogun to monitor local officials. There islittle evidence to suggest that monitoring technologies were better in China, however. In fact,the two regimes instituted similar monitoring systems that combined top-down, parallel, andbottom-up monitoring.
In top-down monitoring, local officials were supervised by higher-ranking officials withinthe same bureaucratic hierarchy. In the shogunate, the magistrate’s office was periodicallyaudited by the Finance Office in Edo (Totman 1967, p. 76). In China, the administration
14 The position of the shogun in relation to other daimyo could be seen as one of “first among equals.” Hecould order a daimyo to provide military and logistical support or to make contributions to public projects (e.g.,castles, roads, and bridges). However, he had no right to tax daimyo lands. An important mechanism imposedby the shogun to ensure daimyo subservience was sankin kotai. Essentially a hostage system, it required adaimyo to maintain two residences—one in the daimyo domain and the other in Edo—and to spend alternateyears at each place. When the daimyo was absent from Edo, his wife and heir were required to stay there ashostages. This and other measures helped maintain an extended period of peace known as Pax Tokugawa.15 An analogy can be found in the theory of the firm, which equates ownership to a firm with the control ofresidual rights to its assets (Grossman and Hart 1986). Since a daimyo was the residual claimant to the fiscalresources of his domain, he, not the shogun, owned the domain.16 Due to the shogunate’s strong political and economic influences, the institutional features of local domainsshared much in common with those of the shogunate domain (Nakabayashi 2012). However, due to datalimitations, we leave a detailed analysis of other domains to future work.17 In the early years of the shogunate, the magistrate office was hereditary and was often held by powerfullocal families. In 1680, the shogun Tsunayoshi initiated administrative reforms and replaced the hereditarysystem with a more meritocratic system. After the reforms, a typical magistrate would serve in 2.54 locationsin his lifetime and spend 5.7 years in each location (Nishizawa 1998).
123
J Econ Growth (2014) 19:439–470 447
conducted a grand review once every three years to evaluate the magistrate’s performanceand mete out reward or punishment accordingly (Watt 1977).
Top-down monitoring, however, could be ineffective in the presence of bureaucraticpatronage networks. To prevent this, the Chinese emperor established an independent sur-veillance agency known as the Censorate to detect bureaucratic malpractices and report themto the emperor (Feuerwerker 1976). Likewise, the shogun sent out censors to keep an eye onthe local administration (Totman 1967; Nakane and Oishi 1990).
Finally, to carry out bottom-up monitoring, both regimes adopted petition systems. Thesystem had a long tradition in China, where it had been in place since the seventh century(Ocko 1988; Fang 2009). In Japan, it was not until 1720 that the shogun set up petition boxesin major cities and permitted the public to make suggestions for better governance or to reportmisconduct and abuse of power by shogunate officials. The petitions were sent directly to theshogun for his review. Over 75 % of large local domains instituted similar systems (Ohira2003).
In both cases, the petition system was costly to implement, as it typically generated a largenumber of petitions including irrelevant requests and false accusations. In the Tokugawashogunate, each petition was investigated and petitioners were punished for misstatements.The system functioned reasonably well and was maintained until the end of the Tokugawaperiod (Ohira 2003).18
By contrast, the sheer size of the Chinese population made it extremely costly for the Qingrulers to verify the authenticity of every petition. Both the emperors Qianlong (r. 1736–1795)and Jiaqing (r. 1796–1820) initially encouraged petitions from their subjects but quicklyreversed their policies after receiving a flood of complaints that they could not possibly dealwith (Fang 2009). The system did not function as intended, and some complainants resortedto extreme measures, such as committing suicide outside the palace gates, to attract theemperor’s attention to their grievances. In other words, although both China and Japan usedsimilar systems of bottom-up monitoring to check corruption, it was less effective in Chinadue to its much greater size and population.
The rulers in China and Japan were concerned about the well-being and grievances of theirsubjects for both ideological and practical reasons. Because Confucianism demanded rulersto treat their subjects benevolently, it legitimized popular resistance against an oppressiveruler.19 This fear of a violent rebellion served as a constraint on dictators in both China andJapan and gave them an incentive to prevent the overexploitation of their subjects.
2.4 The system of tax collection
Land taxation was the most important source of government revenue in both Qing China andTokugawa Japan. Both economies depended heavily on small-scale, labor-intensive agricul-ture. Every land-holding household was obligated to pay the land tax, the amount of whichwas determined based on the size and quality of the land the family held (Ch’u 1962; Nakaneand Oishi 1990). In the case of Japan, the fiscal base was measured in rice, the primarystaple crop nationwide. Fields, forests, residential lands, mines, and fishing grounds werealso assessed and taxed in terms of rice (Nishikawa 1985, pp. 23–24). If rice were not the
18 In addition to exposing corruption, petitions also contributed to the creation of fire brigades and the estab-lishment of a hospital for the poor in Edo (Roberts 1994).19 In the words of Mencius, “If a prince treats his subjects as his hands and feet, they will treat him as theirbelly and heart. lf he treats them as his horses and hounds, they will treat him as a mere fellow-countryman.If he treats them as mud and weeds, they will treat him as an enemy” (Mencius 2004).
123

448 J Econ Growth (2014) 19:439–470
main crop cultivated, then part of the tax would be levied in cash at a conversion rate set bythe lord.
By contrast, regional diversity necessitated the denomination and collection of taxes in avariety of crops and metals in China. Although most taxes had been monetized by the seven-teen century, the peasants still had to pay part of their land taxes in kind, which, dependingon the region, could be rice, wheat, millet, barley, sorghum, beans, or other staple crops.Furthermore, it was common for the portion of the land tax denominated in silver to be paidin copper coins when and where silver was scarce (Ch’u 1962). In such cases, commuta-tion rates were set by magistrates based on local conditions. This high heterogeneity createdgreat difficulties for the imperial court to monitor the over-collection of taxes by the countyadministration (Ch’u 1962; Zelin 1984).
In Qing China, the primary unit of taxation was the household, whereas in Tokugawa Japan,it was the village instead of the household. Under the village contract system (murauke), theJapanese rulers levied the land tax on each village based on its total assessed yield. Villageleaders were in charge of assigning and collecting taxes from individual households andtransferring the sum to the magistrate. Moreover, households in the same village were madecollectively responsible for the payment of taxes. This arrangement reduced the frequency ofcontact between the magistrate and individual peasants and, therefore, limited the opportu-nities for tax officials to abuse power. Indeed, the magistrate rarely showed up in the villagesexcept for annual inspections, and villages retained a high degree of autonomy in runningtheir affairs in Japan (Walthall 1991).
For this system to work, it was necessary that village communities remained tightly knit tofacilitate mutual monitoring and discourage free riding. To restrict geographical mobility, theshogunate and local lords mandated every village to keep a household registry and requiredtheir subjects to obtain permission before changing residency or traveling.
We do not model the village contract system in Japan in the next section as doing sowould further reduce the monitoring costs for the Japanese rulers and strengthen our mainresults. It should be noted, however, that the village contract system was not a uniquelyJapanese system. In fact, China had instituted a similar system during the Ming dynasty(1368–1644). The system eventually unraveled, however, as the potential for migration givenChina’s vast inner frontiers made it difficult to maintain tightly knit communities that werenecessary to implement collective responsibility.20 By contrast, the village contract systemwas firmly institutionalized in Tokugawa Japan. Even though it was abolished by the Meijigovernment with the introduction of a new land tax system, tax collection was delegated tolocal communities that continued to use a collective responsibility system well into the 1930s(Sakane 2011b).
We also do not incorporate taxpayer heterogeneity in our model. In China, taxpayers couldbe broadly classified into two groups: the gentry and the peasants. Historical studies suggestthat unlike ordinary peasants, the gentry were rarely subjected to bureaucratic extortionbecause of their political connections (Ch’u 1962; Watt 1977).21 Some gentry took advantage
20 As in Tokugawa Japan, the primary unit of land taxation in Ming China was the self-governing village(Huang 1974). The Ming state also heavily restricted domestic and foreign traveling. However, large-scalepopulation movements to the inner frontiers in the sixteenth century put this system under increasing pressure.The migration of a household implies that the remaining households had to shoulder extra corvée responsi-bilities. This in turn increased the incentives for others to migrate, setting off a chain reaction that caused thesystem to unravel (Heijdra 1998; Fei 2007). By the seventeenth century, the unit of taxation was switchedfrom the village to the household.21 The gentry was an elite minority, constituting 1.3 % of the Chinese population around 1,800 (Zhang 1955).As holders of official educational degrees, they belonged to the same social class as the magistrate and somehad ties with high-level government officials.
123
J Econ Growth (2014) 19:439–470 449
of their sheltered position to act as tax farmers, earning extralegal income by paying taxeson the peasants’ behalf and charging for the service.
There was heterogeneity among taxpayers in Japan too, although not to the extent observedin China. Under the village contract system, wealthy peasants were typically appointed asvillage leaders. Some village leaders took advantage of their position and colluded with themagistrate to extort the villagers (Nishizawa 2004).
Based on these observations, we consider local elites (the gentry and the village leaders)as tax intermediaries instead of taxpayers and incorporate them as a constituent of the taxagent.22
3 The model
Motivated by the historical observations, in this section we develop a formal model to studythe impact of geographical size on a ruler’s capacity to collect taxes and provide public goods.
Consider a discrete-time, infinite-horizon game with three types of players: ruler, taxagents, and peasants. As a stable dictator with dynastic succession, the ruler is assumed tolive infinitely long, while the agents and the peasants are assumed to be short-lived.
For analytical simplicity, we assume that the dictatorship consists of S homogenous regionsand that S is exogenously given to the Ruler.23 We let the number of regions S represent thegeographical size of the dictatorship and take a region as the unit of analysis. In other words,when comparing large and small dictatorships, we assume that the two regimes differ only inthe number of regions they encompass and that all regions in the two regimes are “identical.”
3.1 The basic setup
We first describe a basic, single-period game in a representative region consisting of a fixednumber of jurisdictions.24 Assume that the region is populated by N Peasants who engagein agricultural production.25 Let Y denote the agricultural output in the region and assumethat it increases with labor inputs at a diminishing rate: Y = Y (N ), where N > 0, Y (0) = 0,Y ′(·) > 0, and Y ′′(·) < 0. In other words, the aggregate output increases with population,and hence population growth and economic growth are synonyms in our model.
In each region, the ruler sets a tax rate τ and stations a fixed number of Agents to collecttaxes from the Peasants, where one Agent is assigned to every jurisdiction.26 We interpret theAgent as a figure that represents all tax intermediaries in his jurisdiction.27 When collecting
22 Our main results will not change if we incorporate taxpayer heterogeneity and model the local elites astaxpayers with political connections.23 In historical terms, in the case of Qing China, a region corresponds to a province and thus S = 18; in thecase of Tokugawa Japan, the entire Shogunate domain can be seen as just one region, and thus S = 1.24 In historical terms, one region consisted of approximately 83 jurisdictions in Qing China and approximately50 jurisdictions in the Tokugawa shogunate.25 For simplicity, we assume away commercial production, but it can be incorporated without changing themain results.26 In historical terms, the official tax rate τ includes not only the tax rate explicitly stipulated by the ruler, butalso the rate of informally approved surcharges to cover local expenses (see footnote 36 for details).27 In historical terms, in China the Agent represents the magistrate, the county subofficials, and the gentry;in Japan the Agent represents the magistrate, his subordinates, and the village leaders. We implicitly assumethat the local elites were equally influential in China and Japan. Since the gentry in China likely controlledmore political and economic resources than the village leaders in Japan did, modeling this difference will onlystrengthen our results.
123

450 J Econ Growth (2014) 19:439–470
taxes, the agent may demand extralegal surcharge of rate θ from the peasants, in addition tothe official tax rate τ , for his private benefit. As a result, the effective expropriation rate forthe peasants is τ + θ , creating a potential wedge between what the ruler receives and whatthe peasants pay.
When the agent announces τ +θ , the Peasants pay the portion of their outputs to the agentas demanded.28 If τ + θ is within an exogenously given rate of r , then the Peasants considerit acceptable and stay put. However, if it exceeds r , then the peasants deem this “unjust” andrevolt. We assume that only the ruler actively seeks to prevent rebellion for three reasons.First, because peasant rebellion destroys productive capacity and affects future agriculturaloutputs, it hurts the long-lived ruler much more than the short-lived agents. Second, withineach jurisdiction there are coordination problems among tax intermediaries that collectivelyconstitute the agent. Even if revolts hurt them, it is individually rational for each of themto ignore the no-revolt condition in setting θ . Third, a rebellion could spill over to otherjurisdictions. If agents in different jurisdictions cannot coordinate their actions in setting θ ,then it will be individually rational to ignore the no-revolt condition. By contrast, as the soledictator governing the entire domain, the ruler internalizes externalities across both time andspace.
To discourage the agents from engaging in extralegal expropriation, the ruler employsthe following monitoring mechanism. First, the ruler conducts audits in randomly selectedregions after the agents finish tax collection. Let A(S) denote the probability of the represen-tative region receiving audits where 0 ≤ A(S) ≤ 1. Due to the ruler’s resource constraints,we assume that the probability of audits decreases with the number of regions in a dictator-ship: A′(·) < 0.29 In other words, in the absence of modern information technologies, theruler faces managerial diseconomies of scale.
Next, when an agent is indicted on misconduct charges in the auditing process, the rulerpunishes the agent by imposing a fine X . Audits, however, detect misconduct only imperfectlywith probability D(θ) where 0 ≤ D(θ) ≤ 1 and D(0) = 0. We assume that the detectionprobability increases with the rate of surcharge θ at an increasing rate, but that the marginalrate of detection is concave in θ : D′(·) > 0, D′′(·) > 0, and D′′′(·) ≤ 0.30 A simple examplewould be a quadratic function: D(θ) = θ2.
To summarize, the timing of events in the basic, single-period game in the representativeregion is as follows: (1) The ruler sets a tax rate τ to maximize tax revenue. (2) The represen-tative Agent selects θ to maximize his expected payoff and proceeds to collect taxes. (3) The
28 We assume that the tax unit is an individual. Incorporating the village contract system in Tokugawa Japanin the model would further reduce the monitoring costs for Japanese rulers and strengthen our results.29 For simplicity, we use A(·) as the reduced form representation of the ruler’s auditing strategy. To endogenizeA, suppose the ruler is free to select the fraction of S regions to audit, but audits are costly as they consumehis time and attention. If the cost of audits is increasing in A · S (the total amount of audits conducted) at anincreasing rate, and if we assume an interior solution, then A′(·) < 0 follows.30 For simplicity, we use D(·) and X as the reduced form representation of the ruler’s monitoring strategyand directly impose assumptions. The above assumptions, however, can be justified as follows. Suppose thatwhen the agent collects a surcharge of θ , then an audit will reveal a signal θ drawn from a normal distributionN (θ, σ 2) bounded between 0 and 1 (i.e., truncated normal distribution). Suppose that the ruler punishes theAgent whenever θ is greater than some threshold value h. This delivers the properties D(0) > 0 and D′(·) > 0.Ignoring corner solutions, it can be further verified that the Agent will never set θ beyond the threshold h,which in turn implies that we can focus on the values of θ that correspond to D′′(·) > 0. Moreover, it can beshown that if σ is large enough (i.e., if the ruler’s information is sufficiently noisy), then D′′′(·) ≤ 0. Finally,even though the ruler can choose a level of fine from a range of possible values, in equilibrium the ruler willalways choose the maximum fine, which gives X in our model.
123
J Econ Growth (2014) 19:439–470 451
peasants pay τ + θ of their outputs to the agents and decide whether or not to revolt. (4) Theruler conducts randomized audits and punishes the agents if the audits uncover misconduct.
The representative agent To provide benchmark results, we derive the equilibrium of thesingle-period game. First, consider the optimization problem of the representative agent. TheAgent chooses a rate of extralegal surcharge θ to maximize his expected payoff, given themonitoring mechanism, A(·), D(·), and X :
max0≤θ≤1
vA = θ · Y (N ) − A(S) · D(θ) · X (1)
The optimal rate of surcharge θ∗ is given by the following condition:
Y (N ) = A(S) · D′(θ∗) · X (2)
The ruler The ruler chooses a tax rate to maximize tax revenue. In doing so, however, weassume that, unlike the agents, the ruler is deeply concerned about peasant rebellion and thusconstrained by the no-revolt condition: τ + θ ≤ r .
Formally, the ruler’s maximization problem can be written as:
max0≤τ≤1
vR = τ · Y (N )
s.t. τ + θ ≤ r (3)
Anticipating the responses by the agents and the peasants, the ruler sets a tax rate giventhe optimality condition (2) and the no-revolt condition. It is simple to show that thereis a unique equilibrium in the single-period game in which τ ∗ and θ∗ are determined byY (N ) = A(S) · D′(θ∗) · X and τ ∗ + θ∗ = r .
Comparative statics To examine the effects of the size of a dictatorship on the optimal taxand corruption rates, we perform comparative statics with respect to the number of regionsS. From the optimality condition Y (N ) = A(S) · D′(θ∗) · X and the assumptions A′(S) < 0and D′′(θ) > 0, we obtain the following result:
Result 1 The equilibrium corruption rate θ∗ is higher in a larger dictatorship: dθ∗d S > 0.
From τ ∗ + θ∗ = r , it also follows that:
Result 2 The equilibrium tax rate τ ∗ is lower in a larger dictatorship: dτ∗d S < 0.
In other words, assuming that production and monitoring technologies are identical acrosscomparable regions in the two dictatorships, the model predicts lower official tax rates andhigher extralegal expropriation rates in Qing China than in Tokugawa Japan. These resultsare driven solely by the assumption of managerial diseconomies of scale, A′(S) < 0.
3.2 The dynamic setup
We now consider a dynamic game (t = 1, 2, 3...) and introduce two additional features. First,to provide a link between tax revenue and the economy, we allow the ruler to spend part ofthe revenue on a local public good. Second, to study dynamic implications, we endogenizepopulation and permit the economy to grow.
If the ruler spends all tax revenue on nonproductive pursuits, such as private consumption,then from an economic point of view, there is little difference between taxation and corruption.Suppose, however, that the ruler spends part of the tax revenue on public goods in each region.For simplicity, assume that a random shock (e.g., natural disaster) hits the representativeregion at the end of every period. Assume also that the ruler can invest in a public good in
123
452 J Econ Growth (2014) 19:439–470
the beginning of every period to prepare for the possible disaster. We consider a local publicgood (as opposed to a pure public good) that is non-excludable but rivalrous within the regionand has no spillover effects on other regions. Most infrastructure investments, such as roads,flood control, fire protection, and famine relief, satisfy these conditions and must be providedon a regional basis.
Let γt be the level of public good the ruler provides in period t . Unless the level of publicgood investment is sufficiently large relative to the size of the shock, the shock destroysthe region’s economy and terminates the game at the end of period t . Let G(γt ) denote theprobability that the region survives the shock and the game continues into period t + 1 giventhe investment γt . We assume that the continuation probability increases with γt but at adiminishing rate: G(0) = 0, G ′(·) > 0, and G ′′(·) < 0.31 In other words, the ruler now hasan incentive to invest in the public good to protect the regional economy from the randomshock to secure future tax revenue.32
Next, we model consumption and reproduction decisions of a representative peasant.Assume that the peasant lives for just one period, earns income from agricultural production,and spends his after-tax income on consumption and reproduction to maximize his utility.33
Let u(ct , nt+1) represent the utility the peasant receives from the consumption ct and thenumber of offspring nt+1 produced in period t . Collectively, nt+1 gives total population inthe next period Nt+1, namely, Nt+1 = Nt · nt+1. Following Hansen and Prescott (2002), weassume that the two goods are complements and are subject to diminishing marginal utility:u1(.) > 0, u2(.) > 0, u11(.) < 0, u22(.) < 0, u12(.) > 0.
The timing of events in the dynamic game in period t (t = 1, 2, 3...) is as follows: (1) Theruler sets a tax rate τt and public good investment γt . (2) The representative agent selects a rateof extralegal expropriation θt . (3) The representative peasant pays τt +θt of his income to theAgent, makes consumption and reproductive decisions (ct , nt+1), and revolts if τt + θt > r .(4) The ruler conducts randomized audits and fines the agents if misconduct is detected. (5)Exogenous shock hits the region and destroys the economy unless γt is sufficiently large; thegame continues to the next period with probability G(γt ).
The representative peasant We derive an equilibrium of the dynamic game by backwardinduction.
First, the optimization problem of the representative Peasant in period t is given by:
maxct ,nt+1>0
ut = u(ct , nt+1) (4)
s.t. ct + nt+1 ≤ [1 − τt − θt ] · yt (5)
where individual income is defined by yt = Y (Nt )Nt
. Note that yt is exogenous to the peasanteven though Nt = Nt−1 · nt because nt is a decision variable of the previous generation.
31 For example, let Wt denote the realization of the shock in period t , and assume that the shock destroys theeconomy if γt < Wt . Suppose that Wt is the absolute value of a normally distributed random variable withmean 0 and variance σ 2. Then, it follows that G(γt ) = F(γt ; 0, σ 2) − F(−γt ; 0, σ 2) and thus G(0) = 0,G′(·) > 0, and G′′(·) < 0.32 More generally, the ruler may invest in public goods that directly increase the agricultural output Y in theregion. In our model, we consider public goods that only affect the continuation probability as it immeasurablysimplifies the analysis.33 In our model, when making reproduction decisions, individual peasants do not take into consideration thenegative externalities of producing offspring today on the living standard of the next generation. We assumethat even if each peasant cares about the well-being of his offspring in the next period, peasants in the regionare unable to act collectively to regulate population growth to attain a socially optimal level of income. Assuch, individual peasants take Nt+1 and thus yt+1 as exogenous and beyond their control.
123

J Econ Growth (2014) 19:439–470 453
From the first order condition and the assumption u12(.) > 0, it can be shown that the optimalnumber of offspring n∗
t+1 is an increasing function of net individual income (1− τt − θt ) · yt .The representative agent The representative Agent is assumed to be short-lived. As a
result, the maximization problem of the representative Agent is essentially the same as in thesingle-period game, and thus the optimal rate of extralegal expropriation in period t is givenby:
Y (Nt ) = A(S) · D′(θ∗t ) · X (6)
The ruler The ruler is assumed to live for infinitely many periods. He sets the current andfuture values of (τ, γ ) to maximize the expected discounted value of the tax revenue stream.In doing so, we again assume that the ruler is bound by the no-revolt condition in everyperiod. Let V R
t represent the ruler’s present value of the future revenue stream in period t .His maximization problem in period t is given by:
max0≤τt+ j ≤1,γt+ j ≥0
V Rt = τt · Y (Nt ) − γt + G(γt ) · V R
t+1 (7)
s.t. τt+ j + θt+ j ≤ r ∀ j = 0, 1, 2 . . .
The optimal level of public good investment γt is given by the following condition:
G ′(γ ∗t ) · V R∗
t+1 = 1 (8)
In other words, the ruler invests in the public good up to the level where the marginalreturn from the investment equals its marginal cost. The higher the present value of his futurerevenue stream V R∗
t+1, the more willing the ruler is to invest in the public good to increase thecontinuation probability.
The ruler sets an optimal tax rate, taking the agent’s optimality condition (6) and thePeasant’s no-revolt condition as given. Because these conditions are the same as before, theequilibrium tax and corruption rates (τ ∗
t , θ∗t ) in the dynamic game are again determined by
Y (N ) = A(S) · D′(θ∗t ) · X and τ ∗
t + θ∗t = r (t = 1, 2, 3 . . .).
Population dynamics We now turn to equilibrium population dynamics. Because the Peas-ant’s net income is (1 − r) · yt in the equilibrium and r is a constant, the optimal numberof offspring can be expressed as n∗
t+1 = n∗t+1(yt ), where n∗
t+1(·) is strictly increasing in yt .This, in turn, provides the population dynamics because by definition:
n∗t+1(yt ) = N∗
t · n∗t+1
N∗t
= N∗t+1
N∗t
(9)
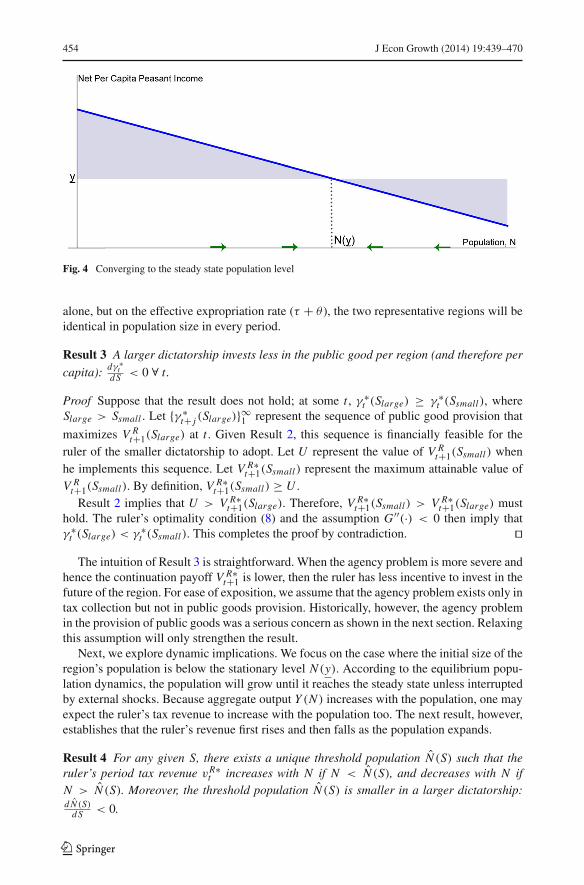
In the spirit of Malthus, Condition (9) implies that the direction and rate of populationgrowth depends on the peasant’s per capita income. Let y denote the level of income defined
by n∗t+1(y) = N∗
t+1N∗
t= 1. If yt > y, then Nt+1 > Nt or population will expand; if yt < y
instead, then population will contract. Either way, in the long run the region’s population willconverge to a stationary level N (y) associated with the steady-state per capita income y (seeFig. 4).
3.2.1 Comparative statics
We compare the two dictatorships that differ only in the number of regions that they encom-pass. In particular, we assume the same initial populations in the representative regions in thetwo dictatorships. Recall that the optimal tax rate is higher in a smaller dictatorship in everyperiod (Result 2). However, since population growth depends not on the official tax rate (τ )
123
454 J Econ Growth (2014) 19:439–470
Fig. 4 Converging to the steady state population level
alone, but on the effective expropriation rate (τ + θ ), the two representative regions will beidentical in population size in every period.
Result 3 A larger dictatorship invests less in the public good per region (and therefore per
capita): dγ ∗t
d S < 0 ∀ t .
Proof Suppose that the result does not hold; at some t , γ ∗t (Slarge) ≥ γ ∗
t (Ssmall), whereSlarge > Ssmall . Let {γ ∗
t+ j (Slarge)}∞1 represent the sequence of public good provision that
maximizes V Rt+1(Slarge) at t . Given Result 2, this sequence is financially feasible for the
ruler of the smaller dictatorship to adopt. Let U represent the value of V Rt+1(Ssmall) when
he implements this sequence. Let V R∗t+1(Ssmall) represent the maximum attainable value of
V Rt+1(Ssmall). By definition, V R∗
t+1(Ssmall) ≥ U .Result 2 implies that U > V R∗
t+1(Slarge). Therefore, V R∗t+1(Ssmall) > V R∗
t+1(Slarge) musthold. The ruler’s optimality condition (8) and the assumption G ′′(·) < 0 then imply thatγ ∗
t (Slarge) < γ ∗t (Ssmall). This completes the proof by contradiction. �
The intuition of Result 3 is straightforward. When the agency problem is more severe andhence the continuation payoff V R∗
t+1 is lower, then the ruler has less incentive to invest in thefuture of the region. For ease of exposition, we assume that the agency problem exists only intax collection but not in public goods provision. Historically, however, the agency problemin the provision of public goods was a serious concern as shown in the next section. Relaxingthis assumption will only strengthen the result.
Next, we explore dynamic implications. We focus on the case where the initial size of theregion’s population is below the stationary level N (y). According to the equilibrium popu-lation dynamics, the population will grow until it reaches the steady state unless interruptedby external shocks. Because aggregate output Y (N ) increases with the population, one mayexpect the ruler’s tax revenue to increase with the population too. The next result, however,establishes that the ruler’s revenue first rises and then falls as the population expands.
Result 4 For any given S, there exists a unique threshold population N (S) such that theruler’s period tax revenue vR∗
t increases with N if N < N (S), and decreases with N ifN > N (S). Moreover, the threshold population N (S) is smaller in a larger dictatorship:d N (S)
d S < 0.
123
J Econ Growth (2014) 19:439–470 455
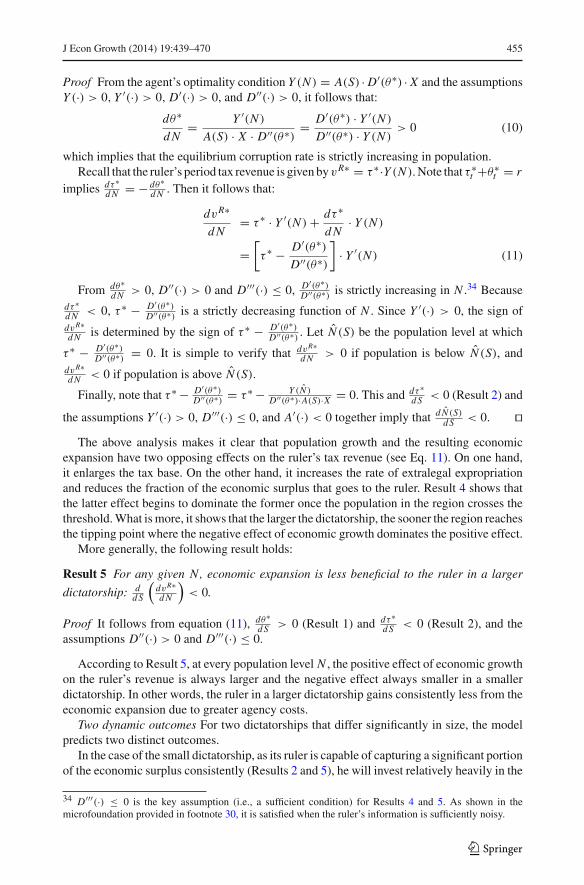
Proof From the agent’s optimality condition Y (N ) = A(S) · D′(θ∗) · X and the assumptionsY (·) > 0, Y ′(·) > 0, D′(·) > 0, and D′′(·) > 0, it follows that:
dθ∗
d N= Y ′(N )
A(S) · X · D′′(θ∗)= D′(θ∗) · Y ′(N )
D′′(θ∗) · Y (N )> 0 (10)
which implies that the equilibrium corruption rate is strictly increasing in population.Recall that the ruler’s period tax revenue is given by vR∗ = τ ∗·Y (N ). Note that τ ∗
t +θ∗t = r
implies dτ∗d N = − dθ∗
d N . Then it follows that:
dvR∗
d N= τ ∗ · Y ′(N ) + dτ ∗
d N· Y (N )
=[τ ∗ − D′(θ∗)
D′′(θ∗)
]· Y ′(N ) (11)
From dθ∗d N > 0, D′′(·) > 0 and D′′′(·) ≤ 0, D′(θ∗)
D′′(θ∗) is strictly increasing in N .34 Becausedτ∗d N < 0, τ ∗ − D′(θ∗)
D′′(θ∗) is a strictly decreasing function of N . Since Y ′(·) > 0, the sign ofdvR∗d N is determined by the sign of τ ∗ − D′(θ∗)
D′′(θ∗) . Let N (S) be the population level at which
τ ∗ − D′(θ∗)D′′(θ∗) = 0. It is simple to verify that dvR∗
d N > 0 if population is below N (S), anddvR∗d N < 0 if population is above N (S).
Finally, note that τ ∗ − D′(θ∗)D′′(θ∗) = τ ∗ − Y (N )
D′′(θ∗)·A(S)·X = 0. This and dτ∗d S < 0 (Result 2) and
the assumptions Y ′(·) > 0, D′′′(·) ≤ 0, and A′(·) < 0 together imply that d N (S)d S < 0. �
The above analysis makes it clear that population growth and the resulting economicexpansion have two opposing effects on the ruler’s tax revenue (see Eq. 11). On one hand,it enlarges the tax base. On the other hand, it increases the rate of extralegal expropriationand reduces the fraction of the economic surplus that goes to the ruler. Result 4 shows thatthe latter effect begins to dominate the former once the population in the region crosses thethreshold. What is more, it shows that the larger the dictatorship, the sooner the region reachesthe tipping point where the negative effect of economic growth dominates the positive effect.
More generally, the following result holds:
Result 5 For any given N, economic expansion is less beneficial to the ruler in a larger
dictatorship: dd S
(dvR∗d N
)< 0.
Proof It follows from equation (11), dθ∗d S > 0 (Result 1) and dτ∗
d S < 0 (Result 2), and theassumptions D′′(·) > 0 and D′′′(·) ≤ 0.
According to Result 5, at every population level N , the positive effect of economic growthon the ruler’s revenue is always larger and the negative effect always smaller in a smallerdictatorship. In other words, the ruler in a larger dictatorship gains consistently less from theeconomic expansion due to greater agency costs.
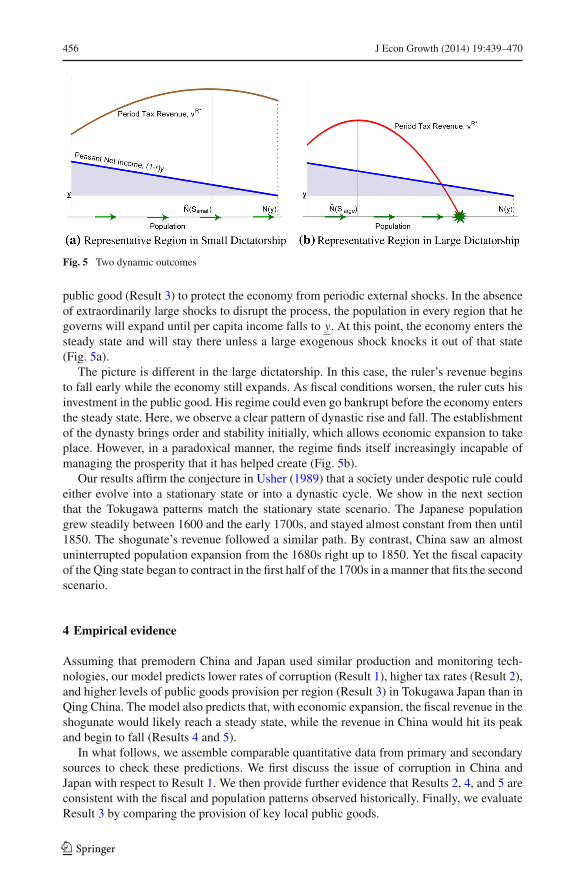
Two dynamic outcomes For two dictatorships that differ significantly in size, the modelpredicts two distinct outcomes.
In the case of the small dictatorship, as its ruler is capable of capturing a significant portionof the economic surplus consistently (Results 2 and 5), he will invest relatively heavily in the
34 D′′′(·) ≤ 0 is the key assumption (i.e., a sufficient condition) for Results 4 and 5. As shown in themicrofoundation provided in footnote 30, it is satisfied when the ruler’s information is sufficiently noisy.
123
456 J Econ Growth (2014) 19:439–470
Fig. 5 Two dynamic outcomes
public good (Result 3) to protect the economy from periodic external shocks. In the absenceof extraordinarily large shocks to disrupt the process, the population in every region that hegoverns will expand until per capita income falls to y. At this point, the economy enters thesteady state and will stay there unless a large exogenous shock knocks it out of that state(Fig. 5a).
The picture is different in the large dictatorship. In this case, the ruler’s revenue beginsto fall early while the economy still expands. As fiscal conditions worsen, the ruler cuts hisinvestment in the public good. His regime could even go bankrupt before the economy entersthe steady state. Here, we observe a clear pattern of dynastic rise and fall. The establishmentof the dynasty brings order and stability initially, which allows economic expansion to takeplace. However, in a paradoxical manner, the regime finds itself increasingly incapable ofmanaging the prosperity that it has helped create (Fig. 5b).
Our results affirm the conjecture in Usher (1989) that a society under despotic rule couldeither evolve into a stationary state or into a dynastic cycle. We show in the next sectionthat the Tokugawa patterns match the stationary state scenario. The Japanese populationgrew steadily between 1600 and the early 1700s, and stayed almost constant from then until1850. The shogunate’s revenue followed a similar path. By contrast, China saw an almostuninterrupted population expansion from the 1680s right up to 1850. Yet the fiscal capacityof the Qing state began to contract in the first half of the 1700s in a manner that fits the secondscenario.
4 Empirical evidence
Assuming that premodern China and Japan used similar production and monitoring tech-nologies, our model predicts lower rates of corruption (Result 1), higher tax rates (Result 2),and higher levels of public goods provision per region (Result 3) in Tokugawa Japan than inQing China. The model also predicts that, with economic expansion, the fiscal revenue in theshogunate would likely reach a steady state, while the revenue in China would hit its peakand begin to fall (Results 4 and 5).
In what follows, we assemble comparable quantitative data from primary and secondarysources to check these predictions. We first discuss the issue of corruption in China andJapan with respect to Result 1. We then provide further evidence that Results 2, 4, and 5 areconsistent with the fiscal and population patterns observed historically. Finally, we evaluateResult 3 by comparing the provision of key local public goods.
123
J Econ Growth (2014) 19:439–470 457
4.1 Corruption
By its very nature, evidence of corruption is elusive. Nevertheless, consistent with our the-oretical predictions, historical accounts by contemporary observers in Qing China suggestthat bureaucratic corruption was pervasive during the eighteenth century and that it worsenedover time.35 By comparison, the problem was reasonably contained in Tokugawa Japan.
As noted earlier, regional diversity in crops and multiple commutation rates across theempire made it difficult for the Chinese emperor to monitor local officials. In collecting landtax, over-collection (fu-shou) by magistrates and their underlings was reported to be endemic(Ch’u 1962; Zelin 1984).36
One popular form of over-collection was the manipulation of commutation rates, whereinmagistrates demanded households to pay taxes in copper (instead of the officially stipulatedsilver or grain) and set the commutation rate above the market rate (Ch’u 1962, p. 142). FengGuifen, a contemporary scholar, observed in the 1840s that commoners paid up to 16,000wen of copper cash for every shi of rice that they owed in taxes, when the market price ofrice was less than 3000 wen per shi (Wang 1973, p. 38). In Guangdong, the commutation rateincreased by 250 % (from 2 taels to 7 taels of silver per shi of grain) from the mid-eighteenthcentury to the mid-nineteenth century, even though the grain price rose only 40 % during thesame period (Lin 1997).
Setting a high commutation rate was just one example of over-collection. In Shanxi, 12surtaxes unauthorized by the central government were imposed between 1735 and 1795,followed by 7 additional items between 1796 and 1820 and 15 more between 1821 and 1850(Wang 1973, p. 59).
According to Zhang (1962, p. 32), in the early nineteenth century a typical Chinesemagistrate earned 30,000 silver taels a year through extralegal channels. By this estimate,the extralegal incomes of the 1,500 magistrates (45 million taels) would have exceededthe annual amount of tax silver that entered the state coffers (40 million taels in the earlynineteenthcentury). Ni and Van (2006) estimate that corruption consumed more than 20 %of China’s agricultural output in 1850.
While bureaucratic corruption was a subject of intense discussion in official and scholarlydiscourse in Qing China, it attracted less attention in Tokugawa Japan. Political and intel-lectual elites in the late Tokugawa period were more concerned with the declining economicstatus of the ruling class (who served as government officials) than their misconduct (Jansen1989; Totman 1993).
Bribes and gifts to tax officials were the common form of illegal exaction in Japan.However, historical accounts indicate that corruption was reasonably contained after the
35 Park (1997) suggests that corruption was already institutionalized in High Qing as it penetrated all levelsof bureaucracy. The scale and frequency of corruption scandals increased significantly during the second halfof the eighteenth century (Elliott 2009). The Qing emperors themselves became deeply concerned about theproblem (Li 2007; Will 2008). For example, from the statements made by Emperor Daoguang (r. 1821–1850)in private interviews with officials, Will (2008) concludes that the emperor had a profound distrust of hisbureaucracy.36 To be sure, not all tax surcharges were illegal because some over-collection was necessary to cover thecosts of tax collection. Emperor Kangxi (r. 1662–1722) once mentioned in private that he would considera magistrate who imposed a 10 % surcharge an honest official (Qu1962). Emperor Yongzheng (r. 1723–35)subsequently legalized the collection of a silver meltage fee to help pay for local administrative costs. Thesanctioned rates averaged about 12 % nationwide (Zelin 1984). Likewise in Japan, magistrates were initiallyallowed to collect a 3 % surcharge on the regular rice tax to finance personnel and other expenses. During the1720s, the shogun Yoshimune instituted reforms to incorporate these expenses into the official budget. Ourtax revenue estimates in Figs. 1 and 8 include these legal and informally approved surcharges.
123
458 J Econ Growth (2014) 19:439–470
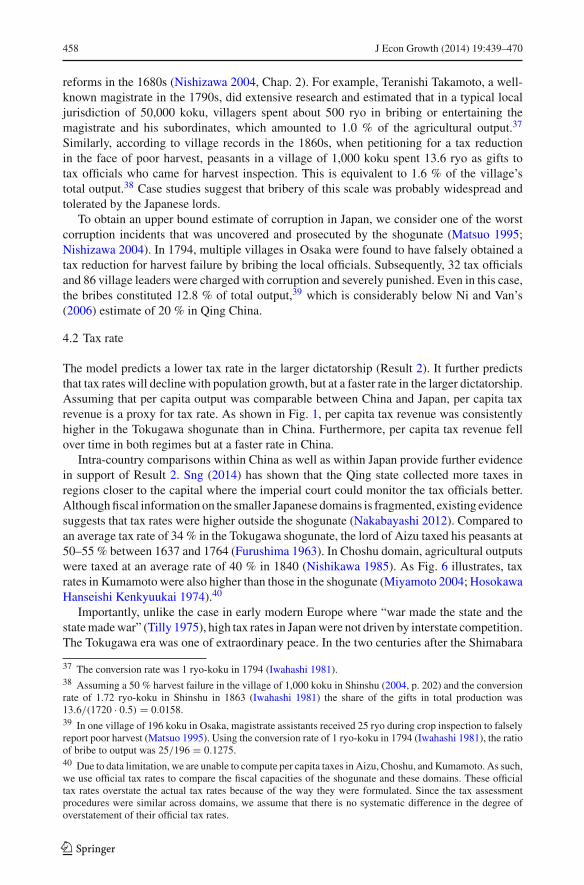
reforms in the 1680s (Nishizawa 2004, Chap. 2). For example, Teranishi Takamoto, a well-known magistrate in the 1790s, did extensive research and estimated that in a typical localjurisdiction of 50,000 koku, villagers spent about 500 ryo in bribing or entertaining themagistrate and his subordinates, which amounted to 1.0 % of the agricultural output.37
Similarly, according to village records in the 1860s, when petitioning for a tax reductionin the face of poor harvest, peasants in a village of 1,000 koku spent 13.6 ryo as gifts totax officials who came for harvest inspection. This is equivalent to 1.6 % of the village’stotal output.38 Case studies suggest that bribery of this scale was probably widespread andtolerated by the Japanese lords.
To obtain an upper bound estimate of corruption in Japan, we consider one of the worstcorruption incidents that was uncovered and prosecuted by the shogunate (Matsuo 1995;Nishizawa 2004). In 1794, multiple villages in Osaka were found to have falsely obtained atax reduction for harvest failure by bribing the local officials. Subsequently, 32 tax officialsand 86 village leaders were charged with corruption and severely punished. Even in this case,the bribes constituted 12.8 % of total output,39 which is considerably below Ni and Van’s(2006) estimate of 20 % in Qing China.
4.2 Tax rate
The model predicts a lower tax rate in the larger dictatorship (Result 2). It further predictsthat tax rates will decline with population growth, but at a faster rate in the larger dictatorship.Assuming that per capita output was comparable between China and Japan, per capita taxrevenue is a proxy for tax rate. As shown in Fig. 1, per capita tax revenue was consistentlyhigher in the Tokugawa shogunate than in China. Furthermore, per capita tax revenue fellover time in both regimes but at a faster rate in China.
Intra-country comparisons within China as well as within Japan provide further evidencein support of Result 2. Sng (2014) has shown that the Qing state collected more taxes inregions closer to the capital where the imperial court could monitor the tax officials better.Although fiscal information on the smaller Japanese domains is fragmented, existing evidencesuggests that tax rates were higher outside the shogunate (Nakabayashi 2012). Compared toan average tax rate of 34 % in the Tokugawa shogunate, the lord of Aizu taxed his peasants at50–55 % between 1637 and 1764 (Furushima 1963). In Choshu domain, agricultural outputswere taxed at an average rate of 40 % in 1840 (Nishikawa 1985). As Fig. 6 illustrates, taxrates in Kumamoto were also higher than those in the shogunate (Miyamoto 2004; HosokawaHanseishi Kenkyuukai 1974).40
Importantly, unlike the case in early modern Europe where “war made the state and thestate made war” (Tilly 1975), high tax rates in Japan were not driven by interstate competition.The Tokugawa era was one of extraordinary peace. In the two centuries after the Shimabara
37 The conversion rate was 1 ryo-koku in 1794 (Iwahashi 1981).38 Assuming a 50 % harvest failure in the village of 1,000 koku in Shinshu (2004, p. 202) and the conversionrate of 1.72 ryo-koku in Shinshu in 1863 (Iwahashi 1981) the share of the gifts in total production was13.6/(1720 · 0.5) = 0.0158.39 In one village of 196 koku in Osaka, magistrate assistants received 25 ryo during crop inspection to falselyreport poor harvest (Matsuo 1995). Using the conversion rate of 1 ryo-koku in 1794 (Iwahashi 1981), the ratioof bribe to output was 25/196 = 0.1275.40 Due to data limitation, we are unable to compute per capita taxes in Aizu, Choshu, and Kumamoto. As such,we use official tax rates to compare the fiscal capacities of the shogunate and these domains. These officialtax rates overstate the actual tax rates because of the way they were formulated. Since the tax assessmentprocedures were similar across domains, we assume that there is no systematic difference in the degree ofoverstatement of their official tax rates.
123

J Econ Growth (2014) 19:439–470 459
Fig. 6 Tax rate. Sources: Ohno (1996), Miyamoto (2004) and Hosokawa Hanseishi Kenkyuukai (1974)
rebellion (1637–1638), no major armed incident occurred. Until the West forced Japan toopen up in the 1850s, tensions between the shogunate and local domains were never highenough to make war a real possibility.
4.3 Population growth and fiscal change
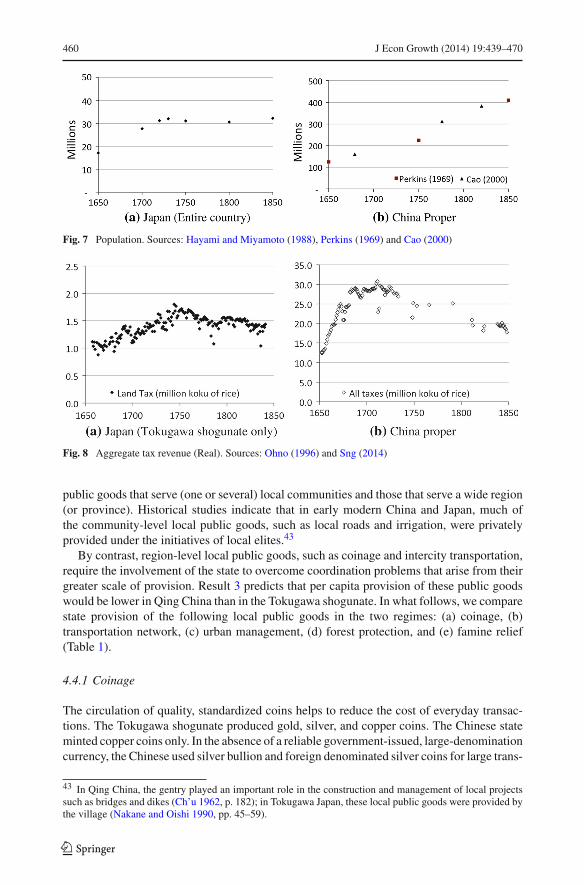
According to demographic trends, the Tokugawa era can be divided into two sub-periods.From 1600 to the early 1700s, population grew from 12 million to 30 million and townsand cities proliferated. From 1700 to 1850, however, Japan’s population stayed at around30 million (Fig. 7a). As Fig. 8a shows, aggregate tax revenue of the shogunate evolved intandem with population change: land tax revenues grew steadily before the early eighteenthcentury and stayed more or less flat afterwards.41
In China proper, the population expanded steadily from the late 1600s to around 1850(Fig. 7b). However, the Qing state’s tax revenue peaked in the first half of the eighteenthcentury and tailed off from then on (Fig. 8b). Ironically—but consistent with Result 4—theturning point occurred in the midst of the High Qing period, when the Chinese economy wasexpanding steadily and interregional trade was flourishing (Shiue and Keller 2007).42
According to Fig. 8, even though the Qing state collected lower taxes per capita, itsaggregate tax revenue remained far greater than that of the Tokugawa shogunate throughoutthe period. If we assume that a ruler maximizes aggregate tax revenue and not per capitarevenue, then it might have been perfectly rational for the Qing emperor to prefer to governa large empire.
4.4 Provision of local public goods
Finally, we compare the provision of local public goods by the state in China and Japan.For our analysis, it is important to distinguish two categories of local public goods: local
41 The two dips in the shogunate land tax revenue after 1750 correspond to the Tenmei famine (1783–1786)and the Tenpo famine (1833–1837).42 The decline in the Qing state’s aggregate tax revenue in the early 1700s coincided with two policy decisions.In 1712, Emperor Kangxi announced a permanent freeze on the head tax, which accounted for 5 % of thenational tax revenue, as it was found to be excessively regressive and prone to abuses in the collection process(Shi 2007). In the 1730s, the imperial court dropped its policy of incentivizing provincial and local officialsto report newly reclaimed lands, as it became concerned that the policy had encouraged false reporting byofficials who were eager to please the emperor, and peasants were made to shoulder taxes on lands that neverexisted (Rowe 2009). Given the political considerations behind these decisions, they are consistent with ourargument.
123
460 J Econ Growth (2014) 19:439–470
Fig. 7 Population. Sources: Hayami and Miyamoto (1988), Perkins (1969) and Cao (2000)
Fig. 8 Aggregate tax revenue (Real). Sources: Ohno (1996) and Sng (2014)
public goods that serve (one or several) local communities and those that serve a wide region(or province). Historical studies indicate that in early modern China and Japan, much ofthe community-level local public goods, such as local roads and irrigation, were privatelyprovided under the initiatives of local elites.43
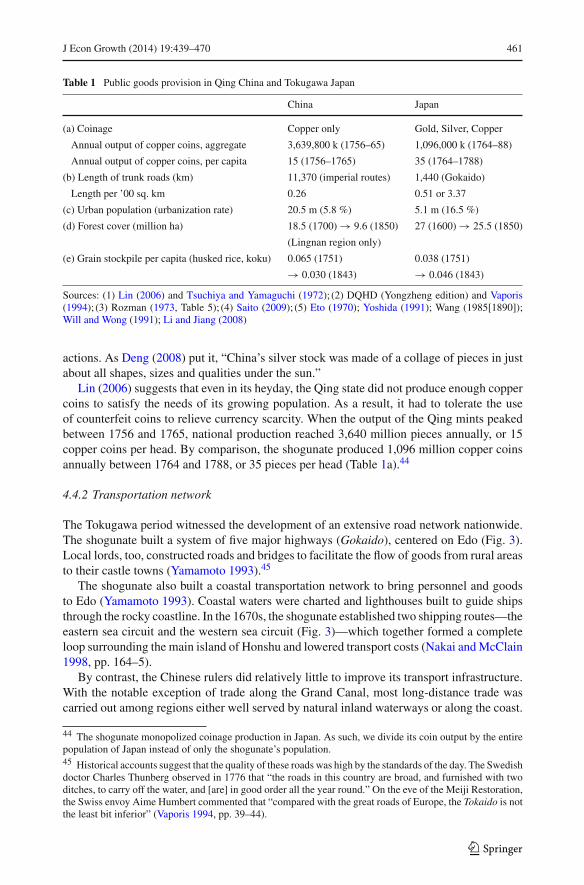
By contrast, region-level local public goods, such as coinage and intercity transportation,require the involvement of the state to overcome coordination problems that arise from theirgreater scale of provision. Result 3 predicts that per capita provision of these public goodswould be lower in Qing China than in the Tokugawa shogunate. In what follows, we comparestate provision of the following local public goods in the two regimes: (a) coinage, (b)transportation network, (c) urban management, (d) forest protection, and (e) famine relief(Table 1).
4.4.1 Coinage
The circulation of quality, standardized coins helps to reduce the cost of everyday transac-tions. The Tokugawa shogunate produced gold, silver, and copper coins. The Chinese stateminted copper coins only. In the absence of a reliable government-issued, large-denominationcurrency, the Chinese used silver bullion and foreign denominated silver coins for large trans-
43 In Qing China, the gentry played an important role in the construction and management of local projectssuch as bridges and dikes (Ch’u 1962, p. 182); in Tokugawa Japan, these local public goods were provided bythe village (Nakane and Oishi 1990, pp. 45–59).
123
J Econ Growth (2014) 19:439–470 461
Table 1 Public goods provision in Qing China and Tokugawa Japan
China Japan
(a) Coinage Copper only Gold, Silver, Copper
Annual output of copper coins, aggregate 3,639,800 k (1756–65) 1,096,000 k (1764–88)
Annual output of copper coins, per capita 15 (1756–1765) 35 (1764–1788)
(b) Length of trunk roads (km) 11,370 (imperial routes) 1,440 (Gokaido)
Length per ’00 sq. km 0.26 0.51 or 3.37
(c) Urban population (urbanization rate) 20.5 m (5.8 %) 5.1 m (16.5 %)
(d) Forest cover (million ha) 18.5 (1700) → 9.6 (1850) 27 (1600) → 25.5 (1850)
(Lingnan region only)
(e) Grain stockpile per capita (husked rice, koku) 0.065 (1751) 0.038 (1751)
→ 0.030 (1843) → 0.046 (1843)
Sources: (1) Lin (2006) and Tsuchiya and Yamaguchi (1972); (2) DQHD (Yongzheng edition) and Vaporis(1994); (3) Rozman (1973, Table 5); (4) Saito (2009); (5) Eto (1970); Yoshida (1991); Wang (1985[1890]);Will and Wong (1991); Li and Jiang (2008)
actions. As Deng (2008) put it, “China’s silver stock was made of a collage of pieces in justabout all shapes, sizes and qualities under the sun.”
Lin (2006) suggests that even in its heyday, the Qing state did not produce enough coppercoins to satisfy the needs of its growing population. As a result, it had to tolerate the useof counterfeit coins to relieve currency scarcity. When the output of the Qing mints peakedbetween 1756 and 1765, national production reached 3,640 million pieces annually, or 15copper coins per head. By comparison, the shogunate produced 1,096 million copper coinsannually between 1764 and 1788, or 35 pieces per head (Table 1a).44
4.4.2 Transportation network
The Tokugawa period witnessed the development of an extensive road network nationwide.The shogunate built a system of five major highways (Gokaido), centered on Edo (Fig. 3).Local lords, too, constructed roads and bridges to facilitate the flow of goods from rural areasto their castle towns (Yamamoto 1993).45
The shogunate also built a coastal transportation network to bring personnel and goodsto Edo (Yamamoto 1993). Coastal waters were charted and lighthouses built to guide shipsthrough the rocky coastline. In the 1670s, the shogunate established two shipping routes—theeastern sea circuit and the western sea circuit (Fig. 3)—which together formed a completeloop surrounding the main island of Honshu and lowered transport costs (Nakai and McClain1998, pp. 164–5).
By contrast, the Chinese rulers did relatively little to improve its transport infrastructure.With the notable exception of trade along the Grand Canal, most long-distance trade wascarried out among regions either well served by natural inland waterways or along the coast.
44 The shogunate monopolized coinage production in Japan. As such, we divide its coin output by the entirepopulation of Japan instead of only the shogunate’s population.45 Historical accounts suggest that the quality of these roads was high by the standards of the day. The Swedishdoctor Charles Thunberg observed in 1776 that “the roads in this country are broad, and furnished with twoditches, to carry off the water, and [are] in good order all the year round.” On the eve of the Meiji Restoration,the Swiss envoy Aime Humbert commented that “compared with the great roads of Europe, the Tokaido is notthe least bit inferior” (Vaporis 1994, pp. 39–44).
123
462 J Econ Growth (2014) 19:439–470
Many roads appeared to be poorly built (Pomeranz 2000). Schran (1978) observes that “as arule, the rivers and lakes were not made more passable for boats by the removal of obstaclessuch as rocks, silt, and debris, by the dredging or marking of channels, by the construction oftwo paths, etc,” and “the Chinese people adapted to this limited involvement of the governmentin communication by ‘struggling’ on their own (individually or in groups) against the naturalelements as well as each other.”
In Table 1b, we use the length of trunk roads as a crude measure of state investmentin transportation. The Qing imperial postal system, which the imperial court relied on tomaintain communications with the rest of the country, was about 13,770 km long, or eighttimes the length of the Gokaido (Fig. 2). However, this implies a trunk road density (lengthdivided by domain size, in km per 100 km2) of only 0.26, compared to 3.37 in the shogunateif we assume that the Gokaido served only the shogunate domain. Even if we divide thelength of the Gokaido by the whole of Japan, the resulting road density, at 0.51, would stillbe twice that of China.46
4.4.3 Urban management
The state played an active role in Japan’s urban expansion. Local lords transformed theircastles into towns as they strove to expand their tax base (McClain 1980). As these castletowns grew, their rulers imposed detailed regulations and devised new systems of urbanadministration (Nakai and McClain 1998). For example, after a big fire in 1657, the shogunatecreated open spaces in Edo to serve as fire breaks (Hanley 1987). Professional firefightingunits were set up and watchtowers were built.47 Measures were also taken to ensure thatwaste materials were properly recycled or disposed of, and streets and waterways were keptclean and open in Edo as well as in the smaller towns and cities (Hanley 1987).
Contrary to Max Weber’s claim that a heavy state presence in Chinese cities stifled China’seconomic development, formal administration penetrated far less in Chinese cities than inJapanese ones (Rozman 1973). Over 95 % of the towns and cities in early modern China didnot have a permanent bureaucratic presence (Zelin 2004). Unlike the case in Japan, wherethere was a distinction between the urban magistrates (machi-bugyo) and the rural ones(daikan), Chinese counties were not functionally differentiated into urban and rural units.48
The urban infrastructure in China was less developed than in Japan (Mosk 2011). A Chinesescholar observed in the early 1900s that “the hundred and one undertakings, such as roads,streetlights, removal of rubbish, water supply, school system, police, fire protection, etc.,which people of the West are accustomed to regard as functions of a municipal governmentare, with a few exceptions of recent date, never undertaken by the proper government officials”(Rowe 1989, p. 135).
Rozman (1973) calculated that in 1800, Japan’s urbanization rate (16.5 %) was more thantwice that of China (5.5 %), and “the most urbanized province of China [Zhili] was con-siderably less urban than the least urbanized region of Japan [Tohoku]” (Table 1c). Somescholars have pointed out that conventional measures of urbanization may have underesti-mated China’s true level of urbanization, for these measures overlook the proliferation of
46 The Chinese imperial postal system comprised both land and water routes. To obtain upper bound estimatesfor China, we treat them all as “roads.”47 According to Engelbert Kaempfer, a German physician who visited Japan between 1690 and 1692, it wascommon to see fire police patrolling the streets and equipment such as water-filled buckets and fire axes beingplaced at prominent intervals in Japanese cities (Kaempfer and Beatrice 1999).48 See Mote (1973) and Fei (2009, pp. 13–20).
123
J Econ Growth (2014) 19:439–470 463
small market towns in early modern China (Li 2000; Brandt et al. 2014). Our comparativeanalysis shows that the lack of state leadership in solving urban collective action problemsmay help to explain why, instead of seeing its largest cities growing, China’s “urbanization”took such a unique path.
4.4.4 Forest preservation
Population growth and urbanization brought about rapid deforestation in seventeenth-centuryJapan. By the mid-seventeenth century, few prime forests were still in existence. Becauseenvironment degradation threatened the long-term economic and security interests of theshogun and local lords, they responded by issuing regulations to restrict entry into forestsand clearance of woodland for cultivation. Over time, they created new administrative bodies(e.g., the Kinai Office of Erosion Control) and positions (e.g., forest magistrates) to enforcethe regulations, demanded the compilation of forest registers to track illegal logging, set upinspection points along rivers and roads to detect smugglers, and implemented sumptuaryrules to prohibit the use of precious timber on “wasteful” activities.49 Attempts were alsomade to delineate the boundaries between domains as well as between villages to avoid“the tragedy of commons.” Finally, the shogunate and some domains promoted reforestationprograms actively (Totman 1989).
Early modern China, too, experienced rapid deforestation (Elvin and Liu 1998; Elvin2004; Marks 2012). Like the Japanese rulers, the Qing emperor was acutely aware of theproblem and the threat it posed to social stability. When flash floods caused by excessiveland reclamation plagued the middle reaches of the Yangzi River in the second half of theeighteenth century, the state intervened spontaneously. However, its efforts were thwartedby corruption and inefficient administration. Zhang (2006, p. 100) observes that the govern-ment’s attempt to issue new regulations and throw resources at the problem was unsuccessfuland “money was wasted on a top-heavy, inefficient, and corrupt bureaucracy.”50 According toMcCaffrey (2003), the Qing state’s inability to manage the rivalry among local communitiesin the region was a major contributing factor to the White Lotus Rebellion in 1796.
Saito (2009) provides a quantitative measure to compare environmental preservation out-comes in China and Japan. Between 1600 and 1850, the estimated woodland area in Japan fellfrom 27 million hectares to 25.5 million hectares, and the movement between the two timepoints followed a U-shaped trajectory: forest cover first contracted sharply before rebound-ing. In Lingnan, a region in South China that “share[d] much the same flora and climate”as Japan, forest-covered area was almost halved from 18.3 million hectares in 1700 to 9.6million hectares in 1850 (Table 1d).
4.4.5 Famine relief
For agrarian societies, crop failures could undermine social stability. To mitigate this threat,the Qing emperors built a nationwide system of public granaries known as the ever-normalgranaries. Located in the provincial, prefectural, and county capitals, these granaries weremanaged by the local magistrates and were expected to perform two main functions: faminerelief in natural disasters and price smoothing in normal times (buying low and selling high)(QSG, 1976 [1927], juan 121).
49 For example, in 1706, the shogunate banned the use of large pine trees as New Year’s decorations.50 Similar situations were observed elsewhere. In the Hunan province, Perdue (1987) argues that it was nota lack of awareness of the problem but “the state’s limited impact on the society” that doomed the Qinggovernment’s efforts to reverse the trend of ecological degradation there.
123
464 J Econ Growth (2014) 19:439–470
The size and frequency of the Qing state’s granary operations reached a peak in the mid-eighteenth century, and by the 1780s, the system was on a path of decline (Will and Wong1991). Corruption was considered to be a main factor. In 1781, a major embezzlement casewas exposed in the northwestern province of Gansu, where provincial officials conspiredto falsely report droughts and carry out phantom relief operations. In 1792, when EmperorQianlong instructed the governor-general of Zhili to provide relief to famine-stricken areas,he found out that the province’s reported grain reserve was grossly inflated and it had nocapacity to execute his order (QSL, QL juan 1417).
In Japan, the shogunate established a nationwide system of rice stockpile in 1633 inwhich a fixed amount of rice was stored in over 50 castles in various domains for militaryand emergency purposes (Yanagitani 1985, 1989). During the Kyoho famine in 1732, theshogunate used this system to send a large volume of rice to disaster areas and successfullycontained the damage (Yanagitani 1985; Kikuchi 1997). The same system, however, provedinadequate in coping with the much greater Tenmei famine from 1783 to 1786, which resultedin heavy casualties in the northern domains and major riots in Edo and Osaka. Not to repeatthe dismal experience, the shogunate set up nonmilitary granaries modeled after China and(1) ordered magistrates to create village granaries and store 0.1 % of rice output (0.2 %of other grains) throughout the shogunate domain; (2) established ever-normal granaries inmajor cities; and (3) ordered local lords to build granaries in their domains and store 2.5 %of rice output (Ando 2000).51
The new granaries complemented the existing ones and played a major role in mitigatingthe impact of the Great Tempo Famine from 1832 to 1837, especially in Edo (Yoshida 1991;Kikuchi 1997). Right after the famine, the shogunate ordered local lords to stock an additional2.5 % of rice output in their granaries (Ando 2000).
The shogunate made periodic inspections to monitor the amount of rice in the castleand city granaries. Although the actual amount often fell short of the stipulated amountdue to high maintenance and replenishment costs, corruption did not appear to be a majorproblem. Ando (2000) reports corruption cases in Edo involving town leaders overstatingthe number of needy households to misappropriate money, but the degree of overstatementwas meager. Although data are scarce, our estimates indicate that the amount of emergencyreserve increased steadily from 1750 to 1850 in Japan, reflecting the successive reforms. Inthe shogunate domain, the amount of reserve, measured in husked rice, grew from less than300,000 koku in 1751 to 368,000 koku in 1843, and to 555,000 koku in 1861; in per capitaterms, it rose from less than 0.038 koku in 1751 to 0.046 koku in 1843, and to 0.068 koku in1861 (Table 1e).52
In China, the amount of grain stockpiles in public granaries increased initially from 14.7million koku in 1751 to 17.0 million koku in 1782, but declined subsequently to 11.9 million
51 Many local lords also instituted various forms of granaries through their own initiatives (Kikuchi 1997).52 These estimates are derived using the following data and assumptions. The amount of rice reserves is a sumof (1) rice stockpiles in the shogunate domain (bakuryo shirozume-mai), (2) the shogunate-funded portion ofvillage granaries (gokura), and (3) the city granaries (machikaisho) in Edo and Osaka funded primarily by theshogunate. Data for 1751 are based on Yanagitani (1985) and Iijima (2004). Data for 1843 are drawn fromhistorical record, Zenkoku Chokoku Aridaka, reproduced in Eto (1970), and from Yoshida (1991). Data for1861 are drawn from the historical document, Okinginkome Aridaka Kakitsuke, reproduced in Ohno (2008),as well as from Yoshida (1991) and Iijima (2004). To produce lower bound estimates, we assume that therice reserves in the shogunate domain served not only the shogunate domain, but also the fiefs of his vassals(hatamoto). We further assume that the population of the shogunate domain and vassal territories made up25 % of the total population in Japan. Granaries were held in the form of husked rice (kome) as well asunhusked rice (momi), grains, and cash. We only include rice in our estimates to be conservative and use thestandard rate of 0.5 to convert unhusked rice into husked rice.
123
J Econ Growth (2014) 19:439–470 465
koku in 1843, and to 10.3 million koku in 1850. In per capita terms, it declined from 0.065koku in 1751 to 0.060 koku in 1782, and fell further to 0.030 koku in 1843 and to 0.025 kokuin 1850.53
In other words, while the Qing emperor had higher capacity to provide famine relief thanthe Tokugawa shogun in the mid-eighteenth century, their positions were reversed by themid-nineteenth century, which is consistent with our theoretical predictions.54
5 Conclusion
In this paper, we provide a comparative and historical institutional analysis of state capacityin Qing China and Tokugawa Japan. We show that despite a common cultural, institutional,and technological heritage, there was already a fiscal divergence between China and Japanbefore their first attempts at modernization in response to the arrival of the West.
Theoretically and empirically, we demonstrate that the extraordinary geographical size ofChina imposed increasingly insurmountable constraints on the regime’s capacity to collecttaxes and provide essential local public goods as its economy expanded.55 It is our conjecturethat this factor alone might have been sufficient in holding back China’s transition fromstagnation to growth even in the absence of Western imperialism.56
By contrast, aided partly by Japan’s geographical compactness, the Tokugawa shogunateand the local lords were able to perform basic functions and thereby maintain social orderup until the arrival of the Black Ships.57 Although the shogunate was replaced by a coalitionof powerful local lords during the Meiji Restoration, the new government inherited from theTokugawa period an established system of political controls and a functioning tax system
53 We arrive at the estimates for China based on the following data and assumptions. The amount of grainreserves is the sum of grain stockpiled in (1) nonmilitary state granaries outside Beijing, (2) state granariesin Beijing, and (3) military granaries. Data for (1) are drawn from Will and Wong (1991, Table A.2), and (2)from Li and Jiang (2008). For (3), due to the paucity of historical data, we derive our estimates based on thefollowing assumptions: the Wenzhou standard of storing 2 shi of unhusked rice per soldier (Wang 1890) wasobserved nationally; the Qing military stood at 800,000 soldiers throughout the period considered. Becauserice was the most valuable grain, to obtain an upper bound estimate we assume that all grains in the granarieswere rice.54 Accounting for the likelihood that the nineteenth-century Chinese figures were over-reported by the localofficials would only strengthen our result.55 We focus on agency problems as the primary mechanism that links geography and state capacity. There maybe other geography-induced factors that impact state capacity. If these factors had a strong and increasinglydifferential influence on state capacity in China and Japan, the empirical importance of our theoretical findingsmay be weakened.56 Importantly, the frequency and scale of violent peasant uprisings in China escalated from the 1770s onwarddue to weakening social control (Naquin and Rawski 1987; Sng 2014). The first large-scale commoner uprisingin Qing China, the Lin Shuangwen Uprising of 1786, preceded the Opium War (1839–42) by half a centuryand two of the subsequent major uprisings also took place before the Western intrusion (i.e., the White LotusRebellion of 1796 and the Eight Trigrams Uprising of 1813). Furthermore, the Opium War was dwarfed bythe Taiping Rebellion (1850–64) in terms of duration and scale. An estimated twenty million lives were lostin the rebellion (Ho 1959), which was suppressed only after the central government ceded political power toprovincial governors and the gentry.57 The Tokugawa shogunate maintained 215 years of uninterrupted domestic peace from the ShimabaraRebellion in 1638 to the arrival of the Black Ships in 1856. To be sure, the incidents of peasant riots (ikki) alsoincreased in Tokugawa Japan after 1700, but these “riots” were unarmed and well-ordered peasant protestsand violent confrontations rarely happened except during the early Tokugawa years (Vaporis 1994; Hosaka2006).
123
466 J Econ Growth (2014) 19:439–470
that provided the newly established state with a sizable fraction of the national income fromthe onset (Sakane 2011a, b; Nakabayashi 2012).
It is often argued that the paths of China and Japan diverged after 1868 due to the riseof a more effective government in Japan (Beasley 1972; Ma 2004). In this paper, we showthat the divergence of their state capacity was well underway before 1850. In light of recentfindings on the importance of a proactive state in facilitating the transition from stagnationto growth (Doepke 2004; Galor et al. 2009; Dincecco and Prado 2012), we conjecture thatTokugawa Japan’s legacy of a strong state might have prepared Japan better for the age ofindustrialization. In other words, we see the proactive Meiji government as a product ofJapan’s history, not a radical break from the past.
Acknowledgments This paper was previously circulated under the title “Taxation and Public Goods Provi-sion in China and Japan before 1850.” We thank Joel Mokyr for his encouragement and suggestions. StephenBroadberry, Phil Hoffman, Michihiro Kandori, Mark Koyama, Takashi Kurosaki, Masaki Nakabayashi, JaredRubin, Takashi Shimizu, Yasuo Takatsuki, Se Yan, Chun-Lei Yang, the editor, four anonymous referees, andseminar participants at Rutgers University, UC Irvine, Caltech, Osaka University, Hitotsubashi University,University of Tokyo, University of Hawaii, Peking University Guanghua School of Management, UC Berke-ley, Stanford University, the 2012 Econometrics Society North American Summer Meeting, the 2012 AsianHistorical Economics Conference, the 2012 Hong Kong Economic Association Conference, and the 2013ASSA Meeting provided many helpful comments. We gratefully acknowledge financial support from theJSPS Grant-in-Aid for Scientific Research (S) 22223003.
References
Acemoglu, D. (2005). Politics and economics in weak and strong states. Journal of Monetary Economics,52(7), 1199–1226.
Alcock, R. (1863). The capital of the tycoon: A narrative of a three years’ residence in Japan. London:Longman, Green, Longman, Roberts & Green.
Alesina, A., & Spolaore, E. (1997). On the number and size of nations. Quarterly Journal of Economics,112(4), 1027–1056.
Allen, R. C., Bassino, J. P., Ma, D., Moll-Murata, C., & van Zanden, J. L. (2011). Wages, prices, and livingstandards in China, 1738–1925: In comparison with Europe, Japan, and India. Economic History Review,64(s1), 8–39.
Ando, Y. (2000). Kansei Kaikakuki no Toshi Seisaku [Urban Policies in the Kansei Reform Period]. Tokyo:Azekura Shobo.
Aoki, M. (2014). Strategies and public propositions in games of institutional change: Theory and comparativehistorical cases, available at SSRN: http://ssrn.com/abstract=2445628. Accessed 05 Sept 2014.
Ashraf, Q., & Galor, O. (2013). The ‘Out of Africa’ hypothesis, human genetic diversity, and comparativeeconomic development. American Economic Review, 103(1), 1–46.
Balazs, E. (1964). Chinese civilization and bureaucracy: Variations on a theme. New Haven: Yale UniversityPress.
Baten, J., Ma, D., Morgan, S., & Wang, Q. (2010). Evolution of living standards and human capital in Chinain the 18–20th centuries: Evidences from real wages, age-heaping, and anthropometrics. Explorations inEconomic History, 47(3), 347–359.
Beasley, W. G. (1972). The Meiji restoration. Stanford: Stanford University Press.Besley, T., & Persson, T. (2009). The origins of state capacity: Property rights, taxation, and politics. American
Economic Review, 99(4), 1218–44.Besley, T., & Persson, T. (2013). Taxation and development. In A. J. Auerbach, R. Chetty, M. Feldstein, E.
Saez (Eds.), Handbook of public economics (Vol. 5, pp. 51–110). Amsterdam: Elsevier.Brandt, L., Ma, D., & Rawski, T. (2014). From divergence to convergence: Re-evaluating the history behind
China’s economic boom. Journal of Economic Literature, 52(1), 45–123.Broadberry, S. (2013). Accounting for the great divergence, LSE Economic History Working Papers, 184/2013.Campante, F. R., & Do, Q. A. (2014). Isolated capital cities, accountability, and corruption: Evidence from
US states. American Economic Review, 104(8), 2456–81.Cao, S. J. (2000). Zhongguo Ren Kou Shi [The Demographic History of China]. Shanghai: Fudan Press.Ch’u, T. T. (1962). Local government in China under the Ch’ing. Cambridge, MA: Harvard University Press.
123
J Econ Growth (2014) 19:439–470 467
Deng, K. (2008). Miracle or mirage? Foreign silver, China’s economy and globalization from the sixteenth tothe nineteenth centuries. Pacific Economic Review, 13(3), 320–357.
Dincecco, M. (2011). Political transformations and public finances: Europe, 1650–1913. Cambridge, MA:Cambridge University Press.
Dincecco, M., & Katz, G. (2014). State capacity and long-run economic performance. Economic Journal(forthcoming).
Dincecco, M., & Prado, M. (2012). Warfare, fiscal capacity, and performance. Journal of Economic Growth,17(3), 171–203.
Dincecco, M., Federico, G., & Vindigni, A. (2011). Warfare, taxation, and political change: Evidence fromthe Italian Risorgimento. Journal of Economic History, 71(4), 887–914.
Doepke, M. (2004). Accounting for fertility decline during the transition to growth. Journal of EconomicGrowth, 9(3), 347–383.
Doepke, M., & Zilibotti, F. (2005). The macroeconomics of child labor regulation. American Economic Review,95(5), 1492–1524.
DQHD. (2006). Da Qing wuchao huidian [Collected Statutes of the Qing Dynasty through Five Reigns].Beijing: Thread-binding Books Publishing House.
Elliott, M. (2009). Emperor Qianlong: Son of heaven, man of the world. New York: Pearson Longman.Elvin, M. (2004). The retreat of the elephants: An environmental history of China. New Haven, CT: Yale
University Press.Elvin, M., & Liu, T. J. (1998). Sediments of time: Environment and society in Chinese history. Cambridge,
MA: Cambridge University Press.Eto, J. (Ed.). (1970). Katsu Kaishu Zenshu [Complete Works of Kaishu Katsu] (Vol. 3). Tokyo: Keiso Shobo.Fang, Q. (2009). Hot potatoes: Chinese complaint systems from early times to the late Qing (1898). Journal
of Asian Studies, 68(4), 1105–1135.Fei, S. (2007). We must be taxed: A case of populist urban fiscal reform in Ming Nanjing (1368–1644). Late
Imperial China, 28(2), 1–40.Fei, S. (2009). Negotiating urban space: Urbanization and late Ming Nanjing. Cambridge, MA: Harvard
University Asia Center.Feuerwerker, A. (1976). State and society in eighteenth-century China: the Ch’ing Empire in its glory. Ann
Arbor, MI: Center for Chinese Studies, University of Michigan.Furushima, T. (1963). Shohin ryutsu no hatten to ryoshu keizai [The lord’s economy and the development
of commerce]. In S. Ienaga (Ed.), Iwanami Koza Nihon Rekishi [Iwanami Lectures on Japanese History](Vol. 12). Tokyo: Iwanami Shoten.
Galor, O. (2005). From stagnation to growth: Unified growth theory. In P. Aghion & S. Durlauf (Eds.),Handbook of economic growth (pp. 171–293). Amsterdam: Elsevier.
Galor, O. (2011). Unified growth theory. Princeton, NJ: Princeton University Press.Galor, O., & Moav, O. (2006). Das Human-Kapital: A theory of the demise of the class structure. Review of
Economic Studies, 73(1), 85–117.Galor, O., Moav, O., & Vollrath, D. (2009). Inequality in landownership, the emergence of human-capital
promoting institutions, and the great divergence. Review of Economic Studies, 76(1), 143–179.Gennaioli, N., & Voth, H.J. (2011). State capacity and military conflict, CEPR Discussion Paper No. DP8699.Giroud, X. (2013). Proximity and investment: Evidence from plant-level data. Quarterly Journal of Economics,
128(2), 861–915.Greif, A. (1998). Historical and comparative institutional analysis. American Economic Review, 88(2), 80–84.Grossman, S., & Hart, O. (1986). The costs and benefits of ownership: A theory of vertical and lateral
integration. Journal of Political Economy, 94(4), 691–719.Hanley, S. B. (1987). Urban sanitation in preindustrial Japan. Journal of Interdisciplinary History, 18(1), 1–26.Hansen, G., & Prescott, E. (2002). Malthus and Solow. American Economic Review, 92(4), 1205–1217.Hayami, A., & Miyamoto, M. (1988). Nihon Keizaishi: Keizai Shaki no Seiritsu, 17–18 Seiki [Emergence of
Economic Society, 17 and 18th Centuries]. Tokyo: Iwanami Shoten.He, W. (2013). Paths toward the modern fiscal state: England, Japan, and China. Cambridge, MA: Harvard
University Press.Heijdra, M. (1998). The socio-economic development of rural China under the Ming. In D. Twitchett & F.
W. Mote (Eds.), The Cambridge history of China. Vol. 8: The Ming dynasty, 1368–1644 (pp. 417–578).Cambridge, MA: Cambridge University Press.
Ho, P. T. (1959). Studies on the population of China, 1368–1953. Cambridge, MA: Harvard University Press.Hoffman, P. T., & Rosenthal, J. L. (1997). The political economy of warfare and taxation in early modern
Europe: Historical lessons for economic development. In J. Drobak & J. Nye (Eds.), The frontiers of thenew institutional economics (pp. 31–55). St. Louis, MO: Academic Press.
123
468 J Econ Growth (2014) 19:439–470
Hosaka, S. (2006). Hyakusho Ikki to Gimin no Kenkyu [Research on Peasant Riots and Martyrs]. Tokyo:Yoshikawa Kobunkan.
Hosokawa Hanseishi Kenkyuukai (1974). Kumamoto-han Nenpyo Ko [A Draft Chronology of Kumamotodomain]. Kumamoto.
Huang, P. C. C. (2003). Further thoughts on eighteenth-century Britain and China: Rejoinder to Pomeranz’sresponse to my critique. Journal of Asian Studies, 62(1), 157–187.
Huang, R. (1974). Taxation and governmental finance in sixteenth-century Ming China. London: CambridgeUniversity Press.
Iijima, C. (2004). Edo Bakufu Zaisei no Kenkyu [Research on Edo Bakufu Finance]. Tokyo: YoshikawaKobunkan.
Iwahashi, M. (1981). Kinsei Nihon Bukkashi no Kenkyu: Kinsei Beika no Kozo to Hendo [Studies on CommodityPrices in Early Modern Japan: The Structure and Transformation of Early Modern Rice Prices]. Tokyo:Ohara Shinseisha.
Jansen, M. (Ed.). (1989). The Cambridge history of Japan, volume 5: The nineteenth century. Cambridge:Cambridge University Press.
Jansen, M. (1992). China in the Tokugawa World. Cambridge, MA: Harvard University Press.Johnson, N. D., & Koyama, M. (2014a). Tax farming and the origins of state capacity in England and France.
Explorations in Economic History, 51, 1–20.Johnson, N. D., & Koyama, M. (2014b). Taxes, lawyers, and the decline of witch trials in France. Journal of
Law & Economics, 57(1), 77–112.Jones, E. (1981). The European miracle: Environments, economies, and geopolitics in the history of Europe
and Asia. Cambridge, MA: Cambridge University Press.Kaempfer, E., & Beatrice, M. B. B. (1999). Kaempfer’s Japan: Tokugawa culture observed. Honolulu: Uni-
versity of Hawaii Press.Kikuchi, I. (1997). Kinsei no Kikin [Famines in Premodern Japan]. Tokyo: Yoshikawa Kobunkan.Kiser, E., & Tong, X. (1992). Determinants of the amount and type of corruption in state fiscal bureaucracies:
An analysis of late imperial China. Comparative Political Studies, 25(3), 300–331.Ko, C. Y., & Sng, T. H. (2013). Regional dependence and political centralization in imperial China. Eurasian
Geography and Economics, 54(5–6), 470–483.Ko, C.Y., Koyama, M., & Sng, T.H. (2014). Unified China and divided Europe, available at SSRN: http://ssrn.
com/abstract=2382346. Accessed 05 Sept 2014.Landes, D. S. (1998). The wealth and poverty of nations: Why some are so rich and some so poor. New York:
W.W. Norton.Levi, M. (1988). Of rule and revenue. Berkeley, CA: University of California Press.Li, B. (2000). Jiangnan de Zaoqi Gongyehua (1550–1850) [Jiangnan’s Early Industrialization, 1550–1820].
Beijing: Social Sciences Documentation Press.Li, L. M. (2007). Fighting famine in North China: State, market, and environmental decline, 1690s–1990s.
Stanford, CA: Stanford University Press.Li, W. Z., & Jiang, T. X. (2008). Qingdai Caoyun [The Grain Tribute System of Qing Dynasty]. Beijing: Social
Sciences Academic Press.Lin, A. (1997). The rural economy of Guangdong, 1870–1937: A study of the Agrarian crisis and its origins
in Southernmost China. New York: St. Martin’s Press.Lin, M. H. (2006). China upside down: Currency, society, and ideologies, 1808–1856. Cambridge, MA:
Harvard University Asia Center.Ma, D. (2004). Why Japan, not China, was the first to develop in East Asia: Lessons from sericulture, 1850–
1937. Economic Development and Cultural Change, 52(2), 369–394.Ma, D. (2011). Rock, scissors, paper: The problem of incentives and information in traditional Chinese state
and the origin of great divergence, LSE Economic History Working Paper, 152/11.Maddison, A. (2001). The world economy: A millennial perspective. Paris: OECD.Marks, R. (2012). China: Its environment and history. Lanham, MD: Rowman & Littlefield Publishers.Matsuo, H. (1995). Kanseiki kinai bakuryo ni okeru zoshuuwai to sono shobatsu [Bribery and its punishment
in the shogunate during the Kansei period]. In N. Asao (Ed.), Nihon Kokka no Shiteki Tokushitsu [HistoricalCharacteristics of the Japanese State]. Tokyo: Shibunkaku Shuppan.
McCaffrey, C. M. (2003). Living through rebellion: A local history of the White Lotus Uprising in Hubei,China. Dissertation, University of California, San Diego.
McClain, J. L. (1980). Castle towns and daimyo authority: Kanazawa in the years 1583–1630. Journal ofJapanese Studies, 6(2), 267–299.
Mencius, (2004). Mencius. London: Penguin Books. translated by D. C. Lau.Miyamoto, M. (2004). Prices and macroeconomics dynamics. In A. Hayami, O. Saito, & R. Toby (Eds.),
Emergence of economic society in Japan, 1600–1870 (pp. 119–158). Oxford: Oxford University Press.
123

J Econ Growth (2014) 19:439–470 469
Mosk, C. (2011). Traps embraced or escaped: Elites in the economic development of modern Japan and China.Singapore: World Scientific.
Mote, F. W. (1973). A millennium of Chinese urban history: Form, time, and space concepts in Soochow. RiceUniversity Studies, 59(4), 35–65.
Nakabayashi, M. (2012). Rise of the Japanese fiscal state. In B. Yun-Casalilla, P. O’Brien, & F. Comin Comin(Eds.), The rise of fiscal states: A global history, 1500–1914 (pp. 378–409). Cambridge, MA: CambridgeUniversity Press.
Nakai, N., & McClain, J. L. (1998). Commercial change and urban growth in early modern Japan. In M.Smitka (Ed.), The Japanese economy in the Tokugawa Era (pp. 131–207). New York: Garland Pub.
Nakane, C., & Oishi, S. (1990). Tokugawa Japan: The social and economic antecedents of modern Japan.Tokyo: University of Tokyo Press.
Naquin, S., & Rawski, E. (1987). Chinese society in the eighteenth century. New Haven, CT: Yale UniversityPress.
Ni, S., & Van, P. H. (2006). High corruption income in Ming and Qing China. Journal of DevelopmentEconomics, 81(2), 316–336.
Nishikawa, S. (1985). Nihon Keizai no Seichoshi [History of the Growth of the Japanese Economy]. Tokyo:Toyo Keizai.
Nishizawa, A. (1998). Bakuryo Jinya to Daikan Shihai [Magistrates’ Offices and Controls]. Tokyo: IwataShoin.
Nishizawa, A. (2004). Daikan no Nichijo Seikatsu [Everyday Life of Magistrates]. Tokyo: Kodansha.O’Brien, P. (2005). Fiscal and financial preconditions for the rise of British naval hegemony: 1485–1815, LSE
Economic History Working Paper, 91/05.Ocko, J. (1988). I’ll take it all the way to Beijing: Capital appeals in the Qing. Journal of Asian Studies, 47(2),
291–315.Ohira, Y. (2003). Meyasubako no Kenkyu [A Study of the Petition Box]. Tokyo: Sobunsha.Ohno, M. (1996). Edo Bakufu Zaiseishi Ron [Financial History of Edo Shogunate]. Tokyo: Yosikawa
Kobunkan.Ohno, M. (2008). Edo Bakufu Zaisei Shiryo Shusei [Collections of Historical Documents on the Tokugawa
Shogunate Finance] (Vol. 1). Tokyo: Yoshikawa Kobunkan.Olson, M. (1993). Dictatorship, democracy, and development. American Political Science Review, 87(3),
567–576.Olsson, O., & Hansson, G. (2011). Country size and the rule of law: Resuscitating Montesquieu. European
Economic Review, 55(5), 613–629.Park, N. (1997). Corruption in eighteenth-century China. Journal of Asian Studies, 56(4), 967–1005.Perdue, P. C. (1987). Exhausting the earth: State and peasant in Hunan, 1500–1850. Cambridge, MA: Harvard
University Press.Perkins, D. H. (1969). Agricultural development in China, 1368–1968. Chicago: Aldine.Pomeranz, K. (2000). The great divergence: China, Europe, and the making of the modern world economy.
Princeton, NJ: Princeton University Press.QSG. (1976[1927]). Qing Shi Gao [Draft History of the Qing]. Beijing: Zhonghua Shuju. compiled by Zhao
Erxun [1844–1927].QSL. (1986). Qing Shilu [Veritable Records of the Qing dynasty]. Beijing: Zhonghua Shuju.Reischauer, E. (1970). Japan: The story of a nation. London: Duckworth.Roberts, L. (1994). The petition box in eighteenth-century Tosa. Journal of Japanese Studies, 20(2), 423–458.Rosenthal, J. L., & Wong, R. B. (2011). Before and beyond divergence: The politics of economic change in
China and Europe. Cambridge, MA: Harvard University Press.Rowe, W. (1989). Hankow: Conflict and community in a Chinese city, 1796–1895. Stanford, CA: Stanford
University Press.Rowe, W. (2009). China’s last empire: The great Qing. Cambridge, MA: Harvard University Press.Rozman, G. (1973). Urban networks in Ch’ing China and Tokugawa Japan. Princeton, NJ: Princeton University
Press.Saito, O. (2009). Forest history and the great divergence: China, Japan, and the west compared. Journal of
Global History, 4(3), 379–404.Sakane, Y. (2011a). Ie to Mura: Nihon Dento Shakai to Keizai Hatten [House and Village: Traditional Japanese
Society and Economic Development]. Tokyo: Nobunkyo.Sakane, Y. (2011b). Kindai nihon ni okeru chozei seido no tokushitsu [The characteristics of the tax collection
system in early modern Japan]. In M. Katsube (Ed.), Kindai Higashi Ajia ni okeru Gairai to Zairai [TheForeign and the Native in Premodern East Asia] (pp. 385–472). Osaka: Seibundo Shuppan.
Schran, P. (1978). A reassessment of inland communications in late Ch’ing China. Late Imperial China, 3(10),28–48.
123

470 J Econ Growth (2014) 19:439–470
Shi, Z. (2007). Dingyin zhi zheng yu tandingrudi [The collection of the head tax and the apportionment of thehead tax quota into the land tax]. Qingshi luncong [Symposium on Qing history] (pp. 148–160). Beijing:CASS.
Shiue, C. H., & Keller, W. (2007). Markets in China and Europe on the eve of the industrial revolution.American Economic Review, 97(4), 1189–1216.
Sng, T.H. (2014). Size and dynastic decline: The principal-agent problem in late imperial China. Explorationsin Economic History (forthcoming).
Stasavage, D. (2011). States of credit: Size, power, and the development of European polities. Princeton, NJ:Princeton University Press.
Tilly, C. (1975). Reflections on the history of European state-making. In C. Tilly (Ed.), The formation ofnational states in Western Europe (pp. 3–83). Princeton, NJ: Princeton University Press.
Totman, C. (1967). Politics in the Tokugawa Bakufu, 1600–1843. Cambridge, MA: Harvard University Press.Totman, C. (1989). The green archipelago: Forestry in preindustrial Japan. Berkeley, CA: University of
California Press.Totman, C. (1993). Early modern Japan. Berkeley, CA: University of California Press.Tsuchiya, T., & Yamaguchi, K. (1972). Zuroku Nihon No Kahei [Japanese Currency Illustrated]. Tokyo: Toyo
Keizai Shinposha.Usher, D. (1989). The dynastic cycle and the stationary state. American Economic Review, 79(5), 1031–1044.Vaporis, C. (1994). Breaking barriers: Travel and the state in early modern Japan. Cambridge, MA: Council
on East Asian Studies, Harvard University.Walthall, A. (1991). Peasant uprisings in Japan: A critical anthology of peasant histories. Chicago: University
of Chicago Press.Wang, Q. (1985[1890]). Shiqu Yu Ji [Collection of Notes on Fiscal Matters of the Qing Dynasty]. Beijing:
Beijing Ancient Books Publishing House.Wang, Y. C. (1973). Land taxation in imperial China, 1750–1911. Cambridge, MA: Harvard University Press.Wang, Y. C. (1992). Secular trends of rice prices in the Yangzi Delta, 1638–1935. In T. G. Rawski & L. M. Li
(Eds.), Chinese history in economic perspective (pp. 35–68). Berkeley, CA: University of California Press.Watt, J. (1977). The yamen and urban administration. In G. W. Skinner (Ed.), The city in late imperial China
(pp. 353–390). Stanford, CA: Stanford University Press.Will, P. E. (2008). Views of the realm in crisis: Testimonies on imperial audiences in the nineteenth century.
Late imperial China, 29.1S, 125–159.Will, P. E., & Wong, R. B. (1991). Nourish the people: The state civilian granary system in China, 1650–1850.
Ann Arbor, MI: Center for Chinese Studies, University of Michigan.Wittfogel, K. A. (1957). Oriental despotism: A comparative study of total power. New Haven, CT: Yale
University Press.Xie, J. (2002). Xinxi chuandi yu xinhai geming [Information transmission and the revolution of 1911]. Journal
of East China Normal University (Philosophy and Social Sciences) 4.Yamamoto, H. (1993). Technological innovation and the development of transportation in Japan. Tokyo:
United Nations University Press.Yanagitani, K. (1985). Edo bakufu shirozumemai-sei no seiritsu [The establishment of Edo bakufu’s strategic
rice provisions]. Nihon Rekishi, 444, 38–57.Yanagitani, K. (1989). Edo bakufu shirozumemai-sei no kino [The role of Edo bakuf’su strategic rice provi-
sions]. Shigaku Zasshi, 69, 15–37.Yoshida, N. (1991). Kinsei Kyodai Toshi no Shakai Kozo [The Social Structure of Metropolises in Premodern
Japan]. Tokyo: Tokyo Daigaku Shuppan.Zelin, M. (1984). The magistrate’s tael: Rationalizing fiscal reform in eighteenth-century Ch’ing China.
Berkeley: University of California Press.Zelin, M. (2004). Economic freedom in late imperial China. In W. C. Kirby (Ed.), Realms of freedom in modern
China (pp. 57–83). S, CAtanford: Stanford University Press.Zhang, J. (2006). Water calamities and dike management in the Jianghan Plain in the Qing and the Republic.
Late imperial China, 27(1), 66–108.Zhang, Z. (1955). The Chinese gentry: Studies on their role in nineteenth-century Chinese society. Seattle,
WA: University of Washington Press.Zhang, Z. (1962). The income of the Chinese gentry. Seattle, WA: University of Washington Press.
123