Embed Size (px)
Citation preview
Asian Economies
Sisira JayasuriyaDepartment of Economics
skj/asianeconomies/1 2
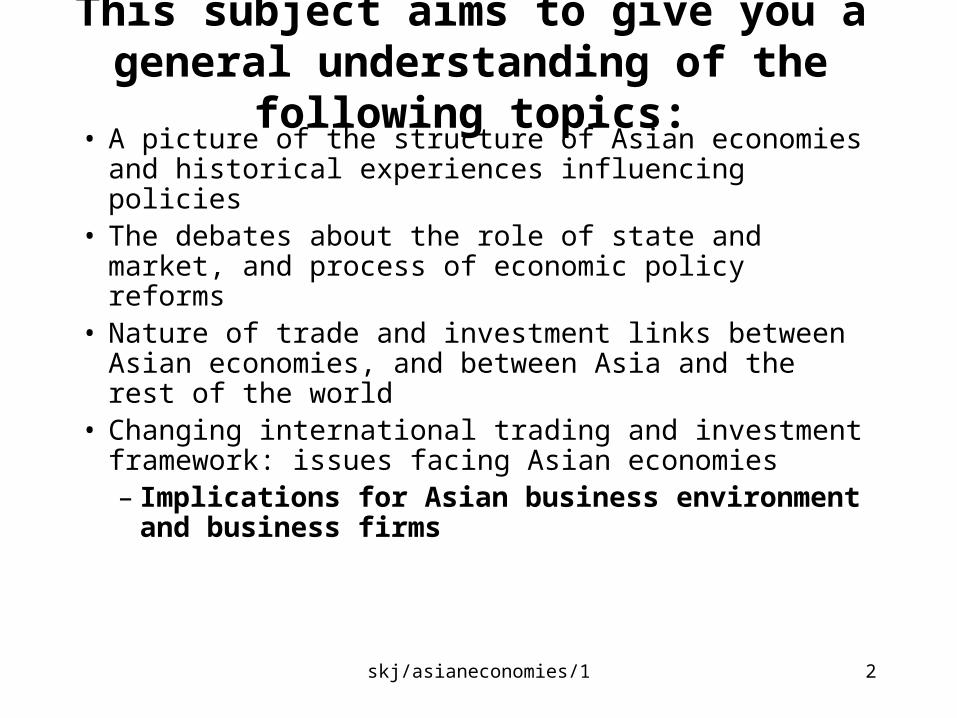
This subject aims to give you a general understanding of the following topics:
• A picture of the structure of Asian economies and historical experiences influencing policies
• The debates about the role of state and market, and process of economic policy reforms
• Nature of trade and investment links between Asian economies, and between Asia and the rest of the world
• Changing international trading and investment framework: issues facing Asian economies– Implications for Asian business environment
and business firms
skj/asianeconomies/1 3
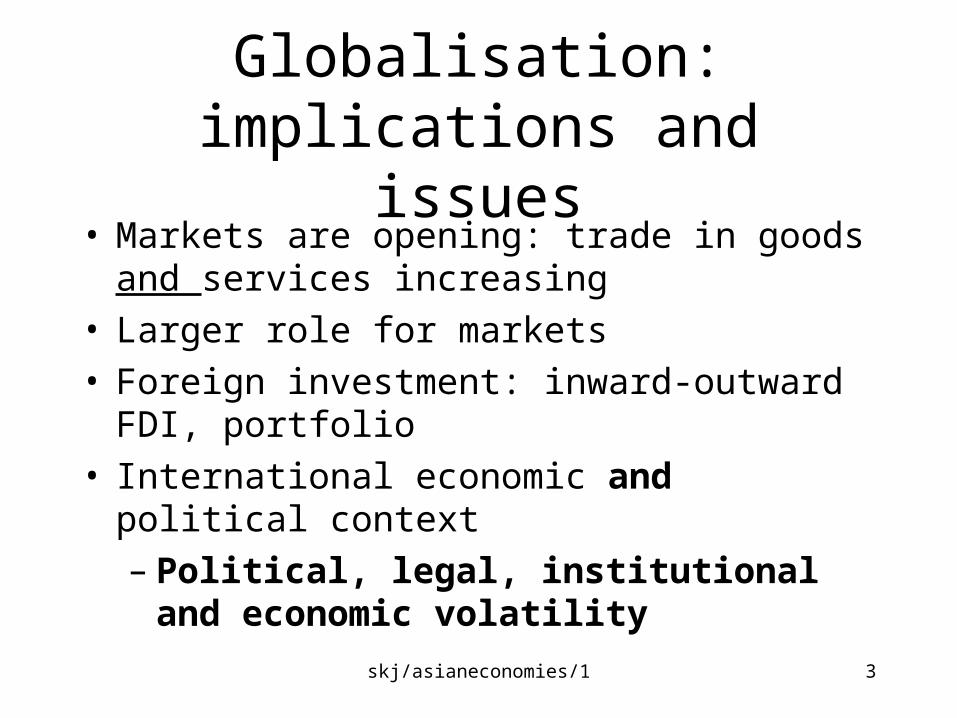
Globalisation: implications and issues
• Markets are opening: trade in goods and services increasing
• Larger role for markets• Foreign investment: inward-outward FDI,
portfolio• International economic and political context
– Political, legal, institutional and economic volatility
skj/asianeconomies/1 4
Asian economies
• Regional identity and diversity: economic, political, historical, cultural
skj/asianeconomies/1 5
Diversity
• Some of the largest countries and some very small countries
• Some of the richest and some of the poorest• Some natural resource-rich, some natural
resource-poor• In some population predominantly urban, in
manufacturing/services, some, still predominantly rural, in agriculture
skj/asianeconomies/1 6
Historical background: links, similarities and differences
– historical links in Asia go back many centuries• Chinese and Indian cultural influences and links• Trade links
– direct western colonial rule: South Asia, Southeast Asia (except Thailand)
• British, Dutch, French, Portuguese, Spanish-American
– western domination : China, Thailand– Japanese colonialism
skj/asianeconomies/1 7
Independence and post-independence
• nationalist movements: relatively peaceful vs revolutionary/violent
• communist movements in independence struggles
• regional conflicts
• political ideology and circumstances, and economic policy
skj/asianeconomies/1 8
Convergence in economic policies: all countries are increasingly adopting similar
policies
• Since late 1970s, process of economic policy liberalization – market oriented policies
• Late 1980s-early 1990s, pace of liberalization accelerated
• 1997 crisis and aftermath• But history, culture, structure, politics
matter
skj/asianeconomies/1 9
Asian economic integration?
• geographical proximity• some (limited) sense of common cultural
heritage (rice eaters???)• economic links have been growing:
– regional integration arrangements – ‘natural’ economic complementarities
• “Asian” economic crisis and ‘contagion’, “yen” zone…….
skj/asianeconomies/1 10
Regional Integration Agreements (RIAs)
• ASEAN
• CER
• SAARC
• APEC
skj/asianeconomies/1 11
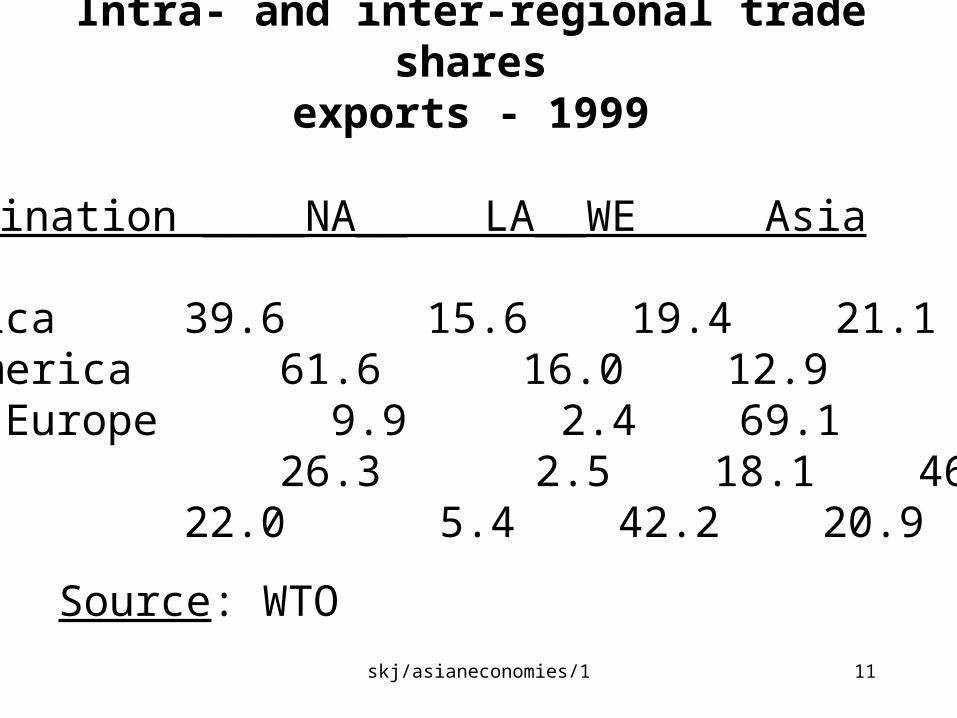
Intra- and inter-regional trade sharesexports - 1999
Destination ____NA__ LA__WE AsiaOrigin N. America 39.6 15.6 19.4 21.1Latin America 61.6 16.0 12.9 6.0Western Europe 9.9 2.4 69.1 7.5Asia 26.3 2.5 18.1 46.6World 22.0 5.4 42.2 20.9
Source: WTO
skj/asianeconomies/1 12
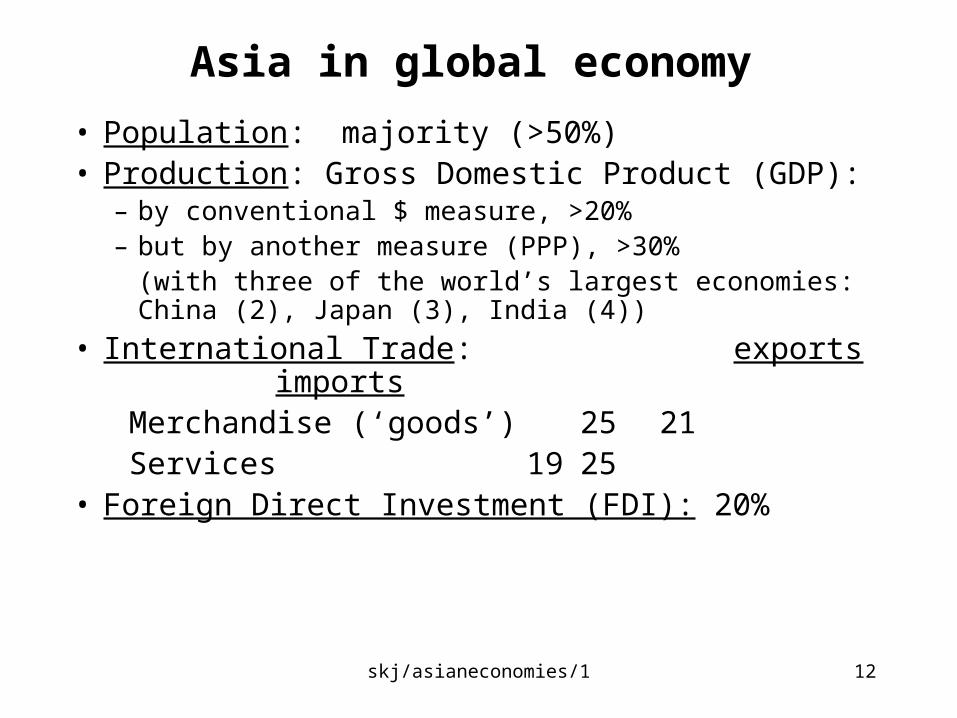
Asia in global economy
• Population: majority (>50%)• Production: Gross Domestic Product (GDP):
– by conventional $ measure, >20%– but by another measure (PPP), >30%
(with three of the world’s largest economies: China (2), Japan (3), India (4))
• International Trade: exports imports
Merchandise (‘goods’) 25 21 Services 19 25• Foreign Direct Investment (FDI): 20%

skj/asianeconomies/1 13
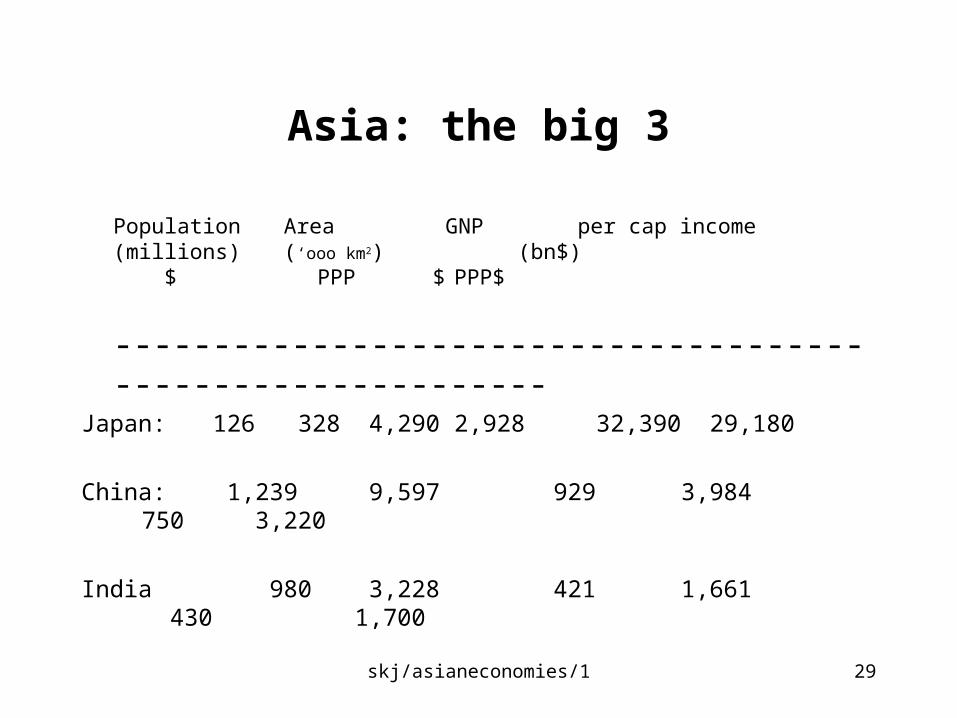
Asia: the big 3
Population Area GNP per cap income(millions) (‘ooo km2) (bn$)
$ PPP $PPP$
------------------------------------------------------------Japan: 126 328 4,290 2,928 32,390 29,180
China: 1,239 9,597 929 3,984 750 3,220
India 980 3,228 421 1,661 430 1,700
skj/asianeconomies/1 14
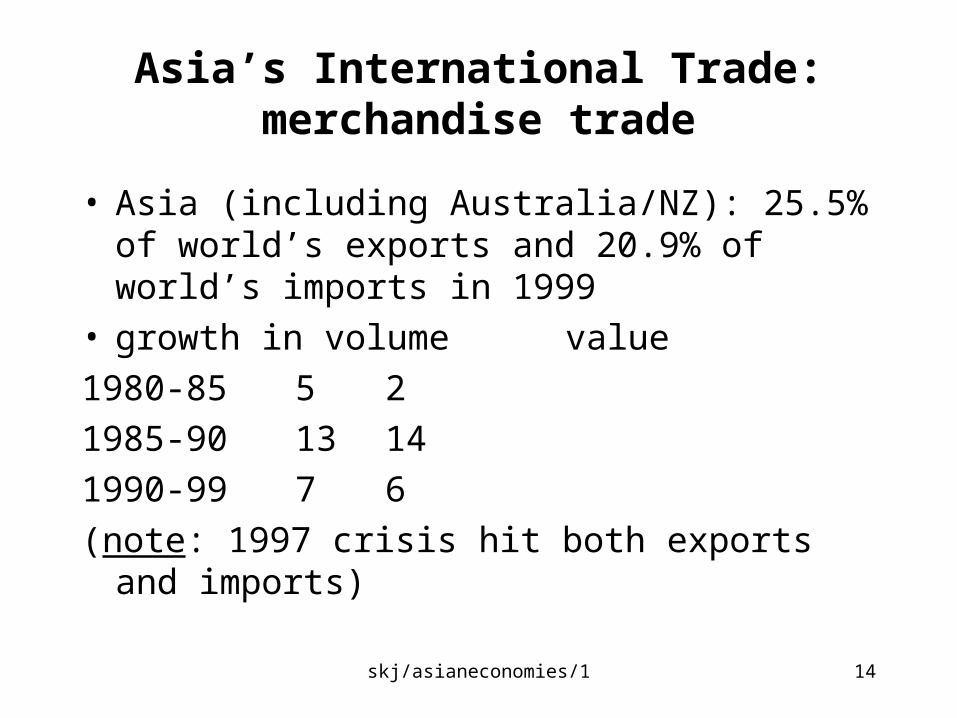
Asia’s International Trade: merchandise trade
• Asia (including Australia/NZ): 25.5% of world’s exports and 20.9% of world’s imports in 1999
• growth in volume value
1980-85 5 2
1985-90 13 14
1990-99 7 6
(note: 1997 crisis hit both exports and imports)
skj/asianeconomies/1 15
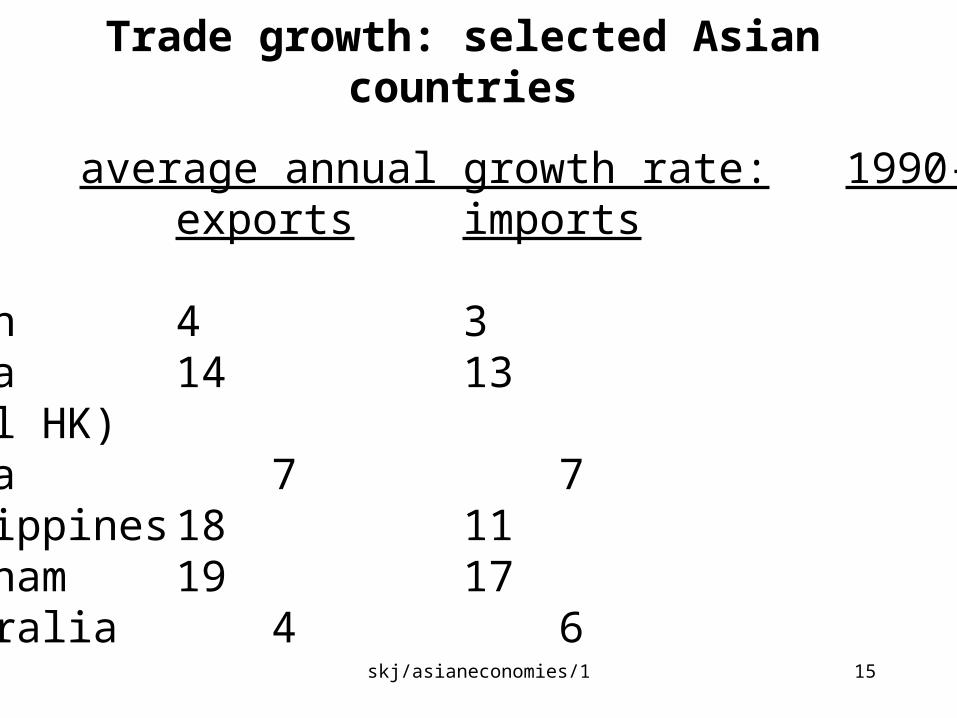
Trade growth: selected Asian countries
average annual growth rate:1990-99exports imports
Japan 4 3China 14 13(excl HK)India 7 7Philippines 18 11Vietnam 19 17Australia 4 6
skj/asianeconomies/1 16
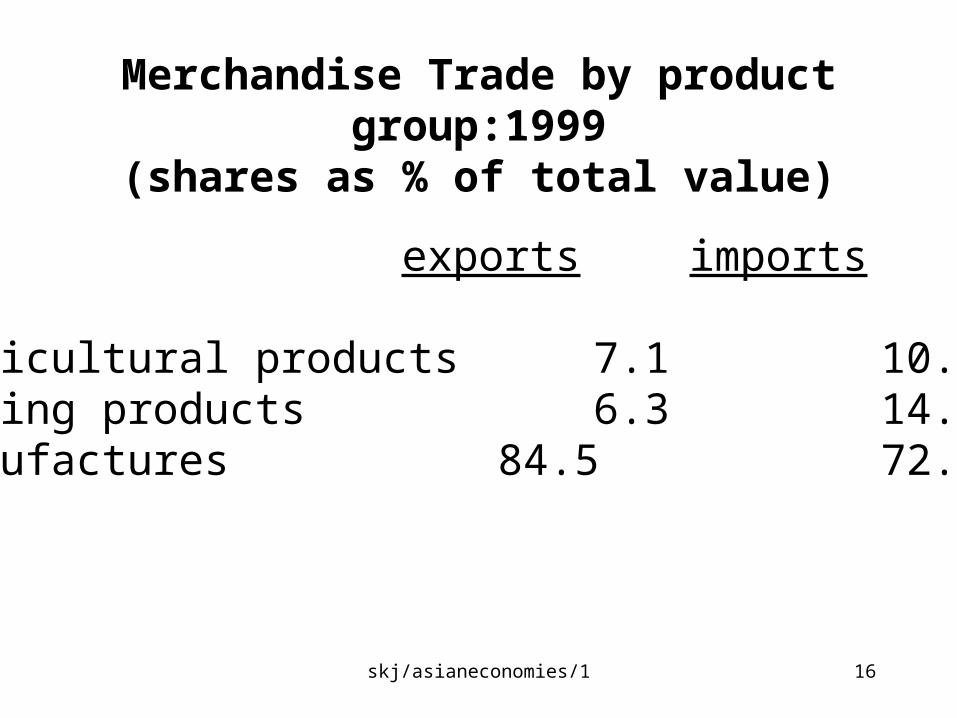
Merchandise Trade by product group:1999(shares as % of total value)
exports imports
Agricultural products 7.1 10.6Mining products 6.3 14.5Manufactures 84.5 72.5
skj/asianeconomies/1 17
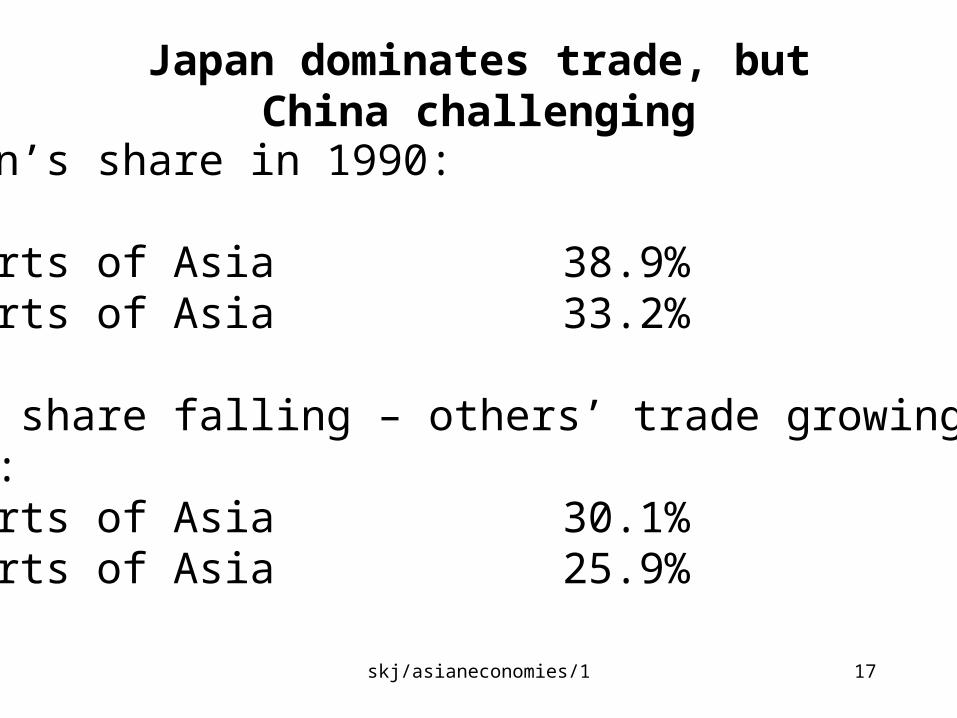
Japan dominates trade, but China challenging
Japan’s share in 1990:
Exports of Asia 38.9%Imports of Asia 33.2%
But, share falling – others’ trade growing faster1999:Exports of Asia 30.1%Imports of Asia 25.9%
skj/asianeconomies/1 18
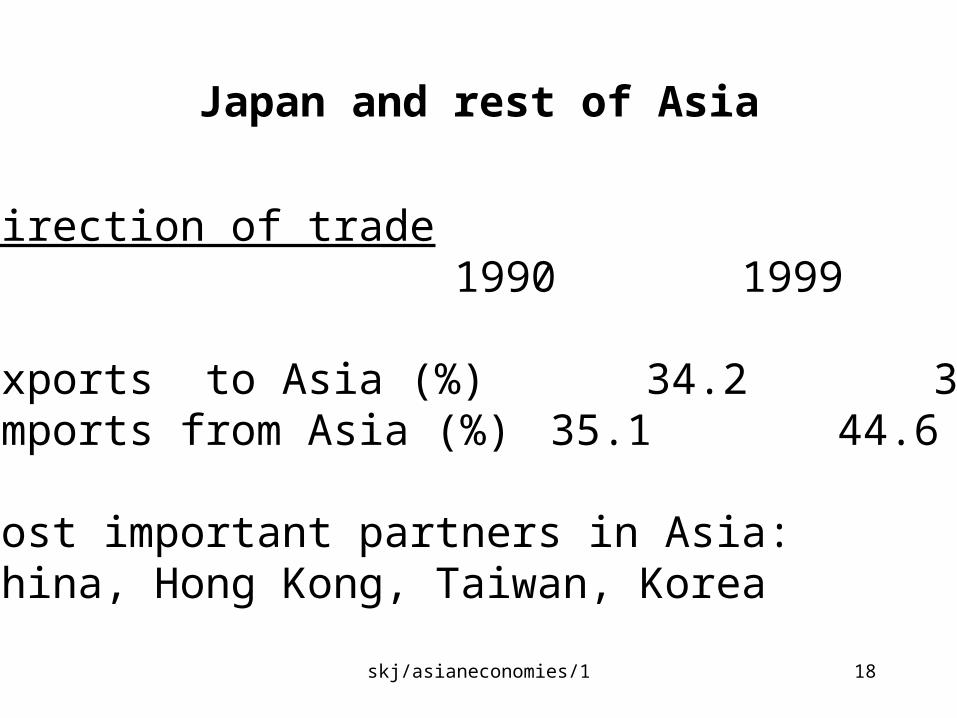
Japan and rest of Asia
Direction of trade 1990 1999
exports to Asia (%) 34.2 39.7imports from Asia (%) 35.1 44.6
most important partners in Asia: China, Hong Kong, Taiwan, Korea
skj/asianeconomies/1 19
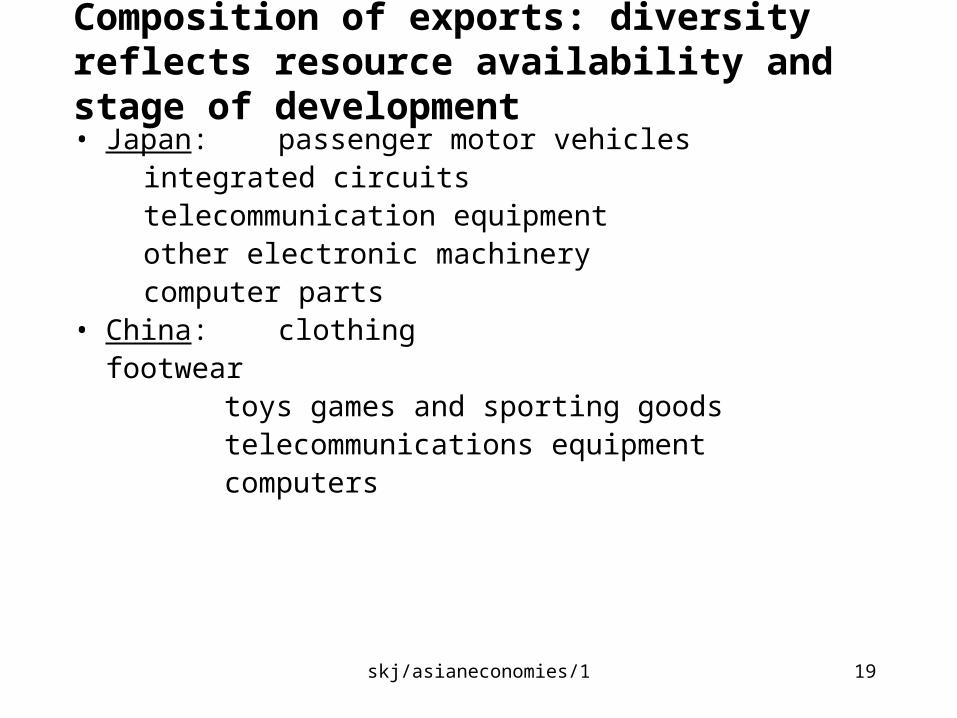
Composition of exports: diversity reflects resource availability and stage of development
• Japan: passenger motor vehiclesintegrated circuitstelecommunication equipmentother electronic machinerycomputer parts
• China: clothingfootwear
toys games and sporting goodstelecommunications equipmentcomputers
skj/asianeconomies/1 20
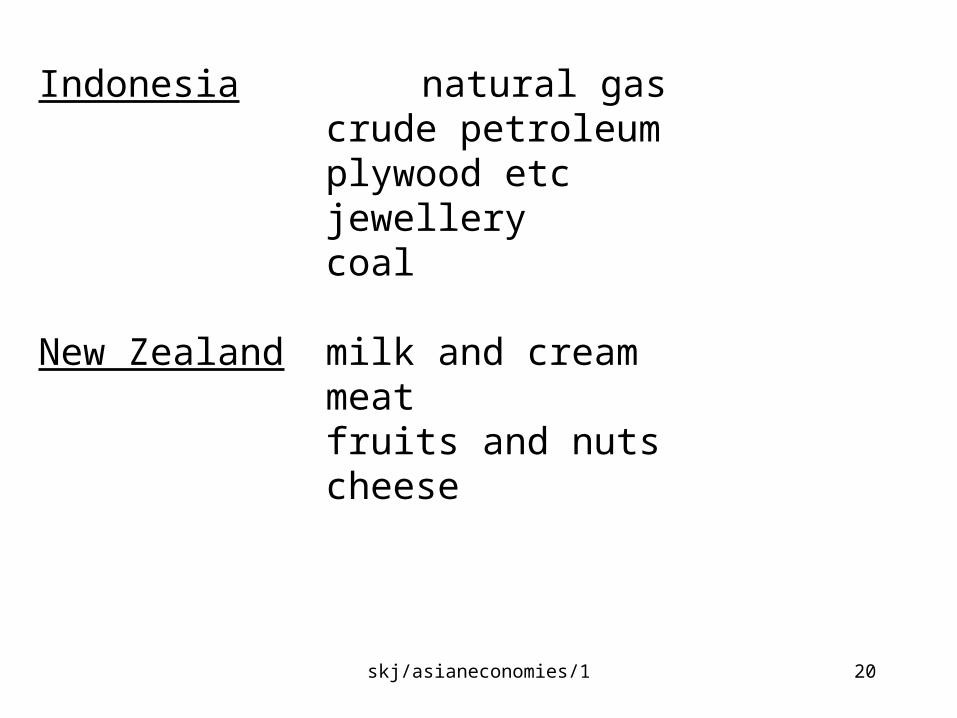
Indonesia natural gascrude petroleumplywood etcjewellerycoal
New Zealand milk and creammeatfruits and nutscheese
skj/asianeconomies/1 21
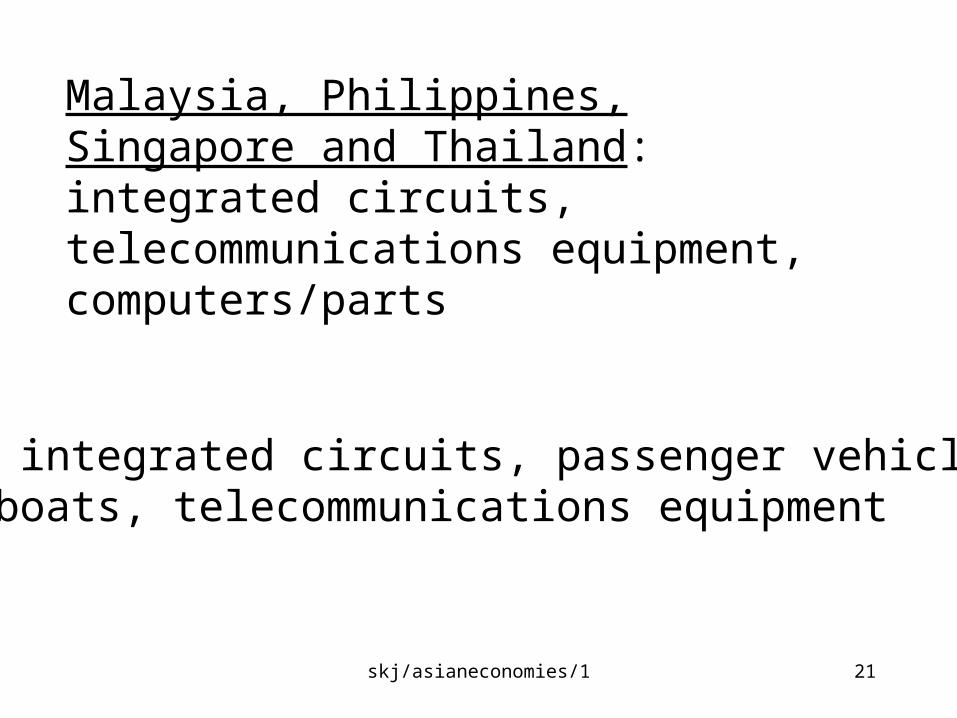
Malaysia, Philippines, Singapore and Thailand: integrated circuits, telecommunications equipment, computers/parts
Korea: integrated circuits, passenger vehicles,ships/boats, telecommunications equipment
skj/asianeconomies/1 22
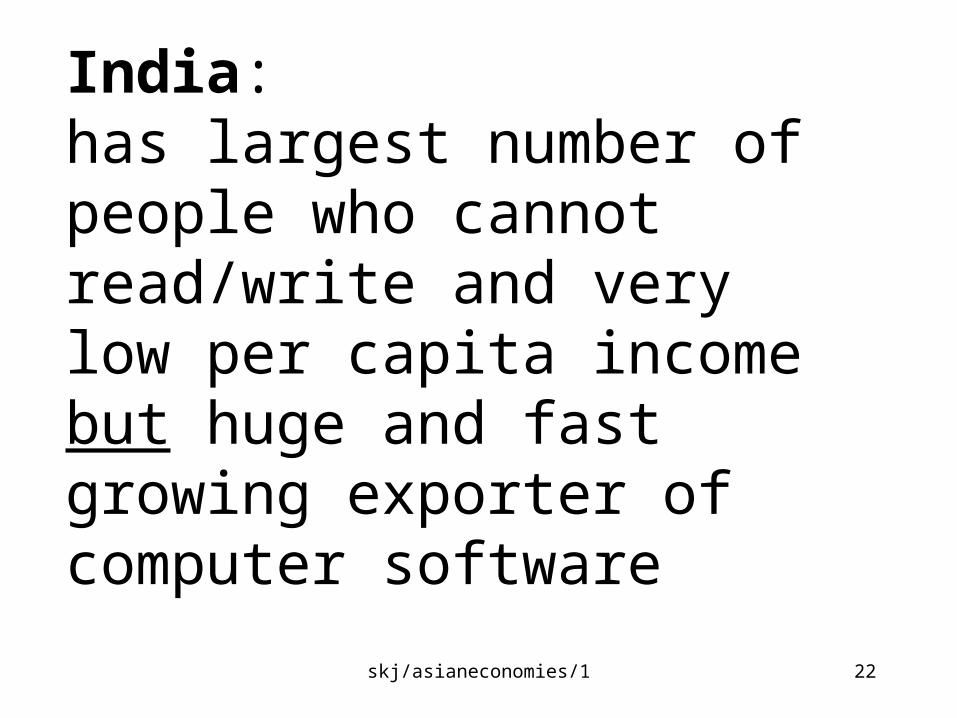
India: has largest number of people who cannot read/write and very low per capita income but huge and fast growing exporter of computer software
skj/asianeconomies/1 23
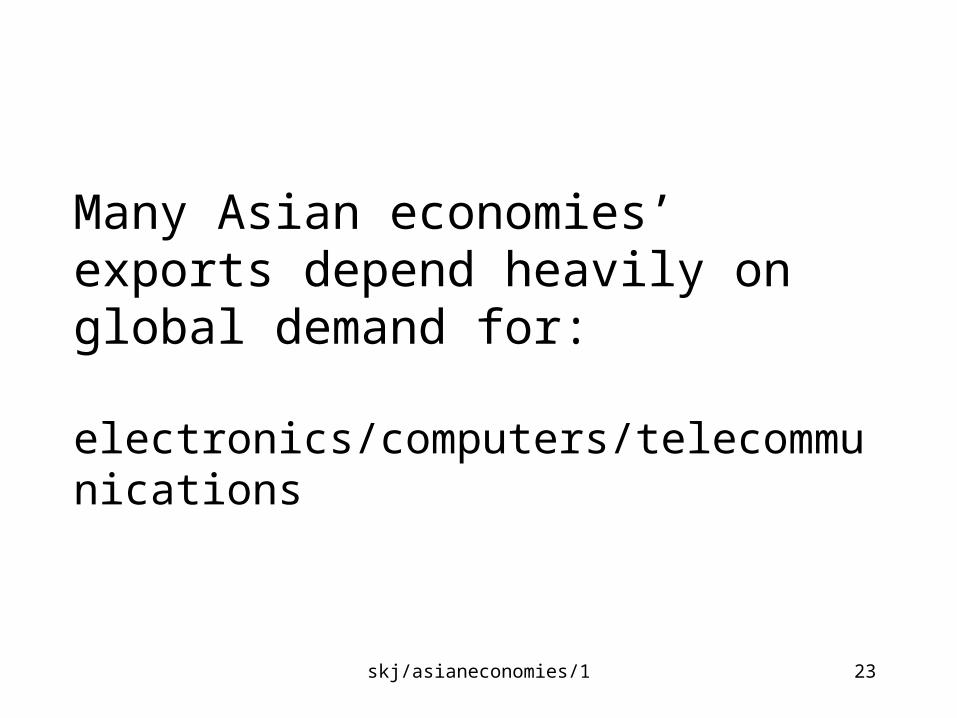
Many Asian economies’ exports depend heavily on global demand for:
electronics/computers/telecommunications
skj/asianeconomies/1 24
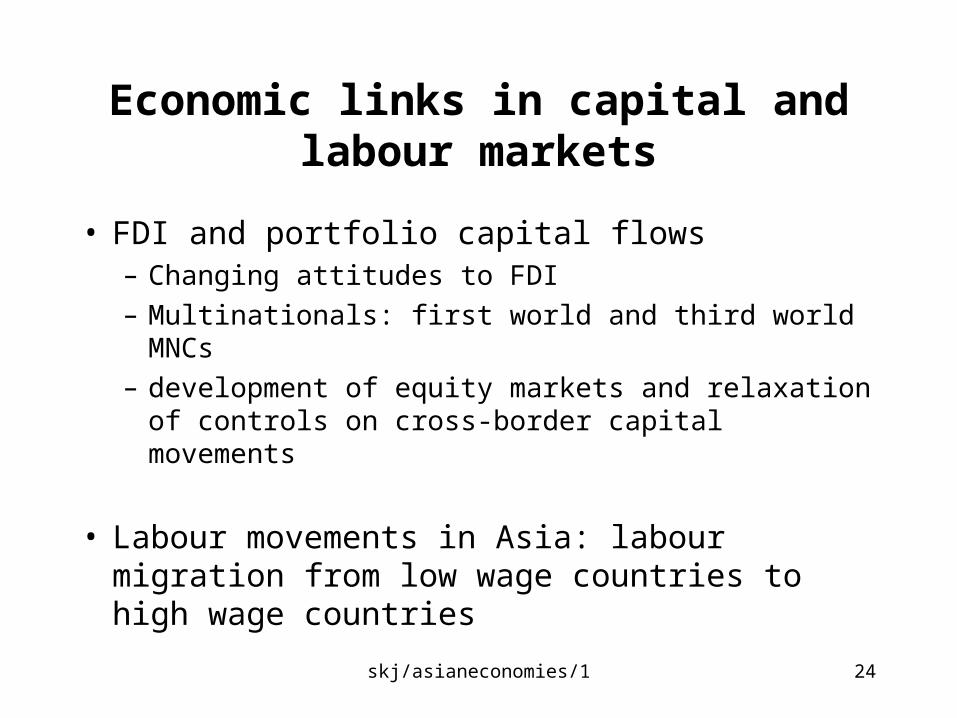
Economic links in capital and labour markets
• FDI and portfolio capital flows– Changing attitudes to FDI
– Multinationals: first world and third world MNCs
– development of equity markets and relaxation of controls on cross-border capital movements
• Labour movements in Asia: labour migration from low wage countries to high wage countries
skj/asianeconomies/1 25
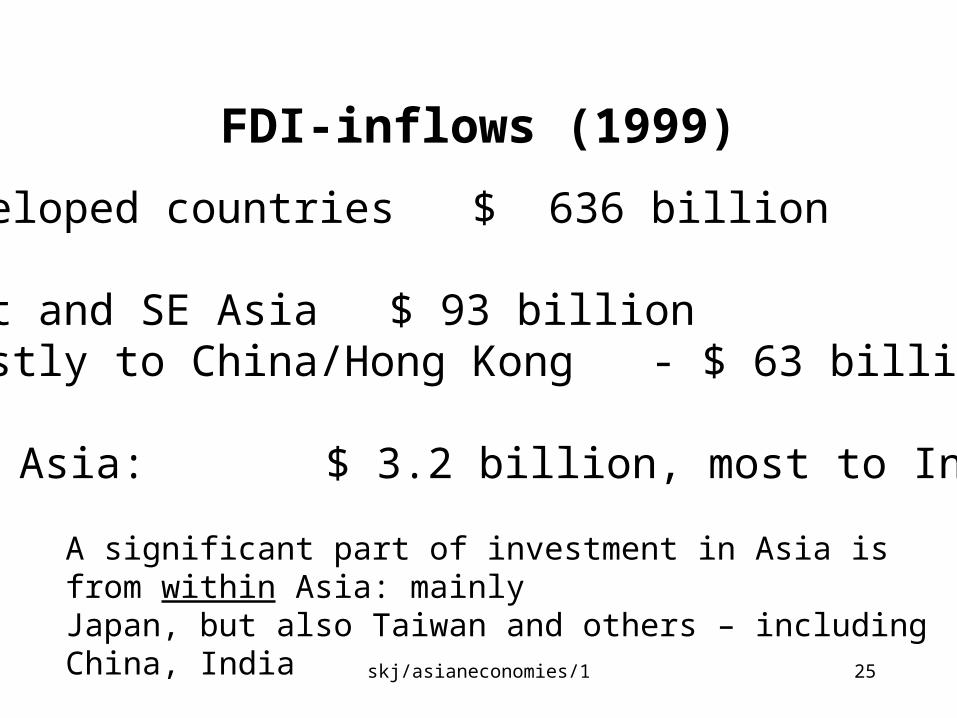
FDI-inflows (1999)
Developed countries $ 636 billion
East and SE Asia $ 93 billion(mostly to China/Hong Kong - $ 63 billion)
South Asia: $ 3.2 billion, most to India
A significant part of investment in Asia is from within Asia: mainlyJapan, but also Taiwan and others – including China, India
skj/asianeconomies/1 26
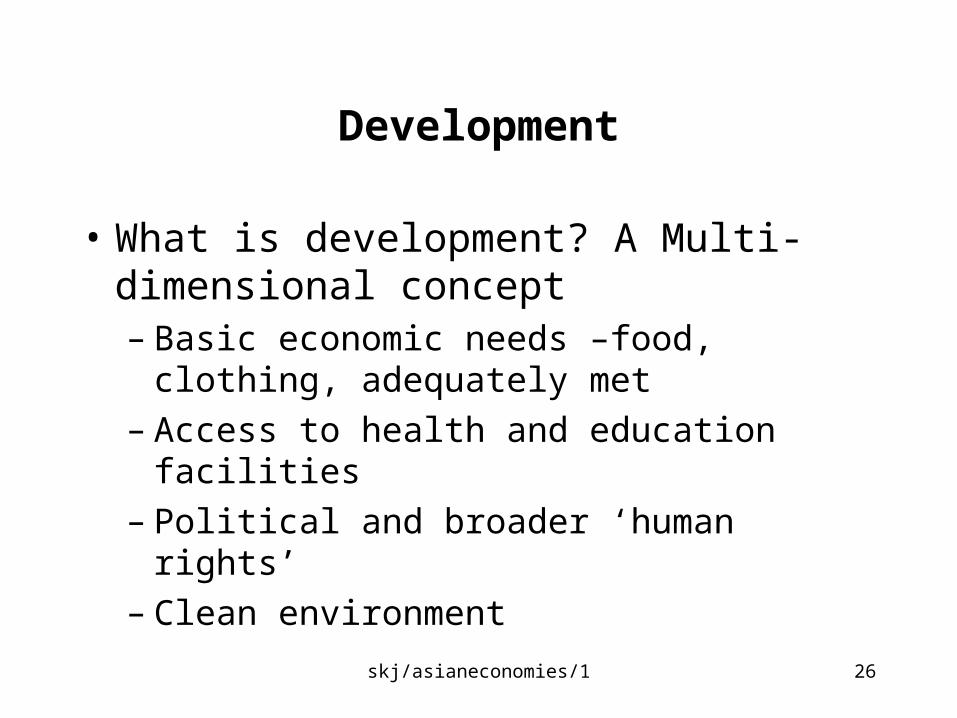
Development
• What is development? A Multi-dimensional concept– Basic economic needs –food, clothing,
adequately met– Access to health and education facilities– Political and broader ‘human rights’– Clean environment
skj/asianeconomies/1 27
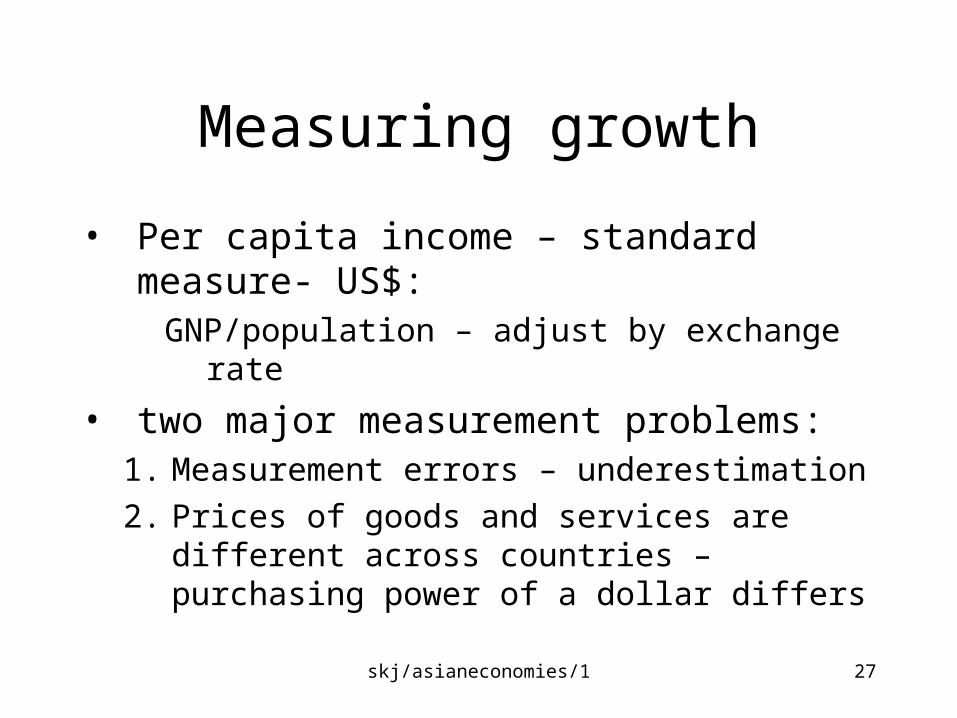
Measuring growth
• Per capita income – standard measure- US$:
GNP/population – adjust by exchange rate
• two major measurement problems:1. Measurement errors – underestimation
2. Prices of goods and services are different across countries – purchasing power of a dollar differs
skj/asianeconomies/1 28
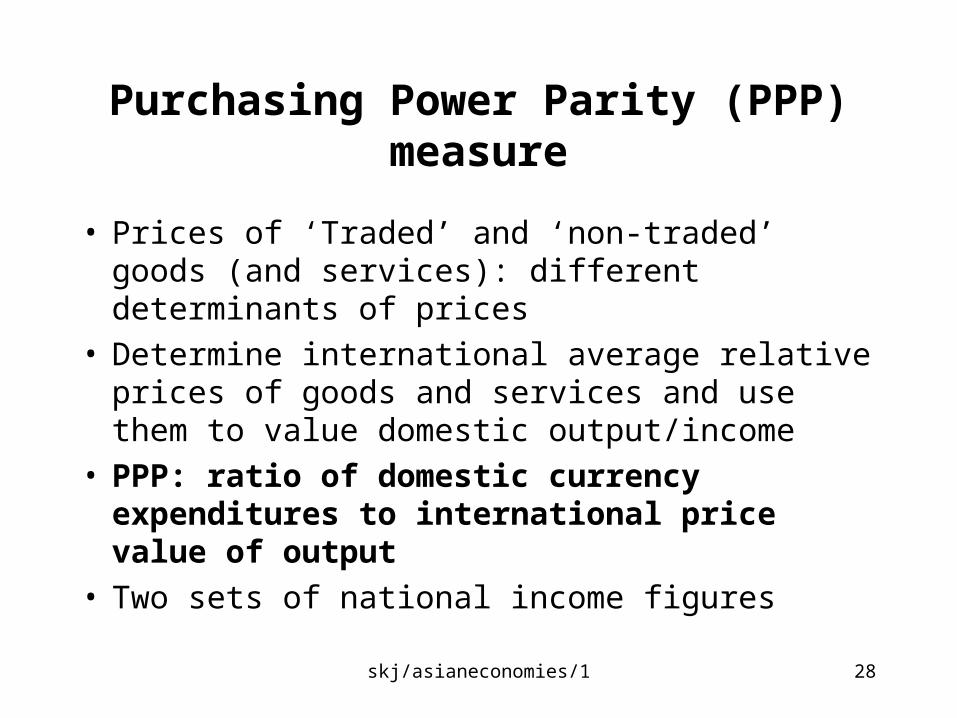
Purchasing Power Parity (PPP) measure
• Prices of ‘Traded’ and ‘non-traded’ goods (and services): different determinants of prices
• Determine international average relative prices of goods and services and use them to value domestic output/income
• PPP: ratio of domestic currency expenditures to international price value of output
• Two sets of national income figures
skj/asianeconomies/1 29
Asia: the big 3
Population Area GNP per cap income(millions)(‘ooo km2) (bn$)
$ PPP $ PPP$
------------------------------------------------------------Japan: 126 328 4,290 2,928 32,390 29,180
China: 1,239 9,597 929 3,984 750 3,220
India 980 3,228 421 1,661 430 1,700
skj/asianeconomies/1 30
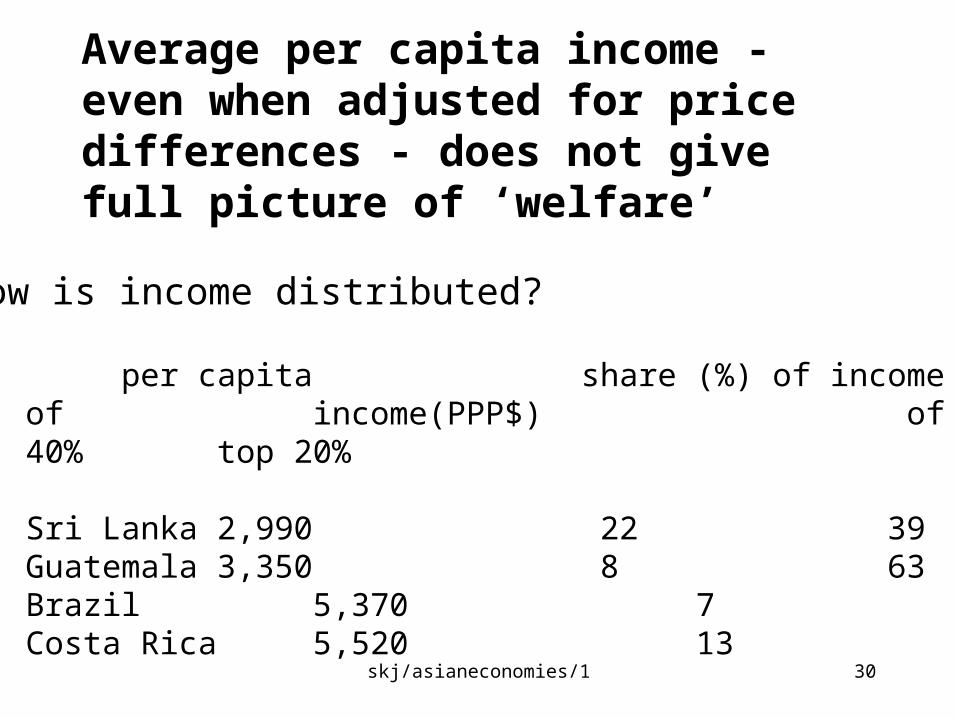
Average per capita income - even when adjusted for price differences - does not give full picture of ‘welfare’
per capita share (%) of income share of income(PPP$) of bottom 40% top 20%
Sri Lanka 2,990 22 39Guatemala 3,350 8 63Brazil 5,370 7 65Costa Rica 5,520 13 50
How is income distributed?
skj/asianeconomies/1 31
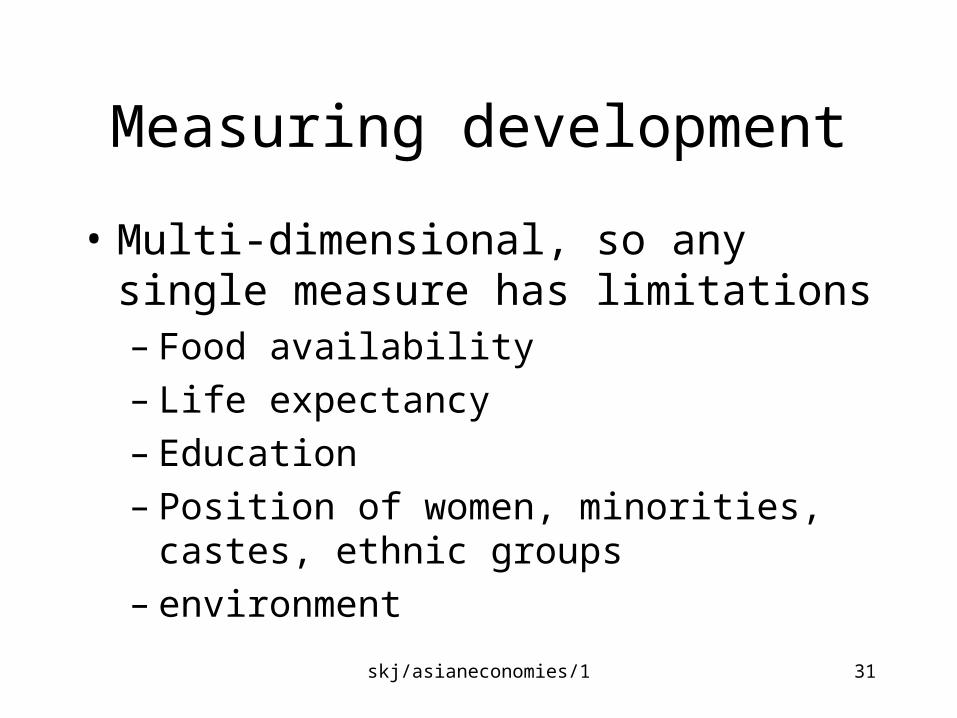
Measuring development
• Multi-dimensional, so any single measure has limitations– Food availability– Life expectancy– Education– Position of women, minorities, castes, ethnic
groups– environment
skj/asianeconomies/1 32
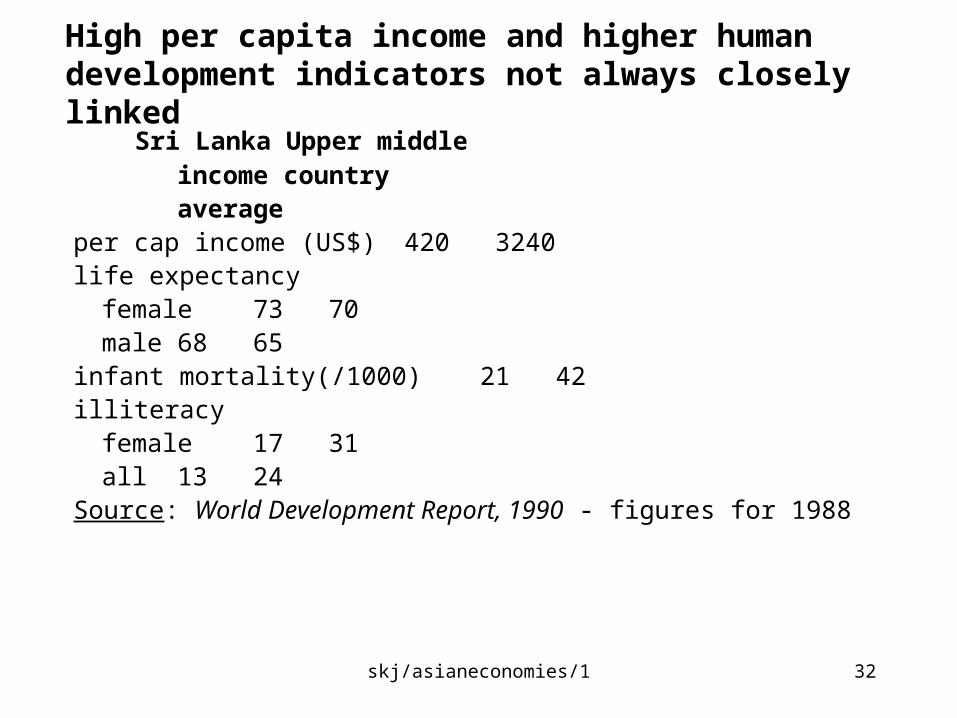
High per capita income and higher human development indicators not always closely linked
Sri Lanka Upper middle income country average
per cap income (US$) 420 3240 life expectancy
female 73 70male 68 65
infant mortality(/1000) 21 42illiteracy
female 17 31all 13 24
Source: World Development Report, 1990 - figures for 1988
skj/asianeconomies/1 33
Human Development Index (HDI)
• A composite index produced by the UN, published in Human Development Report
• Includes:– Literacy/education– Life expectancy– Per capita income
• Takes values between 0 and 1• Has limitations, but overcomes some limitations
of ‘per capita income’ measure

![+1cm[width=30mm]logo.pdf +1cm Corporate Frauds: Factors … · 2020-02-13 · Sohail Rizwan (PM 123012) Dr. Sisira Colombage Federation University, Melbourne, Australia Dr. Nirosha](https://img.pdfslide.us/doc/110x75/5fb289900444c87054516422/1cmwidth30mmlogopdf-1cm-corporate-frauds-factors-2020-02-13-sohail-rizwan.jpg)