Embed Size (px)
Citation preview

752
© 2019 AESS Publications. All Rights Reserved.
PERFORMANCE OF MALAYSIAN FINANCIAL FIRMS: AN INTELLECTUAL CAPITAL PERSPECTIVE USING MVAIC MODEL
Hapsah S.Mohammad1+
Imbarine Bujang2
1,2Universiti Teknologi MARA, Sabah Branch, Kota Kinabalu Campus, Malaysia.
(+ Corresponding author)
ABSTRACT Article History Received: 5 April 2019 Revised: 8 May 2019 Accepted: 12 June 2019 Published: 18 July 2019
Keywords Intellectual capital Financial performance MVAIC model Human capital efficiency Structural capital efficiency Relational capital efficiency Capital used efficiency Competitive advantage Malaysia.
JEL Classification: O34, M1, G21.
This study examined the influence of intellectual capital on Malaysian financial firms from two perspectives, performance of intellectual capital and impact of intellectual capital on financial performance. The data used were collected from the audited annual reports of 21 financial firms listed in the finance sector of Bursa Malaysia. The sample period was from 2011 to 2015 and the number of observations for this analysis was 105. Intellectual capital was measured using the modified value-added intellectual coefficient (MVAIC) model and financial performance was proxied by the return on asset (ROA). The findings suggested a strong association between MVAIC and ROA. CEE, HCE and SCE made significant and positive contributions towards financial performance. As for RCE, the findings revealed a positive but insignificant relationship with ROA. On the performance of intellectual capital, the HCE contributed approximately 82% to MVAIC followed by SCE 16%, RCE 1% and CEE 1%. Thus, the value creation capability of Malaysian financial firms is directly attributable to the HCE of the firms. The main limitations of the study were no control for firm-specific variables such as firm-size, and that the level of risk, firms’ complexity and structural capital were not segregated into its components namely innovation capital and process capital to identify which was more dominant in creating value. Financial firms may use the results to address the factors affecting intellectual capital performance in order to maximize value creation capability. Education institutions need to collaborate with the finance industry to increase the relevance of their educational mission and to stimulate new directions in the education industry.
Contribution/ Originality: This study investigated intellectual capital in two dimensions namely intellectual
capital performance and impact of intellectual capital on financial performance. The MVAIC model incorporates
measurement of relational capital. The findings may allow financial firms to benchmark themselves based on the
level of efficiency rankings, to establish priorities and develop strategic plans, thus inducing financial performance.
1. INTRODUCTION
Firms have resources that are both tangible and intangible in nature (Barney, 1991; Riahi-Belkaoui, 2002).
These resources are used to create value and improve firms’ financial performance. Firms’ financial performance is
also influenced by the country’s economy. Malaysia’s economy has recorded an average of 7 per cent growth over
the last three decades (Goh, 2005) and it has undergone substantial changes over the years.
Asian Economic and Financial Review ISSN(e): 2222-6737 ISSN(p): 2305-2147 DOI: 10.18488/journal.aefr.2019.97.752.765 Vol. 9, No. 7, 752-765 © 2019 AESS Publications. All Rights Reserved. URL: www.aessweb.com
Asian Economic and Financial Review, 2019, 9(7): 752-765
753
© 2019 AESS Publications. All Rights Reserved.
Malaysia’s economic development can be divided into three phases with phase one from 1957 to 1969, phase
two from 1970 to 1990 and phase 3 from 1991 onwards (Fadhlin et al., 2004). Throughout the three phases, the
government has set out various economic policies to ensure economic growth and development. These economic
policies relied on the traditional production factors such as land, labor, capital and entrepreneur to sustain the
economy. However, the extent of reliance on these production factors evolved over time. After independence in
1957, Malaysia’s economy was supported by the agriculture sector and this sector was labor-intensive. As time
passed, Malaysia’s economy moved into the manufacturing sector and again was labor-intensive. Due to increasing
labor costs, Malaysia was losing its competitiveness if it continued to depend on the production of labor-intensive
goods from both agriculture and manufacturing sectors, and it would have affected future economic growth (Goh,
2005).
The changes in the global economy had witnessed a different approach towards firms’ sources of value creation.
In the old economy, a firm was considered as having a competitive advantage if it was able to produce a similar
product at a lower cost. Thus, competitive advantage was defined as having lower cost, which mad the company
enjoy a higher profit margin (Ting and Lean, 2009). However, the new global economy recognizes the importance
of knowledge-based resources as the main factor in sustaining competitive advantage. The knowledge-based
resources are also referred to as intellectual capital (Kristandl and Bontis, 2007) and intellectual capital is made up
of the combination knowledge of human, structural and relational resources (Bontis, 1996; Edvinsson and Malone,
1997; Stewart, 1997). To keep up with the new global economy, Malaysia introduced the Knowledge Economy
Master Plan in 2001 and its main purpose is to achieve a sustainable economic growth through investments on
intellectual capital (Ting and Lean, 2009).
Due to the significance of intellectual capital on firms’ financial performance and growth, many prior studies
have been performed on intellectual capital. The objectives vary and some studies examined intellectual capital
performance and some studies related intellectual capital to firms’ financial performance. Despite the numerous
studies, more studies on intellectual capital are needed. According to Marr et al. (2003) the study of intellectual
capital will bring a lot of goodness and it will benefit many parties. The findings of the analysis may assist firms in
terms of strategy formulation, strategy execution, diversification, expansion decisions, basis for compensation and
to communicate measures to external stakeholders (Marr et al. (2003). The growth of a firm’s intellectual capital
has been interpreted as an early indicator for future profitability (Roos and Roos, 1997).
Quite a number of prior studies had used the value added intellectual coefficient (VAIC) model to measure
intellectual capital performance (Goh, 2005; Kamath, 2007; Ting and Lean, 2009; Joshi et al., 2010; Joshi et al.,
2013). This model, nevertheless, does not measure relational capital which is a pillar of intellectual capital. To
better reflect intellectual capital performance, another model called MVAIC, was used in recent studies
(Nimtrakoon, 2015; Ulum et al., 2016). The measurement of intellectual capital using the MVAIC model is not
widely investigated. Thus, replicating the study of Goh (2005); Ting and Lean (2009); Muhammad and Ismail
(2009); Joshi et al. (2010); Joshi et al. (2013); Ulum et al. (2014); Nimtrakoon (2015); Ulum et al. (2016) this study
was improvised by: first, adding relational capital into the measurement of intellectual capital via the MVAIC
model; second, evaluating the intellectual capital performance of Malaysian financial firms; and third, empirically
examining the association between intellectual capital and financial performance of Malaysian financial firms.
Hence, this paper had three objectives: to evaluate intellectual capital performance, to measure the impact of
intellectual capital on financial performance and to examine the separate effects of human capital efficiency,
structural capital efficiency, relational capital efficiency and capital used efficiency on the financial performance of
Malaysian financial firms.
The remaining parts of this paper is organized into the literature review which includes the definition of
intellectual capital, the strengths and limitations of VAIC model and the use of MVAIC model, the review of
previous studies and the development of the hypotheses. The next part includes the research methodology of the
Asian Economic and Financial Review, 2019, 9(7): 752-765
754
© 2019 AESS Publications. All Rights Reserved.
study and the discussion of the empirical findings and the paper is concluded with some practical implications of the
study and recommendations for future research.
2. LITERATURE REVIEW
2.1. Definition of Intellectual Capital
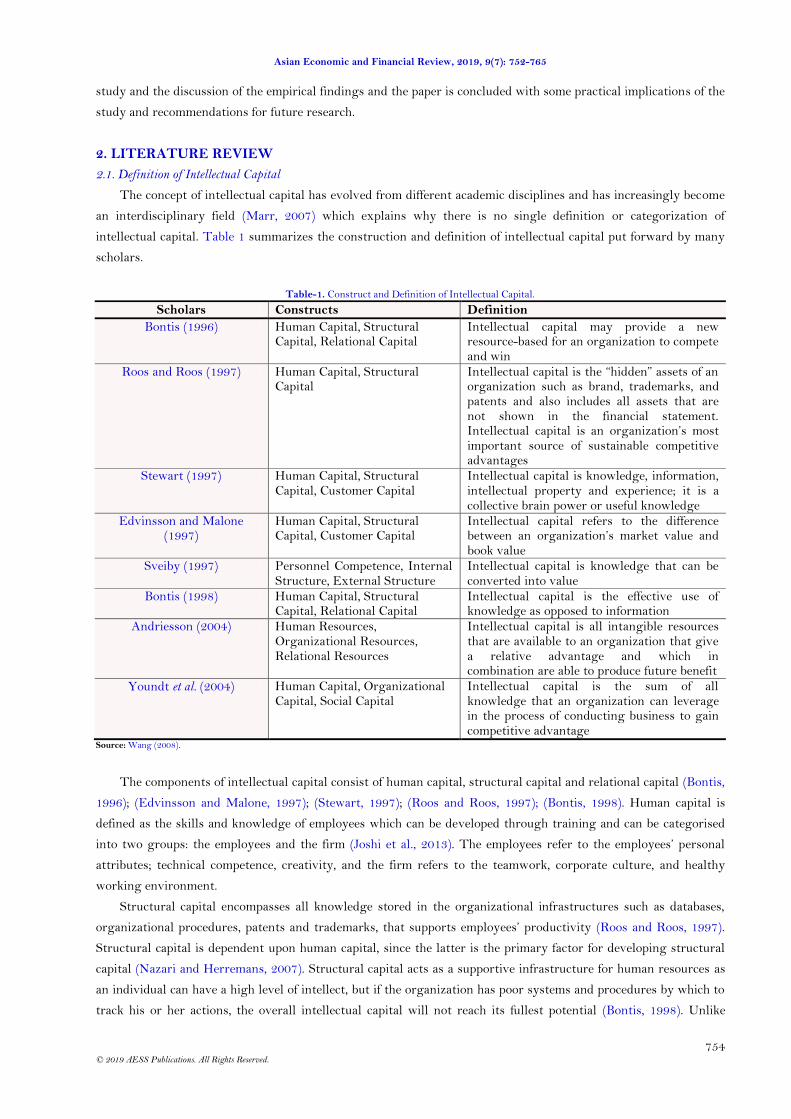
The concept of intellectual capital has evolved from different academic disciplines and has increasingly become
an interdisciplinary field (Marr, 2007) which explains why there is no single definition or categorization of
intellectual capital. Table 1 summarizes the construction and definition of intellectual capital put forward by many
scholars.
Table-1. Construct and Definition of Intellectual Capital.
Scholars Constructs Definition
Bontis (1996) Human Capital, Structural Capital, Relational Capital
Intellectual capital may provide a new resource-based for an organization to compete and win
Roos and Roos (1997) Human Capital, Structural Capital
Intellectual capital is the “hidden” assets of an organization such as brand, trademarks, and patents and also includes all assets that are not shown in the financial statement. Intellectual capital is an organization’s most important source of sustainable competitive advantages
Stewart (1997) Human Capital, Structural Capital, Customer Capital
Intellectual capital is knowledge, information, intellectual property and experience; it is a collective brain power or useful knowledge
Edvinsson and Malone (1997)
Human Capital, Structural Capital, Customer Capital
Intellectual capital refers to the difference between an organization’s market value and book value
Sveiby (1997) Personnel Competence, Internal Structure, External Structure
Intellectual capital is knowledge that can be converted into value
Bontis (1998) Human Capital, Structural Capital, Relational Capital
Intellectual capital is the effective use of knowledge as opposed to information
Andriesson (2004) Human Resources, Organizational Resources, Relational Resources
Intellectual capital is all intangible resources that are available to an organization that give a relative advantage and which in combination are able to produce future benefit
Youndt et al. (2004) Human Capital, Organizational Capital, Social Capital
Intellectual capital is the sum of all knowledge that an organization can leverage in the process of conducting business to gain competitive advantage
Source: Wang (2008).
The components of intellectual capital consist of human capital, structural capital and relational capital (Bontis,
1996); (Edvinsson and Malone, 1997); (Stewart, 1997); (Roos and Roos, 1997); (Bontis, 1998). Human capital is
defined as the skills and knowledge of employees which can be developed through training and can be categorised
into two groups: the employees and the firm (Joshi et al., 2013). The employees refer to the employees’ personal
attributes; technical competence, creativity, and the firm refers to the teamwork, corporate culture, and healthy
working environment.
Structural capital encompasses all knowledge stored in the organizational infrastructures such as databases,
organizational procedures, patents and trademarks, that supports employees’ productivity (Roos and Roos, 1997).
Structural capital is dependent upon human capital, since the latter is the primary factor for developing structural
capital (Nazari and Herremans, 2007). Structural capital acts as a supportive infrastructure for human resources as
an individual can have a high level of intellect, but if the organization has poor systems and procedures by which to
track his or her actions, the overall intellectual capital will not reach its fullest potential (Bontis, 1998). Unlike

Asian Economic and Financial Review, 2019, 9(7): 752-765
755
© 2019 AESS Publications. All Rights Reserved.
human capital, structural capital components can be owned and traded by an organization (Edvinsson and Malone,
1997) at least to the extent which they can be legally protected and become intellectual property rights. Edvinsson
and Malone (1997) described structural capital as customer capital and organizational capital, with the latter being
subdivided into process capital and innovation capital. Similarly, Roos and Roos (1997) defined structural capital
(which they call organizational capital) as the sum of process capital and innovation capital; however they put
relational capital on an equal footing with human capital and structural capital rather than as a subcategory.
Relational capital is the link that the firm has with its external environment for example the customers,
suppliers, resource providers, banks and shareholders. Relational capital is the ability of a firm to create relational
value with its external stakeholders in the form of customer and brand loyalty, customer satisfaction, market image
and goodwill, power to negotiate, strategic alliances and coalitions. Joshi et al. (2013) stressed the importance of
both creation and maintenance of relational capital. These scholars agreed on the notion that human capital,
structural capital and relational capital were basic components of the intellectual capital construct.
2.2. Valuation Models
Scholars have linked intellectual capital to firms’ competitive advantage. Thus, numerous valuation models
have been introduced to measure intellectual capital. Table 2 summarizes the intellectual capital valuation models.
Table-2. Intellectual Capital and Valuation Models.
Valuation Methods Inventor Year
Balance Scorecard Robert S.Kaplan and David P.Norton 1992 Intellectual Capital Audit Annie Brooking 1996 Calculated Intangible Value Thomas A.Stewart 1997 Holistic Value Approach Goran Roos, J. Roos, Nicola C. Dragonetti and Leif
Edvinsson 1997
Intellectual Capital-Index Goran Roos 1997
Intangible Asset Monitor Karl Erick Sveiby 1997 Market-to-Book Ratio Thomas A. Stewart 1997 Skandia Navigator Leif Edvinsson and Michael S. Malone 1997 Value Added Intellectual Coefficient Ante Pulic 1997 Sullivan’s Work Patrick H. Sullivan 1998 Intangible Scoreboard Baruch Lev 1999 Intellectual Capital Statement Jan Mouritsen 2001 iValuing Factor Ken Standfield 2001 Inclusive Value Methodology Philip K. M. Pherson and Stephen Pike 2001 Citation-Weighted Patent Bronwyn H. Hall, Adam B. Jaffe and Manual
Trajtenberg 2001
Intellectual Capital Benchmarking System Jose Maria Viedma 2001 Value Chain Scoreboard Baruch Lev 2001 Extended VAIC (eVAIC) Jamal A. Nazari and Irene M. Herramas 2007 Modified Value Added Intellectual Coefficient (MVAIC)
Ihyaul Ulum, Imam Ghozali and Agus Purwanto 2014
Source: Ulum et al. (2014).
Numerous models were suggested as a result of the lack of agreement by the scholars. Each valuation model
has some advantages and disadvantages (Sydler et al., 2014). This study adopts a modified version of the valuation
model proposed by Pulic (1998). Pulic (1998) proposed the VAIC model which was later modified by Ulum et al.
(2014) by adding relational capital into the measurement of intellectual capital. The VAIC model was used in this
study because of the wide acceptance of this model in the literature of intellectual capital. This was based on the
findings of Volkov (2012) which stated that as of June 2012, the VAIC model of Pulic (1998) has been used in 46
studies and has been cited by 2373 studies (Hamidreza and Ruzita, 2013).
Asian Economic and Financial Review, 2019, 9(7): 752-765
756
© 2019 AESS Publications. All Rights Reserved.
The VAIC model has several advantages. First, the model is straight forward and simple to use in determining
the value of intellectual capital. Second, the acquisition of data required in the model is feasible because all the data
are obtained from corporate financial reports (secondary data). Third, the data are obtained from audited financial
statements, therefore the measurement is objective and verifiable (Goh, 2005). Fourth, the model makes cross-
organizational or cross-national comparison possible, unlike other measurement models which require both
financial and non-financial measures often including some subjective judgments. Fifth, the firms can use the model
to evaluate their own intellectual capital and firms’ performance (Firer and Mitchell, 2003; Chen et al., 2005; Goh,
2005; Pew et al., 2007; Laing et al., 2010).
However, the VAIC model has some limitations (Joshi et al., 2013). The efficiency measurement of intellectual
capital using the VAIC model has been challenged by several scholars. Chang (2007) suggested modifications to the
VAIC model by adding research and development (R&D) expenditure and intellectual property (IP) for intellectual
capital measurement. His study documented evidence that other elements such as R&D expenditure and IP are
positively related with firms’ market value and profitability, suggesting that additional information on intellectual
capital is omitted from Pulic’s VAIC model. Numerous scholars had defined intellectual capital as human capital,
structural capital and relational capital however the model does not include relational capital in its measurement of
intellectual capital (Ulum et al., 2014). Scholars had cited that relational capital had become the most important
business success factor and the key factor in sustaining competitive advantage and creating firms’ value
(Andriesson, 2004). Chen et al. (2005) also argued that advertising expenditures (a proxy for relational capital) play
an increasingly important role in business.
Factors such as increased global competition and increased people’s standard of living are placing greater
pressure for firms’ to offer greater product differentiation and value added services. These can be achieved through
improving firm’s customer relation (relational capital) and address numerous needs of their customers (Goh, 2005).
To measure relational capital, this paper adopted the MVAIC model by Ulum et al. (2014). The MVAIC model
included relational capital in the measurement of intellectual capital in line with the construct and definition of
intellectual capital adopted in this study.
2.3. Review of Prior Literature
Studies on firms’ intellectual capital can be viewed from two different perspectives. Some scholars investigated
the performance of human capital, structural capital and relational capital towards firms’ growth that is the value
creation capability of different components of intellectual capital (Goh, 2005; Kamath, 2007; Joshi et al., 2010) and
some analyzed the relationship between intellectual capital and firms’ financial performance (Ting and Lean, 2009;
Nimtrakoon, 2015). The analysis of Bontis et al. (2000) investigated the performance of the three components of
intellectual capital in the service and non-service industries in Malaysia. The result of the study indicated that
structural capital has a great influence on business performance of both industries. The findings of Scafarto et al.
(2016) on intellectual capital performance in the global agribusiness industry, revealed that relational capital has a
positive impact on firms’ performance. Other studies had also documented a positive contribution of relational
capital towards firms’ performance (Sharabati et al., 2010; Mention and Bontis, 2013).
However, some studies argued that firms’ relied more on their human capital to create value. According to Goh
(2005) the value creation capability of commercial banks in Malaysia was contributed by human capital . A similar
study conducted on Australian banks had documented the same result (Joshi et al., 2010). The findings of Kamath
(2007) on the intellectual capital performance of Indian banking indicated some differences. The analysis suggested
that foreign banks relied more on human capital while public banks relied more on physical capital for value
creation. Thus, future study on intellectual capital performance is justified because prior studies have indicated
mixed and inconclusive results. Goh (2005) emphasized the importance of benchmarking based on the level of
efficiency ranking in order to establish priorities and develop strategic plans which can result in enhancing the

Asian Economic and Financial Review, 2019, 9(7): 752-765
757
© 2019 AESS Publications. All Rights Reserved.
firms’ future performance. The findings would assist stakeholders in assessing the creation capabilities of firms and
policy makers to formulate and implement policies. Studies on intellectual capital performance in Malaysia are
limited (Goh, 2005; Ting and Lean, 2009).
The findings on the relationship between intellectual capital and financial performance had also documented
inconsistency. Some firms recorded positive relationship between intellectual capital and financial performance
(Muhammad and Ismail, 2009; Khan et al., 2015; Nimtrakoon, 2015) and others documented negative relationship
between intellectual capital and financial performance (Kamath, 2008; Maditinos et al., 2011; Mehralian et al., 2012;
Mosavi et al., 2012; Joshi et al., 2013; Bontis et al., 2015). Therefore, this study further investigated the relationship
between intellectual capital and financial performance.
2.4. Hypotheses Development
In a study conducted by Ting and Lean (2009) on the relationship between intellectual capital and financial
performance of Malaysian financial institutions, the results indicated that intellectual capital has a positive impact
on firms’ financial performance. Similarly, Muhammad and Ismail (2009) had also documented that intellectual
capital has positive and significant relationship with financial performance. The study of Khan et al. (2015) into the
five major Islamic banks in Pakistan suggested a positive relationship between intellectual capital and financial
performance. Nimtrakoon (2015) examined the relationship between intellectual capital and financial performance of
technology firms on the five ASEAN stock markets (Indonesia, Malaysia, Philippines, Singapore, and Thailand) and
the findings suggested a positive relationship between intellectual capital and financial performance. Drawing from
these previous findings, the first hypothesis is posited as follows:
H1: Firms with greater intellectual capital tend to have higher financial performance.
The study of Bontis et al. (2000) of the service and non-service industries in Malaysia revealed that structural
capital has a significant influence on the business performance of both industries. The findings of Scafarto et al.
(2016) in the global agribusiness industry documented a positive contribution of relational capital towards firms’
performance. Goh (2005) argued that the value creation capability of commercial banks in Malaysia was contributed
largely by human capital efficiency. Similarly, the study of Joshi et al. (2010) for Australian banks documented the
same findings. The study of Kamath (2007) on intellectual capital performance of Indian banking had indicated that
public sector banks rely more on physical capital for value creation. According to the findings from previous studies,
the second hypothesis is proposed as follows:
H2: Firms with greater HCE, SCE, RCE, and CEE tend to have higher financial performance.
To test the hypotheses formulated for this study, two regression models were presented as follows Model 1 and 2:
Model 1 ROAit = αit + β0MVAICit + εit (1)
Model 2 ROAit = αit + β0HCEit + β1SCEit + β2RCEit + β3CEEit + εit (2)
3. RESEARCH METHODOLOGY
The data were collected from the audited annual reports of 21 financial firms listed in the finance sector of
Bursa Malaysia. There were 33 firms listed as at 31 December 2015 and initially three firms were dropped from the
analysis due to the unavailability of data. Then nine more firms were dropped from the sample leaving the final
sample size at 21. These nine firms were not used due to the non-availability of the marketing cost which is a proxy
for relational capital. The number of observations for this analysis was 105 and the sample period was from 2011 to
2015.
Following prior studies of Ting and Lean (2009); Muhammad and Ismail (2009); Joshi et al. (2013); and
Nimtrakoon (2015) this paper adopted ROA as the financial performance indicator. ROA is calculated as operating

Asian Economic and Financial Review, 2019, 9(7): 752-765
758
© 2019 AESS Publications. All Rights Reserved.
profit divided by total assets. ROA is commonly used as a key performance indicator of firms’ profitability, thus it
has been robustly tested and widely used as a measure of financial performance in earlier research (Joshi et al.,
2013).
Intellectual capital and its components namely human capital, structural capital, relational capital, capital used
was measured using modified value-added intellectual coefficient (MVAIC) model. Mathematically, the MVAIC was
presented as MVAIC= HCE+SCE+RCE+CEE. Several steps are taken in order to establish the value of MVAIC.
Step 1 was to establish the Value Added (VA). VA is derived from the equation: VA = OP + EC + D + A, where
OP is operating profit, EC is employee costs, D is depreciation, and A is amortization. Step 2 was to establish
efficiency scores namely HCE, SCE, RCE and CEE. To compute human capital efficiency (HCE) the equation was:
HCE = VA/HC, where human capital (HC) represents the investment made by the firm on its employees. It
includes salary, wages and all incentives paid to employees. This ratio gives the contribution made by every unit of
money invested in human capital to the value added in the firm. In other words, HCE is an indicator of value added
by human resources used by the business (Joshi et al., 2013).
To compute structural capital efficiency (SCE) the equation was: SCE = VA – HC/VA, where SCE indicates the
proportion of total VA accounted by structural capital. SCE shows how much of the firm’s value creation was
generated by the structural capital (Joshi et al., 2013). To compute relational capital efficiency (RCE) the equation
used was: RCE = RC/VA. RC is the marketing cost of firms. This ratio gives the contribution made by every unit of
relational capital to the value added in the firm (Ulum et al., 2014). To compute capital used efficiency (CEE) the
equation was: CEE = VA/CE, where capital used (CE) represents the total assets of the firm (Ulum et al., 2014).
CEE was a measure of physical capital. This ratio gives the contribution made by every unit of physical capital to
the value added in the firm.
4. EMPIRICAL RESULTS
This paper presented two levels of analyses: the first was the intellectual capital performance of Malaysian
financial firms and the second was the relationship between intellectual capital and financial performance.
4.1. Intellectual Capital Performance
Table 3 illustrates the intellectual capital performance of Malaysian financial firms listed in Bursa Malaysia
from 2011 to 2015.
The efficiency in utilizing intellectual capital was quantitatively measured using MVAIC model. The efficiency
levels to be calculated were HCE, SCE, RCE and CEE. The sum of these efficiencies was termed as the MVAIC. As
a performance measurement tool, the greater the value of MVAIC, the better the efficiency level of the firm (Joshi et
al., 2013). If the value of firms’ MVAIC rises over time, it indicates improvement in the efficiency levels, thus more
value creation to the firm (Joshi et al., 2013).
The average value of intellectual capital performance of Malaysian financial firms from 2011 to 2015 was
3.8597 which was higher than that found by Ting and Lean (2009) for Malaysian financial institution during 1999
to 2007 which stood at 2.5493. The findings recorded an increase in the value creation capability of Malaysian
financial sector in recent years. This improvement indicated that the financial institutions have managed their
intellectual capital properly and efficiently (Ting and Lean, 2009). However, the average value of MVAIC (3.8597)
was much lower than that revealed by Joshi et al. (2013) for the Australian financial sector during 2006 to 2008
which stood at 8.8224, suggesting a need for developing country such as Malaysia to benchmark their value
creation efficiency of financial sector against a developed nation such as Australia.

Asian Economic and Financial Review, 2019, 9(7): 752-765
759
© 2019 AESS Publications. All Rights Reserved.
Table-3. Intellectual Capital performance of Malaysian financial firms.
Malaysian Financial Firms HCE SCE RCE CEE MVAIC Ranking
Malaysia Buildings Society Bhd 9.7502 0.8965 0.0100 0.0380 10.6948 1 Public Bank Bhd 4.3606 0.7705 0.0181 0.0252 5.1744 2 Hwang Capital (M) Bhd 4.0141 0.6823 0.0597 0.0497 4.8058 3 Hong Leong Financial Group 3.5294 0.7103 0.0403 0.0199 4.2999 4 Bursa Malaysia Bhd 3.3440 0.7009 0.0243 0.2127 4.2818 5 Hong Leong Bank Bhd 3.3413 0.6992 0.0419 0.0186 4.1011 6 AMMB Holdings Bhd 3.2795 0.6940 0.0415 0.0305 4.0455 7 MNRB Holdings Bhd 3.0011 0.6611 0.0418 0.0541 3.7581 8 Allianz Malaysia Bhd 2.9215 0.6556 0.0359 0.0517 3.6646 9 Alliance Financial Group Bhd 2.8978 0.6548 0.0212 0.0256 3.5994 10 ECM Libra Financial Group 2.8532 0.5810 0.0268 0.0511 3.5122 11
Affin Holdings Bhd 2.8059 0.6349 0.0472 0.0213 3.5097 12 Manulife Holdings Bhd 2.7662 0.6076 0.0778 0.0262 3.4777 13 Malayan Banking Bhd 2.7451 0.6354 0.0447 0.0214 3.4466 14 RHB Bank Bhd 2.6951 0.6217 0.0621 0.0229 3.4018 15 BIMB Holdings Bhd 2.5004 0.5996 0.1205 0.0290 3.2495 16 Syarikat Takaful Malaysia Bhd 2.4680 0.5906 0.0379 0.0424 3.1390 17 CIMB Group Holdings Bhd 2.4717 0.5939 0.0334 0.0297 3.1287 18
Hong Leong Capital Bhd 2.0964 0.5215 0.0227 0.0408 2.6814 19 MAA Group Bhd 1.3176 0.1317 0.1102 0.0580 1.6175 20 Kenanga Investment Bank Bhd 1.2059 0.1626 0.0670 0.0288 1.4644 21
Average 3.1602 0.6098 0.0469 0.0427 3.8597
HCE contributed approximately 81.87% to MVAIC followed by SCE 15.79%, RCE 1.21% and CEE 1.13%. The
above ratios indicated that Malaysian financial firms have a high HCE in comparison to SCE, RCE and CEE. These
findings were consistent with the findings of Goh (2005) for Malaysian banks and Joshi et al. (2010) for Australian
banks. The result showed that the value creation capability of Malaysian financial firms was directly attributable to
the HCE of the firms. The second contributor to MVAIC was SCE, but RCE and CEE had little impact on overall
efficiency and the value creation capability.
The Malaysian Buildings Society Bhd had the highest efficiency ranking with a MVAIC of 10.6948. The
efficiency in utilizing human capital was the main reason for the high performance of MVAIC as demonstrated by
the Malaysian Buildings Society Bhd (HCE = 9.7502). Of the 21 firms, seven firms recorded an above average of
MVAIC (3.8597). In relation to these seven financial firms, they were the most efficient firms in utilizing their
intellectual capital to create value.
4.2. The Relationship between Intellectual Capital and Financial Performance
4.2.1. Descriptive Analysis
Table 4 illustrates the descriptive analysis of the variables in this study.
Table-4. Descriptive analysis.
Variables Mean Standard Deviation Min Max
HCE 3.1602 1.7699 0.9131 10.8174 SCE 0.6098 0.1881 -0.9510 0.9076 RCE 0.0469 0.0336 0.0083 0.1405 CEE 0.0427 0.0427 0.0060 0.2564
MVAIC 3.8597 1.8960 0.9959 11.7784 ROA 2.4839 2.7988 -0.7725 16.4058
The descriptive statistics included the mean value, standard deviation, minimum value and maximum value of
all the variables in the study. The mean value of the MVAIC was 3.8597, depicting the value creation capability of

Asian Economic and Financial Review, 2019, 9(7): 752-765
760
© 2019 AESS Publications. All Rights Reserved.
financial firms for every RM1 invested throughout 2011 to 2015. HCE was the most influential component of
MVAIC in creating wealth with mean value of 3.1602, in relation to SCE, RCE and CEE with the mean values of
0.6098, 0.0469 and 0.0427 respectively. HCE largely determined intellectual capital efficiency in the finance
industry. These findings were consistent with the findings of Goh (2005); Kamath (2007); Joshi et al. (2013); Ku
Ismail and Abdul Karim (2011); Al-Musali and Ku (2014); Nawaz and Haniffa (2017).
HCE, SCE and RCE depicted value creation from intangible resources hence their emphasis was on intellectual
capital, meanwhile CEE was the value generated from one unit of physical and financial capital; thus, it was the
tangible resources. The combined mean value of the HCE, SCE and RCE was 3.8169, which was much higher than
the mean value of CEE of 0.0427. The comparison suggested that firms create value more efficiently from
intellectual capital rather than from physical capital. It was in line with prior literature that firms operating in the
new economy tend to create value from intellectual capital rather than physical capital (Nimtrakoon, 2015).
As for ROA, the mean value was 2.4839, suggesting that the firms were able to generate profit during the
period of analysis. The value of standard deviation measured the consistency of the data. It showed how far the data
were alike or different from each other and as a rule of thumb, the lower the value of standard deviation, the higher
was the consistency. The value of standard deviation for each of the four components of intellectual capital as
reported above indicated a small deviation from mean value (e.g. mean of HCE 3.1602, std dev 1.7699) indicating a
high consistency of the treatment in HCE, SCE, RCE, CEE across firms in the finance industry.
4.2.2. Correlation Analysis
Table 5 illustrates the Pearson correlation matrix for all variables in this study.
Table-5. Correlation Analysis.
Variables HCE SCE CEE RCE MVAIC ROA
HCE 1.0000 SCE 0.7071*** 1.0000 CEE 0.0643 0.1205 1.0000 RCE -0.4254*** -0.5733*** -0.1942** 1.0000
MVAIC 0.9975*** 0.7518*** 0.0910 -0.4406*** 1.0000 ROA 0.2487*** 0.3568*** 0.9664*** -0.3212*** 0.2836*** 1.0000
Note: ***,**,** correlation is significant at 0.01,0.05 and 0.1 level respectively.
The MVAIC was positive but weakly related to ROA (r=0.2836, p<0.0001). Three components of the MVAIC
namely HCE, SCE and CEE, were positive and significantly associated with ROA. CEE had a strong relationship
with ROA (r=0.9664,p<0.000.1) Moderate to weak associations were demonstrated by SCE (r=0.3568,p<0.0001)
and HCE (r=0.2487, p<0.0001) with ROA. RCE demonstrated a negative association with ROA. Regarding the
association of MVAIC and its components, a mixed result was recorded. HCE (r=0.9975) and SCE (r=0.7518) were
found to be associated positively with MVAIC (p<0.0001). CEE showed an insignificant association; meanwhile
RCE was negatively associated with MVAIC.
4.2.3. Hypotheses Testing
The results of the regression analyses were presented in Table 6 and its interpretation were as follows. The
regression result for Model 1 exhibited the value of R2 at 0.3899 percent, indicating that 39 percent variation in
ROA was explained by the variation in MVAIC. The F-value was 48.73 and statistically significant at the 1 per cent
level implying that the regression model was reliable for prediction. The result of Model 1 showed positive and
significant associations between MVAIC and ROA. The estimated coefficient of 1.0192 inferring that when MVAIC
Asian Economic and Financial Review, 2019, 9(7): 752-765
761
© 2019 AESS Publications. All Rights Reserved.
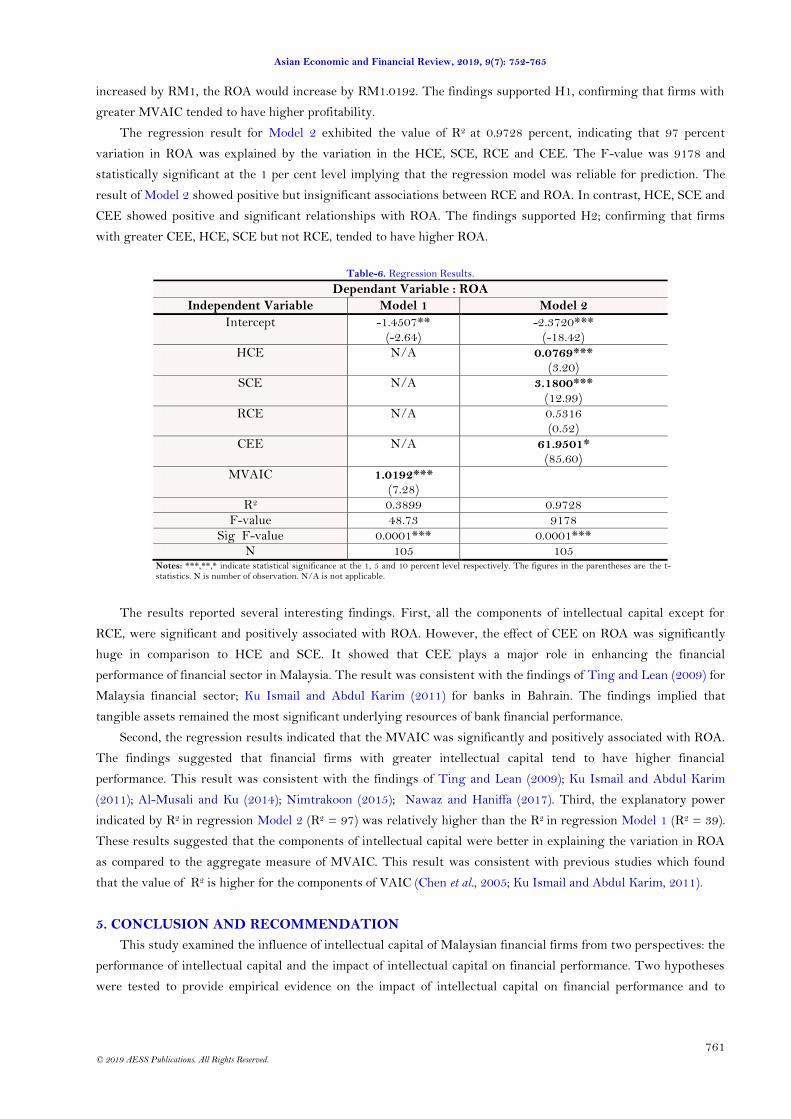
increased by RM1, the ROA would increase by RM1.0192. The findings supported H1, confirming that firms with
greater MVAIC tended to have higher profitability.
The regression result for Model 2 exhibited the value of R2 at 0.9728 percent, indicating that 97 percent
variation in ROA was explained by the variation in the HCE, SCE, RCE and CEE. The F-value was 9178 and
statistically significant at the 1 per cent level implying that the regression model was reliable for prediction. The
result of Model 2 showed positive but insignificant associations between RCE and ROA. In contrast, HCE, SCE and
CEE showed positive and significant relationships with ROA. The findings supported H2; confirming that firms
with greater CEE, HCE, SCE but not RCE, tended to have higher ROA.
Table-6. Regression Results.
Dependant Variable : ROA
Independent Variable Model 1 Model 2
Intercept -1.4507** (-2.64)
-2.3720*** (-18.42)
HCE N/A 0.0769*** (3.20)
SCE N/A 3.1800*** (12.99)
RCE N/A 0.5316 (0.52)
CEE N/A 61.9501* (85.60)
MVAIC 1.0192*** (7.28)
R2 0.3899 0.9728 F-value 48.73 9178
Sig F-value 0.0001*** 0.0001*** N 105 105
Notes: ***,**,* indicate statistical significance at the 1, 5 and 10 percent level respectively. The figures in the parentheses are the t-statistics. N is number of observation. N/A is not applicable.
The results reported several interesting findings. First, all the components of intellectual capital except for
RCE, were significant and positively associated with ROA. However, the effect of CEE on ROA was significantly
huge in comparison to HCE and SCE. It showed that CEE plays a major role in enhancing the financial
performance of financial sector in Malaysia. The result was consistent with the findings of Ting and Lean (2009) for
Malaysia financial sector; Ku Ismail and Abdul Karim (2011) for banks in Bahrain. The findings implied that
tangible assets remained the most significant underlying resources of bank financial performance.
Second, the regression results indicated that the MVAIC was significantly and positively associated with ROA.
The findings suggested that financial firms with greater intellectual capital tend to have higher financial
performance. This result was consistent with the findings of Ting and Lean (2009); Ku Ismail and Abdul Karim
(2011); Al-Musali and Ku (2014); Nimtrakoon (2015); Nawaz and Haniffa (2017). Third, the explanatory power
indicated by R2 in regression Model 2 (R2 = 97) was relatively higher than the R2 in regression Model 1 (R2 = 39).
These results suggested that the components of intellectual capital were better in explaining the variation in ROA
as compared to the aggregate measure of MVAIC. This result was consistent with previous studies which found
that the value of R2 is higher for the components of VAIC (Chen et al., 2005; Ku Ismail and Abdul Karim, 2011).
5. CONCLUSION AND RECOMMENDATION
This study examined the influence of intellectual capital of Malaysian financial firms from two perspectives: the
performance of intellectual capital and the impact of intellectual capital on financial performance. Two hypotheses
were tested to provide empirical evidence on the impact of intellectual capital on financial performance and to
Asian Economic and Financial Review, 2019, 9(7): 752-765
762
© 2019 AESS Publications. All Rights Reserved.
examine the separate effects of human capital efficiency, structural capital efficiency, relational capital efficiency and
capital used efficiency on the financial performance of Malaysian financial firms.
Hypothesis 1 that a higher value of MVAIC leads to higher ROA, was strongly supported. The findings
indicated that intellectual capital measured by MVAIC had a strong association with the financial performance of
Malaysian financial firms demonstrating that an increase in value creation efficiency affects firms’ profitability.
CEE, HCE and SCE make positive contributions towards the financial performance of the firms. The findings
supported Hypothesis 2, confirming that firms with greater CEE, HCE, SCE but not RCE, tended to have higher
ROA. On the performance of intellectual capital, HCE contributed approximately 81.7% to MVAIC followed by
SCE 16%, RCE 1.2% and CEE 1.1%. The above ratios indicated that Malaysian financial firms have high HCE in
comparison to SCE, RCE and CEE. The result showed that the value creation capability of Malaysian financial
firms was directly attributable to the HCE of the firms.
This study had some limitations that need to be acknowledged. First, this study did not control for firm-specific
variables such as firm-size, the level of risk, and firms’ complexity as suggested by the extant literature. Scholars
argued that knowledge creation, diffusion and storage were inherently evolutionary in nature, thus the degree to
which a firm developed its intellectual capital may be varied across the sample (Nawaz and Haniffa, 2017).
Second, there was a positive association between SCE and ROA, however this study did not classify structural
capital into innovation capital and process capital to gain a better insight into structural capital efficiency or which
of the two contributed more towards financial performance.
Some practical implications of the findings were identified in the context of the finance industry and the
education industry. The findings revealed that the finance industry should increase the intellectual capital
utilization in enhancing their financial performance. The findings also suggested that physical capital, human
capital, structural capital may induce financial performance, thus proper allocation of investment in these resources
was worth considering as the firms’ value creation capability were detected by the efficiency level of their
intellectual capital components.
As for the education industry, the findings of the study proved the existence of strong association between
intellectual capital and firms’ financial performance. Some components of intellectual capital such as human capital
and structural capital lead to higher firms’ profitability. Accordingly, the programs offered by education institutions
must reflect and adhere to the needs of the industry. The education institutions may collaborate with the industry
in order to increase the relevance of their educational mission and to stimulate new directions in the education
industry. The institutions play a vital role as a means of both, for the efficient transfer of knowledge and providing
training for skills required by the industry.
This study would like to make several recommendations for future research. First, future research may consider
incorporating firm-specific variables such as firm-size, the level of risk, and firms’ complexity as control variables as
suggested by the extant literature. Second, this study did not classify structural capital into innovation capital and
process capital. Perhaps, to gain a better insight into structural capital efficiency, it is recommended that the
components of structural capital (innovation capital and process capital) be separated and included in future
research.
Funding: This study received no specific financial support. Competing Interests: The authors declare that they have no competing interests. Acknowledgement: Both authors contributed equally to the conception and design of the study.
REFERENCES
Al-Musali, M.A.K. and I.K.N.I. Ku, 2014. Intellectual capital and its effect on financial performance of banks: Evidence from
Saudi Arabia. Procedia-Social and Behavioural Sciences, 164: 201-207.

Asian Economic and Financial Review, 2019, 9(7): 752-765
763
© 2019 AESS Publications. All Rights Reserved.
Andriesson, D., 2004. Making sense of intellectual capital : Designing a method for the valuation of intangibles. Burlington, MA:
Elsevier Butterworth-Heinemann.
Barney, J., 1991. Firm resources and sustained competitive advantage. Journal of Management, 17(1): 99-120.Available at:
https://doi.org/10.1177/014920639101700108.
Bontis, N., 1996. There’s a price on your head: Managing intellectual capital strategically . Business Quarterly Summer,, 60(4):
41-47.
Bontis, N., 1998. Intellectual capital: An exploratory study that develops measures and models. Management Decision, 36(2): 63-
76.Available at: https://doi.org/10.1108/00251749810204142.
Bontis, N., W. Chua Chong Keow and S. Richardson, 2000. Intellectual capital and business performance in Malaysian
industries. Journal of Intellectual Capital, 1(1): 85-100.Available at: https://doi.org/10.1108/14691930010324188.
Bontis, N., S. Janošević and V. Dženopoljac, 2015. Intellectual capital in Serbia’s hotel industry. International Journal of
Contemporary Hospitality Management, 27(6): 1365-1384.Available at: https://doi.org/10.1108/ijchm-12-2013-0541.
Chang, S.L., 2007. Valuing intellectual capital and firms’ performance: Modyfying value added intellectual coefficient (VAICTM)
in Taiwan IT industry. Doctoral of Business Administration, Golden Gate University. San Francisco, CA.
Chen, M.-C., S.-J. Cheng and Y. Hwang, 2005. An empirical investigation of the relationship between intellectual capital and
firms’ market value and financial performance. Journal of Intellectual Capital, 6(2): 159-176.Available at:
https://doi.org/10.1108/14691930510592771.
Edvinsson, L. and M.S. Malone, 1997. Intellectual capital: Realizing your company’s true value by finding its hidden brainpower.
New York: HarperCollins Publishers.
Fadhlin, A., C. Chai, Khairul and Tan, 2004. An overview on the growth and development of the Malaysian construction
Industry. Workshop on the Construction Contract Mgt, Universiti Teknologi Malaysia.
Firer, S. and W.S. Mitchell, 2003. Intellectual capital and traditional measures of corporate performance. Journal of Intellectual
Capital, 4(3): 348-360.Available at: https://doi.org/10.1108/14691930310487806.
Goh, P.K., 2005. Intellectual capital performance of commercial banks in Malaysia. Journal of Intellectual Capital, 6(3): 385-
396.Available at: https://doi.org/10.1108/14691930510611120.
Hamidreza, J. and A.R. Ruzita, 2013. Extended value added intellectual coefficient in advanced and low technology mnufacturing
companies in Malaysia. International Journal of Finance and Economics Studies, 2(7): 65-82.
Joshi, M., D. Cahill and J. Sidhu, 2010. Intellectual capital performance in the banking sector: An assessment of Australian
owned banks. Journal of Human Resource Costing & Accounting, 14(2): 151-170.Available at:
https://doi.org/10.1108/14013381011062649.
Joshi, M., D. Cahill, J. Sidhu and M. Kansal, 2013. Intellectual capital and financial performance: an evaluation of the Australian
financial sector. Journal of Intellectual Capital, 14(2): 264-285.Available at:
https://doi.org/10.1108/14691931311323887.
Kamath, B.G., 2007. The intellectual capital performance of the Indian banking sector. Journal of Intellectual Capital, 8(1): 96-
123.Available at: https://doi.org/10.1108/14691930710715088.
Kamath, B.G., 2008. Intellectual capital and corporate performance in Indian pharmaceutical industry. Journal of Intellectual
Capital, 9(4): 684-704.Available at: https://doi.org/10.1108/14691930810913221.
Khan, M.S., F. Yasser and T. Hussain, 2015. Intellectual capital and financial performance: An evaluation of islamic banks.
Islamic Banking and Finance Review, 2(1): 59-75.
Kristandl, G. and N. Bontis, 2007. Constructing a definition for intangibles using the resource based view of the firm.
Management Decision, 45(9): 1510-1524.Available at: https://doi.org/10.1108/00251740710828744.
Ku Ismail, K.N.I. and M. Abdul Karim, 2011. Intellectual capital and financial performance of banks in Bahrain. Journal of
Business Management and Accounting, 1(1): 63-77.
Laing, G., J. Dunn and S. Hughes-Lucas, 2010. Applying the VAIC™ model to Australian hotels. Journal of Intellectual Ccapital,
11(3): 269-283.Available at: https://doi.org/10.1108/14691931011064545.

Asian Economic and Financial Review, 2019, 9(7): 752-765
764
© 2019 AESS Publications. All Rights Reserved.
Maditinos, D., D. Chatzoudes, C. Tsairidis and G. Theriou, 2011. The impact of intellectual capital on firms' market value and
financial performance. Journal of Intellectual Capital, 12(1): 132-151.Available at:
https://doi.org/10.1108/14691931111097944.
Marr, B., 2007. What is intellectual capital? In Joia, L.A. (Ed.), Strategies for information technology and intellectual capital:
challenges and opportunities. Hershey, PA: Idea Group Publishing. pp: 1-9.
Marr, B., D. Gray and A. Neely, 2003. Why do firms measure their intellectual capital? Journal of Intellectual Capital, 4(4): 441-
464.Available at: https://doi.org/10.1108/14691930310504509.
Mehralian, G., A. Rajabzadeh, M. Reza Sadeh and H. Reza Rasekh, 2012. Intellectual capital and corporate performance in
Iranian pharmaceutical industry. Journal of Intellectual Capital, 13(1): 138-158.Available at:
https://doi.org/10.1108/14691931211196259.
Mention, A.-L. and N. Bontis, 2013. Intellectual capital and performance within the banking sector of Luxembourg and Belgium.
Journal of Intellectual Capital, 14(2): 286-309.Available at: https://doi.org/10.1108/14691931311323896.
Mosavi, S.A., S. Nekoueizadeh and M. Ghaedi, 2012. A study of relations between intellectual capital components, market value
and finance performance. African Journal of Business Management, 6(4): 1396-1403.Available at:
https://doi.org/10.5897/ajbm11.1466.
Muhammad, N.M.N. and M.K.A. Ismail, 2009. Intellectual capital efficiency and firm’s performance: Study on Malaysian
financial sectors. International Journal of Economics and Finance, 1(2): 206-212.Available at:
https://doi.org/10.5539/ijef.v1n2p206.
Nawaz, T. and R. Haniffa, 2017. Determinants of financial performance of islamic banks: An intellectual capital perspective.
Journal of Islamic Accounting and Business Research, 8(2): 130-142.Available at: https://doi.org/10.1108/jiabr-06-
2016-0071.
Nazari, J.A. and I.M. Herremans, 2007. Extended VAIC model measuring intellectual capital components. Journal of Intellectual
Capital, 8(4): 595-609.Available at: http://dx.doi.org/10.1108/14691930710830774.
Nimtrakoon, S., 2015. The relationship between intellectual capital, firms’ market value and financial performance: Empirical
evidence from the ASEAN. Journal of Intellectual Capital, 16(3): 587-618.Available at: https://doi.org/10.1108/jic-09-
2014-0104.
Pew, T.H., D. Plowman and P. Hancock, 2007. Intellectual capital and financial returns of companies. Journal of Intellectual
Capital, 8(1): 76-95.Available at: https://doi.org/10.1108/14691930710715079.
Pulic, A., 1998. Measuring the performance of intellectual potential in knowledge economy. (Presented in 1998 at the 2nd
McMaster World Congress on Measuring and Managing Intellectual Capital by the Austrian Team for Intellectual
Potential).
Riahi-Belkaoui, A., 2002. Intellectual capital and firm performance of U.S Multinational firms: A study of the resource-based and
stakeholder views. Available from http://dx.doi.org/10.2139/ssrn.365580.
Roos, G. and J. Roos, 1997. Measuring your company's intellectual performance. Long Range Planning, 30(3): 413-426.Available
at: https://doi.org/10.1016/s0024-6301(97)00022-8.
Scafarto, V., F. Ricci and F. Scafarto, 2016. Intellectual capital and firm performance in the global agribusiness industry: The
moderating role of human capital. Journal of Intellectual Capital, 17(3): 530-552.Available at:
https://doi.org/10.1108/jic-11-2015-0096.
Sharabati, A.-A.A., S. Naji Jawad and N. Bontis, 2010. Intellectual capital and business performance in the pharmaceutical sector
of Jordan. Management Decision, 48(1): 105-131.Available at: https://doi.org/10.1108/00251741011014481.
Stewart, T.A., 1997. Intellectual capital: The new wealth of organizations. New York: Currency Doubleday.
Sveiby, K.E., 1997. The new organisational wealth – managing and measuring knowledge-based assets. San Francisco, CA:
Berrett-Koehler.
Sydler, R., S. Haefliger and R. Pruksa, 2014. Measuring intellectual capital with financial figures: Can we predict firm
profitability? European Management Journal, 32(2): 244-259.Available at: https://doi.org/10.1016/j.emj.2013.01.008.

Asian Economic and Financial Review, 2019, 9(7): 752-765
765
© 2019 AESS Publications. All Rights Reserved.
Ting, I.W.K. and H.H. Lean, 2009. Intellectual capital performance of financial institutions in Malaysia. Journal of Intellectual
Capital, 10(4): 588-599.Available at: https://doi.org/10.1108/14691930910996661.
Ulum, I., I. Ghozali and A. Purwanto, 2014. Intellectual capital performance of Indonesian banking sector: A modified VAIC (M-
VAIC) perspective. International Journal of Finance & Accounting, 6(2): 103-123.Available at:
https://doi.org/10.5296/ajfa.v6i2.5246.
Ulum, I., Rizqiyah and A.W. Jati, 2016. Intellectual capital performance: A comparative study between financial and non-
financial industry of Indonesia biggest firms. International Journal of Economics and Financial Issues, 6(4): 1436-1439.
Volkov, A., 2012. Value added intellectual co-efficient (VAIC (TM)): A selective thematic-bibliography. Journal of New Business
Ideas & Trends, 10(1): 14-24.
Wang, J.C., 2008. Investigating market value and intellectual capital for S&P 500. Journal of Intellectual Capital, 9(4): 546-
563.Available at: http://dx.doi.org/10.2208/14691930810913159.
Youndt, M.A., M. Subramaniam and S.A. Snell, 2004. Intellectual capital profiles: An examination of investments and returns.
Journal of Management studies, 41(2): 335-361.Available at: https://doi.org/10.1111/j.1467-6486.2004.00435.x.
Views and opinions expressed in this article are the views and opinions of the author(s), Asian Economic and Financial Review shall not be responsible or answerable for any loss, damage or liability etc. caused in relation to/arising out of the use of the content.