Embed Size (px)
Citation preview
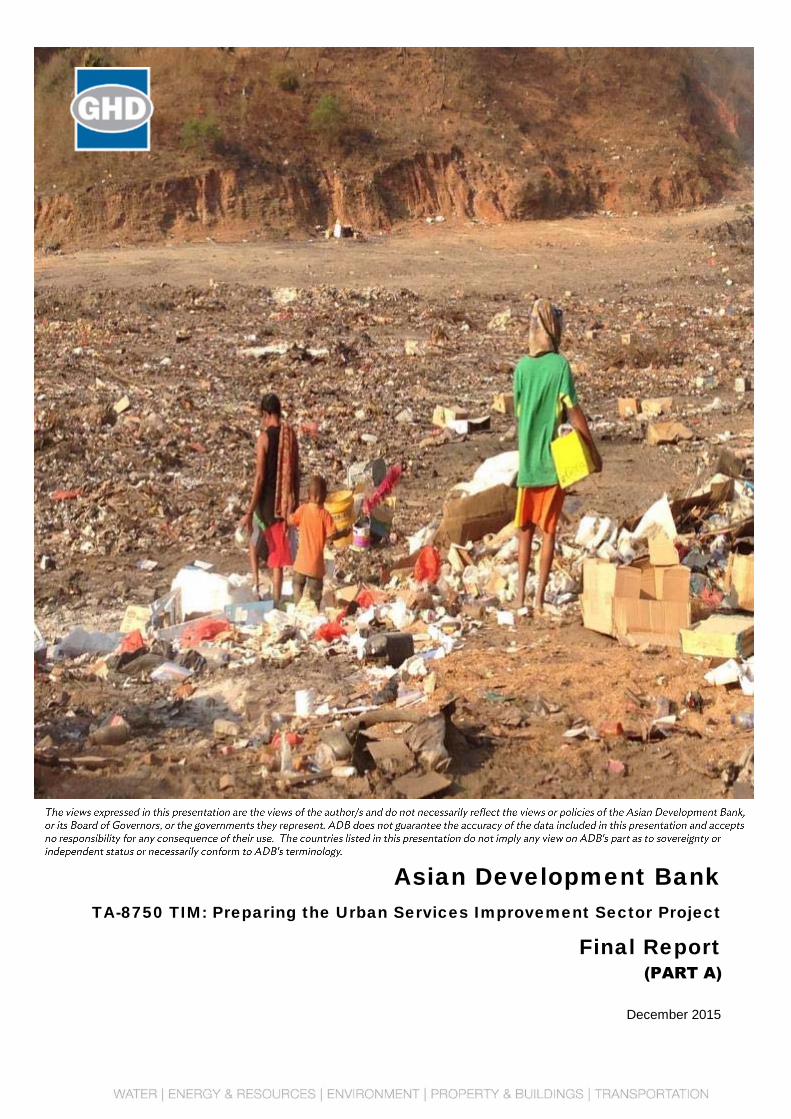
Asian Development Bank TA-8750 TIM: Preparing the Urban Services Improvement Sector Project
Final Report
December 2015
(PART A)
GHD | Report for Asian Development Bank – TA-8750 TIM: Preparing the Urban Services Improvement Sector Project, 5510101 | i
Table of contents 1. Executive Summary ....................................................................................................................... 1
2. Introduction..................................................................................................................................... 6
2.1 Background .......................................................................................................................... 6
2.2 Reports and deliverables ..................................................................................................... 6
3. Background .................................................................................................................................... 8
3.1 Introduction .......................................................................................................................... 8
3.2 Overview of Solid Waste Management in Dili ...................................................................... 8
3.3 Legislative Environment ....................................................................................................... 9
3.4 Institutional Environment ................................................................................................... 10
3.5 Previous Studies and Investigations .................................................................................. 10
3.6 Plasma Arc Gasification Plant ........................................................................................... 11
3.7 Current Project ................................................................................................................... 12
4. Waste Audits and Load Determination ........................................................................................ 14
4.1 Introduction ........................................................................................................................ 14
4.2 Previous Audit (2014) ........................................................................................................ 14
4.3 Project Audit 2015 .............................................................................................................. 17
4.4 Volume Determinations...................................................................................................... 18
4.5 Density Determinations ...................................................................................................... 18
4.6 Mass Loads ........................................................................................................................ 18
4.7 Waste Components ........................................................................................................... 19
4.8 Comparison with other Waste Audits ................................................................................. 25
5. Population Projections and Waste Generation ............................................................................ 27
5.1 Background ........................................................................................................................ 27
5.2 Waste Generation Allowance ............................................................................................ 27
5.3 Collection Allowances ........................................................................................................ 29
5.4 Recycling Allowances ........................................................................................................ 29
5.5 Compaction Allowance ...................................................................................................... 30
5.6 Soil Cover Allowance ......................................................................................................... 30
5.7 Waste settlement ............................................................................................................... 31
5.8 Airspace Consumption ....................................................................................................... 31
6. Waste Bins and Containers.......................................................................................................... 36
6.1 Current System .................................................................................................................. 36
6.2 Possible Waste and Recyclables Collection Options ........................................................ 36
6.3 Overview Concept for Waste Containers........................................................................... 37
6.4 Time Frames ...................................................................................................................... 38
6.5 Near Term .......................................................................................................................... 39
6.6 Medium Term ..................................................................................................................... 43
6.7 Long Term .......................................................................................................................... 43
ii | GHD | Report for Asian Development Bank – TA-8750 TIM: Preparing the Urban Services Improvement Sector Project, 5510101
7. Waste Minimisation ...................................................................................................................... 45
7.1 Introduction ........................................................................................................................ 45
7.2 Background ........................................................................................................................ 45
7.3 Integrated Resource Recovery (IRR) ................................................................................ 46
7.4 Waste Pricing ..................................................................................................................... 46
7.5 Legislation .......................................................................................................................... 46
7.6 User Pays Domestic Waste ............................................................................................... 47
7.7 Education ........................................................................................................................... 47
8. Minimising Plastic Bags and Bottles ............................................................................................ 49
8.1 Introduction ........................................................................................................................ 49
8.2 Plastic bags ........................................................................................................................ 49
8.3 PET Bottles ........................................................................................................................ 50
9. Recycling ...................................................................................................................................... 54
9.1 Introduction ........................................................................................................................ 54
9.2 Current Recyclers .............................................................................................................. 54
9.3 Indicative Rates for Recyclable Materials .......................................................................... 57
9.4 Specific Waste Components .............................................................................................. 58
9.5 Primary Recycling Candidate Materials and Options ........................................................ 60
9.6 Options to target Green Waste .......................................................................................... 62
9.7 Recycling Competing Priorities .......................................................................................... 64
9.8 Second Tier Options for Future Recycling ......................................................................... 64
10. Waste Collection .......................................................................................................................... 66
10.1 Introduction and background ............................................................................................. 66
10.2 Initial Collection Improvement Option – Street Sweeper Staff .......................................... 66
10.3 Overview of Near to Medium Term Collection Options ..................................................... 67
10.4 Green Waste Kerbside chipping ........................................................................................ 70
10.5 Fully mechanised compactor trucks and tricycles ............................................................. 70
10.6 Partly mechanised open trucks and motorcycles. ............................................................. 72
10.7 Generation rates and service levels 2018 ......................................................................... 73
10.8 Steel Skips Collection – 2018 Option 1 ............................................................................. 73
10.9 Wheelie bin (Door to door) collection model – 2018 Option 2 ........................................... 74
10.10 Steel Skips collection model – 2023 Option 1 ................................................................... 75
10.11 Wheelie bin collection model – 2023 Option 2 .................................................................. 75
10.12 Additional Collection Facilities In 2028 .............................................................................. 76
10.13 Vacuum Broom Trucks – Pilot Trial ................................................................................... 78
10.14 Summary ............................................................................................................................ 81
11. Waste Processing and Disposal Due Diligence ........................................................................... 83
11.1 Background ........................................................................................................................ 83
11.2 Incineration ........................................................................................................................ 83
11.3 Pit Burners ......................................................................................................................... 83
11.4 Baling ................................................................................................................................. 84
GHD | Report for Asian Development Bank – TA-8750 TIM: Preparing the Urban Services Improvement Sector Project, 5510101 | iii
11.5 Composting ........................................................................................................................ 84
11.6 “Zero Waste” Integrated Approach .................................................................................... 89
11.7 Summary ............................................................................................................................ 90
12. Waste to Energy ........................................................................................................................... 91
12.1 Introduction ........................................................................................................................ 91
12.2 Plasma Arc Gasification Plant ........................................................................................... 92
12.3 Fuel Sources & Competing Priorities ................................................................................. 92
12.4 Municipal Solid Waste as Feedstock ................................................................................. 93
12.5 Performance and Suitability ............................................................................................... 94
13. Review of Tibar Disposal Site ...................................................................................................... 95
13.1 Background ........................................................................................................................ 95
13.2 Access Roads .................................................................................................................... 96
13.3 Current Site Operation ....................................................................................................... 96
13.4 Soils Profiles and Hydrogeology ........................................................................................ 97
13.5 Local Socio-Environmental Factors ................................................................................. 104
14. Remediation of Existing Tibar Dumping Site ............................................................................. 105
14.1 Background ...................................................................................................................... 105
14.2 Remediation Priorities ...................................................................................................... 107
14.3 Contemporary Waste Management ................................................................................. 107
14.4 Inert Waste ....................................................................................................................... 108
14.5 Parallel Operating Period ................................................................................................. 109
15. Landfill Development Due Diligence .......................................................................................... 111
15.1 Site Selection ................................................................................................................... 111
15.2 Standard for Disposal Facility .......................................................................................... 112
15.3 Landfill Configuration ....................................................................................................... 114
15.4 Appurtenant Facilities and Equipment ............................................................................. 117
15.5 Operational Protocols ...................................................................................................... 120
15.6 Summary .......................................................................................................................... 121
16. Leachate Management .............................................................................................................. 123
16.1 Stormwater Management ................................................................................................ 123
16.2 Overview of Leachate Management Strategy ................................................................. 123
16.3 Rainfall and Evaporation .................................................................................................. 125
16.4 Leachate Water Balance ................................................................................................. 126
16.5 Leachate Design Flowrate ............................................................................................... 128
16.6 Need for Leachate Treatment .......................................................................................... 129
17. Leachate Treatment Plant Option .............................................................................................. 131
17.1 Leachate Characteristics ................................................................................................. 131
17.2 Process Selection ............................................................................................................ 132
17.3 Equalization Lagoon ........................................................................................................ 132
17.4 Chemical Dosing .............................................................................................................. 133
iv | GHD | Report for Asian Development Bank – TA-8750 TIM: Preparing the Urban Services Improvement Sector Project, 5510101
17.5 Attached Media Anaerobic Treatment ............................................................................. 133
17.6 Aerated Lagoon ............................................................................................................... 134
17.7 Clarification ...................................................................................................................... 134
17.8 Maturation Ponds ............................................................................................................. 135
17.9 Other Parameters ............................................................................................................ 135
18. Landfill Gas Options ................................................................................................................... 137
18.1 Background ...................................................................................................................... 137
18.2 Gas Generation Rates ..................................................................................................... 138
18.3 Landfill Gas Safety Issues ............................................................................................... 138
18.4 Passive Release .............................................................................................................. 139
18.5 Passive Release with Local Gas Blanket Interceptors .................................................... 140
18.6 Active Collection/Local Gas Blanket Interceptors/ Burners ............................................. 141
18.7 Active Collection/Deep Wells/Utilisation of Energy .......................................................... 142
18.8 Gas Utilisation Economics ............................................................................................... 143
19. Management of Specific Waste Types ...................................................................................... 145
19.1 Summary of Waste Categories ........................................................................................ 145
19.2 Acceptable Wastes (General) .......................................................................................... 145
19.3 Difficult Wastes (but always Acceptable) ......................................................................... 145
19.4 Special Wastes (sometimes Acceptable) ........................................................................ 146
19.5 Prohibited Wastes ............................................................................................................ 146
19.6 Pathogenic and Medical Waste ....................................................................................... 146
19.7 Household Hazardous Waste .......................................................................................... 148
20. Climate Change Issues .............................................................................................................. 149
21. Septage Treatment and Management Options .......................................................................... 150
21.1 Background ...................................................................................................................... 150
21.2 Background to Septage Characteristics .......................................................................... 151
21.3 Management Options....................................................................................................... 151
21.4 Land Application .............................................................................................................. 151
21.5 Co-disposal with Solid Waste .......................................................................................... 152
21.6 Specialised Composting Operations ................................................................................ 152
21.7 Centralised Septage Treatment Plant (SpTP) ................................................................. 153
21.8 Septage Treatment and Disposal Options Comparison .................................................. 153
GHD | Report for Asian Development Bank – TA-8750 TIM: Preparing the Urban Services Improvement Sector Project, 5510101 | v
Table index Table 4.1 – Results Categories from Domestic Waste Audit (2014) ...................................................... 16
Table 4.2 – Waste Audit Results (2015) ................................................................................................ 19
Table 5-1– Waste Generation rates by Income Band ............................................................................ 28
Table 5-2 – Waste Generation Rates by Region ................................................................................... 28
Table 5-3 – Population and Waste Generation Rate Projections Summary .......................................... 32
Table 5-4 – Population and Waste Generation Rate Projections – With Greenwaste
Recycling ........................................................................................................................... 33
Table 5-5 – Population and Waste Generation Rate Projections – Without Greenwaste
Recycling ........................................................................................................................... 34
Table 5-6 – Population and Waste Generation Rate Projections – Ultimate Site Development ........... 35
Table 9-1 – Summary of Recyclers in Dili in 2015 ................................................................................. 57
Table 10-1 – Options for Waste & Recyclables Collection .................................................................... 78
Table 12-1 – Estimates of Power Plant Capital and Operating Costs (2010) ........................................ 91
Table 13-1 – Indicative Soil Profile in Lower Grassed Area ................................................................... 99
Table 13-2 – Indicative Soil Profile in the Three Upper Areas ............................................................. 100
Table 13-3 – Summary of Soil Profiles ................................................................................................. 102
Table 15-1 – Controlled Dump and Landfill Options ............................................................................ 113
Table 15-2 – Landfill Staging ................................................................................................................ 116
Table 15-3 – Operations Manual Table of Contents ToC .................................................................... 120
Table 15-4 – Environmental Monitoring and Management Plan ToC .................................................. 120
Table 17-1 – Leachate Characteristics for Design ............................................................................... 131
Table 18-1 – Gas Blanket Options ....................................................................................................... 140
Table 21.1 – Average chemical and physical properties of septage .................................................... 151
Figure index No table of figures entries found.
vi | GHD | Report for Asian Development Bank – TA-8750 TIM: Preparing the Urban Services Improvement Sector Project, 5510101
Appendices Appendix A – Terms of Reference Appendix B – Waste Minimisation Appendix C – Existing Waste Collection Contracts Appendix D – Soils Monitoring Results Appendix E – Landfill Development Plans Appendix F – Organizational Charts and Ministry Responsibilities Appendix G – Hygiene Urban Policy and Urban Waste Management Appendix H – HouseHold Survey Questionnaire Appendix I – Finance Management Annexes Appendix J – Performance Monitoring Measures for Solid Waste Collection Operations Appendix K – Performance Monitoring Measures for Solid Waste Landfill Operations Appendix L – Initial Environmental Examination Appendix M – DNSA Groundwater testing Appendix N – Waste Authority Staff Terms of Reference Appendix O – Inception Report Workshop Presentation Appendix P – Invitee and Attendance List from Inception Report Workshop Appendix Q – Interim Report Workshop Presentation Appendix R – Invitee and Attendance List from Interim Report Workshop Appendix S – Interim Report Costings Appendix T – Final Costing Spreadsheets Appendix U – Glossary of Terms
GHD | Report for Asian Development Bank – TA-8750 TIM: Preparing the Urban Services Improvement Sector Project, 5510101 | vii
ABBREVIATIONS
ADB : Asian Development Bank
BCC : Behaviour Change Communication
BOQ : Bill of Quantity
CHS : Community Health Services
CSO : Civil Society Organisation
DDA : Dili District Administration
DED : Detailed Engineering Design
DNMA : Diresaun Nasional Meu-Ambiental
EIA : Environmental impact assessment
EMP : Environmental Management Plan
GCL : Geosynthetic Clay Liner
Govt : Government
IA : Implementing Agency
IEC : Information Education Communication
IEE : Initial Environmental Examination
MinICE : Ministry of Industry, Commerce and Environment
MOE : Ministry of Education
MOH : Ministry of Health
MWM : Medical Waste Management
NDLA : National Directorate of Local Administration
NDSB : National Directorate for Basic Sanitation Services
NGOs : Non- Government Organization
OPC : Output-and Performance-Based Contracts
PMO : Project Management Office
PPP : Public-Private Partnership
SPS : Safeguards Policy Statement
SpTP : Septage Treatment Plant
SWM : Solid Waste Management
WACS : Waste Assessment and Characterization Survey
WATSAN : Water and Sanitation
WSP : Water and Sanitation Program
viii | GHD | Report for Asian Development Bank – TA-8750 TIM: Preparing the Urban Services Improvement Sector Project, 5510101
Disclaimer This Report has been prepared by GHD Pty Ltd for ADB and may only be used and relied on by ADB for the purpose agreed between GHD and ADB as set out in Contract Number 115737-S52506 between ADB and GHD Pty Ltd. GHD Pty Ltd otherwise disclaims responsibility to any person other than ADB arising in connection with this Report. The services undertaken by GHD Pty Ltd in connection with preparing this Report were limited to those specifically detailed in the Report and are subject to the scope limitations set out in Contract Number 115737-S52506. The opinions, conclusions and any recommendations in this Report are based on information/comments provided by ADB as well as stakeholders in this project and information reviewed at the date of field visits and report preparation. GHD Pty Ltd has no responsibility or obligation to update this Report to account for events or changes occurring subsequent to the date that the Report was prepared.
GHD | Report for Asian Development Bank – TA-8750 TIM: Preparing the Urban Services Improvement Sector Project, 5510101 | 1
1. Executive Summary Background
GHD was commissioned by the Asian Development Bank in January 2015 to undertake The Dili
Urban Services Improvement Sector Project Technical Assistance (TA 8750 –TIM).
The purpose of the technical assistance (TA) is to develop an investment strategy to meet the
water supply and Solid Waste Management (SWM) needs of Dili’s population over the period
2015-2030 in line with national development targets. The investment strategies are to identify a
range of appropriate options that are affordable, and that can be operated and maintained in a
sustainable manner, based on a comprehensive and participatory assessment of the urban
water supply and solid waste situation in Dili.
The Consultant is working closely with individual consultants recruited separately to prepare a
preliminary design and costings for water supply improvements for Dili, and to design
organizational arrangements for project implementation. These water supply reports have been
submitted separately but are:
Inception Report – March 2015
Interim Report – June 2015
Final Report – September 2015
An agreement was developed by the GoTL during the course of this TA with a Korean company
to provide a plasma plant to manage solid waste at Tibar. The contract is confidential so only
limited details are available. However the plant would reportedly take all of Dili’s waste and
incinerate it at very high temperatures, while also generating some electricity. The contractor
will reportedly also provide some new collection vehicles but details are unavailable. Therefore
the GoTL would not be seeking a loan supporting improved solid waste management at this
time, but it has been agreed to still complete this TA and provide documentation for an
alternative SWM approach if required in the near term.
Current Situation and Status (Collections, 3Rs)
Dili’s urban population has accelerated rapidly over the last two decades. Its current population
is in the order of 300,000 persons. An urban master plan for Dili is currently being prepared by
JICA. This document presents a number of possible growth scenarios, but rates approaching
5% would not be unexpected.
At present, community based collections services are provided for the residents in Dili. This is
provided via approximately 200 community dumping pits located throughout the city and
serviced by up to 40 hired vehicles, 20 government vehicles and approximately 20 private
sector vehicles serving institutions.
A comprehensive waste audit concluded that there are on approximately 115 vehicle
movements a day to and from the Tibar dumping site, each hauling 1.05 tonnes on average,
making some 120 tonnes of waste a day being hauled to the site.
In general, most of the higher value recyclables are already being recovered or reused prior to
disposal, resulting in very low levels remaining in the waste stream. This includes materials
such as iron, but especially aluminium and copper.
Proposed Collection Upgrades
Options for improving collection efficiency and expanding recycling efficacy include providing
skip bins which would receive residual waste only. These would be co-located with the existing
concrete bunkers and mechanically elevated into waste compactor trucks which could haul up
2 | GHD | Report for Asian Development Bank – TA-8750 TIM: Preparing the Urban Services Improvement Sector Project, 5510101
to 10 times the mass of the current trucks, thereby greatly reducing both traffic and
environmental impacts.
The concrete bunkers (both existing an additional ones provided under this project) could then
be used solely for greenwaste, which is the biggest single component of the waste stream at
33% by mass. Keeping the greenwaste separate from other wastes would mean that it could be
more readily reused or recycled.
Given that there is a significant proportion of narrow streets and other hard to access areas, a
combination of large and small compactor trucks will be required. For these options, a mix of 28
cubic metre and eight cubic metre compaction trucks were investigated, supplemented by small
tricycles for the very hard to access areas.
Mobile chippers are proposed to allow greenwaste from the existing concrete pits to be
shredded on site for more efficient transport. The chipped greenwaste will occupy less than
10% of the bulky unchipped material.
Review of Existing Tibar Dumpsite
The existing disposal site at Tibar has been operating for more than 20 years. Whilst the
operation is far from satisfactory, the ministries are to be congratulated as it is better run than
many of the dumping sites in Southeast Asia and the Pacific. However the existing dumpsite
will still require remediation prior to commissioning the new landfill. The main issue will be
extinguishing the burning waste by excavating all burning or smoking waste, wetting it, allowing
it to cool and then stockpiling. The very old waste would be essentially inert and some could be
utilized as a daily cover material supplement rather than incorporated directly into the landfill
consuming vital airspace.
It is likely that an artificial liner will be required, such as a geo-synthetic clay liner, and therefore
the active waste already deposited on site will be placed on top of this liner immediately after it
has been installed, which is a requirement for this type of liner to ensure that the bentonite
therein activates correctly.
Proposed Landfill
A controlled landfill would include interventions such as a contoured base, artificial liner such as
GCL, leachate interception pipes., stormwater diversion drainage networks, leachate pumping
station, opportunities to reuse leachate either through re-injection or irrigation of external batters
during the dry season, landfill gas collection systems, programmed cell staging, waste
compaction, profiling and application of suitable daily, intermediate and final cover material. A
range of treatment and disposal options were reviewed and a Controlled Landfill is considered
the best option.
The Tibar site has a total area of some 25 hectares, including some 12 hectares of the central
flatter area. The first five year stage would require an area approximately 200 metres square
whereas the 15 year life would require approximately eight hectares reaching a height of some
30 m. The total site capacity utilising the central flat area is some 20 years. If waste was to be
placed in the artificial valley formed between the central waste mound and the surrounding hills,
the total site has sufficient capacity to accept waste until the next century.
The soil on the site and surrounding mountains is generally suitable for cover material and could
be excavated and stockpiled during landfill formation.
There are many options for landfill gas management. Investigations indicate the waste
quantities are too small to generate commercial quantities of landfill gas to support energy
production, especially as greenwaste is to be diverted. However, gas will be collected and
flared, to avoid methane going directly to the atmosphere through a passive release system.
GHD | Report for Asian Development Bank – TA-8750 TIM: Preparing the Urban Services Improvement Sector Project, 5510101 | 3
Institutional Aspects
The government institutions involved with SWM have been reviewed. Responsibilities are
fragmented through many ministries at present, however there are plans for a National Solid
Waste Commission to provide an umbrella organization. Furthermore the General Urban
Department has recently been established to coordinate SWM activities and prepare SWM
plans throughout Timor Leste. Within the current organizations there are few skills and
experience in Solid Waste Management apart from running the privatized waste collection
contracts.
The solid waste sector is under the Ministry of State Administration (Estatal) and the line agency
is the Dili District Administration of the Municipalities Division of Estatal. This agency is
responsible for the physical activities of O&M in their respective sectors, but budgeting,
revenue, other financial matters, and capital financing are centralised under respective
Ministerial Divisions of finance and administration.
Household Survey and Focus Groups
The HH survey was generally representative of the population as a whole, with a larger
percentage of Female Headed Households surveyed than are found in the general population.
The average HH size was 7.8 persons per HH, with the average age of HH heads around 49
years. The largest percentage of HHs (29%) reported incomes of between USD 121 –
220/month, with 22% of FHH reporting incomes of under USD 60/month. These figures point to
significant poverty levels within Dili.
Almost half (45%) of those surveyed disposed of their garbage in the bunkers provided by the
City. Another 32% burned their rubbish, with the remaining HHs burying or throwing the rubbish
in drains, river, outside. A small percentage (3%) had a door-to-door service. Young males and
young females (not children) are primarily responsible for disposing of rubbish i.e. carrying the
garbage to the bunker.
When asked about the project design based on a three bin system, 94% of HHs said they would
separate their waste as the system required. Almost all (98%) of HHs agreed with contracting
private sector companies to deliver the required service in solid waste disposal.
The Willingness to Pay for the Proposed 3 Bin System responses were almost evenly split with
51% of HHs replying in the affirmative and 49% replying in the negative.
Behaviours and Communications Strategy
The core solid waste communications strategy is through (i) a series of professional emotive
television spots using prominent Timorese personalities to change attitudes and social norms
about what is un/acceptable behaviour (ii) community outreach to suco leaders and residents in
aldeias to inform and demonstrate recycling and waste minimization; (iii) school-based activities
including talks, demonstrations, games, and information which supports the proposed new
primary curriculum, and research needs of secondary school students.
Initial Environmental Examination
This IEE was prepared following the ADB Safeguards Policy Statement of 2009, and the 2003
ADB Environmental Assessment Guidelines.
The redesign and rehabilitation of the Tibar landfill, followed by the management practices for
operations set out in this IEE and in the Feasibility Study and Due Diligence Report will result in
improved air, water and noise environment quality and community safety at the landfill site and
surrounding areas. Changes to collection and haulage practices will have benefits in improving
the quality of life and urban amenity.
4 | GHD | Report for Asian Development Bank – TA-8750 TIM: Preparing the Urban Services Improvement Sector Project, 5510101
The majority of identified environmental impacts are not assessed as significant, and the
construction management safeguards and operational regimes will address the range of
potential environmental impacts identified and will be actioned through the Project EMP and
continuously checked in the environmental monitoring program.
Environmental improvement of the landfill site, its management and garbage haulage will make
direct and significant improvements to the community living in the vicinity of the site and along
the approach road in Tibar. The population of direct beneficiaries in Tibar is estimated at up to
400 people in 75-80 households.
Leachate will be intercepted by an artificial liner and directed though a series of pipes to a
pumping station from where it will either be irrigated or reinjected, and not discharged from the
site. Landfill gas will be generated from the biochemical degradation within the landfill.
Methane gas will be collected in vertical wells and piped to specialised gas flaring equipment.
The IEE includes an EMP where the identified environmental impacts and mitigation measures
are transformed into an action plan for their implementation. The provisions of the EMP will be
incorporated into tender documents and construction contracts.
Procurement
The procurement capacity of Estatal was not assessed as part of the scope of the Country and
Sector Procurement Assessment project, and therefore a PCA was conducted into its
procurement capacities to identify the strengths and weaknesses of the agency to design and
manage the procurement of goods, works and consulting services. The overall risk rating for
Estatal is ‘average’ to ‘high’. However, if the procurements are above a specified threshold, it
will be managed by the National Procurement Commission (NPC), in which case the risk rating
associated with that agency will apply; i.e. ‘average’. The applicable thresholds are: works –
UD$ 1 million; goods – US$ 250,000; consultants – US$ 200,000.
A range of procurement and contracting models were reviewed, including Traditional
Procurement Model, EPC Contract, Output- and Performance-Based Contracts, and Public-
Private Partnership. The traditional model is being used at present for part of the collection
services. The existing waste collection contracts have been reviewed and are very basic
documents specifying payment, delivery times and number of loads per day without any
performance criteria. A performance based contract would be appropriate for the collection
services in the future, most likely utilizing modern fleet equipment purchased through the ADB
loan. Possible clauses for the performance based elements are provided in the report and
appendices.
The private sector is generally reluctant to put its capital at risk in infrastructure projects unless
risks are covered. The solid waste sector in Timor Leste is regarded as risky and it would mean
that the PPP models such as concessions or divestitures involving deep commitment would only
be attractive if the opportunity held out the promise of a high rate of return on capital.
Options such as leases and management contracts are more appropriate in the circumstances.
Management contracts and leases can result in improvements in operating efficiency and
performance. They do, however, have disadvantages compared to concessions and Build-
Operate-Transfer models. The improvements they achieve may not endure beyond the expiry
of the contract.
It follows that a management contract is a simpler and more flexible instrument. It avoids the
long-term commitment and risks of a lease. However, a lease may provide a private party with
more room to pursue improvements. At the stage of development of Dili’s sanitation sector, a
management contract is perhaps a more appropriate PPP model.
GHD | Report for Asian Development Bank – TA-8750 TIM: Preparing the Urban Services Improvement Sector Project, 5510101 | 5
Finance and Economics
The urban solid waste sector charges no user fees and collects no revenue from households or
businesses in Dili. Both the solid waste and water supply sectors are entirely dependent on
Government appropriations to meet their costs.
The solid waste sector has not undertaken a major investment project in recent years, and
Estatal staff lack skills in project management or capital finance administration.
The financial management assessment chapter contains country-level and project-level financial
risk assessments, as well as the key findings from responses to the financial management
assessment questionnaire recently completed with the cooperation of the relevant Ministries.
In specifying economic costs in relation to the financial costs of the project, applicable rates
covering taxes on imported goods, on domestic sales of imported goods, excise taxes on
petroleum products, and other items specifically covered in the 2008 Tax Law1 have been
applied.
The economic analysis incorporates additional capital expenditure incurred over the 27-year life
of the project (to 2045) for waste collection and processing equipment as needed to handle
rising waste generation in the city as population grows. Estimates of operating costs with-
project, for collections/ processing and for landfill operations, are based on the waste volumes
and the equipment and personnel employed to handle them.
The estimated financial costs of the project (i.e., tax inclusive, and with market rates for local
labour), in accordance with the proposed implementation schedule, were developed and totalled
$21.43M. A physical contingency of 10% of Base Costs is included in project costs. A price
contingency is calculated based on an inflation rate of 5.4% per annum on local costs and 1.5%
on foreign costs. An estimate of Financing Charges During Implementation is not included in
project costs, as financing arrangements for the project have not, under present circumstances,
been determined.
In the economic analysis, taxes and duties including fuel excise taxes have been removed from
investment and operational costs and unskilled labour in the local cost component has been
shadow-priced. The quantifiable and non-quantifiable benefits are also described.
Applying the assumptions and parameters outlined above, the project EIRR of quantifiable
benefits is 14.1% with an ENPV of $1.68 million. The quantifiable benefits result in an EIRR
above but near the threshold 12% economic opportunity cost of capital (EOCC). However, the
non-quantifiable benefits, comprising the positive public health and environmental impacts, are
substantial, and place the real economic performance of the project well above the quantifiable
results. It is, however, interesting that the project can be justified economically on the basis of
cost savings alone.
1 Democratic Republic of Timor Leste, Tax and Duties Act, Decree Law No: 8/2008
6 | GHD | Report for Asian Development Bank – TA-8750 TIM: Preparing the Urban Services Improvement Sector Project, 5510101
2. Introduction 2.1 Background
GHD was commissioned by the Asian Development Bank in January 2015 to undertake The Dili
Urban Services Improvement Sector Project Technical Assistance. The Terms of Reference is
included as Appendix A – Terms of Reference
The purpose of the technical assistance is to develop an investment strategy to meet the water
supply and Solid Waste Management needs of Dili’s population over the period 2015-2030 in
line with national development targets. The investment strategies were to identify a range of
appropriate options that are affordable, and that can be operated and maintained in a
sustainable manner, based on a comprehensive and participatory assessment of the urban
water supply and solid waste situation in Dili.
The investment planning, design and feasibility work was to be carried out over a period of 7
months. The TA was to build on recently prepared water supply and solid waste assessments
for Dili. The project includes identification and design of priority investments to develop an
improved integrated Solid Waste Management system for Dili, due diligence and feasibility
assessments, and project costing. The Consultant was to work closely with individual
consultants recruited separately to prepare preliminary design and costing for water supply
improvements for Dili, and to design organizational arrangements for project implementation.
The TA will cover both solid waste and water supply, and GHD will cover: (i) design of SWM
components, and (ii) social analysis, feasibility studies and safeguards assessments for both
SWM and water supply. The ADB has recruited experts to undertake the water supply
components separately.
The consultant was to work closely with both the Ministry of Public Works (MPW) and Ministry of
State Administration. In overview, the Ministry of Public Works is responsible for the dump site
operation and policy generation, whereas the Ministry of State Administration is responsible for
collection activities.
The project has a strong social focus including both a social, poverty, gender and social
safeguard specialist, as well as the social marketing specialist. In addition to these specialities,
the team includes a financial analyst, economist and environmental specialists. The team
leader also has a technical role being the Solid Waste Management specialist, working with the
solid waste design engineer.
2.2 Reports and deliverables
The consultant is to work closely with the designated partners, namely, the Ministry of Public
Works and Ministry of State Administration officials. The reporting schedule was as follows:
Inception report which will include: the results of initial stakeholder consultations,
findings from the review of recent Solid Waste Management studies, any required
changes to the terms of reference, as well as confirmed work plan and personnel
schedule, implementation arrangements, and any other issues requiring attention to
ensure smooth implementation of activities. The report was submitted within 1 month
of mobilization of the consultant team and presented at a workshop.
Interim Report which will include options analysis and preliminary designs for
appropriate least-cost technically, socially and environmentally feasible options for an
improved integrated Solid Waste Management system in Dili, including specific
measures to ensure inclusive access to water supply and solid waste services. The
report will also include the findings from the institutional and fiduciary systems
GHD | Report for Asian Development Bank – TA-8750 TIM: Preparing the Urban Services Improvement Sector Project, 5510101 | 7
assessment. The report will be submitted within 4 months of mobilization of the
consultant team.
Feasibility study. Immediately following the approval of proposed investments,
feasibility studies and due diligence assessments for these priority investments will be
prepared and submitted for endorsement within 6 months of consultant mobilization.
Final Report which includes a consolidated investment program, and final due
diligence and feasibility studies for priority investments will be submitted for
endorsement within 7 months of mobilization of the consultant team.
In addition to the umbrella reports listed above, the water supply specialist also prepared a number of reports which were presented as standalone documents. While there was some overlap in the sectorial investigations such as household surveys and communications, these reports were disaggregated with the appropriate sections presented in the relevant reports for Solid Waste Management and water supply respectively. There is some commonality in the sectorial reports regarding approach and methodology but the workings and conclusions are specific to that sector.
The separate reports presented by the water supply specialists are listed below:
Inception Report – March 2015
Interim Report – June 2015
Final Report – September 2015
8 | GHD | Report for Asian Development Bank – TA-8750 TIM: Preparing the Urban Services Improvement Sector Project, 5510101
3. Background 3.1 Introduction
Dili, as the capital city of Timor Leste, is also is the primary commercial hub. Its urban area
stretches some 12 km east to west and 3 km north to south and, extending from sea level along
the coast to over 50 metres elevation in land. It is home to the nation’s primary seaport
although another port is proposed for the Tibar area at present. It is the country’s primary
institutional and commercial centre and hosts the national government.
The city is divided into district’s which in turn are divided into 26 villages (sucos) of which 18 are
classified as an urban.
The economy is essentially driven by the petroleum sector where royalties eclipse taxes and all
other revenues by a significant margin. Economic growth remains strong largely due to
increased public expenditure. This expenditure is stimulating expansion of the private sector
particularly in construction.
Dili’s urban population has accelerated rapidly over the last two decades. Its current population
is in the order of 300,000 persons. An urban master plan for Dili is currently being prepared by
JICA. This document presents a number of possible growth scenarios, but growth rates
approaching 5% would not be unexpected.
This combination of significantly increasing population, as well as increasing community wealth
will result in a significant increase in the waste mass being generated from the city. Therefore,
there is an urgent need to prepare an integrated Solid Waste Management (SWM) plan for this
locale.
There is a move to devolve responsibility for Waste Management from national government to
municipal government. This will need to be investigated more closely during the implementation
of this project.
In terms of the legislative environment, there are a number of acts that impinge upon Solid
Waste Management. However, there is no dedicated SWM act which addresses all facets of
Solid Waste Management including aspects such as waste minimisation, recycling targets,
disposal facility standards, as well as specific areas such as producer responsibility for special
wastes, anti-litter controls and so on.
3.2 Overview of Solid Waste Management in Dili
In overview, community based collections services are provided for the residents in Dili. These
are provided by 40 hired vehicles, 20 government vehicles and approximately 20 private sector
vehicles serving commercial institutions. There is a very small amount of door-to-door collection
provided by private contractors that mainly transport plastic mobile garbage bins.
Approximately 300 community dumping pits are located throughout the city. This is
supplemented by a number of covered hook lift bins and also commercial bins. There are
minimal recycling bins or green waste repository pits throughout the city at present, apart from
those provided by the private sector or NGO organizations involved in recycling. One example
is the mesh cages provided for recovery of PET bottles. A number of individuals and small
companies recover recyclables from the community pits throughout the city.
The main haulage vehicles are generally small six wheel tipping trucks with a carrying capacity
of approximately three tonnes. However, given the low density of waste within these vehicles,
they are often only caring approximately one tonne even when essentially full.
GHD | Report for Asian Development Bank – TA-8750 TIM: Preparing the Urban Services Improvement Sector Project, 5510101 | 9
As a result, there are on average approximately 115 vehicle movements a day to and from the
Tibar dumping site.
The Tibar dumping site is approximately 16 km from the centre of Dili. The site has been in
operation since Indonesian times and has a central flat area of approximately 12 hectares with a
further 13 hectares surrounding the main tipping areas on the surrounding hills. Also on the site
are a number of buildings associated with the Waste Management activities, a waste oil storage
dump, composting plant for green waste and the septage receivals and treatment plant facility.
Compared with many similar sized cities throughout the Pacific, and developing countries within
South and Southeast Asia, the city is relatively free of fly dumping and litter. In fact the vacant
lots, road verges and canals are relatively free of waste compared with most other cities of this
size.
The Tibar dumping site is better operated than many uncontrolled dumps in the region. There is
some control over where waste loads are dumped, as well as an attempt to provide some waste
profiling and application of cover soil. The main drawback is extensive burning on the site which
is ubiquitous on similar dumps in developing countries.
Overall, the collection and disposal of waste is substandard, but the two ministries are to be
congratulated for at least providing a service that is superior to many other similar cities in other
developing countries. However, that is not to say that significant improvements could not be
made both in terms of efficiency and efficacy, as well as greatly improving socio-environmental
issues.
3.3 Legislative Environment
As noted in the GlobalWorks 2014 report on Solid Waste Management Strategy and Urban
Investment Plan, although Government has made progress in formulating environmental
legislation, notably relating to environmental impact assessment provisions, the legislative and
regulatory framework relating to the SWM sector is at an early stage of development. In this
context, the Basic Law on Environment 26/11, which establishes environmental policy relating to
natural resource protection, does however mandate pollution control standards for facility
discharges to the atmosphere, lands and subsurface resources.
Coupled with this are powers to continually monitor the environment, and the provision of
penalties for violations. This, therefore, has relevance to the development and operation of
SWM facilities and systems, in that they need to comply with prescribed discharge standards
that can be monitored to ensure compliance. Specifically for SWM, the law also promotes waste
reduction, recycling and reuse, and encourages waste-to-energy modalities. Although it defers
the definition of SWM collection, transfer, storage, treatment, disposal and recycling
methodologies to separate statute, it does confirm that municipal solid waste (MSW)
management is the responsibility of local authorities.
The law also mandates that MSW can only be discharged into designated facilities that are
determined by competent authorities, and that they are to be constructed in a way to prevent
groundwater contamination.
Further, the National Sanitation Policy, approved in 2012, provides a vision, guidelines and
agency responsibilities for a clean and hygienic environment, and notably, the reduction, reuse
and recycling of MSW. It mandates the formulation and implementation of five year strategies
and investment programs to support policy implementation.
Additionally, there is the Government Decree Law No 33/2008 on Hygiene and Public Order.
The order empowers district administrations to prohibit landowners and tenants from disposing
waste on the sides of rights of way, blocking drains and ditches, and dumping waste outside of
Administration designated areas. It also mandates fines for offenders.
10 | GHD | Report for Asian Development Bank – TA-8750 TIM: Preparing the Urban Services Improvement Sector Project, 5510101
Beyond this, policies, plans, guidance documents, and SWM strategies at the municipal or
national level do not yet exist. Enforcement is therefore difficult, as enforcers are unsure what
specifically to enforce or how. Also reported is that a legislative and regulatory framework is yet
to be formulated to regulate the medical waste management (MWM) sector, notably in the
segregation, storage, treatment and disposal of sharps, pathological and other hazardous
wastes.
3.4 Institutional Environment
A number of agencies are involved in Solid Waste Management in Dili.
3.4.1 Ministry of State Administration
This ministry is responsible for national and local administration and the provision of public
services Nationwide. The National Directorate of Local Administration (NDLA) of the ministry is
involved with infrastructure planning and implementation as well as budget allocations for Solid
Waste Management services. This also includes the funding for the private sector waste
collection contracts and the maintenance of equipment and staff. Essentially this ministry is
responsible for the collection activities.
The Sanitation Department of the Dili District Administration (DDA) is responsible for the day to
day management of Solid Waste Management collection services and street sweeping in Dili. It
has a staff of approximately 300 people.
3.4.2 Ministry of Public Works
Within this ministry, the National Directorate for Basic Sanitation Services (NDSB) is jointly
responsible for policy and planning and close coordination of its activities with the sanitation
department of the Dili District administration. This agency is also responsible for the operation
of the landfill.
3.4.3 Ministry of Industry, Commerce and Environment (MinICE):
The National Directorate for the Environment of the MinICE is responsible for environmental
policy and regulation for the SWM sector, and specifically for pollution discharge monitoring and
control
3.4.4 Ministry of Health (MOH)
The National Directorate of Community Health Services (CHS) of the MOH is responsible for the
management and regulation of MWM sector. The MOH also has responsibilities relating to public health aspects of the SWM sector.
3.4.5 Ministry of Education (MOE)
The MOE is responsible to promote sanitation awareness through school curriculum
development.
3.5 Previous Studies and Investigations
A number of previous studies and investigations have been undertaken.
The most recent of these was the ADB funded Dili Solid Waste Management Sector final report
on Solid Waste Management Strategy and Urban Investment Plan in September 2014. (SC-
103479: TIM). This report investigated the background through the city profile and demand
issues, as well as the considering the regulations and enforcement environment. The study
also included the waste characterization and generation leading to conclusions on waste type
GHD | Report for Asian Development Bank – TA-8750 TIM: Preparing the Urban Services Improvement Sector Project, 5510101 | 11
and generation volumes and mass. The Report concludes with some recommendations on
storage, collection and disposal systems together with reference to specific waste such as
mediwaste. An important component which is to be addressed in the current study is the
capacity support issues relating not only to the public sector actors, but also the civil society and
commercial stakeholders such as those involved in recycling.
Some other investigations were undertaken in 2014 under the Governance for Development
activities supported by Australian aid funding DFAT. However, this work was not completed as
the Australian government became aware of the current ADB funded project and terminated
their investigations. This work contains background on storage, recycling and collection
activities within Dili, and makes some preliminary assessments of possible improvements.
While the work is unfinished, it still provided some useful inputs into the current study.
The ADB also prepared the Solid Waste Management in the Pacific Timor-Leste Country
Snapshot report. This is a summary document that provides a very comprehensive overview of
the entire Solid Waste Management activities including institutional arrangements, financial
issues, and commentary on public awareness.
The November 2010 final report entitled Timor Leste Urban Sanitation Assessment was funded
by the Water and Sanitation Program (WSP). This report addressed a number of aspects of
water and sanitation (WATSAN), and not just solid waste. It provides particular information on
the institutional and financial issues, as well as particularly the social aspects following some
detailed surveys.
The UNDP 2001 report “Solid Waste Management Plan” provides the historical background to
Solid Waste Management in East Timor. Many of the items have been superseded by recent
developments, however, some of the institutional assessments and role definitions together with
goals and strategic objectives still apply.
3.6 Plasma Arc Gasification Plant
An agreement was developed by the GoTL during the course of this TA with a Korean company
to provide a plasma plant at Tibar. The contract is confidential so only limited details remain
available. However the plant is reportedly to take all of Dili’s waste and incinerate it at very high
temperatures, while also generating some electricity. The contractor will reportedly also provide
some new collection vehicles but details are unavailable. Therefore the GoTL will not be
seeking a loan supporting improved solid waste management at this time, but it has been
agreed to still complete this TA and provide documentation for an alternative SWM approach if
required in the near term. An official project opening was held in mid-2015 at the Tibar site, but
at the time of writing this report no site works had commenced.
The background to this development is described below. Quoting from official Government of
Timor-Leste website:
“The Council of Ministers met this Tuesday, October 21st, 2014, in the Council of
Ministers’ meeting room, at the Government Palace, in Dili, and approved seven
diplomas:
# 2. Government Resolution approving the assignment for the construction of the Waste Treatment Factory of Tibar to the company Shun Hsin Constructions & Development, Ltd., Korea
Following the presentation at the Council of Ministers’ meeting from August 19th, the Government once again evaluated the implications of the construction of a Waste Treatment Factory in Tibar, proposed by the company Shun Hsin, having expressed their agreement, in principle, to this investment.
12 | GHD | Report for Asian Development Bank – TA-8750 TIM: Preparing the Urban Services Improvement Sector Project, 5510101
It should be emphasized that population growth of the cities and consumption have been contributing to aggravate environmental conditions, mainly in urban areas, and thus it is urgent to take a decision on pollution treatment. The proposal by the Shun Hsin Company includes not only the collection and storage of waste, but also the treatment and reuse of organic waste.”
Waste-to energy for power generation or other purposes has found wide acceptance in
countries where space is at a premium and landfills are extremely difficult to locate and
maintain. The discussion on Tibar Landfill (following) shows that this is not the case in Dili.
The key points of this proposal are:
$150M CAPEX (some or all provided by proponent);
Produces power from selected waste – organics, waste oil, plastics, cardboard, paper;
Feasibility based on current very high costs of power in Timor-Leste of about $0.40
per Kilowatt hour;
Commercial in confidence proposal granting 50 year control of Tibar Landfill site;
Full access to Government waste collections from Dili for life of plant operation
(condition to rescind contract if not granted);
Similar plant supplier claims energy for 1800 homes from 100t/d waste throughput, or
about 2MW generation capacity;
Existing plasma waste plants are mainly at universities and specialist military
establishments;
Will require very specialist operations and maintenance;
Proponent presently undertaking a number of feasibility studies and has signed a
contract in October 2014 with Minister of Environment Industry and Commerce after
securing finances required.
3.7 Current Project
The way head was agreed with the ADB that the TA would continue and prepare the
appropriate documents together with the required institutional structures and task descriptions
would still be prepared, together with the overall costings and financial and economic analysis.
This was also to be supported by the full socio-environmental investigations. So the current
project will build upon the previous work and take it to a level which has community, civil
society, commercial and government support for a sustainable project and appurtenant
activities.
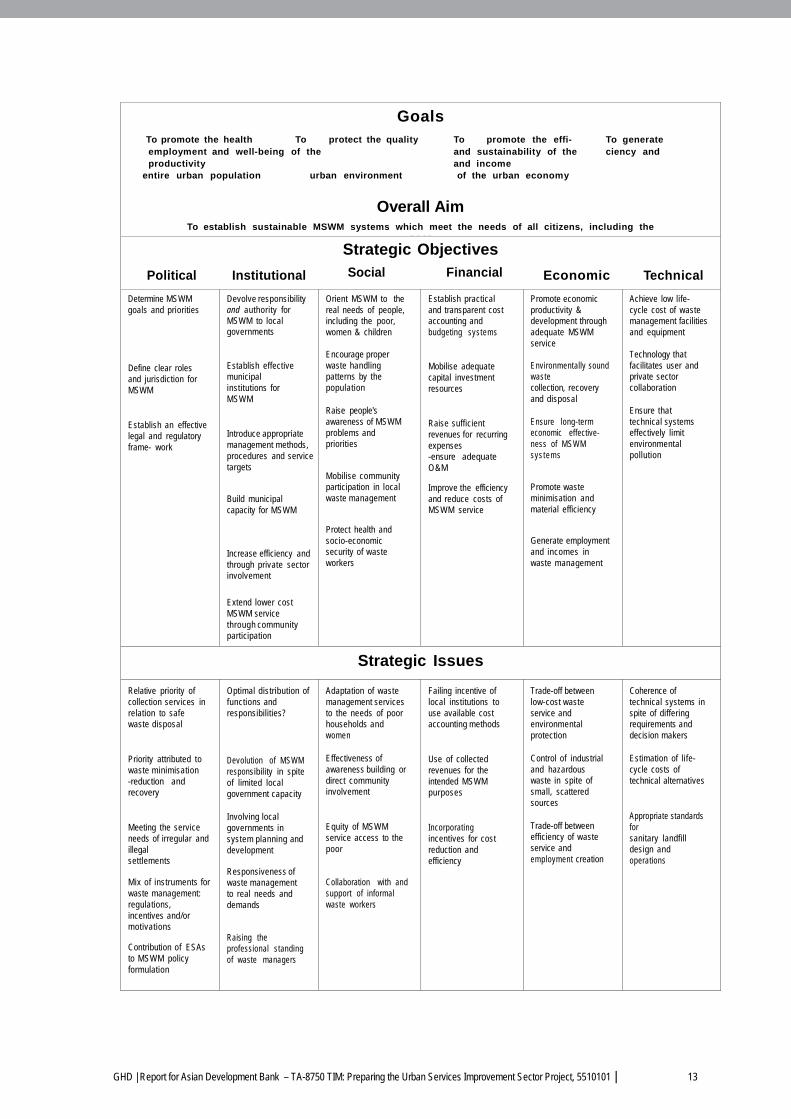
Whilst the terms of reference provide clear direction for this activity, an umbrella framework is
proposed as set out below which brings together the various elements of an eclectic integrated
Solid Waste Management plan.
This approach is built upon the UNDP/UNCHS (Habitat)/World Bank/SDC Collaborative
Programme on Municipal Solid Waste Management in Low-Income Countries Conceptual
Framework, SKAT Working Paper No. 9. This document provides an effective guideline for the
goals and overall aim of such a project, taking account of the key political, institutional, social,
financial, economic and technical components. The programmatic approach below has been
prepared to include a number of key elements and activities which directly reflect the needs of
the current project.
The water supply activities will run in parallel with these activities and the Solid Waste
Management Team will liaise/coordinate with the water activities to maximise the benefits of all
the work and to avoid duplication.
GHD | Report for Asian Development Bank – TA-8750 TIM: Preparing the Urban Services Improvement Sector Project, 5510101 | 13
Goals To promote the health To protect the quality To promote the effi- To generate employment and well-being of the and sustainability of the ciency and productivity and income
entire urban population urban environment of the urban economy
Overall Aim To establish sustainable MSWM systems which meet the needs of all citizens, including the
poor
Political
Institutional
Strategic Objectives Social Financial
Economic
Technical
Determine MSWM goals and priorities
Define clear roles and jurisdiction for MSWM
Establish an effective legal and regulatory frame- work
Devolve responsibility and authority for MSWM to local governments
Establish effective municipal institutions for MSWM
Introduce appropriate management methods, procedures and service targets
Build municipal capacity for MSWM
Increase efficiency and through private sector involvement
Extend lower cost MSWM service through community participation
Orient MSWM to the real needs of people, including the poor, women & children
Encourage proper waste handling patterns by the population
Raise people's awareness of MSWM problems and priorities
Mobilise community participation in local waste management
Protect health and socio-economic security of waste workers
Establish practical and transparent cost accounting and budgeting systems
Mobilise adequate capital investment resources
Raise sufficient revenues for recurring expenses -ensure adequate O&M
Improve the efficiency and reduce costs of MSWM service
Promote economic productivity & development through adequate MSWM service
Environmentally sound waste collection, recovery and disposal
Ensure long-term economic effective- ness of MSWM sys tems
Promote waste minimisation and material efficiency
Generate employment and incomes in waste management
Achieve low life- cycle cost of waste management facilities and equipment
Technology that facilitates user and private sector collaboration
Ensure that technical systems effectively limit environmental pollution
Strategic Issues
Relative priority of collection services in relation to safe waste disposal
Priority attributed to waste minimisation -reduction and recovery
Meeting the service needs of irregular and illegal settlements
Mix of instruments for waste management: regulations, incentives and/or motivations
Contribution of ESAs to MSWM policy formulation
Optimal distribution of functions and responsibilities?
Devolution of MSWM responsibility in spite of limited local government capacity
Involving local governments in system planning and development
Responsiveness of waste management to real needs and demands
Raising the professional standing of waste managers
Adaptation of waste management services to the needs of poor households and women
Effectiveness of awareness building or direct community involvement
Equity of MSWM service access to the poor
Collaboration with and support of informal waste workers
Failing incentive of local institutions to use available cost accounting methods
Use of collected revenues for the intended MSWM purposes
Incorporating incentives for cost reduction and efficiency
Trade-off between low-cost waste service and environmental protection
Control of industrial and hazardous waste in spite of small, scattered sources
Trade-off between efficiency of waste service and employment creation
Coherence of technical systems in spite of differing requirements and decision makers
Estimation of life- cycle costs of technical alternatives
Appropriate standards for sanitary landfill design and operations
14 | GHD | Report for Asian Development Bank – TA-8750 TIM: Preparing the Urban Services Improvement Sector Project, 5510101
4. Waste Audits and Load Determination 4.1 Introduction
All aspects of this project are predicated on a sound knowledge of the waste components and
waste quantity that needs to be managed.
A number of previous waste audits have been conducted, including one in 2014. However that
audit was based on a disaggregated approach where samples were collected from a number of
households and commercial areas, and then the data was aggregated to provide an overall
picture. Therefore, it was considered an end-of-pipe waste audit was required at the Tibar
dumpsite which was to provide not only the fractions of the various components making up the
overall waste stream, but also to be able to better estimate the actual volume and tonnage of
material currently going to the dumpsite. Without these data sets, the project could not proceed
on a sound basis.
These data are essential not only for the sizing and design of the infrastructure requirements,
but also allow the social elements be better understood in terms of assistance required to
increase recycling activities and other recovery operations.
4.2 Previous Audit (2014)
4.2.1 Overview
A waste assessment and characterization survey (WACS) was undertaken as part of the Dili
Solid Waste Management Sector – Solid Waste Management Strategy Urban Investment Plan
(2014). The WACS included the following three surveys:
A one-week (seven calendar-day) survey of MSW from three Dili communities
(communities), namely Farol, Colmera and Kaikoli. A total of 25 households were
selected for assessment in each community, with each providing their MSW every day
consecutively for one week (1-Jul-2014 to 7-Jul-2014);
A one-day assessment (3-Jul-2014) of institutional and commercial MSW generators
in Dili including offices, a church, a market and a restaurant;
A one-day assessment (4-Jul-2014) of MSW vehicles entering the Tibar Dumpsite, to
estimate the quantity of MSW being disposed of at the facility daily.
4.2.2 WACS Methodology
The three communities of Farol, Colmera and Kaikoli were selected primarily based on their
perceived household income level, with Farol considered to represent a higher-income
community, Colmera a medium-income community, and Kaikoli a lower-income community. In
summary, the WACS included the following activities:
Community surveys to identify the 25 target households in each of the three
communities, followed by door-to-door interviews in order to solicit householder
support and participation in the WACS. This also included a short interview of each
householder;
Households were then provided two plastic bags; (i) a clear, sealable bag in which to
place all food and kitchen (wet) waste, and (ii) a larger white plastic bag with a
drawstring tie in which to place all other waste materials. The critical need for
householders to place all waste materials in the bags every day was strongly
emphasized;
GHD | Report for Asian Development Bank – TA-8750 TIM: Preparing the Urban Services Improvement Sector Project, 5510101 | 15
The institutional and commercial facilities surveyed followed a similar methodology to
that of the households. This initially included the identification of suitable facilities
throughout Dili, followed by respondent interviews;
On the second and subsequent survey days, the bags were collected daily from each
household, when bags were also provided for the next day. Collections were
performed generally between 8.00 am and 10.00 am every day. A truck was utilized to
run around Dili, collect all the bags, and transport them safely back to a waste
processing area. Bags were collected in a similar manner from institutional and
commercial establishments;
A processing facility was established in which the waste processing activities were
performed. The methodology for the processing of the waste was as follows:
a) The two sets of waste bags (food waste bags and composite waste bags) from each generator were removed from the delivery truck and placed in designated areas, where they were recorded as present on the daily record sheets;
b) Each bag was then weighed (to the nearest gram) and the weights recorded;
c) The waste bags were then placed inside a 200-liter sized waste drum, where the weight and volume of the waste was recorded to calculate waste density;
d) Waste from all the bags in a given community was then tipped onto the sorting table or tipping floor where it was segregated into 15 waste components;
e) Following segregation and verification, each waste component was then weighed to the nearest gram and recorded;
f) Following waste processing, the waste materials were then stored for either collection by recyclers, or disposed of into the municipal waste collection system.
The results obtained from the WACS were then analysed daily in order to calculate, for each
community, approximations of overall waste generation (per capita/day) and waste composition
(in percent) of each of the 15 waste components assessed. In certain cases, this required
engineering judgment in order to reduce anomalies in the data and apply correction factors. The
WACS assessment of selected institutional and commercial establishments followed a similar
procedure to that of the household assessment, with one major difference. That difference
relates to the fact that, although the waste composition (in terms of the 15 waste components)
can be determined. The relative mass contributions of institutional activities and commercial
enterprises are unknown.
An assessment was also conducted to provide an initial estimate of MSW being delivered to the
Tibar dumpsite. As a weighbridge was not available in Dili during the assessment on which to
weigh waste trucks, a one-day truck count was completed at the Tibar Dumpsite in order to
identify the number of trucks entering the facility, their volume estimated, and then an assumed
overall density was applied to provide an indication of the likely waste tonnage being disposed
at the facility.
In terms of household waste disposal, all three communities recorded markedly high collection
by the Dili District municipal system. This included all households surveyed in Farol (100
percent), 23 out of 25 participants (92 percent) in Colmera, and 20 out of 25 participants in
Kaikoli (80 percent). Two respondents in Colmera reported that they indiscriminately throw their
waste, and five in Kaikoli burn theirs.
Respondents recorded very low levels of household segregation, diversion and recycling. From
all potential recyclable materials in the MSW, only metals and wood were recorded as being
recycled. Of these, metals recorded the highest diversion, especially Kaikoli, where 10 out of 25
respondents segregate and sell metals from their waste.
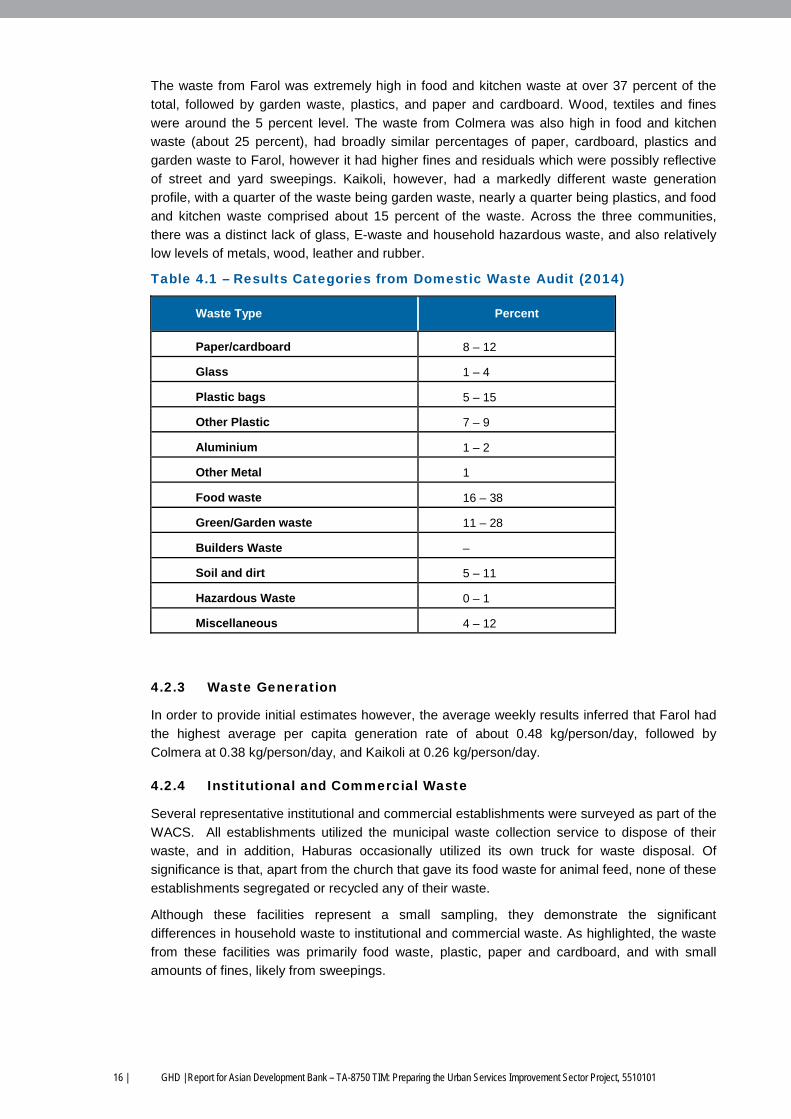
16 | GHD | Report for Asian Development Bank – TA-8750 TIM: Preparing the Urban Services Improvement Sector Project, 5510101
The waste from Farol was extremely high in food and kitchen waste at over 37 percent of the
total, followed by garden waste, plastics, and paper and cardboard. Wood, textiles and fines
were around the 5 percent level. The waste from Colmera was also high in food and kitchen
waste (about 25 percent), had broadly similar percentages of paper, cardboard, plastics and
garden waste to Farol, however it had higher fines and residuals which were possibly reflective
of street and yard sweepings. Kaikoli, however, had a markedly different waste generation
profile, with a quarter of the waste being garden waste, nearly a quarter being plastics, and food
and kitchen waste comprised about 15 percent of the waste. Across the three communities,
there was a distinct lack of glass, E-waste and household hazardous waste, and also relatively
low levels of metals, wood, leather and rubber.
Table 4.1 – Results Categories from Domestic Waste Audit (2014)
Waste Type Percent
Paper/cardboard 8 – 12
Glass 1 – 4
Plastic bags 5 – 15
Other Plastic 7 – 9
Aluminium 1 – 2
Other Metal 1
Food waste 16 – 38
Green/Garden waste 11 – 28
Builders Waste –
Soil and dirt 5 – 11
Hazardous Waste 0 – 1
Miscellaneous 4 – 12
4.2.3 Waste Generation
In order to provide initial estimates however, the average weekly results inferred that Farol had
the highest average per capita generation rate of about 0.48 kg/person/day, followed by
Colmera at 0.38 kg/person/day, and Kaikoli at 0.26 kg/person/day.
4.2.4 Institutional and Commercial Waste
Several representative institutional and commercial establishments were surveyed as part of the
WACS. All establishments utilized the municipal waste collection service to dispose of their
waste, and in addition, Haburas occasionally utilized its own truck for waste disposal. Of
significance is that, apart from the church that gave its food waste for animal feed, none of these
establishments segregated or recycled any of their waste.
Although these facilities represent a small sampling, they demonstrate the significant
differences in household waste to institutional and commercial waste. As highlighted, the waste
from these facilities was primarily food waste, plastic, paper and cardboard, and with small
amounts of fines, likely from sweepings.
GHD | Report for Asian Development Bank – TA-8750 TIM: Preparing the Urban Services Improvement Sector Project, 5510101 | 17
4.2.5 Tibar Dumpsite Waste Disposal Amount
A total of 99 truckloads of waste were disposed of at the Tibar facility throughout the day of the
survey, each carrying full loads.
With this approach to the audit, it was not possible to accurately calculate the amount of
institutional and commercial waste being generated in Dili without an exhaustive assessment of
each and every facility in Dili.
Assuming a 20% uplift, this would increase the average per capita generation estimate (taking
into account household, commercial and institutional waste) to 0.393 kg/person/day. Multiplying
the total Dili population estimate by the indicative per capita waste generation rate of 0.393
kg/person/day therefore results in an inferred municipal waste generation rate for Dili of about
115 tons per day.
4.3 Project Audit 2015
In the audit description above, it was acknowledged that whilst explicit details were obtained for
domestic waste and separately for commercial waste, these could not sensibly be aggregated.
The aggregation process involved an engineers’ estimate of the relative quantities but this is not
based on any objective data.
Whilst the above audit has provided some very useful data, it is the overall waste stream
entering the landfill that will determine the equipment requirements, as well as the possibility for
enhanced recycling efforts together with waste minimisation activities. Therefore because of the
accepted limitations of the site specific audits described above, a more detailed end-of-pipe
style audit was undertaken to assess the mixed waste as it entered the landfill. This also
afforded an opportunity to determine the quantity of waste actually reaching the landfill.
As a result, waste audits were conducted over a period of three days with the following aims.
To segregate and weigh a representative quantity of the mixed waste stream to
determine the percentage of various waste components, with a view to improving
waste recovery and recycling;
To determine average waste density by weighing known volumes of waste from
selected loads;
To determine the total volume and mass of waste entering the site daily. The audit took place over 3 days as follows:
On Day One, the audit area was agreed and process discussed with lead labourers.
Selected trucks were diverted, load volumes calculated and weighed to determine
loaded density of waste;
On Day Two, samples of waste were collected from every waste truck (1 rubbish bin
per truck) and stockpiled by local labourers hired for the audit. Volume of each load
was recorded. Density determinations continued;
On Day Three, waste was taken from the waste pile and audited by separating the
mixed waste into the 12 components for weighing. Additional full truck loads to be
audited. Density determinations continued.
In reality, because most vehicles carry a mixture of waste from different sources (households,
market, street cleaning/sweeping, institutions, restaurants, commercial area, etc), there is no
opportunity for undertaking audits of individual waste stream types and then recombining the
individual waste characteristics. Even if the various waste streams could be segregated into
different trucks, such an approach of auditing individual waste streams would not provide
statistically valid overall waste data as there is no quantitative manner for combining the audit
results of the individual waste streams. This would only be possible if a weighbridge was
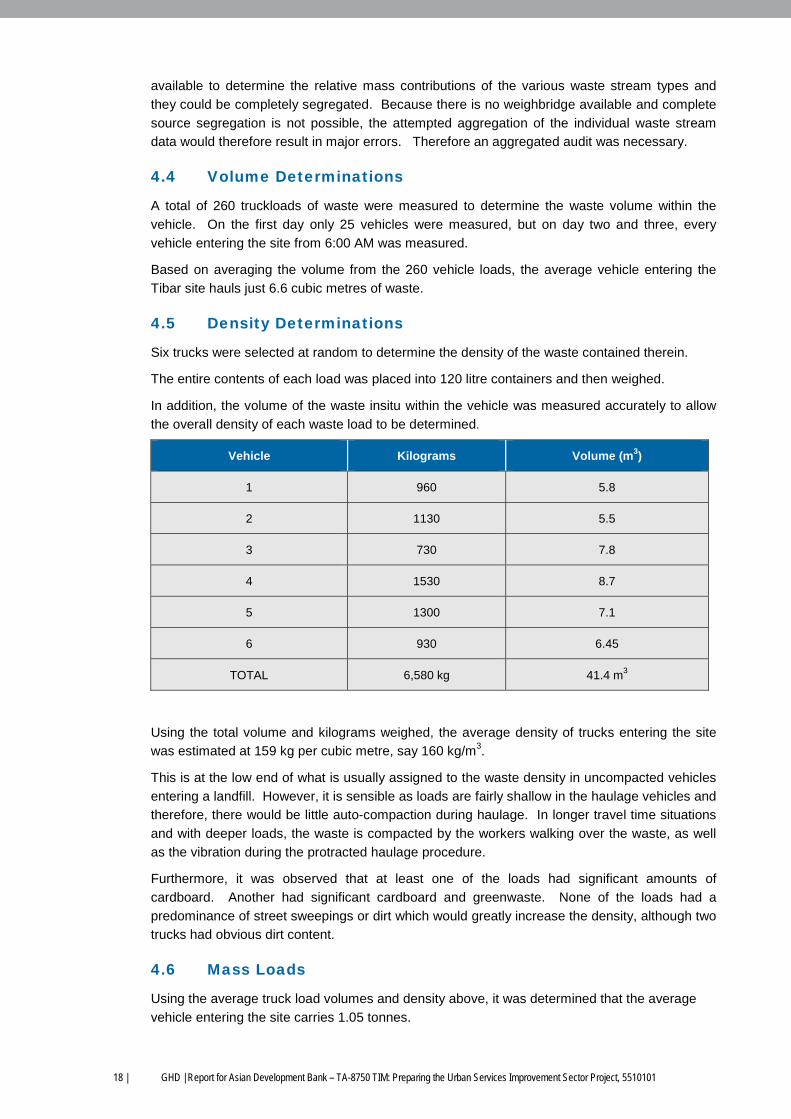
18 | GHD | Report for Asian Development Bank – TA-8750 TIM: Preparing the Urban Services Improvement Sector Project, 5510101
available to determine the relative mass contributions of the various waste stream types and
they could be completely segregated. Because there is no weighbridge available and complete
source segregation is not possible, the attempted aggregation of the individual waste stream
data would therefore result in major errors. Therefore an aggregated audit was necessary.
4.4 Volume Determinations
A total of 260 truckloads of waste were measured to determine the waste volume within the
vehicle. On the first day only 25 vehicles were measured, but on day two and three, every
vehicle entering the site from 6:00 AM was measured.
Based on averaging the volume from the 260 vehicle loads, the average vehicle entering the
Tibar site hauls just 6.6 cubic metres of waste.
4.5 Density Determinations
Six trucks were selected at random to determine the density of the waste contained therein.
The entire contents of each load was placed into 120 litre containers and then weighed.
In addition, the volume of the waste insitu within the vehicle was measured accurately to allow
the overall density of each waste load to be determined.
Vehicle Kilograms Volume (m3)
1 960 5.8
2 1130 5.5
3 730 7.8
4 1530 8.7
5 1300 7.1
6 930 6.45
TOTAL 6,580 kg 41.4 m3
Using the total volume and kilograms weighed, the average density of trucks entering the site
was estimated at 159 kg per cubic metre, say 160 kg/m3.
This is at the low end of what is usually assigned to the waste density in uncompacted vehicles
entering a landfill. However, it is sensible as loads are fairly shallow in the haulage vehicles and
therefore, there would be little auto-compaction during haulage. In longer travel time situations
and with deeper loads, the waste is compacted by the workers walking over the waste, as well
as the vibration during the protracted haulage procedure.
Furthermore, it was observed that at least one of the loads had significant amounts of
cardboard. Another had significant cardboard and greenwaste. None of the loads had a
predominance of street sweepings or dirt which would greatly increase the density, although two
trucks had obvious dirt content.
4.6 Mass Loads
Using the average truck load volumes and density above, it was determined that the average
vehicle entering the site carries 1.05 tonnes.
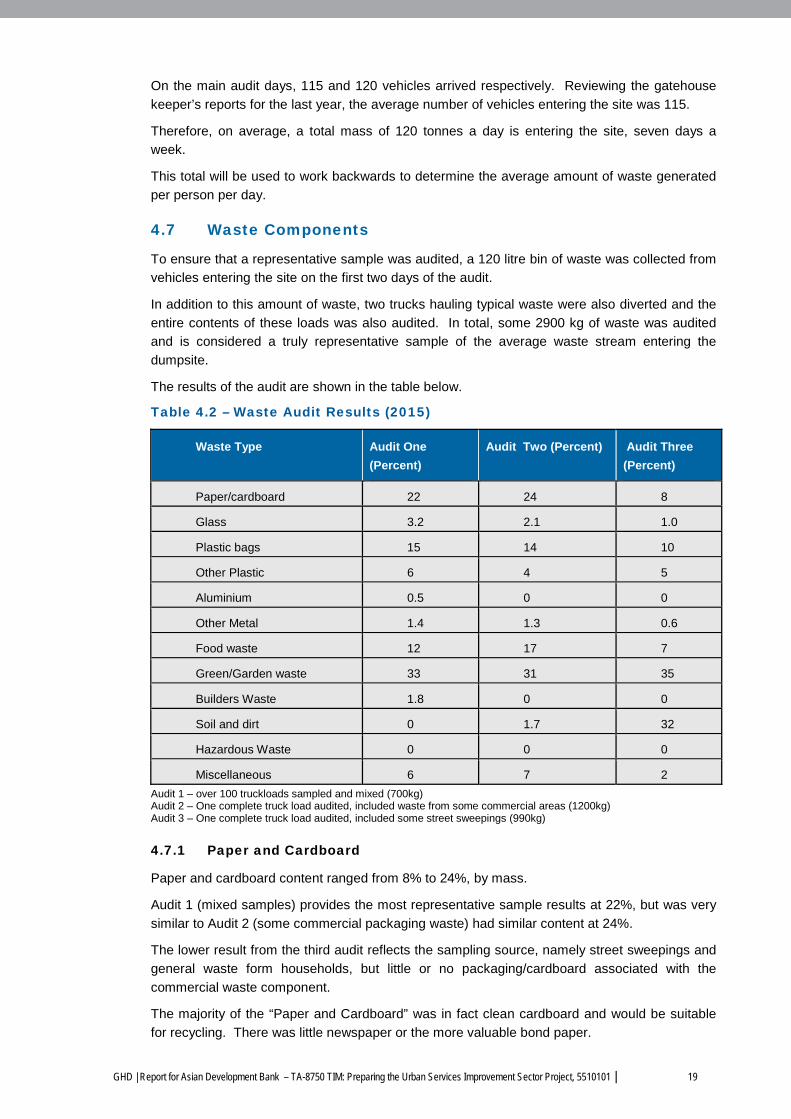
GHD | Report for Asian Development Bank – TA-8750 TIM: Preparing the Urban Services Improvement Sector Project, 5510101 | 19
On the main audit days, 115 and 120 vehicles arrived respectively. Reviewing the gatehouse
keeper’s reports for the last year, the average number of vehicles entering the site was 115.
Therefore, on average, a total mass of 120 tonnes a day is entering the site, seven days a
week.
This total will be used to work backwards to determine the average amount of waste generated
per person per day.
4.7 Waste Components
To ensure that a representative sample was audited, a 120 litre bin of waste was collected from
vehicles entering the site on the first two days of the audit.
In addition to this amount of waste, two trucks hauling typical waste were also diverted and the
entire contents of these loads was also audited. In total, some 2900 kg of waste was audited
and is considered a truly representative sample of the average waste stream entering the
dumpsite.
The results of the audit are shown in the table below.
Table 4.2 – Waste Audit Results (2015)
Waste Type Audit One
(Percent)
Audit Two (Percent) Audit Three
(Percent)
Paper/cardboard 22 24 8
Glass 3.2 2.1 1.0
Plastic bags 15 14 10
Other Plastic 6 4 5
Aluminium 0.5 0 0
Other Metal 1.4 1.3 0.6
Food waste 12 17 7
Green/Garden waste 33 31 35
Builders Waste 1.8 0 0
Soil and dirt 0 1.7 32
Hazardous Waste 0 0 0
Miscellaneous 6 7 2
Audit 1 – over 100 truckloads sampled and mixed (700kg) Audit 2 – One complete truck load audited, included waste from some commercial areas (1200kg) Audit 3 – One complete truck load audited, included some street sweepings (990kg)
4.7.1 Paper and Cardboard
Paper and cardboard content ranged from 8% to 24%, by mass.
Audit 1 (mixed samples) provides the most representative sample results at 22%, but was very
similar to Audit 2 (some commercial packaging waste) had similar content at 24%.
The lower result from the third audit reflects the sampling source, namely street sweepings and
general waste form households, but little or no packaging/cardboard associated with the
commercial waste component.
The majority of the “Paper and Cardboard” was in fact clean cardboard and would be suitable
for recycling. There was little newspaper or the more valuable bond paper.
20 | GHD | Report for Asian Development Bank – TA-8750 TIM: Preparing the Urban Services Improvement Sector Project, 5510101
On average only a small proportion was old tissues, paper wipes and very dirty/wet cardboard,
with very little recycling potential. Paper recycling plants may accept a very small percentage of
dirty paper, but expect that it is sorted into different categories to facilitate easier processing,
such as bond paper, newspapers, glossy page magazines, etc. In general though, recyclers do
not accept paper items that have been exposed to water. The fibres may be damaged, and
there are contamination risks.
At present some 4 to 6 tonnes a day of cardboard is reportedly recycled and dispatched to
Singapore. Given a further 25 tonnes per day is being dumped, then there is a significant
opportunity for greater recovery rates for cardboard and paper.
4.7.2 Glass
The class content varied from 1 to 2%, by mass.
In most cases the glass was in whole bottle form and not as cullet resulting from either bottles or
plate glass. In general these cullet mixes attract a much lower price than whole bottles because
of the difficulty in recycling the different colour and glass types.
While the percentages are low, this still represents over a tonne per day of bottles being
dumped. The bottles and cullet would have to be collected, but could probably only be sold as
cullet given the wide mix of bottle types.
However, it is recognised that until there is a local bottling plant able to directly reuse the glass
bottles in Dili, local recycling of intact bottles will be difficult. Local reuse of the bottles as
containers for other liquids is preferred as one option or crushing and use as concrete
aggregate
4.7.3 Plastic Bags
The plastic bag content varied from 10% to 15%, by mass.
Plastic bags are visible both throughout the city as a result of wind-blown litter and fly dumping,
as well being highly visible at the final disposal location. These bags are also present in the
local ocean environment after being carried to the sea by wind or through the city drains
following rain events. Given the obvious presence of plastic bags in the community, there is
often a strong emphasis by communities to recycle these bags.
To make plastic bags more attractive to recycling companies, they require cleaning which can
result in significant water pollution. Most plastic bags observed during the site audit and other
inspections at Tibar and the primary dumping location were dirty (over 75%) and this would
require wiping/scraping and then washing before recycling. In some countries, such as in
Quezon City in the Philippines, selected types of plastic bags are cleaned and then recycled
into high value recyclable such as handbags and casual jewellery. However the amount of
water pollution resulting from washing these bags is very significant and must be considered as
part of the overall impacts of recycling. It is of course possible to clean the plastic bags using a
wastewater recycling system that would involve sedimentation and possibly filtration, but this is
not considered to be appropriate for Dili at the time
Further, the bags are obviously low density and expensive to transport unless they are
processed through chipping or granulating. Even with these interventions, there are very few
junk shops in developing countries, even in major cities, that recycle plastic bags. The profit
margin is relatively low even with local buyers, and the large storage volumes required to
generate any significant turnover means that the available junk shop storage areas are not
being used efficiently. Therefore the operators tend to focus on other materials such as
aluminium, metals or perhaps even plastic bottles.
GHD | Report for Asian Development Bank – TA-8750 TIM: Preparing the Urban Services Improvement Sector Project, 5510101 | 21
There are some exceptions to this in Vietnam where clean plastic bags are recycled in some
cities. However, these activities are in significantly larger cities than Dili. The definition of clean
and dirty plastic bags needs to be defined. In countries such as Viet Nam, “dirty” plastic bags
are purchased for recycling. However, the definition of dirty in this case is that there is some
inorganic soil making the bag dirty rather than being exposed to or containing quantities of
organic waste such as food scraps. So therefore any references to recycling dirty plastic bags
refer to those bags which have some soil contamination rather than plastic bags used for
disposing of food scraps. Any plastic bags contaminated with food wastes will need both
scraping and then washing and drying before recyclers will accept the bags, which is clearly not
commercially viable.
Overall, given the fact that the great majority of the plastic bags are dirty (both from inorganics
and also organics) and would require significant cleaning, and the fact that the city is a
significant distance from the possible recycling market in Indonesia, recycling plastic bags would
not seem viable at this time. The recycling benefits must also be offset against the expected
pollution that would result from cleaning all plastic bags which would be essential. Much larger
volumes are required and also a higher proportion of clean bags to make it viable.
Other options include driving oil from plastic plants, or low temperature burning in peri-urban
households.
A better approach would be waste minimisation – using reusable bags and waste bins to carry
waste to the primary dumping areas, rather than plastic bags.
Alternative types of plastic bags which are “degradable” (break down into much smaller pieces
of plastic) or “compostable” (organic-sourced bags often containing starches which are
compostable and do not leave smaller plastic residuals) are possibly too expensive to be
considered as a viable alternative at this time.
Both recycling and waste minimisation will be reviewed during project implementation.
4.7.4 Other Plastic Containers
Plastic containers constituted about 4% to 6% of the total waste stream, based on mass. Whilst
official data is hard to obtain, it is suggested that 8 million plastic bottles are brought into Timor
Leste each month.
As with plastic bags, the bulk density of plastic bottles is very low and therefore, the amount of
plastic bottles within the waste stream can attract significant recycling attention. Once the
plastic bottles are actually compacted within the landfill, they will only occupy a very small
percentage of the airspace and are therefore are not a critical factor in landfill life or operating
costs. However, they do remain a recyclable commodity and all efforts should be made to keep
these out of the landfill and facilitate recycling.
The beverage bottles were often dirty and could not be recycled unless rinsed at least. As for
plastic bags, this rinsing process would involve the removal of inorganics as well as organic
material. To provide a sufficient mass of plastic containers to make the recycling dirty containers
worthwhile, a large amount of dirty containers would need to be reclaimed and cleaned. The
issue of water pollution would then become an issue as for plastic bags.
At this stage, clean plastic PET containers are already being recycled by some major local
enterprises. There is also interest in recycling Poly-Propylene containers as well but this has
not happened as yet.
The plastic collar and cap on PET water bottles is made from a different plastic to that of the
main bottle itself. At some stage in the recycling process, the collar and cap has to be removed
as the mixture of HDPE/PP and PET cannot be processed successfully. This is not a problem
22 | GHD | Report for Asian Development Bank – TA-8750 TIM: Preparing the Urban Services Improvement Sector Project, 5510101
until a chipper or granulator system is installed as the presence of the collar or cap is obvious.
Even a small amount of the collar or cap material can contaminate a very large mass of PET
plastic and make the chipped material far less valuable.
One of the recyclers in the study area does manually separate the collars and caps from the
water bottles. To obtain a higher price for their segregated product, other junk shops would
receive a slightly lower rate per kilogram because these items had not been removed.
If the scale of recycling becomes significant, them a “topper” machine can be purchased which
simply chops off the top of the bottle to remove both the cap and collar automatically prior to
chipping.
A decision needs to be made by the recycling companies whether they wish to continue with
segregation or just accept the slightly lower margin for contaminated PET product. This
decision becomes especially critical if a chipper or granulator is to be purchased to allow much
greater densities to be achieved and therefore reduced haulage costs.
One other way of improving the recycling efficiency would be to have the city or agencies
provide some secure compounds so that larger volumes of these materials can be stockpiled
prior to sale. In all cases and for all materials, the junk shop will achieve a higher price for
selling larger volumes because of the reduced transaction and haulage costs.
4.7.5 Aluminium
Aluminium containers constituted about 0.0% to 0.5% of the total waste stream, based on mass.
To put this into perspective, less than 6 cans were recovered from nearly one tonne of waste for
one audit. The local community realises the high value of this product resulting in very little
aluminium being wasted.
There are no other specific interventions required for aluminium as this is clearly being recycled
effectively at present. If the option of installing recycling product cages near primary dumping
locations is adopted, then slightly higher recovery rates may be expected.
4.7.6 Other Metals
Other metals, such as tin cans and roofing iron, represented between 0.6% and 1.4% of the
waste stream, by mass.
This category was mainly comprised of steel cans, wire and other assorted household and
commercial metalwork. There was no one particular component of this waste stream that needs
to be specifically addressed, apart from metal cans.
In many developing countries, metal cans are not recycled because the market prices are low,
and it is not economic to recycle. Furthermore to make the metal cans suitable for recycling at
higher prices, the cans have to be cleaned out and labels removed which is a very labour
intensive process.
One larger recycler in Dili has a press and compacts steel containers and other items for sale
internationally.
A dedicated recycling program for the tins and other metals is unlikely to be warranted. Ongoing
scavenging is the best option. If the option of installing recycling product cages near primary
dumping locations is adopted, then higher recovery rates may be expected
GHD | Report for Asian Development Bank – TA-8750 TIM: Preparing the Urban Services Improvement Sector Project, 5510101 | 23
4.7.7 Food Waste
Food waste represented between 7% and 17% of the total waste stream, based on mass. It was
composed of mainly vegetables, fruit residue and peelings, but with very little meat and fish
scraps.
There are few recycling options for food waste apart from feeding domestic animals at the
household level, use for fish food in commercial ponds and composting at household or
commune level, or centrally.
Household composting can be by shallow burial and retrieval, simple slatted containers or
commercial plastic bin systems with inversion capabilities.
Feeding domestic animals is strongly supported, but is not possible in all areas due to
households having small or no yards to run chickens or pigs.
In summary, household composting is strongly recommended for further investigation.
Commune level composting has some guarded support and centralised composting has many
hurdles to overcome for it to be sustainable economically. The issues include waste
segregation efficiency, compost quality (such as seeds not being inactivated), foreign objects
(glass shards or metal pieces) and most critically, developing a sustainable commercial market
where users are willing to pay enough for the product to cover all the composting costs.
4.7.8 Greenwaste
Greenwaste represented between 31 to 35% of the waste stream, based on mass.
It consisted mainly of grass clippings, leaves and small branches. This material could not be
processed for any productive use, but would provide organics for compost if required, or just
contribute to the landfill gas generation for later harvesting.
However, there was a significant amount of larger tree material (estimated at 40%) by mass that
could be chipped for recycling and then used as batter protection on landfill slopes or road dust
control. Alternatively the chipped greenwaste could be composted on a larger scale than the
present H3R operation, subject to market demand.
The local greenwaste could be composted either alone or with food scraps, as it provides a
better balance of carbon to nitrogen than food scraps alone which often have too much nitrogen
for optimal composting.
Because the greenwaste is presently mixed through with other waste in most cases, it cannot
be easily separated and reused centrally after collection without mechanical equipment such as
rotating trommels or screens. This mechanical equipment is inappropriate at this stage of SWM
development and the greenwaste will continue to just be co-disposed with the other waste
material.
One option to be considered is dedicating the existing concrete primary dumping locations/pits
just for greenwaste disposal, with residuals to go into new covered dump bins. This would allow
the greenwaste to be chipped directly from the bins by a mobile chipper and the chips used on
parks and gardens in Dili, dust suppression or higher uses such as composting.
However, for the immediate future, greenwaste should just be left comingled and land disposed,
following H3R compost diversions.
4.7.9 Builders and Demolition Waste
Builders and demolition waste comprised between 0% and 1.8% of the waste stream, based on
mass.
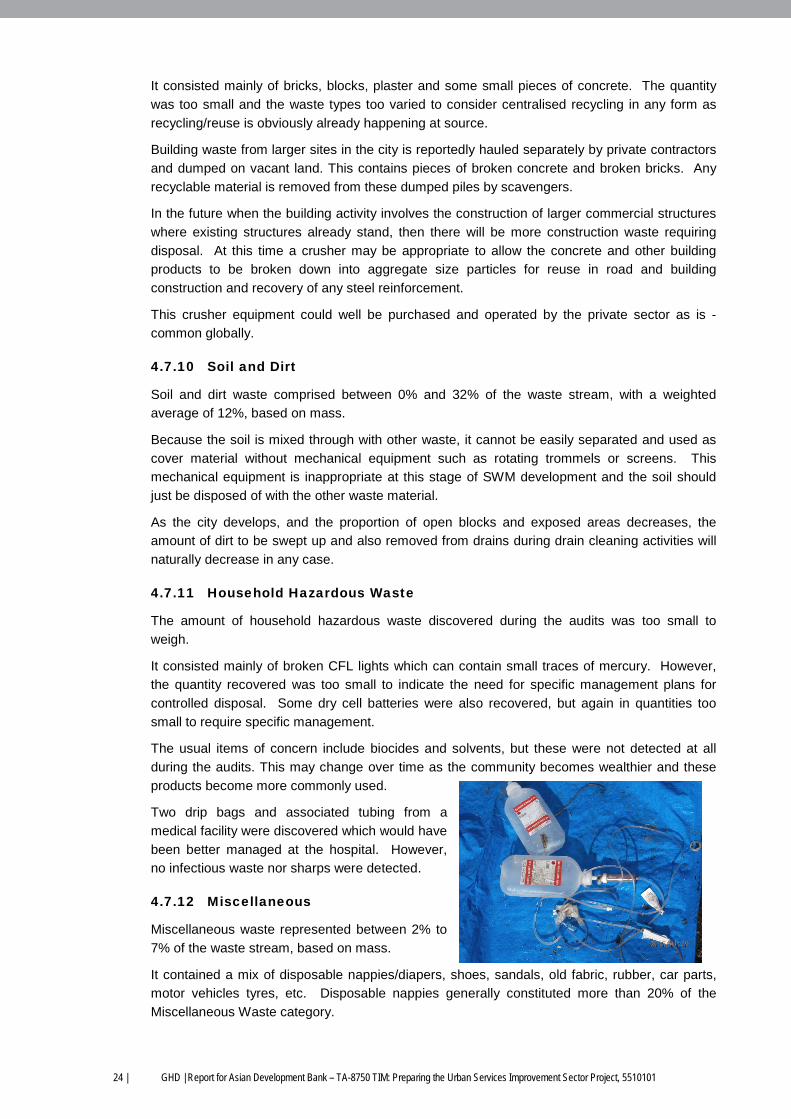
24 | GHD | Report for Asian Development Bank – TA-8750 TIM: Preparing the Urban Services Improvement Sector Project, 5510101
It consisted mainly of bricks, blocks, plaster and some small pieces of concrete. The quantity
was too small and the waste types too varied to consider centralised recycling in any form as
recycling/reuse is obviously already happening at source.
Building waste from larger sites in the city is reportedly hauled separately by private contractors
and dumped on vacant land. This contains pieces of broken concrete and broken bricks. Any
recyclable material is removed from these dumped piles by scavengers.
In the future when the building activity involves the construction of larger commercial structures
where existing structures already stand, then there will be more construction waste requiring
disposal. At this time a crusher may be appropriate to allow the concrete and other building
products to be broken down into aggregate size particles for reuse in road and building
construction and recovery of any steel reinforcement.
This crusher equipment could well be purchased and operated by the private sector as is -
common globally.
4.7.10 Soil and Dirt
Soil and dirt waste comprised between 0% and 32% of the waste stream, with a weighted
average of 12%, based on mass.
Because the soil is mixed through with other waste, it cannot be easily separated and used as
cover material without mechanical equipment such as rotating trommels or screens. This
mechanical equipment is inappropriate at this stage of SWM development and the soil should
just be disposed of with the other waste material.
As the city develops, and the proportion of open blocks and exposed areas decreases, the
amount of dirt to be swept up and also removed from drains during drain cleaning activities will
naturally decrease in any case.
4.7.11 Household Hazardous Waste
The amount of household hazardous waste discovered during the audits was too small to
weigh.
It consisted mainly of broken CFL lights which can contain small traces of mercury. However,
the quantity recovered was too small to indicate the need for specific management plans for
controlled disposal. Some dry cell batteries were also recovered, but again in quantities too
small to require specific management.
The usual items of concern include biocides and solvents, but these were not detected at all
during the audits. This may change over time as the community becomes wealthier and these
products become more commonly used.
Two drip bags and associated tubing from a
medical facility were discovered which would have
been better managed at the hospital. However,
no infectious waste nor sharps were detected.
4.7.12 Miscellaneous
Miscellaneous waste represented between 2% to
7% of the waste stream, based on mass.
It contained a mix of disposable nappies/diapers, shoes, sandals, old fabric, rubber, car parts,
motor vehicles tyres, etc. Disposable nappies generally constituted more than 20% of the
Miscellaneous Waste category.
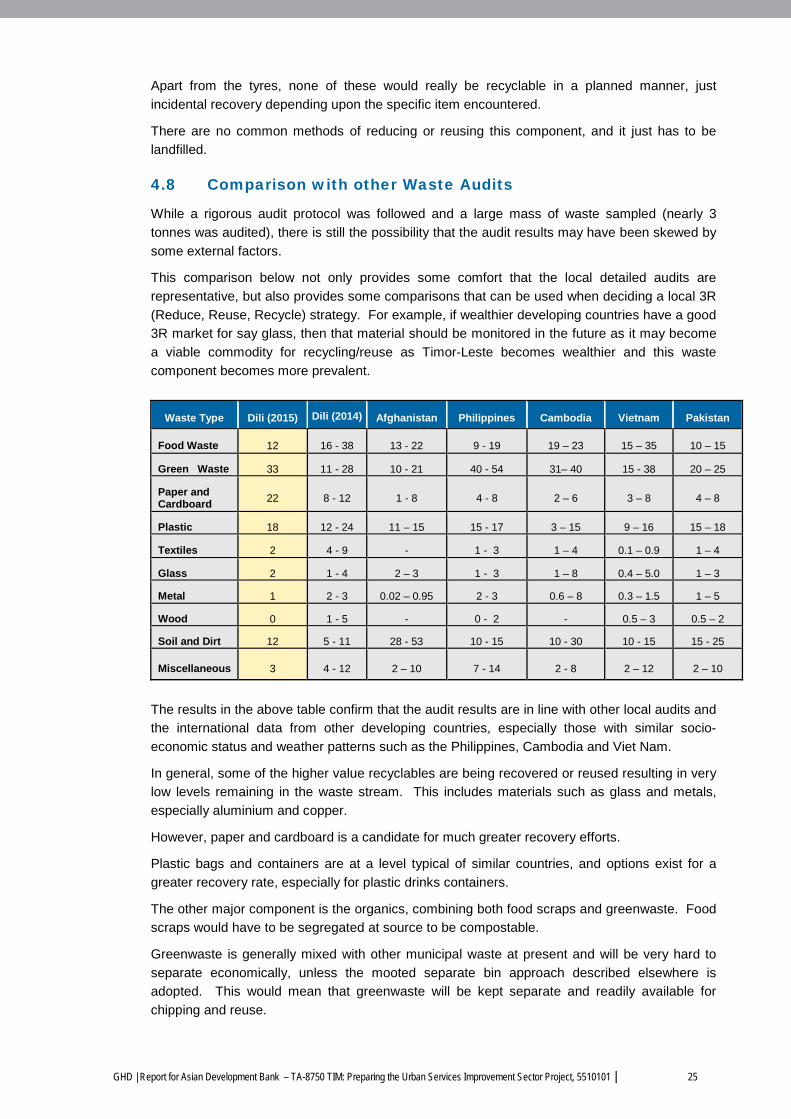
GHD | Report for Asian Development Bank – TA-8750 TIM: Preparing the Urban Services Improvement Sector Project, 5510101 | 25
Apart from the tyres, none of these would really be recyclable in a planned manner, just
incidental recovery depending upon the specific item encountered.
There are no common methods of reducing or reusing this component, and it just has to be
landfilled.
4.8 Comparison with other Waste Audits
While a rigorous audit protocol was followed and a large mass of waste sampled (nearly 3
tonnes was audited), there is still the possibility that the audit results may have been skewed by
some external factors.
This comparison below not only provides some comfort that the local detailed audits are
representative, but also provides some comparisons that can be used when deciding a local 3R
(Reduce, Reuse, Recycle) strategy. For example, if wealthier developing countries have a good
3R market for say glass, then that material should be monitored in the future as it may become
a viable commodity for recycling/reuse as Timor-Leste becomes wealthier and this waste
component becomes more prevalent.
Waste Type Dili (2015) Dili (2014) Afghanistan Philippines Cambodia Vietnam Pakistan
Food Waste 12 16 - 38 13 - 22 9 - 19 19 – 23 15 – 35 10 – 15
Green Waste 33 11 - 28 10 - 21 40 - 54 31– 40 15 - 38 20 – 25
Paper and Cardboard 22 8 - 12 1 - 8 4 - 8 2 – 6 3 – 8 4 – 8
Plastic 18 12 - 24 11 – 15 15 - 17 3 – 15 9 – 16 15 – 18
Textiles 2 4 - 9 - 1 - 3 1 – 4 0.1 – 0.9 1 – 4
Glass 2 1 - 4 2 – 3 1 - 3 1 – 8 0.4 – 5.0 1 – 3
Metal 1 2 - 3 0.02 – 0.95 2 - 3 0.6 – 8 0.3 – 1.5 1 – 5
Wood 0 1 - 5 - 0 - 2 - 0.5 – 3 0.5 – 2
Soil and Dirt 12 5 - 11 28 - 53 10 - 15 10 - 30 10 - 15 15 - 25
Miscellaneous 3 4 - 12 2 – 10 7 - 14 2 - 8 2 – 12 2 – 10
The results in the above table confirm that the audit results are in line with other local audits and
the international data from other developing countries, especially those with similar socio-
economic status and weather patterns such as the Philippines, Cambodia and Viet Nam.
In general, some of the higher value recyclables are being recovered or reused resulting in very
low levels remaining in the waste stream. This includes materials such as glass and metals,
especially aluminium and copper.
However, paper and cardboard is a candidate for much greater recovery efforts.
Plastic bags and containers are at a level typical of similar countries, and options exist for a
greater recovery rate, especially for plastic drinks containers.
The other major component is the organics, combining both food scraps and greenwaste. Food
scraps would have to be segregated at source to be compostable.
Greenwaste is generally mixed with other municipal waste at present and will be very hard to
separate economically, unless the mooted separate bin approach described elsewhere is
adopted. This would mean that greenwaste will be kept separate and readily available for
chipping and reuse.
26 | GHD | Report for Asian Development Bank – TA-8750 TIM: Preparing the Urban Services Improvement Sector Project, 5510101
Soil and dirt is a significant component, but cannot be reused as soil on roads, as cover material
at a landfill or placed on landfill batters without mechanical separation using trommels and
screens.
In summary, there is nothing unusual with the results and the dataset exhibits no obvious
outliers, hence these results provide a sound basis for the study going forward.
GHD | Report for Asian Development Bank – TA-8750 TIM: Preparing the Urban Services Improvement Sector Project, 5510101 | 27
5. Population Projections and Waste Generation 5.1 Background
Estimates have been made for both population projections and waste generation rates for the
timeframes specified in the Terms of Reference, namely to 15 years.
The population projections are primarily based on the Census figures and JICA growth rates for
urban areas. (“The Project for Study on Dili Urban Master Plan in the Democratic Republic of
Timor-Leste – Interim Report Dec 2014, JICA with Nippon Koei Co, Ltd and Pacet Corp.)
Specifically Case 2 - The Consensus Scenario was adopted which generates a growth rate of
4.6%. The interim populations derived in the Report for 2015, 2020, 2025 and 2030 were
adopted from Table 9.2.2 Population Projections by Five Scenarios 2010 – 2030 as these
populations have been adjusted to account for factors making the growth rate vary from the
overall 4.6%.
In addition to the specified timeframe, population and waste generation rate predictions have
been extended until the 30 year horizon as that is a common life expectancy for a landfill.
Requiring this extensive life is to allow efficient recovery of the CAPEX required to develop the
site as well as avoid the need to find a new site. Developing a new site is very time consuming
and costly, especially obtaining all necessary approvals including a social licence to operate by
the surrounding communities. A straight 4.6% growth rate was then used for the of the 30 year
prediction.
A long term projection was also completed to assess the indicative life of the expanded site
utilising the surrounding hill features. A straight 4.6% growth rate was then used for the start of
the post 2045 year prediction, reducing to 3% and then finally 2%. There is no planning basis
for these lower growth rates apart from a general expectation that the population of Dili will not
continue to grow at such high rates as at present into the long term future.
These projections have little if any statistical validity given the large time scales involved, but the
data can be used to demonstrate that the full site would last for many decades.
If the population and/or waste mass predictions are not reflective of reality in the future, this
does not violate the validity proposed development interventions, but merely proportionally
increases or reduces the facility’s life.
In terms of waste generation quantities, various factors were applied as described below.
5.2 Waste Generation Allowance
5.2.1 Background
Accurate waste generation data in Timor Leste is very limited. There are very few if any
functioning public weighbridges, and no portable truck scales for hire, so accurate aggregated
waste generation figures are non-existent. Added to that, most cities do not have a high level of
collection service efficiency to allow the mass of waste being hauled to be accurately related to
a service area population in any case. Most local waste generation rates are based solely on
mass estimates or very small samples being weighed and then grossly extrapolated. In
summary, little credence should be placed on local per-person waste estimates of generation
rates.
Projects in other developing countries like Vietnam and the Philippines often use a rate of at
least 0.5 kilograms per person.day (kg/p.d) going up to 0.65 kg/p.d for provincial cities with a
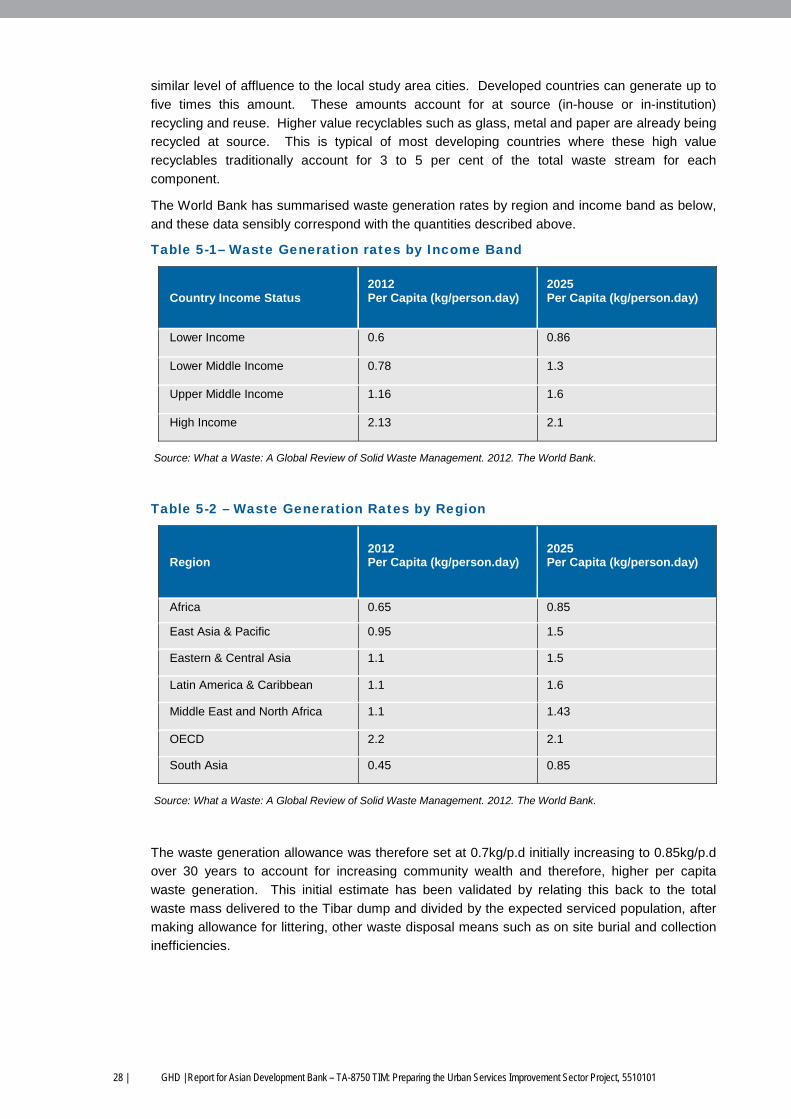
28 | GHD | Report for Asian Development Bank – TA-8750 TIM: Preparing the Urban Services Improvement Sector Project, 5510101
similar level of affluence to the local study area cities. Developed countries can generate up to
five times this amount. These amounts account for at source (in-house or in-institution)
recycling and reuse. Higher value recyclables such as glass, metal and paper are already being
recycled at source. This is typical of most developing countries where these high value
recyclables traditionally account for 3 to 5 per cent of the total waste stream for each
component.
The World Bank has summarised waste generation rates by region and income band as below,
and these data sensibly correspond with the quantities described above.
Table 5-1– Waste Generation rates by Income Band
Country Income Status 2012 Per Capita (kg/person.day)
2025 Per Capita (kg/person.day)
Lower Income 0.6 0.86
Lower Middle Income 0.78 1.3
Upper Middle Income 1.16 1.6
High Income 2.13 2.1
Source: What a Waste: A Global Review of Solid Waste Management. 2012. The World Bank.
Table 5-2 – Waste Generation Rates by Region
Region 2012 Per Capita (kg/person.day)
2025 Per Capita (kg/person.day)
Africa 0.65 0.85
East Asia & Pacific 0.95 1.5
Eastern & Central Asia 1.1 1.5
Latin America & Caribbean 1.1 1.6
Middle East and North Africa 1.1 1.43
OECD 2.2 2.1
South Asia 0.45 0.85
Source: What a Waste: A Global Review of Solid Waste Management. 2012. The World Bank.
The waste generation allowance was therefore set at 0.7kg/p.d initially increasing to 0.85kg/p.d
over 30 years to account for increasing community wealth and therefore, higher per capita
waste generation. This initial estimate has been validated by relating this back to the total
waste mass delivered to the Tibar dump and divided by the expected serviced population, after
making allowance for littering, other waste disposal means such as on site burial and collection
inefficiencies.
GHD | Report for Asian Development Bank – TA-8750 TIM: Preparing the Urban Services Improvement Sector Project, 5510101 | 29
5.3 Collection Allowances
5.3.1 Collection Serviced Area
It is estimated that some 90% of the total Dili area is presently serviced with waste disposal
facilities, based on access to community bunkers, private collection options and litter clean-ups
and street sweeping collections.
Only the very steep areas located in the surrounding hills are not offered any service, as well as
few very poor areas and rural-residential enclaves which are very small in area and population.
Over time this collection serviced percentage will increase as the more readily accessible flatter
areas are developed and densities increase with infill development within existing development
precincts. There is not expected to be an immediate improvement as people currently have at
least pedestrian access to bunkers or informal primary dumping locations. However the
efficiency of collection will improve and this is measured through a different metric below.
By 2030 it is estimated 95% of Dili will be serviced, increasing to 97.5% by 2045, when only the
most remote steep sites and old informal settler areas remain unserviced.
5.3.2 Collection Efficiency in Serviced Area
Within the serviced area, there are collection inefficiencies because of waste remaining in
bunkers, spillage out of bunkers due to animal activity, illegal dumping, on-site disposal through
burial or burning and so on.
At present this is estimated to reduce collection efficiency to 70%. This should increase within
the first two years of the program to 75% and then to 80% by 2030.
The ultimate aim is of course to approach 100% collection efficiency, but this may only achieved
in the very long term following cultural changes which accept that littering is not desirable, and
supported as well by a campaign of fines associated with littering. However, significant changes
in the community attitude towards littering will be generational and not expected to be significant
in the life of the controlled landfill proposed. With the recommended improvements in this
report, it may be expected that the collection percentage will increase to over 90% by 2045.
5.4 Recycling Allowances
As the wealth of the community increases, the amount of waste generated will increase.
However, this does not translate into a proportional increase in the quantum of waste to be
collected and disposed of. The key changes with increasing wealth relates mostly to increased
packaging, for such as paper, cardboard, tins and bottles and minor increases in food waste.
So as the amount of waste generated per person increases, so does the amount of recyclables,
resulting in much smaller growth rate for the waste to be disposed of compared with the total
increase in the mass of waste generated.
5.4.1 Recycling at Primary Dumping Locations
The percentage of waste recycled from the primary disposal locations, as well as during
transport to the landfill has been estimated at 5% at present.
With the provision of recycling cages collocated at the bins and bunkers, it is expected that
recyclables’ recovery will immediately increase by some 50% to 7.5%.
With the option of greenwaste bunkers being provided, potentially 70% of the greenwaste could
be diverted for chipping for mulch, dust suppression, erosion control or composting. As
greenwaste makes up 33% of the total waste stream, recycling this component would provide a
further 22% diversion making 30% recycling overall at the primary dumping location in 2018.
30 | GHD | Report for Asian Development Bank – TA-8750 TIM: Preparing the Urban Services Improvement Sector Project, 5510101
This is expected to increase a further 10% to 40% overall by 2030, because of increased
recyclables content, better recovery systems and so on.
A further 5% increase to 45% is expected by 2045.
If greenwaste is not to be recycled, then the recycling at primary dumping locations will go from
7.5% to 17.5% by 2030, and 22.5% by 2045.
5.4.2 Recycling at Landfill
This is not expected to change significantly over time from the present estimated 5%.
The removal of greenwaste will make accessing and finding the recyclables easier for the waste
pickers as the waste will not be “diluted” by greenwaste, but this will be offset by greater
recyclables recovery from the recycling cages in Dili. Additionally, the move to compaction
vehicles will prevent haulage staff recovering recyclables during the haul from Dili to Tibar post
2018.
In the longer term as community wealth increases and the fraction of recyclables also increases,
it is likely that more comprehensive recycling activities will be initiated upstream prior to or at
primary dumping locations. This may be as a result of multiple bin systems being introduced at
household level or just greater private sector involvement in direct-to-household recovery
systems or increased emphasis on commercial or institutional activities.
Overall the future factors impacting upon scavenging recovery rates are compensatory and are
expected to cancel each other out in effect and the current 5% recovery by scavenging will
continue.
5.5 Compaction Allowance
There are two options for providing compaction at the controlled landfill. The most common is
the use of a tracked bulldozer which at the usual size of a D6 or D7 equivalent will consistently
achieve a bulk density of 500 to 600 kg per cubic metre (kg/m3). The current bulldozer is a D3
size which is barely adequate to move and profile waste, but insufficient to provide any
measurable compaction.
However, if a purpose built landfill compactor is used, then the smallest of the usual size range
(being a 25 tonne unit or a Caterpillar 816 equivalent) should achieve a density of up to 700
kg/m3. If the midsize compactor of about 35 tons (or a Caterpillar 826 equivalent) is used, then
the density would generally approach 900 kg/m3.
Because of the small size of the controlled landfill, it is proposed to purchase a slightly smaller
bulldozer such as a D6 which will be a suitable size to be able to push and shape the waste
quantities and provide some compaction. A dedicated landfill compactor (20 tonne unit) can
also be justified for the short to medium term waste loads.
The current in-situ density is estimated to be 350 kg/m3 prior to burning but after placement and
some compaction. Once the D6 equivalent dozer and small landfill compactor commence
operations, a density of 550 kg/m3 increasing to 650 kg/m3 over two years should be achieved
as the operators better understand how to use the equipment and general operations improve.
5.6 Soil Cover Allowance
Three types of soil cover are required to operate a landfill correctly. The first and possibly most
critical is the application of daily cover to a thickness of 100 to 150 millimetres. This cover
provides a multitude of engineering interventions including a reduction in water infiltration
leading to less leachate generated, less vermin on site, reduced bird numbers on site, reduced
litter and reduced odours.
GHD | Report for Asian Development Bank – TA-8750 TIM: Preparing the Urban Services Improvement Sector Project, 5510101 | 31
If an area of the controlled landfill is to be left unused for a period of a few months or more,
intermediate cover to a thickness of 300 mm should be applied.
Final cover usually consists of two layers. For the first layer is a 600 millimetre thick clay or silty
clay cap to prevent rainfall infiltration. This should be topped with a layer of growing medium of
compost to facilitate plant growth.
The application of all types of cover can contribute some 15 and to 25% of the total landfill
volume. However, smaller percentages are possible at well run landfills by recovering the daily
soil application prior to commencing another lift of waste.
For this study, it has been assumed that 10% of the total landfill volume will be cover material
initially. This is because it is expected that the daily cover may in fact be only applied on a
weekly basis or at some other lesser frequency. Over time this will increase to 20% as
operations improve.
5.7 Waste settlement
Waste settles over time and it has been assumed that 5% of the volume will be lost in the first
year, in accordance with recorded results from many landfills.
The waste will continue to compact at 0.5% per year on average over the following 30 years,
resulting in a total settlement of some 20%.
5.8 Airspace Consumption
Based on the above assumptions, the cumulative waste volume taken up at the controlled
landfill has been calculated on an annual basis.
Based on this theoretical waste volume, the controlled landfill stages have been sized.
Traditionally the first stage or cell at a controlled landfill should provide some 3 to 5 year’s
capacity. Typically, the overall controlled landfill site selected should have capacity for at least
25 plus years operation.
The design approach in this report is to have three main stages with the first stage to provide
approximately five years operation. By utilising over-topping techniques to eventually combine
the cells into one mound, the total life will be approximately 25 years as required.
The estimate of the landfill life is contingent upon the final decision on how to best remediate
the existing waste disposal site. In the table below, it has been assumed that all old waste is
placed into the new landfill as the first two lifts. This will effectively isolate the leachate
collection system form direct rainfall interception, which is highly desirable. The inert waste
fractions will be retained and used as daily cover material, whereas the soil under the old waste
will be reused as intermediate and final cover, provided that the laboratory tests confirm that the
soil is uncontaminated.
In reality there are numerous factors that could eventuate and impact upon the assumptions
and predictions for this predicted landfill life in the coming decades. However, these impacts
can be counteracting, such as a lower growth rate than that predicted could be contrasted
against a higher per person waste generation rate and so on.
Therefore, it is recommended that the following table of cumulative waste volume be adopted as
the best available predictions at this time. Any variations to the many components intrinsic to
this prediction will only alter the life of the controlled landfill and not the concept nor the basic
design approach. If the cumulative waste volume at the controlled landfill is either significantly
larger or smaller compared with the predictions below, then the later cell sizes can be amended
to compensate for these variations.
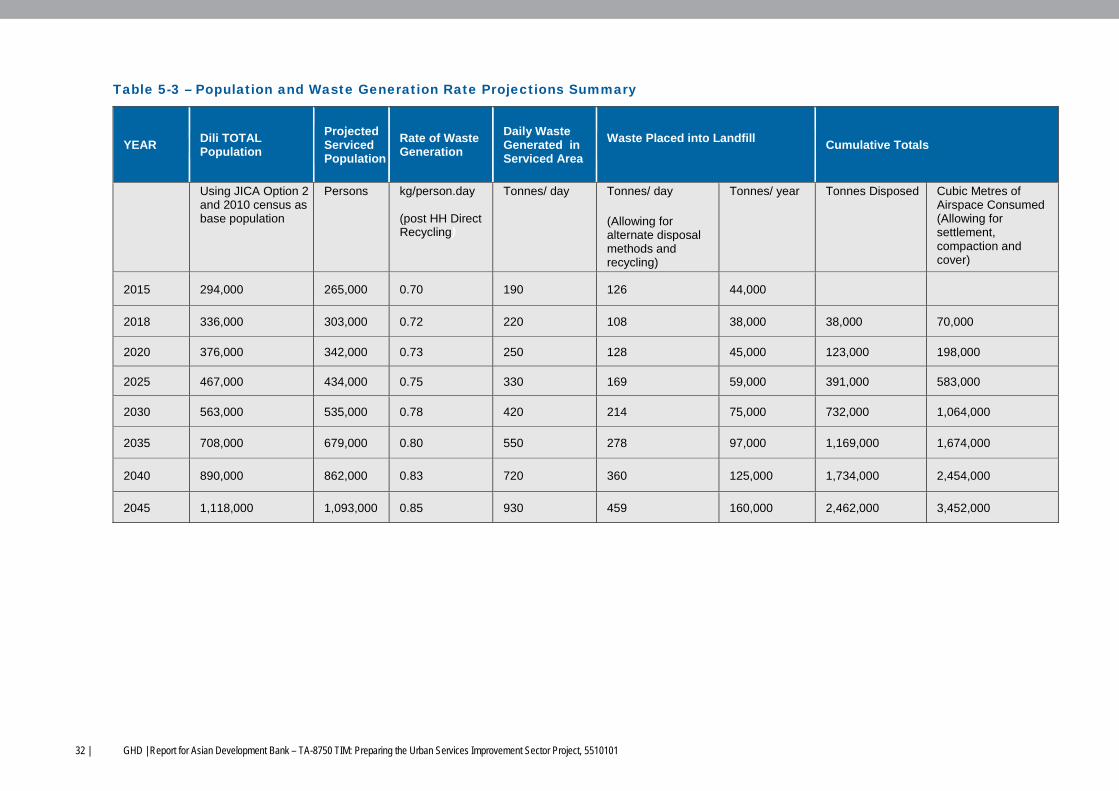
32 | GHD | Report for Asian Development Bank – TA-8750 TIM: Preparing the Urban Services Improvement Sector Project, 5510101
Table 5-3 – Population and Waste Generation Rate Projections Summary
YEAR Dili TOTAL Population
Projected Serviced Population
Rate of Waste Generation
Daily Waste Generated in Serviced Area
Waste Placed into Landfill
Cumulative Totals
Using JICA Option 2 and 2010 census as base population
Persons kg/person.day (post HH Direct Recycling)
Tonnes/ day Tonnes/ day (Allowing for alternate disposal methods and recycling)
Tonnes/ year Tonnes Disposed Cubic Metres of Airspace Consumed (Allowing for settlement, compaction and cover)
2015 294,000 265,000 0.70 190 126 44,000
2018 336,000 303,000 0.72 220 108 38,000 38,000 70,000
2020 376,000 342,000 0.73 250 128 45,000 123,000 198,000
2025 467,000 434,000 0.75 330 169 59,000 391,000 583,000
2030 563,000 535,000 0.78 420 214 75,000 732,000 1,064,000
2035 708,000 679,000 0.80 550 278 97,000 1,169,000 1,674,000
2040 890,000 862,000 0.83 720 360 125,000 1,734,000 2,454,000
2045 1,118,000 1,093,000 0.85 930 459 160,000 2,462,000 3,452,000
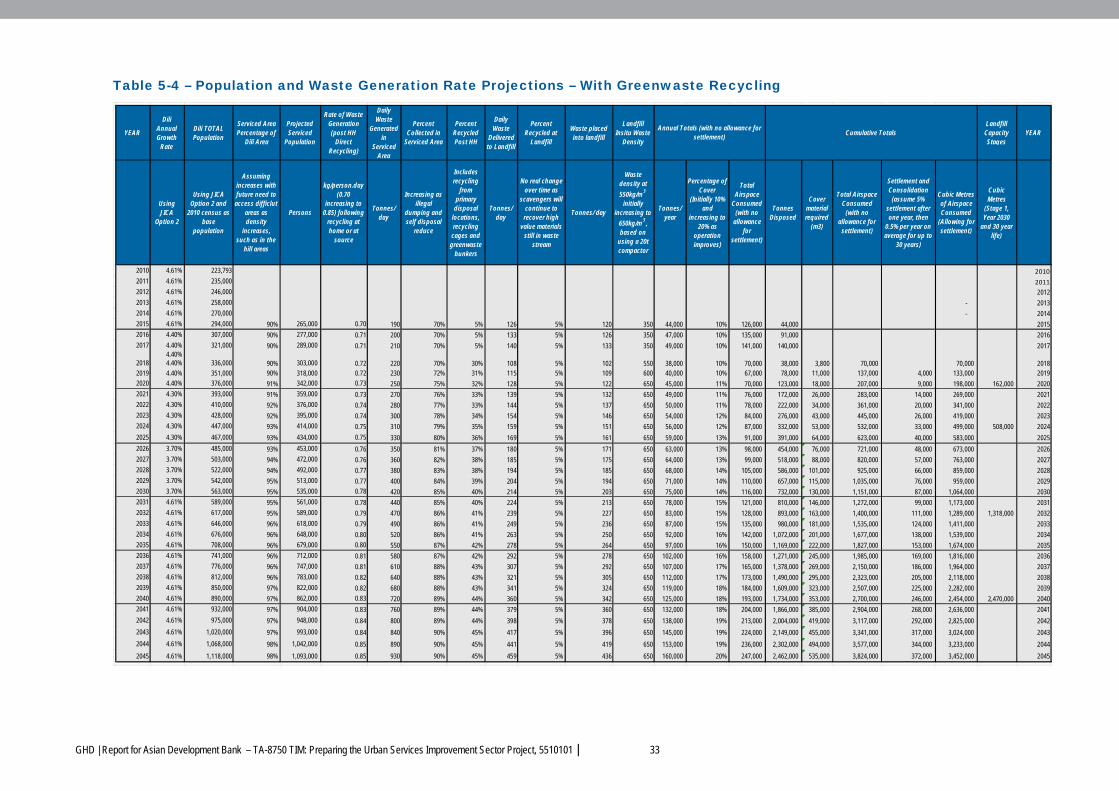
GHD | Report for Asian Development Bank – TA-8750 TIM: Preparing the Urban Services Improvement Sector Project, 5510101 | 33
Table 5-4 – Population and Waste Generation Rate Projections – With Greenwaste Recycling
YEAR
Dili Annual Growth
Rate
Dili TOTAL Population
Serviced Area Percentage of
Dili Area
Projected Serviced
Population
Rate of Waste Generation (post HH
Direct Recycling)
Daily Waste
Generated in
Serviced Area
Percent Collected in
Serviced Area
Percent Recycled Post HH
Daily Waste
Delivered to Landfill
Percent Recycled at
Landfill
Waste placed into landfill
Landfill Insitu Waste
Density
Landfill Capacity Stages
YEAR
Using JICA
Option 2
Using JICA Option 2 and
2010 census as base
population
Assuming increases with future need to
access difficlut areas as density
increases, such as in the
hill areas
Persons
kg/person.day (0.70
increasing to 0.85) following
recycling at home or at
source
Tonnes/ day
Increasing as illegal
dumping and self disposal
reduce
Includes recycling
from primary
disposal locations, recycling
cages and greenwaste
bunkers
Tonnes/ day
No real change over time as
scavengers will continue to
recover high value materials
still in waste stream
Tonnes/ day
Waste density at 550kg/m 3
initially increasing to
650kg/m 3 , based on
using a 20t compactor
Tonnes/ year
Percentage of Cover
(Initially 10% and
increasing to 20% as
operation improves)
Total Airspace
Consumed (with no
allowance for
settlement)
Tonnes Disposed
Cover material required
(m3)
Total Airspace Consumed
(with no allowance for
settlement)
Settlement and Consolidation
(assume 5% settlement after one year, then
0.5% per year on average for up to
30 years)
Cubic Metres of Airspace Consumed
(Allowing for settlement)
Cubic Metres
(Stage 1, Year 2030
and 30 year life)
2010 4.61% 223,793 2010
2011 4.61% 235,000 2011
2012 4.61% 246,000 2012
2013 4.61% 258,000 - 2013
2014 4.61% 270,000 - 2014
2015 4.61% 294,000 90% 265,000 0.70 190 70% 5% 126 5% 120 350 44,000 10% 126,000 44,000 2015
2016 4.40% 307,000 90% 277,000 0.71 200 70% 5% 133 5% 126 350 47,000 10% 135,000 91,000 2016
2017 4.40% 321,000 90% 289,000 0.71 210 70% 5% 140 5% 133 350 49,000 10% 141,000 140,000 20174.40%
2018 4.40% 336,000 90% 303,000 0.72 220 70% 30% 108 5% 102 550 38,000 10% 70,000 38,000 3,800 70,000 70,000 20182019 4.40% 351,000 90% 318,000 0.72 230 72% 31% 115 5% 109 600 40,000 10% 67,000 78,000 11,000 137,000 4,000 133,000 2019
2020 4.40% 376,000 91% 342,000 0.73 250 75% 32% 128 5% 122 650 45,000 11% 70,000 123,000 18,000 207,000 9,000 198,000 162,000 2020
2021 4.30% 393,000 91% 359,000 0.73 270 76% 33% 139 5% 132 650 49,000 11% 76,000 172,000 26,000 283,000 14,000 269,000 2021
2022 4.30% 410,000 92% 376,000 0.74 280 77% 33% 144 5% 137 650 50,000 11% 78,000 222,000 34,000 361,000 20,000 341,000 2022
2023 4.30% 428,000 92% 395,000 0.74 300 78% 34% 154 5% 146 650 54,000 12% 84,000 276,000 43,000 445,000 26,000 419,000 2023
2024 4.30% 447,000 93% 414,000 0.75 310 79% 35% 159 5% 151 650 56,000 12% 87,000 332,000 53,000 532,000 33,000 499,000 508,000 2024
2025 4.30% 467,000 93% 434,000 0.75 330 80% 36% 169 5% 161 650 59,000 13% 91,000 391,000 64,000 623,000 40,000 583,000 2025
2026 3.70% 485,000 93% 453,000 0.76 350 81% 37% 180 5% 171 650 63,000 13% 98,000 454,000 76,000 721,000 48,000 673,000 2026
2027 3.70% 503,000 94% 472,000 0.76 360 82% 38% 185 5% 175 650 64,000 13% 99,000 518,000 88,000 820,000 57,000 763,000 2027
2028 3.70% 522,000 94% 492,000 0.77 380 83% 38% 194 5% 185 650 68,000 14% 105,000 586,000 101,000 925,000 66,000 859,000 2028
2029 3.70% 542,000 95% 513,000 0.77 400 84% 39% 204 5% 194 650 71,000 14% 110,000 657,000 115,000 1,035,000 76,000 959,000 2029
2030 3.70% 563,000 95% 535,000 0.78 420 85% 40% 214 5% 203 650 75,000 14% 116,000 732,000 130,000 1,151,000 87,000 1,064,000 2030
2031 4.61% 589,000 95% 561,000 0.78 440 85% 40% 224 5% 213 650 78,000 15% 121,000 810,000 146,000 1,272,000 99,000 1,173,000 2031
2032 4.61% 617,000 95% 589,000 0.79 470 86% 41% 239 5% 227 650 83,000 15% 128,000 893,000 163,000 1,400,000 111,000 1,289,000 1,318,000 2032
2033 4.61% 646,000 96% 618,000 0.79 490 86% 41% 249 5% 236 650 87,000 15% 135,000 980,000 181,000 1,535,000 124,000 1,411,000 2033
2034 4.61% 676,000 96% 648,000 0.80 520 86% 41% 263 5% 250 650 92,000 16% 142,000 1,072,000 201,000 1,677,000 138,000 1,539,000 2034
2035 4.61% 708,000 96% 679,000 0.80 550 87% 42% 278 5% 264 650 97,000 16% 150,000 1,169,000 222,000 1,827,000 153,000 1,674,000 2035
2036 4.61% 741,000 96% 712,000 0.81 580 87% 42% 292 5% 278 650 102,000 16% 158,000 1,271,000 245,000 1,985,000 169,000 1,816,000 2036
2037 4.61% 776,000 96% 747,000 0.81 610 88% 43% 307 5% 292 650 107,000 17% 165,000 1,378,000 269,000 2,150,000 186,000 1,964,000 2037
2038 4.61% 812,000 96% 783,000 0.82 640 88% 43% 321 5% 305 650 112,000 17% 173,000 1,490,000 295,000 2,323,000 205,000 2,118,000 2038
2039 4.61% 850,000 97% 822,000 0.82 680 88% 43% 341 5% 324 650 119,000 18% 184,000 1,609,000 323,000 2,507,000 225,000 2,282,000 2039
2040 4.61% 890,000 97% 862,000 0.83 720 89% 44% 360 5% 342 650 125,000 18% 193,000 1,734,000 353,000 2,700,000 246,000 2,454,000 2,470,000 2040
2041 4.61% 932,000 97% 904,000 0.83 760 89% 44% 379 5% 360 650 132,000 18% 204,000 1,866,000 385,000 2,904,000 268,000 2,636,000 2041
2042 4.61% 975,000 97% 948,000 0.84 800 89% 44% 398 5% 378 650 138,000 19% 213,000 2,004,000 419,000 3,117,000 292,000 2,825,000 2042
2043 4.61% 1,020,000 97% 993,000 0.84 840 90% 45% 417 5% 396 650 145,000 19% 224,000 2,149,000 455,000 3,341,000 317,000 3,024,000 2043
2044 4.61% 1,068,000 98% 1,042,000 0.85 890 90% 45% 441 5% 419 650 153,000 19% 236,000 2,302,000 494,000 3,577,000 344,000 3,233,000 2044
2045 4.61% 1,118,000 98% 1,093,000 0.85 930 90% 45% 459 5% 436 650 160,000 20% 247,000 2,462,000 535,000 3,824,000 372,000 3,452,000 2045
Cumulative TotalsAnnual Totals (with no allowance for settlement)
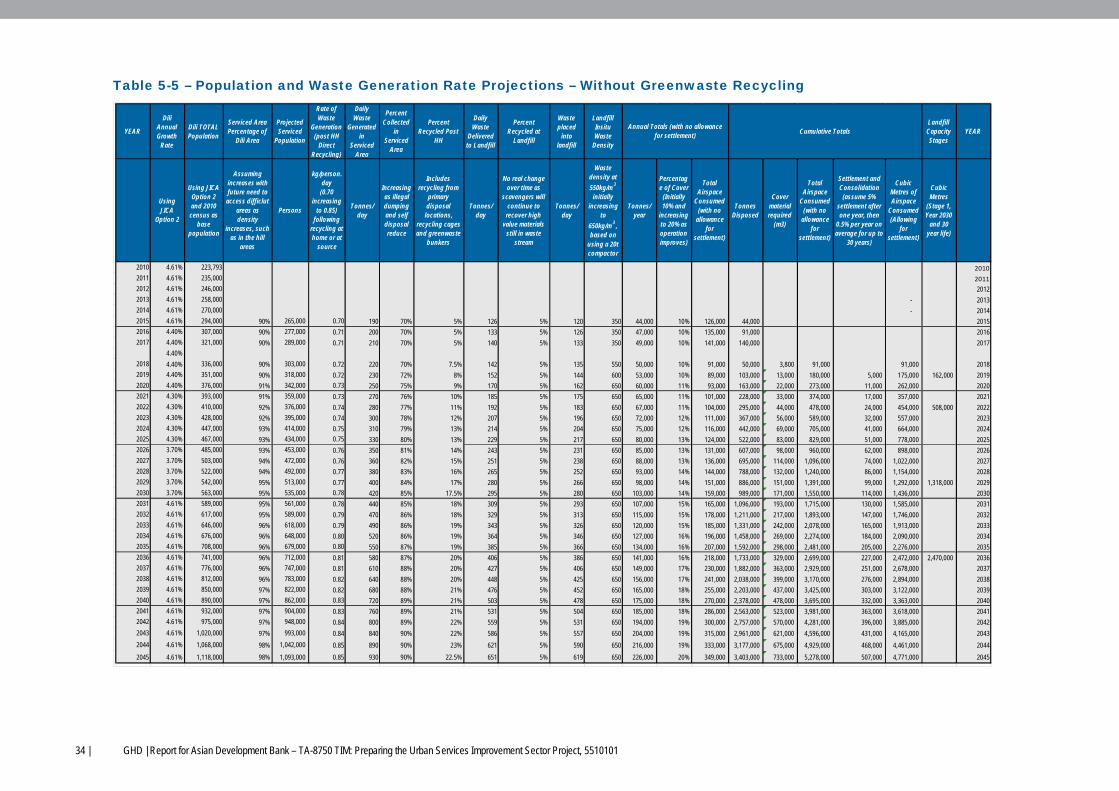
34 | GHD | Report for Asian Development Bank – TA-8750 TIM: Preparing the Urban Services Improvement Sector Project, 5510101
Table 5-5 – Population and Waste Generation Rate Projections – Without Greenwaste Recycling
YEAR
Dili Annual Growth
Rate
Dili TOTAL Population
Serviced Area Percentage of
Dili Area
Projected Serviced
Population
Rate of Waste
Generation (post HH
Direct Recycling)
Daily Waste
Generated in
Serviced Area
Percent Collected
in Serviced
Area
Percent Recycled Post
HH
Daily Waste
Delivered to Landfill
Percent Recycled at
Landfill
Waste placed
into landfill
Landfill Insitu Waste
Density
Landfill Capacity Stages
YEAR
Using JICA
Option 2
Using JICA Option 2 and 2010
census as base
population
Assuming increases with future need to
access difficlut areas as density
increases, such as in the hill
areas
Persons
kg/person.day
(0.70 increasing
to 0.85) following
recycling at home or at
source
Tonnes/ day
Increasing as illegal dumping and self disposal reduce
Includes recycling from
primary disposal
locations, recycling cages and greenwaste
bunkers
Tonnes/ day
No real change over time as
scavengers will continue to
recover high value materials
still in waste stream
Tonnes/ day
Waste density at 550kg/m 3
initially increasing
to 650kg/m 3 , based on
using a 20t compactor
Tonnes/ year
Percentage of Cover
(Initially 10% and
increasing to 20% as operation improves)
Total Airspace
Consumed (with no
allowance for
settlement)
Tonnes Disposed
Cover material required
(m3)
Total Airspace
Consumed (with no
allowance for
settlement)
Settlement and Consolidation
(assume 5% settlement after one year, then
0.5% per year on average for up to
30 years)
Cubic Metres of Airspace
Consumed (Allowing
for settlement)
Cubic Metres
(Stage 1, Year 2030
and 30 year life)
2010 4.61% 223,793 2010
2011 4.61% 235,000 2011
2012 4.61% 246,000 2012
2013 4.61% 258,000 - 2013
2014 4.61% 270,000 - 2014
2015 4.61% 294,000 90% 265,000 0.70 190 70% 5% 126 5% 120 350 44,000 10% 126,000 44,000 2015
2016 4.40% 307,000 90% 277,000 0.71 200 70% 5% 133 5% 126 350 47,000 10% 135,000 91,000 2016
2017 4.40% 321,000 90% 289,000 0.71 210 70% 5% 140 5% 133 350 49,000 10% 141,000 140,000 2017
4.40%
2018 4.40% 336,000 90% 303,000 0.72 220 70% 7.5% 142 5% 135 550 50,000 10% 91,000 50,000 3,800 91,000 91,000 2018
2019 4.40% 351,000 90% 318,000 0.72 230 72% 8% 152 5% 144 600 53,000 10% 89,000 103,000 13,000 180,000 5,000 175,000 162,000 2019
2020 4.40% 376,000 91% 342,000 0.73 250 75% 9% 170 5% 162 650 60,000 11% 93,000 163,000 22,000 273,000 11,000 262,000 2020
2021 4.30% 393,000 91% 359,000 0.73 270 76% 10% 185 5% 175 650 65,000 11% 101,000 228,000 33,000 374,000 17,000 357,000 2021
2022 4.30% 410,000 92% 376,000 0.74 280 77% 11% 192 5% 183 650 67,000 11% 104,000 295,000 44,000 478,000 24,000 454,000 508,000 2022
2023 4.30% 428,000 92% 395,000 0.74 300 78% 12% 207 5% 196 650 72,000 12% 111,000 367,000 56,000 589,000 32,000 557,000 2023
2024 4.30% 447,000 93% 414,000 0.75 310 79% 13% 214 5% 204 650 75,000 12% 116,000 442,000 69,000 705,000 41,000 664,000 2024
2025 4.30% 467,000 93% 434,000 0.75 330 80% 13% 229 5% 217 650 80,000 13% 124,000 522,000 83,000 829,000 51,000 778,000 2025
2026 3.70% 485,000 93% 453,000 0.76 350 81% 14% 243 5% 231 650 85,000 13% 131,000 607,000 98,000 960,000 62,000 898,000 2026
2027 3.70% 503,000 94% 472,000 0.76 360 82% 15% 251 5% 238 650 88,000 13% 136,000 695,000 114,000 1,096,000 74,000 1,022,000 2027
2028 3.70% 522,000 94% 492,000 0.77 380 83% 16% 265 5% 252 650 93,000 14% 144,000 788,000 132,000 1,240,000 86,000 1,154,000 2028
2029 3.70% 542,000 95% 513,000 0.77 400 84% 17% 280 5% 266 650 98,000 14% 151,000 886,000 151,000 1,391,000 99,000 1,292,000 1,318,000 2029
2030 3.70% 563,000 95% 535,000 0.78 420 85% 17.5% 295 5% 280 650 103,000 14% 159,000 989,000 171,000 1,550,000 114,000 1,436,000 2030
2031 4.61% 589,000 95% 561,000 0.78 440 85% 18% 309 5% 293 650 107,000 15% 165,000 1,096,000 193,000 1,715,000 130,000 1,585,000 2031
2032 4.61% 617,000 95% 589,000 0.79 470 86% 18% 329 5% 313 650 115,000 15% 178,000 1,211,000 217,000 1,893,000 147,000 1,746,000 2032
2033 4.61% 646,000 96% 618,000 0.79 490 86% 19% 343 5% 326 650 120,000 15% 185,000 1,331,000 242,000 2,078,000 165,000 1,913,000 2033
2034 4.61% 676,000 96% 648,000 0.80 520 86% 19% 364 5% 346 650 127,000 16% 196,000 1,458,000 269,000 2,274,000 184,000 2,090,000 2034
2035 4.61% 708,000 96% 679,000 0.80 550 87% 19% 385 5% 366 650 134,000 16% 207,000 1,592,000 298,000 2,481,000 205,000 2,276,000 2035
2036 4.61% 741,000 96% 712,000 0.81 580 87% 20% 406 5% 386 650 141,000 16% 218,000 1,733,000 329,000 2,699,000 227,000 2,472,000 2,470,000 2036
2037 4.61% 776,000 96% 747,000 0.81 610 88% 20% 427 5% 406 650 149,000 17% 230,000 1,882,000 363,000 2,929,000 251,000 2,678,000 2037
2038 4.61% 812,000 96% 783,000 0.82 640 88% 20% 448 5% 425 650 156,000 17% 241,000 2,038,000 399,000 3,170,000 276,000 2,894,000 2038
2039 4.61% 850,000 97% 822,000 0.82 680 88% 21% 476 5% 452 650 165,000 18% 255,000 2,203,000 437,000 3,425,000 303,000 3,122,000 2039
2040 4.61% 890,000 97% 862,000 0.83 720 89% 21% 503 5% 478 650 175,000 18% 270,000 2,378,000 478,000 3,695,000 332,000 3,363,000 2040
2041 4.61% 932,000 97% 904,000 0.83 760 89% 21% 531 5% 504 650 185,000 18% 286,000 2,563,000 523,000 3,981,000 363,000 3,618,000 2041
2042 4.61% 975,000 97% 948,000 0.84 800 89% 22% 559 5% 531 650 194,000 19% 300,000 2,757,000 570,000 4,281,000 396,000 3,885,000 2042
2043 4.61% 1,020,000 97% 993,000 0.84 840 90% 22% 586 5% 557 650 204,000 19% 315,000 2,961,000 621,000 4,596,000 431,000 4,165,000 2043
2044 4.61% 1,068,000 98% 1,042,000 0.85 890 90% 23% 621 5% 590 650 216,000 19% 333,000 3,177,000 675,000 4,929,000 468,000 4,461,000 2044
2045 4.61% 1,118,000 98% 1,093,000 0.85 930 90% 22.5% 651 5% 619 650 226,000 20% 349,000 3,403,000 733,000 5,278,000 507,000 4,771,000 2045
Annual Totals (with no allowance for settlement) Cumulative Totals
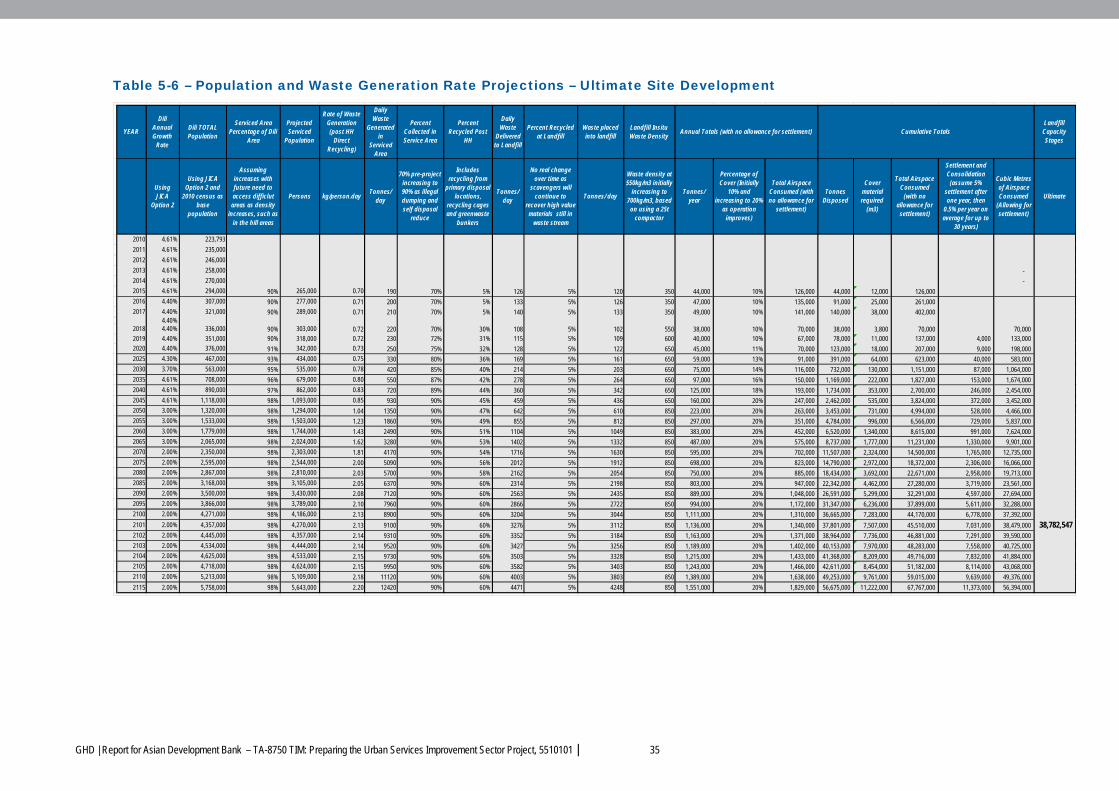
GHD | Report for Asian Development Bank – TA-8750 TIM: Preparing the Urban Services Improvement Sector Project, 5510101 | 35
Table 5-6 – Population and Waste Generation Rate Projections – Ultimate Site Development
YEAR
Dili Annual Growth
Rate
Dili TOTAL Population
Serviced Area Percentage of Dili
Area
Projected Serviced
Population
Rate of Waste Generation (post HH
Direct Recycling)
Daily Waste
Generated in
Serviced Area
Percent Collected in Service Area
Percent Recycled Post
HH
Daily Waste
Delivered to Landfill
Percent Recycled at Landfill
Waste placed into landfill
Landfill Insitu Waste Density
Landfill Capacity Stages
Using JICA
Option 2
Using JICA Option 2 and
2010 census as base
population
Assuming increases with future need to access difficlut
areas as density increases, such as
in the hill areas
Persons kg/person.day Tonnes/ day
70% pre-project increasing to 90% as illegal dumping and self disposal
reduce
Includes recycling from
primary disposal locations,
recycling cages and greenwaste
bunkers
Tonnes/ day
No real change over time as
scavengers will continue to
recover high value materials still in
waste stream
Tonnes/ day
Waste density at 550kg/m3 initially
increasing to 700kg/m3, based
on using a 25t compactor
Tonnes/ year
Percentage of Cover (Initially
10% and increasing to 20%
as operation improves)
Total Airspace Consumed (with no allowance for
settlement)
Tonnes Disposed
Cover material required
(m3)
Total Airspace Consumed
(with no allowance for
settlement)
Settlement and Consolidation (assume 5%
settlement after one year, then
0.5% per year on average for up to
30 years)
Cubic Metres of Airspace Consumed
(Allowing for settlement)
Ultimate
2010 4.61% 223,793
2011 4.61% 235,000
2012 4.61% 246,000
2013 4.61% 258,000 -
2014 4.61% 270,000 -
2015 4.61% 294,000 90% 265,000 0.70 190 70% 5% 126 5% 120 350 44,000 10% 126,000 44,000 12,000 126,000
2016 4.40% 307,000 90% 277,000 0.71 200 70% 5% 133 5% 126 350 47,000 10% 135,000 91,000 25,000 261,000
2017 4.40% 321,000 90% 289,000 0.71 210 70% 5% 140 5% 133 350 49,000 10% 141,000 140,000 38,000 402,000 4.40%
2018 4.40% 336,000 90% 303,000 0.72 220 70% 30% 108 5% 102 550 38,000 10% 70,000 38,000 3,800 70,000 70,000 2019 4.40% 351,000 90% 318,000 0.72 230 72% 31% 115 5% 109 600 40,000 10% 67,000 78,000 11,000 137,000 4,000 133,000
2020 4.40% 376,000 91% 342,000 0.73 250 75% 32% 128 5% 122 650 45,000 11% 70,000 123,000 18,000 207,000 9,000 198,000
2025 4.30% 467,000 93% 434,000 0.75 330 80% 36% 169 5% 161 650 59,000 13% 91,000 391,000 64,000 623,000 40,000 583,000
2030 3.70% 563,000 95% 535,000 0.78 420 85% 40% 214 5% 203 650 75,000 14% 116,000 732,000 130,000 1,151,000 87,000 1,064,000
2035 4.61% 708,000 96% 679,000 0.80 550 87% 42% 278 5% 264 650 97,000 16% 150,000 1,169,000 222,000 1,827,000 153,000 1,674,000
2040 4.61% 890,000 97% 862,000 0.83 720 89% 44% 360 5% 342 650 125,000 18% 193,000 1,734,000 353,000 2,700,000 246,000 2,454,000
2045 4.61% 1,118,000 98% 1,093,000 0.85 930 90% 45% 459 5% 436 650 160,000 20% 247,000 2,462,000 535,000 3,824,000 372,000 3,452,000
2050 3.00% 1,320,000 98% 1,294,000 1.04 1350 90% 47% 642 5% 610 850 223,000 20% 263,000 3,453,000 731,000 4,994,000 528,000 4,466,000
2055 3.00% 1,533,000 98% 1,503,000 1.23 1860 90% 49% 855 5% 812 850 297,000 20% 351,000 4,784,000 996,000 6,566,000 729,000 5,837,000
2060 3.00% 1,779,000 98% 1,744,000 1.43 2490 90% 51% 1104 5% 1049 850 383,000 20% 452,000 6,520,000 1,340,000 8,615,000 991,000 7,624,000
2065 3.00% 2,065,000 98% 2,024,000 1.62 3280 90% 53% 1402 5% 1332 850 487,000 20% 575,000 8,737,000 1,777,000 11,231,000 1,330,000 9,901,000
2070 2.00% 2,350,000 98% 2,303,000 1.81 4170 90% 54% 1716 5% 1630 850 595,000 20% 702,000 11,507,000 2,324,000 14,500,000 1,765,000 12,735,000
2075 2.00% 2,595,000 98% 2,544,000 2.00 5090 90% 56% 2012 5% 1912 850 698,000 20% 823,000 14,790,000 2,972,000 18,372,000 2,306,000 16,066,000
2080 2.00% 2,867,000 98% 2,810,000 2.03 5700 90% 58% 2162 5% 2054 850 750,000 20% 885,000 18,434,000 3,692,000 22,671,000 2,958,000 19,713,000
2085 2.00% 3,168,000 98% 3,105,000 2.05 6370 90% 60% 2314 5% 2198 850 803,000 20% 947,000 22,342,000 4,462,000 27,280,000 3,719,000 23,561,000
2090 2.00% 3,500,000 98% 3,430,000 2.08 7120 90% 60% 2563 5% 2435 850 889,000 20% 1,048,000 26,591,000 5,299,000 32,291,000 4,597,000 27,694,000
2095 2.00% 3,866,000 98% 3,789,000 2.10 7960 90% 60% 2866 5% 2722 850 994,000 20% 1,172,000 31,347,000 6,236,000 37,899,000 5,611,000 32,288,000
2100 2.00% 4,271,000 98% 4,186,000 2.13 8900 90% 60% 3204 5% 3044 850 1,111,000 20% 1,310,000 36,665,000 7,283,000 44,170,000 6,778,000 37,392,000
2101 2.00% 4,357,000 98% 4,270,000 2.13 9100 90% 60% 3276 5% 3112 850 1,136,000 20% 1,340,000 37,801,000 7,507,000 45,510,000 7,031,000 38,479,000 38,782,547 2102 2.00% 4,445,000 98% 4,357,000 2.14 9310 90% 60% 3352 5% 3184 850 1,163,000 20% 1,371,000 38,964,000 7,736,000 46,881,000 7,291,000 39,590,000
2103 2.00% 4,534,000 98% 4,444,000 2.14 9520 90% 60% 3427 5% 3256 850 1,189,000 20% 1,402,000 40,153,000 7,970,000 48,283,000 7,558,000 40,725,000
2104 2.00% 4,625,000 98% 4,533,000 2.15 9730 90% 60% 3503 5% 3328 850 1,215,000 20% 1,433,000 41,368,000 8,209,000 49,716,000 7,832,000 41,884,000
2105 2.00% 4,718,000 98% 4,624,000 2.15 9950 90% 60% 3582 5% 3403 850 1,243,000 20% 1,466,000 42,611,000 8,454,000 51,182,000 8,114,000 43,068,000
2110 2.00% 5,213,000 98% 5,109,000 2.18 11120 90% 60% 4003 5% 3803 850 1,389,000 20% 1,638,000 49,253,000 9,761,000 59,015,000 9,639,000 49,376,000
2115 2.00% 5,758,000 98% 5,643,000 2.20 12420 90% 60% 4471 5% 4248 850 1,551,000 20% 1,829,000 56,675,000 11,222,000 67,767,000 11,373,000 56,394,000
Annual Totals (with no allowance for settlement) Cumulative Totals
36 | GHD | Report for Asian Development Bank – TA-8750 TIM: Preparing the Urban Services Improvement Sector Project 5510101
6. Waste Bins and Containers 6.1 Current System
In overview, community based collections services are provided for the residents in Dili, and not
door to door collections. The serviced area of Dili is some 2,815 hectares in area with 176
kilometres of roads and lanes.
Generally waste is loaded into trucks by hand from about 200 concrete hoppers positioned at
neighbourhoods. The first 100 of these were constructed in 2002. Unfortunately, the gates to
these bunkers have been widely removed by thieves using them for animal pens and similar
uses. Also some hoppers have been privately built for residential and commercial complexes.
Finally, there are hooklift truck skips at market sites and bins at public places.
This is collected by up to 40 vehicles hired through the DDA (targeting two to three return trips
to the dumpsite per day), 20 government vehicles (targeting 2 return trips to the dumpsite per
day) and approximately 20 private sector vehicles serving various institutional and commercial
activities. There is a very small amount of door-to-door collection provided by private
contractors (such as Anteater) that mainly transport plastic mobile garbage bins. Collectively
this indicates that a theoretical maximum of some 160 vehicles a day could be travelling to Tibar
dumpsite. In reality it rarely exceeds 120 vehicles per day.
The main haulage vehicles are generally small six wheel tipping trucks with a carrying capacity
of approximately three tonnes. However, given the low density of waste within these vehicles,
they are often only caring approximately one tonne even when essentially full.
There are also a number of enclosed vehicles used by various institutions, as well as a small
number of trailer and utility vehicles carrying plastic mobile garbage bins from various
residences.
As a result, there are on average approximately 115 vehicle movements a day to and from the
Tibar dumping site.
Some of the coastal areas use recycled rice bags to store rubbish for collection. This is to be
encouraged as these bags can be recycled, as they are internationally, to avoid single use
plastic bags for rubbish disposal.
From a community development perspective, it is noted that some villagers bring informal waste
dumping habits with them when they move to the city. This aspect of substandard waste
management practices will be addressed by the social development activities of this project.
Whilst the overall collection system is not ideal, it must be acknowledged that the streets and
gutters, road verges, vacant lots and drains are generally almost litter free. The general tidiness
in Dili regarding fly dumping and litter is much better than many comparable countries, and the
DDA should be recognised for their successes to date.
6.2 Possible Waste and Recyclables Collection Options
6.2.1 Background
In considering the current solid waste management system in Dili, several enhancements are
suggested for detailed review.
Waste is mixed or “comingled” meaning waste pickers at Tibar must sift manually through the
waste to extract metals, PET bottles and green waste for the composting plant, with associated
GHD | Report for Asian Development Bank – TA-8750 TIM: Preparing the Urban Services Improvement Sector Project, 5510101 | 37
risks of injury and contamination of the recovered materials. The triple handling of the waste and
recyclables limits the number of trips to the landfill each day and increases truck congestion in
the city and costs for fuel and labour.
In the case of co-mingled green waste intended to produce soil products for farming, the
presence of small quantities of heavy metals such as dry cell batteries and broken glass will
mean the compost would fail international standards for safe use in agriculture.
6.2.2 Waste Transfer Stations
The prospect for use of waste transfer stations is a low priority, given the proximity to the Tibar
site and the air space available there. Generally haul distances in excess of 20km each way
are required before transfer stations become feasible.
The review of Dili collection requirements may require some minor transfer stations to interface
between hand trolleys and compactor trucks, but these will likely be strategically-placed skip
bins, rather than a permanent facility or building. Street sweeper/ vacuum trucks will have a
loading ramp to allow disposal of the dirt and debris to an open skip sized to suit the unit and
either compactor truck emptied or a hook truck for larger skips.
There might be a prospect of expanding organised scavenging at Tibar through a facility such
as conveyors running waste to a push pit where remnant waste can be compacted by a dozer
and pushed into a transfer vehicle for conveying to the working cell of the landfill. This is a form
of transfer station. The proposed plasma arc plant from Taiwan would require pre-sorting of
metals and inert materials as wet and inert materials use more power to convert to molten slag
in the process and reduce syngas production.
Should the concept for Dili waste management invite a relatively simple expansion of services to
aldeas or sucos outside the urban precincts of Dili, then local transfer stations might be
considered. Economies of scale for recycling and location of sucos en-route to possible future
recycling outlets such as the cement plant in Baucau, might allow transit villages to join in
collection and conveyance of waste or selected recyclables - for fuel, recycling or export for re-
use (such as lead-acid batteries).
6.3 Overview Concept for Waste Containers
The concept is basically to build upon the numerous concrete walled bunkers currently
constructed and to which neighbouring houses bring most of their waste.
These open bins are subject to interference by domestic animals – pigs and dogs, as well as
goats and vermin - which can spread the waste and makes evidence of illegal tipping by
residents almost impossible to prove or enforce. Many metal gates have been stolen from
these bins, increasing animal access. There are also informal piles of waste where a bin is
considered by residents as too distant.
By keeping these bins for the green waste component (which is less attractive to animals), a
source of recyclable material free from heavy metals and broken glass can be processed into
soil for use in gardens, farming plots, hillside and landfill erosion stabilization and parks
beautification all over Dili and Timor-Leste. Informal waste sampling in 2012 and comments
from locals suggest up to 40% of the waste collected is green waste. The project audit
confirmed 33% is green waste. More green waste collection occurs in the wet season or
following major storms with tree damage.
The concept is to supply a steel skip bin placed adjacent to the bunker - which is not accessible
to domestic animals - and which would store one week of domestic “putrescible” waste carried
to the skips by households. It is noted that not all households have street or road access and
38 | GHD | Report for Asian Development Bank – TA-8750 TIM: Preparing the Urban Services Improvement Sector Project 5510101
so individual household bins would be difficult to implement. Plastic wheelie bins (Mobile
Garbage Bins - MGBs) for storage of other household and commercial materials are also
vulnerable to vandalism, to fire and to widespread theft. For completeness in comparing
options, it is intended to show a door-to-door collection model utilising wheelie bins, although
the separation of green waste to bunkers would probably be adversely affected by this option to
place bins outside most homes.
This green waste bunker system would provide segregation for one third of the waste stream.
The next stage of development would be to ask householders and passers-by using the bins to
deposit recyclables into a special metal cage or roofed bin. The concept provides for a simple
metal cage covered in cyclone fence mesh with appropriate sized openings at the front or top to
admit recyclables. This would initially target plastic PET bottles, but could be extended as
markets develop and an education campaign takes effect. The aluminium is scavenged door-
to-door currently and is far more valuable and the wire mesh recycling cages would be targets
for theft if aluminium was included.
The waste audit confirmed large quantities of cardboard, but this should not be stored in open
mesh containers in case it becomes wet. A better option would be to encourage the private
sector to place covered bins near significant producers of waste cardboard and paper for
compaction and later collection and recycling. Candidates would be shopping complexes such
as Timor Plaza, universities and schools, as well as commercial premises importing materials
with extensive packaging such as whitegoods, etc. Haburas Foundation has recently
purchased four fire log presses to be installed in Dili and commencing in April will consume 4 to
8 tonnes per day of paper, cardboard, coffee chips and timber shards to produce alternative fuel
logs.
The options for waste handling, collection (and also recycling covered later) respond to current
practices, amended progressively to a more effective materials handling and recovery system
over the 15 years to 2033.
The preferred systems are described, but pending consumer feedback on the likely costs, all
have the do-nothing option as a fall-back position and improvements are chosen to be
consistent with keeping the current regime should no new initiative be supported.
Of course, the pending contract between the Government of Timor-Leste and a Taiwanese
company to build a plasma arc gasification to power generation plant at Tibar has a profound
effects on priorities for kerbside separation and the survival of various recycling activities.
Because we are informed that current recyclers may be exempt from the new plant operations,
this report prioritises emergent and established recyclers over new and untried initiatives.
6.4 Time Frames
In terms of timing options, the near term and medium term occupy the first five to 10 years
respectively. All the equipment required has a working life of at least 10 years and as such, the
only change from the short term to the medium term would be the purchase of more equipment
in response to a growing population and therefore waste mass. It is considered that the
significant changes from the current waste containers and collection systems should be made to
the preferred system in one move rather than staging this over a number of years which can
lead to confusion in the community. Therefore as mentioned above, the only change from the
near term to the medium term will be the purchase of some additional equipment in response to
the increasing waste mass.
Ten years from the start (what is described as long term in the terms of reference) would be an
appropriate time for an overall review of the waste containers and collection systems. This
would be an opportunity to consider door to door collection services and other refinements to
GHD | Report for Asian Development Bank – TA-8750 TIM: Preparing the Urban Services Improvement Sector Project, 5510101 | 39
the system, as well as purchase more equipment required for the increasing population and
waste load. This would also reflect any advances in waste processing such as improved Waste
to Energy Systems for small mass loads or improved recycling opportunities due to the
possibility of local recycling companies being established, such as local plastics manufacturers
or bottling plants which can reuse local recyclables rather than having to export them for
recycling.
6.5 Near Term
In the short term say 2018 - 2023, the City needs to procure modern plant and equipment for its
waste collection and recycling initiatives, whilst expanding the service to the targets within this
report (or such targets as amended by experience in operation). Most of the plant procured in
2018 will have a service life of 10 to 15 years and so this “near-term” stage considers what is
required to be operating at or near 2028. There will be staged procurement to match growth and lessons learnt during the “medium term”.
As urban planning has been undertaken for Dili and advice given that growth will largely be by
infill of Comoro and Tibar to the District boundary with Liquica to the west and out to Hera in the
east, it is assumed that the street and housing densities will be regulated to allow access of the
larger, more efficient collection vehicles and recyclers’ trucks.
The short and medium term is aimed at kerbside segregation of waste, reduction in transported
volumes and modern compaction fleet for putrescible and household waste collection. The fleet
mix is dependent upon segregation of waste, so all must proceed simultaneously.
However, if the Taiwanese company initiates its plasma arc gasification plant, the contract
requires all municipal waste to be directed to Tibar under the contract. Existing recyclers will be
exempt and the plant does not desire metals, so those activities and established plastic,
cardboard and composting operations may continue. Their ability to expand operations is
unclear as the plant will seek organics for its process, including plastics and woody waste and
paper etc.
The incentive for kerbside waste segregation is diminished in this instance and the City may
decide in the near or medium term to continue with the co-mingled concrete bunker waste and
open trucks, allowing the contractor to sort and shred waste as it enters the plant at Tibar.
There are, however, cost savings in transportation to be had in using compactor fleets and tree
chipping, whatever the destination for the waste.
In summary the proposed components are as follows:
Construction of replacement concrete bunkers and additional bunkers at strategic
collection points throughout the City. Approximately 1200 bunkers will be needed by
2018. These will introduce the 100 metres from the house service for co-mingled
waste and will be serviced by the existing truck fleet contracts to Tibar. These bunkers
will become green waste bunkers in the medium term;
Expansion of the street sweepers numbers and activities to collect waste door to door
or from stockpiles within areas not accessed by the trucks and bring it to bunkers;
Passing of legislation by the Government of Timor-Leste to allow export of recyclables
identified in this report and including some hazardous items such as lead-acid
batteries. Also completion of draft legislation governing waste management –
avoidance, minimisation and disposal;
Placement of wire cages for PET and HDPE bottle collection at selected sites with
security services such as shopping centres. This will continue on from the 28 cages
already deployed by Hopesellers. It is a private venture on a profit-making basis and
will not be costed in this report;
40 | GHD | Report for Asian Development Bank – TA-8750 TIM: Preparing the Urban Services Improvement Sector Project 5510101
Procure compactor truck fleet based on service area targets and accessibility criteria.
Allow for weekly or twice weekly collection of household waste dependent upon
customer surveys and servicing costs. Add to fleet as Dili grows;
Procure steel skips – 4 cubic metre for main and collector roads and 1200 Litre for
smaller streets to collect household waste and putrescibles only;
Divert using concrete bunkers for comingles waste to only green waste usage after
education campaign;
Procure chippers and contract trucks to reduce the volume and collect green waste
chips for composting/ mulch/ daily cover for the landfill. Alternatively, collect to open
trucks and transport to compost plant or landfill;
Confirm markets and commence large scale open-windrow composting. Alternatively
take to landfill for disposal and/or daily cover to active cells;
Review septage trials and procure specialised equipment for septage mixing with
compost heaps and for windrow turning. Hire delivery trucks for product distribution to
Government agencies and private outlets;
Procure some vacuum broom trucks (street sweepers) for cleaning the main avenues
and tourist parks and trial their efficacy in reducing street litter and improving drainage
system performance;
Procure or offer small loans to the private sector for procuring tyre wall cutters;
cardboard and paper compactor/balers; PET flake compactors; aluminium can balers;
Broker a local exporter for lead-acid batteries with international guidance from
Westernwave and export to suitable recycler such as the South Korean firms;
Micro loans to individuals or village groups to manufacture re-usable bags for
shopping and other re-manufactured products from recyclables;
Co-ordinate and encourage refuse derived fuel initiatives such as Haburas fire logs
and Baucau Cement Plant power station furnaces to accept soiled paper, cardboard,
tyres and plastic bags, oil;
Broker service relationships between large waste generators such as Timor-Plaza and
recyclers or energy-derived fuel outlets. Liaise with returning shipping containers and
trucks to Baucau City, Baucua Port and internationally;
Trialling of open windrow compost, possibly incorporating septage sludge at the H3R
facility at Tibar or other possible operators;
Co-ordination of recyclers’ initiatives to collect and compact waste to minimise
shipping costs and fill containers returning to foreign ports with recycling facilities.
Provide a co-ordinated approach to shipping agencies and buyers through information
data bases, business plan advice and technical support. Link metal recyclers with
plastic and paper products to fill 40 foot containers and stay under 26 Tonnes limit.
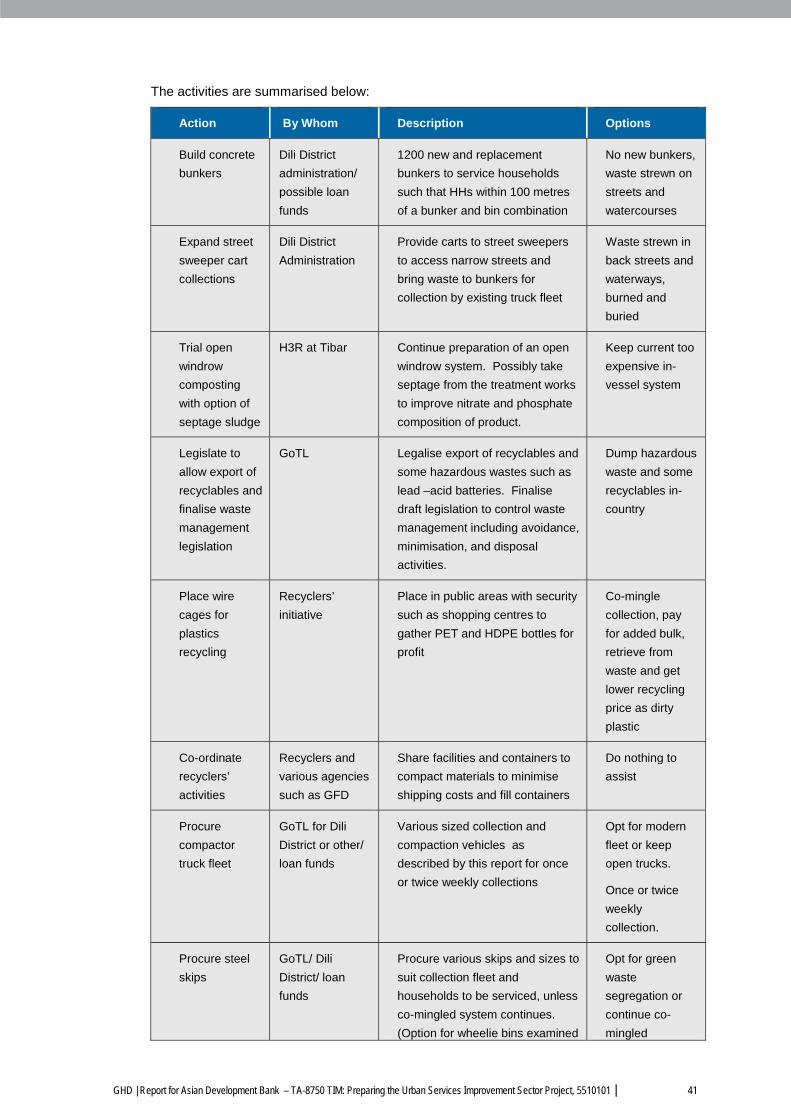
GHD | Report for Asian Development Bank – TA-8750 TIM: Preparing the Urban Services Improvement Sector Project, 5510101 | 41
The activities are summarised below:
Action By Whom Description Options
Build concrete
bunkers
Dili District
administration/
possible loan
funds
1200 new and replacement
bunkers to service households
such that HHs within 100 metres
of a bunker and bin combination
No new bunkers,
waste strewn on
streets and
watercourses
Expand street
sweeper cart
collections
Dili District
Administration
Provide carts to street sweepers
to access narrow streets and
bring waste to bunkers for
collection by existing truck fleet
Waste strewn in
back streets and
waterways,
burned and
buried
Trial open
windrow
composting
with option of
septage sludge
H3R at Tibar Continue preparation of an open
windrow system. Possibly take
septage from the treatment works
to improve nitrate and phosphate
composition of product.
Keep current too
expensive in-
vessel system
Legislate to
allow export of
recyclables and
finalise waste
management
legislation
GoTL Legalise export of recyclables and
some hazardous wastes such as
lead –acid batteries. Finalise
draft legislation to control waste
management including avoidance,
minimisation, and disposal
activities.
Dump hazardous
waste and some
recyclables in-
country
Place wire
cages for
plastics
recycling
Recyclers’
initiative
Place in public areas with security
such as shopping centres to
gather PET and HDPE bottles for
profit
Co-mingle
collection, pay
for added bulk,
retrieve from
waste and get
lower recycling
price as dirty
plastic
Co-ordinate
recyclers’
activities
Recyclers and
various agencies
such as GFD
Share facilities and containers to
compact materials to minimise
shipping costs and fill containers
Do nothing to
assist
Procure
compactor
truck fleet
GoTL for Dili
District or other/
loan funds
Various sized collection and
compaction vehicles as
described by this report for once
or twice weekly collections
Opt for modern
fleet or keep
open trucks.
Once or twice
weekly
collection.
Procure steel
skips
GoTL/ Dili
District/ loan
funds
Procure various skips and sizes to
suit collection fleet and
households to be serviced, unless
co-mingled system continues.
(Option for wheelie bins examined
Opt for green
waste
segregation or
continue co-
mingled
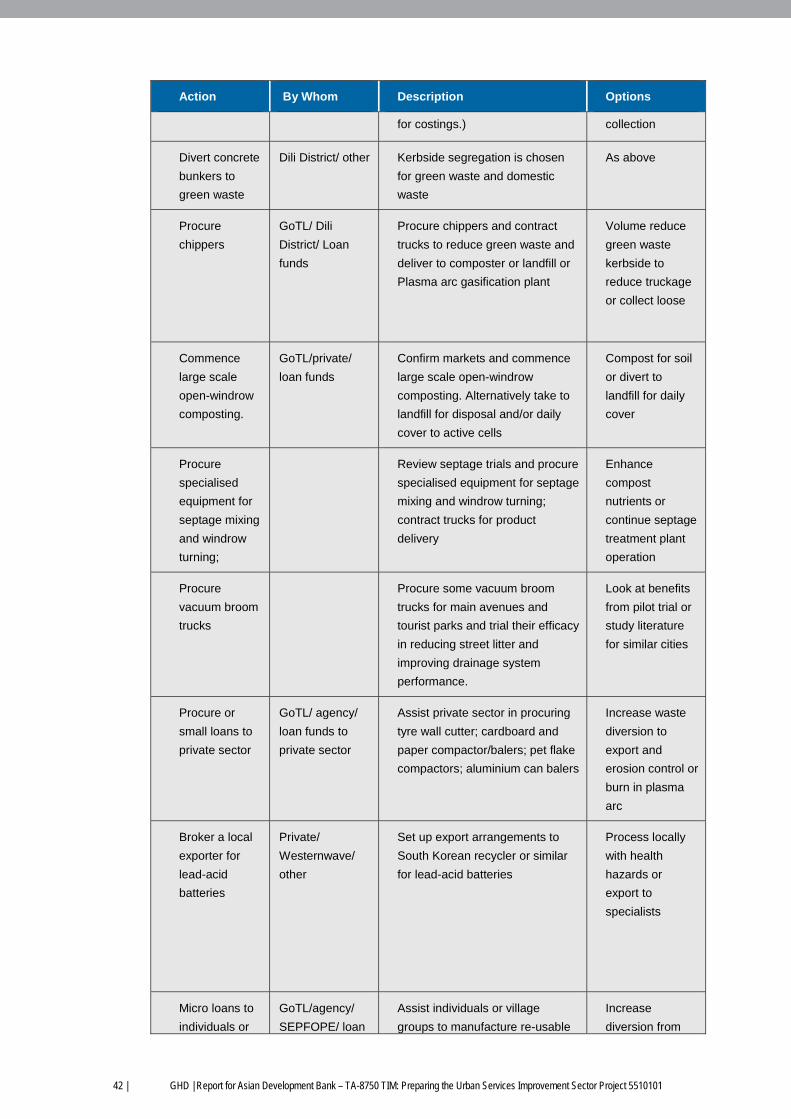
42 | GHD | Report for Asian Development Bank – TA-8750 TIM: Preparing the Urban Services Improvement Sector Project 5510101
Action By Whom Description Options
for costings.) collection
Divert concrete
bunkers to
green waste
Dili District/ other Kerbside segregation is chosen
for green waste and domestic
waste
As above
Procure
chippers
GoTL/ Dili
District/ Loan
funds
Procure chippers and contract
trucks to reduce green waste and
deliver to composter or landfill or
Plasma arc gasification plant
Volume reduce
green waste
kerbside to
reduce truckage
or collect loose
Commence
large scale
open-windrow
composting.
GoTL/private/
loan funds
Confirm markets and commence
large scale open-windrow
composting. Alternatively take to
landfill for disposal and/or daily
cover to active cells
Compost for soil
or divert to
landfill for daily
cover
Procure
specialised
equipment for
septage mixing
and windrow
turning;
Review septage trials and procure
specialised equipment for septage
mixing and windrow turning;
contract trucks for product
delivery
Enhance
compost
nutrients or
continue septage
treatment plant
operation
Procure
vacuum broom
trucks
Procure some vacuum broom
trucks for main avenues and
tourist parks and trial their efficacy
in reducing street litter and
improving drainage system
performance.
Look at benefits
from pilot trial or
study literature
for similar cities
Procure or
small loans to
private sector
GoTL/ agency/
loan funds to
private sector
Assist private sector in procuring
tyre wall cutter; cardboard and
paper compactor/balers; pet flake
compactors; aluminium can balers
Increase waste
diversion to
export and
erosion control or
burn in plasma
arc
Broker a local
exporter for
lead-acid
batteries
Private/
Westernwave/
other
Set up export arrangements to
South Korean recycler or similar
for lead-acid batteries
Process locally
with health
hazards or
export to
specialists
Micro loans to
individuals or
GoTL/agency/
SEPFOPE/ loan
Assist individuals or village
groups to manufacture re-usable
Increase
diversion from
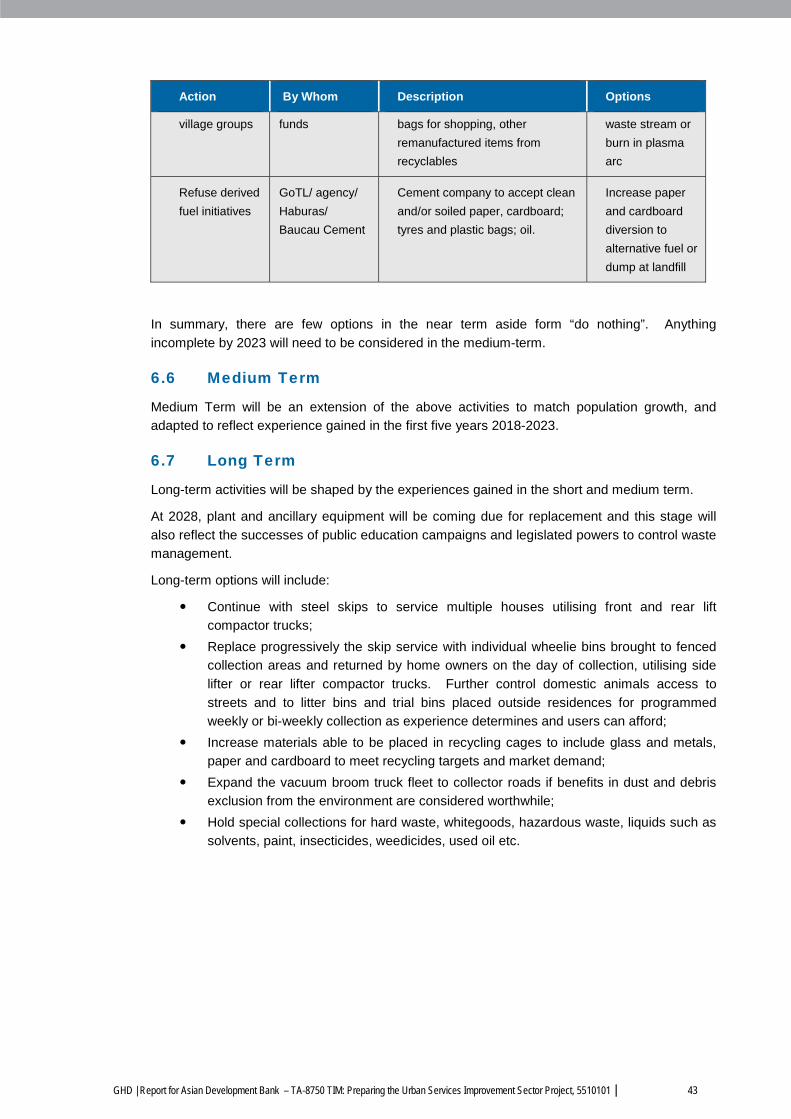
GHD | Report for Asian Development Bank – TA-8750 TIM: Preparing the Urban Services Improvement Sector Project, 5510101 | 43
Action By Whom Description Options
village groups funds bags for shopping, other
remanufactured items from
recyclables
waste stream or
burn in plasma
arc
Refuse derived
fuel initiatives
GoTL/ agency/
Haburas/
Baucau Cement
Cement company to accept clean
and/or soiled paper, cardboard;
tyres and plastic bags; oil.
Increase paper
and cardboard
diversion to
alternative fuel or
dump at landfill
In summary, there are few options in the near term aside form “do nothing”. Anything
incomplete by 2023 will need to be considered in the medium-term.
6.6 Medium Term
Medium Term will be an extension of the above activities to match population growth, and
adapted to reflect experience gained in the first five years 2018-2023.
6.7 Long Term
Long-term activities will be shaped by the experiences gained in the short and medium term.
At 2028, plant and ancillary equipment will be coming due for replacement and this stage will
also reflect the successes of public education campaigns and legislated powers to control waste
management.
Long-term options will include:
Continue with steel skips to service multiple houses utilising front and rear lift
compactor trucks;
Replace progressively the skip service with individual wheelie bins brought to fenced
collection areas and returned by home owners on the day of collection, utilising side
lifter or rear lifter compactor trucks. Further control domestic animals access to
streets and to litter bins and trial bins placed outside residences for programmed
weekly or bi-weekly collection as experience determines and users can afford;
Increase materials able to be placed in recycling cages to include glass and metals,
paper and cardboard to meet recycling targets and market demand;
Expand the vacuum broom truck fleet to collector roads if benefits in dust and debris
exclusion from the environment are considered worthwhile;
Hold special collections for hard waste, whitegoods, hazardous waste, liquids such as
solvents, paint, insecticides, weedicides, used oil etc.
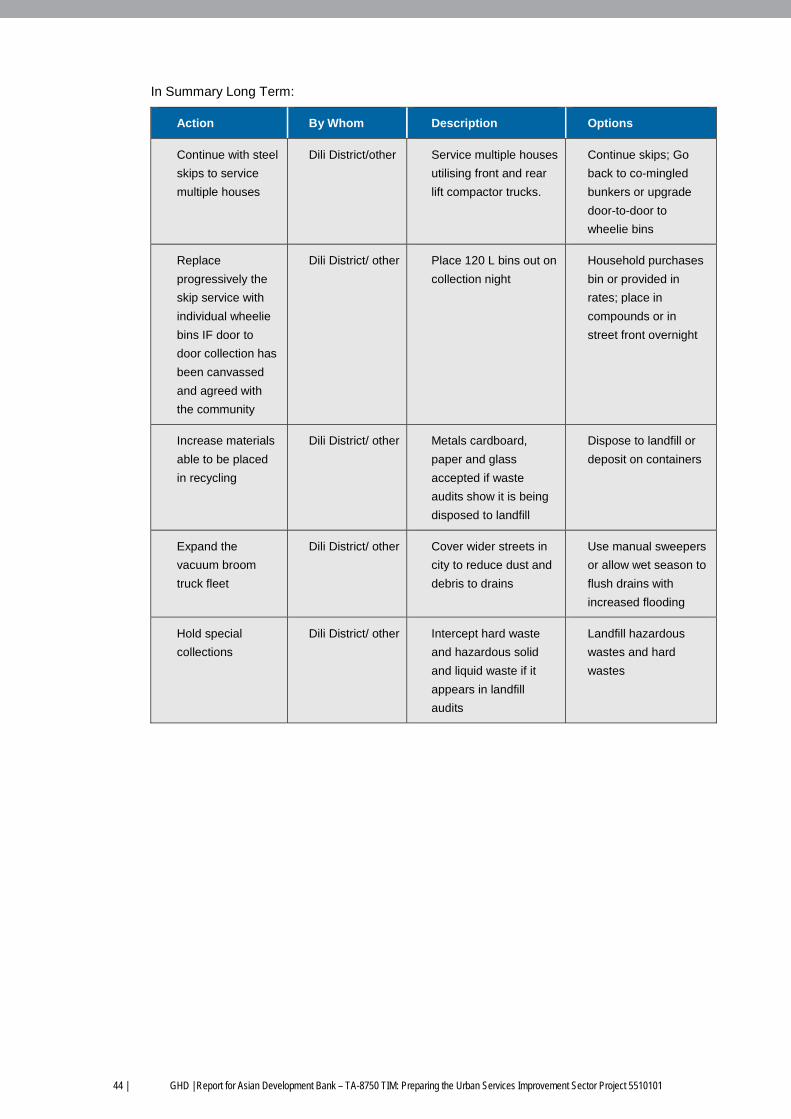
44 | GHD | Report for Asian Development Bank – TA-8750 TIM: Preparing the Urban Services Improvement Sector Project 5510101
In Summary Long Term:
Action By Whom Description Options
Continue with steel
skips to service
multiple houses
Dili District/other Service multiple houses
utilising front and rear
lift compactor trucks.
Continue skips; Go
back to co-mingled
bunkers or upgrade
door-to-door to
wheelie bins
Replace
progressively the
skip service with
individual wheelie
bins IF door to
door collection has
been canvassed
and agreed with
the community
Dili District/ other Place 120 L bins out on
collection night
Household purchases
bin or provided in
rates; place in
compounds or in
street front overnight
Increase materials
able to be placed
in recycling
Dili District/ other Metals cardboard,
paper and glass
accepted if waste
audits show it is being
disposed to landfill
Dispose to landfill or
deposit on containers
Expand the
vacuum broom
truck fleet
Dili District/ other Cover wider streets in
city to reduce dust and
debris to drains
Use manual sweepers
or allow wet season to
flush drains with
increased flooding
Hold special
collections
Dili District/ other Intercept hard waste
and hazardous solid
and liquid waste if it
appears in landfill
audits
Landfill hazardous
wastes and hard
wastes
GHD | Report for Asian Development Bank – TA-8750 TIM: Preparing the Urban Services Improvement Sector Project, 5510101 | 45
7. Waste Minimisation 7.1 Introduction
The following chapter on waste minimisation, reduction and recycling provide an overview of
contemporary schemes worldwide. Some are more aligned with developed countries but are
presented as an aspirational guide to the long term options.
This is critical so any medium to long term approaches preferred by the Municipalities are not
restricted or limited prevented by the decisions for the short term approaches.
7.2 Background
Householders currently recycle or reuse much of the higher value products in the waste stream
at source. Waste stream visual inspections and detailed audits confirmed very low levels of
primary recyclables such as glass, metals and paper in the waste being disposed. Other raw
waste stream audits in SE and South Asia typically indicate more of these components are
present.
This generally low level confirms that efficient reduction, reuse and recycling are already
occurring at source or at a primary dumping location. This small recyclables quantity in the
waste stream was further confirmed by examining the waste at some of the final disposal sites
and noting the small number of waste pickers or scavengers present.
There have not been any sustained SWM education campaigns by the Municipalities or local
NGOs to date. While primary recyclables are being removed at source, there are still
opportunities for other improvements in waste minimisation and avoidance.
The USEPA has produced booklets such as “The Consumers Handbook for Reducing Solid
Waste”. This booklet is particularly comprehensive and addresses the integrated waste
management approach, or the cradle to grave approach. This addresses all phases of waste
management including advice on reducing the amount of unnecessary packaging. The
handbook also covers the issue of adopting practices that reduce waste toxicity, and the
associated issue of household hazardous waste collection that is often overlooked in these
publications. The composting section is also very basic and provides the details for constructing
and operating a household or commune level compost scheme.
Also the UNDP funded Project “Public and Private Sectors Convergence for Solid Waste Co-
governance in Urban Poor Communities” would provide good educational material as input to
developing a local plan and strategy. These booklets, and many others which relevant NGOs
have already prepared, could be used as a basis for developing local educational information on
waste reduction.
In summary, source reduction or waste minimisation is a necessary component of a waste
management strategy. The benefits of waste minimisation include pollution prevention, reduced
need for waste treatment and disposal facilities, and cost savings.
The items usually addressed in waste minimisation campaigns such as packaging material
(paper and cardboard) as well as plastic and metal containers. The presently small quantities of
these materials excluding plastic are as a result of the presently low household incomes. As
these incomes and generally community wealth increases, so will the packaging waste
quantities, and the associated need for escalating waste minimisation activities.
The following sections review the major strategies employed to encourage waste minimisation.
46 | GHD | Report for Asian Development Bank – TA-8750 TIM: Preparing the Urban Services Improvement Sector Project 5510101
7.3 Integrated Resource Recovery (IRR)
Integrated Resource Recovery (IRR) is the recommended approach to waste minimisation for
the Municipalities. This aims to “instil an understanding and support within the community of
waste management principles”.
Fundamentally, this can only be achieved by creating the opportunity for members of the public
to play an integral and valued role in the decision making process, from initial planning through
to system implementation and operation. This has to cover all aspects including resource
recovery systems and technology.
7.4 Waste Pricing
A major influence on the success of waste minimisation and, indeed, recycling is the pricing
regime for waste disposal. In addition, charging the full cost of disposal will provide a
commercial incentive for business and industry to become involved with waste minimisation and
recycling.
In setting the appropriate waste disposal charges the following factors need to be considered:
operational costs;
present and future costs of purchasing and developing disposal sites;
costs of new equipment in the future;
rehabilitation and long term site monitoring and after-care;
possible costs associated with environmental disadvantages; and
charges set by external waste management or environmental authorities.
A major influence on the success of waste minimisation and, indeed, recycling is the pricing
regime for waste disposal. A local option is the introduction of compulsory charges for all
plastic bags used at shops. Plastic makes up a significant fraction of the current waste stream,
mainly as bags.
This is used in other developing countries such as Fiji in the Pacific and Makati in the
Philippines. The charge is in the order of 5 cents per large plastic grocery bag. The aim is
twofold. Firstly, it is to encourage people to only use the actual number of bags required.
Secondly it encourages people to reuse the bags, either for later trips to the shops or to use the
bags for storing garbage rather than buying special garbage bags and liners. It has also had
the effect of people using reusable fabric or woven bags instead of plastic
7.5 Legislation
Waste minimisation legislation has been utilised in many parts of the world in order to control
the generation of waste. Examples of such legislation follow.
7.5.1 Town Planning and Building Requirements
In Europe many countries require waste management issues to be addressed as part of the
planning approval process. Typical elements range from estimation of the type and quantity of
waste generated, the requirement for waste audits, and plans for disposal of waste, both on-
going and as generated by the building activity.
The City, as part of the planning approval process, could require commercial and industrial
applicants to provide information on waste minimisation and recycling programs/activities to be
incorporated into the proposed development. This would include both the construction and
GHD | Report for Asian Development Bank – TA-8750 TIM: Preparing the Urban Services Improvement Sector Project, 5510101 | 47
operational phases. In addition details of expected wastes for landfilling both quantity and
composition should be requested from each applicant.
7.5.2 Prohibition of Non-Environmentally Acceptable Packaging
The City could consider establishing localised guidelines pursuant to the prohibition of the use
of non-environmentally acceptable packaging, once local incomes increase and packaging
amounts increase, in concert with national or provincial guidelines are developed in the future.
7.6 User Pays Domestic Waste
Worldwide experience has shown that merely providing recycling services is not sufficient to
reduce waste volumes significantly. Only where there is a direct link with increased pricing of
waste services or commercial returns to the householders for material sold door to door, do
improvements in recycling rates occur.
Community Waste Reduction Activities endorsed by the City should take into account the
following;
Local Capability;
Economic Viability;
Technical Requirements;
Social Concerns;
Disposition of Residual Waste;
Environmental Impact.
The “Pay as You Throw” Charging Policy is a method of introducing a financial incentive to
dispose of less waste, by having the City charging the householder/business on the basis of the
amount of waste actually given over for collection and disposal.
There are over 3,000 communities in the USA alone using such a scheme. However these
schemes have the benefit of operating in a very structured environment of anti-littering and anti-
dumping legislation. Therefore waste generators have no real option but to place their waste for
collection and pay the requisite fees.
This internalises the cost of waste services, and provides a strong incentive for generators to
minimise waste production. This may be in the form of waste avoidance or greater focus on
reuse and recycling, such as composting for domestic situations.
In developing countries, the legislation and ordinances are usually in place but the community
culture and enforcement is such that increased littering and waste dumping will usually occur.
This has the result of diverting waste away from the collection service and associated correct
disposal systems, to encouraging illegal dumping in vacant lots, watercourses and drains.
Therefore a “Pay as You Throw” Charging Policy will only be appropriate once there is a very
structured institutional approach to litter and fly-dumping control.
7.7 Education
A major key in any Government body achieving reduction of waste to disposal is the education
of the community, both general to society and business. Locally a Municipal initiative is required
to support education with respect to waste management. This effort could possibly be best
directed through a combination of national campaigns, supplemented with funding for local level
education through local NGO’s.
48 | GHD | Report for Asian Development Bank – TA-8750 TIM: Preparing the Urban Services Improvement Sector Project 5510101
It is considered that education is the fundamental key to a successful waste reduction strategy
and a separate chapter is devoted to socialising this education imperative, including listing the
activities required as well as related costings.
Appendix B– Waste Minimisation provides more details on this topic.
GHD | Report for Asian Development Bank – TA-8750 TIM: Preparing the Urban Services Improvement Sector Project, 5510101 | 49
8. Minimising Plastic Bags and Bottles 8.1 Introduction
Based on the above background to waste minimisation, it is considered that efforts should
initially focus on managing plastic bags which make up to 15% of the total waste delivered to
the dumpsite, and PET bottles which make up a further 6%. However PET bottles, in particular,
are a major litter issue and following protracted storm events, are washed out of the local
unofficial dumping areas through the local drainage canals and onto local beaches.
8.2 Plastic bags
A number of options for recycling these are presented in the recycling chapters below. However
in summary, there is very little opportunity for recycling plastic bags apart from burning as a fuel
source or bringing in shredding equipment and moulds to make plastic items such as plastic
seats. However given that most plastic bags are soiled in terms of either inorganic soil or
organic material attachment, the overall environmental cost associated with having two clean
and dry these bags, not to mention the higher labour content, would make such a scheme
generally unattractive at the present time.
8.2.1 Plastic bag ban
Some cities have taken the step of simply banning the use of plastic bags. An example would
be Makati City with in Metro Manila. This ban applies to both the large supermarket outlets and
also smaller corner stores where all purchases have to be placed within paper bags or cartons.
This plastics ban has also been extended as far as drinking straws which have to be waxed
paper rather than more traditional plastics straws.
This is not been universally supported and there is significant consumer resentment because in
the often raining environment with in Manila, the paper bags become wet and grocery items can
fall through the bags.
Superficially this is a very aggressive approach for a small city like Dili to take it this time and
other alternatives described below would be preferable.
8.2.2 Bag tax
As mentioned in the chapter above, some countries introduced a charge for the supplying of
supermarket plastic bags. In Fiji for example approximately 5¢ for each shopping bag was
previously being charged at supermarkets to discourage people from taking excessive numbers
of plastic bags and as a corollary, encouraging people to provide their own reusable fabric bags.
Again this is discussed further in the recycling chapters below.
Such a scheme has recently been introduced into the European Union. However to make
implementation more streamlined, only those supermarket chains employing more than 250
persons have to charge the tax. Therefore in Dili, a similar approach would be just that the
larger supermarkets are required to pay the tax as opposed to the wet markets and the small
corner stores.
8.2.3 Degradable bags
There a number of degradable and biodegradable plastic bags now available.
Biodegradable plastic bags are often made from farmed products like corn starch, which, in the
right conditions, will break down into elements like carbon dioxide, water and methane.
Biodegradable bags are generally best suited to composting and may contribute to methane
50 | GHD | Report for Asian Development Bank – TA-8750 TIM: Preparing the Urban Services Improvement Sector Project 5510101
emissions if sent to landfill. To meet international standards, bags need to compost within 12
weeks and fully biodegrade within 6 months. Biodegradable bags are not suited to recycling.
These bags are appropriate for large cities where the back turnover is very high. However if the
bags are stored for protracted periods due to slow sales or distribution issues, the bags will start
to biodegrade prior to use. Therefore it is considered that the fully biodegradable plastic bags
are inappropriate at this time.
Degradable plastic bags break down primarily through the reaction of a chemical additive to
oxygen, light or heat and are also known as 'oxodegradable’ bags. These are best suited to
landfill disposal, as they may survive long enough to present a threat to animals if littered.
These bags are the second generation of degradable plastics. The first generation involved just
the degradation of the matrix holding the plastic molecules together such that the plastic bag
merely broke down into a large number of very small pieces of plastic which then would take
many decades to biodegrade.
However the second generation benefit from having chemical additives that can be used to
ensure that the entire bag breaks down over a specified time period. This time period can be
set to vary from a few weeks up to a number of years as required by the purchaser. Again in
the Pacific Island nations, this has been the preferred approach and the consumer tax for
purchasing non-biodegradable bags has been abandoned. The central government in Fiji for
example has mandated that all plastic bags must be of the degradable type and this applies not
only to shopping bags but also storage bag such as for hot bread, etc. Informal discussions
with local environment department staff indicate that very happy with the take up for these
degradable bags and the significant reduction in the amount of plastic bags now residing in the
terrestrial and marine environment.
8.2.4 Summary
Therefore the recommended approach for plastic bag management is to legislate that all plastic
bags have to be degradable using the second generation chemistry wherein the bags break
down entirely into their prime elements, and not a multitude of small plastic remnants. This
approach would also be supplemented through the information and education campaign which
would encourage use of reusable fabric bags and the general minimisation the use of plastic
bags, even though they would be degradable.
8.3 PET Bottles
8.3.1 Background
As noted above, these bottles only represent about 6% of the total waste mass entering the
dumpsite. However a large proportion of the bottles are not collected and represent a major
component of the local litter concerns, especially given their propensity to be washed into local
drain systems and ultimately be washed into the local embayments and local beaches.
There are a number of options for waste minimisation/source reduction of these containers
including taxes, charging policies, container deposit legislation and ultimately, extended
producer responsibility.
8.3.2 Charging policies
These are alternatively termed pay as you throw schemes, meaning that any material sent for
disposal attracts a specific charge. The idea is that a price signal is then sent to the waste
generator to encourage waste Minimisation. However such schemes will only work within an
institutional and enforcement environment where illegal dumping or littering is policed.
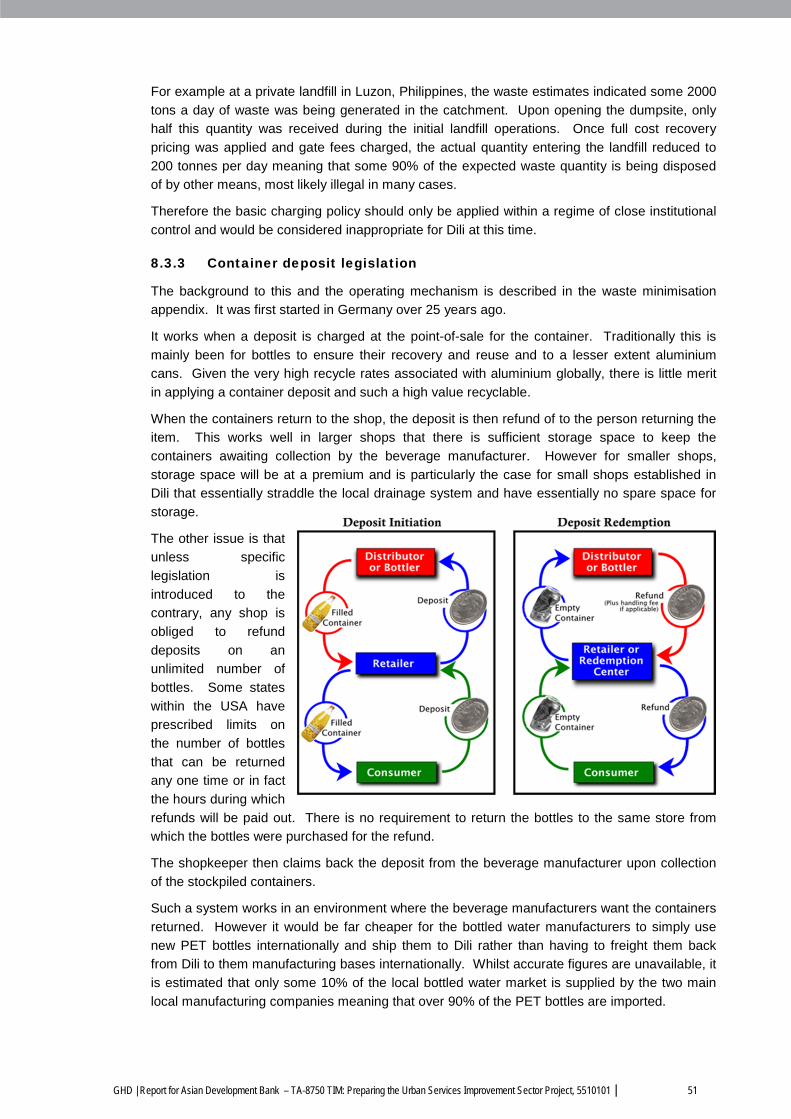
GHD | Report for Asian Development Bank – TA-8750 TIM: Preparing the Urban Services Improvement Sector Project, 5510101 | 51
For example at a private landfill in Luzon, Philippines, the waste estimates indicated some 2000
tons a day of waste was being generated in the catchment. Upon opening the dumpsite, only
half this quantity was received during the initial landfill operations. Once full cost recovery
pricing was applied and gate fees charged, the actual quantity entering the landfill reduced to
200 tonnes per day meaning that some 90% of the expected waste quantity is being disposed
of by other means, most likely illegal in many cases.
Therefore the basic charging policy should only be applied within a regime of close institutional
control and would be considered inappropriate for Dili at this time.
8.3.3 Container deposit legislation
The background to this and the operating mechanism is described in the waste minimisation
appendix. It was first started in Germany over 25 years ago.
It works when a deposit is charged at the point-of-sale for the container. Traditionally this is
mainly been for bottles to ensure their recovery and reuse and to a lesser extent aluminium
cans. Given the very high recycle rates associated with aluminium globally, there is little merit
in applying a container deposit and such a high value recyclable.
When the containers return to the shop, the deposit is then refund of to the person returning the
item. This works well in larger shops that there is sufficient storage space to keep the
containers awaiting collection by the beverage manufacturer. However for smaller shops,
storage space will be at a premium and is particularly the case for small shops established in
Dili that essentially straddle the local drainage system and have essentially no spare space for
storage.
The other issue is that
unless specific
legislation is
introduced to the
contrary, any shop is
obliged to refund
deposits on an
unlimited number of
bottles. Some states
within the USA have
prescribed limits on
the number of bottles
that can be returned
any one time or in fact
the hours during which
refunds will be paid out. There is no requirement to return the bottles to the same store from
which the bottles were purchased for the refund.
The shopkeeper then claims back the deposit from the beverage manufacturer upon collection
of the stockpiled containers.
Such a system works in an environment where the beverage manufacturers want the containers
returned. However it would be far cheaper for the bottled water manufacturers to simply use
new PET bottles internationally and ship them to Dili rather than having to freight them back
from Dili to them manufacturing bases internationally. Whilst accurate figures are unavailable, it
is estimated that only some 10% of the local bottled water market is supplied by the two main
local manufacturing companies meaning that over 90% of the PET bottles are imported.
52 | GHD | Report for Asian Development Bank – TA-8750 TIM: Preparing the Urban Services Improvement Sector Project 5510101
To make the return of used PET bottles internationally financially viable, the bottles would either
have to be pressed and baled or shredded prior to shipping offshore. This negates the overall
ideal of reusing the original container and morphs more into a recycling program rather than a
reuse program which is the usual are aim of container deposit legislation. Furthermore
traditionally the container deposit legislation was more focused on durable goods such as glass
bottles.
There is always a percentage of unclaimed deposits that are usually retained just as profit by
the various beverage companies. In some countries, such as the USA and parts of the
European Union, the central government takes an active role in the management of the
container deposit funds and actually retains the unclaimed deposits as part of government
revenue. This is another level of complexity that is considered inappropriate for Dili at present.
Specific to Dili and the potential for using container deposit legislation for PET bottles, there are
real concerns because:
Small corner shops will need to locate and secure storage areas;
The storage areas must be secure as the bottles can either be stolen and resubmitted
for deposit funds again, or the bottles can be set on fire as they are highly flammable;
There’s no real incentive for the beverage manufacturer to pick up the returned bottles
as they would be more expensive to collect, ship and return to their manufacturing
bases internationally than simply using new bottles within the international bottling
facilities. This is particularly the case with the current slump in oil prices where
reprocessed plastic has become far more expensive than virgin plastic leading to the
closure a number of very large plastics recycling companies in Europe;
Therefore there is a real risk of large stockpiles will be generated without any market
forces dictating that they would be reused or recycled.
In summary, container deposit legislation for PT bottles may achieve good collection but not
necessarily facilitate a sustainable recycling protocol at the current PET prices and export costs.
This will potentially change over time as the percentage of beverages being manufactured
locally increases beyond the current 10%.
8.3.4 Extended producer responsibility
This is the next possible step after container deposit legislation which makes the manufacturer
of products responsible for the material’s entire life cycle. This means the manufacturers are
responsible for the take-back, recycling and final reuse for disposal of the products
manufactured.
This responsibility is normally applied for larger items and lately particularly for materials such
as eWaste internationally.
For items such as PET water bottles, it would be very costly to have international companies
responsible for shipping back all the bottles since most PET bottles are not refilled but rather are
chipped and recycled. If extended producer responsibility was applied to these bottles, a very
significant cost impact could be expected in the product sale price to the consumer.
Overall it is considered an inappropriate mechanism at these at this time for PET bottles.
8.3.5 PET tax
Another option is to apply a tax to either the import of PET bottles or to the PET pellets itself
when imported for bottle making. A notional charge equivalent to say 10¢ a bottle could be
applied.
GHD | Report for Asian Development Bank – TA-8750 TIM: Preparing the Urban Services Improvement Sector Project, 5510101 | 53
The tax would work in the following manner:
Government collects the tax equivalent to 10¢ a bottle on either imported bottles or
virgin pellets imported for bottle manufacture;
The private sector or NGOs could then offer to pay a reasonable amount for the delivery
of PET bottles for recycling. Approximately $1.00 was paid for 80 bottles previously.
Such an amount would make it attractive for people to collect bottles for sale, especially
those from the lower Socio-Economic groups;
The bottles would then be cleaned, sorted and chipped and perhaps baled to maximize
the quantity that could be shipped within a standard sea container;
Once the ship exporter at dispatch the material, the recycling company would present
their export manifest to the government and receive payment for each ton of PET
exported.
There are approximately 18,000 Two litre bottles per tonne making $1800 a tonne tax revenue
at the notional 10¢ a bottle. Assuming 75% tax processing efficiency within the government,
this translates to approximately $1300 a tonne available to support PET a recycling. This would
be more than sufficient to make the recycling feasible.
Such a tax needs to be considered in terms of whether it is progressive or regressive, and
whether it has significant impacts on the less advantaged communities. In fact such a tax would
be pro-poor too as only about 50% of low to middle income Dili population buy bottled water. It
is generally the middle to upper income bands that purchase bottled water. So the tax would
not impact upon the less advantaged communities in terms of access to water.
However the significant increase in recycling would be beneficial to the disadvantaged
community groups who would most likely become more involved in bottle collection and sale.
Implementing the scheme will obviously require government support and appropriate legislation.
The economics of the scheme will change when a more reliable piped water supply is available
and also has more local bottling plants are established.
Overall the purpose of the tax is to make the recycling scheme financially viable for such light
material as PET. At the present time, even with subsidized shipping costs negotiated by this
project, it is marginal covering costs exporting PET internationally. Payment of the collected tax
money back to the recyclers would greatly encourage both collection and recycling of this
material, leading to a significant reduction in the amount of PET litter and general material waste
at present.
Such a taxation regime could still be supported by the use of recycling cages to provide income
for NGOs, civil society groups or commercial recycling corporations.
8.3.6 Summary
Basic charging policies, container deposit legislation and extended producer responsibility are
not considered suitable and effective approaches for maximising the recovery and recycling of
PET bottles.
Application of a tax to the import or local manufacture of PET bottles is preferred, where the tax
is then passed on to recycling NGOs or private companies to maximize collection and recycling
efficiency.
Regardless of the scheme adopted, ongoing education will be essential in terms of achieving
overall waste minimisation ideals being adopted by the community.
54 | GHD | Report for Asian Development Bank – TA-8750 TIM: Preparing the Urban Services Improvement Sector Project 5510101
9. Recycling 9.1 Introduction
Dili has 285,000 people currently and will grow to 578,000 by 2030. On average the total mass
entering the site is 120 tonnes a day, seven days a week.
In addition to these landfill quantities, the following must be considered:
private recyclers scavenge most of the aluminium cans for scrap and two recyclers
collect PET water bottles and chip into flakes for export;
One recycler sends around 12 containers per month overseas for recycling aluminium;
For several years a recycler sent 4 to 6 tonnes per day of cardboard to Singapore, but
high freight costs ended this venture and it now goes to landfill;
One NGO collecting and chipping PET bottles has a stockpile of eight million bottles
but full shipping rates are not viable commercially. (30 tonne).
The basic need for successful recycling in Timor-Leste depends upon shipping agents (currently
paying for empty container return to major ports) striking a deal to benefit both parties. This
form of discounting is widespread in the Pacific for developing nations.
To be sustainable, exporting recyclables needs to be profitable. Approaches were made to
several shipping agents and the data shown above was provided to allow some estimates of
shipping volumes which might occur. ANL has offered a 50% discount at this point in time.
Mariana shipping has offered 40 foot containers at the same rate – a further 50% reduction.
This may allow sustainable cardboard and paper export. UNDP, Hopesellers and Caltech are
acting on these new offers brokered by the project with maritime agents.
9.2 Current Recyclers
An updated and expanded list of recyclers has been prepared below which will continue to be
expanded by research, interviews; liaison with the Ministry of Finance and government records
throughout the project duration.
One key issue restricting the development of greater recycling activities is the transport cost of
taking the recyclables to international destinations for processing. Until such time as Dili
expands to such an extent that the local industries develop, particularly those in the beverage
industry or plastics industry, then there will remain a need to export these products
internationally. Shipping companies in small and less developed countries are returning empty
sea containers and so could offer cut rates for recyclables. Our project is attempting to broker
such an arrangement. We have had substantial discounts agreed by ANL and the Mariana line
which have been passed on to our contacts in recycling. Government action may be to link
contracts with importers to such corporate citizenship. One option is to combine shipments with
aluminium bales as a full 20 foot container is too heavy and about 1/3 of the container may be
topped up with plastic or paper bales.
9.2.1 Haburas Foundation
This company makes bio briquettes for clay oven cooking made from paper, coffee husks, wood
waste at Dili, Baucau, Ermera, Liquica – 40 tonnes/month. The group has recently imported
four automatic firelog casting machines from China which will greatly increase its production and
demand for waste paper and cardboard. The current clay oven has tended to crack within 12
months and a more versatile and larger unit is being designed. The four units will take up to 8
tonne of waste paper or cardboard per day and the facility near Heras will open in April.
GHD | Report for Asian Development Bank – TA-8750 TIM: Preparing the Urban Services Improvement Sector Project, 5510101 | 55
9.2.2 Posh Food Industry Ltd.
This company used to send cardboard to Singapore – 4 to 6 tonnes per day, but has just
reportedly ceased to operate. Its equipment has been purchased by Caltech although container
shipping charges make such export non-viable. Timor Plaza is re-developing its waste handling
facility and wishes to find viable resource recovery partners.
9.2.3 CalTech Industries
This company recycles minor quantities of glass by crushing bottles and cullet and using it in
concrete as aggregate.
They also intermittently recycle plastics and cardboard as well as metals. Caltech purchased
the Posh Foods cardboard compactor, and has hired a Timorese environmental engineer
(Australian degree) to explore sustainability measures for the company.
As mentioned above, the company is constrained by high sea container freight charges. UNDP
and Hopesellers are now liaising regarding compaction of PET flakes and export potential with
the discounted sea freight negotiated by our project. This combined approach was also
brokered by the project as well as liaison with Timor Plaza management on the best outcomes
for their waste handling, especially the recyclables including paper and cardboard.
9.2.4 Anteater
Anteater is a local firm collecting waste including cardboard and paper but carts all as
uncompacted in open tray trucks to Tibar. They also specialize in metal, especially aluminium
and a supplied by many collectors including Aitarak Laran – 4 to 6 tonne/day of metals recycled
9.2.5 Besi Tua Lld
Besi Tua Lld at Comoro has been buying metal scrap since 2004 – largely aluminium from
agents who collect from Tibar landfill and also from undertaking regular household collections.
They despatch about 10 to 12 shipping containers a month to Singapore and have 30
containers and 40 staff. The capital cost of specialised equipment, such as balers and presses,
is holding them back from expanding their operation.
They have indicated that the containers are completely filled with cans and so additional baling
would reduce shipping costs for this recycler, as a full container does not reach the weight limit.
They also add other metals to shipments as received.
9.2.6 Daikyo Recycling
Daikyo Recycling advertises all manner of products received including batteries and e-waste but
enquiries to the firm confirmed only aluminium and zinc was exported to Singapore. Quantities
were not available. The cheaper freight rates may well expand their options.
9.2.7 H3R Green Waste Composting
The firm has been established at Tibar as a demonstration plant and has a staff of students
working five 2000 Litre rotating aerobic composters made in Indonesia. They sell 5 Kg bags of
compost for $1.00 and supply several farmers with fertile soil material, making a maximum of
about 1 tonne per week. There was a 21 day training period provided recently by DFAT’s
Growth for Development project by an Italian expert to build on this existing activity.
H3R is now looking for space to initiate open windrow composting with far better economies of
scale. Specialised windrow turning plant and injection pumps to blend septage into the
windrows can cost $0.5M and assistance will be required, coupled with government agencies
such as participants in the land degradation action plan volunteering to take the additional
56 | GHD | Report for Asian Development Bank – TA-8750 TIM: Preparing the Urban Services Improvement Sector Project 5510101
product to satisfy ADB loan requirements. A presentation and request for support has been
made to the Secretary for Environment Industry and Commerce to identify markets for soil
products. The initial expansion of cells at Tibar landfill and the daily cover soil to exclude vermin
and disease vectors from contact with the waste will be costed for recovery from nearby borrow
areas and the greenwaste can be purchased for under this cost as an alternative. This would
especially suit green waste salvaged from co-mingled waste as it may contain metals and glass
fragments unacceptable to farmers.
At the time of preparing this report, H3R was only operating intermittently.
9.2.8 Permatil
Permatil is a small NGO targeting youth with a sustainability message and includes rainwater
harvesting, home composting and sustainable behaviour on the land. They have been active in
rural areas and Auturo Island but are now moving to Dili. They have a large youth congress
each year, planning one in august 2015 attended by thousands.
Home composting was found to breed some bugs but chickens disposed of these readily and
the practice was accepted by gardeners as beneficial. Ego will be approached regarding further
community messages by our team and is active with the Education Ministry in compiling science
curricula which include sustainability components.
9.2.9 TIC LDa Waste Control, Dili – Incineration
It was reported that expired medicines and pharmaceuticals were incinerated in a converted
shipping container at Tibar, fabricated with a smoke stack in a fenced compound. Other waste
is incinerated on consignment including lead acid batteries which were emptied of acid and
shovelled out into the tip after cool-down. The shipping container has a concrete slab floor and
ignition was started with added fuel oil. The company had incinerated hospital waste when the
United Nations was in country, but not since. This is an ad-hoc improvised single chamber
incinerator which would be incapable of reaching 1100 degrees centigrade to treat hospital
waste.
They have operated since 2006 and run several trucks for several times a day to Tibar,
collecting embassy waste, private commercial and incinerator work. They run 200L and 400L
steel skip bins for customers.
The disposal of lead acid batteries in this way is hazardous to workers in the vicinity and the
lead is a persistent accumulating poison in the environment. World Bank reports and
confirmation at Dili’s main hospital reveals a functioning suitable incinerator now operates daily.
9.2.10 Western Wave
Western Wave is an Australian company promoting sustainable recycling of lead-acid batteries
from Western Australia to South Korea where all materials – the acid, the case, the filler plugs
and the metals are recycled safely into new batteries. If the GoTL approved export of old
batteries, they would take batteries from Darwin to Perth under this system. They would also
participate in training and specifying the preparation and packaging for export direct to Korea
from Dili and facilitate the contacts with the Korean recycler. Lead acid batteries last three
years on average in Australia. Anecdotally, batteries in Timor-Leste can last as little as one
year.
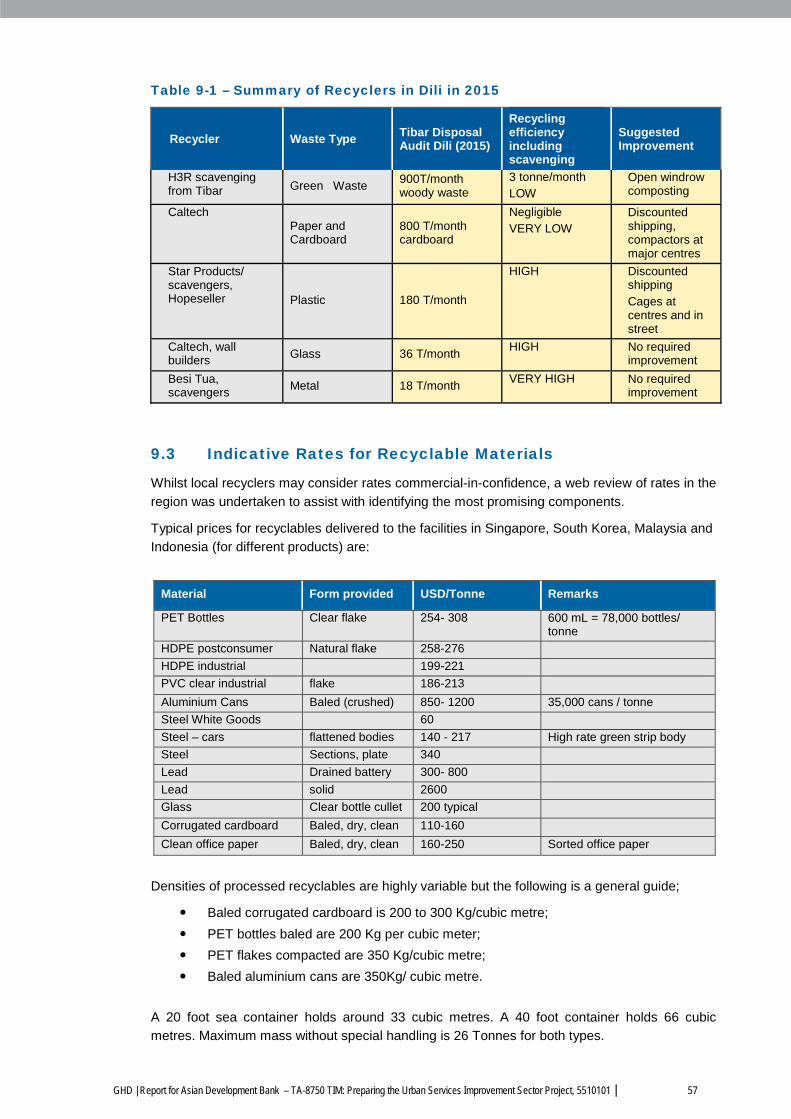
GHD | Report for Asian Development Bank – TA-8750 TIM: Preparing the Urban Services Improvement Sector Project, 5510101 | 57
Table 9-1 – Summary of Recyclers in Dili in 2015
Recycler Waste Type Tibar Disposal Audit Dili (2015)
Recycling efficiency including scavenging
Suggested Improvement
H3R scavenging from Tibar Green Waste
900T/month woody waste
3 tonne/month LOW
Open windrow composting
Caltech Paper and Cardboard
800 T/month cardboard
Negligible VERY LOW
Discounted shipping, compactors at major centres
Star Products/ scavengers, Hopeseller Plastic 180 T/month
HIGH Discounted shipping Cages at centres and in street
Caltech, wall builders Glass 36 T/month
HIGH No required improvement
Besi Tua, scavengers
Metal 18 T/month VERY HIGH No required
improvement
9.3 Indicative Rates for Recyclable Materials
Whilst local recyclers may consider rates commercial-in-confidence, a web review of rates in the
region was undertaken to assist with identifying the most promising components.
Typical prices for recyclables delivered to the facilities in Singapore, South Korea, Malaysia and
Indonesia (for different products) are:
Material Form provided USD/Tonne Remarks
PET Bottles Clear flake 254- 308 600 mL = 78,000 bottles/ tonne
HDPE postconsumer Natural flake 258-276
HDPE industrial 199-221
PVC clear industrial flake 186-213
Aluminium Cans Baled (crushed) 850- 1200 35,000 cans / tonne
Steel White Goods 60
Steel – cars flattened bodies 140 - 217 High rate green strip body
Steel Sections, plate 340
Lead Drained battery 300- 800
Lead solid 2600
Glass Clear bottle cullet 200 typical
Corrugated cardboard Baled, dry, clean 110-160
Clean office paper Baled, dry, clean 160-250 Sorted office paper
Densities of processed recyclables are highly variable but the following is a general guide;
Baled corrugated cardboard is 200 to 300 Kg/cubic metre;
PET bottles baled are 200 Kg per cubic meter;
PET flakes compacted are 350 Kg/cubic metre;
Baled aluminium cans are 350Kg/ cubic metre.
A 20 foot sea container holds around 33 cubic metres. A 40 foot container holds 66 cubic
metres. Maximum mass without special handling is 26 Tonnes for both types.
58 | GHD | Report for Asian Development Bank – TA-8750 TIM: Preparing the Urban Services Improvement Sector Project 5510101
Based on the above,
A cardboard shipment would be worth about $1,333;
Baled PET sells for about $1800 per container load;
Flaked PET sells for about $3,176 per container load;
Aluminium on the other hand is worth six times as much, about $11,000 per container
load.
9.4 Specific Waste Components
9.4.1 Lead acid batteries
Vehicle numbers were sourced from the Ministry of Finance’s web page2. Lead-Acid batteries
have an average service life of three years.
Motorcycle = 4 -5 Kg (4 Kg lead), 200 used batteries/tonne;
Car = 8 to 10 Kg (8 Kg lead), 100 used batteries/tonne;
Light Truck = 14 Kg (10 Kg lead), 70 used batteries/tonne;
Large Truck = 40 Kg (20 Kg lead), 25 used batteries/tonne;
At current numbers, at least (assuming 1/3 of batteries are purchased in a year and so disposal
will be 1/3 of registered vehicles three years later).
3000 motorcycle (150 tonne per annum);
1500 car batteries (150 tonne per annum);
200 light trucks (3 tonne per annum);
50 large trucks (2 tonne) per annum.
Batteries are almost 100% recyclable. Their segregation into metals and plastic is extremely
hazardous and should be undertaken in a controlled environment.
The Basel Convention prevents export of hazardous waste to third world countries and so a
reputable recycler would need to be located. Korea has such an industry and Western Australia
ships used lead-acid batteries to Korea for around $500/ tonne delivered.
The Dodd & Dodd Group in Perth have an export licence, confirm shipping to Darwin and road
transport to Perth of used batteries would be viable for on-shipment to Korea. The price paid to
allow for inclusion in their shipments is pending, but pure lead fetches around $2,600/tonne.
Before 2011, some 8,500 batteries will have been disposed, representing over 54 Tonne of lead
released into the environment if not properly disposed.
Batteries are stacked (with acid contained within) on pallets weighing around 450 Kg and a 20
foot sea container can carry some 20 Tonnes. One container of used batteries is considered
worth shipping out of Timor Leste.
There may be reputable recycling facilities closer to Dili, but this shipment to South Korea is a
viable option to remove an environmental hazard and profit from doing so. Westernwave have
indicated a willingness to train a Timorese company to meet export standards and to introduce
the South Korean recycler as consistent with their industry aim to promote responsible use and
recycling of batteries from Dili Port and possibly the new cement factory port at Baucau which
will have spare capacity for other shipping usage when constructed.
2 Fonte/Source: Direcção Nacional dos Transportes Terrestres/National Directorate for Land Transports * Ministry of Finance,
General Directorate of Statistics, Timor-Leste in Figures 2012, Page 75
GHD | Report for Asian Development Bank – TA-8750 TIM: Preparing the Urban Services Improvement Sector Project, 5510101 | 59
9.4.2 Vehicle Tyres
Assuming an average five year life, 2012 figures give at least 7,000 tyres per year require
disposal.
These would be well disposed if burned as supplementary fuel in the cement kiln power plant
planned for Baucau.
Alternatively a tyre wall cutter as used in many cities and available from China could be utilised
to make slope stabilisation mattresses from used tyres, or artificial reefs for fish breeding
offshore and erosion protection to beaches and reefs.
9.4.3 Sump Oil
Currently, some 80,000 Litres of used sump oil will be generated per year.
It can be used for fuel in incineration or furnaces or filtered and re-refined for re-use locally. The
oil industry starting up in the seas off Timor-Leste may provide refining opportunities or flaring
facilities for this relatively small volume. Collection at service centres will need to be regulated
into the future as vehicle numbers grow.
The plasma arc plant proposed at Tibar requires waste oil for its organic process feed if the
contract goes ahead.
9.4.4 Plastic Bottles
Star Products is the partner with SEPFOPE, the training and professional development Ministry
which opened a plastics bottle recycling facility at Maunleona near the Comoro River. It is
exporting chipped PET resin to Indonesia and plans in the future to be able to produce tables
and chairs and other products from PET bottles.
The parent company of Coca Cola makes available mould details and technical advice for its
NAVY III chairs which are widely used in take away food stores and shopping malls in the
U.S.A. It may require an application from SEPFOPE to speed this process.
The Hopeseller/Greenseller Group are stockpiling chipped PET flakes and are seeking sea
container discounted back freight cartage for their stockpile.
UNDP has assisted students at the university under the guidance of their professor, to form this
NGO and is assisting with business plans, running costs and promotion and subsidizing bottle
purchases. The Korean Government had funded this initiative. Significant support amongst the
community has seen the collection of nearly 5 million bottles in 12 months through both buy
back days and also recovery from purpose-built wire cages. Some 28 cages have been placed
at strategic locations and no vandalism problems have occurred. They had borrowed Star
products chipper but now have their own.
Export costs are the main barrier to as viable future. The Korean aid buying scheme has
finished and now profit from exports must drive the future operations. They have 30 tonnes of
chipped PET to export and our project has brokered discount shipping rates which allow
profitable export to other than Kupang in Indonesia. Difficulties with permits at Kupang have
stalled all exports to Indonesia even though container freight is only $450.
UNDP is liaising with Caltech to double the density of the chips using the Caltech press and
exporting at the reduced rates negotiated.
9.4.5 Refuse Derived Fuel / Incineration Facilities
In 2014, the Government of Timor-Leste announced the future construction of a new cement
facility in Baucau. The kiln would provide an opportunity for waste to energy through burning
60 | GHD | Report for Asian Development Bank – TA-8750 TIM: Preparing the Urban Services Improvement Sector Project 5510101
selected waste such as tyres, paper, cardboard, waste oil and plastics in its power plant. It is a
four hour haul, but if the waste is well sorted and compacted, it may be viable as a return load
for trucks which would otherwise be empty.
The management of the plant has corresponded indicating a willingness to use refuse-derived
fuel where a mutual benefit is obtained. The cement kiln itself will be coal fired.
Caltech’s owner is visiting the developers in Perth to discuss disposal of refuse derived fuel
after the consultant’s intervention.
9.4.6 Hospital Waste
Comments received and references forwarded by the World Bank reflect a project in 2007 to
equip each major Timor-Leste hospital with a simple dual chamber incinerator for infectious
wastes. This attains the 1000 degrees C for a two second detention period adequate for total
kill of infectious material and pathogens. Whilst some reviews show the regional cities
incinerators may not be operable, interviews at the main Dili hospital showed the unit is
operational daily and the waste handling and segregation training has also been completed by
World Bank operatives.
This aspect will not be further explored for Dili. Additional inexpensive dual chamber
incinerators may be constructed in Dili and elsewhere using the De Montford University
designed hospital incinerator (Mark 9). The sterile ash is disposed to landfill.
9.4.7 Dili Port Waste Oil
Used oil is currently exported to Surabaya for incineration as no suitable bilge or sump oil
incinerator is available at the port. The plasma plant could solve this, as could provision of a
dual chamber quarantine/ oil burner incinerator capable of about 1200
9.5 Primary Recycling Candidate Materials and Options
Initially, the targets with ready markets outside Tibar Landfill (subject to further research) include
green waste composting as well as chipped or baled drinking water PET bottles, Polyethylene
plastic juice and milk bottles, and clean, dry cardboard and paper (the last was found in large
quantities in the Tibar waste stream). Greenwaste should be managed before entering the
landfill.
The concept for plastic bottles is to make a galvanized steel frame wrapped in cyclone fencing
mesh in a (typically) cube shape, with cut-outs at the front sized to allow easy deposition of PET
bottles. This would be positioned (anchored securely) near to the domestic waste skip to
encourage households to save space in their bin and to make recovery of these materials more
cost effective.
Private enterprise or NGO recyclers could clear the bins, or the Ministry workers/ contractors
could sell the material to the recyclers. As the community becomes more sophisticated with
regard to materials recovery, partitioned cages could accept a greater variety of recyclables.
The domestic waste delivered to Tibar at this early stage would still have minor quantities of
steel scrap, glass, containers not separated out and cardboard and paper to be scavenged on
arrival - as is currently the case. Wet or lightly contaminated paper and cardboard may still be
used for fire log production by Haburas.
Aluminium cans are currently collected door to door by recyclers and little improvement is
required
GHD | Report for Asian Development Bank – TA-8750 TIM: Preparing the Urban Services Improvement Sector Project, 5510101 | 61
This approach could be in conjunction with encouraging the less affluent households to
segregate and recycle at home and sell the recyclable directly to supplement their household
incomes.
Green waste needs to be diverted at kerbside to avoid contamination in the soil products it may
produce.
The major plant should last for 12 to 15 years and so this addresses both the Near to Medium
Term, leaving 2028- 2033 as decision time for major changes to the overall recycling program.
There is some ongoing growth to cater for and experience gained along the way will feed into
what plant is purchased medium to long term for top-up and diversion of plant to specific areas
of operation within the city. The numbers and ratios of plant to skips to chippers etc. are inter-
dependent and so 2018 to 2028 will see almost all suggested plant procured, with ongoing
additional plant for medium-term growth. The logical point to look at long-term is when this
investment is nearing the end of its service life 2028-33.
So in summary, nearly all purchasing activity is in the short–term and we would recommend
review of operations by the implementers and a revised plan be done in 2028.
9.5.1 Options to target plastic bottles
a) Option 1 – Separate Bin for PET, HDPE Plastic Bottles
A lightweight cage is positioned next to the waste skip and concrete bunker – appropriate signs
show it is for bottles - with a deposit slot sized to accept these items.
The advantages of a separate bin for PET, HDPE Plastic Bottles:
Saves approximately 10 trips by trucks to Tibar landfill each day;
Handled once and picked up by, or delivered uncontaminated directly to recycler;
Safer for labourers to handle;
Passers-by can place recyclables in any cage –reduces litter;
Bulky bottles do not fill domestic waste trucks with their “air gaps”;
Less truck traffic in Dili Streets and less travel to recycler depots;
Not spread by domestic animals or wind and rain;
Easier to enforce littering laws;
Do not migrate to drains exacerbating flooding events and marine pollution.
The disadvantages of a separate bin for PET, HDPE Plastic Bottles:
Requires separate cages for recyclables to be provided;
Requires education to deposit recyclables only;
Hand clean-up of waste incorrectly thrown into bin;
Possibly broken glass thrown into bin;
May attract vandals. Siting in centres with security seems to have overcome such
problems with the 28 cages currently deployed by Hopesellers.
b) Option 2 – No Separate Bin for PET, HDPE Plastic Bottles
This is essentially the current situation, where recyclables must be scavenged at Tibar or picked
up on the streets as with Hopesellers and Star Products. The advantages of no separate bin for
PET, HDPE Plastic Bottles and Cans:
No need to provide separate cages and education in use for residents;
Maintains income and work for scavengers at Tibar;
62 | GHD | Report for Asian Development Bank – TA-8750 TIM: Preparing the Urban Services Improvement Sector Project 5510101
Maintains income and work for scavengers in Dili if the paid scheme continues.
Hopesellers no longer has Korean aid funded purchase and must collect and sell as a
viable business.
The disadvantages of no separate bin for PET, HDPE Plastic Bottles and Cans:
Requires collection mixed with domestic waste and contamination, health risks to
labourers;
Spread by domestic animals and blows into drains;
Requires more trucks to convey to Tibar;
Is handled three times, once scavenged at Tibar, from delivered loads;
Must then be re-transported from Tibar to recycler depots.
9.5.2 Options to target paper & cardboard
The project has brokered discounted sea freight which means profitable recycling of paper and
cardboard can resume. Bulk reduction is extremely important due to the light mass of paper
products. Caltech has a press to bale paper and other products, but the material must be
hauled to their site. Options involve mass reduction at source for large producers like Timor
Plaza and other shopping complexes and supermarkets.
a) Option 1 – Dedicated balers at waste source
The advantages of dedicated balers include:
Less truck space required to ship bales to recycler;
Easy stacking into sea containers;
Cheap 240 volt units available to produce 70 Kg bales.
Disadvantages of dedicated balers include:
Cost to several outlets may discourage participation;
Maintenance may not be kept up, affecting reliability;
Wrong products may be baled together, reducing price.
b) Option 2 – No Dedicated balers at waste source
Advantages of no dedicated baler at source include:
Lower cost to main producers of paper waste;
Centralised sorting and expert baling at recycler.
Disadvantages of no dedicated balers at waste producers
Increased truck hire;
More windblown litter;
More contamination.
9.6 Options to target Green Waste
With some 33% of the waste stream estimated to be green waste, this requires the equivalent of
some 40 open six wheeler trucks to travel to Tibar each day. Larger open body trucks could be
used to reduce the number of trips required.
Woody green waste is very bulky and hard to compress in an open truck. Even in a compactor
truck the ratio is typically only a two times reduction. About 25% of the green waste measured
was grass and leaves, requiring no reduction.
GHD | Report for Asian Development Bank – TA-8750 TIM: Preparing the Urban Services Improvement Sector Project, 5510101 | 63
However, such woody waste is reduced in volume by up to 10 to 14 times if chipped or
shredded at the kerbside into the back of a truck. A simple tarpaulin can contain the product in
the existing fleet of tippers if appropriate, or larger trucks could be adopted. Use of existing
trucks will reduce the impact of changes to the domestic waste collection fleet.
Mobile chipper units can be attached to the truck towbar and will discharge the chips into the
tray of the truck. The delivered green waste takes a fraction of the storage area needed when it
arrives at the compost plant and is more readily mulched into suitable composting material.
Alternatively the chipped disease-free green waste could be used straight away on city parks
and gardens, or other erosion protection requirements to save hauling it to Tibar.
a) Option 1 – Separate bin for Green waste
The advantages of a separate bin for greenwaste are:
Saves up to 40 trips to Tibar landfill each day;
Handled once and delivered in a compact volume directly to composter;
Free of broken glass and dry-cell battery or other heavy metal contamination;
Safer for labourers to handle;
Less truck traffic in Dili streets;
Not spread by domestic animals;
Easier to enforce littering laws.
The disadvantages of a separate bin for greenwaste are:
Requires separate bins for domestic waste to be provided;
Requires a chipper to be towed by the truck;
Fuel and maintenance for chipper;
Noise during chipping operation.
b) Option 2 – No Separate Bin for Green Waste
The advantages of no separate bin for greenwaste are:
Saves up to 40 trips by 20 trucks to Tibar landfill each day;
Handled once and delivered in a compact volume directly to composter;
Less truck traffic in Dili streets;
Does not require separate bins for domestic waste to be provided.
The disadvantages of no separate bin for greenwaste are:
Labour must sort from mixed rubbish – health risks;
Labour must use separate trucks when separating domestic waste;
Labour must pick up from informal piles;
Probability of operator error contaminating green waste with heavy metal from dry cell
batteries, glass shards;
Requires a chipper to be towed by the truck;
Fuel and maintenance for chipper;
More labour to pick up waste that has been spread by domestic animals;
Harder to educate use of bins for green waste when mixed and encourages informal
dumps;
Noise during chipping operation;
Difficult to enforce littering laws.
64 | GHD | Report for Asian Development Bank – TA-8750 TIM: Preparing the Urban Services Improvement Sector Project 5510101
9.7 Recycling Competing Priorities
The approach to the overall recycling requires an understanding of the interplay and
contradictions involved. For example if the ultimate aim is to maximize landfill gas generation to
provide electricity generation, then all organics should be directed to the landfill rather than
supporting composting plants and green waste diversion.
Other contradictions can possibly apply for example if the waste to energy plant is to be
considered. To maximize electricity generation this plant would wish to maximize the calorific
value of the feedstock. Therefore recycling of green waste as well as other high calorific fuels
such as paper and plastics would not be supported.
Therefore the approach described in this report has been to assume that the advice received
from government that existing recycling schemes could continue has been adopted. However
this direct contradiction between attempting to maximize recycling of calorific fuels such as
paper, cardboard and plastics will need to be monitored as the success or otherwise of the
waste to energy plant during implementation becomes apparent. Similarly, the government has
indicated that it will not require green waste to be made available for the waste to energy plant
so a green waste diversion plan has been incorporated.
More specifically, the common theme in discussions on environmental problems in Timor Leste
commences with the widespread use of firewood to boil (sterilise drinking water and for cooking
and for lighting in rural areas). Ongoing traditional slash-and-burn agriculture, combined with a
nation which has largely steeper than 40% slope in its interior, exacerbates erosion on thin
topsoiled areas over limestone terrain.
The non- bioavailability of trace metals for plant nutrition and thin topsoil layers mean erosion to
the lower populated areas such as Dili fills the water courses with sediment and makes flooding
worse. Waste audit data suggests green waste makes up 33% or more of Dili’s total waste
stream. Composters such as H3R are salvaging this material to produce soil replacement and
soil improvement materials, which are vital to address the erosion problems and agricultural
diversity of Timor-Leste.
This same wood and other material is a key source for a waste to energy plant, presenting the
conflict with recyclables options.
9.8 Second Tier Options for Future Recycling
The above section lists some of the main recycling companies and entities already operating in
or around Dili. Below is a list in no particular order of the type of other opportunities that may be
considered in the future.
Our latest information is that the Plasma Arc contract is proceeding and that all waste from Dili
City is to be conveyed under the terms of this contract to the plant at Tibar. The Minister has
indicated that existing operating recyclers will be exempt and so, as a contingency, the report
has concentrated on making viable and operational recyclers such as Hopesellers and Caltech;
Star Products and H3R composting. As the target feedstock for this process is organics, it
would seem likely that plastics, paper, cardboard and green waste may eventually be sought
after by the operator. Inert metals and building stone are not desired and increase plasma arc
operating costs, so should continue as established.
Therefore, the following may be developed further in parallel with the first tier recyclables
approach described above:
Cloth Supermarket bags/ woven baskets – micro loans to manufacture – possibly a
small charge for importing plastic bags at outlets will pay small businesses to produce
more cloth bags and subsidise the cost of providing an alternative;
GHD | Report for Asian Development Bank – TA-8750 TIM: Preparing the Urban Services Improvement Sector Project, 5510101 | 65
Remanufacture of discarded plastics – a small privately funded enterprise in Dili could
remanufacture the plastic bags and other waste stream components into robust bags,
hats and toys etc. and could be expanded through micro-loans. The SEPFOPE/ Star
Products venture has this remanufacturing of PET plastic into products as a future aim;
Limit plastics imported - use polyethylene and PET for food containers and bags (which
burn cleanly) as last resort for disposal. Educate possibility of use for fire starting in rural
homes which have little access to recycling;
Refine and filter motor oil – export or refine locally to sell at discount for chain saw or
metalworking lubrication, power station (Baucau cement) fuel or in engines - dependent
upon quality;
Diesel engine sump oil bleed back into fuel injection – diesel generator sets in Tonga
and elsewhere have waste sump oil fed at low rate into fuel to be burned. Crepe
external ultra-filters can also extend serviceable life of oil by order of magnitude;
Container deposit on bottles and cans - the current purchase of bottles and scrap
metals assists, but a community wide clean up can be facilitated by applying a
refundable deposit on nuisance containers in Timor-Leste. This also to be addressed
under waste minimisation. The lowest denomination coin at 5c makes this quite
expensive for the poorer families however;
Re-use personal bottles – place bulk treated water dispensers with the hand pump
readily available in Dili in supermarkets for cheaper “own bottle” refills to reduce usage.
Modify to ensure hygienic air break to refilled bottle;
Cast aluminium small boat components from cans- micro loans to set up moulds for
boat fittings, other products from cans;
“Glass-crete”- set up ball mill for thicker jars and bottles to break up for sand and
aggregate for use in urban footpaths concrete - silica is quartz rock originally. Trowelling
the cement paste on the surface makes the material safe to use for paths etc. Current
outlet is security barrier on top of masonry walls;
Cardboard compactors at supermarkets. Timor Plaza is reviewing and rebuilding its
waste management facility to be more sustainable and is seeking enterprise partners.
Newly negotiated sea freight for recyclables will make some of these products viable to
export;
LED light exchange subsidized from power bills – replace incandescent and toxic
compact fluorescents with long life globes and reduce generator demand;
Clean up steel vehicle bodies and scrap steel – bulk ship to Indonesian steel mills as
one-off clean up. A mobile car compactor unit can be hired for large jobs;
Used car deposit for return to recycler – charge a refundable deposit to discourage
dumping unserviceable cheap car bodies, trucks in forests, yards;
Vehicle tyre wall cutter – remove sidewalls to allow landfilling (tyres are problems for
voids and “pumping” to surface). Once removed walls can be used for erosion control
bolted or tied together at the foreshore or on hillsides and for artificial fish breeding reefs
offshore;
Use publicity and good corporate citizen aspects to encourage shipping companies
currently carrying empty sea containers back to busier ports to provide substantial
discounts to exporters of recyclables to offshore manufacturers. There has been some
success on this front with two positive responses from ANL and Mariana after the
project set out the likely freight numbers and destinations. Government procurement
contracts might be linked to a contract which requires such opportunity from the carriers
bringing the packaging and paper and plastics into the Timor-Leste environment.
66 | GHD | Report for Asian Development Bank – TA-8750 TIM: Preparing the Urban Services Improvement Sector Project 5510101
10. Waste Collection 10.1 Introduction and background
Generally waste is loaded into trucks by hand from about 200 concrete hoppers positioned
within neighbourhoods. The first 100 of these were constructed in 2002. Unfortunately, the
gates to these bunkers have been widely removed by thieves using them for animal pens and
similar uses. Also some hoppers have been privately built for residential and commercial
complexes. Also, there are hooklift truck skips at market sites and bins at public places.
This waste is collected by up to 40 vehicles hired through the DDA (targeting two to 3 return
trips to the dumpsite per day), 15 government vehicles (targeting 2 return trips to the dumpsite
per day) and approximately 20 private sector vehicles serving various institutional and
commercial activities. There is a very small amount of door-to-door collection provided by
private contractors (such as Anteater) that mainly transport plastic mobile garbage bins.
Collectively, this indicates that a theoretical maximum of some 160 vehicles a day could be
travelling to Tibar dumpsite. In reality it rarely exceeds 120 vehicles per day in 2015.
10.2 Initial Collection Improvement Option – Street Sweeper Staff
In the intermediate term, the approach to reduce fly dumping and littering could be by having
street sweeper staff collect the household waste door to door at a set time each day, as well as
sweep the streets clearing up litter. This is the “Indian” and “Indonesian” Municipal approach of
street sweepers with a hand cart fitted with 4 to 6 detachable containers of 30 to 40 Litres each
being responsible for a stretch of road of around 500 metres. The sweeper rings a bell or
distinctive horn so residents bring out their waste for collection. Residents must arrange
someone to meet the sweeper during his rounds. The sweeper conveys the waste to the
nearest existing concrete bunker or to trucks, for collection by the existing truck fleet.
A refinement would be motorcycle powered carts that can allow a greater area to be serviced by
the sweeper per day and would add around $1500 to the cost per cart.
The advantages of street sweepers providing door to door collection include:
Does not require loan funds necessarily;
Can be quickly put into action;
Conforms with new regulations limiting the hours that waste can be deposited into the
streets and reduces exposure time of waste to animals;
Carts service can reduce uncontrolled littering;
Carts can access footpaths to houses as well as roads;
Carts can separate some loose green waste and bottles;
Rubbish not spread by domestic animals from informal piles on back streets;
Timing of collections can reduce access to domestic waste by animals;
Retained employment and income for local sweepers and trucking firms;
Carts can be made locally at low cost;
Can be incorporated into municipal grants for cleaning up Dili;
Can support larger fleet to access narrow back streets in the future.
The disadvantages of street sweepers providing door to door collection include:
Sweepers and labourers risk injury loading and unloading;
Handled twice, slower loading and still slow manual unloading and delivered in
uncompact volume directly to landfill face;
GHD | Report for Asian Development Bank – TA-8750 TIM: Preparing the Urban Services Improvement Sector Project, 5510101 | 67
Still requires at least 66 truckloads of waste to Tibar landfill each day;
Green waste largely uncatered for and may be dumped on footpaths;
Requires provision of hand carts for sweepers and enough staff to cover Dili at 500
metres of road each for domestic waste collection service;
People who miss collection may still throw litter in the street;
People may be fined if they are not home when the collection occurs and leave waste
in the streets;
Costs more long term than mechanized collection.
Overall this is not recommended as anything more than an interim or transition approach and
has not been further examined.
10.3 Overview of Near to Medium Term Collection Options
The current form of collection from neighbourhood concrete bunkers is familiar to the residents
and requires them to cart their waste to a central point. Therefore, it is suggested that this form
of around-the-clock service might be more readily adopted by the people, rather than door-to-
door collection which requires a set time for service street sweeper staff and has many other
disadvantages discussed later.
The restriction exists that many houses do not have street access and this also makes
“individual household bins” a more difficult option. Protecting smaller bins from overturning by
domestic animals, theft and vandalism is also of concern.
The options presented shall include a collection from household wheelie bins to assess
probable costs, but is not considered viable at this time in the development of Dili’s urban
services.
The new arrangements would be initiated together with educational campaigns to reinforce the
message to separate the waste and recyclables. The primary concept discussed looks to
service some 20 to 30 households with centrally located steel skip(s) which can be lifted with a
lifter attachment to the waste truck. The skip holds one week of putrescible and household
waste for 30 households and is cleared once per week. If odour problems are encountered,
twice weekly collection (as in Darwin) could be instituted. Each day, the trucks would service
14% of Dili to the landfill, returning after a week to each zone.
Assuming house lots are two deep with a ten to fifteen metre allotment width, the maximum
distance walked to deposit waste in a bin would be around 100 metres. This would allow
houses with no street access to carry bags to the bin. Waxed paper bags or other
biodegradable bags might be supplied with the service as an alternative to plastic bags for
carrying the waste out to the skip.
Surveys show many children are enlisted to carry the waste to the bins currently and so it is
proposed to place a concrete beam at the end of the skip to position it and to allow steps for
child access. A smaller lid in the skip cover could be installed to allow smaller citizens ease of
access.
The system is likely to be put in place from 2018 and initial plant requirements and collection
rates are presented herein. In essence the population from the recent JICA predictions would
be at a density of around 6 persons per house. The waste generation rate is 0.72 Kg/head/day
or 4.32 Kg/house/day.
From 2018 there should be provision for kerbside separation of green waste and some recycling
(to cages) of plastics reducing the putrescible and household waste to 3 Kg/house/day
For 30 households for a week this would be around 4.2 cubic metres volume at 150 Kg/cubic
68 | GHD | Report for Asian Development Bank – TA-8750 TIM: Preparing the Urban Services Improvement Sector Project 5510101
metre density. With some additional diversion to green waste, or slight compaction in the skip
the 4 cubic metre skip should suffice. Recycling rates are assumed to increase in the short
term.
The smaller three x 1.2 cubic metre skips used with the “narrow street” rear lifter trucks would
take 24 houses for a week.
With diversion at 30% of waste (green waste component) the household would dispose around
140 Litres per week of domestic putrescible waste. If door-to-door collection was provided, the
green waste diversion to the concrete bunkers may suffer, so limiting bin size would be an
important driver to increase green waste segregation.
Surveys indicate outer areas of Dili currently may only be collected once per week. Darwin City
(in a similar climate) has a twice weekly collection, but this would be undertaken with the bins
half full and would be less efficient and more costly. Depending upon household behaviour,
costs to service and on site waste storage, odour problems may dictate twice weekly collection.
Discussions with Dili District Administration, combined with a tour of nominated sites in Dili,
show that three types of collection plant will be needed to service Dili.
Firstly, the wider streets with power lines set back on one side have no great access
difficulties and can utilise the larger front-lift compactor trucks with around 28 cubic
metres capacity and compactive force lifting the in-situ density of loose waste of 150
Kg/ cubic metre to a compacted volume of 90 cubic metres equivalent (at 450
Kg/cubic metre). However, axle loads can be high at this loading.
With suitable suspension (airbag being one option) the manufacturer recommended a
conservative figure for payload would be 64 cubic metres capacity per load. These
trucks can load around 16 of the 4 cubic metre bins. It is envisaged that the bins
would be recessed into the footpath at about 30 degrees to the road alignment for
ease of access by the truck, without unduly blocking traffic.
A crew of three would incorporate a spotter for connecting the bins to the lifter; the
driver and a flagman to direct traffic. The two labourers would also collect spillage or
incidental waste en route. About 45% of Dili is accessible currently (2015).
Secondly, the narrower streets with drainage channels either side can be accessed by
the 8 cubic metre rear loading compactor truck. These can lift up to a 1.2 cubic metre
steel skip and can accept bins and clean-up waste from the operating crew into the
rear compactor access chute. Here it is envisaged that 3 No x 1.2 cubic metre skips
will be positioned in groups on slabs of concrete over the drains at a 30 degree angle
to the street to allow easy reversal for loading. The overhead clearance for these
trucks is less and the trucks have a low profile – down to 2.1m high.
This model can take around 24 cubic metres compacted or 20 x 1.2 cubic metre skips.
About 49% of the City needs this type of collection. The 8 cubic metre body trucks
have a 4x 2 axle configuration and a 4000Kg payload, or about 8 cu.m. of compacted
waste, which is quite efficient. The truck wheelbase is 4.25m, length 4.6m and is 2.2m
wide, so it is considered that the ability to operate in the narrow streets will be
adequate.
Thirdly a motorcycle cart can access narrow lanes to bring waste bins or bags from
households with no street access to a skip which can be accessed by the smaller 8
cubic metre truck or the larger 28 cubic metre truck. These satellite skips would act as
transfer stations. Some 6% of Dili requires this service – similar to the short-term
street sweeper staff service.
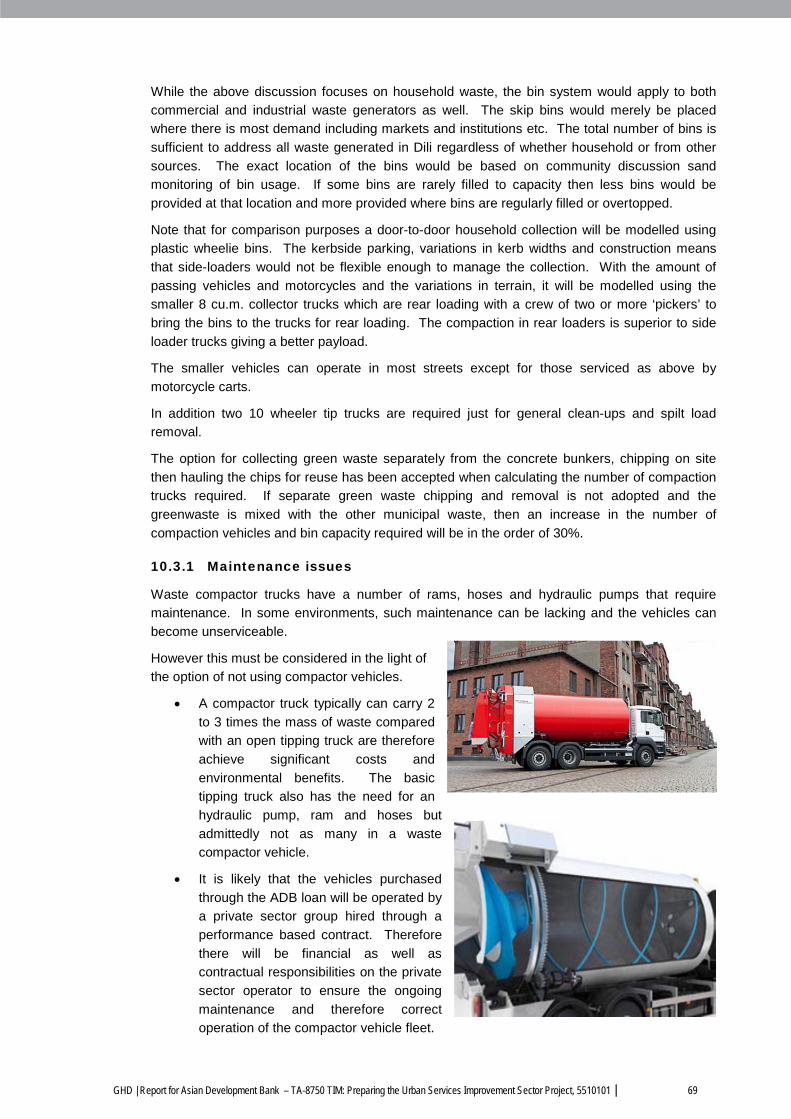
GHD | Report for Asian Development Bank – TA-8750 TIM: Preparing the Urban Services Improvement Sector Project, 5510101 | 69
While the above discussion focuses on household waste, the bin system would apply to both
commercial and industrial waste generators as well. The skip bins would merely be placed
where there is most demand including markets and institutions etc. The total number of bins is
sufficient to address all waste generated in Dili regardless of whether household or from other
sources. The exact location of the bins would be based on community discussion sand
monitoring of bin usage. If some bins are rarely filled to capacity then less bins would be
provided at that location and more provided where bins are regularly filled or overtopped.
Note that for comparison purposes a door-to-door household collection will be modelled using
plastic wheelie bins. The kerbside parking, variations in kerb widths and construction means
that side-loaders would not be flexible enough to manage the collection. With the amount of
passing vehicles and motorcycles and the variations in terrain, it will be modelled using the
smaller 8 cu.m. collector trucks which are rear loading with a crew of two or more ‘pickers’ to
bring the bins to the trucks for rear loading. The compaction in rear loaders is superior to side
loader trucks giving a better payload.
The smaller vehicles can operate in most streets except for those serviced as above by
motorcycle carts.
In addition two 10 wheeler tip trucks are required just for general clean-ups and spilt load
removal.
The option for collecting green waste separately from the concrete bunkers, chipping on site
then hauling the chips for reuse has been accepted when calculating the number of compaction
trucks required. If separate green waste chipping and removal is not adopted and the
greenwaste is mixed with the other municipal waste, then an increase in the number of
compaction vehicles and bin capacity required will be in the order of 30%.
10.3.1 Maintenance issues
Waste compactor trucks have a number of rams, hoses and hydraulic pumps that require
maintenance. In some environments, such maintenance can be lacking and the vehicles can
become unserviceable.
However this must be considered in the light of
the option of not using compactor vehicles.
A compactor truck typically can carry 2
to 3 times the mass of waste compared
with an open tipping truck are therefore
achieve significant costs and
environmental benefits. The basic
tipping truck also has the need for an
hydraulic pump, ram and hoses but
admittedly not as many in a waste
compactor vehicle.
It is likely that the vehicles purchased
through the ADB loan will be operated by
a private sector group hired through a
performance based contract. Therefore
there will be financial as well as
contractual responsibilities on the private
sector operator to ensure the ongoing
maintenance and therefore correct
operation of the compactor vehicle fleet.
70 | GHD | Report for Asian Development Bank – TA-8750 TIM: Preparing the Urban Services Improvement Sector Project 5510101
Finally there are different options for a waste compactor vehicle that do not utilize a ram
system. A rotating trommel design as shown in the adjacent photographs is equipped
with a spiral steel plate welded to the external shell. The entire cylinder rotates in a
system similar to that of a concrete agitator truck. Therefore the only moving parts are
the roller bearings and one motor to drive the cylinder. When the waste has to be
emptied from the cylinder, the motor is merely reversed and this spiral plate forces the
waste from the vehicle. Such systems are becoming more popular throughout Europe
and require far less maintenance than a typical waste compactor vehicles using the
traditional ram system.
For these reasons, it is appropriate that a waste compaction fleet should be adopted. The exact
type of compaction system to be employed can be confirmed at the detailed design and
procurement stage.
10.4 Green Waste Kerbside chipping
Some 240 cu metres per day of green waste has to be managed. Approximately 25% is leaves
and grass, so woody waste would be about 180 cubic metres per day.
Discussions were held regarding a machine capable of chipping a 150mm diameter branch. It
was assumed the larger than 150mm timbers would be chain saw cut or burned in-situ (downed
tree).
A supplier suggested a combined blade and hammer machine which produces particles suitable
for composting. The Negri bio-shredder model R280 DK260TRG 37622, or equivalent, would
be suitable and may be drawn by a towbar on the truck carting the shredded material.
The volume reduction by chipping of branches is some tenfold and can be as high as 14 times.
Each machine should be able to do 20 cu metres per day. This can be increased with a change
of crew.
For 2018, the requirements are:
On a conservative basis 8 machines are required;
With the volume reduction, about 16 cubic metres of chips would be carted by 8 trucks
comfortably – to the composting facility.
The following options all assume that greenwaste is being diverted to the concrete bins for
separate management and hauling.
If greenwaste is not separated, then all the above equipment requirements should be increased
by one third to contain and then haul the additional co-mingled waste mass.
10.5 Fully mechanised compactor trucks and tricycles
10.5.1 Wider streets
In this option, the front lift style waste compactor truck (a short wheelbase 4x2 model) lowers its
forks and lifts a 4000 Litre skip in about 20 seconds - to deposit waste into the body behind the
driver. It is then compacted to more than three times the loose density in the skip bin. For
example, McDonald Johnson in Australia manufacture a FORCE 285 unit suiting this duty and
this would take (conservatively) around sixteen of the four cubic metre skips to fill its hopper.
Positioning the truck to the bin, lifting and re-positioning, minor clean up by the crew and travel
some 100 or 200 metres to the next skip would take about 10 minutes per skip for 16 skips.
Return travel to Tibar would be around one to 1.5 hours. These units would complete about two
trips per day to Tibar to service 480 x 2 trips = 960 households’ weekly waste. The truck then
GHD | Report for Asian Development Bank – TA-8750 TIM: Preparing the Urban Services Improvement Sector Project, 5510101 | 71
drives some 14 plus kilometres to Tibar, opens a rear hatch and a ram ejects the full load in a
few minutes.
By comparison, the current open trucks make two to three trips per day and have no significant
compaction of the waste. The compactor truck could haul eight times the waste per trip of the
current small tip trucks.
If experience showed a more frequent collection was required, the truck would be loading 32
skips and would need around 12 to 13 hours for two trips to Tibar, plus clean-up of the vehicle.
This would be accommodated by using two crews over the longer day at a higher cost.
10.5.2 Narrower roads
The narrower roads would utilise 3 x 1.2 cubic metre rear loaded skips and these would be
collected twenty (1200L) at a time by the smaller 8 cubic metre compactor trucks. This
represents 170 houses per load to Tibar.
As above the cycle time would be around 10 minutes per 3 bin group, giving 2.16 hours and an
hour return to Tibar, allowing four trips per day (80 bins and 680 households per day per truck).
A separate crew would be used to allow for clean-out of the fleet vehicles at days end (say 1
hour per truck).
For twice weekly collection, 40 half full skips collected per load gives a 3.2 hour cycle and four
trips per day to Tibar giving 160 half-full bins from 1360 households per day per truck for twice
per week. Two crews would work per day to manage four trips, including truck clean up at day’s
end.
The access tracks to houses with no street access would be handled by motorcycle carts or
hand carts in extreme locations. Street sweepers with carts can manage about 500 metres of
street with collection of waste from households into four or five 50 L drums.
The motorcycle cart travels at about four times the pace and can collect over one kilometres of
street (still need to sweep up litter and spills) transferring the waste to satellite skips on wider
accessible roads. The 120 to 200 litre wheelie bins could be carried from the houses in the tray
of the bike and returned empty if required. Householders would be responsible for their own
receptacles or bags to give to the cart collector at nominated days (probably before the day for
the skip collections).
The existing approximately 80 truck trips to Tibar each day with household waste (using the
larger trucks and excluding green waste) would become 13 trips. This is the absolute best case
interpretation of fleet needs if there were no further access limitations and the public was willing
to walk 100 metres to dispose of their waste. These issues will be assessed later in this report,
but this combination indicates the significant efficiencies available
10.5.3 Advantages
Saves current 80 truckloads to Tibar landfill each day and replaces with significantly
less trips by large compactor vehicles, as the best case scenario;
Handled once, quick loading and quick unloading and delivered in a compact volume
directly to landfill face;
Free of green waste and bottle bulking factors;
Safer for labourers to handle;
Less truck traffic in Dili Streets;
Rubbish not spread by domestic animals;
Easier to enforce littering laws;
Purpose-built trucks not able to be diverted to other uses.
72 | GHD | Report for Asian Development Bank – TA-8750 TIM: Preparing the Urban Services Improvement Sector Project 5510101
10.5.4 Disadvantages
Requires more than 535 separate 4 cubic metre steel bins for domestic waste to be
provided as well as 2144 x 1.2 cu. m. bins for narrower street collections;
Requires purchase of 3 large front lifter trucks, as well as 4 smaller more compact
rear-lifter units and 10 motorcycle carts;
Fuel and maintenance for trucks and cycles;
Reduced employment and income for local trucking firms, partly offset by chipping at
kerbside of green waste and also recycling shipments, delivery of compost products
and bulk recyclables to export or manufacturing points; delivery of finished goods
from re-manufacture;
Compactor vehicles might not access some of the narrow roads, requiring waste to be
carted out to skips in some locations by hand or by motorcycle cart;
Need to maintain safe clearance to power lines, telephone lines at bin lift locations
(rear lifters need less clearance, but take a smaller bin size of around 1.2 cubic metres
maximum, requiring more bins (groups of 3 or 4) and more time to collect).
10.6 Partly mechanised open trucks and motorcycles.
Should the purchase of compactor front / rear loader trucks be beyond the immediate budget
allocations of the Government of Timor-Leste, an all-terrain Tractor loader may be fitted with a
forklift attachment to allow tethered skip bins (a security chain attached to the near edge) to be
lifted and emptied into the open trucks of the current waste fleet. There will be no compaction of
the waste as is currently the case. Two tractors could load arriving open trucks with 8 bins per
hour.
A further economy might be had by attaching the forklift accessory to an existing loader owned
by the Government or a contractor. The lift and tip operation requires a smaller bin of around 3
cubic metres serving around 22 houses each and tethered with a safety chain to the loader
each time it is operated.
10.6.1 Advantages
Handled once, quicker loading, but still slow manual unloading and delivered in
uncompact volume directly to landfill face;
Free of green waste and bottles bulking factor;
Safer for labourers to handle loading, no change to unloading;
Rubbish not spread by domestic animals;
Easier to enforce littering laws;
Retained employment and income for local trucking firms, added to by green waste
and recycling shipments, delivery of compost products.
10.6.2 Disadvantages
Still requires some 80 truck trips to Tibar landfill each day;
Requires in the order of 1400 separate 3 cubic metre steel bins with steel chain tether
for domestic waste to be provided at closer spacings than the first option;
Requires purchase of multiple all-terrain loaders with forklift attachment;
Fuel and maintenance for loader(s);
Larger vehicles might not access narrow roads, requiring waste to be carted out to
skips in some locations by hand or motorcycle cart;
GHD | Report for Asian Development Bank – TA-8750 TIM: Preparing the Urban Services Improvement Sector Project, 5510101 | 73
Intermediate streets with 3 cubic metre skips will be difficult to manoeuvre with tractor
and block traffic to a greater extent/time;
Possible diversion of general-purpose loaders to other duties, affecting reliability of
service.
This option is sub-optimal and will not be costed in full. It would only be used as an interim step
while awaiting suitable funding to allow the far more efficient compactor truck model to be
adopted
10.7 Generation rates and service levels 2018
In 2018, it is assumed the population will be 336,000 and 90% will be in the service area =
302,400 (50,400 households at 6 persons/house). Some 70% will be accessed by the
collection, or 35,000 households.
The waste generation rate is 0.72 Kg/head.day. It is assumed 30% of the waste is separated
and/or recycled at kerbside (0.5 Kg/head/day). Waste from 30 households should fit into a 4.5
cu.m. skip for a week’s rubbish. The larger truck can compact to three times the density and
can take 16 skips or 480 houses per trip. (2 trips/day/28 cu. m. body truck) with 2 crew shifts.
Approximately 25 households will fill the 3 No. x 1200 Litre skips per week. The smaller truck
compacts three times the initial density and can collect 20 bins and 170 houses per trip. (4
trips/day/ 8 cu.m. body truck) or 680 households per truck per 4 trip day. It may be necessary to
have one collection shift with a second crew cleaning multiple 8 cu. m. truck at end of day
equalling about 1 hour per truck.
10.8 Steel Skips Collection – 2018 Option 1
The breakdown into main road access by large 28 cubic metre trucks, small roads accessed by
8 cubic metre trucks and laneways access by motorcycle carts is:
Total area serviced 2815 hectares, 176 kilometres of road;
Servicing 35,000 households;
Large compactor access to 1276 hectares, 77.5 kilometres = 45% / 15,750
households or 2,250/day on 7 day week;
Smaller compactor access to 1539 hectares = 49% / 17,150 households
or 2,450/ day on 7 day week;
Motor cycle cart access to 161 hectares = 6% / 2,100 households.
10.8.1 Once-per week collection – 2018 Option 1A
(2.3, say) 3 No. 28 cu. m. trucks (480 x 2 trips= 960 houses/day/truck) one shift;
525 No. 4 cubic metre skips;
4 No.8 cu.m. trucks (680 houses/day/truck with 4 trips) (3.6 rounded up);
2,018 No. 1200 Litre skips in groups of three at each collection point (1,070 points);
10 No. motorcycle carts (1 kilometre of road serviced each) 70 extra 4.5 cu. m. skips
for motorcycle transfer to large trucks (uses extra half truck allowed above);
One additional large and one additional small truck as spares;
Two 10 wheeler tip trucks.
10.8.2 Twice-per week collection – 2018 Option 1B
3 No. 28 cu. m. trucks (1920 houses/day/truck) but need two shift crews to achieve;
525 No. 4 cubic metre skips;
74 | GHD | Report for Asian Development Bank – TA-8750 TIM: Preparing the Urban Services Improvement Sector Project 5510101
4 No. 8 cu.m. trucks (increase to 2 crew shifts to manage 4 trips/day/truck);
2018 No. 1200 Litre skips in groups of three at each collection point(1,070 points);
10 No. motorcycle carts (1 kilometre of road serviced each) 70 extra 4 cu. m. skips for
motorcycle transfer to large trucks (uses extra half truck allowed above);
Two additional large and small trucks as spares;
Two 10 wheeler tip trucks.
The option for collecting green waste separately from the concrete bunkers, chipping on site
then hauling the chips for reuse has been accepted when calculating the number of compaction
trucks required. If separate green waste chipping and removal is not adopted and the
greenwaste is mixed with the other municipal waste, then an increase in the number of
compaction vehicles and bin capacity required will be in the order of 30%.
10.9 Wheelie bin (Door to door) collection model – 2018 Option 2
This option will require 35,000 140 Litre wheelie bins in 2018.
A small percentage of the bins will have to be conveyed to collection centres by the motorcycle
carts.
The same 8 cubic metre compactor trucks with a crew of two (at least) will hand load the
wheelie bins into the rear compactors from the collection points near each home or business.
Each truck can accommodate around 190 houses per load to Tibar.
Servicing 35,000 households;
Smaller 8 cu. m. compactors access to 94% / 32,900 households;
Motor cycle cart access to 161 hectares = 6% / 2,100 households;
All picked up by 8 cu.m. compactor trucks = 5,000 per day for 7 days.
10.9.1 Once-per week collection – 2018 Option 2A
35,000 No. 140 Litre wheelie bins;
27 No.8 cu.m. trucks (190 houses/day/truck with 1trips);
10 No. motorcycle carts (1 kilometre of road serviced each);
3 additional small trucks as spares;
Two 10 wheeler tip trucks.
10.9.2 Twice-per week collection – 2018 Option 2B
35,000 No. 140 Litre wheelie bins;
27 No.8 cu.m. trucks (380 houses/day/truck with 2 trips) but need two shift crews to
achieve and 16 hours operational;
10 No. motorcycle carts (1 kilometre of road serviced each) wheelie bins on trailer for
motorcycle transfer to compactor trucks (allowed above);
6 additional small trucks as spares;
Two 10 wheeler tip trucks.
The option for collecting green waste separately from the concrete bunkers, chipping on site
then hauling the chips for reuse has been accepted when calculating the number of compaction
trucks required. If separate green waste chipping and removal is not adopted and the
greenwaste is mixed with the other municipal waste, then an increase in the number of
compaction vehicles and bin capacity required will be in the order of 30%.
GHD | Report for Asian Development Bank – TA-8750 TIM: Preparing the Urban Services Improvement Sector Project, 5510101 | 75
10.10 Steel Skips collection model – 2023 Option 1
The population in the serviced area (92% of total) will be some 395,000 with around 6 persons
per house (65,800 houses) and 0.74Kg/person
It is predicted that some 78% is collected, or 51,300 households.
Some 34% of the waste is separated and/or recycled at kerbside, giving 2.93 Kg/house/day
At a density of 150 Kg/cubic metre loose in skips or bins, this is 0.0169 cu m/house/day or 0.136
cu m per week. 30 houses would therefore generate 4.1 cubic metres per week and so the 4.5
cu m skips will still suffice for this collection.
It will be assumed that the housing expansion in Comoro and out to Tibar at the Liquica border
as well as east to Hera will be designed to be accessible to the larger vehicles and that the
additional collection fleet will feature 20 to 28 cu m bodies either side lifting for wheelie bins or
front lifting 4.5 cu.m. skips as development and sophistication of collection takes place.
The 16,300 households increase will be therefore serviced by 4 cubic metre skips and 28 cubic
metre large front-lift compactor trucks.
With a seven day week, this makes an extra 2,330 houses per day.
10.10.1 Once-per week collection – 2023 Option 1A
The extra equipment required beyond that of 2018 is as follows:
3 extra 28 cu. m. trucks (960 houses/day/truck with 2 trips/truck);
543 extra 4 cubic metre skips and concrete bunkers;
One additional truck as spare.
10.10.2 Twice-per week collection – 2023 Option 1B
The extra equipment required beyond that of 2018 is as follows:
3 No. 28 cu. m. trucks (1920 houses/day/truck with 1 trip/day) with one extra shift
crew to achieve;
543 No. extra 4 cubic metre skips and concrete bins;
Two additional trucks as spare.
10.11 Wheelie bin collection model – 2023 Option 2
This option will require 16,300 additional 140 Litre wheelie bins.
A fleet of 8 cubic metre compactor trucks with a crew of two (at least) will hand load the wheelie
bins into the rear compactors from the collection points near each home or business.
Each truck can accommodate around 190 houses per load to Tibar.
Servicing additional 16,300 households;
Smaller 8 cu. m. compactors access to 100% of additional households;
All picked up by 8 cu.m. compactor trucks = 2330 per day for 7 days.
10.11.1 Once-per week collection – 2023 Option 2A
The extra equipment required beyond that of 2018 is as follows:
16,300 No. 140 Litre wheelie bins;
543 No. extra concrete bins;
13 No.8 cu.m. trucks (190 houses/day/truck with 1trips);
76 | GHD | Report for Asian Development Bank – TA-8750 TIM: Preparing the Urban Services Improvement Sector Project 5510101
Two additional trucks as spares.
10.11.2 Twice-per week collection – 2023 Option 2B
The extra equipment required beyond that of 2018 is as follows:
16,300 No. 140 Litre wheelie bins;
13 No.8 cu.m. trucks (380 houses/day/truck with 2 trips) but need two shift crews to
achieve and 16 hours operational;
543 No. extra concrete bins;
Four additional trucks as spares.
10.12 Additional Collection Facilities In 2028
Given that the Service Life of the vehicles and equipment would be nearing its end after 10
years of operation, this would be inappropriate juncture at the start of the long term to undertake
a review. This review would reassess the overall collection equipment and fleet mix to
determine if the different approach should be considered. For example after another decade of
development within Dili, there may be a need to introduce door to door collection in the central
city area and also it may be possible to use larger vehicles in the newly developed areas which
may have wider access roads.
As Dili grows accustomed to regular waste collection and education campaigns and
enforcement take effect, the City may transition to door-to-door collection.
However, just as in first world cities the private cul-de-sacs and multiple unit dwellings need to
bring their wheelie bins to an access road accessible to the compactor vehicle. The steel skips
will have a service life of around ten years, so the decision may be made at this time to
transition to personal household wheelie bins. These may be 140 Litre or 120 Litre as
experience dictates, but they will still be vulnerable to being tipped over by domestic animals or
by vandals.
It is therefore recommended to review experiences to this point and consider replacing the steel
skip spaces with a fenced compound (probably child-proof) with space for residents to leave
their bins the night before the regular collection and to retrieve their bins the next day. This
would allow houses without street access to bring their waste weekly to the collection point and
retrieve their bins which would significantly lessen the chance of odours from loose waste being
a problem to those nearer the collection point. Of course, if residents kept their waste in plastic
or waxed paper sealed bags, then weekly collection would be less likely to cause an offensive
odour problem. The skips would be exchanged periodically for cleaned and deodorised skips at
need.
However should the current system be assessed as still operating efficiently and satisfying
community needs, the following sections set out what additional plant would be required.
10.12.1 Steel Skips model - 2028
The population in the serviced area (95% of total) will be some 535,000.
Waste generation will increase to 0.78 Kg/person/day, 5.79 persons per house and 85% of
waste in the serviced area will be collected or 78,500 households. It is expected that some 40%
of the waste is separated and/or recycled at kerbside, giving 2.7 Kg/house/day
At 150 Kg/cubic metre loose in skips or bins this is 0.018 cu m/house/day or 0.126 cu m per
week. 30 houses would therefore generate 3.78 cubic metres per week and so the 4.5 cu.m.
skips will still suffice for this collection, or could be down-sized as experience dictates.
GHD | Report for Asian Development Bank – TA-8750 TIM: Preparing the Urban Services Improvement Sector Project, 5510101 | 77
If wheelie bins were introduced then 120 Litre bins would suffice by 2028 (replace old 140 litre
bins at end of service life).
It will be assumed that the housing expansion in Comoro and out to Tibar at the Liquica border
as well as east to Hera will be designed to be accessible to the larger vehicles and that the
additional collection fleet will feature 28 cu m bodies either side lifting for wheelie bins or 4.5
cu.m. skips as development and sophistication of collection takes place.
The 27,200 additional households increase from 2023 will be therefore serviced by 4 cubic
metre skips and 28 cubic metre large front-lift compactor trucks.
With a seven day week, an extra 3,885 houses per day needs servicing.
Once-per week collection requires:
4 extra 28 cu. m. trucks (2 x 480 = 960 houses/day/truck with 2 trips/truck);
907 extra 4 cubic metre skips and concrete bunkers;
One additional truck as spare.
Twice-per week collection requires:
4 extra 28 cu. m. trucks ( 960 houses/day/truck with one trip per day to achieve);
907 extra 4 cubic metre skips and concrete bunkers;
Two additional trucks as spare.
10.12.2 Wheelie bin model - 2028
This option will require 27,200 additional 140 Litre wheelie bins.
Each 8 cubic metre compactor truck with a crew of two (at least) will hand load the wheelie bins
into the rear compactors from the collection points near each home or business.
Each truck can accommodate around 190 houses per load to Tibar.
Servicing additional 27,200 households;
Smaller 8 cu. m. compactors access to 100% of additional households;
All picked up by 8 cu.m. compactor trucks = 3,886 per day for 7 days.
Once-per week collection requires (plus standby fleet)
27,200 No. 140 Litre wheelie bins;
21 No. 8 cu.m. trucks (190 houses/day/truck with 1trips);
907 extra concrete bunkers;
Two additional trucks as spares.
Twice-per week collection requires: (plus standby fleet)
27,200 No. 140 Litre wheelie bins;
21 No. 8 cu.m. trucks (380 houses/day/truck with 2 trips) but need two shift crews to
achieve and 16 hours operational;
907 extra concrete bunkers;
Four additional trucks as spares.
The options analysis to be completed as part of this project will include stakeholder analysis
feedback on how far people are willing to walk their waste to the bins. If it is only 50 metres
then far more bins and trucks are required and they will pay more for the service.
The best combination of skip bin sizes and truck/cart capacities will be determined following
stakeholder consultation and interviews, as well as closer inspection of skip bin locations, road
widths and likely haulage routes within the city.
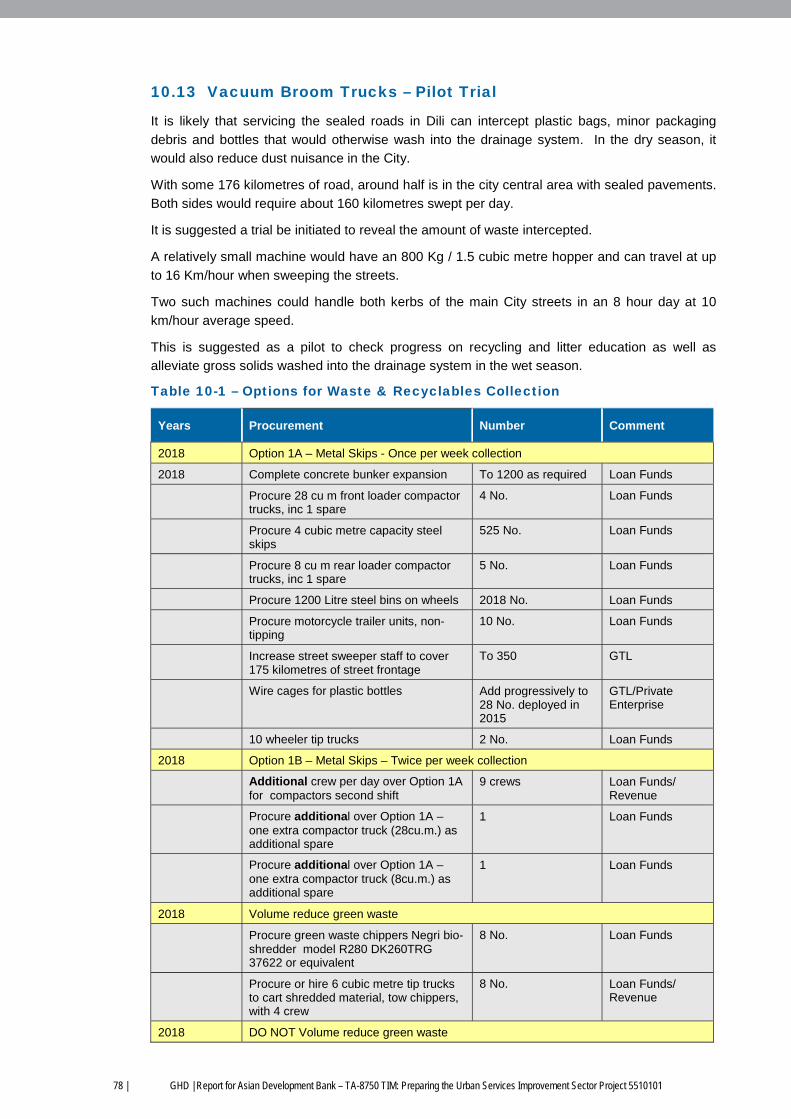
78 | GHD | Report for Asian Development Bank – TA-8750 TIM: Preparing the Urban Services Improvement Sector Project 5510101
10.13 Vacuum Broom Trucks – Pilot Trial
It is likely that servicing the sealed roads in Dili can intercept plastic bags, minor packaging
debris and bottles that would otherwise wash into the drainage system. In the dry season, it
would also reduce dust nuisance in the City.
With some 176 kilometres of road, around half is in the city central area with sealed pavements.
Both sides would require about 160 kilometres swept per day.
It is suggested a trial be initiated to reveal the amount of waste intercepted.
A relatively small machine would have an 800 Kg / 1.5 cubic metre hopper and can travel at up
to 16 Km/hour when sweeping the streets.
Two such machines could handle both kerbs of the main City streets in an 8 hour day at 10
km/hour average speed.
This is suggested as a pilot to check progress on recycling and litter education as well as
alleviate gross solids washed into the drainage system in the wet season.
Table 10-1 – Options for Waste & Recyclables Collection
Years Procurement Number Comment
2018 Option 1A – Metal Skips - Once per week collection
2018 Complete concrete bunker expansion To 1200 as required Loan Funds
Procure 28 cu m front loader compactor trucks, inc 1 spare
4 No. Loan Funds
Procure 4 cubic metre capacity steel skips
525 No. Loan Funds
Procure 8 cu m rear loader compactor trucks, inc 1 spare
5 No. Loan Funds
Procure 1200 Litre steel bins on wheels 2018 No. Loan Funds
Procure motorcycle trailer units, non-tipping
10 No. Loan Funds
Increase street sweeper staff to cover 175 kilometres of street frontage
To 350 GTL
Wire cages for plastic bottles Add progressively to 28 No. deployed in 2015
GTL/Private Enterprise
10 wheeler tip trucks 2 No. Loan Funds
2018 Option 1B – Metal Skips – Twice per week collection
Additional crew per day over Option 1A for compactors second shift
9 crews Loan Funds/ Revenue
Procure additional over Option 1A – one extra compactor truck (28cu.m.) as additional spare
1 Loan Funds
Procure additional over Option 1A – one extra compactor truck (8cu.m.) as additional spare
1 Loan Funds
2018 Volume reduce green waste
Procure green waste chippers Negri bio-shredder model R280 DK260TRG 37622 or equivalent
8 No. Loan Funds
Procure or hire 6 cubic metre tip trucks to cart shredded material, tow chippers, with 4 crew
8 No. Loan Funds/ Revenue
2018 DO NOT Volume reduce green waste
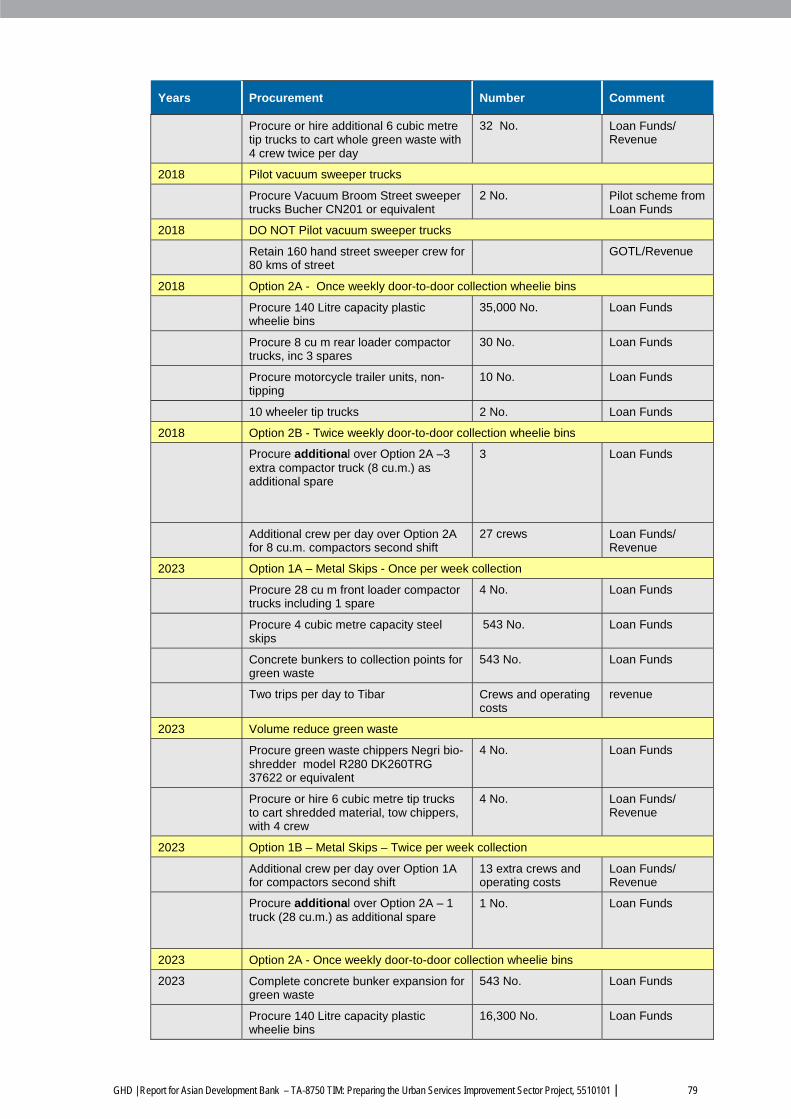
GHD | Report for Asian Development Bank – TA-8750 TIM: Preparing the Urban Services Improvement Sector Project, 5510101 | 79
Years Procurement Number Comment
Procure or hire additional 6 cubic metre tip trucks to cart whole green waste with 4 crew twice per day
32 No. Loan Funds/ Revenue
2018 Pilot vacuum sweeper trucks
Procure Vacuum Broom Street sweeper trucks Bucher CN201 or equivalent
2 No. Pilot scheme from Loan Funds
2018 DO NOT Pilot vacuum sweeper trucks
Retain 160 hand street sweeper crew for 80 kms of street
GOTL/Revenue
2018 Option 2A - Once weekly door-to-door collection wheelie bins
Procure 140 Litre capacity plastic wheelie bins
35,000 No. Loan Funds
Procure 8 cu m rear loader compactor trucks, inc 3 spares
30 No. Loan Funds
Procure motorcycle trailer units, non-tipping
10 No. Loan Funds
10 wheeler tip trucks 2 No. Loan Funds
2018 Option 2B - Twice weekly door-to-door collection wheelie bins
Procure additional over Option 2A –3 extra compactor truck (8 cu.m.) as additional spare
3 Loan Funds
Additional crew per day over Option 2A for 8 cu.m. compactors second shift
27 crews Loan Funds/ Revenue
2023 Option 1A – Metal Skips - Once per week collection
Procure 28 cu m front loader compactor trucks including 1 spare
4 No. Loan Funds
Procure 4 cubic metre capacity steel skips
543 No. Loan Funds
Concrete bunkers to collection points for green waste
543 No. Loan Funds
Two trips per day to Tibar Crews and operating costs
revenue
2023 Volume reduce green waste
Procure green waste chippers Negri bio-shredder model R280 DK260TRG 37622 or equivalent
4 No. Loan Funds
Procure or hire 6 cubic metre tip trucks to cart shredded material, tow chippers, with 4 crew
4 No. Loan Funds/ Revenue
2023 Option 1B – Metal Skips – Twice per week collection
Additional crew per day over Option 1A for compactors second shift
13 extra crews and operating costs
Loan Funds/ Revenue
Procure additional over Option 2A – 1 truck (28 cu.m.) as additional spare
1 No. Loan Funds
2023 Option 2A - Once weekly door-to-door collection wheelie bins
2023 Complete concrete bunker expansion for green waste
543 No. Loan Funds
Procure 140 Litre capacity plastic wheelie bins
16,300 No. Loan Funds
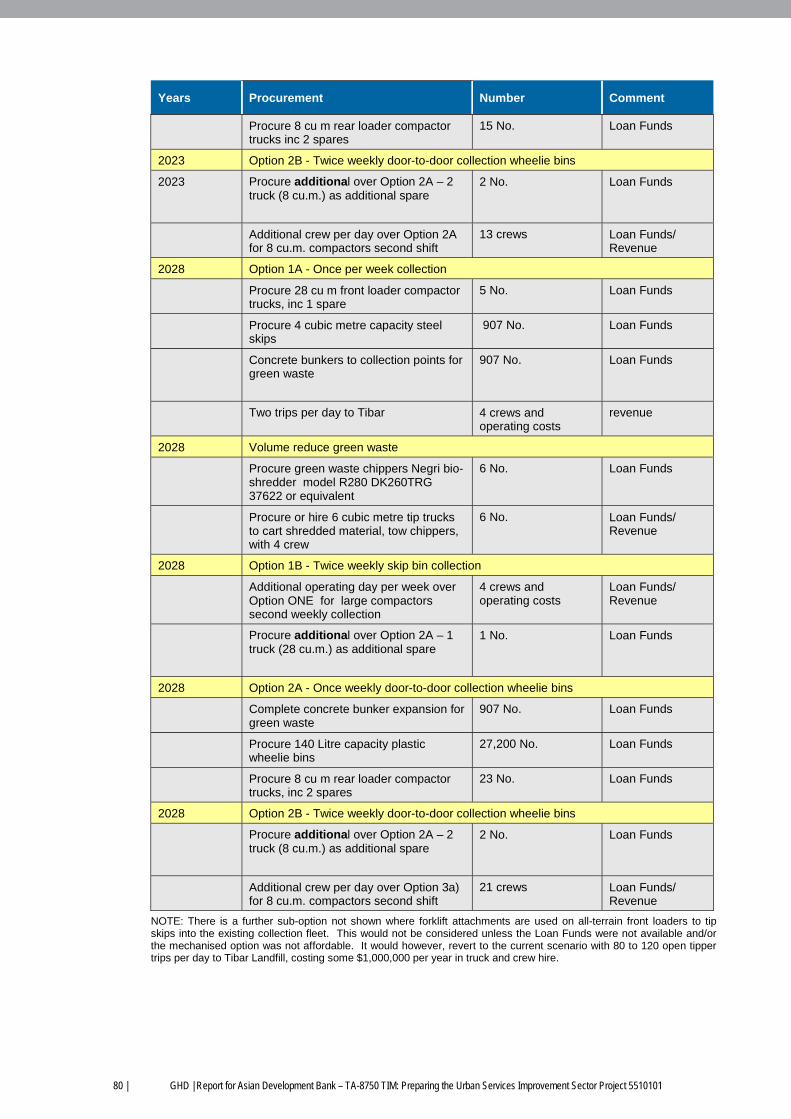
80 | GHD | Report for Asian Development Bank – TA-8750 TIM: Preparing the Urban Services Improvement Sector Project 5510101
Years Procurement Number Comment
Procure 8 cu m rear loader compactor trucks inc 2 spares
15 No. Loan Funds
2023 Option 2B - Twice weekly door-to-door collection wheelie bins
2023 Procure additional over Option 2A – 2 truck (8 cu.m.) as additional spare
2 No. Loan Funds
Additional crew per day over Option 2A for 8 cu.m. compactors second shift
13 crews Loan Funds/ Revenue
2028 Option 1A - Once per week collection
Procure 28 cu m front loader compactor trucks, inc 1 spare
5 No. Loan Funds
Procure 4 cubic metre capacity steel skips
907 No. Loan Funds
Concrete bunkers to collection points for green waste
907 No. Loan Funds
Two trips per day to Tibar 4 crews and operating costs
revenue
2028 Volume reduce green waste
Procure green waste chippers Negri bio-shredder model R280 DK260TRG 37622 or equivalent
6 No. Loan Funds
Procure or hire 6 cubic metre tip trucks to cart shredded material, tow chippers, with 4 crew
6 No. Loan Funds/ Revenue
2028 Option 1B - Twice weekly skip bin collection
Additional operating day per week over Option ONE for large compactors second weekly collection
4 crews and operating costs
Loan Funds/ Revenue
Procure additional over Option 2A – 1 truck (28 cu.m.) as additional spare
1 No. Loan Funds
2028 Option 2A - Once weekly door-to-door collection wheelie bins
Complete concrete bunker expansion for green waste
907 No. Loan Funds
Procure 140 Litre capacity plastic wheelie bins
27,200 No. Loan Funds
Procure 8 cu m rear loader compactor trucks, inc 2 spares
23 No. Loan Funds
2028 Option 2B - Twice weekly door-to-door collection wheelie bins
Procure additional over Option 2A – 2 truck (8 cu.m.) as additional spare
2 No. Loan Funds
Additional crew per day over Option 3a) for 8 cu.m. compactors second shift
21 crews Loan Funds/ Revenue
NOTE: There is a further sub-option not shown where forklift attachments are used on all-terrain front loaders to tip skips into the existing collection fleet. This would not be considered unless the Loan Funds were not available and/or the mechanised option was not affordable. It would however, revert to the current scenario with 80 to 120 open tipper trips per day to Tibar Landfill, costing some $1,000,000 per year in truck and crew hire.
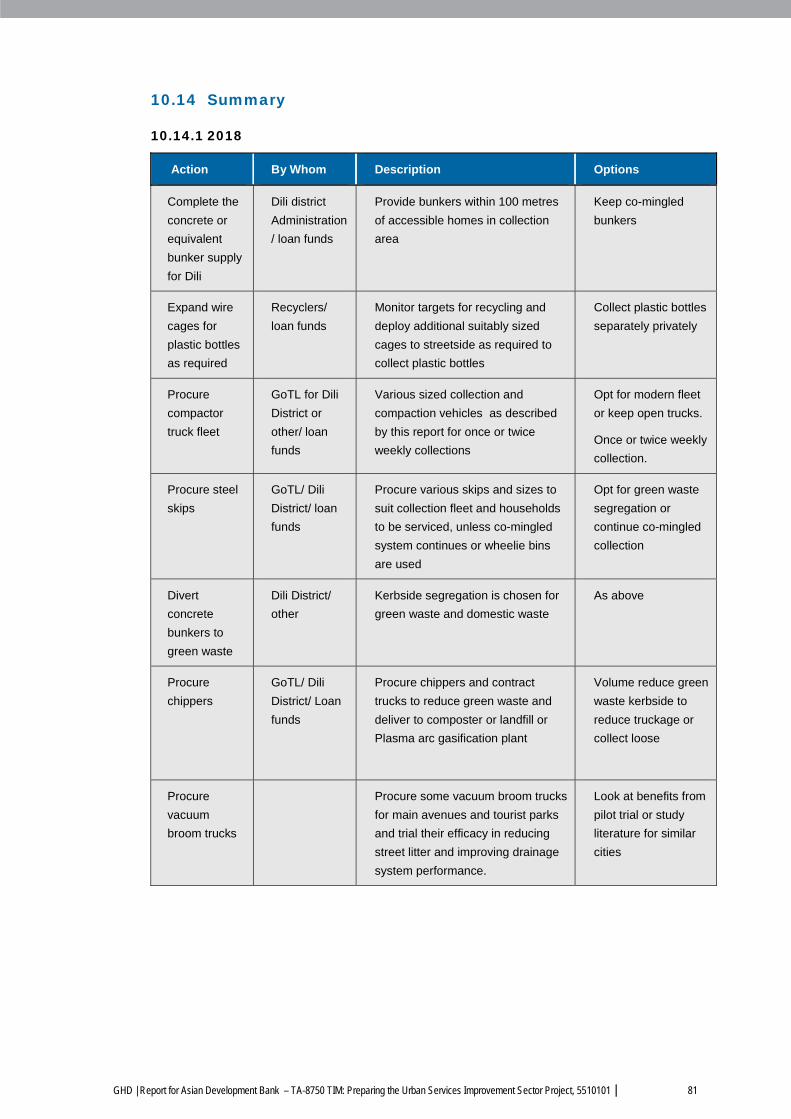
GHD | Report for Asian Development Bank – TA-8750 TIM: Preparing the Urban Services Improvement Sector Project, 5510101 | 81
10.14 Summary
10.14.1 2018
Action By Whom Description Options
Complete the
concrete or
equivalent
bunker supply
for Dili
Dili district
Administration
/ loan funds
Provide bunkers within 100 metres
of accessible homes in collection
area
Keep co-mingled
bunkers
Expand wire
cages for
plastic bottles
as required
Recyclers/
loan funds
Monitor targets for recycling and
deploy additional suitably sized
cages to streetside as required to
collect plastic bottles
Collect plastic bottles
separately privately
Procure
compactor
truck fleet
GoTL for Dili
District or
other/ loan
funds
Various sized collection and
compaction vehicles as described
by this report for once or twice
weekly collections
Opt for modern fleet
or keep open trucks.
Once or twice weekly
collection.
Procure steel
skips
GoTL/ Dili
District/ loan
funds
Procure various skips and sizes to
suit collection fleet and households
to be serviced, unless co-mingled
system continues or wheelie bins
are used
Opt for green waste
segregation or
continue co-mingled
collection
Divert
concrete
bunkers to
green waste
Dili District/
other
Kerbside segregation is chosen for
green waste and domestic waste
As above
Procure
chippers
GoTL/ Dili
District/ Loan
funds
Procure chippers and contract
trucks to reduce green waste and
deliver to composter or landfill or
Plasma arc gasification plant
Volume reduce green
waste kerbside to
reduce truckage or
collect loose
Procure
vacuum
broom trucks
Procure some vacuum broom trucks
for main avenues and tourist parks
and trial their efficacy in reducing
street litter and improving drainage
system performance.
Look at benefits from
pilot trial or study
literature for similar
cities
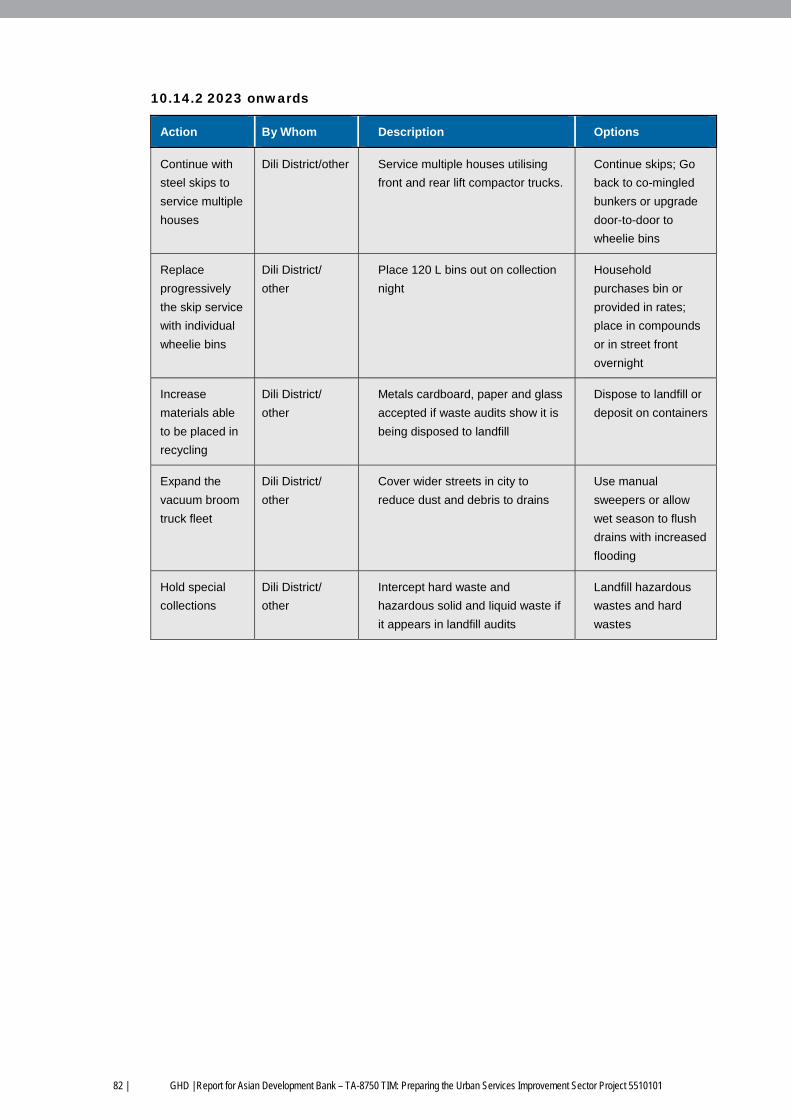
82 | GHD | Report for Asian Development Bank – TA-8750 TIM: Preparing the Urban Services Improvement Sector Project 5510101
10.14.2 2023 onwards
Action By Whom Description Options
Continue with
steel skips to
service multiple
houses
Dili District/other Service multiple houses utilising
front and rear lift compactor trucks.
Continue skips; Go
back to co-mingled
bunkers or upgrade
door-to-door to
wheelie bins
Replace
progressively
the skip service
with individual
wheelie bins
Dili District/
other
Place 120 L bins out on collection
night
Household
purchases bin or
provided in rates;
place in compounds
or in street front
overnight
Increase
materials able
to be placed in
recycling
Dili District/
other
Metals cardboard, paper and glass
accepted if waste audits show it is
being disposed to landfill
Dispose to landfill or
deposit on containers
Expand the
vacuum broom
truck fleet
Dili District/
other
Cover wider streets in city to
reduce dust and debris to drains
Use manual
sweepers or allow
wet season to flush
drains with increased
flooding
Hold special
collections
Dili District/
other
Intercept hard waste and
hazardous solid and liquid waste if
it appears in landfill audits
Landfill hazardous
wastes and hard
wastes
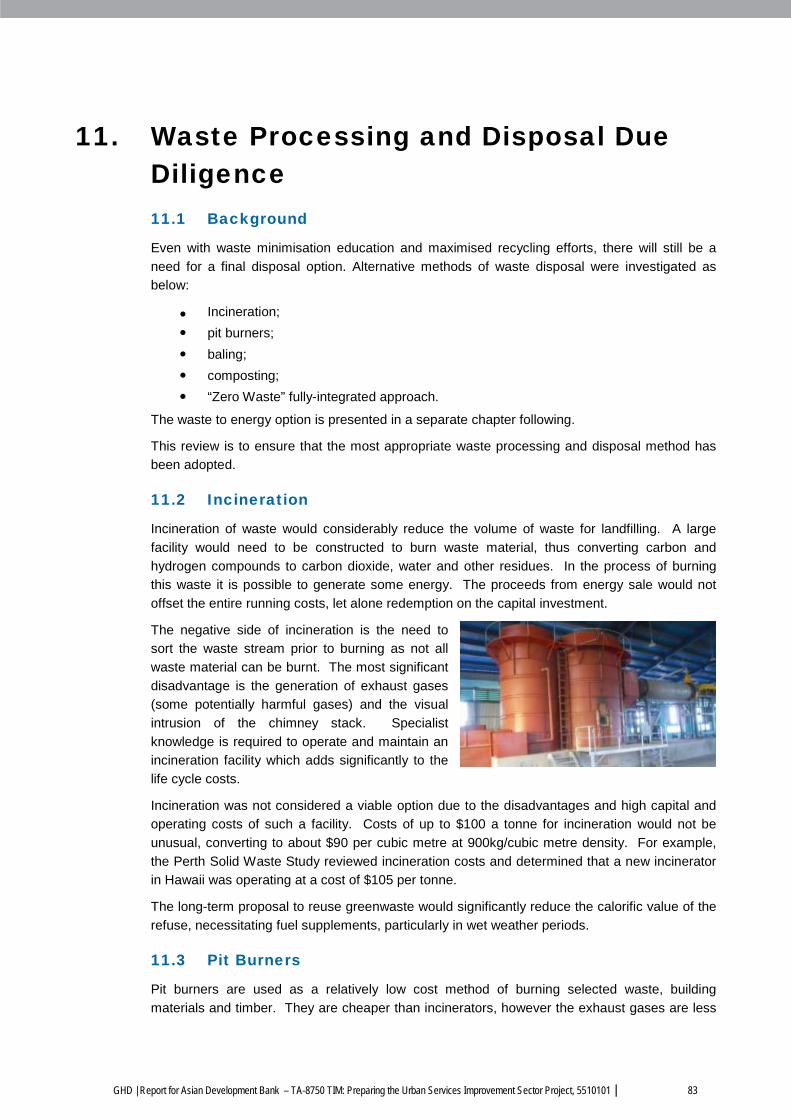
GHD | Report for Asian Development Bank – TA-8750 TIM: Preparing the Urban Services Improvement Sector Project, 5510101 | 83
11. Waste Processing and Disposal Due Diligence 11.1 Background
Even with waste minimisation education and maximised recycling efforts, there will still be a
need for a final disposal option. Alternative methods of waste disposal were investigated as
below:
Incineration;
pit burners;
baling;
composting;
“Zero Waste” fully-integrated approach.
The waste to energy option is presented in a separate chapter following.
This review is to ensure that the most appropriate waste processing and disposal method has
been adopted.
11.2 Incineration
Incineration of waste would considerably reduce the volume of waste for landfilling. A large
facility would need to be constructed to burn waste material, thus converting carbon and
hydrogen compounds to carbon dioxide, water and other residues. In the process of burning
this waste it is possible to generate some energy. The proceeds from energy sale would not
offset the entire running costs, let alone redemption on the capital investment.
The negative side of incineration is the need to
sort the waste stream prior to burning as not all
waste material can be burnt. The most significant
disadvantage is the generation of exhaust gases
(some potentially harmful gases) and the visual
intrusion of the chimney stack. Specialist
knowledge is required to operate and maintain an
incineration facility which adds significantly to the
life cycle costs.
Incineration was not considered a viable option due to the disadvantages and high capital and
operating costs of such a facility. Costs of up to $100 a tonne for incineration would not be
unusual, converting to about $90 per cubic metre at 900kg/cubic metre density. For example,
the Perth Solid Waste Study reviewed incineration costs and determined that a new incinerator
in Hawaii was operating at a cost of $105 per tonne.
The long-term proposal to reuse greenwaste would significantly reduce the calorific value of the
refuse, necessitating fuel supplements, particularly in wet weather periods.
11.3 Pit Burners
Pit burners are used as a relatively low cost method of burning selected waste, building
materials and timber. They are cheaper than incinerators, however the exhaust gases are less
84 | GHD | Report for Asian Development Bank – TA-8750 TIM: Preparing the Urban Services Improvement Sector Project 5510101
controllable. Pit burners can reduce the volume of waste requiring landfill significantly, however,
not to the extent of incineration. Operation in protracted wet weather would be difficult.
Due to the difficulties in meeting exhaust gases emission requirements and expected public
objection to the odours and visible plumes which would result, a pit burner system was not
considered viable for the total waste stream. It may be appropriate for large timber pieces and
tree stumps, especially following any natural disasters.
11.4 Baling
Baling domestic waste is a technique similar to compaction and uses pressure to bind the waste
into a tight mass ready for disposal. This process significantly reduces the volume of waste and
makes handling and transportation easier. However, baling plants are costly to purchase and
operate. They are also prone to mechanical breakdown due to the highly variable nature of the
waste stream, including items such as large metal off-cuts and rocks. The baled contents of the
landfill take longer to degrade and stabilise, thereby making the aftercare and utilisation of the
site more difficult.
It was considered that baling of waste was not an economically viable option in the study area,
especially given the relative closeness of the landfill to the city meaning haulage is already
efficient.
11.5 Composting
11.5.1 Introduction
Food wastes that are vegetable or fruit based are fine to compost, as are greenwaste, papers
and other carbon sources. Generally meat and dairy products and anything containing oil
should be avoided at the household scale
The need to reach a certain C:N ratio of about 30:1 as well as the right moisture content impacts
upon what is finally added to the compost system.
In summary for household scale schemes
YES: fruits and vegetables, such as apples (peels and core), cabbage, carrots, celery,
coffee grounds (and filters), eggshells, grapefruit, lettuce, onion peels, orange peels,
pears, pineapple, melon rinds, potatoes, pumpkin shells, squash, tea leaves,
tomatoes, turnip leaves, etc. Also greenwaste can be added provided that it is not too
big. (In composting terms, greenwaste is called “browns” indicating a higher C:N ratio.)
Paper can also be added (good source of C) provided that it is not waxed or
plasticised in any way.
NO: dairy and meat products, including butter, bones, cheese, chicken, fish scraps,
lard, mayonnaise, meat scraps, milk, sour cream, rice and yogurt. Do not compost
foods containing oils or fats such as peanut butter, salad dressing, margarine, and
vegetable oil.
For commercial or centralised schemes, meat and dairy products can be accepted in small
quantities. These schemes have sufficient mass to facilitate higher temperature compost
reactions which minimise the odours and general attractiveness of these items to pests.
11.5.2 Greenwaste
Presently greenwaste is 33% of the total waste stream. As community wealth increases, there
will be an increase in green waste for disposal.
GHD | Report for Asian Development Bank – TA-8750 TIM: Preparing the Urban Services Improvement Sector Project, 5510101 | 85
As described in the Collection chapter, a chipper should be purchased to allow the green waste
to be broken down into small pieces if larger sized material is being collected. These
greenwaste chips can then be composted, perhaps with the addition of animal or treated human
waste, including septage, to provide the correct carbon and nitrogen ratio. Alternatively
greenwaste can be used around the landfill site or in the city precinct for applying to gravel
verges and roads during wet periods and also applying to external batters to limit erosion of the
cover material.
The greenwaste is presently mixed throughout the comingled total waste stream and rarely is
collected as a consolidated entity from one location. Because of the small size and non-rigid
nature of the greenwaste, it would be very difficult to specifically remove it from the comingled
waste mechanically using a screen or trommel.
Separating it out by hand would be exceedingly labour intensive for the benefits gained, based
on the waste audit experiences.
At source segregation of greenwaste is proposed, utilising existing concrete bunkers.
11.5.3 Food waste
There are limited options for the reuse or recycling of food waste.
The food waste consisted mainly of fruit and vegetable peelings and trimmings, or spoiled fruit
and vegetables.
There was also some rice as well as some meat and cooked food in the samples audited and
observed in primary dumping locations as well as waste disposal sites.
The most obvious recycling opportunity given the current financial capacity of the communities
is to simply feed the household food waste to animals such as chickens or goats or use home
composting. This presupposes that households segregate their food waste so it can be
recycled directly at-source by the householder.
Once the community wealth increases and the quantity of food waste increases, then
consideration could be given to centrally composting the food waste. However, the food waste
is fully mixed throughout the comingled waste and is not in selected pockets, and therefore
would have to be segregated at source. This at-source segregation will be required of the
following:
Householder will have to segregate prior to either placing the food waste in a
dedicated food scraps bin for door to door collection or carrying it to the primary
dumping location where separate community bins will have to be provided for food
scraps;
Commercial premises such as restaurants and hotels will have to segregate waste
and then dispose of the food scraps as for the households, depending upon whether
there is door to door collection or not;
Market vendors will have to keep food waste separate and place in dedicated food
scraps bins.
At all levels, an IEC campaign will be required to ensure that only things that can be composted
are placed in the Food Waste bins.
The various options for composting are discussed in more detail below.
11.5.4 Composting Background
Composting trials and facilities were very popular in the 1970s and 1980s. However the failure
rate for these facilities approached 100% for a variety of reasons discussed elsewhere. Lately
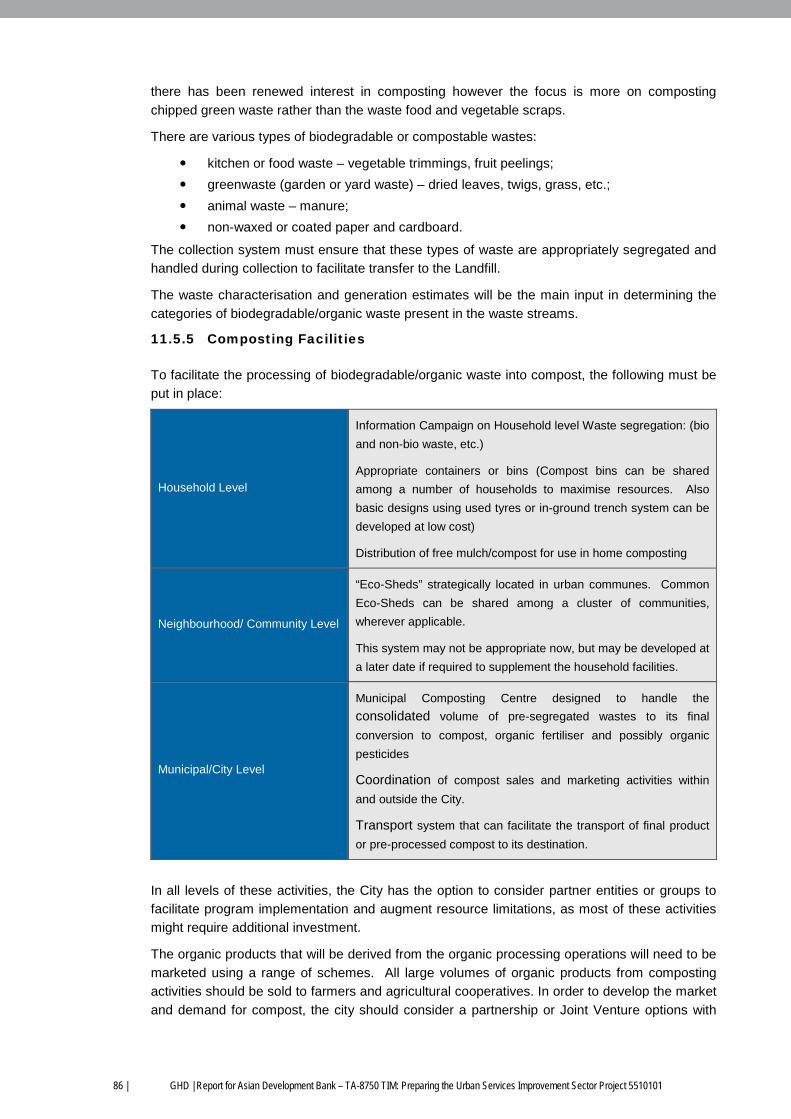
86 | GHD | Report for Asian Development Bank – TA-8750 TIM: Preparing the Urban Services Improvement Sector Project 5510101
there has been renewed interest in composting however the focus is more on composting
chipped green waste rather than the waste food and vegetable scraps.
There are various types of biodegradable or compostable wastes:
kitchen or food waste – vegetable trimmings, fruit peelings;
greenwaste (garden or yard waste) – dried leaves, twigs, grass, etc.;
animal waste – manure;
non-waxed or coated paper and cardboard.
The collection system must ensure that these types of waste are appropriately segregated and
handled during collection to facilitate transfer to the Landfill.
The waste characterisation and generation estimates will be the main input in determining the
categories of biodegradable/organic waste present in the waste streams.
11.5.5 Composting Facilities
To facilitate the processing of biodegradable/organic waste into compost, the following must be
put in place:
Household Level
Information Campaign on Household level Waste segregation: (bio
and non-bio waste, etc.)
Appropriate containers or bins (Compost bins can be shared
among a number of households to maximise resources. Also
basic designs using used tyres or in-ground trench system can be
developed at low cost)
Distribution of free mulch/compost for use in home composting
Neighbourhood/ Community Level
“Eco-Sheds” strategically located in urban communes. Common
Eco-Sheds can be shared among a cluster of communities,
wherever applicable.
This system may not be appropriate now, but may be developed at
a later date if required to supplement the household facilities.
Municipal/City Level
Municipal Composting Centre designed to handle the
consolidated volume of pre-segregated wastes to its final
conversion to compost, organic fertiliser and possibly organic
pesticides
Coordination of compost sales and marketing activities within
and outside the City.
Transport system that can facilitate the transport of final product
or pre-processed compost to its destination.
In all levels of these activities, the City has the option to consider partner entities or groups to
facilitate program implementation and augment resource limitations, as most of these activities
might require additional investment.
The organic products that will be derived from the organic processing operations will need to be
marketed using a range of schemes. All large volumes of organic products from composting
activities should be sold to farmers and agricultural cooperatives. In order to develop the market
and demand for compost, the city should consider a partnership or Joint Venture options with
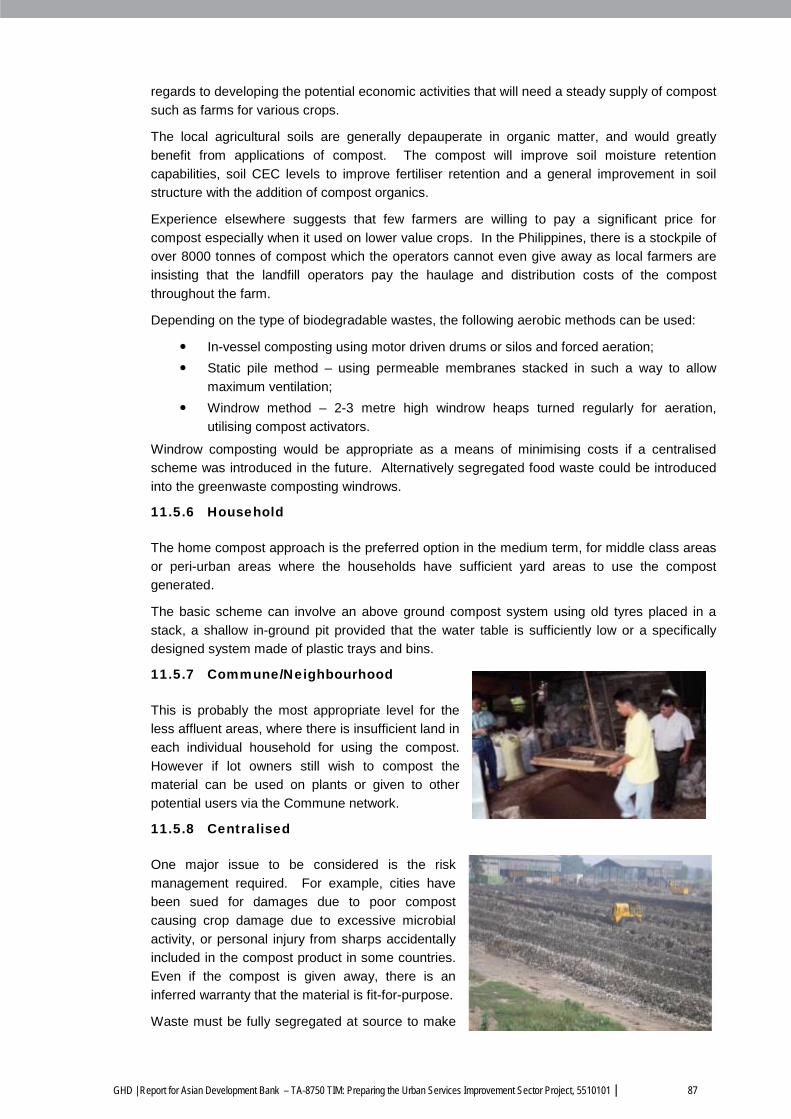
GHD | Report for Asian Development Bank – TA-8750 TIM: Preparing the Urban Services Improvement Sector Project, 5510101 | 87
regards to developing the potential economic activities that will need a steady supply of compost
such as farms for various crops.
The local agricultural soils are generally depauperate in organic matter, and would greatly
benefit from applications of compost. The compost will improve soil moisture retention
capabilities, soil CEC levels to improve fertiliser retention and a general improvement in soil
structure with the addition of compost organics.
Experience elsewhere suggests that few farmers are willing to pay a significant price for
compost especially when it used on lower value crops. In the Philippines, there is a stockpile of
over 8000 tonnes of compost which the operators cannot even give away as local farmers are
insisting that the landfill operators pay the haulage and distribution costs of the compost
throughout the farm.
Depending on the type of biodegradable wastes, the following aerobic methods can be used:
In-vessel composting using motor driven drums or silos and forced aeration;
Static pile method – using permeable membranes stacked in such a way to allow
maximum ventilation;
Windrow method – 2-3 metre high windrow heaps turned regularly for aeration,
utilising compost activators.
Windrow composting would be appropriate as a means of minimising costs if a centralised
scheme was introduced in the future. Alternatively segregated food waste could be introduced
into the greenwaste composting windrows.
11.5.6 Household
The home compost approach is the preferred option in the medium term, for middle class areas
or peri-urban areas where the households have sufficient yard areas to use the compost
generated.
The basic scheme can involve an above ground compost system using old tyres placed in a
stack, a shallow in-ground pit provided that the water table is sufficiently low or a specifically
designed system made of plastic trays and bins.
11.5.7 Commune/Neighbourhood
This is probably the most appropriate level for the
less affluent areas, where there is insufficient land in
each individual household for using the compost.
However if lot owners still wish to compost the
material can be used on plants or given to other
potential users via the Commune network.
11.5.8 Centralised
One major issue to be considered is the risk
management required. For example, cities have
been sued for damages due to poor compost
causing crop damage due to excessive microbial
activity, or personal injury from sharps accidentally
included in the compost product in some countries.
Even if the compost is given away, there is an
inferred warranty that the material is fit-for-purpose.
Waste must be fully segregated at source to make
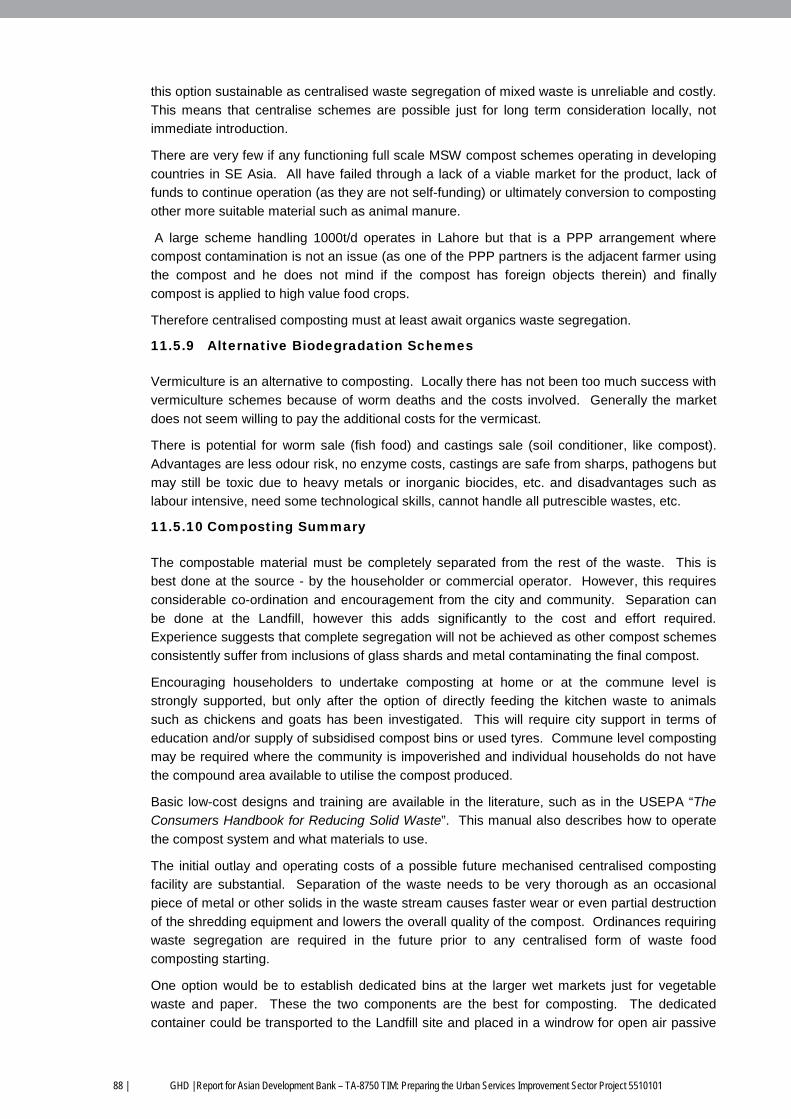
88 | GHD | Report for Asian Development Bank – TA-8750 TIM: Preparing the Urban Services Improvement Sector Project 5510101
this option sustainable as centralised waste segregation of mixed waste is unreliable and costly.
This means that centralise schemes are possible just for long term consideration locally, not
immediate introduction.
There are very few if any functioning full scale MSW compost schemes operating in developing
countries in SE Asia. All have failed through a lack of a viable market for the product, lack of
funds to continue operation (as they are not self-funding) or ultimately conversion to composting
other more suitable material such as animal manure.
A large scheme handling 1000t/d operates in Lahore but that is a PPP arrangement where
compost contamination is not an issue (as one of the PPP partners is the adjacent farmer using
the compost and he does not mind if the compost has foreign objects therein) and finally
compost is applied to high value food crops.
Therefore centralised composting must at least await organics waste segregation.
11.5.9 Alternative Biodegradation Schemes
Vermiculture is an alternative to composting. Locally there has not been too much success with
vermiculture schemes because of worm deaths and the costs involved. Generally the market
does not seem willing to pay the additional costs for the vermicast.
There is potential for worm sale (fish food) and castings sale (soil conditioner, like compost).
Advantages are less odour risk, no enzyme costs, castings are safe from sharps, pathogens but
may still be toxic due to heavy metals or inorganic biocides, etc. and disadvantages such as
labour intensive, need some technological skills, cannot handle all putrescible wastes, etc.
11.5.10 Composting Summary
The compostable material must be completely separated from the rest of the waste. This is
best done at the source - by the householder or commercial operator. However, this requires
considerable co-ordination and encouragement from the city and community. Separation can
be done at the Landfill, however this adds significantly to the cost and effort required.
Experience suggests that complete segregation will not be achieved as other compost schemes
consistently suffer from inclusions of glass shards and metal contaminating the final compost.
Encouraging householders to undertake composting at home or at the commune level is
strongly supported, but only after the option of directly feeding the kitchen waste to animals
such as chickens and goats has been investigated. This will require city support in terms of
education and/or supply of subsidised compost bins or used tyres. Commune level composting
may be required where the community is impoverished and individual households do not have
the compound area available to utilise the compost produced.
Basic low-cost designs and training are available in the literature, such as in the USEPA “The
Consumers Handbook for Reducing Solid Waste”. This manual also describes how to operate
the compost system and what materials to use.
The initial outlay and operating costs of a possible future mechanised centralised composting
facility are substantial. Separation of the waste needs to be very thorough as an occasional
piece of metal or other solids in the waste stream causes faster wear or even partial destruction
of the shredding equipment and lowers the overall quality of the compost. Ordinances requiring
waste segregation are required in the future prior to any centralised form of waste food
composting starting.
One option would be to establish dedicated bins at the larger wet markets just for vegetable
waste and paper. These the two components are the best for composting. The dedicated
container could be transported to the Landfill site and placed in a windrow for open air passive
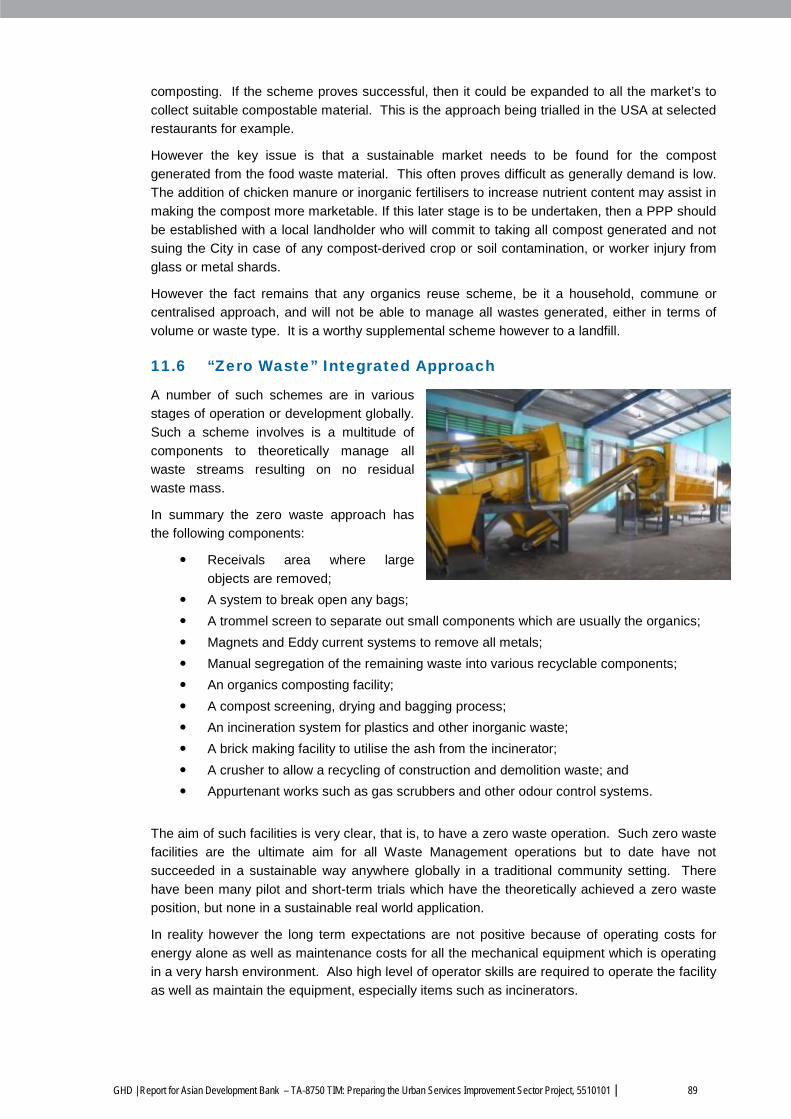
GHD | Report for Asian Development Bank – TA-8750 TIM: Preparing the Urban Services Improvement Sector Project, 5510101 | 89
composting. If the scheme proves successful, then it could be expanded to all the market’s to
collect suitable compostable material. This is the approach being trialled in the USA at selected
restaurants for example.
However the key issue is that a sustainable market needs to be found for the compost
generated from the food waste material. This often proves difficult as generally demand is low.
The addition of chicken manure or inorganic fertilisers to increase nutrient content may assist in
making the compost more marketable. If this later stage is to be undertaken, then a PPP should
be established with a local landholder who will commit to taking all compost generated and not
suing the City in case of any compost-derived crop or soil contamination, or worker injury from
glass or metal shards.
However the fact remains that any organics reuse scheme, be it a household, commune or
centralised approach, and will not be able to manage all wastes generated, either in terms of
volume or waste type. It is a worthy supplemental scheme however to a landfill.
11.6 “Zero Waste” Integrated Approach
A number of such schemes are in various
stages of operation or development globally.
Such a scheme involves is a multitude of
components to theoretically manage all
waste streams resulting on no residual
waste mass.
In summary the zero waste approach has
the following components:
Receivals area where large
objects are removed;
A system to break open any bags;
A trommel screen to separate out small components which are usually the organics;
Magnets and Eddy current systems to remove all metals;
Manual segregation of the remaining waste into various recyclable components;
An organics composting facility;
A compost screening, drying and bagging process;
An incineration system for plastics and other inorganic waste;
A brick making facility to utilise the ash from the incinerator;
A crusher to allow a recycling of construction and demolition waste; and
Appurtenant works such as gas scrubbers and other odour control systems.
The aim of such facilities is very clear, that is, to have a zero waste operation. Such zero waste
facilities are the ultimate aim for all Waste Management operations but to date have not
succeeded in a sustainable way anywhere globally in a traditional community setting. There
have been many pilot and short-term trials which have the theoretically achieved a zero waste
position, but none in a sustainable real world application.
In reality however the long term expectations are not positive because of operating costs for
energy alone as well as maintenance costs for all the mechanical equipment which is operating
in a very harsh environment. Also high level of operator skills are required to operate the facility
as well as maintain the equipment, especially items such as incinerators.
90 | GHD | Report for Asian Development Bank – TA-8750 TIM: Preparing the Urban Services Improvement Sector Project 5510101
The key issues regarding sustainability are on-going funding and plant complexity. Experience
indicates that such funding often tails away when higher priority local funding requests
eventuate, usually associated with higher profile local authority activities.
In summary, it is simply impossible to recycle or reuse every component of a real-world mixed
domestic waste and commercial/industrial waste stream. Even internally to the SWM operation,
composting is not a completely predictable activity. Compost facilities utilising more traditional
waste streams like green waste or sewage sludges --always have some batches that do not
meet specification for some reason either biological or due to contamination. These off-
specification batches have to be dumped and there is no facility at this style of plant for such a
large volume to be disposed of.
11.6.1 International Comparisons
There are no functioning full scale MSW compost schemes operating in developing countries in
SE Asia which are self-funding. All have failed through a lack of a viable market for the product,
lack of funds to continue operation (as they are not self-funding) or ultimately conversion to
composting other more suitable material such as animal manure. A large scheme handling
1000t/d operates in Lahore but that is a PPP arrangement where compost contamination is not
an issue (as one of the PPP partners is the adjacent farmer using the compost and he does not
mind if the compost has foreign objects therein) and finally compost is applied to high value food
crops.
Waste incineration is generally only practiced in locales where land costs are so high to
preclude landfill development. They are banned in some counties like the Philippines because
of concerns about the stack emission being environmentally damaging and even carcinogenic.
The Government there does not believe that incinerator scrubber and filter systems will be
maintained in the long term thereby allowing toxins to escape into the atmosphere.
The unfired bricks can only be used for local non-structural drainage projects which will
eventually be fulfilled. Also incinerator ash can contain many contaminants such as heavy
metals. Unless a pozzolanic material such as cement is added to the mix, then the heavy
metals will be mobile and can leach out causing pollution.
11.7 Summary
Most of the above methods can be used for reduction of the volume of waste; however a landfill
is still required for some part of the waste stream.
A typical zero waste approach is considered very unlikely to be sustainable for the many
reasons listed above. The high capital and operating cost of such a process makes the process
nonviable unless the provincial or national government is committed to subsidising the operation
for the life of the operation.
Given the cost of the above methods, landfilling is considered the most appropriate method for
disposal. Only the remnant wastes will be landfilled.
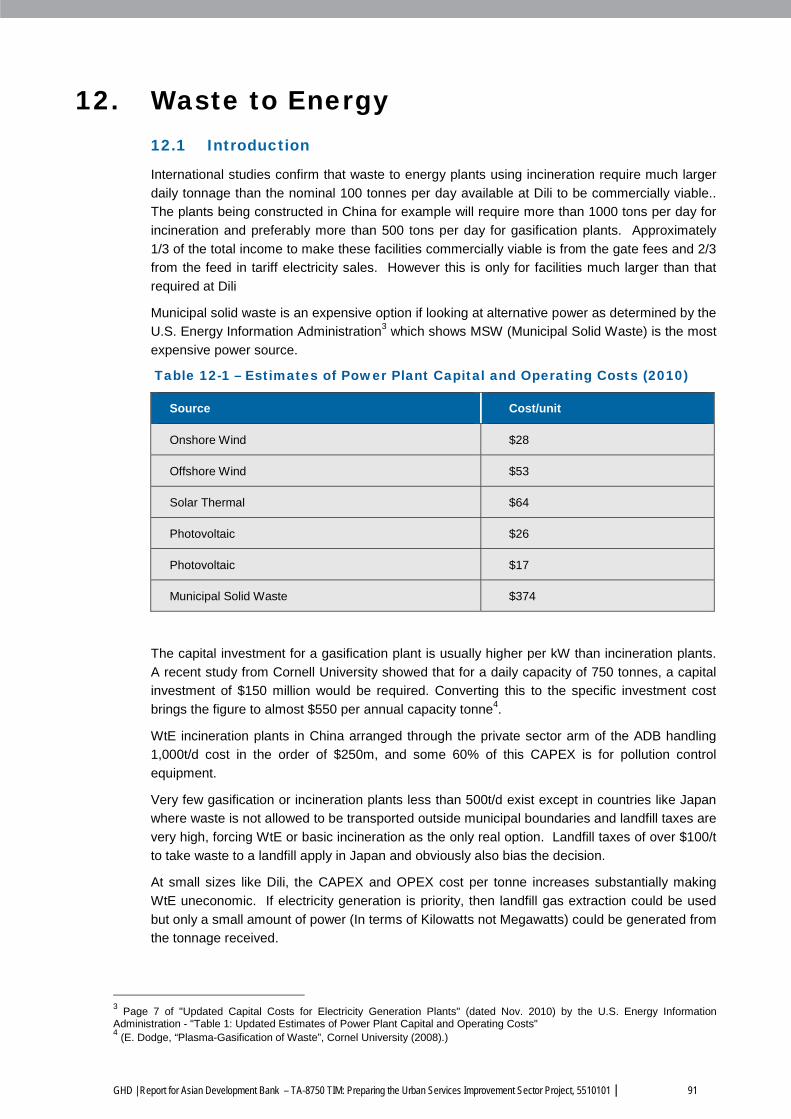
GHD | Report for Asian Development Bank – TA-8750 TIM: Preparing the Urban Services Improvement Sector Project, 5510101 | 91
12. Waste to Energy 12.1 Introduction
International studies confirm that waste to energy plants using incineration require much larger
daily tonnage than the nominal 100 tonnes per day available at Dili to be commercially viable..
The plants being constructed in China for example will require more than 1000 tons per day for
incineration and preferably more than 500 tons per day for gasification plants. Approximately
1/3 of the total income to make these facilities commercially viable is from the gate fees and 2/3
from the feed in tariff electricity sales. However this is only for facilities much larger than that
required at Dili
Municipal solid waste is an expensive option if looking at alternative power as determined by the
U.S. Energy Information Administration3 which shows MSW (Municipal Solid Waste) is the most
expensive power source.
Table 12-1 – Estimates of Power Plant Capital and Operating Costs (2010)
Source Cost/unit
Onshore Wind $28
Offshore Wind $53
Solar Thermal $64
Photovoltaic $26
Photovoltaic $17
Municipal Solid Waste $374
The capital investment for a gasification plant is usually higher per kW than incineration plants.
A recent study from Cornell University showed that for a daily capacity of 750 tonnes, a capital
investment of $150 million would be required. Converting this to the specific investment cost
brings the figure to almost $550 per annual capacity tonne4.
WtE incineration plants in China arranged through the private sector arm of the ADB handling
1,000t/d cost in the order of $250m, and some 60% of this CAPEX is for pollution control
equipment.
Very few gasification or incineration plants less than 500t/d exist except in countries like Japan
where waste is not allowed to be transported outside municipal boundaries and landfill taxes are
very high, forcing WtE or basic incineration as the only real option. Landfill taxes of over $100/t
to take waste to a landfill apply in Japan and obviously also bias the decision.
At small sizes like Dili, the CAPEX and OPEX cost per tonne increases substantially making
WtE uneconomic. If electricity generation is priority, then landfill gas extraction could be used
but only a small amount of power (In terms of Kilowatts not Megawatts) could be generated from
the tonnage received.
3 Page 7 of "Updated Capital Costs for Electricity Generation Plants" (dated Nov. 2010) by the U.S. Energy Information
Administration - "Table 1: Updated Estimates of Power Plant Capital and Operating Costs" 4 (E. Dodge, “Plasma-Gasification of Waste”, Cornel University (2008).)
92 | GHD | Report for Asian Development Bank – TA-8750 TIM: Preparing the Urban Services Improvement Sector Project 5510101
12.2 Plasma Arc Gasification Plant
Waste-to energy for power generation or other purposes has found wide acceptance in
countries where space is at a premium and landfills are extremely difficult to locate and
maintain. The discussion on Tibar Landfill (following) shows that this is not the case in Dili.
The key points of this proposal are:
$150M CAPEX (some or all provided by proponent);
Produces power from selected waste – organics, waste oil, plastics, cardboard, paper;
Feasibility based on current very high costs of power in Timor-Leste of about $0.40
per Kilowatt hour;
Commercial in confidence proposal granting 50 year control of Tibar Landfill site;
Full access to Government waste collections from Dili for life of plant operation
(condition to rescind contract if not granted);
Similar plant supplier claims energy for 1800 homes from 100t/d waste throughput, or
about 2MW generation capacity;
Existing plasma waste plants are mainly at universities and specialist military
establishments;
Will require very specialist operations and maintenance;
Proponent presently undertaking a number of feasibility studies and has signed a
contract in October 2014 with Minister of Environment Industry and Commerce after
securing finances required.
12.3 Fuel Sources & Competing Priorities
The common theme in discussions on environmental problems in Timor Leste commences with
the widespread use of firewood to boil (sterilise drinking water and for cooking and for lighting in
rural areas). Ongoing traditional slash-and-burn agriculture, combined with a nation which has
largely steeper than 40% slope in its interior, exacerbates erosion on thin topsoiled areas over
limestone terrain. The non- bioavailability of trace metals for plant nutrition and thin topsoil
layers mean erosion to the lower populated areas such as Dili fills the water courses with
sediment and makes flooding worse. Waste audit data suggests green waste makes up 33% or
more of Dili’s total waste stream. Composters such as H3R are salvaging this material to
produce soil replacement and soil improvement materials, which are vital to address the erosion
problems and agricultural diversity of Timor-Leste.
This same wood and other material is a key source for a waste to energy plant, presenting the
conflict with recyclables options.
Investigations have indicated that the proposal by the Taiwanese firm is a plasma arc based
facility. Operational details are unavailable at time of reporting. International references have
therefore been accessed for details of such plants and their performance on MSW.
Plasma arc gasification is a waste treatment technology that uses an electric arc to produce
high temperatures within the reactor to convert organic fuel material to synthesis gas and melt
the residual inorganic materials, which form a vitreous solid upon cooling. The electric arc is
maintained between electrodes in a firing device designated as a torch, or in some cases,
between the torch electrodes and the walls of the reactor (transfer arc mode).
Plasma arc gasification processes are characterized by:
High reaction temperatures and energy densities in the reactor (temperatures up to
7,000 °C or more with plasma torches that can generate energy densities up to 100
MW/m3);
GHD | Report for Asian Development Bank – TA-8750 TIM: Preparing the Urban Services Improvement Sector Project, 5510101 | 93
Capability to safely dispose of hazardous wastes including asbestos, munitions,
medical waste, toxic chemical agents, etc.;
High parasitic power loads required to operate the torches;
Production of inert vitrified solid (after cooling) from inorganic components in the fuel;
Requirement for a low moisture fuel that is consistent in composition.
In conventional plasma arc gasification reactor designs, the plasma torches are installed in a
copula and heat incoming waste. Unconverted material exits the process as a molten slag
through a port at the bottom of the reactor vessel. In the conventional design the syngas is
combusted and the hot gases are directed to a heat recovery boiler to produce steam, which is
used to generate electricity.
Plasma arc systems of this type were originally intended for use in mass burn mode after
removal of recyclables from the waste stream. Because of the extremely high temperatures
achievable in plasma arc, it was believed that little or no waste sorting would be required
because all components of the municipal solid waste stream would eventually leave the reactor
as gas or as a molten slag. As has been shown by the operation of small specialty facilities and
demonstration MSW plants, the consistency of the waste has a direct impact on performance of
a plasma facility. Waste streams that include large amounts of inorganic materials such as
poorly sorted construction waste, metals, and glass, result in increased slag production and
decreased syngas production. The heat energy that is required to melt these inorganics is lost
since the molten slag does not contribute to syngas production.
Most plasma arc facilities in Japan and North America are used for disposal of special industrial
waste or hazardous waste. Some of these facilities do provide thermal energy for district heating
or generating small amounts of electricity. Due to the high temperatures generated by the
plasma arc torches, these plants are used to dispose of such waste as asbestos, munitions,
catalytic converters, aluminium dross, and fly ash. These system range in capacity from 1 TPD
to 200 TPD, with most in the 10-20 TPD range. These plasma arc disposal facilities described
above operate successfully on a single, low moisture feedstock, the composition and
characteristics of which are well understood and do not vary over time.
12.4 Municipal Solid Waste as Feedstock
Municipal solid waste, on the other hand, has a high moisture content and is not constant in
composition. Attempts to use plasma arc gasification to treat municipal solid waste have not
been entirely successful for this and other reasons.
While several commercial scale plants using plasma arc technology for disposal of municipal
solid waste have been proposed in the US, none have yet been built. Citizens in Florida, for
example, recently rejected proposals for two large commercial scale plants citing environmental
concerns and a lack of trust in the technology.
Plasma arc gasification of MSW on a demonstration scale has been carried out. One example is
the 90 TPD facility in Ontario, Canada. In the Ontario plant design, the syngas is cooled and
used to fire a reciprocating engine powered electrical generator. Heat recovered from the
exhaust of the reciprocating engine, combined with that recovered from the cooling of the
syngas can be used to generate low quality steam for district heating or bottom cycle power
generation. This particular system experienced a number of operational problems including the
requirement to build a waste water treatment plant onsite to treat the condensate recovered
from the cooling of the syngas. The overall performance of the facility since put into operation is
indicated by the fact that, although rated at 90 TPD, it processed on average less than 10 TPD
in its first three years of commercial demonstration.
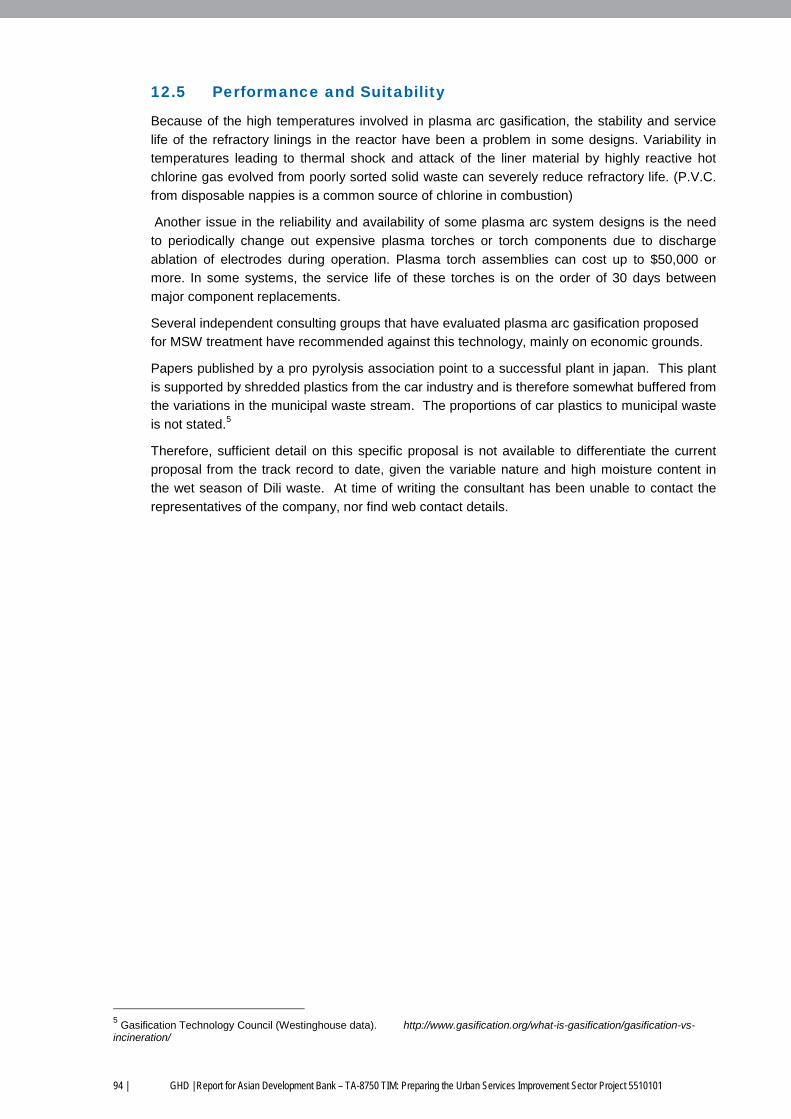
94 | GHD | Report for Asian Development Bank – TA-8750 TIM: Preparing the Urban Services Improvement Sector Project 5510101
12.5 Performance and Suitability
Because of the high temperatures involved in plasma arc gasification, the stability and service
life of the refractory linings in the reactor have been a problem in some designs. Variability in
temperatures leading to thermal shock and attack of the liner material by highly reactive hot
chlorine gas evolved from poorly sorted solid waste can severely reduce refractory life. (P.V.C.
from disposable nappies is a common source of chlorine in combustion)
Another issue in the reliability and availability of some plasma arc system designs is the need
to periodically change out expensive plasma torches or torch components due to discharge
ablation of electrodes during operation. Plasma torch assemblies can cost up to $50,000 or
more. In some systems, the service life of these torches is on the order of 30 days between
major component replacements.
Several independent consulting groups that have evaluated plasma arc gasification proposed
for MSW treatment have recommended against this technology, mainly on economic grounds.
Papers published by a pro pyrolysis association point to a successful plant in japan. This plant
is supported by shredded plastics from the car industry and is therefore somewhat buffered from
the variations in the municipal waste stream. The proportions of car plastics to municipal waste
is not stated.5
Therefore, sufficient detail on this specific proposal is not available to differentiate the current
proposal from the track record to date, given the variable nature and high moisture content in
the wet season of Dili waste. At time of writing the consultant has been unable to contact the
representatives of the company, nor find web contact details.
5 Gasification Technology Council (Westinghouse data). http://www.gasification.org/what-is-gasification/gasification-vs-
incineration/
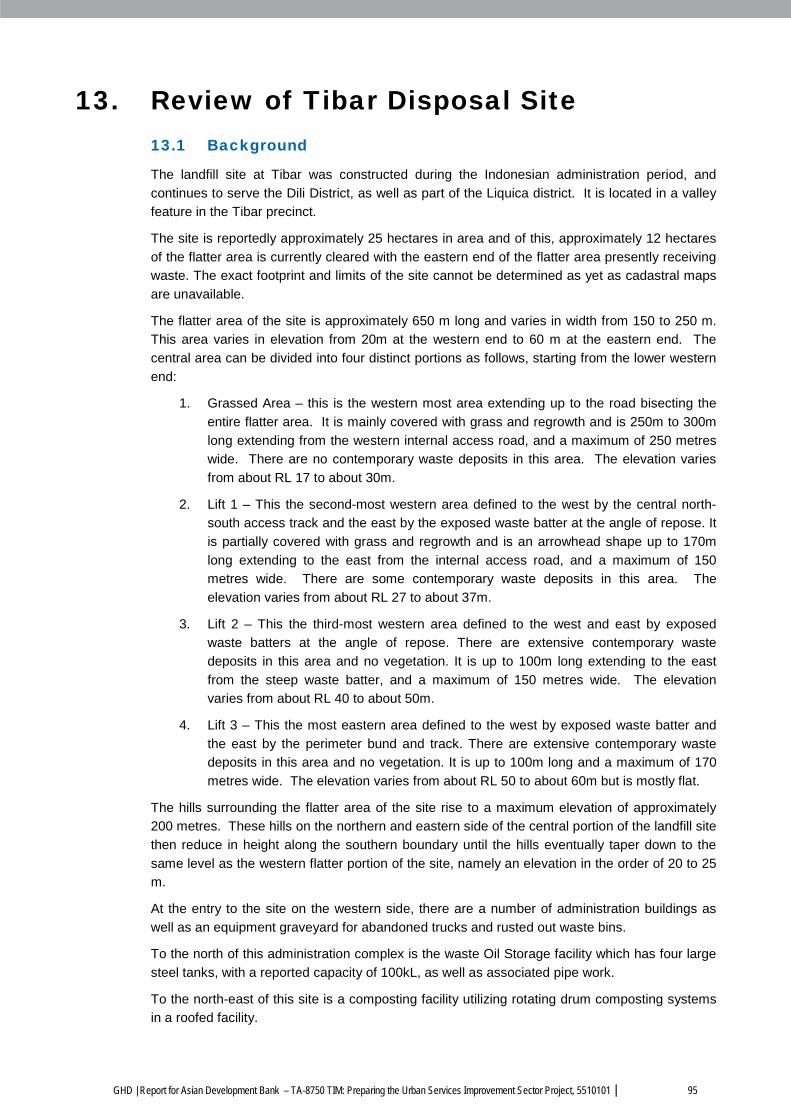
GHD | Report for Asian Development Bank – TA-8750 TIM: Preparing the Urban Services Improvement Sector Project, 5510101 | 95
13. Review of Tibar Disposal Site 13.1 Background
The landfill site at Tibar was constructed during the Indonesian administration period, and
continues to serve the Dili District, as well as part of the Liquica district. It is located in a valley
feature in the Tibar precinct.
The site is reportedly approximately 25 hectares in area and of this, approximately 12 hectares
of the flatter area is currently cleared with the eastern end of the flatter area presently receiving
waste. The exact footprint and limits of the site cannot be determined as yet as cadastral maps
are unavailable.
The flatter area of the site is approximately 650 m long and varies in width from 150 to 250 m.
This area varies in elevation from 20m at the western end to 60 m at the eastern end. The
central area can be divided into four distinct portions as follows, starting from the lower western
end:
1. Grassed Area – this is the western most area extending up to the road bisecting the
entire flatter area. It is mainly covered with grass and regrowth and is 250m to 300m
long extending from the western internal access road, and a maximum of 250 metres
wide. There are no contemporary waste deposits in this area. The elevation varies
from about RL 17 to about 30m.
2. Lift 1 – This the second-most western area defined to the west by the central north-
south access track and the east by the exposed waste batter at the angle of repose. It
is partially covered with grass and regrowth and is an arrowhead shape up to 170m
long extending to the east from the internal access road, and a maximum of 150
metres wide. There are some contemporary waste deposits in this area. The
elevation varies from about RL 27 to about 37m.
3. Lift 2 – This the third-most western area defined to the west and east by exposed
waste batters at the angle of repose. There are extensive contemporary waste
deposits in this area and no vegetation. It is up to 100m long extending to the east
from the steep waste batter, and a maximum of 150 metres wide. The elevation
varies from about RL 40 to about 50m.
4. Lift 3 – This the most eastern area defined to the west by exposed waste batter and
the east by the perimeter bund and track. There are extensive contemporary waste
deposits in this area and no vegetation. It is up to 100m long and a maximum of 170
metres wide. The elevation varies from about RL 50 to about 60m but is mostly flat.
The hills surrounding the flatter area of the site rise to a maximum elevation of approximately
200 metres. These hills on the northern and eastern side of the central portion of the landfill site
then reduce in height along the southern boundary until the hills eventually taper down to the
same level as the western flatter portion of the site, namely an elevation in the order of 20 to 25
m.
At the entry to the site on the western side, there are a number of administration buildings as
well as an equipment graveyard for abandoned trucks and rusted out waste bins.
To the north of this administration complex is the waste Oil Storage facility which has four large
steel tanks, with a reported capacity of 100kL, as well as associated pipe work.
To the north-east of this site is a composting facility utilizing rotating drum composting systems
in a roofed facility.
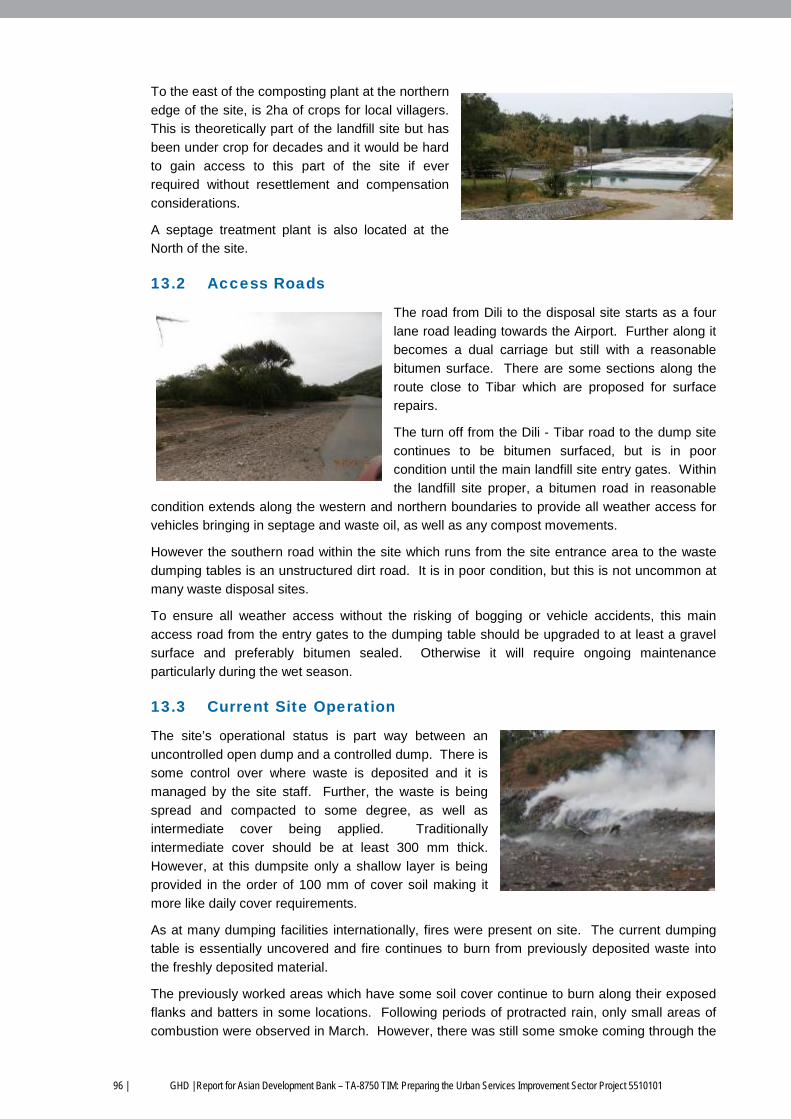
96 | GHD | Report for Asian Development Bank – TA-8750 TIM: Preparing the Urban Services Improvement Sector Project 5510101
To the east of the composting plant at the northern
edge of the site, is 2ha of crops for local villagers.
This is theoretically part of the landfill site but has
been under crop for decades and it would be hard
to gain access to this part of the site if ever
required without resettlement and compensation
considerations.
A septage treatment plant is also located at the
North of the site.
13.2 Access Roads
The road from Dili to the disposal site starts as a four
lane road leading towards the Airport. Further along it
becomes a dual carriage but still with a reasonable
bitumen surface. There are some sections along the
route close to Tibar which are proposed for surface
repairs.
The turn off from the Dili - Tibar road to the dump site
continues to be bitumen surfaced, but is in poor
condition until the main landfill site entry gates. Within
the landfill site proper, a bitumen road in reasonable
condition extends along the western and northern boundaries to provide all weather access for
vehicles bringing in septage and waste oil, as well as any compost movements.
However the southern road within the site which runs from the site entrance area to the waste
dumping tables is an unstructured dirt road. It is in poor condition, but this is not uncommon at
many waste disposal sites.
To ensure all weather access without the risking of bogging or vehicle accidents, this main
access road from the entry gates to the dumping table should be upgraded to at least a gravel
surface and preferably bitumen sealed. Otherwise it will require ongoing maintenance
particularly during the wet season.
13.3 Current Site Operation
The site’s operational status is part way between an
uncontrolled open dump and a controlled dump. There is
some control over where waste is deposited and it is
managed by the site staff. Further, the waste is being
spread and compacted to some degree, as well as
intermediate cover being applied. Traditionally
intermediate cover should be at least 300 mm thick.
However, at this dumpsite only a shallow layer is being
provided in the order of 100 mm of cover soil making it
more like daily cover requirements.
As at many dumping facilities internationally, fires were present on site. The current dumping
table is essentially uncovered and fire continues to burn from previously deposited waste into
the freshly deposited material.
The previously worked areas which have some soil cover continue to burn along their exposed
flanks and batters in some locations. Following periods of protracted rain, only small areas of
combustion were observed in March. However, there was still some smoke coming through the
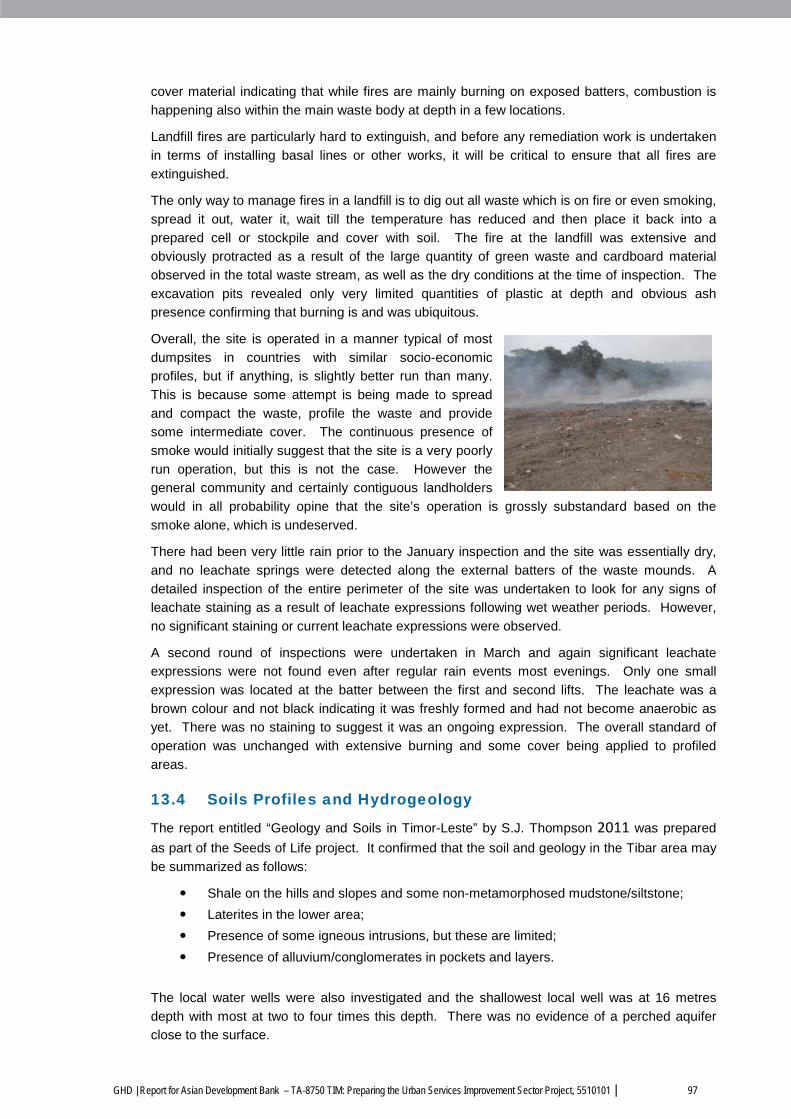
GHD | Report for Asian Development Bank – TA-8750 TIM: Preparing the Urban Services Improvement Sector Project, 5510101 | 97
cover material indicating that while fires are mainly burning on exposed batters, combustion is
happening also within the main waste body at depth in a few locations.
Landfill fires are particularly hard to extinguish, and before any remediation work is undertaken
in terms of installing basal lines or other works, it will be critical to ensure that all fires are
extinguished.
The only way to manage fires in a landfill is to dig out all waste which is on fire or even smoking,
spread it out, water it, wait till the temperature has reduced and then place it back into a
prepared cell or stockpile and cover with soil. The fire at the landfill was extensive and
obviously protracted as a result of the large quantity of green waste and cardboard material
observed in the total waste stream, as well as the dry conditions at the time of inspection. The
excavation pits revealed only very limited quantities of plastic at depth and obvious ash
presence confirming that burning is and was ubiquitous.
Overall, the site is operated in a manner typical of most
dumpsites in countries with similar socio-economic
profiles, but if anything, is slightly better run than many.
This is because some attempt is being made to spread
and compact the waste, profile the waste and provide
some intermediate cover. The continuous presence of
smoke would initially suggest that the site is a very poorly
run operation, but this is not the case. However the
general community and certainly contiguous landholders
would in all probability opine that the site’s operation is grossly substandard based on the
smoke alone, which is undeserved.
There had been very little rain prior to the January inspection and the site was essentially dry,
and no leachate springs were detected along the external batters of the waste mounds. A
detailed inspection of the entire perimeter of the site was undertaken to look for any signs of
leachate staining as a result of leachate expressions following wet weather periods. However,
no significant staining or current leachate expressions were observed.
A second round of inspections were undertaken in March and again significant leachate
expressions were not found even after regular rain events most evenings. Only one small
expression was located at the batter between the first and second lifts. The leachate was a
brown colour and not black indicating it was freshly formed and had not become anaerobic as
yet. There was no staining to suggest it was an ongoing expression. The overall standard of
operation was unchanged with extensive burning and some cover being applied to profiled
areas.
13.4 Soils Profiles and Hydrogeology
The report entitled “Geology and Soils in Timor-Leste” by S.J. Thompson 2011 was prepared
as part of the Seeds of Life project. It confirmed that the soil and geology in the Tibar area may
be summarized as follows:
Shale on the hills and slopes and some non-metamorphosed mudstone/siltstone;
Laterites in the lower area;
Presence of some igneous intrusions, but these are limited;
Presence of alluvium/conglomerates in pockets and layers.
The local water wells were also investigated and the shallowest local well was at 16 metres
depth with most at two to four times this depth. There was no evidence of a perched aquifer
close to the surface.
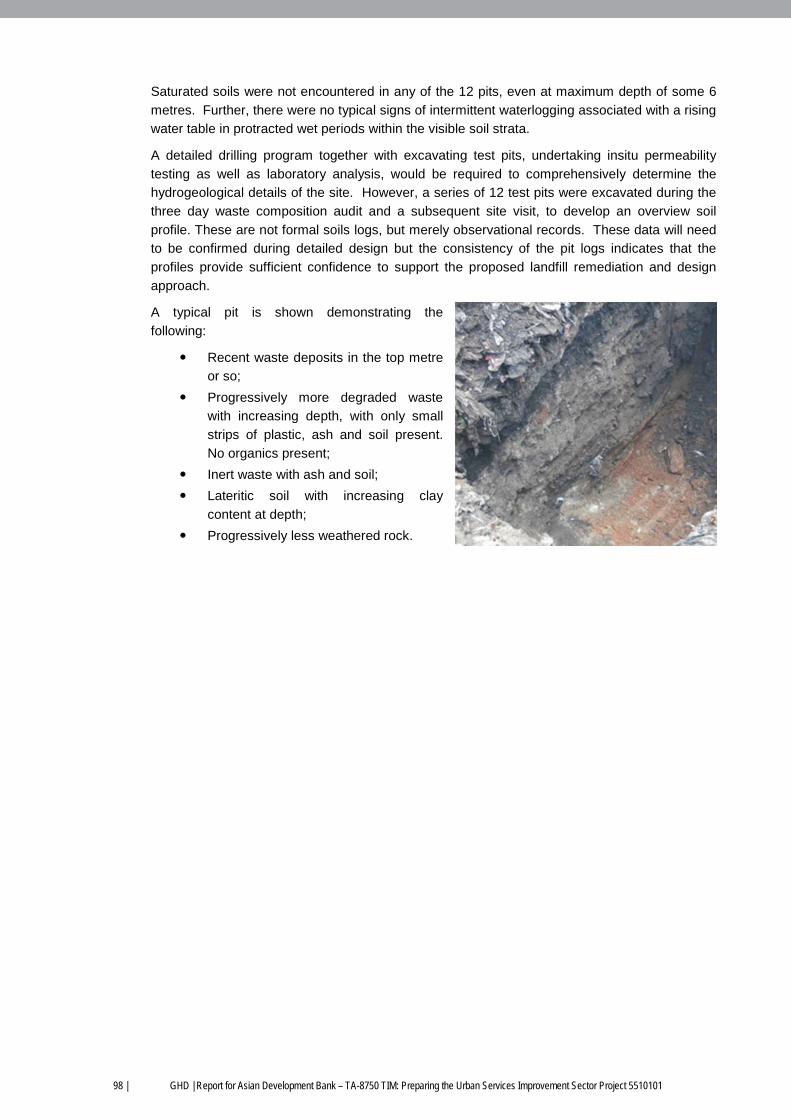
98 | GHD | Report for Asian Development Bank – TA-8750 TIM: Preparing the Urban Services Improvement Sector Project 5510101
Saturated soils were not encountered in any of the 12 pits, even at maximum depth of some 6
metres. Further, there were no typical signs of intermittent waterlogging associated with a rising
water table in protracted wet periods within the visible soil strata.
A detailed drilling program together with excavating test pits, undertaking insitu permeability
testing as well as laboratory analysis, would be required to comprehensively determine the
hydrogeological details of the site. However, a series of 12 test pits were excavated during the
three day waste composition audit and a subsequent site visit, to develop an overview soil
profile. These are not formal soils logs, but merely observational records. These data will need
to be confirmed during detailed design but the consistency of the pit logs indicates that the
profiles provide sufficient confidence to support the proposed landfill remediation and design
approach.
A typical pit is shown demonstrating the
following:
Recent waste deposits in the top metre
or so;
Progressively more degraded waste
with increasing depth, with only small
strips of plastic, ash and soil present.
No organics present;
Inert waste with ash and soil;
Lateritic soil with increasing clay
content at depth;
Progressively less weathered rock.
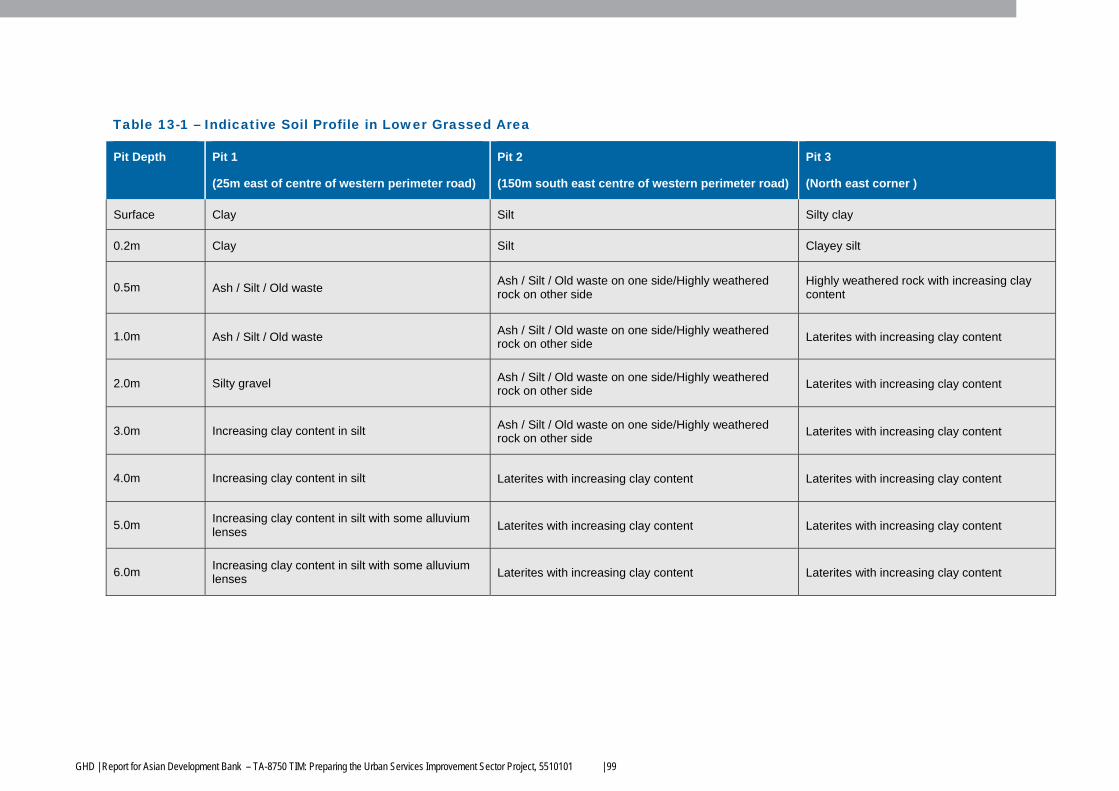
GHD | Report for Asian Development Bank – TA-8750 TIM: Preparing the Urban Services Improvement Sector Project, 5510101 | 99
Table 13-1 – Indicative Soil Profile in Lower Grassed Area
Pit Depth Pit 1
(25m east of centre of western perimeter road)
Pit 2
(150m south east centre of western perimeter road)
Pit 3
(North east corner )
Surface Clay Silt Silty clay
0.2m Clay Silt Clayey silt
0.5m Ash / Silt / Old waste Ash / Silt / Old waste on one side/Highly weathered rock on other side
Highly weathered rock with increasing clay content
1.0m Ash / Silt / Old waste Ash / Silt / Old waste on one side/Highly weathered rock on other side
Laterites with increasing clay content
2.0m Silty gravel Ash / Silt / Old waste on one side/Highly weathered rock on other side
Laterites with increasing clay content
3.0m Increasing clay content in silt Ash / Silt / Old waste on one side/Highly weathered rock on other side
Laterites with increasing clay content
4.0m Increasing clay content in silt Laterites with increasing clay content Laterites with increasing clay content
5.0m Increasing clay content in silt with some alluvium lenses Laterites with increasing clay content Laterites with increasing clay content
6.0m Increasing clay content in silt with some alluvium lenses Laterites with increasing clay content Laterites with increasing clay content
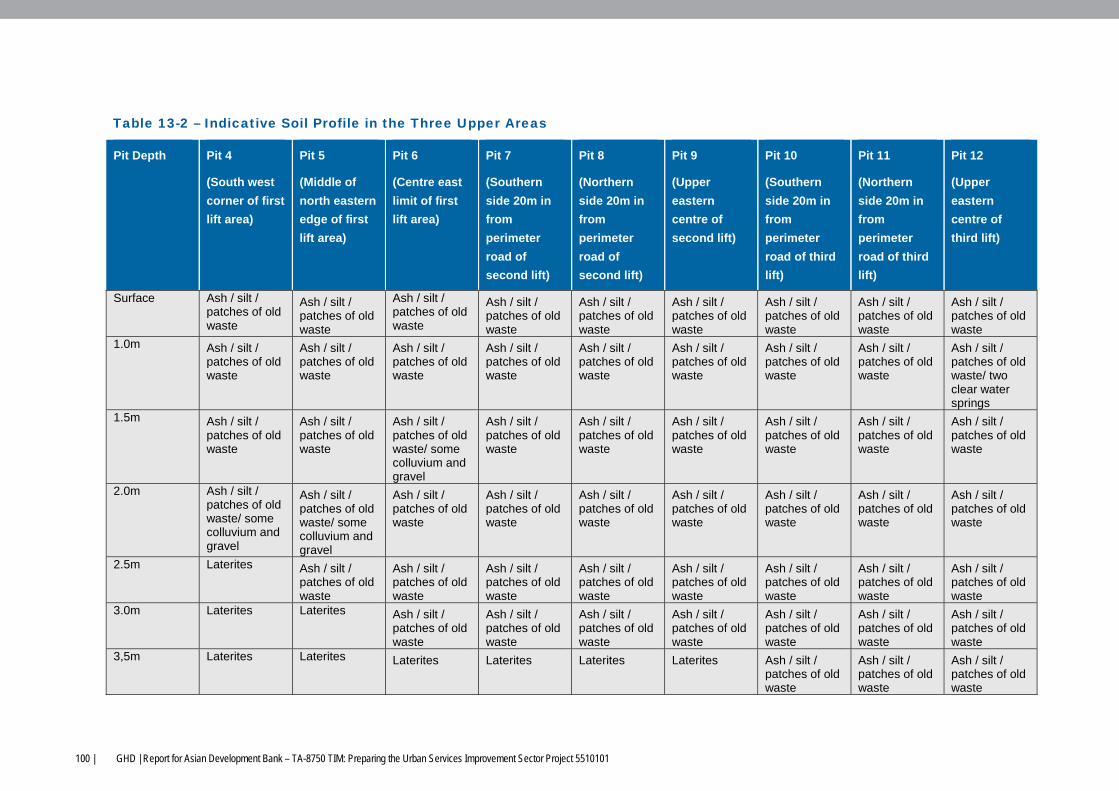
100 | GHD | Report for Asian Development Bank – TA-8750 TIM: Preparing the Urban Services Improvement Sector Project 5510101
Table 13-2 – Indicative Soil Profile in the Three Upper Areas
Pit Depth Pit 4
(South west
corner of first
lift area)
Pit 5
(Middle of
north eastern
edge of first
lift area)
Pit 6
(Centre east
limit of first
lift area)
Pit 7
(Southern
side 20m in
from
perimeter
road of
second lift)
Pit 8
(Northern
side 20m in
from
perimeter
road of
second lift)
Pit 9
(Upper
eastern
centre of
second lift)
Pit 10
(Southern
side 20m in
from
perimeter
road of third
lift)
Pit 11
(Northern
side 20m in
from
perimeter
road of third
lift)
Pit 12
(Upper
eastern
centre of
third lift)
Surface Ash / silt / patches of old waste
Ash / silt / patches of old waste
Ash / silt / patches of old waste
Ash / silt / patches of old waste
Ash / silt / patches of old waste
Ash / silt / patches of old waste
Ash / silt / patches of old waste
Ash / silt / patches of old waste
Ash / silt / patches of old waste
1.0m Ash / silt / patches of old waste
Ash / silt / patches of old waste
Ash / silt / patches of old waste
Ash / silt / patches of old waste
Ash / silt / patches of old waste
Ash / silt / patches of old waste
Ash / silt / patches of old waste
Ash / silt / patches of old waste
Ash / silt / patches of old waste/ two clear water springs
1.5m Ash / silt / patches of old waste
Ash / silt / patches of old waste
Ash / silt / patches of old waste/ some colluvium and gravel
Ash / silt / patches of old waste
Ash / silt / patches of old waste
Ash / silt / patches of old waste
Ash / silt / patches of old waste
Ash / silt / patches of old waste
Ash / silt / patches of old waste
2.0m Ash / silt / patches of old waste/ some colluvium and gravel
Ash / silt / patches of old waste/ some colluvium and gravel
Ash / silt / patches of old waste
Ash / silt / patches of old waste
Ash / silt / patches of old waste
Ash / silt / patches of old waste
Ash / silt / patches of old waste
Ash / silt / patches of old waste
Ash / silt / patches of old waste
2.5m Laterites Ash / silt / patches of old waste
Ash / silt / patches of old waste
Ash / silt / patches of old waste
Ash / silt / patches of old waste
Ash / silt / patches of old waste
Ash / silt / patches of old waste
Ash / silt / patches of old waste
Ash / silt / patches of old waste
3.0m Laterites Laterites Ash / silt / patches of old waste
Ash / silt / patches of old waste
Ash / silt / patches of old waste
Ash / silt / patches of old waste
Ash / silt / patches of old waste
Ash / silt / patches of old waste
Ash / silt / patches of old waste
3,5m Laterites Laterites Laterites Laterites Laterites Laterites Ash / silt / patches of old waste
Ash / silt / patches of old waste
Ash / silt / patches of old waste
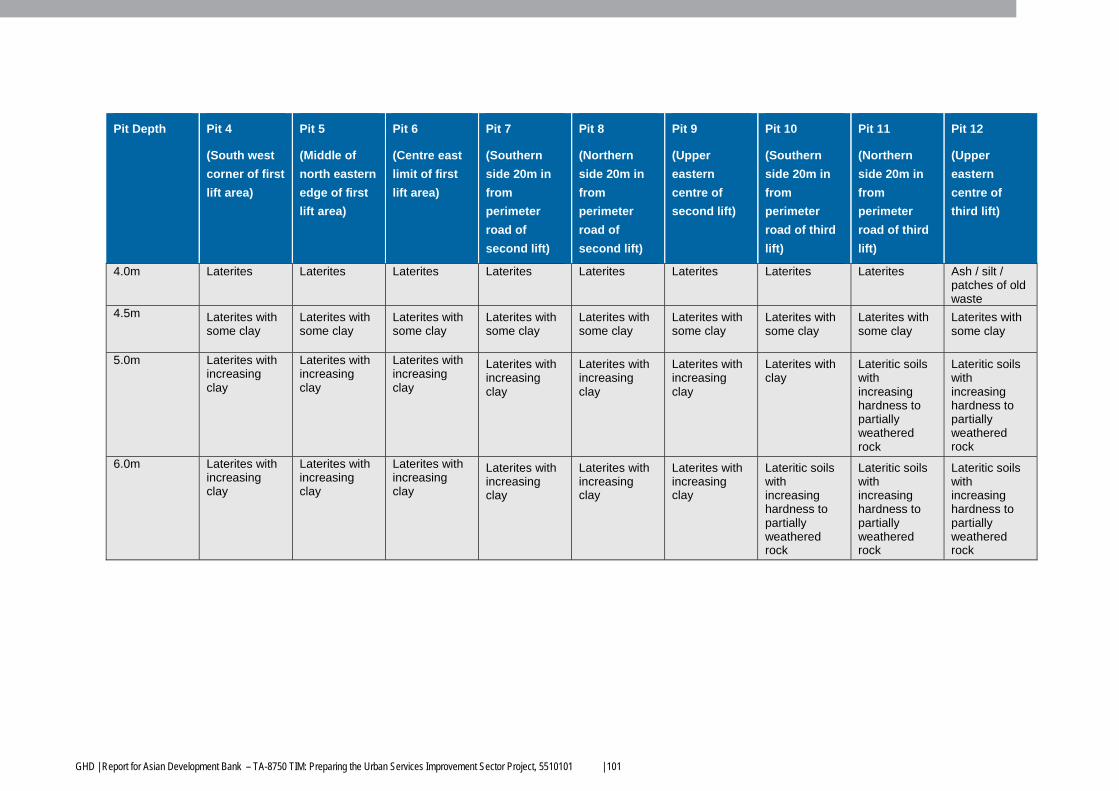
GHD | Report for Asian Development Bank – TA-8750 TIM: Preparing the Urban Services Improvement Sector Project, 5510101 | 101
Pit Depth Pit 4
(South west
corner of first
lift area)
Pit 5
(Middle of
north eastern
edge of first
lift area)
Pit 6
(Centre east
limit of first
lift area)
Pit 7
(Southern
side 20m in
from
perimeter
road of
second lift)
Pit 8
(Northern
side 20m in
from
perimeter
road of
second lift)
Pit 9
(Upper
eastern
centre of
second lift)
Pit 10
(Southern
side 20m in
from
perimeter
road of third
lift)
Pit 11
(Northern
side 20m in
from
perimeter
road of third
lift)
Pit 12
(Upper
eastern
centre of
third lift)
4.0m Laterites Laterites Laterites Laterites Laterites Laterites Laterites Laterites Ash / silt / patches of old waste
4.5m Laterites with some clay
Laterites with some clay
Laterites with some clay
Laterites with some clay
Laterites with some clay
Laterites with some clay
Laterites with some clay
Laterites with some clay
Laterites with some clay
5.0m Laterites with increasing clay
Laterites with increasing clay
Laterites with increasing clay
Laterites with increasing clay
Laterites with increasing clay
Laterites with increasing clay
Laterites with clay
Lateritic soils with increasing hardness to partially weathered rock
Lateritic soils with increasing hardness to partially weathered rock
6.0m Laterites with increasing clay
Laterites with increasing clay
Laterites with increasing clay
Laterites with increasing clay
Laterites with increasing clay
Laterites with increasing clay
Lateritic soils with increasing hardness to partially weathered rock
Lateritic soils with increasing hardness to partially weathered rock
Lateritic soils with increasing hardness to partially weathered rock
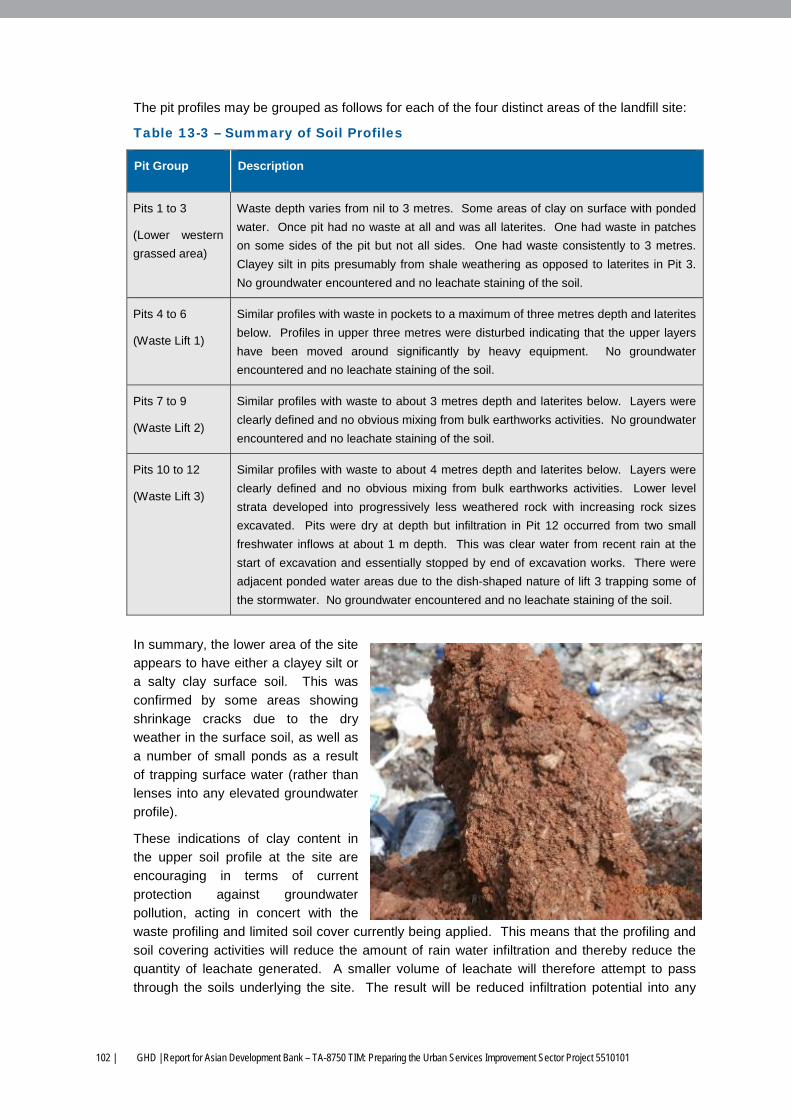
102 | GHD | Report for Asian Development Bank – TA-8750 TIM: Preparing the Urban Services Improvement Sector Project 5510101
The pit profiles may be grouped as follows for each of the four distinct areas of the landfill site:
Table 13-3 – Summary of Soil Profiles
Pit Group Description
Pits 1 to 3
(Lower western
grassed area)
Waste depth varies from nil to 3 metres. Some areas of clay on surface with ponded
water. Once pit had no waste at all and was all laterites. One had waste in patches
on some sides of the pit but not all sides. One had waste consistently to 3 metres.
Clayey silt in pits presumably from shale weathering as opposed to laterites in Pit 3.
No groundwater encountered and no leachate staining of the soil.
Pits 4 to 6
(Waste Lift 1)
Similar profiles with waste in pockets to a maximum of three metres depth and laterites
below. Profiles in upper three metres were disturbed indicating that the upper layers
have been moved around significantly by heavy equipment. No groundwater
encountered and no leachate staining of the soil.
Pits 7 to 9
(Waste Lift 2)
Similar profiles with waste to about 3 metres depth and laterites below. Layers were
clearly defined and no obvious mixing from bulk earthworks activities. No groundwater
encountered and no leachate staining of the soil.
Pits 10 to 12
(Waste Lift 3)
Similar profiles with waste to about 4 metres depth and laterites below. Layers were
clearly defined and no obvious mixing from bulk earthworks activities. Lower level
strata developed into progressively less weathered rock with increasing rock sizes
excavated. Pits were dry at depth but infiltration in Pit 12 occurred from two small
freshwater inflows at about 1 m depth. This was clear water from recent rain at the
start of excavation and essentially stopped by end of excavation works. There were
adjacent ponded water areas due to the dish-shaped nature of lift 3 trapping some of
the stormwater. No groundwater encountered and no leachate staining of the soil.
In summary, the lower area of the site
appears to have either a clayey silt or
a salty clay surface soil. This was
confirmed by some areas showing
shrinkage cracks due to the dry
weather in the surface soil, as well as
a number of small ponds as a result
of trapping surface water (rather than
lenses into any elevated groundwater
profile).
These indications of clay content in
the upper soil profile at the site are
encouraging in terms of current
protection against groundwater
pollution, acting in concert with the
waste profiling and limited soil cover currently being applied. This means that the profiling and
soil covering activities will reduce the amount of rain water infiltration and thereby reduce the
quantity of leachate generated. A smaller volume of leachate will therefore attempt to pass
through the soils underlying the site. The result will be reduced infiltration potential into any
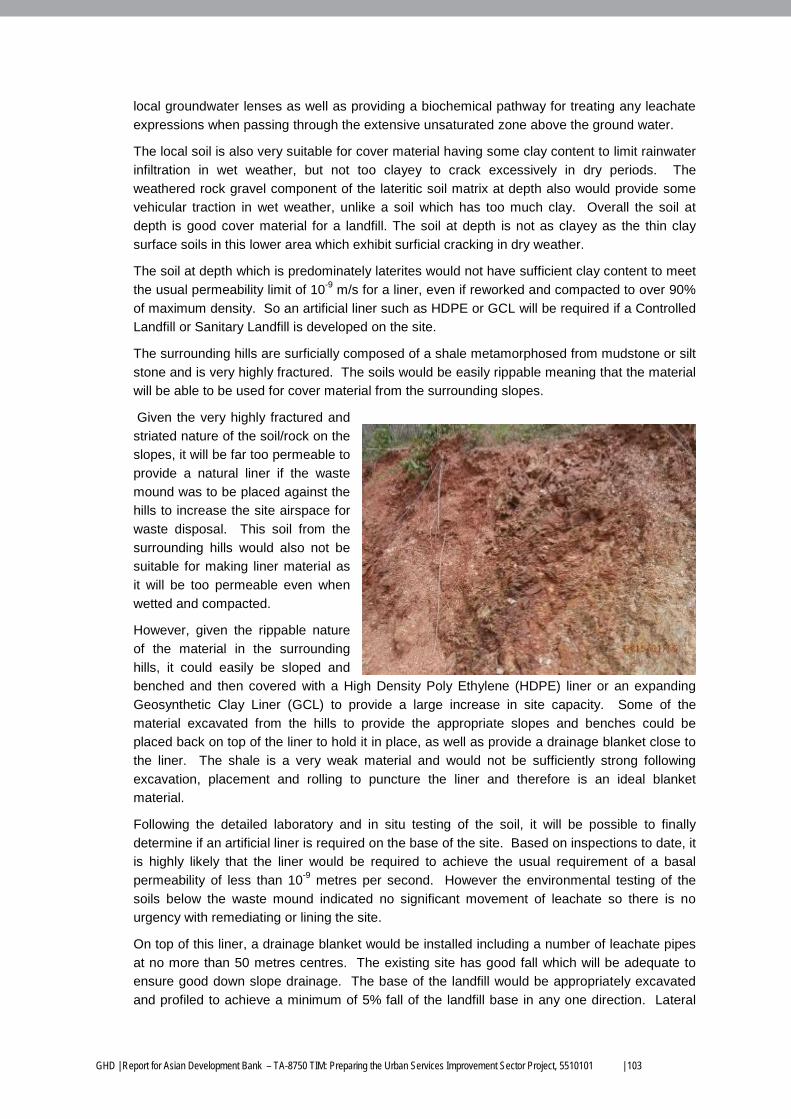
GHD | Report for Asian Development Bank – TA-8750 TIM: Preparing the Urban Services Improvement Sector Project, 5510101 | 103
local groundwater lenses as well as providing a biochemical pathway for treating any leachate
expressions when passing through the extensive unsaturated zone above the ground water.
The local soil is also very suitable for cover material having some clay content to limit rainwater
infiltration in wet weather, but not too clayey to crack excessively in dry periods. The
weathered rock gravel component of the lateritic soil matrix at depth also would provide some
vehicular traction in wet weather, unlike a soil which has too much clay. Overall the soil at
depth is good cover material for a landfill. The soil at depth is not as clayey as the thin clay
surface soils in this lower area which exhibit surficial cracking in dry weather.
The soil at depth which is predominately laterites would not have sufficient clay content to meet
the usual permeability limit of 10-9 m/s for a liner, even if reworked and compacted to over 90%
of maximum density. So an artificial liner such as HDPE or GCL will be required if a Controlled
Landfill or Sanitary Landfill is developed on the site.
The surrounding hills are surficially composed of a shale metamorphosed from mudstone or silt
stone and is very highly fractured. The soils would be easily rippable meaning that the material
will be able to be used for cover material from the surrounding slopes.
Given the very highly fractured and
striated nature of the soil/rock on the
slopes, it will be far too permeable to
provide a natural liner if the waste
mound was to be placed against the
hills to increase the site airspace for
waste disposal. This soil from the
surrounding hills would also not be
suitable for making liner material as
it will be too permeable even when
wetted and compacted.
However, given the rippable nature
of the material in the surrounding
hills, it could easily be sloped and
benched and then covered with a High Density Poly Ethylene (HDPE) liner or an expanding
Geosynthetic Clay Liner (GCL) to provide a large increase in site capacity. Some of the
material excavated from the hills to provide the appropriate slopes and benches could be
placed back on top of the liner to hold it in place, as well as provide a drainage blanket close to
the liner. The shale is a very weak material and would not be sufficiently strong following
excavation, placement and rolling to puncture the liner and therefore is an ideal blanket
material.
Following the detailed laboratory and in situ testing of the soil, it will be possible to finally
determine if an artificial liner is required on the base of the site. Based on inspections to date, it
is highly likely that the liner would be required to achieve the usual requirement of a basal
permeability of less than 10-9 metres per second. However the environmental testing of the
soils below the waste mound indicated no significant movement of leachate so there is no
urgency with remediating or lining the site.
On top of this liner, a drainage blanket would be installed including a number of leachate pipes
at no more than 50 metres centres. The existing site has good fall which will be adequate to
ensure good down slope drainage. The base of the landfill would be appropriately excavated
and profiled to achieve a minimum of 5% fall of the landfill base in any one direction. Lateral
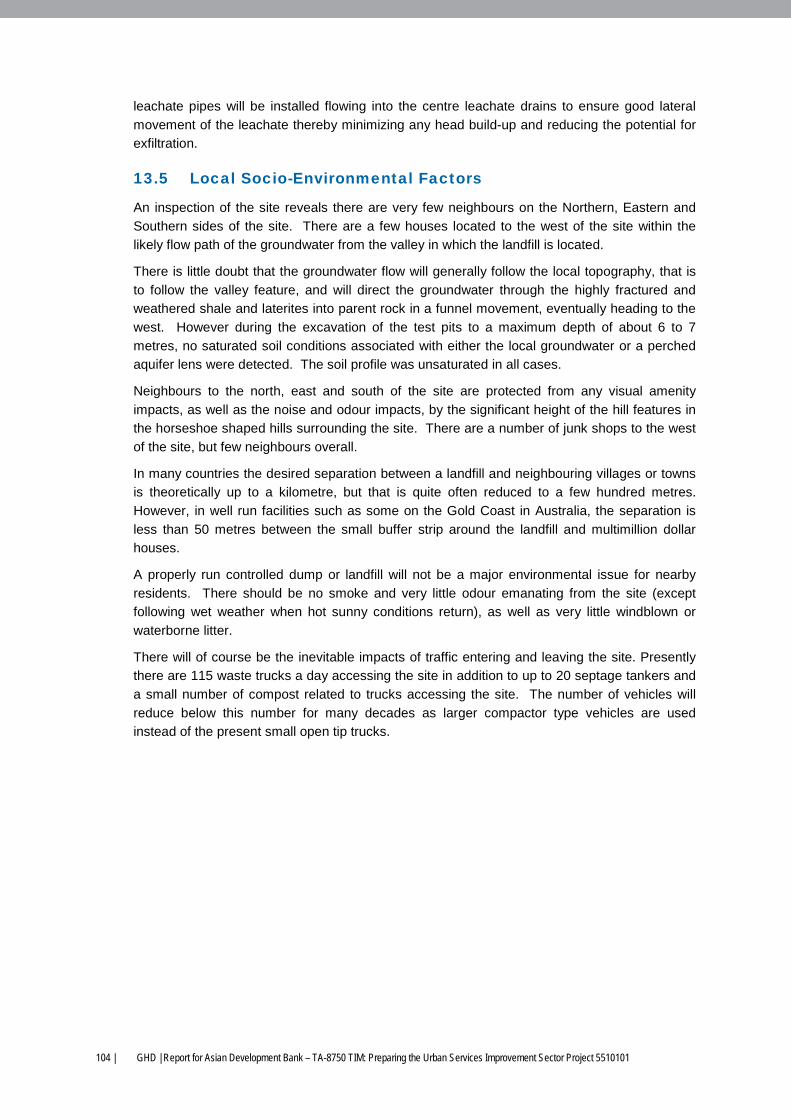
104 | GHD | Report for Asian Development Bank – TA-8750 TIM: Preparing the Urban Services Improvement Sector Project 5510101
leachate pipes will be installed flowing into the centre leachate drains to ensure good lateral
movement of the leachate thereby minimizing any head build-up and reducing the potential for
exfiltration.
13.5 Local Socio-Environmental Factors
An inspection of the site reveals there are very few neighbours on the Northern, Eastern and
Southern sides of the site. There are a few houses located to the west of the site within the
likely flow path of the groundwater from the valley in which the landfill is located.
There is little doubt that the groundwater flow will generally follow the local topography, that is
to follow the valley feature, and will direct the groundwater through the highly fractured and
weathered shale and laterites into parent rock in a funnel movement, eventually heading to the
west. However during the excavation of the test pits to a maximum depth of about 6 to 7
metres, no saturated soil conditions associated with either the local groundwater or a perched
aquifer lens were detected. The soil profile was unsaturated in all cases.
Neighbours to the north, east and south of the site are protected from any visual amenity
impacts, as well as the noise and odour impacts, by the significant height of the hill features in
the horseshoe shaped hills surrounding the site. There are a number of junk shops to the west
of the site, but few neighbours overall.
In many countries the desired separation between a landfill and neighbouring villages or towns
is theoretically up to a kilometre, but that is quite often reduced to a few hundred metres.
However, in well run facilities such as some on the Gold Coast in Australia, the separation is
less than 50 metres between the small buffer strip around the landfill and multimillion dollar
houses.
A properly run controlled dump or landfill will not be a major environmental issue for nearby
residents. There should be no smoke and very little odour emanating from the site (except
following wet weather when hot sunny conditions return), as well as very little windblown or
waterborne litter.
There will of course be the inevitable impacts of traffic entering and leaving the site. Presently
there are 115 waste trucks a day accessing the site in addition to up to 20 septage tankers and
a small number of compost related to trucks accessing the site. The number of vehicles will
reduce below this number for many decades as larger compactor type vehicles are used
instead of the present small open tip trucks.
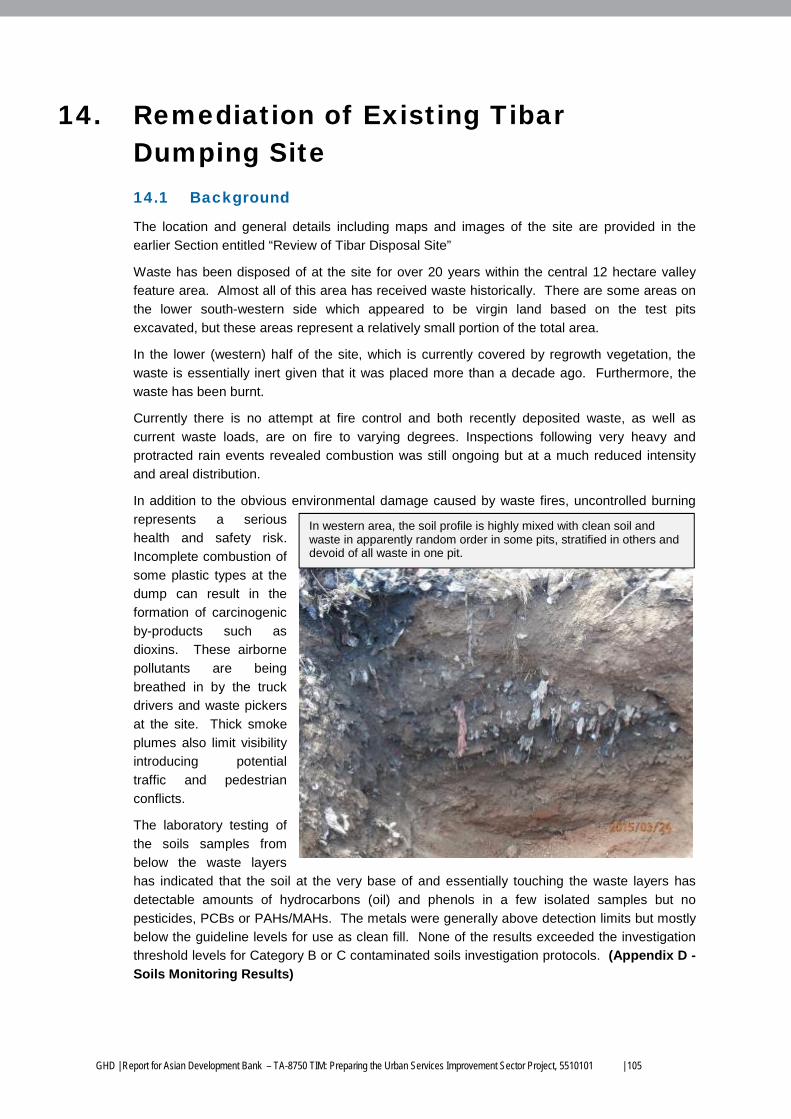
GHD | Report for Asian Development Bank – TA-8750 TIM: Preparing the Urban Services Improvement Sector Project, 5510101 | 105
14. Remediation of Existing Tibar Dumping Site 14.1 Background
The location and general details including maps and images of the site are provided in the
earlier Section entitled “Review of Tibar Disposal Site”
Waste has been disposed of at the site for over 20 years within the central 12 hectare valley
feature area. Almost all of this area has received waste historically. There are some areas on
the lower south-western side which appeared to be virgin land based on the test pits
excavated, but these areas represent a relatively small portion of the total area.
In the lower (western) half of the site, which is currently covered by regrowth vegetation, the
waste is essentially inert given that it was placed more than a decade ago. Furthermore, the
waste has been burnt.
Currently there is no attempt at fire control and both recently deposited waste, as well as
current waste loads, are on fire to varying degrees. Inspections following very heavy and
protracted rain events revealed combustion was still ongoing but at a much reduced intensity
and areal distribution.
In addition to the obvious environmental damage caused by waste fires, uncontrolled burning
represents a serious
health and safety risk.
Incomplete combustion of
some plastic types at the
dump can result in the
formation of carcinogenic
by-products such as
dioxins. These airborne
pollutants are being
breathed in by the truck
drivers and waste pickers
at the site. Thick smoke
plumes also limit visibility
introducing potential
traffic and pedestrian
conflicts.
The laboratory testing of
the soils samples from
below the waste layers
has indicated that the soil at the very base of and essentially touching the waste layers has
detectable amounts of hydrocarbons (oil) and phenols in a few isolated samples but no
pesticides, PCBs or PAHs/MAHs. The metals were generally above detection limits but mostly
below the guideline levels for use as clean fill. None of the results exceeded the investigation
threshold levels for Category B or C contaminated soils investigation protocols. (Appendix D -
Soils Monitoring Results)
In western area, the soil profile is highly mixed with clean soil and waste in apparently random order in some pits, stratified in others and devoid of all waste in one pit.
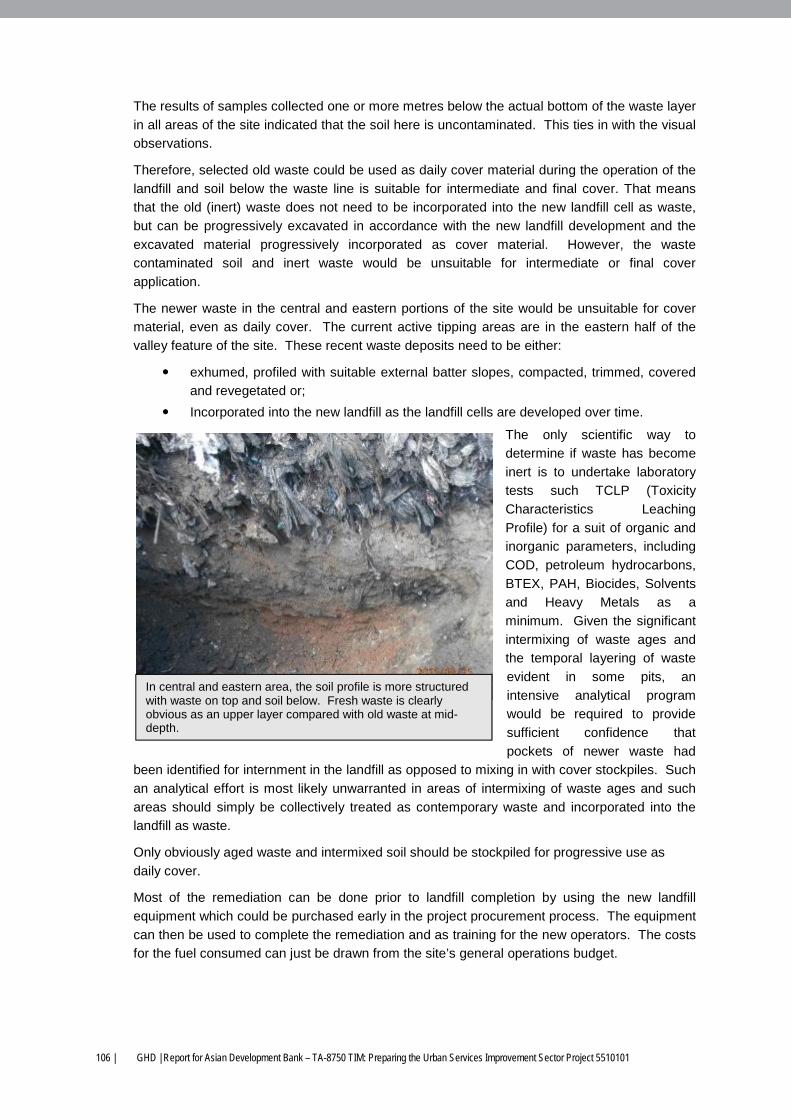
106 | GHD | Report for Asian Development Bank – TA-8750 TIM: Preparing the Urban Services Improvement Sector Project 5510101
The results of samples collected one or more metres below the actual bottom of the waste layer
in all areas of the site indicated that the soil here is uncontaminated. This ties in with the visual
observations.
Therefore, selected old waste could be used as daily cover material during the operation of the
landfill and soil below the waste line is suitable for intermediate and final cover. That means
that the old (inert) waste does not need to be incorporated into the new landfill cell as waste,
but can be progressively excavated in accordance with the new landfill development and the
excavated material progressively incorporated as cover material. However, the waste
contaminated soil and inert waste would be unsuitable for intermediate or final cover
application.
The newer waste in the central and eastern portions of the site would be unsuitable for cover
material, even as daily cover. The current active tipping areas are in the eastern half of the
valley feature of the site. These recent waste deposits need to be either:
exhumed, profiled with suitable external batter slopes, compacted, trimmed, covered
and revegetated or;
Incorporated into the new landfill as the landfill cells are developed over time.
The only scientific way to
determine if waste has become
inert is to undertake laboratory
tests such TCLP (Toxicity
Characteristics Leaching
Profile) for a suit of organic and
inorganic parameters, including
COD, petroleum hydrocarbons,
BTEX, PAH, Biocides, Solvents
and Heavy Metals as a
minimum. Given the significant
intermixing of waste ages and
the temporal layering of waste
evident in some pits, an
intensive analytical program
would be required to provide
sufficient confidence that
pockets of newer waste had
been identified for internment in the landfill as opposed to mixing in with cover stockpiles. Such
an analytical effort is most likely unwarranted in areas of intermixing of waste ages and such
areas should simply be collectively treated as contemporary waste and incorporated into the
landfill as waste.
Only obviously aged waste and intermixed soil should be stockpiled for progressive use as
daily cover.
Most of the remediation can be done prior to landfill completion by using the new landfill
equipment which could be purchased early in the project procurement process. The equipment
can then be used to complete the remediation and as training for the new operators. The costs
for the fuel consumed can just be drawn from the site’s general operations budget.
In central and eastern area, the soil profile is more structured with waste on top and soil below. Fresh waste is clearly obvious as an upper layer compared with old waste at mid- depth.
GHD | Report for Asian Development Bank – TA-8750 TIM: Preparing the Urban Services Improvement Sector Project, 5510101 | 107
14.2 Remediation Priorities
The highest remediation priority is fire control.
It is critical that all actively burning surface waste and smouldering buried waste is fully
extinguished and cooled prior to intruding it into the new landfill.
Small surface-only areas of combustion in the existing dump can be controlled with water and
subsequent application of soil cover material. But the only way to completely extinguish
subsurface fires at waste disposal facilities is to excavate waste until the combustion source is
reached. Therefore, there is little choice in the remediation of this site but to adopt a cut and
carry approach to remove all actively burning and smouldering material and wet it prior to
replacing and covering in accordance with the final design.
Some of this burning material which is outside the footprint of the Stage 1 landfill cell could be
incorporated into the Stage 1 borrow pile and covered until it can be used as daily cover for
later stages of the landfill, provided that it is old inert waste. Therefore, the extinguished waste
pile will need to be well clear of initial landfill development stages to avoid double handling.
In parallel, urgent action is required to prevent new fires starting anywhere in the active
dumping areas and to stop the fires in previously worked areas. Initially the surface fires
should be extinguished and then deeper fires progressively excavated and extinguished as part
of the initial activities leading to eventual full remediation. It is critical that no fires are allowed
to start within the landfill proper either due to purposeful ignition or importation of already
burning or hot waste from the previously worked areas or subsurface burning extending into the
landfill cells.
As noted above, the site has two different types of waste to be managed:
Waste more than 15 or 20 years old which is essentially inert and does not need
special treatment apart from extinguishing, profiling, compacting and temporarily
covering with clean soil for later reuse as a daily cover supplement;
Contemporary waste which most likely has been burnt but is still classed as active
waste and therefore needs appropriate controls by either dedicated stockpiling with
appropriate leachate management or direct incorporation into the landfill.
14.3 Contemporary Waste Management
14.3.1 Option A – Placement in New Landfill
Inspections indicate that whilst here is some old and inert waste under Stage 1, there are also
extensive areas of relatively new waste requiring management.
The contemporary waste would need to be excavated, hauled, spread, extinguished, cooled,
profiled, compacted and temporarily covered in a location clear of the Stage 1 footprint, but
sufficiently close to be able to be efficiently hauled for placement within the landfill proper for
final disposal once the advancing landfill cells have been progressively developed.
The water quality monitoring for the IEE determined that the existing uncontrolled dump is not
resulting in significant water pollution, either surface or groundwater.
Based on the preliminary water quality monitoring results and a detailed soils analysis,
contamination is not spreading into the soil and water profiles underneath the site. Therefore
there will be no need to put in temporary liner systems under any storage stockpiles.
108 | GHD | Report for Asian Development Bank – TA-8750 TIM: Preparing the Urban Services Improvement Sector Project 5510101
It is proposed that the temporary stockpiles of contemporary waste would be established in
Stage 2A to minimise haulage distances back into Stage 1.
14.3.2 Option B – Permanent Capping Outside Landfill Area
Alternatively the contemporary waste could be permanently entombed in a dedicated waste
mound remote form the ultimate landfill footprint.
However there is insufficient land on the site to provide a permanent repository for the waste
outside the ultimate landfill footprint within the flatter portion of the site. The triangle of flat land
to the north of Stage 3A and within the existing bitumen access road to the septage plant is the
only possible area and this should be reserved either for the ultimate landfill expansion when
waste is to be placed against the surrounding hill features, for the recycling areas or possible
leachate treatment plant.
The preferred option is temporary stockpiling of contemporary waste whilst the landfill cells are
developed and then incorporation of the contemporary waste into the cells prior to accepting
new waste. The contemporary waste would be placed as the first lower lifts to protect the gravel
leachate drains and intermediate soil blankets against stormwater erosion and heavy
equipment damage.
Based on the preliminary water quality monitoring results and a detailed soils analysis,
contamination is not spreading into the soil and water profiles underneath the site. Therefore
there will be no need to put in temporary liner systems under any storage stockpiles.
It is proposed that the temporary stockpiles of contemporary waste would be established in
Stage 2A to minimise haulage distances back into Stage 1.
14.4 Inert Waste
The approach would be as follows to remediate the site area under the initial Stage 1 landfill
development where waste is overtly inert:
Excavate until the required cell development profile is achieved and the necessary
quantity of cover material/inert waste has been achieved;
Separate out all actively burning material and hot waste and place on a soil covered
area outside Stage 1. Stage 2A has been adopted as the cover stockpile location for
Stage 1 landfill operations;
Wet the waste and allow to cool down;
Profile the cooled waste to ensure a minimum of 5% slope;
Compact the inert waste using the bulldozer, with at least 5 passes;
Cover with 300 mm of soil, acting as intermediate cover. The soil for this cover activity
may be taken from the excavation works required to prepare the base of the first
stage of the landfill;
Once the landfill commences operation, progressively mine the inert waste stockpile
to be used as daily cover in the landfill cells.
The depth of excavation for cell development should ensure that the base of the landfill is either
in virgin soil or completely inert waste. The concern with placing a landfill liner over old waste
is that there may be glass and other material which may puncture the landfill liner, so a
minimum of one metre of clean soil must be placed back over any residual compacted waste
under the landfill.
GHD | Report for Asian Development Bank – TA-8750 TIM: Preparing the Urban Services Improvement Sector Project, 5510101 | 109
A significant component of the cost associated with remediation will be the excavation of
burning/smouldering waste at depth, carting to a prepared area and spreading, extinguishing
the fires, reloading the waste, returning it and finally compacting and temporarily covering it.
Minimising the quantity of waste that has to be extinguished will greatly reduce the overall
remediation costs so appropriate fire control is needed at the site prior to any landfill earthworks
activities.
Because the old inert waste will be profiled, compacted and temporarily covered, and the local
soils are not highly permeable, it is unlikely that temporary liner systems or leachate collection
and treatment plants will be required. However the IEE testing program will provide guidance
on the need for temporary liners under stockpiled waste.
Similarly, because almost all of the organic material has either degraded or been combusted,
there will be little landfill gas being produced. Therefore, there is no requirement to install a gas
management or collection system for any remediated waste piles.
14.5 Parallel Operating Period
While the landfill is being constructed and commissioned, waste will continue to arrive at the
site and will require management.
One option is to upgrade the current operation is by providing operational guidelines to improve
the operation making it closer to a controlled dump. Apart from banning all fires and
extinguishing existing fires, the main differences would be as follows:
Formalising the responsibility of the site staff to direct all trucks to only dump at the
prepared dumping table;
Profile the area to minimise rainwater infiltration;
Improve compaction;
Prepare cover stockpiles;
Apply cover on at least a weekly basis, preferably daily.
These basic refinements would result in the site being sustainable until the landfill proper is
ready to receive waste.
Waste should only be placed in the Stage 3 area so it is aged prior to having to be excavated
and loaded back into the landfill as waste or cover supplement. The final landfill stage requires
up to 5 metres of cover/waste supplement to be won under Stage 3, so maximising the reuse of
inert waste as cover supplement will reduce overall excavation costs and volumes.
The second and third stages of landfill development would then need to progressively
incorporate this waste into the lined cells as they advance across the ultimate footprint. By the
time the third landfill stage is being developed, most of the “contemporary waste” from say
2015 to 2018 would be essentially inert and could possibly be used as daily cover supplement
anyway, minimising utilisation of active landfill airspace.
In effect, Stage 3 earthworks and profiles would be developed during the operation of Stage 2
with the excavation activities directly linked to cover demand on Stage 2, thereby minimising
double handling. Any cover shortfall for Stage 3 could be overcome by mining soil from the
surrounding hills as they are developed as part of the preparation works for the ultimate landfill.
110 | GHD | Report for Asian Development Bank – TA-8750 TIM: Preparing the Urban Services Improvement Sector Project 5510101
14.5.1 New Site for Interim Disposal of Waste
An alternative approach to managing waste disposal in the interim until the landfill is operating
is to relocate the active dumping table to another area outside the ultimate landfill footprint at
Tibar.
The only possible area at the Tibar site would be to relocate the cropping activities between the
H3R compost plant and the septage treatment plant. The waste disposed over say a 3 year
period, while the landfill is constructed and commissioned, would require an area of
approximately 150 metres by 200 metres or 3 hectares to provide the 390,000m3 of airspace
required. The land would be effectively sterilised after completion as the external batter slopes
would prevent agrarian activities apart from free roaming goats and tree planting.
This option would require significant resettlement and livelihood investigations because farmers
using this government land have been working the area for over 20 years and would now
effectively have unofficial title to the land.
In summary, the preferred option is to utilise the Stage 3 area for the parallel operating/landfill
development period.
Again the results of the IEE and ongoing monitoring will determine if this waste deposited
during the parallel operating period needs to be relocated into the landfill cells or is
environmentally appropriate to be used as cover supplement during the Stage 2 and 3 landfill
activities.
In either case, waste from the parallel operating period will be appropriately managed on the
Tibar site and not require a new site to be developed.
GHD | Report for Asian Development Bank – TA-8750 TIM: Preparing the Urban Services Improvement Sector Project, 5510101 | 111
15. Landfill Development Due Diligence 15.1 Site Selection
It is always preferable to extend the life of an existing facility than look for alternative sites given
the socioeconomic issues associated with the approvals process for a new site and obtaining
the social license to operate required for a new landfill facility. It also provides an opportunity to
remediate existing disposal facilities that may be sub-optimal as part of the site redevelopment
and/or expansion.
The existing disposal site the Tibar is considered suitable for ongoing landfill development for
many reasons, including the following:
There are no sensitive neighbours in close proximity to the site such as major
schools, kindergartens or extensive residential areas. Furthermore it is intended to
develop the Tibar area as the major port for Dili and an industrial estate commonly
associated with ports in this locale. This is a suitable contiguous land use for a landfill
development;
The site has the necessary infrastructure in terms of suitable road easements, power
and access to ground water;
The site is well located with respect to the current centroid of population and also the
expected future growth centroid. It is less than 20 km to the population centroid
thereby obviating the need for any transfer stations, especially given the haulage
compaction units being proposed, but sufficiently remote not to limit urban expansion;
The water table is at least 15 metres below the surface which is highly desirable
attribute for a landfill development;
The site is flood free;
Stormwater can be readily managed with appropriate diversion drains;
Site slopes are suitable for landfill development. It is not flat which requires extensive
excavation to achieve suitable grades on landfill leachate pipes nor is it too steep
resulting in stability concerns;
The local soils are easily workable and contain a mix of clayey silts as well as small
gravel. This is an ideal combination for cover material and also for the development
of temporary access roads throughout the landfill life as stages are progressively
developed;
The soil matrix of the surrounding hills are also readily rippable to depth and could be
developed as a major extension to the current landfill presently restricted just to the
valley feature of the site;
In terms of social benefits, the scavenging community is already present on site and a
number have actually moved to this location to access this livelihood option. Moving
the landfill would have significant social dislocation impacts.
However it is also essential that the site has sufficient capacity for at least 20 years of
operation, otherwise the utilization of the infrastructure installed at the site will not be
maximised, and a new site will have to be obtained in any case.
112 | GHD | Report for Asian Development Bank – TA-8750 TIM: Preparing the Urban Services Improvement Sector Project 5510101
15.2 Standard for Disposal Facility
The selection of the design and operational standard for the disposal facility will be based on
the table below. This presents four options ranging from uncontrolled open dumping to a fully
engineered sanitary landfill.
The first option of open dumping is essentially what is happening at present, or even somewhat
worse, and cannot be supported in the future.
The second option is a controlled dump but this still does not have waste compaction and soil
covering, leading to significant ongoing environmental impacts. This option also could not be
supported.
The third option of a Controlled Landfill has most of the environmental and operational benefits
of the final option (a fully engineered sanitary landfill) but without the technical complexities of
leachate treatment plants for example, and social dislocation of banning all waste pickers form
site. The Controlled Landfill option can be upgraded with scale-appropriate additional
interventions for leachate and gas management, but not burdened with the additional
constraints of the full sanitary landfill option which are undesirable for such relatively small
operations as at Dili.
The fourth and most complex option is an engineered sanitary landfill. This compulsorily
includes the following requirements in addition to those of a Controlled Landfill (the third level of
complexity)
a leachate treatment plant;
mechanised material recovery facilities;
mandated removal of all waste pickers from site; and
full gas control and use.
This combination is considered too expensive for the relatively small city and far too complex to
operate sustainably without ongoing external technical support at least for some years. Also
the additional operating costs for items like the landfill are significant but yield little
environmental gains at this scale. Furthermore the required removal of all waste scavenging
and animal husbandry activities from the site would likely have significant social impacts at this
time.
Given that there is little difference in cost or operational difficulty between a controlled dump
and a Controlled Landfill, but the Controlled Landfill has significantly better environmental
benefits, a Controlled Landfill is the most appropriate disposal system for the city. This could be
upgraded over time to a higher standard. It is important that the basic infrastructure (such as
liners and leachate collection systems) is put in place initially to protect the surrounding
environment (including groundwater), as these systems cannot be retrofitted later on.
An options analysis is provided for the leachate treatment facility in the Leachate Management
chapter elsewhere.
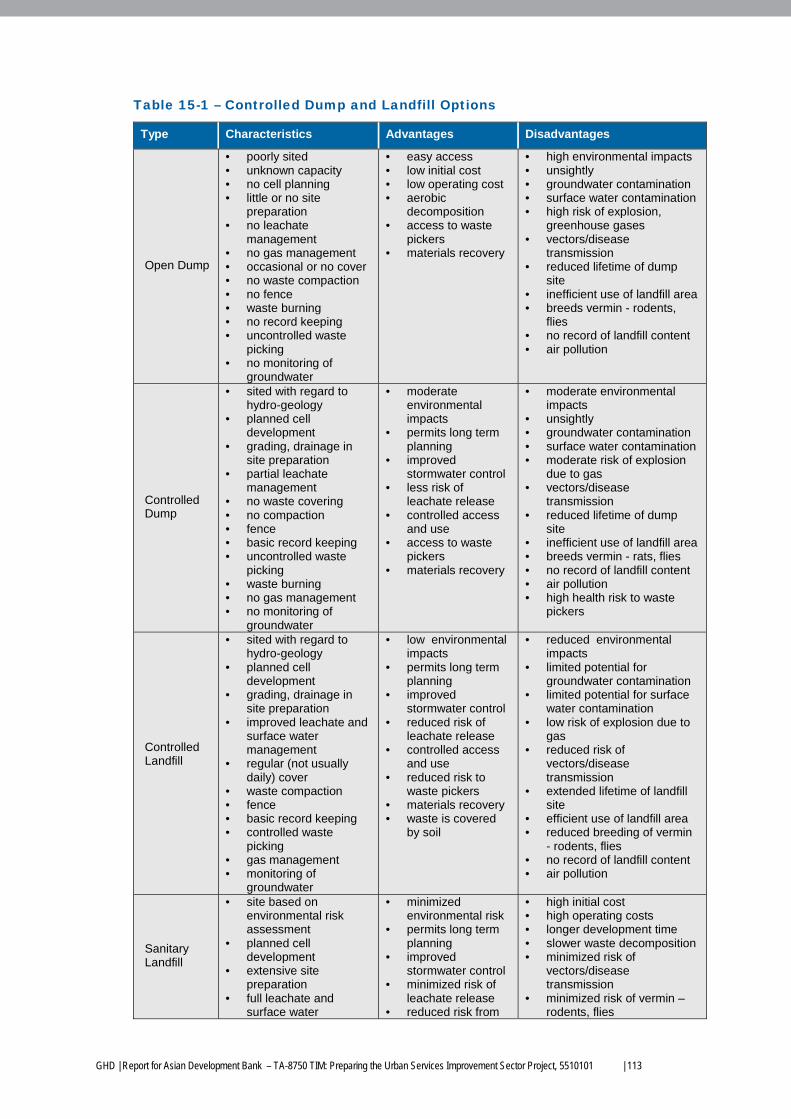
GHD | Report for Asian Development Bank – TA-8750 TIM: Preparing the Urban Services Improvement Sector Project, 5510101 | 113
Table 15-1 – Controlled Dump and Landfill Options
Type Characteristics Advantages Disadvantages
Open Dump
• poorly sited • unknown capacity • no cell planning • little or no site
preparation • no leachate
management • no gas management • occasional or no cover • no waste compaction • no fence • waste burning • no record keeping • uncontrolled waste
picking • no monitoring of
groundwater
• easy access • low initial cost • low operating cost • aerobic
decomposition • access to waste
pickers • materials recovery
• high environmental impacts • unsightly • groundwater contamination • surface water contamination • high risk of explosion,
greenhouse gases • vectors/disease
transmission • reduced lifetime of dump
site • inefficient use of landfill area • breeds vermin - rodents,
flies • no record of landfill content • air pollution
Controlled Dump
• sited with regard to hydro-geology
• planned cell development
• grading, drainage in site preparation
• partial leachate management
• no waste covering • no compaction • fence • basic record keeping • uncontrolled waste
picking • waste burning • no gas management • no monitoring of
groundwater
• moderate environmental impacts
• permits long term planning
• improved stormwater control
• less risk of leachate release
• controlled access and use
• access to waste pickers
• materials recovery
• moderate environmental impacts
• unsightly • groundwater contamination • surface water contamination • moderate risk of explosion
due to gas • vectors/disease
transmission • reduced lifetime of dump
site • inefficient use of landfill area • breeds vermin - rats, flies • no record of landfill content • air pollution • high health risk to waste
pickers
Controlled Landfill
• sited with regard to hydro-geology
• planned cell development
• grading, drainage in site preparation
• improved leachate and surface water management
• regular (not usually daily) cover
• waste compaction • fence • basic record keeping • controlled waste
picking • gas management • monitoring of
groundwater
• low environmental impacts
• permits long term planning
• improved stormwater control
• reduced risk of leachate release
• controlled access and use
• reduced risk to waste pickers
• materials recovery • waste is covered
by soil
• reduced environmental impacts
• limited potential for groundwater contamination
• limited potential for surface water contamination
• low risk of explosion due to gas
• reduced risk of vectors/disease transmission
• extended lifetime of landfill site
• efficient use of landfill area • reduced breeding of vermin
- rodents, flies • no record of landfill content • air pollution
Sanitary Landfill
• site based on environmental risk assessment
• planned cell development
• extensive site preparation
• full leachate and surface water
• minimized environmental risk
• permits long term planning
• improved stormwater control
• minimized risk of leachate release
• reduced risk from
• high initial cost • high operating costs • longer development time • slower waste decomposition • minimized risk of
vectors/disease transmission
• minimized risk of vermin – rodents, flies
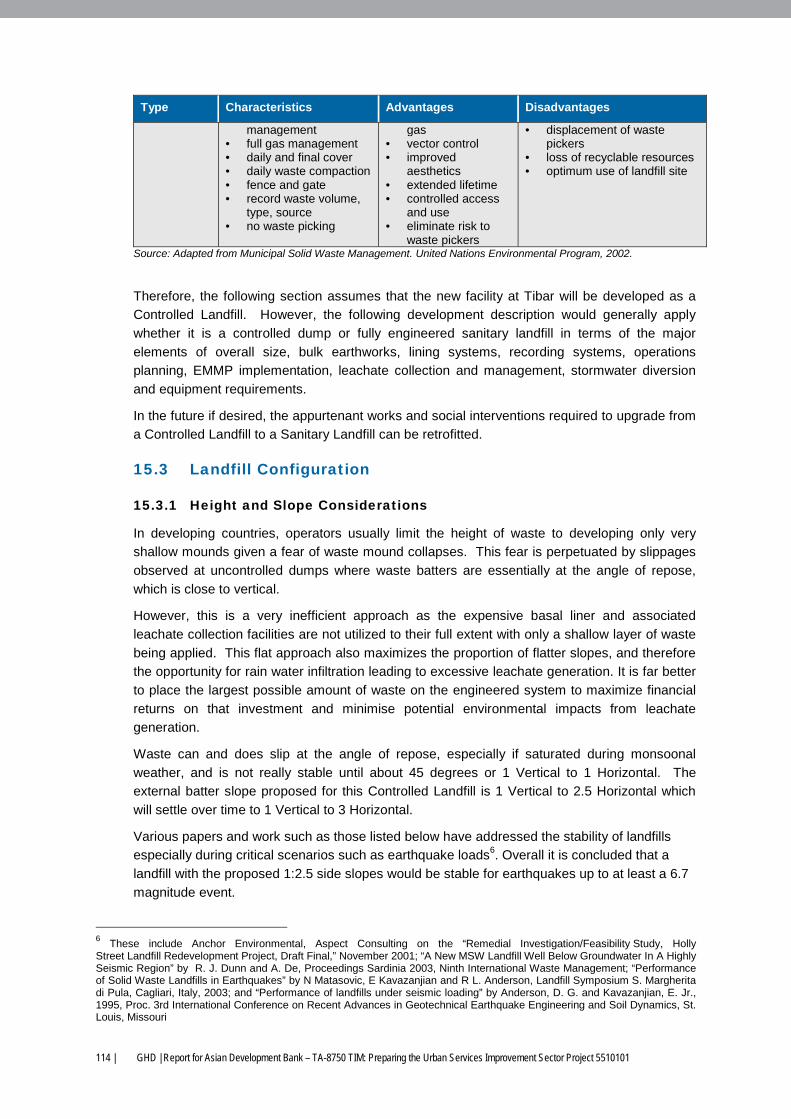
114 | GHD | Report for Asian Development Bank – TA-8750 TIM: Preparing the Urban Services Improvement Sector Project 5510101
Type Characteristics Advantages Disadvantages
management • full gas management • daily and final cover • daily waste compaction • fence and gate • record waste volume,
type, source • no waste picking
gas • vector control • improved
aesthetics • extended lifetime • controlled access
and use • eliminate risk to
waste pickers
• displacement of waste pickers
• loss of recyclable resources • optimum use of landfill site
Source: Adapted from Municipal Solid Waste Management. United Nations Environmental Program, 2002.
Therefore, the following section assumes that the new facility at Tibar will be developed as a
Controlled Landfill. However, the following development description would generally apply
whether it is a controlled dump or fully engineered sanitary landfill in terms of the major
elements of overall size, bulk earthworks, lining systems, recording systems, operations
planning, EMMP implementation, leachate collection and management, stormwater diversion
and equipment requirements.
In the future if desired, the appurtenant works and social interventions required to upgrade from
a Controlled Landfill to a Sanitary Landfill can be retrofitted.
15.3 Landfill Configuration
15.3.1 Height and Slope Considerations
In developing countries, operators usually limit the height of waste to developing only very
shallow mounds given a fear of waste mound collapses. This fear is perpetuated by slippages
observed at uncontrolled dumps where waste batters are essentially at the angle of repose,
which is close to vertical.
However, this is a very inefficient approach as the expensive basal liner and associated
leachate collection facilities are not utilized to their full extent with only a shallow layer of waste
being applied. This flat approach also maximizes the proportion of flatter slopes, and therefore
the opportunity for rain water infiltration leading to excessive leachate generation. It is far better
to place the largest possible amount of waste on the engineered system to maximize financial
returns on that investment and minimise potential environmental impacts from leachate
generation.
Waste can and does slip at the angle of repose, especially if saturated during monsoonal
weather, and is not really stable until about 45 degrees or 1 Vertical to 1 Horizontal. The
external batter slope proposed for this Controlled Landfill is 1 Vertical to 2.5 Horizontal which
will settle over time to 1 Vertical to 3 Horizontal.
Various papers and work such as those listed below have addressed the stability of landfills
especially during critical scenarios such as earthquake loads6. Overall it is concluded that a
landfill with the proposed 1:2.5 side slopes would be stable for earthquakes up to at least a 6.7
magnitude event.
6 These include Anchor Environmental, Aspect Consulting on the “Remedial Investigation/Feasibility Study, Holly
Street Landfill Redevelopment Project, Draft Final,” November 2001; “A New MSW Landfill Well Below Groundwater In A Highly Seismic Region” by R. J. Dunn and A. De, Proceedings Sardinia 2003, Ninth International Waste Management; “Performance of Solid Waste Landfills in Earthquakes” by N Matasovic, E Kavazanjian and R L. Anderson, Landfill Symposium S. Margherita di Pula, Cagliari, Italy, 2003; and “Performance of landfills under seismic loading” by Anderson, D. G. and Kavazanjian, E. Jr., 1995, Proc. 3rd International Conference on Recent Advances in Geotechnical Earthquake Engineering and Soil Dynamics, St. Louis, Missouri
GHD | Report for Asian Development Bank – TA-8750 TIM: Preparing the Urban Services Improvement Sector Project, 5510101 | 115
Following the 1994 Northridge earthquake (6.7 magnitude), 22 landfills examined, and none
sustained major damage as a result of the earthquake. Closer to the epicentre, Lopez Canyon
Landfill remained intact, sustaining no damage to its bottom composite liner or the 1:1 side
slopes containing geomembrane and geosynthetic clay liner. No evidence of either transient or
permanent displacement between the interred waste and liner system was noted.
In summary, this proposed slope of initially 1 Vertical to 2.5 Horizontal has consistently proven
to be stable following protracted cyclonic rain events in landfills over 50 metres high and during
earthquakes well over a magnitude of 6.5 on the modified Richter scale.
15.3.2 Initial Site Development
Estimates have been made of the likely population growth and the waste quantities generated
over the next 30 years. A time frame longer than the 15 years specified in the ToR for the Long
Term Scenarios is often adopted for siting landfills because of the significant socio-
environmental issues and delays involved with obtaining planning and engineering approval for
a new facility. At least a 20 year site life would be expected to allow the site to be considered.
A typical landfill development will involve a balanced cut-to-fill arrangement whereby soil is
excavated prior to basal lining or amending the bottom soil to provide a suitable basal liner. In
this case up 5 metres of soil/old waste should be excavated under the footprint to provide
sufficient cover material for the landfill life. The landfill will essentially be located in the
relatively flat floor of the valley feature over an area of approximately 13 hectares.
A nominal landfill width of 200 m has been assumed, including the perimeter access road and
local drains but excluding the major external drain and fencing. Stage 1 will need to be 200 m
long on average (varies from 150m to 250m) to provide a working life of some six years,
satisfying the short term requirements. It will be a maximum of 35 m high and will require
approximately 1.5 metres of earth to be excavated from underneath the base to provide
sufficient cover material. A five year life is common as the first main stage of a landfill
development.
This Stage will be developed as three sub-stages as follows:
Stage 1A – development on the Northern half of the overall Stage 1 giving a life of
approximately 2 years waste dumping and to a height of 15 metres;
Stage 1B – development on the Southern half of the overall Stage 1 giving a life of
approximately 2 years waste dumping and to a height of 15 metres, and retaining the
central open stormwater drain through the middle of the Stage overall;
Stage 1C – over topping Stages 1A and 1B taking the waste to a height of about 35
metres and giving about a 6 year life in total. The central stormwater drain conveying
local runoff only is progressively overtopped during this Stage 1C.
The second stage could provide a life of some 15 years taking the site through to 2032, and will
be 400 m long on average by 200 m wide. It will be excavated to a depth of over 3 m to
provide the cover required for daily, intermediate and final slope protection. It will be
approximately 35 metres above the existing natural soil level.
The final landfill footprint will occupy most of the flatter area of the site and be approximately
630 metres long on average and 35 metres above the natural soil level. Over five metres of
soil will need to be excavated to provide the cover material in a balanced cut-to-fill operation.
The external batters will initially be at one vertical to 2½ horizontal which will settle to one
vertical to three horizontal over time as the waste decomposes and auto-compacts. Municipal
waste is generally stable at approximately a 45° slope or a one vertical to one horizontal batter.
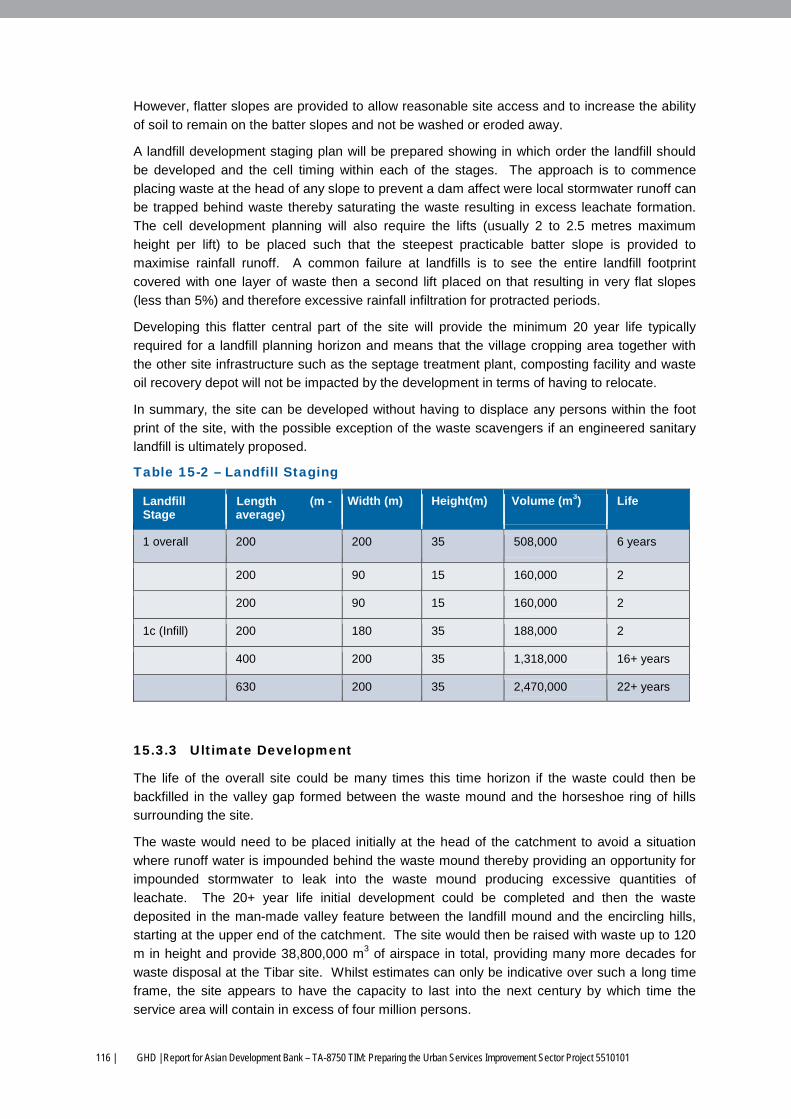
116 | GHD | Report for Asian Development Bank – TA-8750 TIM: Preparing the Urban Services Improvement Sector Project 5510101
However, flatter slopes are provided to allow reasonable site access and to increase the ability
of soil to remain on the batter slopes and not be washed or eroded away.
A landfill development staging plan will be prepared showing in which order the landfill should
be developed and the cell timing within each of the stages. The approach is to commence
placing waste at the head of any slope to prevent a dam affect were local stormwater runoff can
be trapped behind waste thereby saturating the waste resulting in excess leachate formation.
The cell development planning will also require the lifts (usually 2 to 2.5 metres maximum
height per lift) to be placed such that the steepest practicable batter slope is provided to
maximise rainfall runoff. A common failure at landfills is to see the entire landfill footprint
covered with one layer of waste then a second lift placed on that resulting in very flat slopes
(less than 5%) and therefore excessive rainfall infiltration for protracted periods.
Developing this flatter central part of the site will provide the minimum 20 year life typically
required for a landfill planning horizon and means that the village cropping area together with
the other site infrastructure such as the septage treatment plant, composting facility and waste
oil recovery depot will not be impacted by the development in terms of having to relocate.
In summary, the site can be developed without having to displace any persons within the foot
print of the site, with the possible exception of the waste scavengers if an engineered sanitary
landfill is ultimately proposed.
Table 15-2 – Landfill Staging
Landfill Stage
Length (m -average)
Width (m) Height(m) Volume (m3) Life
1 overall 200 200 35 508,000 6 years
200 90 15 160,000 2
200 90 15 160,000 2
1c (Infill) 200 180 35 188,000 2
400 200 35 1,318,000 16+ years
630 200 35 2,470,000 22+ years
15.3.3 Ultimate Development
The life of the overall site could be many times this time horizon if the waste could then be
backfilled in the valley gap formed between the waste mound and the horseshoe ring of hills
surrounding the site.
The waste would need to be placed initially at the head of the catchment to avoid a situation
where runoff water is impounded behind the waste mound thereby providing an opportunity for
impounded stormwater to leak into the waste mound producing excessive quantities of
leachate. The 20+ year life initial development could be completed and then the waste
deposited in the man-made valley feature between the landfill mound and the encircling hills,
starting at the upper end of the catchment. The site would then be raised with waste up to 120
m in height and provide 38,800,000 m3 of airspace in total, providing many more decades for
waste disposal at the Tibar site. Whilst estimates can only be indicative over such a long time
frame, the site appears to have the capacity to last into the next century by which time the
service area will contain in excess of four million persons.
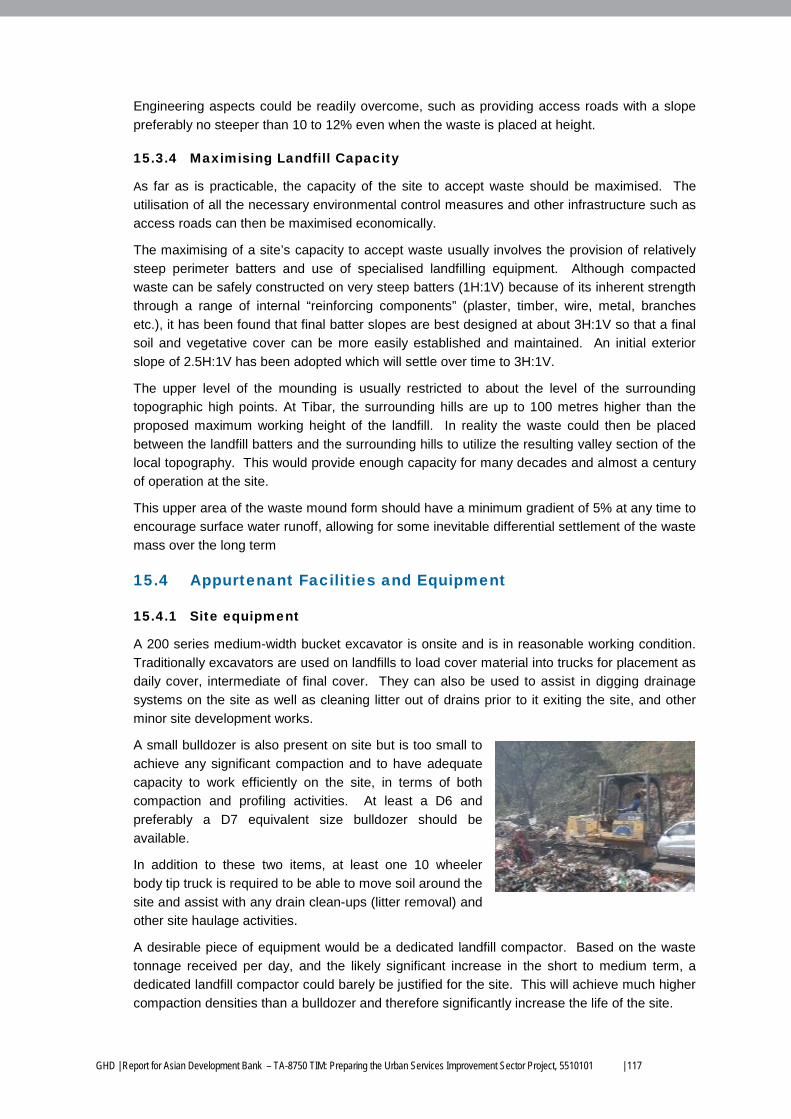
GHD | Report for Asian Development Bank – TA-8750 TIM: Preparing the Urban Services Improvement Sector Project, 5510101 | 117
Engineering aspects could be readily overcome, such as providing access roads with a slope
preferably no steeper than 10 to 12% even when the waste is placed at height.
15.3.4 Maximising Landfill Capacity
As far as is practicable, the capacity of the site to accept waste should be maximised. The
utilisation of all the necessary environmental control measures and other infrastructure such as
access roads can then be maximised economically.
The maximising of a site’s capacity to accept waste usually involves the provision of relatively
steep perimeter batters and use of specialised landfilling equipment. Although compacted
waste can be safely constructed on very steep batters (1H:1V) because of its inherent strength
through a range of internal “reinforcing components” (plaster, timber, wire, metal, branches
etc.), it has been found that final batter slopes are best designed at about 3H:1V so that a final
soil and vegetative cover can be more easily established and maintained. An initial exterior
slope of 2.5H:1V has been adopted which will settle over time to 3H:1V.
The upper level of the mounding is usually restricted to about the level of the surrounding
topographic high points. At Tibar, the surrounding hills are up to 100 metres higher than the
proposed maximum working height of the landfill. In reality the waste could then be placed
between the landfill batters and the surrounding hills to utilize the resulting valley section of the
local topography. This would provide enough capacity for many decades and almost a century
of operation at the site.
This upper area of the waste mound form should have a minimum gradient of 5% at any time to
encourage surface water runoff, allowing for some inevitable differential settlement of the waste
mass over the long term
15.4 Appurtenant Facilities and Equipment
15.4.1 Site equipment
A 200 series medium-width bucket excavator is onsite and is in reasonable working condition.
Traditionally excavators are used on landfills to load cover material into trucks for placement as
daily cover, intermediate of final cover. They can also be used to assist in digging drainage
systems on the site as well as cleaning litter out of drains prior to it exiting the site, and other
minor site development works.
A small bulldozer is also present on site but is too small to
achieve any significant compaction and to have adequate
capacity to work efficiently on the site, in terms of both
compaction and profiling activities. At least a D6 and
preferably a D7 equivalent size bulldozer should be
available.
In addition to these two items, at least one 10 wheeler
body tip truck is required to be able to move soil around the
site and assist with any drain clean-ups (litter removal) and
other site haulage activities.
A desirable piece of equipment would be a dedicated landfill compactor. Based on the waste
tonnage received per day, and the likely significant increase in the short to medium term, a
dedicated landfill compactor could barely be justified for the site. This will achieve much higher
compaction densities than a bulldozer and therefore significantly increase the life of the site.
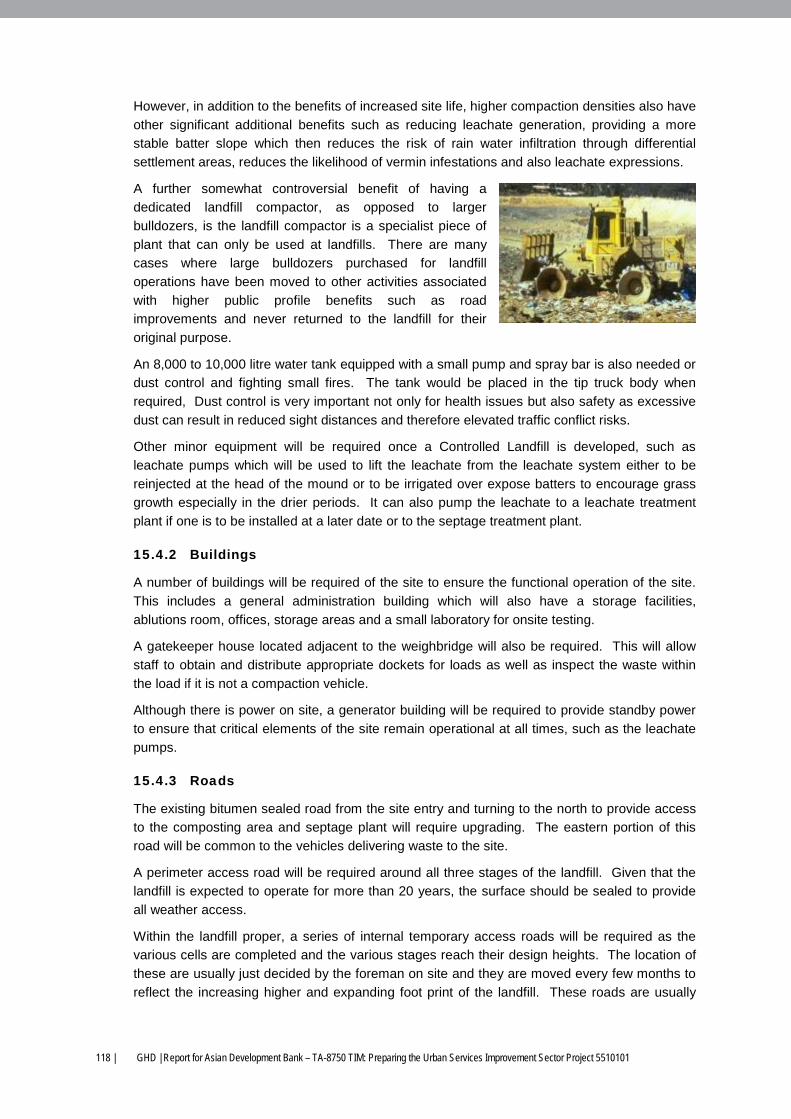
118 | GHD | Report for Asian Development Bank – TA-8750 TIM: Preparing the Urban Services Improvement Sector Project 5510101
However, in addition to the benefits of increased site life, higher compaction densities also have
other significant additional benefits such as reducing leachate generation, providing a more
stable batter slope which then reduces the risk of rain water infiltration through differential
settlement areas, reduces the likelihood of vermin infestations and also leachate expressions.
A further somewhat controversial benefit of having a
dedicated landfill compactor, as opposed to larger
bulldozers, is the landfill compactor is a specialist piece of
plant that can only be used at landfills. There are many
cases where large bulldozers purchased for landfill
operations have been moved to other activities associated
with higher public profile benefits such as road
improvements and never returned to the landfill for their
original purpose.
An 8,000 to 10,000 litre water tank equipped with a small pump and spray bar is also needed or
dust control and fighting small fires. The tank would be placed in the tip truck body when
required, Dust control is very important not only for health issues but also safety as excessive
dust can result in reduced sight distances and therefore elevated traffic conflict risks.
Other minor equipment will be required once a Controlled Landfill is developed, such as
leachate pumps which will be used to lift the leachate from the leachate system either to be
reinjected at the head of the mound or to be irrigated over expose batters to encourage grass
growth especially in the drier periods. It can also pump the leachate to a leachate treatment
plant if one is to be installed at a later date or to the septage treatment plant.
15.4.2 Buildings
A number of buildings will be required of the site to ensure the functional operation of the site.
This includes a general administration building which will also have a storage facilities,
ablutions room, offices, storage areas and a small laboratory for onsite testing.
A gatekeeper house located adjacent to the weighbridge will also be required. This will allow
staff to obtain and distribute appropriate dockets for loads as well as inspect the waste within
the load if it is not a compaction vehicle.
Although there is power on site, a generator building will be required to provide standby power
to ensure that critical elements of the site remain operational at all times, such as the leachate
pumps.
15.4.3 Roads
The existing bitumen sealed road from the site entry and turning to the north to provide access
to the composting area and septage plant will require upgrading. The eastern portion of this
road will be common to the vehicles delivering waste to the site.
A perimeter access road will be required around all three stages of the landfill. Given that the
landfill is expected to operate for more than 20 years, the surface should be sealed to provide
all weather access.
Within the landfill proper, a series of internal temporary access roads will be required as the
various cells are completed and the various stages reach their design heights. The location of
these are usually just decided by the foreman on site and they are moved every few months to
reflect the increasing higher and expanding foot print of the landfill. These roads are usually
GHD | Report for Asian Development Bank – TA-8750 TIM: Preparing the Urban Services Improvement Sector Project, 5510101 | 119
just made with cover material because they are only short term and can be readily repaired on
a daily basis as the bulldozer accesses the site to provide levelling and profiling inputs.
15.4.4 Fences
All landfills require an internal fence. These are usually made of a 1.8 to 2.0 metre high chain
link fence with some strands of barbed wire on top. The fences are provided to not only to
keep out vandals from attacking the equipment stored on site but also prevent stray animals
entering the site. The external fence also acts as a secondary barrier for any windblown litter
which my escape the internal control systems.
The fence will extend around the new buildings and heavy equipment parking area and be
equipped with gates at site entry and also the road exit to the septage and compost plants.
An internal litter fence is also provided at landfills. This is a relocatable fence kept close to the
active face to trap any windblown litter and reduce the probability of offsite litter impacts.
15.4.5 Drainage
A major external drain will be provided around the perimeter of the site adjacent to the fence
line. This will divert any rain water running off from the external catchment around the landfill
site and ultimately connect into the local macro drainage system to the west of the landfill site.
A smaller internal drain will be provided on the inside of the perimeter road to intercept any run
off from the landfill mounds proper.
A central drain will also be provided starting at stage one and going through stage two and
three to divert any stormwater from the centre of the site prior to being progressively landfilled.
15.4.6 Leachate Management
Leachate management is a key factor in any landfill design. This is addressed in a separate
chapter given its importance to the landfill operation.
15.4.7 Weighbridge
A 60 tonne weighbridge will be installed at the entrance to the site.
This will allow determination of the exact mass of waste coming to site from public, institutional
and commercial operators, and the issuance of any subsequent gate charges.
Whilst weighing the incoming loads may not be critical with the current operational
environment, any move towards partial privatisation or a PPP will require waste loads to be
weighed.
15.4.8 Recyclables Stockpile Areas
Given the low density of some materials such as plastic bags and particularly PET drink bottles,
an extensive area is required to allow this material to be stockpiled prior to being densified
either through presses or chippers. Otherwise this material will effectively remain commercially
unattractive to the scavengers.
The layout of these stockpile areas needs to be determined after the socio-economic survey is
completed to better understand whether waste pickers require individual stockpile areas or
whether these can be combined.
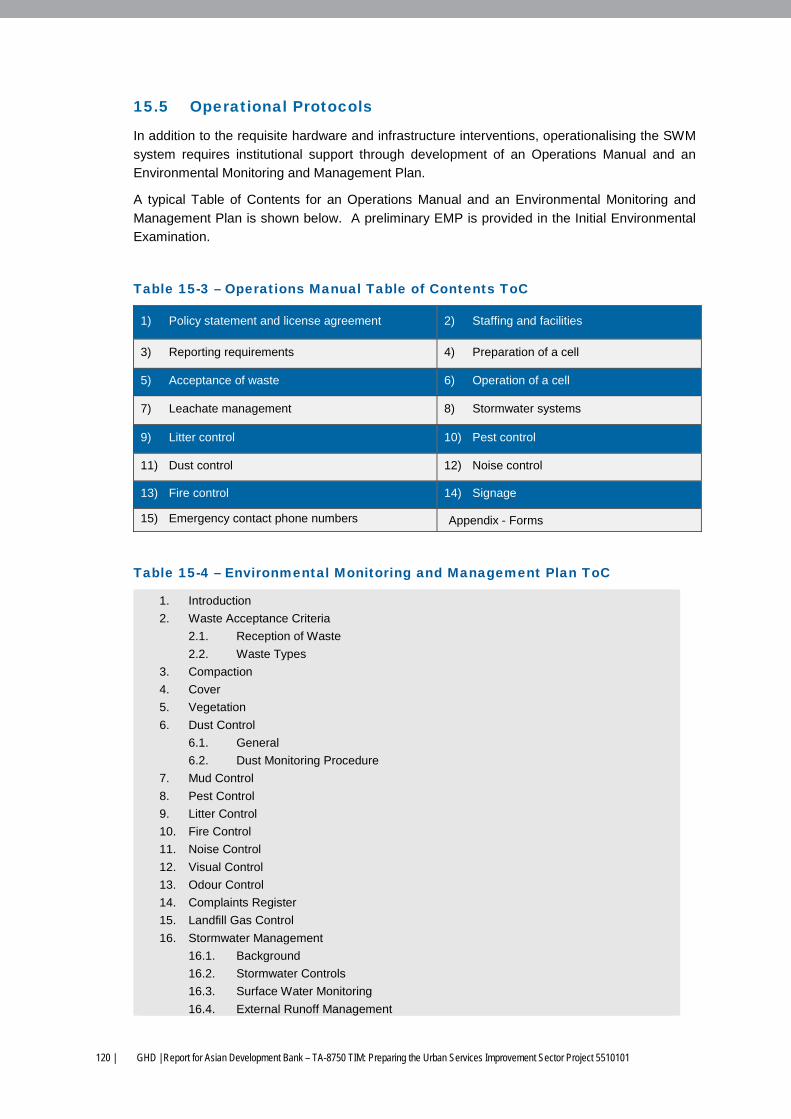
120 | GHD | Report for Asian Development Bank – TA-8750 TIM: Preparing the Urban Services Improvement Sector Project 5510101
15.5 Operational Protocols
In addition to the requisite hardware and infrastructure interventions, operationalising the SWM
system requires institutional support through development of an Operations Manual and an
Environmental Monitoring and Management Plan.
A typical Table of Contents for an Operations Manual and an Environmental Monitoring and
Management Plan is shown below. A preliminary EMP is provided in the Initial Environmental
Examination.
Table 15-3 – Operations Manual Table of Contents ToC
1) Policy statement and license agreement 2) Staffing and facilities
3) Reporting requirements 4) Preparation of a cell
5) Acceptance of waste 6) Operation of a cell
7) Leachate management 8) Stormwater systems
9) Litter control 10) Pest control
11) Dust control 12) Noise control
13) Fire control 14) Signage
15) Emergency contact phone numbers Appendix - Forms
Table 15-4 – Environmental Monitoring and Management Plan ToC
1. Introduction
2. Waste Acceptance Criteria
2.1. Reception of Waste
2.2. Waste Types
3. Compaction
4. Cover
5. Vegetation
6. Dust Control
6.1. General
6.2. Dust Monitoring Procedure
7. Mud Control
8. Pest Control
9. Litter Control
10. Fire Control
11. Noise Control
12. Visual Control
13. Odour Control
14. Complaints Register
15. Landfill Gas Control
16. Stormwater Management
16.1. Background
16.2. Stormwater Controls
16.3. Surface Water Monitoring
16.4. External Runoff Management
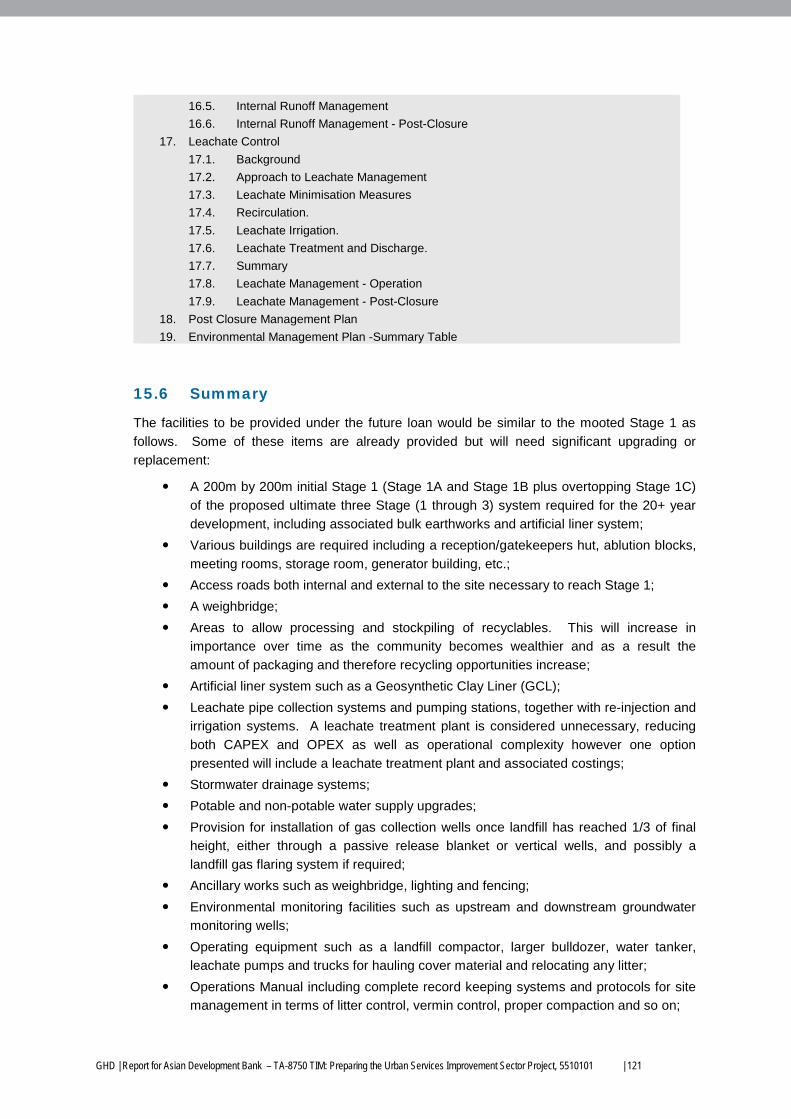
GHD | Report for Asian Development Bank – TA-8750 TIM: Preparing the Urban Services Improvement Sector Project, 5510101 | 121
16.5. Internal Runoff Management
16.6. Internal Runoff Management - Post-Closure
17. Leachate Control
17.1. Background
17.2. Approach to Leachate Management
17.3. Leachate Minimisation Measures
17.4. Recirculation.
17.5. Leachate Irrigation.
17.6. Leachate Treatment and Discharge.
17.7. Summary
17.8. Leachate Management - Operation
17.9. Leachate Management - Post-Closure
18. Post Closure Management Plan
19. Environmental Management Plan -Summary Table
15.6 Summary
The facilities to be provided under the future loan would be similar to the mooted Stage 1 as
follows. Some of these items are already provided but will need significant upgrading or
replacement:
A 200m by 200m initial Stage 1 (Stage 1A and Stage 1B plus overtopping Stage 1C)
of the proposed ultimate three Stage (1 through 3) system required for the 20+ year
development, including associated bulk earthworks and artificial liner system;
Various buildings are required including a reception/gatekeepers hut, ablution blocks,
meeting rooms, storage room, generator building, etc.;
Access roads both internal and external to the site necessary to reach Stage 1;
A weighbridge;
Areas to allow processing and stockpiling of recyclables. This will increase in
importance over time as the community becomes wealthier and as a result the
amount of packaging and therefore recycling opportunities increase;
Artificial liner system such as a Geosynthetic Clay Liner (GCL);
Leachate pipe collection systems and pumping stations, together with re-injection and
irrigation systems. A leachate treatment plant is considered unnecessary, reducing
both CAPEX and OPEX as well as operational complexity however one option
presented will include a leachate treatment plant and associated costings;
Stormwater drainage systems;
Potable and non-potable water supply upgrades;
Provision for installation of gas collection wells once landfill has reached 1/3 of final
height, either through a passive release blanket or vertical wells, and possibly a
landfill gas flaring system if required;
Ancillary works such as weighbridge, lighting and fencing;
Environmental monitoring facilities such as upstream and downstream groundwater
monitoring wells;
Operating equipment such as a landfill compactor, larger bulldozer, water tanker,
leachate pumps and trucks for hauling cover material and relocating any litter;
Operations Manual including complete record keeping systems and protocols for site
management in terms of litter control, vermin control, proper compaction and so on;
122 | GHD | Report for Asian Development Bank – TA-8750 TIM: Preparing the Urban Services Improvement Sector Project 5510101
Environmental Monitoring and Management Plan developed and implemented.
Preliminary designs are presented in Appendix E – Landfill Development Plans. These may
subject to change, based upon site and design considerations.
GHD | Report for Asian Development Bank – TA-8750 TIM: Preparing the Urban Services Improvement Sector Project, 5510101 | 123
16. Leachate Management 16.1 Stormwater Management
Managing both external and internal stormwater runoff is critical at landfills. Often the
uncontaminated stormwater runoff is allowed to mix with the leachate to produce a large
volume of very dilute leachate which is exceedingly difficult to manage.
The best approach is to always ensure that leachate and uncontaminated stormwater remain
separate. At the Tibar site, an external runoff interception drain will be constructed around the
perimeter of the site to collect stormwater running off the surrounding hill features. The drains
will run along the outside of the landfill perimeter road and immediately inside the landfill fence.
They will divert the uncontaminated external stormwater in a westerly direction until it exits the
overall Tibar site and enters the local macro drainage system.
A smaller internal drainage system will be provided on the inside of the landfill perimeter road to
collect stormwater runoff from the landfill mound as it develops.
Finally, the western end of the landfill cells post construction but prior to filling with waste will be
drained by a purpose built temporary drain through the middle of the landfill site. This
temporary drain which will eventually be converted into an advancing landfill cell but initially will
convey the stormwater runoff away from any deposited waste and avoid stormwater ponding
which would eventually reach the landfill tipping area and the waste batters. This would result
in saturation of the deposited waste and the generation of a large volume of dilute leachate.
While the waste will initially be deposited at the higher end of the cell and worked down slope,
there is still a possibility that protracted rain will introduce enough rain water into the cell to
allow the impounded water to contact the active waste face.
Removable sump pumps will be provided temporarily in the lower area of the cell to remove
any impounded uncontaminated stormwater.
In summary, uncontaminated stormwater will be kept completely separate from the leachate
interception and collection system to minimize the volume of contaminated water requiring
management at the facility.
16.2 Overview of Leachate Management Strategy
Leachate is one of, if not the biggest, environmental issue at a controlled landfill and is
traditionally treated and discharged. However, it is proposed to adopt a more contemporary
approach where leachate generation is minimised and the leachate is either reinjected or
irrigated at the site, obviating the need for a leachate treatment plant. The basics of the
management strategy are as follows:
reducing the volume of leachate generated by using filling, compaction, shaping and
covering procedures which severely inhibit direct rainfall entry;
reducing the volume of leachate generated by intercepting and by-passing all
upstream surface water catchment areas around the fill area in surface drainage
channels or bunds;
eliminating seepage of leachate from beneath the site by installing a compacted clay
liner, based on the in situ clay being too permeable without reworking or importing
clay from local pits to construct the liner. If the soil is unacceptable for liner
construction, an artificial HDPE or GCL geo-membrane will need to be provided. It is
assumed that a GCL liner will be adopted unless future geotechnical investigations
124 | GHD | Report for Asian Development Bank – TA-8750 TIM: Preparing the Urban Services Improvement Sector Project 5510101
indicate that the local soils, especially the laterites, can be reworked to provide the
usually required permeability of less than 10-9 m/s;
eliminating lateral movement of leachate by grading the base of the site to the central
area and intercepting this seepage in leachate interceptor/collector drains;
progressively pumping leachate from deleaching wells and recycling it through the
waste by means of “dry wells” or irrigating previously worked areas or future landfill
areas in dry weather. Utilise the storage capacity of the landfill as wet weather
storage so leachate does not have to be irrigated in wet weather possibly resulting in
contaminated stormwater runoff;
monitoring the groundwater quality hydro-geologically upslope and downslope of the
site.
With the available size of the site and the many years that will be associated with each stage of
the development of the final landform, there is ample time available to modify the system if
required, and monitoring programs will be sufficient to detect problems on site before they
become a potential problem for downstream users.
16.2.1 Artificial liner
The test pits excavated over the site as well as an inspection of the surrounding geology
indicates there is unlikely to be extensive areas of highly plastic clay. This type of clay can be
reworked, usually in 200 millimetre layers to build up the typically specified thickness of a 600
millimetre clay liner. This arrangement can provide the usual level of impermeability required,
namely 10-9m/s.
Given the likely absence of such highly plastic and impermeable clays, an artificial liner is
expected to be required. There are two main options, namely a HDPE 2mm thick plastic liner
or a Geosynthetic Clay Liner containing bentonite. Either liner type will provide the required
impermeability.
In developing countries, HDPE liners have often suffered either due to fire as they are
combustible or heavy vehicle traffic damage perforating the liner. Furthermore the liners have
to be heat welded to join the sheets and there are many cases where this heat welding has
proved ineffective.
The GCL liner does not have to be joined using either thermal or solvent processes and merely
has to be overlapped. The other advantage of a GCL liner in situations where installation and
subsequent operational care may be sub-optimal, is that it is partially self-repairing. For
example a hole up to 50 mm in diameter will be self-repaired by the bentonite moving between
the two geotextiles forming the GCL sandwich and plugging up the puncture.
However GCL requires careful placement and to be effective, requires application of a
consistent depth of load bearing material, such as gravel, soil or selected waste. At Tibar, it is
proposed that some of the newer waste from the ongoing dumping activities during the
construction phase of the landfill will be placed on top of the leachate gravel drains and soil to
provide a consistent load for the entire GCL surface to ensure that the liner is properly prepared
and sealed.
GHD | Report for Asian Development Bank – TA-8750 TIM: Preparing the Urban Services Improvement Sector Project, 5510101 | 125
16.3 Rainfall and Evaporation
16.3.1 Rainfall
Rainfall data was obtained from a number of sources. The Country Report on Climate Change
in the Pacific, Volume 2 notes that the rainfall has been reducing over the last decades and is
expected to approach an annual total of 800 mm per year within 20 years.
The Ministry of Agriculture Forestry and Fisheries rainfall data is available from 1953 and
provides an average annual rainfall of 940 mm.
The Timor Leste Situation Analysis by Costings and Powell in 2006 stated that the annual
average rainfall was 890 mm.
An annual average total of 940 mm was adopted as a conservative estimate.
16.3.2 Evaporation
No evaporation data could be found specifically for Dili but rather was interpolated from data for
nearby centres in similar geographical climates.
A total annual average evaporation of 1780 mm was adopted.
16.3.3 Runoff and infiltration Coefficient
The determination of the amount of infiltration and runoff due to rain events is a very complex
task.
For example the amount of runoff that occurs due to a rainfall event depends on numerous
factors including rainfall intensity and duration for each storm event, slope, vegetation, soil type,
antecedent rainfall, smoothness of the slope and so on. There are complete text books and
manuals on how this data set is derived but it still remains very site specific.
For landfill design and particularly leachate generation, the amount of rain water that infiltrates
into the waste mound and therefore can potentially form leachate is more important than
determining the amount of rainfall that runs off. It is not a direct relationships such that
whatever does not run off will automatically become infiltration, as there are interception losses
on leaves and upper soil profiles, etc.
Furthermore, the average size of raindrops increases with the intensity of a rainstorm. In a high
intensity storm, the kinetic energy of raindrops is considerable when hitting the soil surface.
This causes a breakdown of the soil aggregate as well as soil dispersion with the consequence
of driving fine soil particles into the upper soil pores. This results in clogging of the pores,
formation of a thin but dense and compacted layer at the surface which highly reduces the
infiltration capacity.
This effect, often referred to as capping, crusting or sealing, explains why in areas where
rainstorms with high intensities are frequent, considerable quantities of surface runoff are
observed even when the rainfall duration is short and the rainfall depth is comparatively small.
This effect is usually low for low intensity rainfall but most rain in Dili is higher intensity
Given that the approach to landfill design maximizes the fraction of the site that has steep
slopes and a well compacted and profiled soil cap, deep infiltration would be a maximum of
25% for steeply sloped completed area and say 40% for partially covered active working areas
of the landfill.
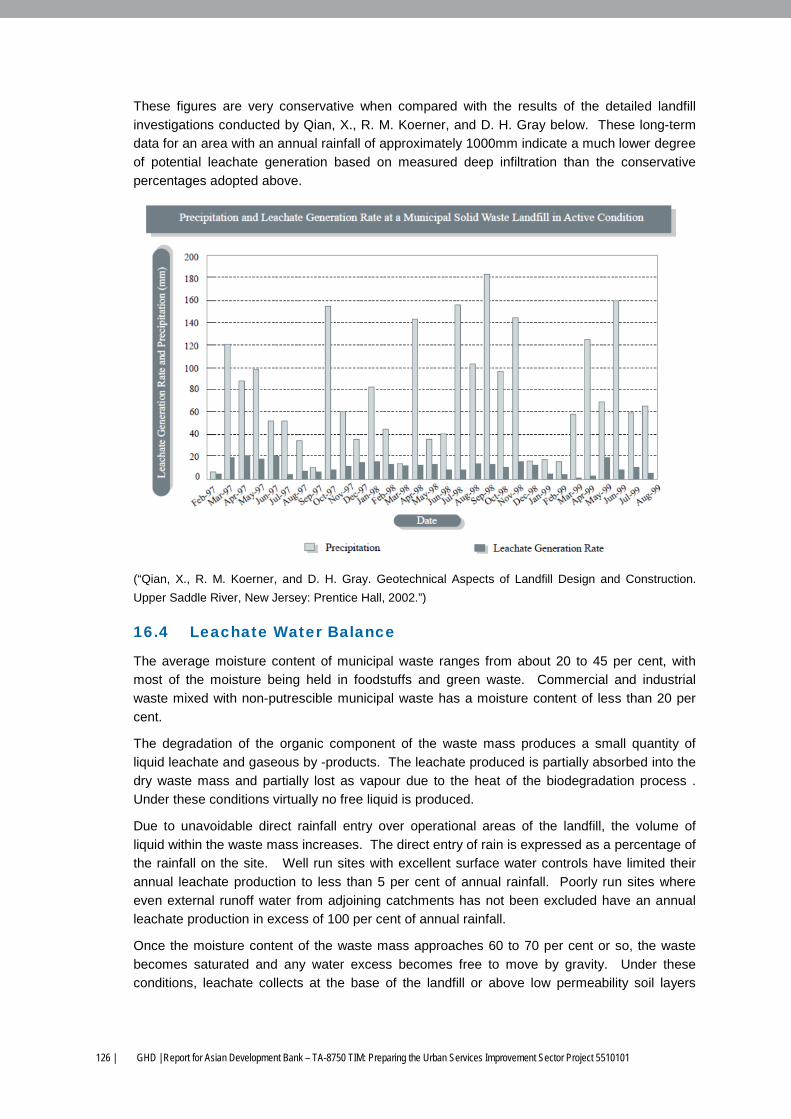
126 | GHD | Report for Asian Development Bank – TA-8750 TIM: Preparing the Urban Services Improvement Sector Project 5510101
These figures are very conservative when compared with the results of the detailed landfill
investigations conducted by Qian, X., R. M. Koerner, and D. H. Gray below. These long-term
data for an area with an annual rainfall of approximately 1000mm indicate a much lower degree
of potential leachate generation based on measured deep infiltration than the conservative
percentages adopted above.
(“Qian, X., R. M. Koerner, and D. H. Gray. Geotechnical Aspects of Landfill Design and Construction.
Upper Saddle River, New Jersey: Prentice Hall, 2002.”)
16.4 Leachate Water Balance
The average moisture content of municipal waste ranges from about 20 to 45 per cent, with
most of the moisture being held in foodstuffs and green waste. Commercial and industrial
waste mixed with non-putrescible municipal waste has a moisture content of less than 20 per
cent.
The degradation of the organic component of the waste mass produces a small quantity of
liquid leachate and gaseous by -products. The leachate produced is partially absorbed into the
dry waste mass and partially lost as vapour due to the heat of the biodegradation process .
Under these conditions virtually no free liquid is produced.
Due to unavoidable direct rainfall entry over operational areas of the landfill, the volume of
liquid within the waste mass increases. The direct entry of rain is expressed as a percentage of
the rainfall on the site. Well run sites with excellent surface water controls have limited their
annual leachate production to less than 5 per cent of annual rainfall. Poorly run sites where
even external runoff water from adjoining catchments has not been excluded have an annual
leachate production in excess of 100 per cent of annual rainfall.
Once the moisture content of the waste mass approaches 60 to 70 per cent or so, the waste
becomes saturated and any water excess becomes free to move by gravity. Under these
conditions, leachate collects at the base of the landfill or above low permeability soil layers
GHD | Report for Asian Development Bank – TA-8750 TIM: Preparing the Urban Services Improvement Sector Project, 5510101 | 127
within the waste mass and expresses itself in springs around the toe of the landfill or even up
the sides of the perimeter batters.
In physical terms at the end of Stage 1( A, B and C), the landfill will consist of 508,000m3 of
waste and soil. With a porosity of about 30 per cent, it has the capacity to accept 152,000m3 of
liquid into the voids prior to leachate flowing. This ignores the capacity of the paper, cardboard
and some other components to absorb leachate.
16.4.1 Cell 1 Balance (for covered site)
Stage 1 surface area = 36,000m2
Average annual rainfall = 940mm
Average annual pan evaporation = 1,780mm
Infiltration coefficient (2.5H:1V) = 0.25
Infiltration = 36,000m2 x 940mm x 0.25 => 8,500m3
Evapotranspiration = 36,000m2 x 1,780mm x 0.625 =>40,050m3 (for lush grass cover)
= 36,000m2 x 1,780mm x 0.35 => 22.400m3 (for moderate grass)
= 36,000m2 x 1,780mm x 0.15 = > 9,600m3 (for no grass cover)
Net potential infiltration = zero for sealed, grassed site (vigorous /lush grass cover)
= zero for sealed, grass site (moderate grass cover)
= zero for sealed, non grassed site
The external final batters will become grassed in any case as the soil becomes covered with
seeds and external sources of sward generation. The proposal to irrigate external batters wil
further encourage sward growth in any case, particulalry in the drier periods.
The completed Cell 1 has a theoretical physical capacity to retain 152,000m3 of leachate in
refuse voids. In practice, this physical retention does not occur since a very large amount of
leachate is removed through absorption and vapour losses in landfill gas as part of the
biodegradation process.
Thus for a “closed” landfill, the potential infiltration of rain water will be totally lost by
evapotranspiration, retention in available pore space and absorption/vaporisation with landfill
gas which is fully saturated. As a further contimgency, there are extensive areas of future
landfill cells which offer large tracts of land for leachate irrigation.
16.4.2 During Operational Phase of Stage 1A
Landfills are more vulnerable to excess rain water infiltration during the operational stage when
storms occur at times when parts of the landfilling operation are uncovered and / or the surface
gradients are temporarily quite flat and represent a significant proportion of the total landfill
area. This fraction obviously reduces over time as the completed area expands as a proportion
of the total landfill foorprint.
Assuming about half of Stage 1A is complete and parts of the site are periodically uncovered
or flat, the following balance could apply:
Area = 9,000m2
Infiltration = 9,000m2 x 940mm x 0.4 => 3,400m3
128 | GHD | Report for Asian Development Bank – TA-8750 TIM: Preparing the Urban Services Improvement Sector Project 5510101
Evapotranspiration = 9,000m2 x 1,780mm x 0.15 => 2,400m3
Net infiltration = 1,000m3
Capacity to retain in voids = 80,000m3 x 0.3 => 24,000m3
Thus, for an uncovered, flat partially completed Stage 1A landfill (the worst case scenario), the
potential infiltration of rain water of 1,000 m3 will be “lost” by evapotranspiration,
absorption/vaporisation and void filling.
The obvious implications of this are to progressively develop a landform that will shed surface
water, cover waste on a regular basis and promote grass growth as external batters are
developed. Reducing the infiltration coefficient from 0.4 to 0.25 alone will control leachate
production to levels which can be readily managed by absorption/vaporisation and
evapotranspiration, and not relying on the finite limit of filling void spaces. A further
contingency is irrigating previously or yet to be worked site areas with leachate.
In summary, there could be a net leachate yield during the early stages of the landfill
development, but later stages will not produce excess leachate beyond the landfill capacity to
retain or evapotranspire the quantity produced.
16.5 Leachate Design Flowrate
For the landfill once Stage 1A is complete, the potential infiltration of rain water will be totally
lost by evapo-transpiration (depending upon the lushness of the ground cover), retention in
available pore space and absorption/vaporization. This does not include the allowance for
irrigation of the completed and undeveloped stages to enhance vegetation cover, or the
allowance for leachate losses in the saturated landfill gas emissions, which provides a further
buffer against leachate migration.
However if for some reason the recommended leachate reinjection and irrigation systems were
not implemented, the average leachate production has been determined below and the relevant
leachate treatment requirements determined. This essentially is reversion to the old traditional
system of simply collecting all leachate and treating it, rather than proactively managing
leachate generation as recommended in this investigation.
The design flow for the leachate treatment plant should therefore be based on the net leachate
flow rate, allowing for the porosity retention ability of the landfill to attenuate leachate flows
requiring treatment during the annual production cycle. The net flow requiring treatment should
therefore be based on the long term average net leachate flow.
There are many theoretical design models for determining the quantity of leachate generated,
but all require extensive data inputs which rely on numerous assumptions that may or may not
happen in reality. Given the many factors affecting leachate generation rates mentioned above,
and the correspondingly numerous methods of disposing of the untreated leachate, the only
real determination of leachate flow rates possibly requiring treatment must be empirical.
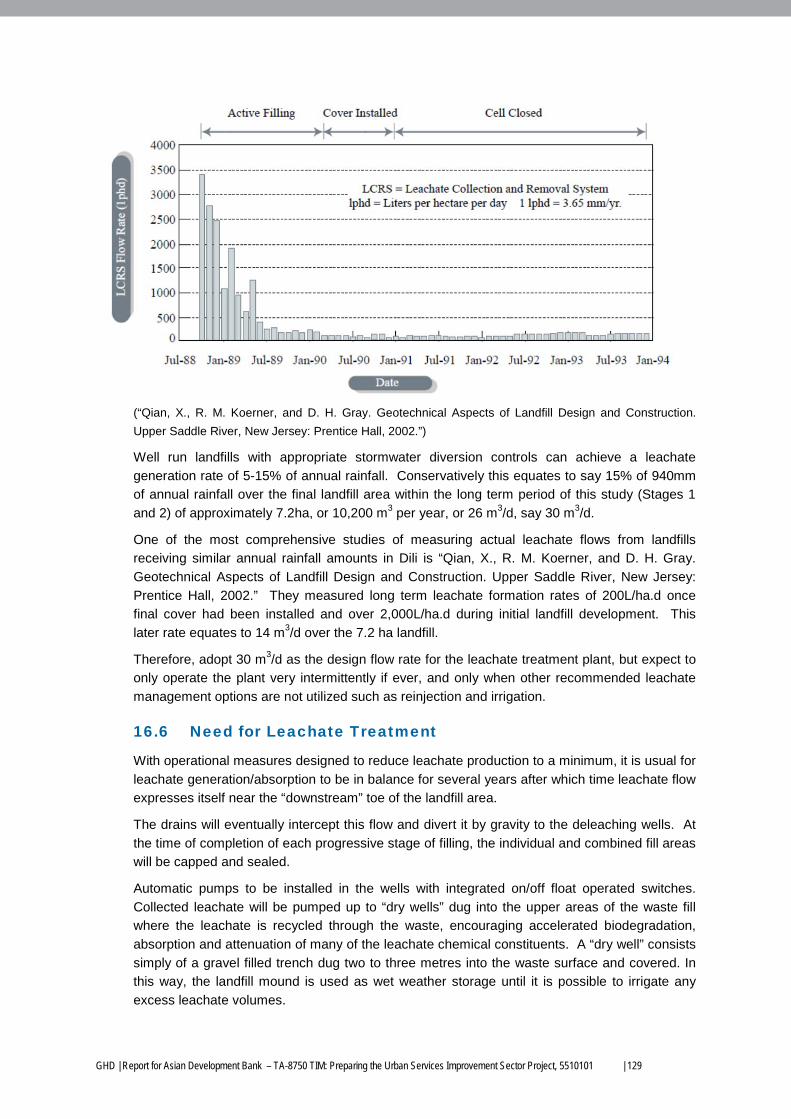
GHD | Report for Asian Development Bank – TA-8750 TIM: Preparing the Urban Services Improvement Sector Project, 5510101 | 129
(“Qian, X., R. M. Koerner, and D. H. Gray. Geotechnical Aspects of Landfill Design and Construction.
Upper Saddle River, New Jersey: Prentice Hall, 2002.”)
Well run landfills with appropriate stormwater diversion controls can achieve a leachate
generation rate of 5-15% of annual rainfall. Conservatively this equates to say 15% of 940mm
of annual rainfall over the final landfill area within the long term period of this study (Stages 1
and 2) of approximately 7.2ha, or 10,200 m3 per year, or 26 m3/d, say 30 m3/d.
One of the most comprehensive studies of measuring actual leachate flows from landfills
receiving similar annual rainfall amounts in Dili is “Qian, X., R. M. Koerner, and D. H. Gray.
Geotechnical Aspects of Landfill Design and Construction. Upper Saddle River, New Jersey:
Prentice Hall, 2002.” They measured long term leachate formation rates of 200L/ha.d once
final cover had been installed and over 2,000L/ha.d during initial landfill development. This
later rate equates to 14 m3/d over the 7.2 ha landfill.
Therefore, adopt 30 m3/d as the design flow rate for the leachate treatment plant, but expect to
only operate the plant very intermittently if ever, and only when other recommended leachate
management options are not utilized such as reinjection and irrigation.
16.6 Need for Leachate Treatment
With operational measures designed to reduce leachate production to a minimum, it is usual for
leachate generation/absorption to be in balance for several years after which time leachate flow
expresses itself near the “downstream” toe of the landfill area.
The drains will eventually intercept this flow and divert it by gravity to the deleaching wells. At
the time of completion of each progressive stage of filling, the individual and combined fill areas
will be capped and sealed.
Automatic pumps to be installed in the wells with integrated on/off float operated switches.
Collected leachate will be pumped up to “dry wells” dug into the upper areas of the waste fill
where the leachate is recycled through the waste, encouraging accelerated biodegradation,
absorption and attenuation of many of the leachate chemical constituents. A “dry well” consists
simply of a gravel filled trench dug two to three metres into the waste surface and covered. In
this way, the landfill mound is used as wet weather storage until it is possible to irrigate any
excess leachate volumes.
130 | GHD | Report for Asian Development Bank – TA-8750 TIM: Preparing the Urban Services Improvement Sector Project 5510101
If the monitoring of the deleaching wells and performance of the “dry wells” indicates that
leachate generation is excessive, there will be room on site to dispose of any excess through
evapotranspiration on intermediate areas of the landfill area by spray irrigation. The use of
leachate as a plant nutrient and water source has been used successfully overseas but needs
to be checked by laboratory testing in each case to determine the site specific quality of the
leachate being produced. This will be undertaken as part of the EMMP leachate monitoring
requirements. If the leachate is unsuitable for irrigation, it can be treated to remove the
contaminant of concern prior to irrigation. For example, if metals levels are excessive, lime
dosing and sedimentation/filtration would be used to reduce the metal content. However
untreated leachate has successfully been used many times for grass and other plant irrigation.
If leachate volumes during the life of the landfill do become excessive for dry well injection and
irrigation, the leachate well pumps could be upgraded to convert the landfill into a controlled
bioreactor. This is being undertaken in the USA and some EU contries where the landfill is
purposely saturated and the leachate recirculated through the refuse mound to accelerate
biodegradation of the refuse organics and conversion of microbial activity from the acid forming
stage to the methanogens. During the methane forming stage, the leachate is biotreated and
the pH stabilised near neutral. The leachate becomes benign after a number of years (rather
than decades usually required in conventional landfills) and can be released to local receiving
waters, possibly after further treatment, such as chemical precipitation.
However given the extensive areas of vacant land available during the early stages of the
controlled landfill development which can be used for leachate irrigation, and then the extensive
waste mound volume in later stages which can be used to “store” the leachate by reinjection,
then leachate management and disposal problems are not expected at any stage of operation.
An area can be set aside in the site layout to install possible future leachate treatment facilities
in any case. Alternatively leachate could be pumped to the septage treatment plant.
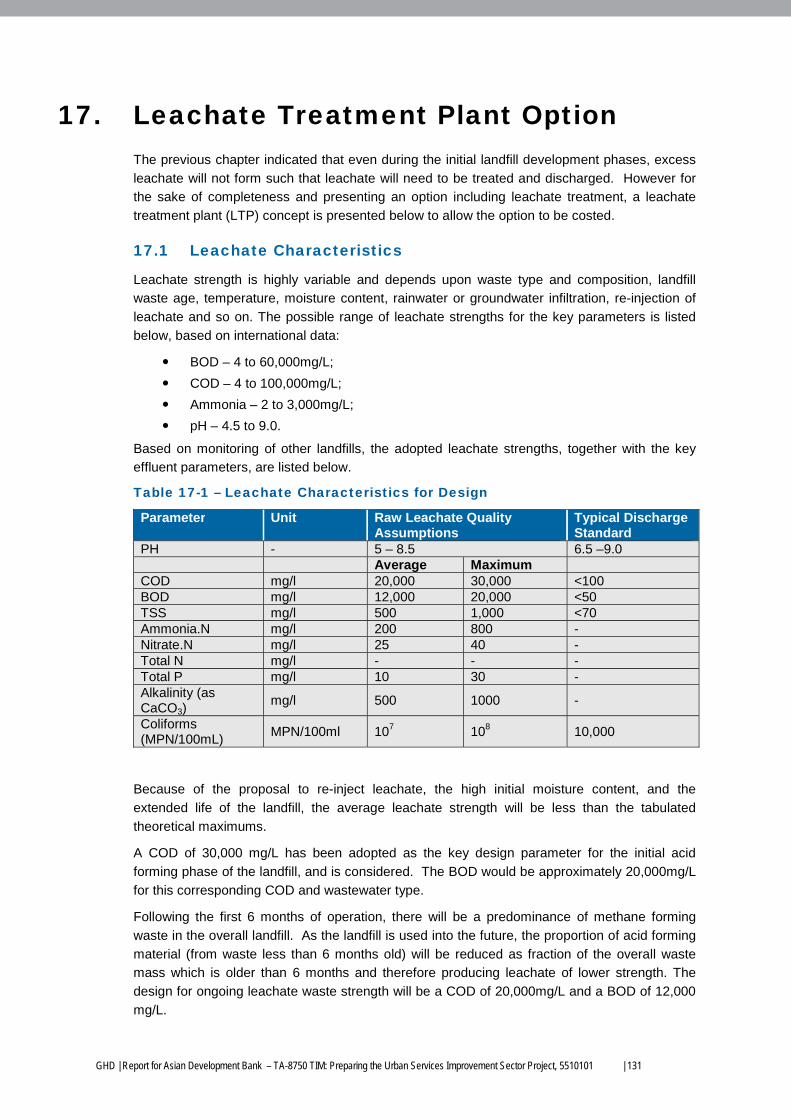
GHD | Report for Asian Development Bank – TA-8750 TIM: Preparing the Urban Services Improvement Sector Project, 5510101 | 131
17. Leachate Treatment Plant Option The previous chapter indicated that even during the initial landfill development phases, excess
leachate will not form such that leachate will need to be treated and discharged. However for
the sake of completeness and presenting an option including leachate treatment, a leachate
treatment plant (LTP) concept is presented below to allow the option to be costed.
17.1 Leachate Characteristics
Leachate strength is highly variable and depends upon waste type and composition, landfill
waste age, temperature, moisture content, rainwater or groundwater infiltration, re-injection of
leachate and so on. The possible range of leachate strengths for the key parameters is listed
below, based on international data:
BOD – 4 to 60,000mg/L;
COD – 4 to 100,000mg/L;
Ammonia – 2 to 3,000mg/L;
pH – 4.5 to 9.0.
Based on monitoring of other landfills, the adopted leachate strengths, together with the key
effluent parameters, are listed below.
Table 17-1 – Leachate Characteristics for Design
Parameter Unit Raw Leachate Quality Assumptions
Typical Discharge Standard
PH - 5 – 8.5 6.5 –9.0 Average Maximum COD mg/l 20,000 30,000 <100 BOD mg/l 12,000 20,000 <50 TSS mg/l 500 1,000 <70 Ammonia.N mg/l 200 800 - Nitrate.N mg/l 25 40 - Total N mg/l - - - Total P mg/l 10 30 - Alkalinity (as CaCO3)
mg/l 500 1000 -
Coliforms (MPN/100mL)
MPN/100ml 107 108 10,000
Because of the proposal to re-inject leachate, the high initial moisture content, and the
extended life of the landfill, the average leachate strength will be less than the tabulated
theoretical maximums.
A COD of 30,000 mg/L has been adopted as the key design parameter for the initial acid
forming phase of the landfill, and is considered. The BOD would be approximately 20,000mg/L
for this corresponding COD and wastewater type.
Following the first 6 months of operation, there will be a predominance of methane forming
waste in the overall landfill. As the landfill is used into the future, the proportion of acid forming
material (from waste less than 6 months old) will be reduced as fraction of the overall waste
mass which is older than 6 months and therefore producing leachate of lower strength. The
design for ongoing leachate waste strength will be a COD of 20,000mg/L and a BOD of 12,000
mg/L.
132 | GHD | Report for Asian Development Bank – TA-8750 TIM: Preparing the Urban Services Improvement Sector Project 5510101
17.2 Process Selection
A number of alternative technologies have considered and evaluated for treatment and/or
disposal of leachate. The factors to consider in selecting the preferred process for the leachate
treatment plant:
Leachate flowrates and strength vary greatly over a landfill life, requiring the leachate
treatment process to be able to accept a variable flow and load;
The treatment plant should be economical, in terms of investment costs and O&M
costs;
The plant must be easy to operate, using appropriate technology to ensure that the
treatment process will meet the required effluent discharge standards.
The proposed leachate treatment process would therefore include the following:
Equalization Lagoon;
pH correction;
Attached Media Anaerobic Treatment;
Aerated Lagoon;
Clarification;
Maturation Ponds.
The adopted design criteria are as follows:
Initial period - flow rate of 30 kL/d and the initial raw leachate COD of 30,000mg/L, the
biological load is 900kg COD/day or 600kg BOD/day;
Long term design load - flow rate of 30 kL/d and the initial raw leachate COD of
20,000mg/L, the biological load is 600kg COD/day or 360kg BOD/day.
17.3 Equalization Lagoon
This lagoon would allow the diurnal and short-term flow variations to be balanced, and also any
short-term variations in leachate composition to be attenuated, allow dilution of transient input
slugs and some settling of toxicants prior to entering the later treatment stages. The lagoon
would also reduce the COD by more than 30%.
For the adopted long-term BOD load of 360kg BOD/day, the required volume is 1,200 kL or
approximately 40 days detention. Allowing for significant short-circuiting and dead pockets, the
minimum required volume is 1,800 kL or 60 days retention. For the initial 6 months when
leachate strength will be the highest, the loading will be 600 kg BOD/day giving 0.33 kg BOD/kL
of pond volume /d, which is acceptable. The effluent COD load from the equalisation pond is
therefore 630 kg COD/d in the first few months, reducing to 420 kg COD/d for the ongoing
operation. The BOD effluent load is 420 kg BOD/d initially, reducing to 250 kg BOD/d for the
ongoing operation.
To allow for sludge and silt accumulation, as well as litter entrapment, a further 50% spare
capacity should be allowed taking the overall volume required to 90 days.
To minimise any odour problems, the lagoon could be equipped with surface aerators to
maintain an anoxic or aerobic surface layer to limit odours and provide some mixing to
minimise the biological impact of any shock loads entering the treatment system; however
aerators are expensive to purchase and operate. An alternative is to cover the equalisation
pond with a floating HDPE membrane. However odour should not be problematic provided that
GHD | Report for Asian Development Bank – TA-8750 TIM: Preparing the Urban Services Improvement Sector Project, 5510101 | 133
any organic litter is removed from the lagoon and any naturally forming surface scum is not
disturbed.
The equalisation lagoon would therefore be 33.5m long x 32m wide x 6m deep at normal water
level.
17.4 Chemical Dosing
Even with the provision of a balancing lagoon to attenuate any acidic or alkaline leachate slugs,
chemical dosing facilities are traditionally provided. Protracted periods of acidic or alkaline
leachate entering the treatment plant will impact the sensitive anaerobic organisms utilised in
the following process. These organisms are slow to recover and repopulate, so a chemical
dosing system using the following components is required:
Acid and alkaline storage tanks;
Reagent mixing tanks if powder form chemicals are to be used, especially lime;
pH probes;
Dosing pumps and control systems;
Chemical contact tank;
Post dosing pH monitoring.
17.5 Attached Media Anaerobic Treatment
A hybrid upflow anaerobic treatment process will be used to efficiently reduce the COD and
BOD prior to aerobic treatment. It is a mixture of Upflow Anaerobic Sludge Blanket (UASB) and
a Fixed Bed Reactor (FBR) in the upper part of the chamber. This hybrid reactor will provide
the main reduction in COD. Using aerated lagoons without anaerobic pre-treatment would take
up too much land at the landfill and consume too much energy if mechanically aerated.
A loading rate of 7 kg COD/m3 day will achieve a COD reduction of 90% during the initial acid
forming phase in the landfill. This high rate is possible because of the highly bio-degradable
short chain fatty acids produced in the early phase of landfill operation. These acids are highly
biodegradable in both aerobic and anaerobic treatment processes.
For the initial phase, the required volume is 630 kg COD/d divided by 7 kg COD/m3 day, giving
a reactor volume of 90 m3. The effluent COD would be 63 kg COD/d or an effluent quality of
2,100 mg/L.
For the ongoing operation after the landfill acid phase is passed, the COD removal rate will
reduce to 85%. With the load being 420 kg COD/d, 85% removal yields the same effluent
quality as for the higher removal rates for the higher strength waste. The BOD in both phases is
approximately 1400 mg/L or 42 kg BOD/d.
The anaerobic lagoon and hybrid anaerobic towers will reduce the ammonia levels by a number
of processes.
There will be biological uptake of ammonia by the anaerobic bacteria starting to form
biological solids or sludges from the COD energy as a substrate.
Finally there will be direct volatilization of the ammonia into the atmosphere,
particularly in the lagoon.
The final effluent ammonia level will be reduced from 800mg/L to less than 600mg/L in the
landfill acidic phase start-up period and to less than 200 mg/L during normal operation, with
minimal nitrates carrying over to the later treatment processes.
134 | GHD | Report for Asian Development Bank – TA-8750 TIM: Preparing the Urban Services Improvement Sector Project 5510101
Therefore the anaerobic treatment tanks will be 3 steel/fibreglass tanks, each 6 metres high
and 2.5 metres in diameter.
17.6 Aerated Lagoon
A lagoon 30m long x 15 m wide x 2.5 m deep will be used, with a floating baffle separating the
aerated lagoon portion of the overall lagoon from the settling lagoon and maturation ponds to
minimize earthwork costs. The pond has a 25 day hydraulic retention time, a high sludge age of
at least 30 days, and an associated elevated Mixed Liquor Suspended Solids mass. This
combination will provide better treatment stability and better removals of refractory compounds.
The BOD removal required is 42 kg/d. Allowing for endogenous decay of the biological floc that
will be formed in the aerated lagoon, and the low activity of the floc given the long sludge age,
the aeration requirements for the BOD will include an additional 60% load. This gives 67 kg
O2/day for BOD oxidation and endogenous decay demands.
Ammonia must also be oxidised to nitrite and nitrate and will later partially denitrify to form
nitrogen gas. This will harmlessly gasify out of the later treatment stages back to the
atmosphere. The design incoming ammonia level is 600 mg/L of ammonia (worst case
scenario) or 18 kg of Ammonia per day.
For each kilogram of ammonia to be oxidised to nitrate, 4.6 kilograms of oxygen is required to
achieve full oxidation. For every kilogram of the resulting nitrate formed which denitrifies back
to nitrogen gas, 2.7 kilograms of oxygen is recovered. There will be some denitrification
(conversion of nitrate back to nitrogen gas) in anoxic pockets in the aeration pond particularly
during periods of non-aeration, and in the anoxic centres of larger aerobic floc particles during
aeration periods.
Assuming only partial denitrification, which is conservative, then 3 kilograms of oxygen is
required per kilogram of ammonia, giving 54kg of oxygen required per day to oxidise the
ammonia.
This gives a total oxygen demand of 120 kg O2/day or 10 kg O2/hr if aerating for 12 hours a
day. The non-aeration periods will allow denitrification to occur. If the Oxygen Transfer Rate
efficiency into dirty water is 1.2 kg O2/kW of power, then 8kW of aeration is required. The
nearest aerator size to that required is a 10HP (7.5kW) aerator. Two aerators will be provided
for better mixing and almost 100% capacity for back-up purposes
In summary, the 30 metre by 15 metre aerated pond will be 2.5 metres deep. Aeration will be
provided by two 10HP (7.5kW) floating surface aerators located at the middle third points.
17.7 Clarification
The design daily flow is 30 kL/d. Even allowing for a flow peaking factor of 2, the design flow
rate is only 60 kL/d. A surface loading rate of 18 m/d is appropriate, giving a clarifier surface
area of 3.5m2. Since low technology is the objective, a settling pond is recommended instead of
a clarifier.
A settling lagoon 5m wide x 30m long x 2.5m deep is recommended based on ease of
construction and allowing for significant short circuiting and sludge deposition, with 10 days
retention time and a peak surface loading rate of only 0.4m/d.
GHD | Report for Asian Development Bank – TA-8750 TIM: Preparing the Urban Services Improvement Sector Project, 5510101 | 135
17.8 Maturation Ponds
A maturation pond is used to balance out any treatment irregularities and also to allow
appropriate die-off the pathogens. A minimum of thirty days retention is usually provided in a
well-baffled pond or pond series. The final lagoon could be stocked with fish or planted with
hyacinth to reduce algal densities.
The total maturation pond retention time recommended is about 45 days which will provide
good effluent polishing as well as the required pathogen die-off even with allowance for some
short-circuiting occurring.
Using the 30 metre wide lagoon with floating baffles, two more cells 10 metres wide would
provide 13 days retention each. The last baffle and the end of the lagoon would form the final
pond, allowing a retention time of 17 days.
17.9 Other Parameters
The priority parameters and how they will be treated are described above. The remainder may
be generally classified as follow:
Heavy metals, such as cadmium, chromium and zinc;
Organics, such as phenols;
Oils, such as vegetable oils;
Radiation;
Coliforms; and
Chlorine.
It is considered that specific treatment units to remove these parameter groups are
unnecessary because the parameters will either be in such small quantities that specific
removal is unnecessary to meet the discharge standards or that the proposed treatment units
will remove them to the required standard anyway. In the event of the treated leachate
exceeding the discharge standards, the treated leachate can reinjected back into the landfill
mound or irrigated in dry weather, and the discharge would cease.
17.9.1 Heavy metals
There is little industrial activity in the catchment so elevated metals levels in the waste stream
would not be expected in the first case, apart from iron. These metals usually come from metal
plating works or other heavy industrial activity. To minimise any heavy metals entering into the
leachate, a recirculation system is proposed that will accelerate the landfill methane forming
stage where heavy metals tend to precipitate out rather than become mobile and enter into the
leachate flow due to acidic landfill conditions.
The biological floc formed in both the anaerobic and aerobic processes will take up significant
fractions of whatever metals are in the leachate for later disposal as a sludge back in the
landfill. If metals levels are only intermittently elevated, then the leachate would not be
discharged for a period, but recirculated back into the waste mound or irrigated within the site in
dry weather. If for some reason excessive metal levels do appear consistently in the treated
leachate, then a chemical dosing system will have to be installed at a later date. This will
involve pH correction using both alkali and acid tanks and dosing systems, as well as a
coagulant and flocculant dosing system for chemicals such as lime or Alum. These chemicals
could be dosed after the balance tank (and before the anaerobic units) into a dedicated two
tank series for coagulation and then flocculation and settling.
136 | GHD | Report for Asian Development Bank – TA-8750 TIM: Preparing the Urban Services Improvement Sector Project 5510101
These dosing systems cost in the order of USD100,000 and will be expensive to operate with
power and chemical costs on an ongoing basis. These plants also require close monitoring to
operate efficiently, and a trained chemist/chemical engineer would be required together with a
well-equipped wet chemistry laboratory. In conclusion, given the low expected metals content
in the raw solid waste, the accelerated methane forming mode of operation of the landfill which
limits metal mobility, the opportunity to stop discharging treated leachate in the event of
elevated metals levels by leachate re-injection or irrigation and finally the metals removals that
will be achieved in the proposed treatment units, no specific heavy metals treatment facilities
are considered necessary. If later found to be necessary, then chemical-dosing facilities can
be retrofitted, but this is not expected to be necessary if the landfill is correctly operated.
17.9.2 Organics, such as phenols
The same comments apply to organics as for heavy metals, especially in relation to very low
levels expected in the raw solid waste. Organics removal could require high technology
systems such as activated carbon filters, which again are very costly to purchase and operate.
The activated carbon has to be replaced or regenerated on a regular basis, which is also costly.
The carbon filters would be located after the settling lagoon prior to the maturation ponds. As
for the heavy metal parameters, specific treatment facilities are not expected to be necessary
as the proposed treatment process will remove most low-level organics due to take up in the
biological floc in any case.
17.9.3 Oils, such as vegetable oils
Only very low levels of oil would be expected in the leachate and most oil will removed in the
biological treatment processes proposed in any case. Special oil separators will not be
required, as any free oil will be retained by baffle skirts in the maturation lagoon.
17.9.4 Radiation
This will not be present in the landfill in measurable quantities as it would not be allowed into
the landfill, such as medical waste from cancer patients receiving radium treatment or large
quantities of smoke detectors.
GHD | Report for Asian Development Bank – TA-8750 TIM: Preparing the Urban Services Improvement Sector Project, 5510101 | 137
18. Landfill Gas Options 18.1 Background
Gases found in landfills are composed mainly of carbon dioxide and methane but can include
minor amounts of ammonia, carbon monoxide, hydrogen, hydrogen sulphide, nitrogen and
oxygen as well as many other trace constituents.
Aerobic decomposition continues to occur until the oxygen in the air initially present in the
compacted wastes is depleted. Following a short interim anoxic phase, decomposition will then
proceed anaerobically producing mainly methane. The gas production rate and composition is
a function of many parameters, such as landfill moisture content, waste composition, waste
age, temperature, and biodegradability.
Biological activity is directly responsible for methane generation from landfilled organic wastes.
The biological decomposition phase takes place in three stages that are not distinctly
separated.
The presence or absence of oxygen is the principal determining factor. When solid waste is
initially deposited, oxygen is trapped in the fill materials by the landfilling operation. While this
oxygen is available, organic wastes are decomposed into CO2, water, residual organics and
heat by aerobic micro-organisms. Aerobic decomposition occurs relatively quickly. CO2
content can reach 90%. Some carbon dioxide dissolves into any available water, resulting in
decreased pH levels, while the balance remains in the gaseous phase.
The oxygen consumed by aerobic micro-organisms is not generally replaced, due to the
presence of a low permeability soil cover. This results in a gradual decrease in the aerobic
micro-organisms population and a corresponding increase in the facultative micro-organism
population which are tolerant to oxygen but do not depend on it. The characteristic products of
this second stage biological decay are carbon dioxide and partially degraded organics,
including organic acids which cause a further reduction in pH levels.
As all of the available oxygen is consumed, the anaerobic methane forming micro-organisms
(methanogens) become dominant. The methane forming bacteria are relatively slow,
producing water and methane with very little production of heat. This group of micro-organisms
efficiently decomposes organic matter, including organic acids, into gaseous end products,
mostly methane. The reduction of organic acid content and the lower production of carbon
dioxide promotes an increase in the leachate pH to near neutral values.
In terms of relative importance, landfills are the third largest source of anthropogenic methane
in the United States. According to the U.S. Environmental Protection Agency (USEPA, 2006)7,
landfill gas comprises 17.7 percent of all U.S. methane emissions. Landfill methane in 2011
accounted for 103 million metric tonnes of carbon equivalent released into the atmosphere.
Methane is a short-lived climate pollutant with significant warming potential, and over a 20 year
period, one ton of methane causes 72 times more warming than one ton of carbon dioxide
(CO2).
7 U. S. EPA, Global Anthropogenic Non-CO2 Greenhouse Gas Emissions: 1990-2020, USEPA, Washington,D.C., 2006.
138 | GHD | Report for Asian Development Bank – TA-8750 TIM: Preparing the Urban Services Improvement Sector Project 5510101
The USEPA (2006)8 estimates that global net CH4 emission from landfills is ~36 Mt for year
2000. They also used IPCC methods (IPCC, 2001)9 to estimate waste generation and methane
production but included both oxidation and gas capture in their estimate.
These studies indicate that landfills contribute some 5% of global methane emissions or about
10% of the anthropogenic fraction globally. However, none of these studies explicitly estimate
the impact of thermal treatment of waste (waste-to-energy) (WtE) and recycling on landfilling
rate and on subsequent CH4 emission from landfills. Increased WtE activity, as well as aerobic
composting of food and greenwaste, or simply diversion and chipping and greenwaste for
garden use will greatly reduce methane emissions from the municipal waste pool globally.
18.2 Gas Generation Rates
Generation rates from other sites have been assessed and used to estimate the likely landfill
gas generation rate at the site. This was done by comparing sites in terms of depth of waste,
total volume of waste and waste stream components. The calculations are for the completed
Stage 1, including the overfill Stage 1C which will represent about 6 years operations.
These comparison sites are as follows:
University of Massachusetts Campus, Boston, USA. The measured flow rate into a
crawl space beneath a building site was 0.3 m3/m2.day of surface area. This
translates to a flow rate of about 10,800m3/day locally. The average depth of waste
will be about 50 per cent less than at Boston, but the age of the waste will be younger
and the organic content will be at least double and hence it is likely that the
generation rate (over a 10 year period) would be at least 18,000m3/day;
Sheldon-Arleta Landfill, Los Angeles, USA. The measured flow rate at the 30m deep
landfill (3 million ton refuse content) at Sheldon-Arleta was about 96,000m3/day. It is
estimated that the local flow rate (based on comparative depths, volume and waste
stream content) would be about 14,000m3/day over a 10 year period;
A theoretical analysis of typical refuse in the USA (based on chemical composition
and capacity for methane generation) gave a peak estimate of 12m3/minute/million
ton of waste. This would translate to about 8,000m3/day. This assumes
biodegradation of all waste;
LandGEM USEPA Landfill gas model: Based on the project waste masses, the gas
generation rate using default values is 15,4000 m3/day when the final overfill is
completed and gas generation rates peak some 8 years later.
In summary, the gas volume per day is likely to be around 15,000 cubic metres per day.
There are many methods for managing landfill gas and some options are described bekow:
18.3 Landfill Gas Safety Issues
There is a common misconception that because natural gas is heavier than air and has a large
component of methane, that methane is also heavier than air at ambient temperature.
However at ambient temperatures, methane is in fact lighter than air and will not result in
plumes of methane flowing down slope during stable atmospheric conditions such as early
morning. 8 U. S. EPA Landfill Methane Outreach Project (LMOP), www.epa.gov/lmop/docs/map.pdf, 2006.
9 Intergovernmental Panel on Climate Change (IPCC), Chapter 5. Waste, IPCC Good Practice Guidance and Uncertainty
Management in National Greenhouse Gas Inventories, Corrigendum (GPGAUM-Corr.2001.01, 15 June 2001), www.ipcc.nggip.iges.or.jp./public/ gp/pdf/5-waste.pdf, 2001.
GHD | Report for Asian Development Bank – TA-8750 TIM: Preparing the Urban Services Improvement Sector Project, 5510101 | 139
Methane will simply pass through numerous locations within the cover material at the landfill (if
not intercepted and contained by a landfill gas management intervention), and simply disperse
safely into the atmosphere. Measurements taken within 100 mm of the surface of major
landfills have confirmed that methane will not accumulate and reach the explosive limits (CH4
content between about 5 and 15% with air).
The only explosions that have occurred at landfills have been as a result of voids being formed
within the waste mound. Explosions in Brazil occurred because large empty tanks were
allowed to be placed within the landfill mound and not compacted and crushed. Items which
could potentially form voids within the landfill at Tibar such as tanks, old car bodies and
whitegoods will be recycled and not allowed into the landfill to form any potentially dangerous
voids.
Therefore any landfill gas interventions should be on the basis of environmental management
rather than any concerns about safety issues.
18.4 Passive Release
18.4.1 Open Grass/Shrub Cover
The most common final rehabilitation of landfill sites is to cover the final layer of compacted
waste with 600mm of inert, generally clayey soil and promote a native grass cover with perhaps
small shrubs and occasionally naturally seeded acacias or the like.
This simple, cheap rehabilitation method is generally successful in a limited way in that the
quality of the grass and shrub cover waxes and wanes with the seasons and naturally re-seeds
itself. The majority of landfills are not excessively deep and the rate of landfill gas produced is
not sufficiently great to displace the oxygen in the soil cover and cause “grass kill”.
If this does occur locally, the rate of landfill gas production varies with many factors (particularly
water content) and local “grass kill” areas can naturally regenerate.
Under these conditions, the exposed site is not developed in any way and there are no near
surface voids in which landfill gas can accumulate. The upward or laterally seeping gas
escapes to the atmosphere, is rapidly diluted and creates no safety hazard.
18.4.2 Treed Areas
Many sites with a minimal 600mm final cover have small trees growing over them.
Most of these have developed from seeds existing within the soil cover that have germinated
after placement or seeds dropped as a result of bird movement.
Most species of tree cannot grow successfully over landfills which produce sufficient gas to
lower the soil oxygen level below about 6%. Small shallow rooted trees may survive on landfills
with a conventional 600mm soil cover or relatively short lived species may thrive, die and
naturally regenerate with no apparent difference in appearance to the landfill landscape with
time.
The passive release of landfill gas, however, through a minimal 600mm thick soil cover will
restrict the development of larger trees and hence is not conducive to a more formal/expansive
plant regeneration program associated with the final rehabilitation of the site.
140 | GHD | Report for Asian Development Bank – TA-8750 TIM: Preparing the Urban Services Improvement Sector Project 5510101
18.4.3 Future Development
Future development on the completed landfill is restricted (apart from problems with settlement)
in a passive, gravity landfill gas system in that any man made or other voids can fill with the gas
which in certain proportions is potentially explosive.
Small structures (sheds, toilets, etc.) on the ground surface would need to be protected from
landfill gas accumulation to remove this potential explosion hazard.
Walking paths, seats, open shelters and the like would be suitable.
18.5 Passive Release with Local Gas Blanket Interceptors
18.5.1 Gas Collection Blanket System Options
A gas blanket can be constructed in the upper third of the refuse mound crown to intercept
landfill gas as it traditionally rises upward through the waste mound. The gas blanket
consisting of gravel or other construction demolition material is installed in the top 1/3 of the
final refuse mound to facilitate movement of this gas. As such, the gas blanket is not required,
and in fact cannot be installed, until the landfill has operated for a number of years.
The gas blanket can be constructed from a variety of materials, some of which can be
recovered from the incoming refuse stream and others will require specific purchase. The
better graded the material, the thinner the blanket can be and still operate effectively, as shown
in Table 18.1.
Table 18-1 – Gas Blanket Options
Material Nominal Grading (mm) Blanket Thickness (mm)
Crushed rock 20 300
Granulated tyres 10 - 20 450
Shredded tyres 100 600
Broken tiles, bricks, cobbles, gravel, etc.
10 - 100 450
Concrete, bricks, tiles, gravel, etc.
10 - 200 600
Rubble, bricks, concrete, tiles, etc.
10 - 450 1 000
The gas blanket system can be either entirely passive without any venting system, or it can be
equipped with a number of gas vents which usually extend six metres above the top of the
cover material and simply vent to atmosphere passively. Alternatively a vacuum pump system
can be installed connected to the vents to maximise gas recovery, and additionally, a gas flare
can be installed if desired.
If productive reuse of the gas is proposed, then a more structured approach to gas recovery
would be required which would traditionally involve the installation of vertical gas wells
throughout the site, rather than a gas blanket intervention approach.
18.5.2 Open Grass/Shrub Cover
As discussed above, a minimal 600mm soil cover will normally allow grass and small shrubs to
grow over landfill sites.
GHD | Report for Asian Development Bank – TA-8750 TIM: Preparing the Urban Services Improvement Sector Project, 5510101 | 141
18.5.3 Treed Areas
The successful, long term growth to maturity of medium and large size trees cannot be assured
on the surface of a deep landfill which produces landfill gas.
The very large landfill at Gonese (Paris, France) is successfully growing a wide variety of trees
on its surface only because virtually all organic matter is removed from the waste stream and
landfill gas production is negligible.
Unless a similar change to the Study area waste stream is achieved, medium and large size
trees could only be successfully grown in a deeper zone of soil protected from landfill gas
infiltration and oxygen displacement.
The protection of the growing medium from landfill gas infiltration may be achieved by the use
of local gas blanket interceptors.
18.5.4 Buildings
Small buildings such as toilets and shelters may be built on a completed landfill provided rigid
foundations (to accommodate significant settlement) and a gas interceptor blanket with gravity
outlet pipes are used.
The need for such buildings at Tibar on the mound is highly unlikely.
18.6 Active Collection/Local Gas Blanket Interceptors/ Burners
This is the same as the above option but with a compressor and gas flare system installed,
rather than passive release.
18.6.1 Open Grass/Shrub Cover
Good quality, healthy grass cover with shrubs should be capable of development on a 600mm
growing medium across the landfill.
18.6.2 Treed Areas
As discussed above, suitable growth areas for trees may be established with the use of gas
interceptor blankets and outlet risers.
Some landfill gas control systems include a flare whereby the landfill gas is sucked out of the
collection zone by means of a blower fan which creates a small negative head and the
collected gas is burnt at the outlet. This suction and burn off method removes any odours.
To be effective, the methane content needs to be consistently high and the burner designed to
prevent snuff outs by wind. There are a variety of designs available on the market and a
suitable flair for the size of operation would cost in the order of USD350,000 for an enclosed
flare and with a suitable compressor and flame control system.
18.6.3 Buildings
Small buildings may be safely protected from a potentially hazardous build-up of landfill gas
beneath or within the structure by means of an interceptor gas blanket with gravity outlet as
described above.
The inclusion of a blower and burner to the system would remove any gas odour.
142 | GHD | Report for Asian Development Bank – TA-8750 TIM: Preparing the Urban Services Improvement Sector Project 5510101
18.6.4 Necessity to Burn Off Gas
In low lying or flat areas where residential development has encroached around a landfill site,
burning off the gas can be effective in removing odours on windless days. Where the sites are
elevated or are remote from residential areas, as will be the case for the Tibar site, the
provision of gravity vent riser pipes 6m high is usually sufficient to disperse the gas without
odour problems.
It is a separate consideration whether the gas should be burnt based on greenhouse gas
emissions.
18.7 Active Collection/Deep Wells/Utilisation of Energy
18.7.1 General
The extraction of landfill gas from waste fill sites by means of a field of deep wells and thence
using this gas as a fuel source has been successfully carried out in numerous locations around
the world.
The surface gravel blanket is not suitable for maximising gas recovery so an alternative
approach is traditionally adopted using vertical wells.
The standard design for these vertical wells is to have them at about a 50 metre grid pattern
spacing over the site. They are usually formed by a 200 millimetre diameter slotted pipe placed
vertically in a 900 millimetre diameter gravel wick. These are usually not installed until at least
after two or three years operation when there is sufficient waste on site to generate useful
quantities of gas and the earlier acid forming stages of the aerobic and anaerobic breakdown
have finished and methane forming bacteria dominate. Also the vertical wells usually only
extend into the top 2/3 of the final landfill height. The bottom third of the landfill is usually not
penetrated by the gas pipes so as to avoid contact with any ponded leachate.
The wells are sealed with an appropriate collar and equipped with individual well heads to allow
valve operation, sampling, etc.
Therefore with the landfill design being proposed there were be only nine gas wells that could
be installed in the finalized Stage 1 (includes sub stages A, B and C). Also in the early stages
of landfill development, there is a risk that the gas wells, which are operated under negative
pressure, would draw in oxygen as there is only daily and intermediate cover on two faces of
the cell.
The landfill gas may be totally cleaned so that it can be pumped directly into an existing natural
gas grid or it can be improved (cleaned) to a variety of levels and used to fire gas burners for
direct heat, to boil water for indirect heating or to fuel gas turbines for electricity generation.
The proposed landfill will ultimately be large but will be filled relatively slowly. With the
likelihood of long-term reduction in organic matter entering the landfill, particularly the green
waste which currently makes up over 30% of the total waste mass, the landfill will not be a
particularly efficient landfill gas producer.
If outside parties have an interest in collecting and utilising the landfill gas from the site then it
can be made available for their independent assessment and development within the
framework of the final rehabilitation plans. A small royalty to the city based on the gas
extracted could offset costs associated with the blending of the gas extraction/utilisation system
into the overall rehabilitation and development plan.
GHD | Report for Asian Development Bank – TA-8750 TIM: Preparing the Urban Services Improvement Sector Project, 5510101 | 143
If gas reuse becomes economic or mandatory in the future, then wells can be retrofitted into the
mound to maximise gas recovery rates for commercial activity or destruction by flaring.
Retrofitting vertical gas wells is not unusual but more expensive than progressive installation
during landfill development.
18.8 Gas Utilisation Economics
The evidence available appears to indicate that the income from sales of landfill gas or
electricity generated from landfill gas often does not cover the consultancy, investigation,
installation, running, maintenance, piping and other overhead costs, especially in such small
landfill operations. Even with the receipt of significant non-conventional fuel tax credits in the
USA, very large and experienced operators have made losses in this field when schemes were
installed based on poor assumptions.
Typically, one million tonnes of landfill waste emit enough landfill gas to produce either 0.7 MW
of electricity or 216 MMBtu of heat. Because waste effectively produces landfill gas for
approximately 20 years, this means that 50,000 tonnes of waste per year is required to
maintain gas production at a one million ton active landfill. This equates to approximately 140
tonnes of waste a day is capable of producing 0.7 MW of electricity. Based on the waste
projections for Dili, this means the expected waste mass going to site in 2032 will be enough to
produce approximately only 1.5 MW of electricity.
By comparison, the Payatas landfill in Manila receives approximately 1,500t/d of mixed waste
and reliably produces 2MW of electricty. An increase to 5MW is being considered by the
private sector operator.
Costs vary, but internal combustion engines smaller than 1 MW typically cost $2,300/kW to
install, with annual operation and maintenance costs of $210/kW, and engines larger than 800
kW typically cost $1,700/kW, with annual operation and maintenance costs of $180/kW.
Revenue depends on electricity buy-back rates that are specific to local electric utilities
In fact a general rule of thumb is that a municipal landfill receiving anything less than five
hundred tonnes of waste a day, and with significant organic content, will not attract commercial
interest in providing power generation facilities.
If outside parties have an interest in collecting and utilising the landfill gas from the site, then it
can be made available for their independent assessment and development within the
framework of the final rehabilitation plans.
As noted above, the well field using can be installed after a landfill cell is completed, so a
decision to have vertical wells incorporated into the design is not required at the beginning of
landfill operation.
Landfill gas will continue to be generated up to 20 years after placement.
In summary:
The proposed controlled landfill is too small to be economic for productive gas reuse
such as power generation or scrubbing to make CNG;
A possible option is progressively installing a gas blanket under the middle third of the
final cover cap to collect gas and vent through 6m high passive vents to minimise gas
odours;
If the methane is later required to be oxidised to reduce greenhouse impact, then a
gas flaring system could be installed to convert the methane component to carbon
dioxide. These units cost about $350,000 but will require careful operation for at least
144 | GHD | Report for Asian Development Bank – TA-8750 TIM: Preparing the Urban Services Improvement Sector Project 5510101
a decade until the site has sufficient mass to generate enough gas to allow the flare to
operate in a stable manner;
Vertical gas wells can be progressively installed or retrofitted to maximise gas
collection if desired and/or mandated in the future. The standard design for these
vertical wells is to have them at a 50 metre grid pattern spaced over the site. The
vents are slotted pipes 200 millimetres in diameter placed vertically in a 900 millimetre
diameter gravel wick, but only extending 2/3 of the depth of the waste. These are
usually only installed when there is sufficient waste on site to generate useful
quantities of gas for commercial uses, and the earlier acid forming stages of the
aerobic and anaerobic breakdown have finished and methane forming bacteria
dominate.
Since any one or a combination of all of the above described treatments/controls can be
implemented at a later date without detrimental effects, there is no need at this stage to make a
final decision on this matter unless it is agreed that all landfill gas emissions should be flared for
greenhouse gas limitation considerations.
For the purposes of costings, it has been assumed that vertical wells will be installed and gas
flaring system.
GHD | Report for Asian Development Bank – TA-8750 TIM: Preparing the Urban Services Improvement Sector Project, 5510101 | 145
19. Management of Specific Waste Types Management of the waste entering the site will be critical for both environmental and personnel
safety.
The presence of medical waste observed during the audit confirmed that management of
incoming waste needs improvement and the following details set out a possible approach, to be
refined during project implementation.
19.1 Summary of Waste Categories
The waste entering the Site may be categorised as follows, with some examples given;
Acceptable Wastes (General) – general household and commercial waste;
Acceptable Wastes (but Difficult) – tyres, mattresses;
Special Wastes (Sometimes Acceptable) – asbestos, liquid waste;
Prohibited Wastes – radioactive waste.
The first two categories are always accepted, but the second category requires some special
management. The third category may be acceptable based on quantities involved, actual
waste characteristics and so on, and is decided on a case by case basis. Prohibited wastes
are never allowed into the Site.
It is critical that all loads are inspected when they arrive at the Site gate or any future transfer
station in the collection system.
19.2 Acceptable Wastes (General)
The following general wastes will be accepted at the Site;
domestic solid waste, as collected by city or private vehicles on a regular basis;
acceptable commercial and industrial waste regularly collected by contractors;
garden refuse (i.e. green waste or yard waste) that may or may not be collected
separately to municipal waste;
inert waste, i.e. construction and demolition debris including concrete, timber,
masonry, bricks, etc. These should be stored separately as they can be reused for
gas collection blankets, etc.
19.3 Difficult Wastes (but always Acceptable)
Difficult wastes are those wastes that are allowed to be tipped at the Site, but require special
treatment to ensure that the best compaction/disposal is achieved. This class does not include
hazardous or dangerous wastes.
Tyres;
Mattresses;
Whitegoods (fridges, freezers or stoves);
Car bodies;
Drums.
146 | GHD | Report for Asian Development Bank – TA-8750 TIM: Preparing the Urban Services Improvement Sector Project 5510101
19.4 Special Wastes (sometimes Acceptable)
These are other wastes that may be accepted on Site, but will have to be decided on a case-
by-case basis, and would include some hazardous and dangerous waste. More details will be
provided on how to manage these materials during project implementation, such as;
Asbestos;
medical waste, including "sharps";
dead animals;
pathogenic wastes;
“dry” sludges, such as treatment plant sludges;
low level radioactive waste;
liquid waste, including paints and thinners;
toxic substances, such as acids and biocides (pesticides and herbicides); and
contaminated soil.
19.5 Prohibited Wastes
Items always unacceptable in the Site will include;
hot loads, greater than 50oC in temperature;
pressure cylinders e.g. Condemned gas cylinders, fire extinguishers;
recyclables, except to the recycling area, such as greenwaste, bulk metals or reusable demolition waste;
large volumes of liquid waste;
radioactive waste;
large containers which cannot be crushed; and
dangerous goods, such as reactive chemicals, explosives including unexploded bombs and so on. Dangerous goods are those wastes that can affect a person’s health or the environment. Some wastes appear to be safe when delivered to the Site but when tipped can react with the air, water or other wastes to form a dangerous material. Typical dangerous goods include:
Chemical wastes which can react to form dangerous gasses, liquids or solids. Chemical wastes can be either liquid or solid;
Radioactive wastes. These can come from hospitals, universities, research institutes and private companies;
Liquid wastes can be dangerous. These include oils, pesticides, solvents, paints, etc.;
Asbestos (can be safe if correctly packaged, but dangerous if dry and powdery);
Medical waste (may be safe if autoclaved or pre-treated in some other manner, but very dangerous if containing untreated used sharps and syringes).
There are many dangerous goods that can be delivered to a Site, and Site staff must be trained
to exercise extreme caution when dealing with these wastes. An Operations Manual will need
to be developed prior to operating the new landfill.
19.6 Pathogenic and Medical Waste
This material represents a very small part of the total waste stream, but is particularly
dangerous to workers and scavengers. Therefore it needs to be addressed in detail during
project implementation.
GHD | Report for Asian Development Bank – TA-8750 TIM: Preparing the Urban Services Improvement Sector Project, 5510101 | 147
Local hospitals have incinerators and reportedly have a waste segregation policy in place. The
infectious material includes general domestic waste which has come in contact with infectious
material such as cleaning equipment, as well as sharps. The simple, but effective segregation
procedure should ensure that the most dangerous components, namely the sharps and
infectious material, are sent to the incinerator on site rather than mixed with the domestic
waste. This reported segregation activity has not been confirmed, but will be reviewed during
the next stage of the project implementation.
Incinerators at the hospitals are reportedly not fully functional and the World Bank is attempting
to assist the hospitals in upgrading these items. This will be reviewed during project
implementation.
Various local small medical facilities, such as medical clinics, have inadequate facilities to
correctly handle all their special waste. This has been confirmed by some medical wastes
appearing in the waste dump locally.
The main issue of concern is sharps (needles, scalpels). Assuming that incineration is not
available, these should be managed by either:
placing in a puncture proof container, disinfected and co-disposed with refuse in a
dedicated cell at the Site; or
destroying by burning in dedicated cardboard boxes fuelled by petrol or in special
desk-top electric incinerators, for example. This is usually done at the Site of waste
generation.
The key issue is that all medical facilities must segregate their waste at source prior to
collection. That will ensure that only small quantities of the dangerous wastes are generated
for special handling.
green - biodegradable
black - non-bio, non-infectious
yellow - infectious
orange - nuclear
red - sharps
The ultimate solution is to require medical waste incinerators at the various institutions. Ash
residual could be safely co-disposed with the general refuse at the landfill. The general
requirements for a mediwaste incinerator are that the temperature should be over 1 200o
Celsius and have a residence time of 2 seconds. However, the cost would be prohibitive for
small facilities.
Due to local cost constraints, a dedicated disposal area at the Site for pre-treated medical and
other special wastes will need to be considered at this stage. An alternative is autoclaving the
hospital waste either at source or centrally at the SWM site.
In summary, infectious waste should be disinfected at the hospital or medical clinic and then
deposited in a dedicated location within the landfill cell, along with household and other
hazardous waste.
More options will be developed and refined for managing these wastes. The exceptions are the
larger hospitals which have their own waste incinerators and adequate segregation procedures
in place.
148 | GHD | Report for Asian Development Bank – TA-8750 TIM: Preparing the Urban Services Improvement Sector Project 5510101
19.7 Household Hazardous Waste
The waste inspections identified only a very small quantity of household hazardous waste in the
waste streams, such as used fluorescent tubes. Following the Information and Education
Campaign and possible implementation of basic waste segregation, all household hazardous
waste should be deposited in a dedicated cell within the landfill.
This dedicated portion of the cell would also be used to accept other appropriate hazardous
waste. The cell would usually have an operational life of only six months before it is then
covered with clay soil, and an adjacent clay trench constructed within the overall cell.
GHD | Report for Asian Development Bank – TA-8750 TIM: Preparing the Urban Services Improvement Sector Project, 5510101 | 149
20. Climate Change Issues Landfills contribute to the emission of methane once the biochemical reactions are stabilised
and the organic fraction is broken down. However, reduction of methane emissions at urban
landfills may not be cost-effective for Dili given the small waste quantities involved. The likely
quantities of landfill gas to be generated will be calculated in later stages of the project, but it is
expected that commercial recovery will not be cost effective.
Locally the main effect of climate change on Solid Waste Management will be hotter drier
summers, more intense rainfall events in the wet season and possibly more frequent/more
intense extreme weather events.
The hotter and drier summers means that grass and other vegetation planted on previously
worked areas of the controlled landfill mound may die due to lack of water and heat stress.
This will be overcome by a conscious plan to collect and pump leachate over the vegetation to
act as an irrigant. This has been done successfully at many other controlled landfills and
controlled dumps.
The more extreme wet weather events can be managed at the controlled landfill by ensuring
that the external batters are protected against erosion resulting from the higher rainfall
intensities.
The master drainage infrastructure will be sized to account for the higher rain fall intensities to
prevent stormwater runoff entering the operating cells and associated recycling areas and
stockpiles.
A further effect from the more intense storms will be a greater amount of debris damage to be
managed at the Solid Waste Management facility. This will be managed by using the chipper
to be purchased in the future to produce valuable products from any debris including any
branches and trees which are damaged during the more violent weather activities.
Alternatively a pit burner can be constructed at minimal cost to manage the additional tree and
construction timber waste coming to the landfill after the storm events.
Overall the impacts of climate change on the project infrastructure will be assessed, but initial
indications are that they will be readily manageable.
150 | GHD | Report for Asian Development Bank – TA-8750 TIM: Preparing the Urban Services Improvement Sector Project 5510101
21. Septage Treatment and Management Options 21.1 Background
Discussions with key ministries indicated some concern with the existing septage treatment
plant located at Tibar. The ministries appreciate that the current plant is possibly undersized
and underperforming, and expressed interest in integrating septage management with the
proposed upgrading of the solid waste facilities at the site.
The Dili Sanitation and Drainage Master Plan prepared by SKM in 2012 recommends that a
small bore reticulation scheme should be installed. To protect the pipe network against
ongoing blockages given that the pipes are a small diameter, septic tanks will need to be
retained between the households and the community reticulation. Therefore, there will be
ongoing production of septage for many years and as such the septage treatment plant will be
required to operate for the foreseeable future or an alternative approach developed.
Other reports provide background on septage management in Dili and are paraphrased below.
Some are still being prepared and the reporting is expected during 2015. (Mike Ponsonby,
Pers Comm)
DNSB has addressed septage treatment in Dili and constructed a facility at Tibar which
receives septage, sewage and sullage (greywater) from commercial, government and domestic
dwellings. The Tibar facility comprises a series of concrete tanks (some open, some covered)
which provide biological treatment for the total waste stream. It is relatively new having been
commissioned in 2012 but none of the mechanical equipment such as the surface aerators are
working. Furthermore discussion with the operators indicated that they do not monitor grit
build-up in the receivals area and primary tanks, nor biosolids build up in the later tanks where
biological activity would be ongoing. The operators noted that the main tasks involve general
grounds keeping roles as well as removal of the scum and crust formation in the tanks.
The final effluent discharges through an ocean outfall to the embayment near Tibar.
The Tibar facility is reportedly designed for a much lower strength waste (as measured by
COD/BOD5 and SS) than the published literature indicates is appropriate for septage or even a
mix of wastes as indicated above. The plant also includes two large blowers to add oxygen to
the partially treated waste stream, as well as provision for chemical injection. Alum is to be
added to assist sludge coagulation and settling, and chlorine is used for disinfection. During the
site visit the blowers were not functioning. New replacement blowers had been purchased.
There are still some aspects of the design that are not clear. The assumptions about the waste
stream characteristics seemed very low, but the available documentation was not particularly
informative in relation to the design parameters. Digested sludge has never been removed from
the facility and the process for doing so is not at all clear, but would seem to require shutting
down the plant in stages, draining the liquid and somehow removing the sludge for disposal
elsewhere.
There was no laboratory test data available on the raw wastewater, the effluent or the
wastewater at different stages of the treatment process.
The Tibar facility current treats about 100 m3 of wastewater daily (5 day week basis) with
approximately 20 trucks delivering septage each day.
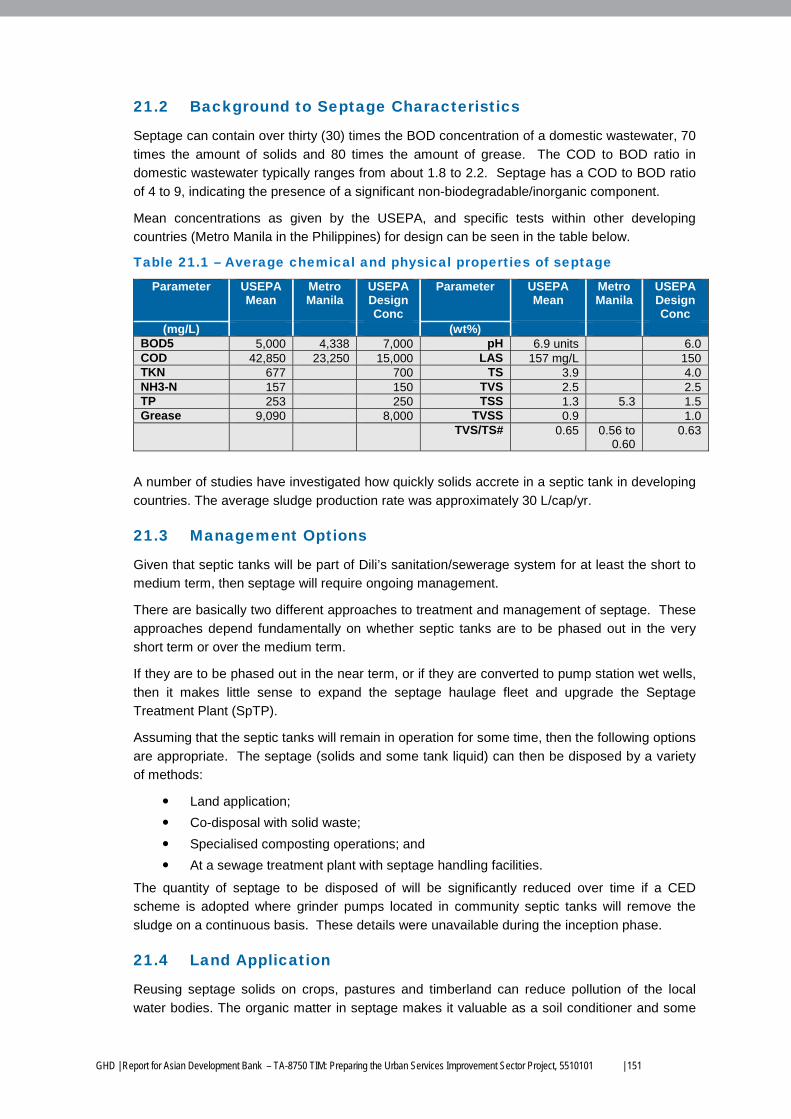
GHD | Report for Asian Development Bank – TA-8750 TIM: Preparing the Urban Services Improvement Sector Project, 5510101 | 151
21.2 Background to Septage Characteristics
Septage can contain over thirty (30) times the BOD concentration of a domestic wastewater, 70
times the amount of solids and 80 times the amount of grease. The COD to BOD ratio in
domestic wastewater typically ranges from about 1.8 to 2.2. Septage has a COD to BOD ratio
of 4 to 9, indicating the presence of a significant non-biodegradable/inorganic component.
Mean concentrations as given by the USEPA, and specific tests within other developing
countries (Metro Manila in the Philippines) for design can be seen in the table below.
Table 21.1 – Average chemical and physical properties of septage
Parameter USEPA Mean
Metro Manila
USEPA Design Conc
Parameter USEPA Mean
Metro Manila
USEPA Design Conc
(mg/L) (wt%) BOD5 5,000 4,338 7,000 pH 6.9 units 6.0 COD 42,850 23,250 15,000 LAS 157 mg/L 150 TKN 677 700 TS 3.9 4.0 NH3-N 157 150 TVS 2.5 2.5 TP 253 250 TSS 1.3 5.3 1.5 Grease 9,090 8,000 TVSS 0.9 1.0 TVS/TS# 0.65 0.56 to
0.60 0.63
A number of studies have investigated how quickly solids accrete in a septic tank in developing
countries. The average sludge production rate was approximately 30 L/cap/yr.
21.3 Management Options
Given that septic tanks will be part of Dili’s sanitation/sewerage system for at least the short to
medium term, then septage will require ongoing management.
There are basically two different approaches to treatment and management of septage. These
approaches depend fundamentally on whether septic tanks are to be phased out in the very
short term or over the medium term.
If they are to be phased out in the near term, or if they are converted to pump station wet wells,
then it makes little sense to expand the septage haulage fleet and upgrade the Septage
Treatment Plant (SpTP).
Assuming that the septic tanks will remain in operation for some time, then the following options
are appropriate. The septage (solids and some tank liquid) can then be disposed by a variety
of methods:
Land application;
Co-disposal with solid waste;
Specialised composting operations; and
At a sewage treatment plant with septage handling facilities.
The quantity of septage to be disposed of will be significantly reduced over time if a CED
scheme is adopted where grinder pumps located in community septic tanks will remove the
sludge on a continuous basis. These details were unavailable during the inception phase.
21.4 Land Application
Reusing septage solids on crops, pastures and timberland can reduce pollution of the local
water bodies. The organic matter in septage makes it valuable as a soil conditioner and some
152 | GHD | Report for Asian Development Bank – TA-8750 TIM: Preparing the Urban Services Improvement Sector Project 5510101
of the nutrients found in septage may be used as crop fertilizer. The nutrient content of the
septage should be considered when developing an overall nutrient management plan to ensure
that nutrients do not overload the soil capacity and then runoff or leach into the local water
environment resulting on eutrophication.
In some countries, the contractor is allowed to freely mix quick lime to a septage truck until a
high pH is attained (typically pH 12 for more than 30 minutes). The treated septage can
subsequently be land disposed to approved areas. Application rates depend on the slope, soil
type, the depth of application, drainage class, and hydraulic loading. Land disposal can also be
prescriptive in the amount allowed per area. Some countries for instance allow septage
disposal only to the extent of 35kL /hectare /year.
However, unless the farming community is willing to substantially sponsor transport costs, land
application for disposal of septage from large urban centres is rendered impractical by the cost
of transport.
21.5 Co-disposal with Solid Waste
Co-disposal of septage can be a viable alternative for urban centres. Septage can provide
microorganisms for degradation of the organic waste. When septage is added to a sanitary
landfill the production of leachate, treatment, and odour must be considered. Septage is not
recommended to be disposed of in landfills that:
receive over 90 cm of annual rainfall;
do not have leachate prevention and control facilities; or
do not have isolated underlying rock or clay strata.
Other common landfill acceptance criteria include not adding more than 5% liquids to the solid
waste stream. This would be the limiting factor at Tibar which currently receives approximately
700 cubic metres of waste a day pre compaction, reducing to approximately 300 cubic metres
of compacted waste. Five percent of this would only equate to 15 kl per day or approximately
15% of the septage quantity to be managed.
In general, sanitary landfills are not cost-effective disposal options for septage, but may be
appropriate to manage any excess biosolids generated in the septage treatment plant that
cannot be productively reused either as:
a nutrient rich additive to compost plants treating green waste; or
following a 12 month with holding period to inactivate pathogens, the biosolids could
be applied to agricultural land. The grit and primary solids recovered from the initial tanks could be drained and disposed into the landfill however, as per common practice globally.
21.6 Specialised Composting Operations
Composting is only a feasible option for septage treatment where bulking agents (cuttings,
grass, garden waste, other carbon rich organic material) are available and the humus product
can be used as a soil conditioner.
If the necessary bulking agents are not readily accessible, this method can be expensive. In
Dili, solid waste is not segregated so there is no green waste stream consisting of yard
sweepings, lawn clippings and tree branches. Therefore there is no access to a free or even
inexpensive source of carbon from greenwaste. Separating out greenwaste or dry paper from
comingled solid waste would be prohibitively expensive and could result in foreign objects
GHD | Report for Asian Development Bank – TA-8750 TIM: Preparing the Urban Services Improvement Sector Project, 5510101 | 153
getting into the resulting compost, with associated legal issues for the city or the landfill
operator if privatised.
However one option being proposed is to separate the green waste at source which would
allow facilities such as H3 R to expand their composting operations with green waste assuming
that a suitable and sustainable market is developed.
It is always preferable to dewater septage before composting, either with a decanting centrifuge
or screw press. Automatic composting machines are commercially available. However basic
open plan drying beds with a drainage medium underneath may be the only practical option.
21.7 Centralised Septage Treatment Plant (SpTP)
A number of technologies (i.e. processes) can be employed to affect treatment, including:
Stabilisation lagoon;
Chlorine oxidation;
Aerobic digestion;
Anaerobic digestion;
Chemical treatment;
A combination of the above.
In most instances it is preferable to dewater the solids to ease handling and to reduce transport
costs. Septic solids can typically be dewatered to at least 30% solids. These solids are highly
infectious and should be “stabilised” to reduce pathogens and putrescibility. Treatment options
for stabilising the solids include:
Addition of lime or other alkaline agents;
Drying beds;
High temperature composting; and
Vermicomposting (use of worms).
The existing plant only satisfies a few of the total set of treatment plant requirements.
21.8 Septage Treatment and Disposal Options Comparison
Some of the factors that influence the selection include: land availability and site conditions,
buffer zone requirements, hauling distance, fuel costs, labour costs, costs of disposal, and
other legal and regulatory requirements. These various options need to be closely examined in
a further study, particularly given the existing facility is reportedly undersized and certainly not
being operated to maximum efficiency
In the Dili region, land can be expensive so if land application was to be considered, then
septage would have to be transported out of the city to agricultural areas. This will involve long
haulage distances and therefore associated high costs. It also means that additional large non-
vacuum tankers would be required for the long distance haulage trips so that he vacuum
tankers can still operate efficiently within the city boundaries.
Rainfall during the rainy season is in excess of what the USEPA recommends for co-disposal
with solid waste, so co-disposal at landfill is not appropriate. The only material it should be co-
disposed within the landfill would be solids recovered from the septage treatment plant,
particularly the grit and fat material retained from the receivals pit and primary tankage.
154 | GHD | Report for Asian Development Bank – TA-8750 TIM: Preparing the Urban Services Improvement Sector Project 5510101
Furthermore dewatered biosolids from the later tankage which cannot be productively reused
for any reason could be disposed into the landfill cells. However the key messages is that
there is insufficient capacity within the landfill to accept the liquid septage.


![[XLS] · Web viewSummary LIFT Fire Fighting Summary-FIRE FIGHTING BOQ_PLUMBING SUMMARY PLUMBING BOQ PART E - SUBSTATION BOQ PART D- LV BOQ PART C- DG BOQ PART B-COMMON BOQ PART A-FLAT-108](https://img.pdfslide.us/doc/110x75/5b0da56a7f8b9a2f788e0961/xls-viewsummary-lift-fire-fighting-summary-fire-fighting-boqplumbing-summary.jpg)