Embed Size (px)
Citation preview
ASIAN DEVELOPMENT BANK PCR: INO 29206
PROJECT COMPLETION REPORT
ON THE
WEST JAVA URBAN DEVELOPMENT SECTOR PROJECT (Loan 1384-INO)
IN
INDONESIA
July 2005
CURRENCY EQUIVALENTS Currency Unit – rupiah (Rp)
At Appraisal At Project Completion (31 August 1995) (28 February 2003)
Rp1.00 = $0.000439 $0.000111 $1.00 = Rp2,278 Rp9,000
ABBREVIATIONS
ADB – Asian Development Bank BAPPEDA – Badan Perencanaan Pembangunan Daerah
(Regional Development Planning Agency) BAPPENAS – Badan Perencanaan Pembangunan Nasional
(National Development Planning Agency) BME – benefit monitoring and evaluation DED – detailed engineering design DGHS – Directorate General of Human Settlements DGURD – Directorate General of Urban and Rural Development EIRR – economic internal rate of return FDS – final disposal site FIRR – financial internal rate of return IDC – interest during construction KIP – Kampong Improvement Program LIDAP – local government institutional development action plan LUCF – local urban development coordination forum MIP – Market Improvement Program MOHA – Ministry of Home Affairs MPW – Ministry of Public Works MSRI – Ministry of Settlements and Regional Infrastructure O&M – operation and maintenance PCR – project completion report PDAM – Perusahaan Daerah Air Minum
(local water enterprise) PJM – Program Jangka Menengah
(midterm investment program) PUCF – provincial urban development coordination forum REPELITA – Rencana Pembangunan Lima Tahun
(five-year development plan) RIAP – revenue improvement action plan PIU – project implementation unit PMU – project management unit RRP – report and recommendation of the President SLA – subsidiary loan agreement SPAR – subproject appraisal report STP – sludge treatment plant TKPP – Tim Koordinasi Pembangunan Perkotaan
(National Coordinating Team for Urban Development) UFW – unaccounted-for water WTP – water treatment plant
WEIGHTS AND MEASURES ha – hectare km – kilometer l/s – liter per second m – meter m3 – cubic meters
GLOSSARY
Bupati – Administrative head of a kabupaten Kabupaten – The third level of government in Indonesia, a subdivision
(district) of a province Kampong – A residential area, usually for low-income classes, in a town or
a city
NOTES
(i) Before 2000, the fiscal year (FY) of the Government and its agencies ended on 31 March. Since 2000, the fiscal year has ended on 31 December. FY before a calendar year denotes the year in which the fiscal year ends, e.g., FY2000 ends in December 2000.
(ii) In this report, "$" refers to US dollars.
CONTENTS
Page BASIC DATA ii
MAP vii
I. PROJECT DESCRIPTION 1
II. EVALUATION OF DESIGN AND IMPLEMENTATION 2
A. Relevance of Design and Formulation 2 B. Project Outputs 3 C. Project Costs 7 D. Disbursements 8 E. Project Schedule 8 F. Implementation Arrangements 8 G. Conditions and Covenants 9 H. Related Technical Assistance 10 I. Consultant Recruitment and Procurement 10 J. Performance of Consultants, Contractors, and Suppliers 10 K. Performance of the Borrower and the Executing Agency 11 L. Performance of the Asian Development Bank 12
III. EVALUATION OF PERFORMANCE 12
A. Relevance 12 B. Efficacy in Achievement of Purpose 13 C. Efficiency in Achievement of Outputs and Purpose 13 D. Preliminary Assessment of Sustainability 14 E. Environmental, Sociocultural, and Other Impacts 15
IV. OVERALL ASSESSMENT AND RECOMMENDATIONS 15
A. Overall Assessment 15 B. Lessons Learned 15 C. Recommendations 16
APPENDIXES 1. Original and Revised Subprojects/Cities 18 2. Project Performance Against Project Framework 19 3. Project Outputs 24 4. Consulting Services and Training 25 5. House Connections for Water Supply 27 6. Problems Encountered with Some Project Components 28 7. Operating Data of Local Water Enterprises (PDAMs) 30 8. Project Cost 37 9. Contract Awards and Disbursements 39 10. Project Schedule 40 11. Project Organization Chart 41 12. Status of Compliance with Loan Covenants 42 13. Project Benefits and Impacts 51 14. Financial and Economic Analysis 53
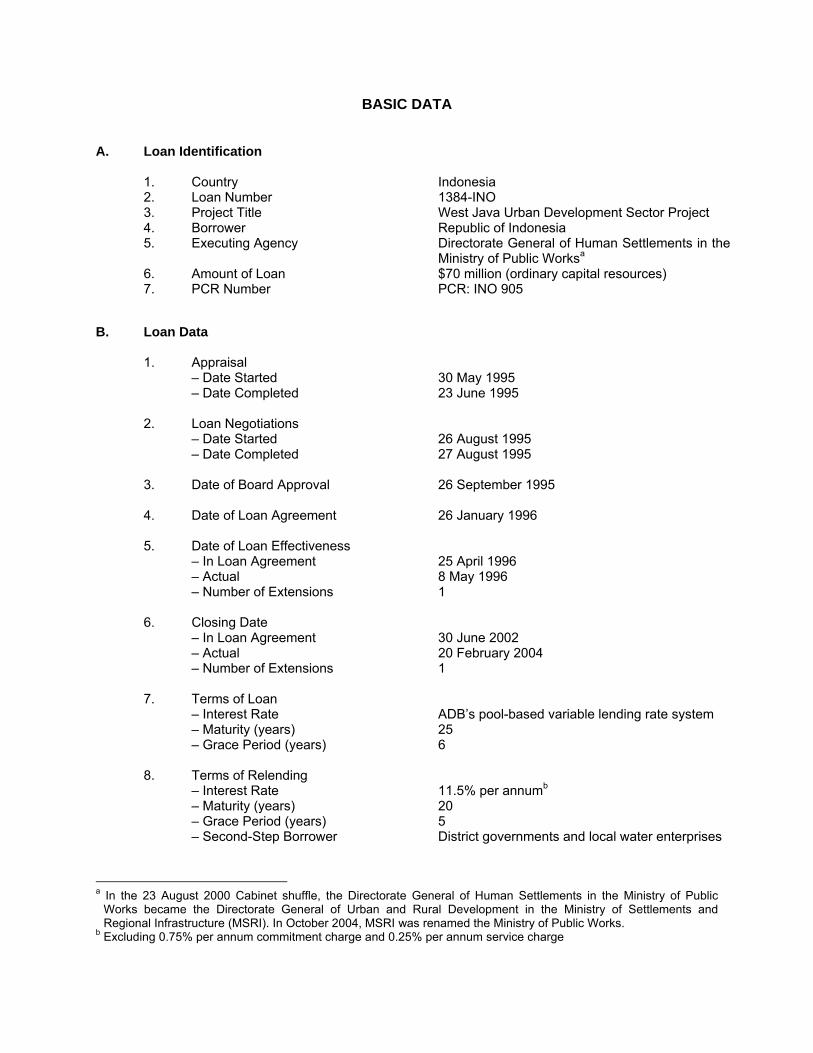
BASIC DATA
A. Loan Identification 1. Country 2. Loan Number 3. Project Title 4. Borrower 5. Executing Agency
6. Amount of Loan 7. PCR Number
Indonesia 1384-INO West Java Urban Development Sector Project Republic of Indonesia Directorate General of Human Settlements in the Ministry of Public Worksa $70 million (ordinary capital resources) PCR: INO 905
B. Loan Data 1. Appraisal – Date Started – Date Completed 2. Loan Negotiations – Date Started – Date Completed 3. Date of Board Approval 4. Date of Loan Agreement 5. Date of Loan Effectiveness – In Loan Agreement – Actual – Number of Extensions 6. Closing Date – In Loan Agreement – Actual – Number of Extensions 7. Terms of Loan – Interest Rate – Maturity (years) – Grace Period (years) 8. Terms of Relending – Interest Rate – Maturity (years) – Grace Period (years) – Second-Step Borrower
30 May 1995 23 June 1995 26 August 1995 27 August 1995 26 September 1995 26 January 1996 25 April 1996 8 May 1996 1 30 June 2002 20 February 2004 1 ADB’s pool-based variable lending rate system 25 6 11.5% per annumb 20 5 District governments and local water enterprises
a In the 23 August 2000 Cabinet shuffle, the Directorate General of Human Settlements in the Ministry of Public
Works became the Directorate General of Urban and Rural Development in the Ministry of Settlements and Regional Infrastructure (MSRI). In October 2004, MSRI was renamed the Ministry of Public Works.
b Excluding 0.75% per annum commitment charge and 0.25% per annum service charge
iii
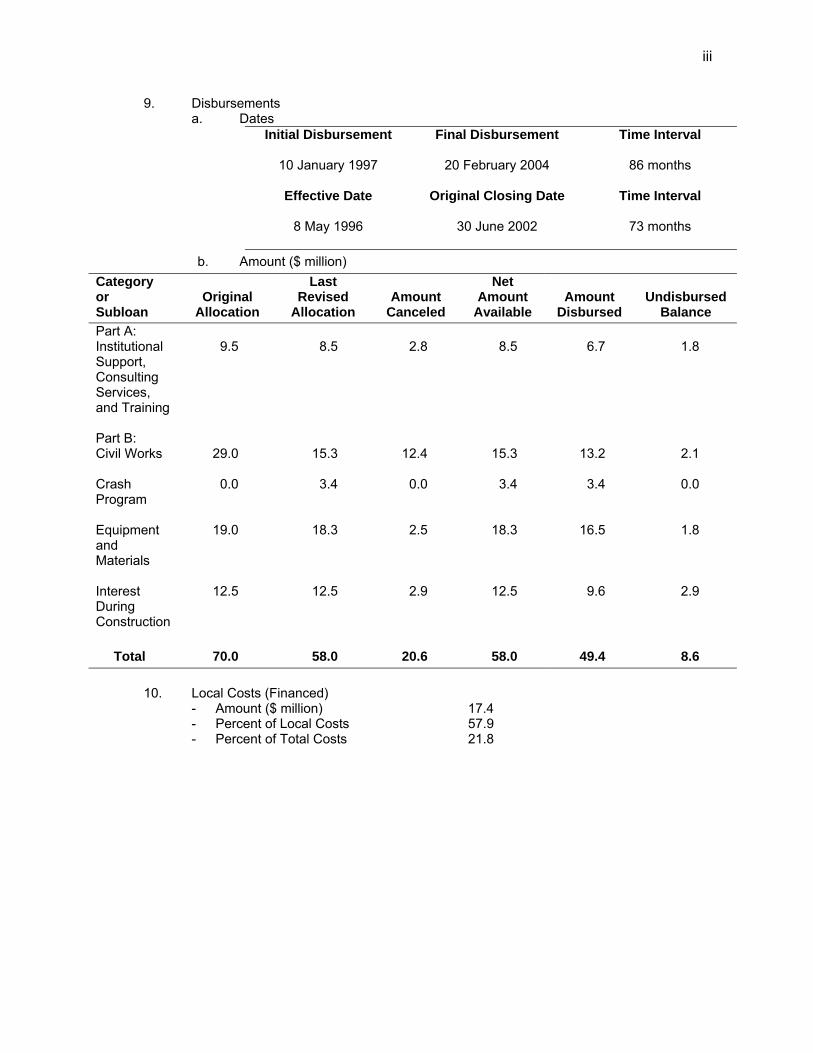
9. Disbursements a. Dates Initial Disbursement
10 January 1997
Final Disbursement
20 February 2004
Time Interval
86 months
Effective Date
8 May 1996
Original Closing Date
30 June 2002
Time Interval
73 months
b. Amount ($ million) Category or Subloan
Original
Allocation
Last Revised
Allocation
Amount
Canceled
Net Amount
Available
Amount
Disbursed
Undisbursed
Balance Part A: Institutional Support, Consulting Services, and Training Part B: Civil Works Crash Program Equipment and Materials Interest During Construction
9.5
29.0
0.0
19.0
12.5
8.5
15.3
3.4
18.3
12.5
2.8
12.4
0.0
2.5
2.9
8.5
15.3
3.4
18.3
12.5
6.7
13.2
3.4
16.5
9.6
1.8
2.1
0.0
1.8
2.9
Total 70.0 58.0 20.6 58.0 49.4 8.6
10. Local Costs (Financed) - Amount ($ million) 17.4 - Percent of Local Costs 57.9 - Percent of Total Costs 21.8
iv
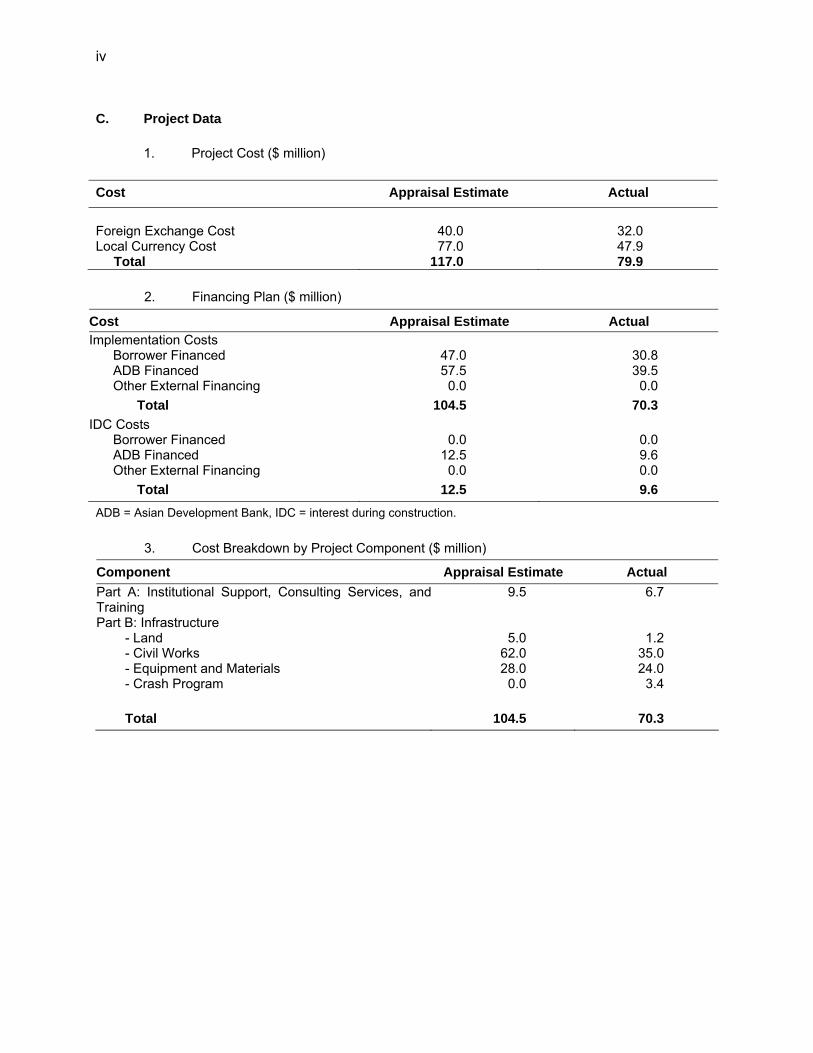
C. Project Data
1. Project Cost ($ million) Cost Appraisal Estimate Actual
Foreign Exchange Cost 40.0 32.0 Local Currency Cost 77.0 47.9 Total 117.0 79.9
2. Financing Plan ($ million)
Cost Appraisal Estimate Actual Implementation Costs Borrower Financed 47.0 30.8 ADB Financed 57.5 39.5 Other External Financing 0.0 0.0 Total 104.5 70.3 IDC Costs Borrower Financed 0.0 0.0 ADB Financed 12.5 9.6 Other External Financing 0.0 0.0 Total 12.5 9.6 ADB = Asian Development Bank, IDC = interest during construction. 3. Cost Breakdown by Project Component ($ million)
Component Appraisal Estimate Actual Part A: Institutional Support, Consulting Services, andTraining
9.5 6.7
Part B: Infrastructure - Land 5.0 1.2 - Civil Works 62.0 35.0 - Equipment and Materials 28.0 24.0 - Crash Program 0.0 3.4 Total 104.5 70.3
v
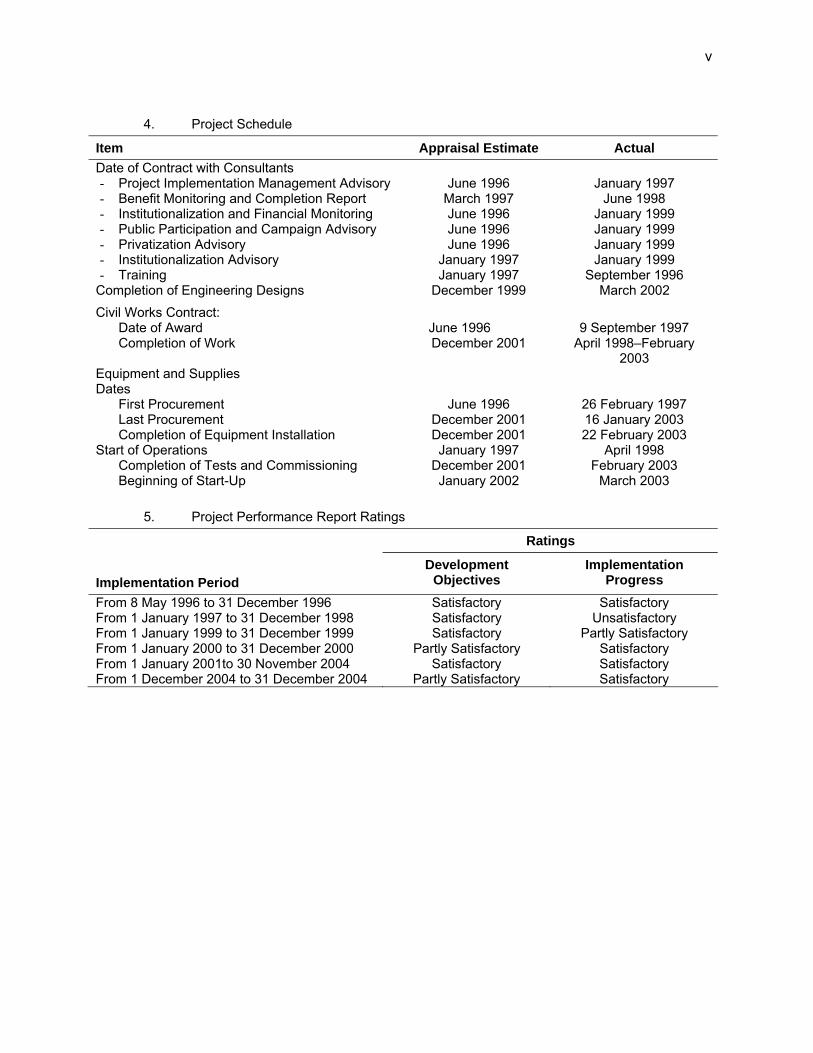
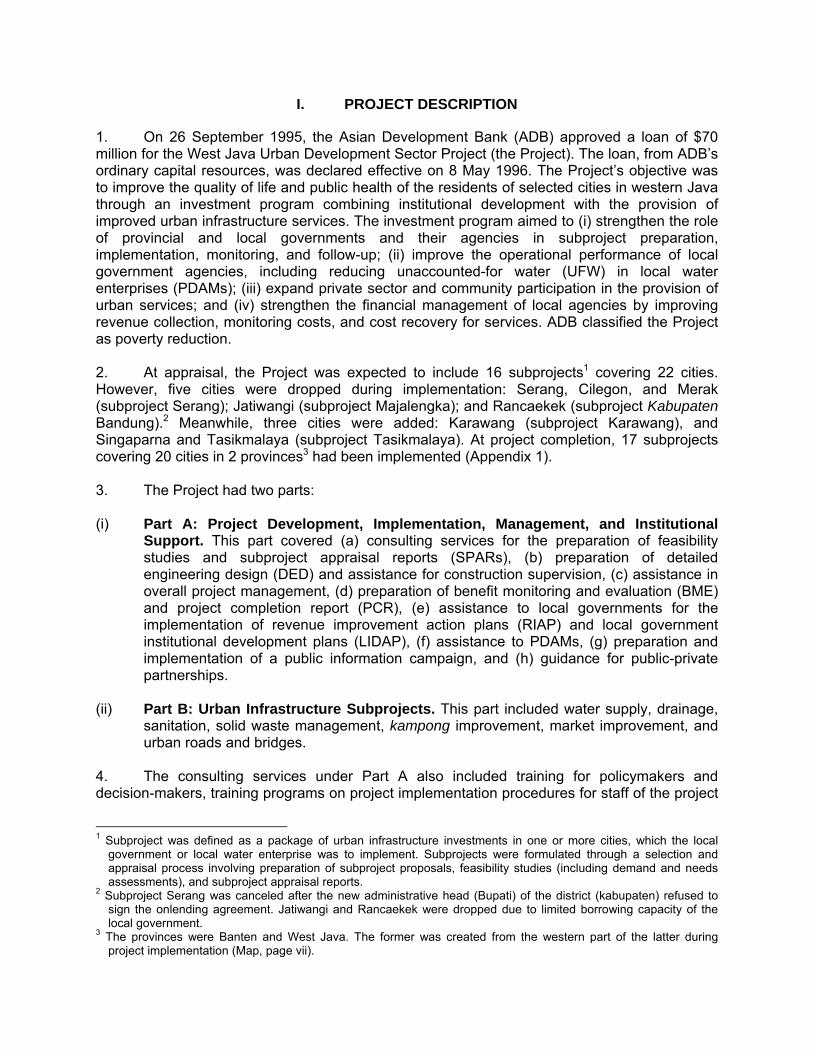
4. Project Schedule
Item Appraisal Estimate Actual Date of Contract with Consultants
- Project Implementation Management Advisory - Benefit Monitoring and Completion Report - Institutionalization and Financial Monitoring - Public Participation and Campaign Advisory - Privatization Advisory - Institutionalization Advisory - Training
June 1996
March 1997 June 1996 June 1996 June 1996
January 1997 January 1997
January 1997
June 1998 January 1999 January 1999 January 1999 January 1999
September 1996 Completion of Engineering Designs December 1999 March 2002 Civil Works Contract: Date of Award June 1996 9 September 1997 Completion of Work December 2001 April 1998–February
2003 Equipment and Supplies Dates First Procurement June 1996 26 February 1997 Last Procurement December 2001 16 January 2003 Completion of Equipment Installation December 2001 22 February 2003 Start of Operations January 1997 April 1998 Completion of Tests and Commissioning December 2001 February 2003 Beginning of Start-Up January 2002 March 2003 5. Project Performance Report Ratings
Ratings Implementation Period
Development Objectives
Implementation Progress
From 8 May 1996 to 31 December 1996 Satisfactory Satisfactory From 1 January 1997 to 31 December 1998 Satisfactory Unsatisfactory From 1 January 1999 to 31 December 1999 Satisfactory Partly Satisfactory From 1 January 2000 to 31 December 2000 Partly Satisfactory Satisfactory From 1 January 2001to 30 November 2004 Satisfactory Satisfactory From 1 December 2004 to 31 December 2004 Partly Satisfactory Satisfactory
vi
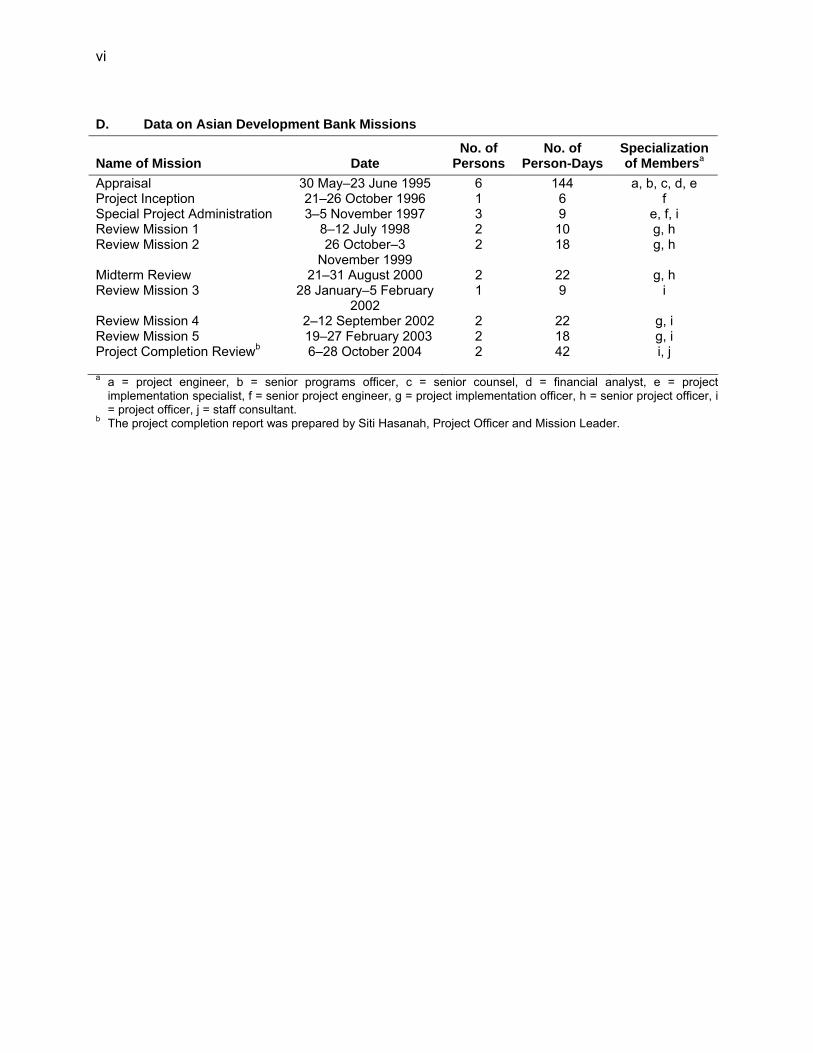
D. Data on Asian Development Bank Missions
Name of Mission
Date
No. of Persons
No. of Person-Days
Specialization of Membersa
Appraisal 30 May–23 June 1995 6 144 a, b, c, d, e Project Inception 21–26 October 1996 1 6 f Special Project Administration 3–5 November 1997 3 9 e, f, i Review Mission 1 8–12 July 1998 2 10 g, h Review Mission 2 26 October–3
November 1999 2 18 g, h
Midterm Review 21–31 August 2000 2 22 g, h Review Mission 3 28 January–5 February
2002 1 9 i
Review Mission 4 2–12 September 2002 2 22 g, i Review Mission 5 19–27 February 2003 2 18 g, i Project Completion Reviewb 6–28 October 2004 2 42 i, j a a = project engineer, b = senior programs officer, c = senior counsel, d = financial analyst, e = project
implementation specialist, f = senior project engineer, g = project implementation officer, h = senior project officer, i = project officer, j = staff consultant.
b The project completion report was prepared by Siti Hasanah, Project Officer and Mission Leader.
LABUHAN
PANDEGLANG
RANGKAS BITUNG
BEKASI
CIBINONG
CIANJUR
SUKABUMI
BOGOR
TANGERANG
GARUT
MAJALENGKA
SUMEDANG
CIREBON
INDRAMAYU
KUNINGAN
SUBANG
CIAMISSANJAR
SingaparnaTASIKMALAYA
PURWAKARTASUBANG
KARAWANG
Ciasem
Suka Mandi
Pusaka Nagara
PamanukanEretan
AnjatanBinong
Pagaden Baru
Arja Winangun
KapetakanGegesik
BalanganLosarang
Kandang Haur
Katang Ampel
Jati BarangHaur Geulis
Cikatamas
Cijulang
Parigi
Cikalong
Salosa
Banjar Sari
Pada Herang
Kali Pucang
Pangandaran
Ciawi Geban
Cibingbin
Kanci Lemang Abang
Losari
Ciledo
Sagala Herang
CisalakBuah Dua
Tanjung Sari
Cicalengka
Majalaya
BANDUNG
SERANG
Cibatu Malangbong
Ciawi
Cisaga
Rancah
Kawali
Panwangan
Cikijing
Tiaga
Linggar Jati
CitimusBeber
Sumber
Palimanan
Palimanan
Prapatan
Maja
Kadipatan
Cikelet
Pameungpeuk Bantarkalong
Cipatujah
Karang Nunggal
Cibalong
Soreang
CikajangSalawu
Suka Raja
Singaparna
Cicurug
Ciemas
Palabunhanratu
Lengkong
Jampang Kulon
Surade
Ujung Genteng
CisolokCibadak
Cibinong
Sindang Barang
Cidaun
Pagelang
Suka Nagara
Cibeber
Pada Larang
Kadu Pandak
Sagaranten
Nialindung
Talaga
Sindang Kerta
Ciwide
Soreang
Pangalengan
Cisewu
Bung Bulang
Cimari
Sindang Laya
Cipanas
CisaruaClawi
Cibarusa
Jonggol
Tambun
PedesBatu Jaya
Rengas Dengklok
Cilamaya
Jatisari
Kali Jati
Pleret
Cikalong Wetar
Lembang
Cimahi
Cariu
Tegal
SariSerpong
Ciampea
Leuwiliang
Jasinga
Tanjung Pook
Cipanas
Depok
Parung
I N D O N E S I A
WEST JAVA URBAN DEVELOPMENT SECTOR PROJECT(as completed)
Par
ago
Ci. Tarum
Ci. Sadane
Ci. Durian
C.i.
Tar
ik
Ci. Latuh
Ci. Kaso
C.i. Buni
Ci. Sadea
Ci.
Sok
a
Ci. Koa
Ci.
Laki
Ci. Herang
Ci. Kan
dang
Ci. K
aingan
Ci W
ulan
Ci Seel
Ci Lutung
6 00'S
7 30'S 7 30'S
o
o o
6 00'So
106 00'E
106 00'E 106 00'E
108 00'E
o
o o
o
0o
0o
130 00'Eo
130 00'Eo
110 00'Eo
110 00'Eo
10 00'So
10 00'So
5 00'No5 00'N
o
N
National Capital
Provincial Capital
City Government
District Capital
Subdistrict Capital
International Airport
Domestic Airport
Port
National Road
Provincial Road
Railway
River
Lake
District Boundary
Provincial Boundary
International Boundary
Boundaries are not necessarily authoritative.
0 10 15 20 25 30
Kilometers
JAKARTA
I N D O N E S I A
JAKARTA
PROJECT AREA
IRIAN
J A V A
SULAWESIK A L I M A N T A NS U M A T R A
BRUNEI DARUSSALAM
MALAYSIA
TIMOR-LESTE
04
-50
51
RM
vii
B A N T E N
C E N T R A LJ A V A
W E S T J A V A
J a v a S e a
I N D I A N O C E A N
J a v a S e aB a n d a S e a
A r a f u r a S e a
I N D I A NO C E A N
S o u t h C h i n a S e aP A C I F I C
O C E A N
C e l e b e sS e a
I. PROJECT DESCRIPTION
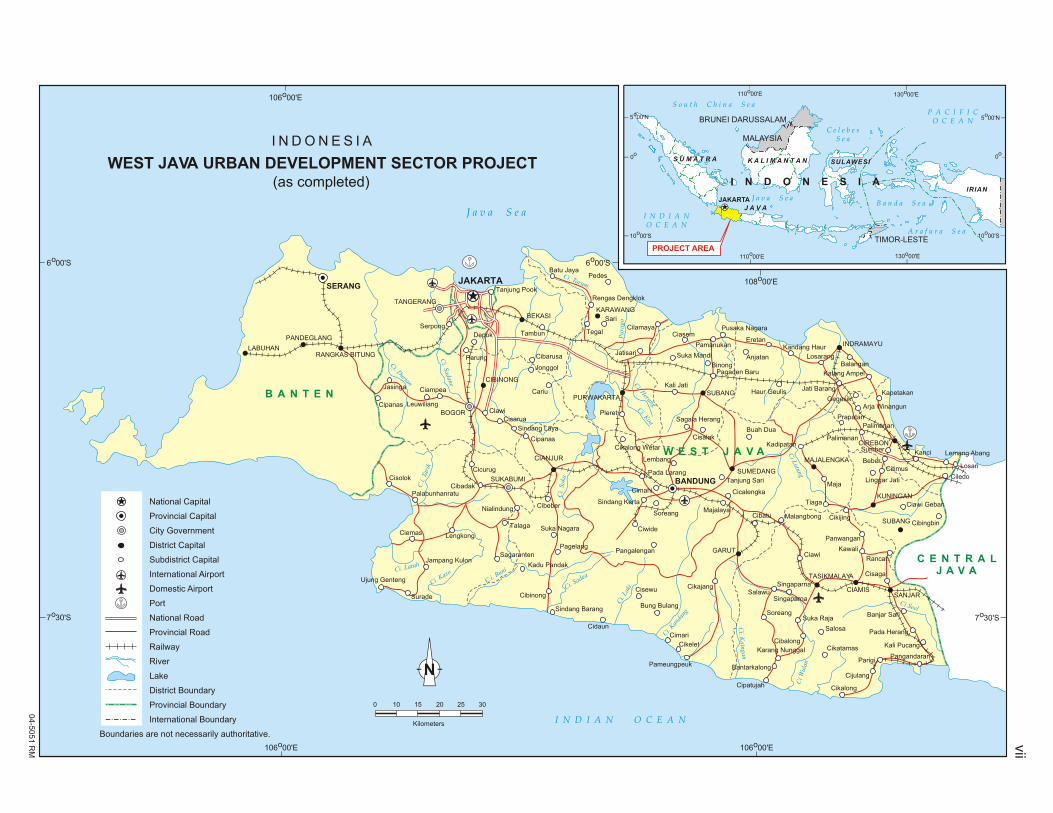
1. On 26 September 1995, the Asian Development Bank (ADB) approved a loan of $70 million for the West Java Urban Development Sector Project (the Project). The loan, from ADB’s ordinary capital resources, was declared effective on 8 May 1996. The Project’s objective was to improve the quality of life and public health of the residents of selected cities in western Java through an investment program combining institutional development with the provision of improved urban infrastructure services. The investment program aimed to (i) strengthen the role of provincial and local governments and their agencies in subproject preparation, implementation, monitoring, and follow-up; (ii) improve the operational performance of local government agencies, including reducing unaccounted-for water (UFW) in local water enterprises (PDAMs); (iii) expand private sector and community participation in the provision of urban services; and (iv) strengthen the financial management of local agencies by improving revenue collection, monitoring costs, and cost recovery for services. ADB classified the Project as poverty reduction. 2. At appraisal, the Project was expected to include 16 subprojects1 covering 22 cities. However, five cities were dropped during implementation: Serang, Cilegon, and Merak (subproject Serang); Jatiwangi (subproject Majalengka); and Rancaekek (subproject Kabupaten Bandung).2 Meanwhile, three cities were added: Karawang (subproject Karawang), and Singaparna and Tasikmalaya (subproject Tasikmalaya). At project completion, 17 subprojects covering 20 cities in 2 provinces3 had been implemented (Appendix 1). 3. The Project had two parts: (i) Part A: Project Development, Implementation, Management, and Institutional
Support. This part covered (a) consulting services for the preparation of feasibility studies and subproject appraisal reports (SPARs), (b) preparation of detailed engineering design (DED) and assistance for construction supervision, (c) assistance in overall project management, (d) preparation of benefit monitoring and evaluation (BME) and project completion report (PCR), (e) assistance to local governments for the implementation of revenue improvement action plans (RIAP) and local government institutional development plans (LIDAP), (f) assistance to PDAMs, (g) preparation and implementation of a public information campaign, and (h) guidance for public-private partnerships.
(ii) Part B: Urban Infrastructure Subprojects. This part included water supply, drainage,
sanitation, solid waste management, kampong improvement, market improvement, and urban roads and bridges.
4. The consulting services under Part A also included training for policymakers and decision-makers, training programs on project implementation procedures for staff of the project
1 Subproject was defined as a package of urban infrastructure investments in one or more cities, which the local
government or local water enterprise was to implement. Subprojects were formulated through a selection and appraisal process involving preparation of subproject proposals, feasibility studies (including demand and needs assessments), and subproject appraisal reports.
2 Subproject Serang was canceled after the new administrative head (Bupati) of the district (kabupaten) refused to sign the onlending agreement. Jatiwangi and Rancaekek were dropped due to limited borrowing capacity of the local government.
3 The provinces were Banten and West Java. The former was created from the western part of the latter during project implementation (Map, page vii).
2
management unit (PMU) and project implementation units (PIU), and master’s degree programs on sanitary engineering and developmental studies for staff of the Ministry of Settlements and Regional Infrastructure (MSRI). 5. The water supply component of Part B involved the installation of new water treatment plants (WTPs), each with a capacity of 1,050 liters per second (l/s), and spring works (broncaptering) with a capacity of 575 l/s. In addition, more than 95,000 new house connections were provided. Under the drainage component, about 84 kilometers (km) of drains were rehabilitated, and 22 km of new drains were constructed. Under the urban road component, about 136 km of roads were improved, 40 km of roads were rehabilitated, and 13 km of roads were constructed. Under the solid waste management component, 13 final disposal sites (FDSs) were rehabilitated and/or constructed, and heavy equipment (e.g., dump trucks, arm-roll trucks, excavators, and bulldozers) was procured. Under the sanitation component, six sludge treatment plants (STPs) were constructed. Under the Kampong Improvement Program (KIP), basic infrastructure in 56 kampong locations covering 452 hectares (ha) was improved or constructed. Under the Market Improvement Program (MIP), two markets were rehabilitated.
II. EVALUATION OF DESIGN AND IMPLEMENTATION
A. Relevance of Design and Formulation
6. The Project was designed in line with the urban sector and development priorities of the Government’s Sixth Five-Year Development Plan (REPELITA VI). Specifically, it aimed to support regional socioeconomic development by strengthening the institutional and financial capacities of the participating provincial and local governments and PDAMs. Public-private sector cooperation and community partnership also were encouraged. The Project also conformed with ADB’s sector strategy for Indonesia (1995), which focused on (i) improving services with special attention to the poor and urban productivity, (ii) improving the effectiveness of investments through better planning and building the capacity of local governments, and (iii) enhancing community participation and public-private cooperation. The project design incorporated the lessons learned (para. 9) from the predecessor project, the Secondary Cities Urban Development Project.4 The project framework is in Appendix 2. 7. REPELITA VI established targets for increasing the coverage of urban infrastructure services: (i) for piped water supply from 40% to 59%, (ii) for sanitation from 44% to 51%, and (iii) for solid waste management from 40% to 46%. REPELITA VI also included provisions for the KIP, MIP, and roads and drainage programs. The Project supported the Government’s objectives by providing additional resources to move towards these targets in selected cities. 8. At appraisal, a sector approach was considered appropriate for several reasons. First, it would allow flexibility in subproject selection, thereby enhancing ownership by the beneficiaries. Second, a proven national policy framework for integrated urban infrastructure development was in place. Third, the participating local governments would implement local investment programs as included in their respective midterm investment programs (PJMs). The Project was expected to help local governments and PDAMs (i) adopt a more demand-responsive approach, (ii) improve their operations, (iii) mobilize more resources, (iv) increase private sector
4 ADB. 1989. Report and Recommendation of the President to the Board of Directors on Proposed Loans to the
Republic of Indonesia for the Secondary Cities Urban Development (Sector) Projects. Manila.
3
involvement and community participation, and (v) apply appropriate technology and low-cost solutions. 9. In assessing the lessons learned from previous similar operations, the Report and Recommendation of the President (RRP)5 noted that the experience with two earlier urban projects6 pointed out the need to (i) include a UFW program in the water supply component; (ii) emphasize institutional development more, and closely monitor tariff increases; (iii) meet local priority needs; (iv) enhance public-private cooperation; (v) address environmental and health problems; (vi) target the urban poor; and (vii) shift the integrated urban infrastructure development from a supply-driven to a demand-driven approach. The RRP stated that these lessons were incorporated in the design of the Project. 10. During project preparation, ADB and the Government discussed policies to improve the efficiency of service delivery and mobilize more local resources. Major issues addressed during the dialogue were (i) decentralization, (ii) local resource mobilization, (iii) credit financing, (iv) private sector participation, and (v) PDAM performance. The Project supported decentralization by incorporating training for local governments and PDAMs, allowing them to improve their management of urban infrastructure services. Decentralization also helped them plan and carry out their priority urban infrastructure investments within agreed arrangements. The appraisal of subprojects was strengthened through detailed analysis of the proposed institutional and financial arrangements, and improved resource mobilization in terms of pricing, taxation, cost recovery, and operation and maintenance (O&M). Under the Project, the Government evaluated the potential for public-private sector cooperation in the provision of selected services. The Project provided assistance for the improvement of financial management, operational and service efficiency of PDAMs, and UFW reduction. 11. A set of technical, financial, and economic criteria was applied for the selection of subprojects and cities to be covered by the Project. The criteria prioritized (i) urban areas with significant population growth, economic growth potential, and infrastructure deficiency; (ii) local governments and PDAMs that had sound O&M, a UFW reduction program, and strong commitment to the Project; (iii) subprojects ready for investment consideration, with completed PJMs, feasibility studies, and DEDs; (iv) cities with populations of more than 20,000; and (v) cities actively seeking private participation, or willing to initiate such a mode for investment. B. Project Outputs
12. Soon after project commencement in August 1996, SPARs were prepared that set targets and specified works for each subproject and/or city. At that time, the exchange rate was Rp2,300–Rp2,400/$. However, when the Asian financial crisis hit Indonesia in 1997, the rupiah depreciated to as low as Rp17,000/$. Although the prices of construction materials increased significantly due to the crisis-induced inflation, the rapid currency depreciation reduced substantially the project cost in US dollar terms.
5 ADB. 1995. Report and Recommendation of the President to the Board of Directors on Proposed Loans to the
Republic of Indonesia for the Sumatra and West Java Urban Development (Sector) Projects. Manila. 6 ADB. 1981. Report and Recommendation of the President to the Board of Directors on Proposed Loan to the
Republic of Indonesia for the Semarang Water Supply Project. Manila. (Loan 547-INO, approved on 25 November 1981). ADB. 1983. Report and Recommendation of the President to the Board of Directors on Proposed Loan to the Republic of Indonesia for the Small Towns Urban Development Project). Manila. (Loan 629-INO, approved on 9 June 1983).
4
13. To address the impact of the crisis, ADB reduced the loan amount from $70 million to $58 million through two partial loan proceed cancellations in 1998 and 1999. Following these cancellations, a SPAR review was conducted in 2001 to adjust the financing plans to the reduced capacity of local governments to provide counterpart funds, and to modify the physical targets to reflect more accurately the requirements. A comparison of the physical targets in the original and revised SPARs with the actual project outputs is in Appendix 3. With the notable exception of the house connections, public hydrants, new roads, and water loss reduction, the physical targets generally were met.
1. Part A: Project Development, Implementation, Management and Institutional Support
14. Under Part A, a consortium of international consultants with a domestic consulting firm was recruited to prepare 13 SPARs.7 In addition, four domestic consortia were recruited to prepare the DED and supervise construction in four regions.8 The terms of reference were merged for overall project management assistance to the Directorate General of Urban and Rural Development (DGURD) and for implementation management assistance to provincial and local governments (regional consultants). Subsequently, a consortium of an international and two domestic consulting firms was fielded in January 1998. Another consortium of an international and two domestic consulting firms was recruited in 1998 to prepare the BME and PCR for the Project. Yet another consortium of an international and two domestic consulting firms was recruited and fielded to provide privatization advisory services. 15. In October 1999, a domestic consulting firm was fielded to prepare the RIAPs and LIDAPs. Another domestic consulting firm was fielded in 1998 to conduct a campaign for the KIP. As a continuation of this activity, a domestic consulting firm was recruited in 2001 to organize a public campaign on the use of sanitation and solid waste management facilities. Several capacity building programs also were completed successfully, including (i) training for policymakers and decision-makers at the start of the Project, (ii) training on project implementation procedures for PMU and PIU staff, (iii) a master’s degree program on developmental studies at the Bandung Institute of Technology for eight MSRI staff, and (iv) a master’s degree program on sanitary engineering by IHE Delft for an additional eight MSRI staff. Appendix 4 lists the consulting firms and their contract amounts.
2. Part B: Urban Infrastructure
a. Water Supply
16. The water supply component was implemented in 19 cities under 431 contracts. The PDAM of each city was responsible for implementation. Water supply was the largest component of the Project, representing almost 64% of the total investment under Part B (excluding land). The component focused on increasing production capacity, extending service coverage, and improving service delivery. The target of increasing production capacity was met through the rehabilitation or upgrading of spring works (broncaptering), as well as the construction of new spring works and WTPs. Spring works with a capacity of 575 l/s and WTPs, each with a capacity of 1,050 l/s, were installed. The distribution networks also were extended
7 The respective local governments prepared the remaining four SPARs. 8 Region 1 included Kabupaten Bandung, Sumedang, Garut, and Karawang; region 2 included Kabupaten Cianjur,
Sukabumi, Pandeglang, and Lebak; region 3 included Kabupaten Indramayu, Cirebon, Kuningan, Majalengka, and Subang; and region 4 included Kabupaten Tasikmalaya, Ciamis, Kota Bekasi, and Tangerang.
5
with the construction of reservoirs with a combined capacity of 28,200 cubic meters (m3), and installation of about 111 km of transmission pipes and 1,181 km of distribution pipes.
17. By contrast, the installation of new house connections fell short of the target of 150,316. Only 95,548 connections were installed, or 64% of the target (Appendix 5). The reasons for this shortfall included (i) start-up and implementation delays; (ii) change in, or problems with, raw water sources; (iii) inaccuracy of demand projections; and (iv) change in administrative jurisdiction of the targeted service area (Appendix 6). 18. In most PDAMs, the targeted UFW reduction from 53% to 25% was not achieved. In some cases, UFW levels after the Project were higher than those before the Project. In Sukabumi, for example, the UFW increased from 41% in 1996 to 59% in 2003. Similar results were observed in Kabupaten Cianjur, Sumedang, and Lebak. Appendix 7 shows the operating data of 14 participating PDAMs.9 Six of them still had a UFW level of 40% or more in 2003. Although one of the envisaged outputs of the Project contained in the RRP was a reduction in UFW by at least 20%, most of the SPARs did not include proper UFW reduction activities. Instead, the SPARs focused on the extension of transmission and distribution networks. A small portion of the investment program was allocated for water meter replacement or repairs. Some of the bulk water meters procured under the Project were such poor quality that they lasted for only a short time. The PDAMs did not try to repair or recalibrate the meters, citing their limited O&M budget and lack of skilled personnel. 19. In all cities, the investment program under the water supply component increased the available water quantity and helped ensure a normal 24-hour-a-day supply with good pressure in most areas and acceptable water quality. The standard of work was generally acceptable. In Sumedang, however, the PDAM had to rehabilitate the new WTP due to leaks, poor installment of settlers, and improper design of the filter system. At present, water supply facilities in most cities are properly managed and operated. However, the WTP in Palabuhanratu has been abandoned. In Kuningan, some valves and maintenance hole covers are rusty, and settlers and filters appear not to have been cleaned up as scheduled. A number of leaks in the pipes to and from the reservoir also were found in Kuningan.
b. Sanitation 20. The sanitation component was implemented in 12 cities under 40 contracts. In most cities, the agency for environment, city parks, and cemetery (Dinas Lingkungan Hidup, Pertamanan, dan Permakaman) was responsible for implementation. Sanitation, together with the KIP/MIP, was the smallest component in terms of cost, representing only about 2% of the total investment under Part B (excluding land). It included the construction of STPs and communal septic tanks, and the provision of sludge collection and transportation equipment. Six STPs (compared with the target of 8) and 35 communal septic tanks (45 targeted) were built, and 10 desludging/vacuum trucks (18 targeted) and 1 wastewater modular unit (1 targeted) were procured. 21. Sanitation was the least successful component of the Project for several reasons. First, demand forecasts in the SPARs were too optimistic, resulting in over-designed facilities. Second, local government staff were inadequately trained in O&M of the facilities. In some cases, those who had been trained were moved to other duties or locations. Third, a
9 The Project Completion Review Mission was unable to obtain such data from the remaining two participating
PDAMs (Kabupaten Bandung and Kota Bekasi).
6
mechanism to enforce local sanitation regulations was missing. Fourth, the O&M budget was inadequate, and supporting equipment (e.g., desludging/vacuum trucks) was lacking (Appendix 6).
c. Drainage
22. The drainage component, which accounted for about 4% of the total investment under Part B (excluding land), was implemented in 14 cities under 87 contracts. The public works agency (Dinas Pekerjaan Umum) of each city was responsible for implementation. The component included (i) rehabilitation of storm water drains, (ii) upgrading of drains to increase capacity, and (iii) construction of new facilities to reduce flooding and inundation. The original SPARs targeted about 71 km of drains for rehabilitation and 2 km for new construction. The reformulated SPARs increased these targets to about 91 km for rehabilitation and 25 km for construction. The increased targets were part of the labor-intensive crash program for civil works, which the Government launched to strengthen the social safety net and mitigate the impact of the 1997 Asian financial crisis. The achievements were slightly below the revised targets, with about 84 km of drains rehabilitated (93% of the target) and 22 km constructed (88%). 23. The drainage component helped reduce the flooding and inundation period in most cities. However, maintenance continues to be a problem, particularly for primary and secondary drains, with insufficient budget frequently mentioned as the main reason.
d. Solid Waste Management
24. The solid waste management component was implemented in 15 cities under 135 contracts. In most cities, the agency for environment, city parks, and cemetery (Dinas Lingkungan Hidup, Pertamanan, and Permakaman) was responsible for implementation. Solid waste management was the third largest component, accounting for 11% of the total investment under Part B (excluding land). It included (i) provision of equipment, vehicles, and facilities; (ii) upgrading of existing facilities and disposal sites; and (iii) construction of new disposal and recycling facilities. Under this component, 215 pieces of equipment and vehicles were procured (compared with the target of 255), and 13 FDSs were upgraded and/or and constructed (compared with the target of 14). However, the life span of smaller items, such as containers, was limited at not more than 3 years. 25. While the physical targets almost were achieved, the FDS operation fell short of expectations. All FDSs were designed and constructed as sanitary landfills10 to minimize their environmental and health impacts. However, none of them is operated as a sanitary landfill. Most are used as open dump sites. Hence, the constructed facilities to support a sanitary landfill operation have become useless. 26. Poor access roads to the FDSs, and inadequate operational roads within them, pose major problems. The poor access roads take a toll on the trucks, increasing their travel times, boosting their fuel consumption, and speeding up their deterioration. The inadequate operational roads prevent heavy equipment, such as bulldozers and excavators, from entering the FDSs. Local government’s lack of commitment to providing O&M budgets, and disputes with
10 In a sanitary landfill system, garbage is formed as a cell, usually 1 meter thick and compacted. After compaction,
the garbage is covered with soil of certain thickness. The coverage is done daily. In a control landfill, the system is the same, though the frequency of the soil coverage is reduced (1–2 times a week).
7
surrounding communities, also have undermined the outcome of the solid waste management component (Appendix 6).
e. Urban Roads
27. The urban road component was implemented in 15 cities under 117 contracts. It was the second largest component, accounting for 17% of the total investment under Part B (excluding land). Implemented by the agency for roads and bridges (Dinas Jalan dan Jembatan or Dinas Bina Marga), this component covered the construction of new roads and bridges, as well as rehabilitation and improvement of existing roads and bridges. However, because of insufficient counterpart funds and weak technical justification for some proposed sections, only 13 km (36%) of the targeted 37 km of new roads were constructed. In Palimanan, the proposed 24 km new road was not constructed, because ADB did not approve the technical justification. About 136 km of roads were improved (107% of the target of about 127 km), and about 40 km of roads were rehabilitated (95% of the target of about 42 km). As under the drainage component, the reformulated SPARs substantially increased the target for road rehabilitation and improvement as part of the labor-intensive crash program to mitigate the social impact of the 1997 Asian financial crisis. 28. The quality of the urban provincial roads works, which were implemented by the provincial agency for roads and bridges is satisfactory. The Karawang overpass is in good condition and operated well. The overpass significantly reduces the congestion in the busy railway intersection and the duration of vehicle trips to and from the toll road. The closure of the intersection to vehicles has eliminated accidents. The improvement of Jl. Cibiru-Cileunyi also has improved traffic flow in the congested southern part of Kota Bandung. Except for Jl. Garuda in Kota Tasik, the quality of local urban roads generally is poor with many badly damaged shortly after completion.
f. Kampong and Market Improvement Programs
29. The KIP/MIP component was implemented in 15 cities under 59 contracts. The KIP included the improvement of basic infrastructure in poor communities. The work covered internal footpaths, access roads and lanes, and tertiary drains. Government counterpart funds financed most of the KIP, except in some cities where ADB also provided financing. The KIP benefited 56 kampong locations (100% of the target) covering 452 ha (98% of the target). This program is believed to have increased some land values, catalyzed house improvements, and stimulated construction by some owners of vacant lots. The MIP, which also aimed to improve basic infrastructure, was implemented in Garut and Sumedang as envisaged in the revised SPARs. C. Project Costs
30. At appraisal, the project cost was estimated at $117.0 million, comprising $9.5 million for Part A, $95.0 million for Part B, and $12.5 million for interest during construction (IDC). The foreign exchange cost accounted for $40.0 million, or 34% of the total project cost. Based on the project reformulation after the 1997 Asian financial crisis, the project cost was revised to $81.7 million, comprising $6.0 million for Part A, $63.2 million for Part B, and $12.5 million for IDC. Local currency cost decreased from $77.0 million to $45.1 million, accounting for most of the reduction. The foreign exchange cost decreased only to $36.6 million. However, the foreign exchange component increased in relative terms to 45% of the total project cost.
8
31. At $79.9 million, the actual project cost was only 2% below the revised estimate. It consisted of $32.0 million in foreign exchange and $47.9 million in local currency. The actual ADB contribution was $49.4 million (62% of the total project cost), covering the entire foreign exchange cost and $17.4 million of the local currency cost. About $2.9 million in ineligible expenditures and unprocessed claims that were to be financed from the ADB loan were paid from the Government’s resources. The estimated and actual project costs, broken down by category, are in Appendix 8. 32. Ten local governments and 14 PDAMs entered into subsidiary loan agreements (SLA) with the Ministry of Finance. The combined value of the SLAs was Rp52.1 billion, with local governments accounting for Rp10.4 billion and PDAMs accounting for Rp41.7 billion. Of the total value, Rp47.8 billion was disbursed—Rp7.8 billion for the local governments and Rp40.0 billion for the PDAMs. 33. Based on the SLAs, most PDAMs should have started to repay their debts in 2000. However, most of them have been unable to fulfill their obligations, citing difficulties in meeting house connection targets, which constrained their financial performance. D. Disbursements
34. Disbursements under the ADB loan totaled $49.4 million, or 85% of the reduced loan amount of $58 million (following cancellations totaling $12 million in 1998 and 2000). Appendix 9 shows the contract amount and disbursement status as of 28 February 2003 (the loan closing date) and 20 February 2004 (the actual loan closing). The undisbursed loan balance of $8.6 million, including $2.9 million allocated for IDC, was canceled at loan closing. 35. To simplify loan administration, funds were disbursed based on ADB’s Guidelines on Imprest Funds and Statement of Expenditures (SOE) Procedures. However, as found in almost all projects employing the imprest account procedure, ADB sometimes did not replenish the special account as quickly as necessary due to delays in processing withdrawal applications. Consequently, the Government used its own resources to pay claims for payments from contractors or consultants, and then requested reimbursement from ADB. ADB did not pay project expenditures totaling about $2.9 million, either because the claims were not accompanied by the required documentation (copy of payment order, Bank Indonesia statement, etc.) or no claims were submitted to ADB for reimbursement. E. Project Schedule
36. The appraisal and actual project schedules are in Appendix 10. A number of issues, such as lack of coordination among agencies, late issuance of counterpart funds, and protracted consultant recruitment, delayed implementation. As a result, the Project was completed in February 2003 instead of December 2001, and the loan closing date was extended by 8 months from 30 June 2002 to 28 February 2003. F. Implementation Arrangements
37. In general, the implementation arrangements agreed at appraisal were followed (Appendix 11). The Directorate General of Human Settlements (DGHS) in the Ministry of Public Works (MPW), which subsequently was renamed DGURD in MSRI, was the Executing Agency (EA).
9
38. At the central level, the National Coordinating Team for Urban Development (TKPP) initially coordinated the activities. TKPP was chaired by the National Development Planning Agency (BAPPENAS), and included senior level representatives from MPW, Ministry of Home Affairs (MOHA), Ministry of Finance, and office of the State Minister of Environment. However, following the Cabinet reshuffle in 1998, TKPP became inactive and subsequently was liquidated. To reduce the negative impact of the TKPP liquidation, BAPPENAS took over the coordinating role with close assistance from DGURD. 39. To provide overall guidance, assistance, and coordination to local governments for subproject management and implementation, the provincial urban development coordination forum (PUCF) was established. The head of the Regional Development Planning Agency (BAPPEDA I) chaired the PUCF. The PMU, which acted as the secretariat of the PUCF, was responsible for (i) project programming and budgeting; (ii) supervising the RIAPs and LIDAPs, and provincial financing roles; (iii) monitoring and reporting on subproject implementation; (iv) providing guidance on contract packaging, tendering, and supervision of subproject works; (v) evaluating subproject benefits; (vi) providing technical assistance and training for local government staff; (vii) coordinating public information and community participation, and maintaining project records; and (viii) implementing PUCF decisions and polices. The PMU faced several problems during project implementation, including insufficient budget, limited office equipment, unqualified staff, and frequent transfer of staff. Consequently, the PMU did not perform its responsibilities as expected. 40. At the district and city level, BAPPEDA II was responsible for planning, programming, and budgeting. Mirroring the arrangements at the provincial level, local urban development coordination forums (LUCF) were established. The heads of BAPPEDA II chaired the LUCFs, which were responsible for coordinating all project activities within their respective jurisdictions. For each subproject, a PIU was established with responsibility for (i) updating the multiyear development program and SPAR; (ii) coordinating subproject implementation, monitoring, control, and reporting; and (iii) facilitating private sector involvement and community participation in providing urban services. Like the PMU, the PIUs faced problems with limited budget, inadequate staff qualifications, frequent staff changes, and local government intervention in PIU matters. G. Conditions and Covenants
41. The status of loan covenant compliance is in Appendix 12. Most of the covenants related to the central Government agencies were complied with, except for the submission of audited financial statements and project accounts. 42. The audited financial statement and audited project accounts for FY2003, which were due on 30 September 2004, have not been submitted to ADB. In October 2004, the EA and PMU agreed to submit statements and accounts within 1 month to the state audit agency. However, despite reminders from ADB, this has not been done. The main reasons for this noncompliance were the liquidation of the PMU after project completion, and the transfer of staff involved in project implementation. 43. Most of the covenants related to local governments were not complied with or were partly complied with. In addition to external factors, such as the economic crisis and decentralization, the main reason for this noncompliance/partial compliance was a lack of willingness to meet the covenants. Many other covenants were not complied with or were partly complied with, including those related to (i) provision of adequate counterpart funds and other
10
funding for implementing agencies (PMU and PIU), (ii) provision of sufficient O&M budget, (iii) promotion of community participation, (iv) provision of trained staff to operate and/or manage the investment (i.e., commitment of trained staff to serve in project-related agency), (v) tariff and service charge setting to meet the O&M costs and debt service, (vii) establishment of baseline data and monitoring system of project benefits, (viii) efficient use of existing assets, and (ix) arrangement for insurance of project facilities. The absence of measures to enforce compliance was the main reason for this noncompliance/partial compliance. 44. The Project had a large number of covenants, in part because some were repeated (i.e., covenants related to SPARs, O&M, and RIAP/LIDAP). For similar projects in the future, repetition of covenants, which creates confusion, should be avoided. Furthermore, measures to enforce compliance should be established and monitored closely. For example, physical implementation should be allowed only after completion of commitments. In addition, annual reconfirmation of compliance should be made a condition for the issuance of investment approvals. H. Related Technical Assistance 45. To help with the preliminary appraisal of representative subprojects and formulation of implementation arrangements for the Project, ADB provided a small-scale project preparatory technical assistance.11 Based on its findings, 16 subprojects covering 22 cities were identified as meeting the agreed technical, financial, and economic criteria (para. 10). Subsequently, the flexibility provided by the sector loan modality allowed the project scope to be modified slightly (para. 2). I. Consultant Recruitment and Procurement
46. Except for the delays, the process for engaging consultants was generally satisfactory. The recruitment of consultants was carried out in accordance with ADB’s Guidelines on the Use of Consultants. Most consultant contracts were with the EA, except for the RIAP and LIDAP consultants, who were contracted by MOHA. 47. Local governments implemented most civil works contracts. The exceptions were two urban road contracts (Jalan Cibiru-Cileunyi in Bandung and Karawang Flyover), which were under the provincial government. Since no contract reached the $3 million threshold for international competitive bidding, all civil works were awarded through local competitive bidding. For the procurement of goods, one contract was awarded through international competitive bidding, and the others through international shopping. The procurement was carried out in accordance with ADB’s Guidelines on Procurement. 48. In some cases, the procurement processes had to be repeated due to irregularities. For example, ADB recommended rebidding for the procurement of pipes in Garut and Sumedang, and procurement of pumps in Lebak. J. Performance of Consultants, Contractors, and Suppliers
49. The performance of the consultants responsible for establishing BME and preparing the PCR was partly satisfactory. The mobilization of the consultants, originally scheduled for early
11 ADB. Technical Assistance to the Republic of Indonesia for the West Java and Sumatra Urban Development
Project. Manila. (TA 2094-INO, approved on 2 June 1994.)
11
1997, was delayed until mid 1998. However, the consultants’ internal problems delayed the completion of the works even further. The benchmark surveys and establishment of indicators, which should have been completed at the early stage of the assignment period, were not finished until mid 2002—1 year before project completion. In addition, their scope of work was adjusted due to the delays, which resulted in the designed outputs not being met fully. These two problems meant that the BME activities were not an integral part of the Project. Thus, the links between inputs, activities, outputs, and outcomes were not identified. 50. The RIAP consultants produced the action plans based on MOHA’s standard RIAP guidelines, and trained the staff of local and provincial secretariats. The LIDAP consultants produced reports and conducted in-house training for line agencies. However, local government policies constrained the consultants’ recommendations. Hence, they were only marginally effective, as demonstrated by the poor operational status of the project infrastructure services. The performance of the consultants responsible for SPAR and DED preparation and construction supervision was also partly satisfactory. Overly optimistic demand projections for the sanitation and water supply components led to idle capacity of the constructed facilities, while the failure to provide necessary equipment for FDSs contributed to their operation as open dumping sites. The frequent assignment of underqualified and inexperienced consultants to supervise construction often led to unsatisfactory construction quality. The private sector advisory consultants prepared several pre-feasibility and feasibility studies. However, these studies did not produce any private sector involvement. Some PDAMs that were not covered under the consultants’ scope of work invited the private sector using schemes different from those proposed by the consultants. These schemes might be difficult to implement in the current policy environment. 51. The RRP estimated that the Project would require the equivalent of 1,807 person-months of consulting services: 972 person-months for project preparation, design, and supervision; 396 person-months for project management support; and 439 person-months for institutional development assistance. However, the PCR Mission analysis indicated that the actual consultant time was equivalent to 3,005 person-months: 1,388 person-months for the project preparation, design, and supervision; 811 person-months for project management support; and 806 person-months for institutional development assistance. The underestimation of the level of assistance required to implement the Project might have been responsible for the almost two-fold increase in the number of consultant person-months required in these three areas. The local government staff capacity probably was overestimated as well. An assessment of consultant performance indicated that it generally was only partly satisfactory, which was likely attributable to the mobilization of less qualified consultant personnel than envisaged in the RRP. Despite the increase in the number of person-months, domestic consultant services were much less expensive than envisaged due to the depreciation of the rupiah that started in 1997. Thus, the total consultancy costs remained within the allocated budget. 52. The performance of the contractors and suppliers generally was adequate. However, the quality of work was poor in some cases due to inadequate design or insufficient construction supervision. K. Performance of the Borrower and the Executing Agency
53. The 1997 Asian financial crisis, the government decentralization in 1999, and two reorganizations of the EA were notable external events that had a major impact on EA operations. Still, most targets were achieved, and the delay in project completion was not excessive. However, the project outcomes did not meet expectations fully as demonstrated by
12
the idle capacity or abandonment of some facilities. This was due, in a large part, to the poor project management practices of the EA and implementing agencies, whose institutional capacity was not improved sufficiently under the Project. Overall, the performance of the borrower and the EA was partly satisfactory. L. Performance of the Asian Development Bank
54. ADB’s project preparation was inadequate. Of the 22 cities expected to participate in the Project, only Serang—which was canceled during implementation—had its SPAR appraised. Considering the diverse range of populations, topography, cultures, and institutional capabilities of the area, this was inadequate. Consequently, the first 2 years after the loan effectiveness were devoted essentially to activities such as the preparation of SPARs and SLAs, as well as to institutional arrangements, rather than subproject implementation. Further, major deficiencies were found in most SPARs, particularly in demand surveys/projections, UFW reduction, and sanitation subprojects. As the Loan Agreement did not require real demand surveys as part of SPAR preparation, proper demand analyses were not presented. Consequently, some SPARs contained a supply-driven approach formulated to meet REPELITA VI targets, rather than the demand-driven approach, as originally designed. In addition, though UFW reduction was one of the major outputs envisaged from the water supply component, the SPARs reflected only limited UFW reduction activities (para. 18). 55. The RRP12 stated that the project design incorporated experiences from previous, similar operations. However, implementation delays and shortcomings in subproject preparation and appraisal were repeated, which diluted expected socioeconomic impacts. ADB should have made several preparatory activities prerequisites for loan negotiations, including (i) subproject selection, (ii) SPAR preparation for the first batch of subprojects, (iii) DED preparation and approval, and (iv) advance recruitment of consultants. 56. ADB’s performance during implementation was satisfactory. ADB staff identified implementation problems, and provided guidance on how to address them. In late 1997, responsibility for project administration was transferred to the Indonesia Resident Mission. The Government welcomed this move, because it made interaction between ADB, the EA, and the implementing agencies more frequent, less costly, and easier. ADB worked with the Government to ensure smooth implementation of the Project by (i) downsizing and reformulating it after the 1997 Asian financial crisis, (ii) extending the loan closing date, (iii) utilizing part of the surplus loan proceeds, and (iv) assisting the Government with problematic withdrawal applications. 57. Although a review mission was not fielded in 2001 because of security concerns, ADB’s monitoring of the Project generally was adequate with 156 staff-days used for review missions. Overall, ADB’s performance is rated partly satisfactory.
III. EVALUATION OF PERFORMANCE
A. Relevance
58. At appraisal and completion, the Project, which aimed to improve the quality of life and public health in 20 urban centers in western Java, was consistent with the Government’s urban
12 Para. 95.
13
sector policy and development priorities, as spelled out in the REPELITAs. The Project also was in line with ADB’s country and sector strategy for Indonesia. However, problems in project formulation and preparation (paras. 54–55) and implementation (paras. 39, 40, and 43) reduced the project relevance to achieving the project purpose. Yet, overall, the Project is assessed as relevant as it contributed to meeting the Government’s priority needs in the sector.
B. Efficacy in Achievement of Purpose
59. Although most of the targeted physical outputs were delivered, the project purpose was only partly achieved. Of the 5 million beneficiaries targeted at appraisal, only an estimated 3.3 million (66% of the appraisal target and 78% of the revised target) actually benefited from the Project. The urban roads component showed the highest achievement, followed by drainage, water supply, KIP/MIP, and solid waste management. Achievement in sanitation was insignificant (Appendix 13). The labor-intensive civil works (i.e., the crash program) implemented in 1997–1998 were successful in providing income opportunities to the urban poor and jobless. However, the objective of the crash program was to provide immediate, short-term employment opportunities to the urban poor and recently laid off people. As such, the program was unable to create productive and sustainable job opportunities. Hence, its effect was insignificant in improving the economic opportunities of the urban poor. 60. The intangible outputs of the Project included institutional development, community strengthening, and increased private sector participation in providing urban services. These included the LIDAP and RIAP formulations, and training of local government and PDAM staff. However, frequent transfers of trained government staff prevented the full impacts of the training from materializing. Despite plans for organizational improvement and system development under the LIDAPs, and revenue improvement under the RIAPs, the institutional structure of local governments and PDAMs did not change much. Water losses are still very high, while water tariffs of most PDAMs barely cover O&M costs. Institutional strengthening of local governments has occurred only rarely, mostly for political reasons. 61. Training also was provided for waste and sludge collection procedures, O&M of FDSs and STPs, and billing and management information systems. However, open dumping sites, limited O&M budgets, carelessness in the O&M of equipment, low revenue collection efficiency, and structurally weak agencies responsible for sanitation and solid waste management still are found in most cities. Overall, the Project is assessed as less efficacious. C. Efficiency in Achievement of Outputs and Purpose
1. Efficiency of Project Investment 62. Under the water supply component, a recalculation of the economic internal rates of return (EIRRs) was conducted for 15 PDAMs. The analysis indicated that most EIRRs for the component were above the cut-off rate of 12%. The EIRRs of PDAMs Kabupaten Ciamis, Kuningan, Garut, Lebak, and Pandeglang were about or close to the cut-off rate (ranged from 8.9% to 11.4%). Only the EIRR of PDAM Kabupaten Sukabumi was far below 12% (at 4.5%), probably due to the installation of fewer-than-expected new house connections (622 units compared with the target of 6,213). For solid waste management, KIP/MIP, drainage, and urban road components, the recalculation was conducted for six subprojects. As with the water supply component, most of EIRRs for these components were also above 12% (Appendix 14). The EIRR for the sanitation component could not be calculated, because most of the facilities built are not operational. The analysis indicated that the Project generally is economically viable.
14
63. The financial internal rates of return (FIRRs) were recalculated for the water supply component (15 PDAMs as samples). The FIRRs for 12 PDAMs ranged from –1.9% to 18.4% while FIRRs for three PDAMs could not be calculated as their net revenues were negative (Appendix 14). The FIRRs for the solid waste management and sanitation components could not be calculated either, because the net revenues for the former are negative (i.e., O&M costs are much higher than the revenue from service charges) and the latter are not being used. Although there are some financially viable subprojects that have contributed to the overall viability of the water supply component, the Project generally is not financially viable.
2. Efficiency of Process
64. Despite concerns about the quality of the SPARs, only minor revisions were made. Under the water supply component, no change was made to increase the investments for the UFW reduction—even though UFW reduction was part of the project objectives. Only a portion of the heavy equipment needed to support the operation of final disposal sites was included, and this did not arrive until the end of the Project. Reorganization of the executing and implementing agencies and frequent transfers of staff undermined coordination among involved agencies. Consequently, decision-making frequently was delayed, which in turn delayed project implementation. An insufficient administration budget and unqualified personnel provided to operate the project management and implementing agencies prevented these agencies from meeting their expected performance. Counterpart funds often were insufficient and delayed, which also affected project implementation. Thus, the Project was physically completed in February 2003, 14 months after the scheduled December 2001 completion date. The delay in mobilizing consultants, excessive use of their services (almost double the person-months envisaged), and participation of less-qualified consultants contributed to the project outcomes. The project showed cost savings (through cancellation of $20.6 million of the original loan proceeds allocation) and a positive economic rate of return. However, the financial rate of return was negative. Thus, the Project is assessed as partly efficient in achieving its purpose and outputs. D. Preliminary Assessment of Sustainability
65. Adequate O&M expenditures are crucial for the sustainability of the project impacts and benefits. Most PDAMs are losing money and not repaying their debts, because they are unable to set tariff rates high enough to cover costs. Decentralization and local autonomy have increased the financial burden on the PDAMs, which now are requested to contribute to the local income. This has reduced their financial capacity to undertake major new capital investments and provide adequate O&M. The dual functions of PDAMs—social and commercial—also reduce their financial capacity. Excessive UFW levels are another reason for their financial problems. While planned tariff increases are often postponed or reduced by local legislative coucil, PDAMs’ action plans and investment strategies sometimes do not prioritize UFW reduction. Unless the financial performance of PDAMs is improved significantly, and adequate O&M budgets are provided, the water supply component will deteriorate.
66. Most PDAMs also face problems with raw water resources. The capacity of springs and surface water (rivers) decreases during dry season. This is attributable largely to the degradation of the environment in the catchment areas through deforestation and illegal mining. This degradation also harms the quality of the surface water, requiring additional resources to meet the water quality standards. Most PDAMs, therefore, are looking for alternatives, such as deep wells. However, the use of deep wells is costly and requires proper feasibility studies to ensure sustainability.
15
67. Revenues from the solid waste collection are much lower than O&M costs. In all cities, O&M budgets are insufficient, and the local governments cannot afford the subsidies to increase them. All the STPs built under the Project have been abandoned. Overall, the sustainability of the Project is less likely. E. Environmental, Sociocultural, and Other Impacts
68. The Project produced positive environmental impacts, especially as a result of the improved water quality and services, improved solid waste collection, and reduced inundation/flood period and area. However, these impacts could have been more significant. The lack of environmental controls in FDSs affected the surrounding areas negatively. The road component improved traffic flow and decreased congestion, reducing air pollution and traffic accidents. 69. The public campaign on the use of sanitation and solid waste management facilities improved the community’s sociocultural behavior, especially regarding solid waste management. Most city residents now understand that drains are not for disposing garbage. On balance, the environmental, sociocultural, and other impacts of the Project were moderate.
IV. OVERALL ASSESSMENT AND RECOMMENDATIONS
A. Overall Assessment
70. Based on a review of its relevance, efficacy, efficiency, sustainability, and environmental, sociocultural, and other impacts, the Project is rated partly successful. B. Lessons Learned
71. The Project was too complex and geographically large. It involved seven diverse components (in their institutional setup and functioning) and 20 cities (18 local authority areas). As such, monitoring and supervision strained the limited capacity of the EA. 72. Inadequate project preparation was one of the issues that prevented full achievement of project purpose. Partly because of the limited time for preparation of the SPARs, demand projections were inaccurate, resulting in idle capacity of some project facilities. The poor preparation of the SPARs also resulted in improper operation of the facilities. Inadequate representation of the diverse social, cultural, and institutional capacity of the participating local governments was another consequence of insufficient resources invested in project preparation. The appraisal of only one SPAR for this sector loan, as a representative sample of conditions in 20 cities, was unreasonable. 73. The institutional capacities of the participating local governments to manage, operate, and maintain their investments were overestimated. As a result, the Project provided insufficient training. In addition, improper training in needs assessment produced a minimal impact on local government capacity. Intradepartmental transfer of staff limited further the effectiveness of the training. The local governments’ lack of political will to implement the institutional development scheme provided under the Project worsened the situation. The unimproved local government capacity indicated that the integrated urban development approach, which involves diverse cross-sector investment, might not be suitable for addressing governance issues at the local
16
level. Specific initiatives focusing on the institutional development and capacity building might be more suitable. 74. The limited budget and inadequate staff capacity provided for the PMU and PIUs prevented them from performing as expected. This resulted in a lack of coordination and, in some cases, poor quality of works. O&M of the completed works is a serious problem in all cities. During preparation, the participating local governments committed to providing the necessary funds. However, the funds allocated are well below the level needed to operate the services effectively, and to establish a reserve for future investments. 75. Proper tariffs and service charges to cover O&M expenditures and undertake new capital investments are crucial to the operation and sustainability of project components. Most local governments keep water tariffs low for political reasons. For solid waste management, the service charge is also low relative to O&M expenditure. An improper understanding of the nature of the service is partly responsible for this. In Indonesia, solid waste management is regarded as a public service. As such, the Government is expected to subsidize the service as much as possible. 76. Despite support from local and central governments, as well as ADB, most participating PDAMs are in a poor financial condition and have excessive water losses. The low water tariff is one key reason. The PDAMs also are managed inefficiently by those without proper experience in the water industry. The dual function of PDAMs—social and commercial—also has increased the burden on their financial capacity. 77. Proper environmental controls on the operation of solid waste disposal sites and sanitation facilities are critical to the sustainability of operations, and are needed to prevent unwanted environmental impacts on surrounding areas. In most cases, improper operation of the facilities and the absence of proper environmental controls are responsible for disputes with surrounding communities and their resistance to accepting their operations. 78. To monitor and evaluate the benefits of built facilities under a project, a proper BME system needs to be established at the local and central levels. Timely recruitment of consultants responsible for producing and testing necessary indicators and procedures is very important. Adequate investment in the institutionalization of the system is also needed. Further, training for local and central government staff must be provided to ensure that BME is maintained after the consultants hand over the system. C. Recommendations
1. Project-Related
79. Financial Sustainability. Water tariffs and charges for solid waste management and sanitation services should reflect more closely the costs involved. The PDAMs and local governments should adjust their water tariffs and service charges regularly to cover O&M costs and provide funds for future capital investments. A financial restructuring program consisting of converting long-term debt into Government equity should be considered for PDAMs to improve their cost recovery and reduce their UFW levels. 80. Project Performance Audit Report. The appropriate timing for the Project Performance Audit Report would be 2007 when data from an additional 3 years of project operation would be available.
17
2. General
81. To ensure comprehensive improvement and better monitoring and supervision, similar projects in the future should be less complex. They should involve only interrelated components and a limited number of local governments (geographically clustered together). The central Government should provide the necessary technical assistance and set priorities for intersector investment in accordance with national objectives. 82. Sufficient funds for project preparation should be invested to increase the chances of a project’s success. Reviews of the SPARs to ensure that the investment programs are in line with the project objectives are also needed. In addition, ADB should prepare a standard SPAR for guidance in the initial stages of SPAR preparation. This template should cover the standard information needed for SPAR reviews, such as background information on the existing conditions, justification of the proposed activities (e.g., demand analysis, financial and economic justifications), targeted beneficiaries, implementation arrangement, etc. 83. For similar projects in the future, local government capacity in managing, operating, and maintaining their investment must be analyzed deeply and properly to ensure that sufficient and proper training is provided. Institutional development activities should be sustained through comprehensive training programs focusing on key operational services, O&M, financial management, and business planning. Training also should emphasize acceptance of change within organizations, adequate documentation of improved systems, and training and handover procedures for new staff to minimize the impacts of staff transfers. 84. Before physical investment components financed by loan projects begin, a system should be established and enforced for monitoring local governments’ and PDAMs’ compliance with covenants and/or commitments on issues such as (i) staffing and proper budgeting for PMUs and PIUs, (ii) other institutional improvements, (iii) service charges, and (iv) O&M budgeting. In addition, annual reconfirmation of compliance should be a condition for the implementation of subsequent activities.
85. Adequacy of local regulations needs to be assessed during project design and implementation. Under this Project, the absence of local regulations to enforce proper sanitation practices has contributed to the unsatisfactory outcome of the sanitation component. Many unlicensed operators collect sludge at night and dispose of it improperly at the built STPs. Most households choose to use the services of the unlicensed operators, because their service charge is lower than that of licensed operators. This has contributed to the abandonment of the STPs. In addition, the absence of an enforcement framework has affected community behavior towards proper sanitation practices. Hence, most septic tanks were built improperly, and people are unaware that their septic tanks need to be cleaned regularly. Appropriate institutional measures on the use and charges for sanitation and disposal services need to be prepared, approved, and implemented. Additional investment under this component is not recommended until these measures have been put in place.
18 Appendix 1
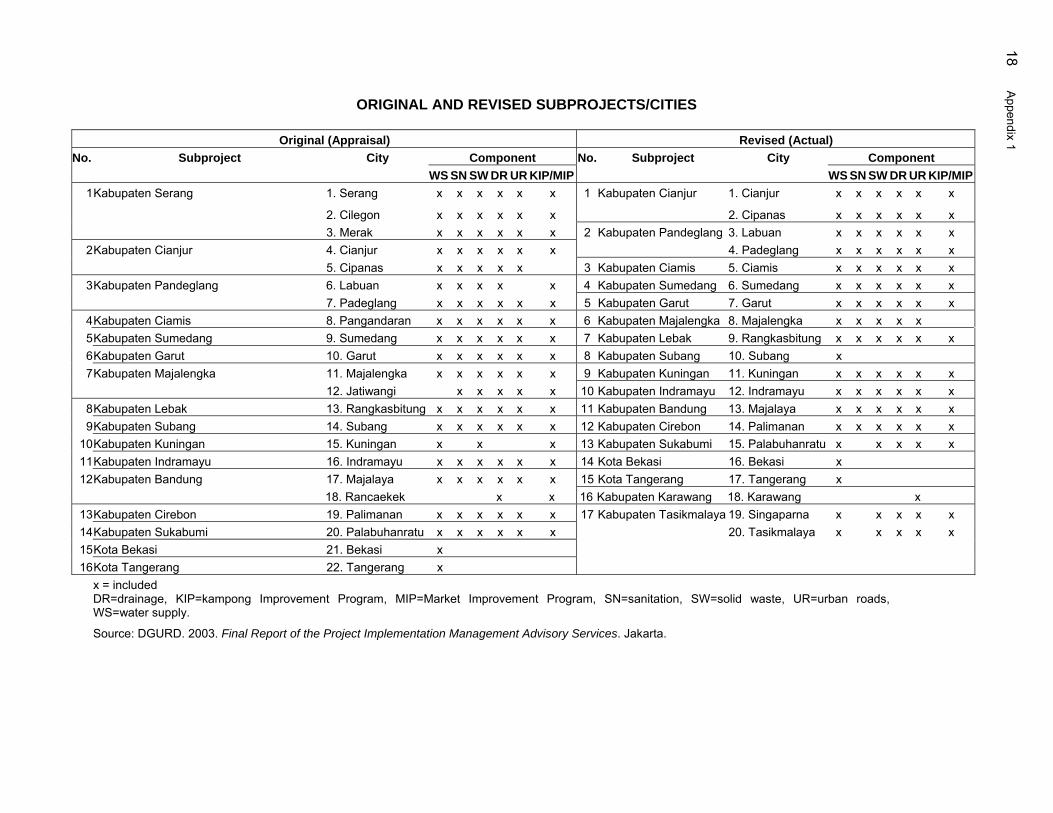
ORIGINAL AND REVISED SUBPROJECTS/CITIES
Original (Appraisal) Revised (Actual) No. Subproject City Component No. Subproject City Component WS SN SW DR UR KIP/MIP WS SN SW DR UR KIP/MIP
1 Kabupaten Serang 1. Serang x x x x x x 1 Kabupaten Cianjur 1. Cianjur x x x x x x
2. Cilegon x x x x x x 2. Cipanas x x x x x x 3. Merak x x x x x x 2 Kabupaten Pandeglang 3. Labuan x x x x x x
2 Kabupaten Cianjur 4. Cianjur x x x x x x 4. Padeglang x x x x x x 5. Cipanas x x x x x 3 Kabupaten Ciamis 5. Ciamis x x x x x x
3 Kabupaten Pandeglang 6. Labuan x x x x x 4 Kabupaten Sumedang 6. Sumedang x x x x x x 7. Padeglang x x x x x x 5 Kabupaten Garut 7. Garut x x x x x x
4 Kabupaten Ciamis 8. Pangandaran x x x x x x 6 Kabupaten Majalengka 8. Majalengka x x x x x 5 Kabupaten Sumedang 9. Sumedang x x x x x x 7 Kabupaten Lebak 9. Rangkasbitung x x x x x x 6 Kabupaten Garut 10. Garut x x x x x x 8 Kabupaten Subang 10. Subang x 7 Kabupaten Majalengka 11. Majalengka x x x x x x 9 Kabupaten Kuningan 11. Kuningan x x x x x x
12. Jatiwangi x x x x x 10 Kabupaten Indramayu 12. Indramayu x x x x x x 8 Kabupaten Lebak 13. Rangkasbitung x x x x x x 11 Kabupaten Bandung 13. Majalaya x x x x x x 9 Kabupaten Subang 14. Subang x x x x x x 12 Kabupaten Cirebon 14. Palimanan x x x x x x
10 Kabupaten Kuningan 15. Kuningan x x x 13 Kabupaten Sukabumi 15. Palabuhanratu x x x x x 11 Kabupaten Indramayu 16. Indramayu x x x x x x 14 Kota Bekasi 16. Bekasi x 12 Kabupaten Bandung 17. Majalaya x x x x x x 15 Kota Tangerang 17. Tangerang x
18. Rancaekek x x 16 Kabupaten Karawang 18. Karawang x 13 Kabupaten Cirebon 19. Palimanan x x x x x x 17 Kabupaten Tasikmalaya 19. Singaparna x x x x x 14 Kabupaten Sukabumi 20. Palabuhanratu x x x x x x 20. Tasikmalaya x x x x x 15 Kota Bekasi 21. Bekasi x 16 Kota Tangerang 22. Tangerang x
x = included
DR=drainage, KIP=kampong Improvement Program, MIP=Market Improvement Program, SN=sanitation, SW=solid waste, UR=urban roads, WS=water supply.
Source: DGURD. 2003. Final Report of the Project Implementation Management Advisory Services. Jakarta.
Appendix 2 19
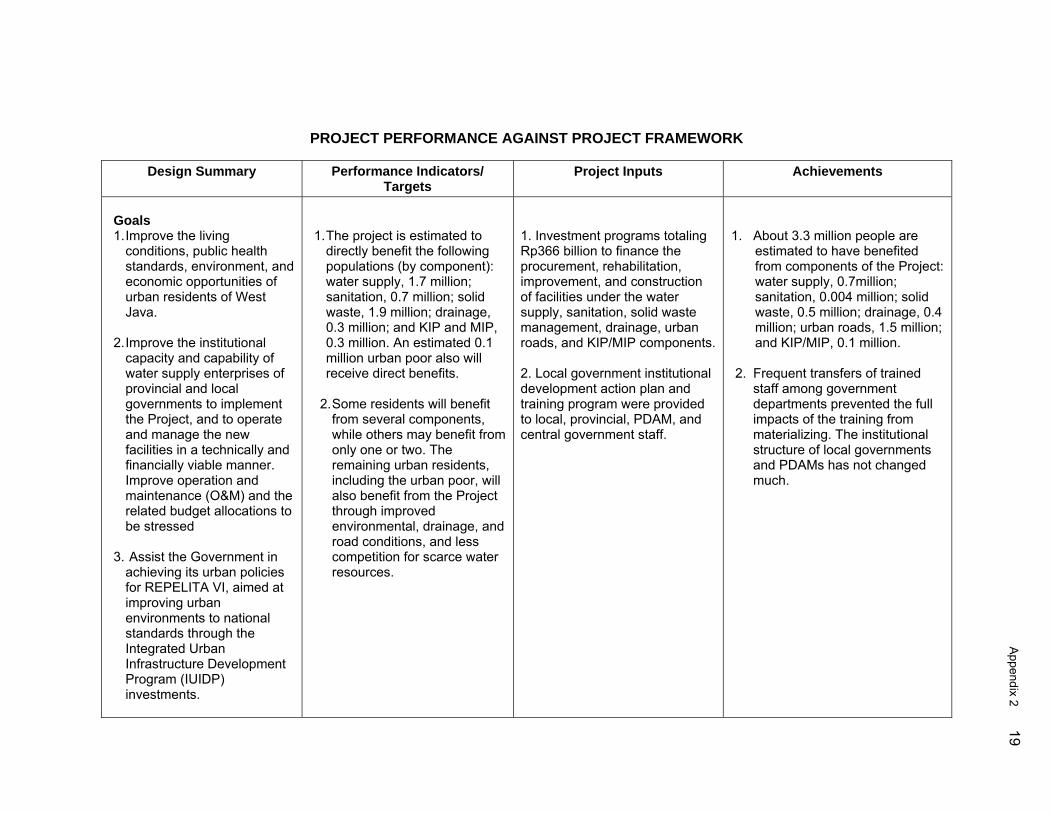
PROJECT PERFORMANCE AGAINST PROJECT FRAMEWORK
Design Summary Performance Indicators/ Targets
Project Inputs Achievements
Goals 1. Improve the living
conditions, public health standards, environment, and economic opportunities of urban residents of West Java.
2. Improve the institutional
capacity and capability of water supply enterprises of provincial and local governments to implement the Project, and to operate and manage the new facilities in a technically and financially viable manner. Improve operation and maintenance (O&M) and the related budget allocations to be stressed
3. Assist the Government in
achieving its urban policies for REPELITA VI, aimed at improving urban environments to national standards through the Integrated Urban Infrastructure Development Program (IUIDP) investments.
1. The project is estimated to
directly benefit the following populations (by component): water supply, 1.7 million; sanitation, 0.7 million; solid waste, 1.9 million; drainage, 0.3 million; and KIP and MIP, 0.3 million. An estimated 0.1 million urban poor also will receive direct benefits.
2. Some residents will benefit
from several components, while others may benefit from only one or two. The remaining urban residents, including the urban poor, will also benefit from the Project through improved environmental, drainage, and road conditions, and less competition for scarce water resources.
1. Investment programs totaling Rp366 billion to finance the procurement, rehabilitation, improvement, and construction of facilities under the water supply, sanitation, solid waste management, drainage, urban roads, and KIP/MIP components. 2. Local government institutional development action plan and training program were provided to local, provincial, PDAM, and central government staff.
1. About 3.3 million people are estimated to have benefited from components of the Project: water supply, 0.7million; sanitation, 0.004 million; solid waste, 0.5 million; drainage, 0.4 million; urban roads, 1.5 million; and KIP/MIP, 0.1 million.
2. Frequent transfers of trained
staff among government departments prevented the full impacts of the training from materializing. The institutional structure of local governments and PDAMs has not changed much.
20 Appendix 2
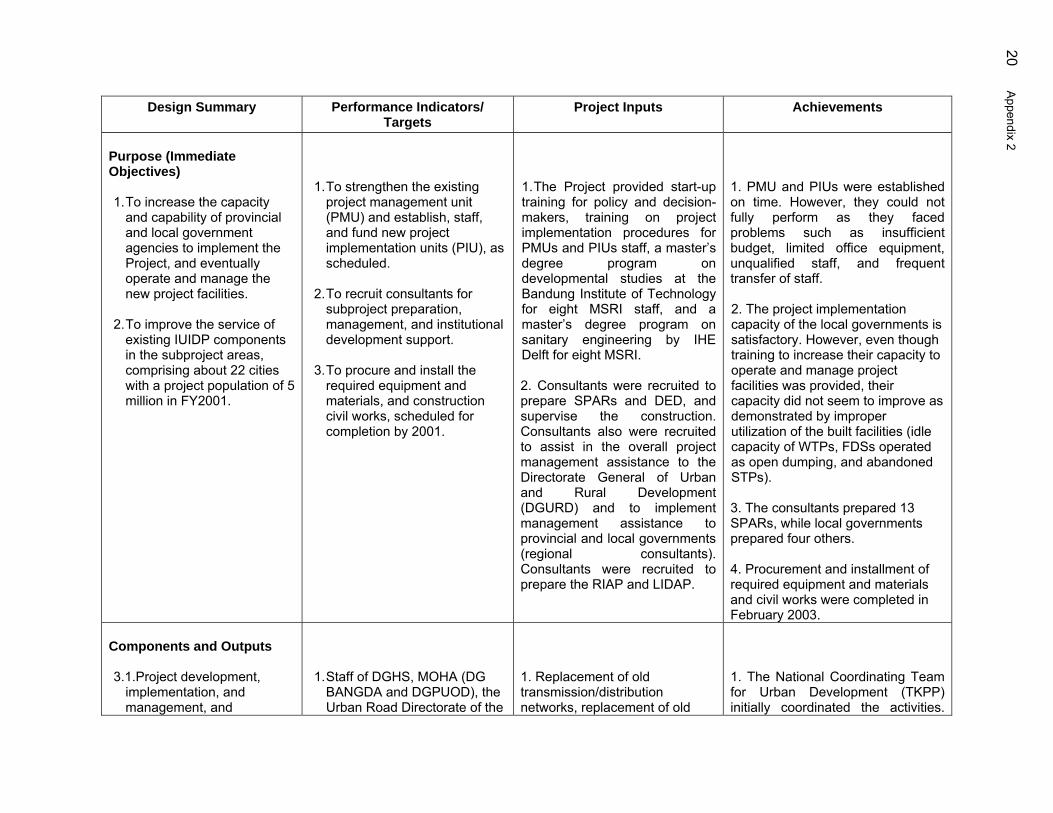
Design Summary Performance Indicators/ Targets
Project Inputs Achievements
Purpose (Immediate Objectives) 1. To increase the capacity
and capability of provincial and local government agencies to implement the Project, and eventually operate and manage the new project facilities.
2. To improve the service of
existing IUIDP components in the subproject areas, comprising about 22 cities with a project population of 5 million in FY2001.
1. To strengthen the existing
project management unit (PMU) and establish, staff, and fund new project implementation units (PIU), as scheduled.
2. To recruit consultants for
subproject preparation, management, and institutional development support.
3. To procure and install the
required equipment and materials, and construction civil works, scheduled for completion by 2001.
1. The Project provided start-up training for policy and decision-makers, training on project implementation procedures for PMUs and PIUs staff, a master’s degree program on developmental studies at the Bandung Institute of Technology for eight MSRI staff, and a master’s degree program on sanitary engineering by IHE Delft for eight MSRI.
2. Consultants were recruited to prepare SPARs and DED, and supervise the construction. Consultants also were recruited to assist in the overall project management assistance to the Directorate General of Urban and Rural Development (DGURD) and to implement management assistance to provincial and local governments (regional consultants). Consultants were recruited to prepare the RIAP and LIDAP.
1. PMU and PIUs were established on time. However, they could not fully perform as they faced problems such as insufficient budget, limited office equipment, unqualified staff, and frequent transfer of staff. 2. The project implementation capacity of the local governments is satisfactory. However, even though training to increase their capacity to operate and manage project facilities was provided, their capacity did not seem to improve as demonstrated by improper utilization of the built facilities (idle capacity of WTPs, FDSs operated as open dumping, and abandoned STPs). 3. The consultants prepared 13 SPARs, while local governments prepared four others. 4. Procurement and installment of required equipment and materials and civil works were completed in February 2003.
Components and Outputs 3.1.Project development,
implementation, and management, and
1. Staff of DGHS, MOHA (DG
BANGDA and DGPUOD), the Urban Road Directorate of the
1. Replacement of old transmission/distribution networks, replacement of old
1. The National Coordinating Team for Urban Development (TKPP) initially coordinated the activities.
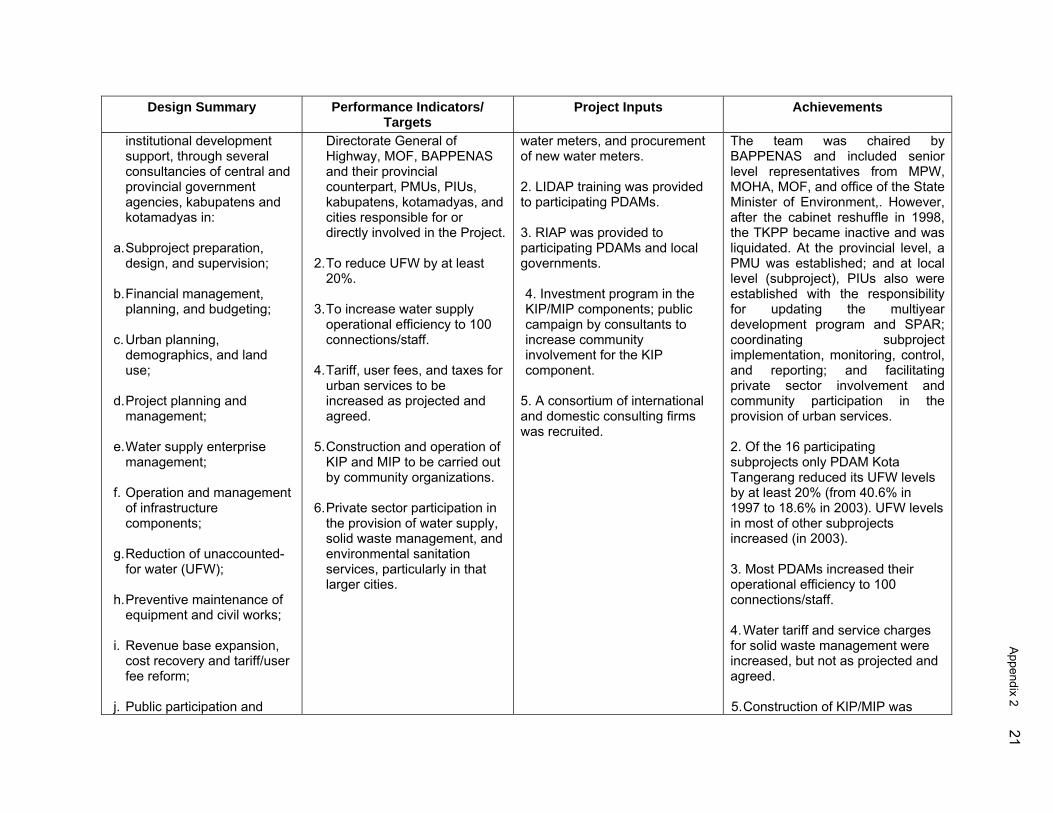
Appendix 2 21
Design Summary Performance Indicators/ Targets
Project Inputs Achievements
institutional development support, through several consultancies of central and provincial government agencies, kabupatens and kotamadyas in:
a. Subproject preparation,
design, and supervision; b. Financial management,
planning, and budgeting; c. Urban planning,
demographics, and land use;
d. Project planning and
management; e. Water supply enterprise
management; f. Operation and management
of infrastructure components;
g. Reduction of unaccounted-
for water (UFW); h. Preventive maintenance of
equipment and civil works; i. Revenue base expansion,
cost recovery and tariff/user fee reform;
j. Public participation and
Directorate General of Highway, MOF, BAPPENAS and their provincial counterpart, PMUs, PIUs, kabupatens, kotamadyas, and cities responsible for or directly involved in the Project.
2. To reduce UFW by at least
20%. 3. To increase water supply
operational efficiency to 100 connections/staff.
4. Tariff, user fees, and taxes for
urban services to be increased as projected and agreed.
5. Construction and operation of
KIP and MIP to be carried out by community organizations.
6. Private sector participation in
the provision of water supply, solid waste management, and environmental sanitation services, particularly in that larger cities.
water meters, and procurement of new water meters.
2. LIDAP training was provided to participating PDAMs.
3. RIAP was provided to participating PDAMs and local governments. 4. Investment program in the KIP/MIP components; public campaign by consultants to increase community involvement for the KIP component.
5. A consortium of international and domestic consulting firms was recruited.
The team was chaired by BAPPENAS and included senior level representatives from MPW, MOHA, MOF, and office of the State Minister of Environment,. However, after the cabinet reshuffle in 1998, the TKPP became inactive and was liquidated. At the provincial level, a PMU was established; and at local level (subproject), PIUs also were established with the responsibility for updating the multiyear development program and SPAR; coordinating subproject implementation, monitoring, control, and reporting; and facilitating private sector involvement and community participation in the provision of urban services. 2. Of the 16 participating subprojects only PDAM Kota Tangerang reduced its UFW levels by at least 20% (from 40.6% in 1997 to 18.6% in 2003). UFW levels in most of other subprojects increased (in 2003). 3. Most PDAMs increased their operational efficiency to 100 connections/staff. 4. Water tariff and service charges for solid waste management were increased, but not as projected and agreed. 5. Construction of KIP/MIP was
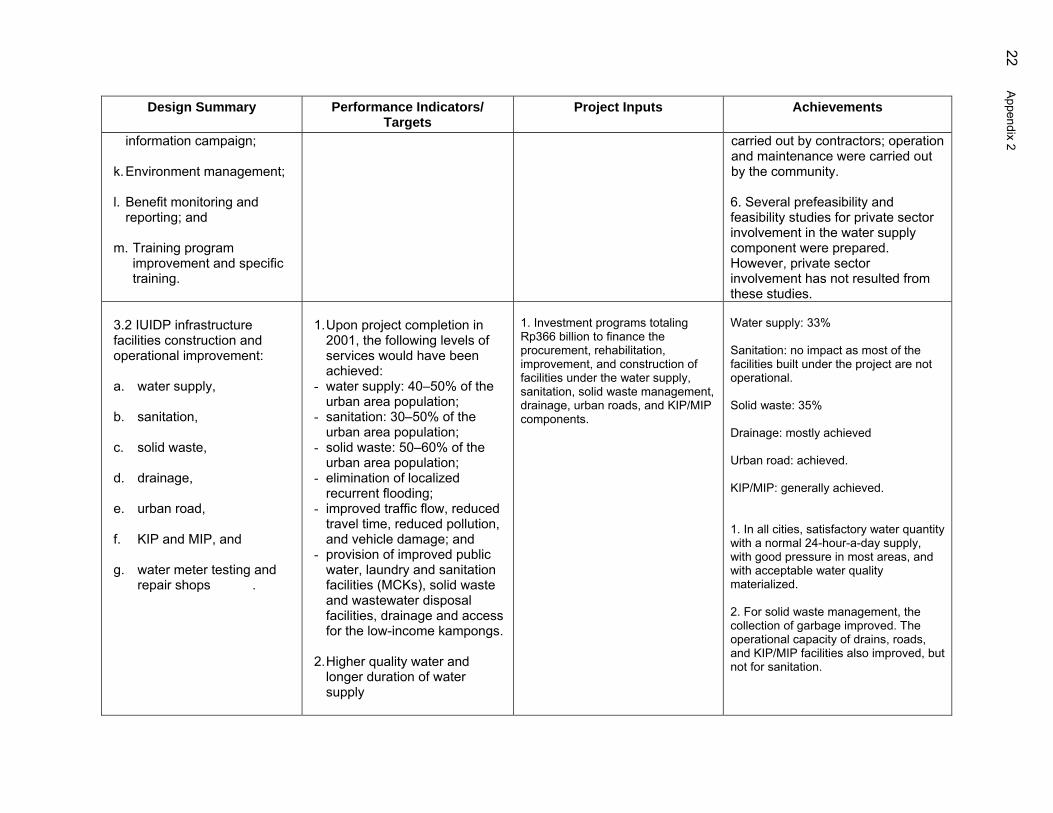
22 Appendix 2
Design Summary Performance Indicators/ Targets
Project Inputs Achievements
information campaign; k. Environment management; l. Benefit monitoring and
reporting; and m. Training program
improvement and specific training.
carried out by contractors; operation and maintenance were carried out by the community. 6. Several prefeasibility and feasibility studies for private sector involvement in the water supply component were prepared. However, private sector involvement has not resulted from these studies.
3.2 IUIDP infrastructure facilities construction and operational improvement: a. water supply, b. sanitation,
c. solid waste,
d. drainage,
e. urban road,
f. KIP and MIP, and g. water meter testing and
repair shops .
1. Upon project completion in
2001, the following levels of services would have been achieved:
- water supply: 40–50% of the urban area population;
- sanitation: 30–50% of the urban area population;
- solid waste: 50–60% of the urban area population;
- elimination of localized recurrent flooding;
- improved traffic flow, reduced travel time, reduced pollution, and vehicle damage; and
- provision of improved public water, laundry and sanitation facilities (MCKs), solid waste and wastewater disposal facilities, drainage and access for the low-income kampongs.
2. Higher quality water and
longer duration of water supply
1. Investment programs totaling Rp366 billion to finance the procurement, rehabilitation, improvement, and construction of facilities under the water supply, sanitation, solid waste management, drainage, urban roads, and KIP/MIP components.
Water supply: 33% Sanitation: no impact as most of the facilities built under the project are not operational. Solid waste: 35% Drainage: mostly achieved Urban road: achieved. KIP/MIP: generally achieved. 1. In all cities, satisfactory water quantity with a normal 24-hour-a-day supply, with good pressure in most areas, and with acceptable water quality materialized. 2. For solid waste management, the collection of garbage improved. The operational capacity of drains, roads, and KIP/MIP facilities also improved, but not for sanitation.
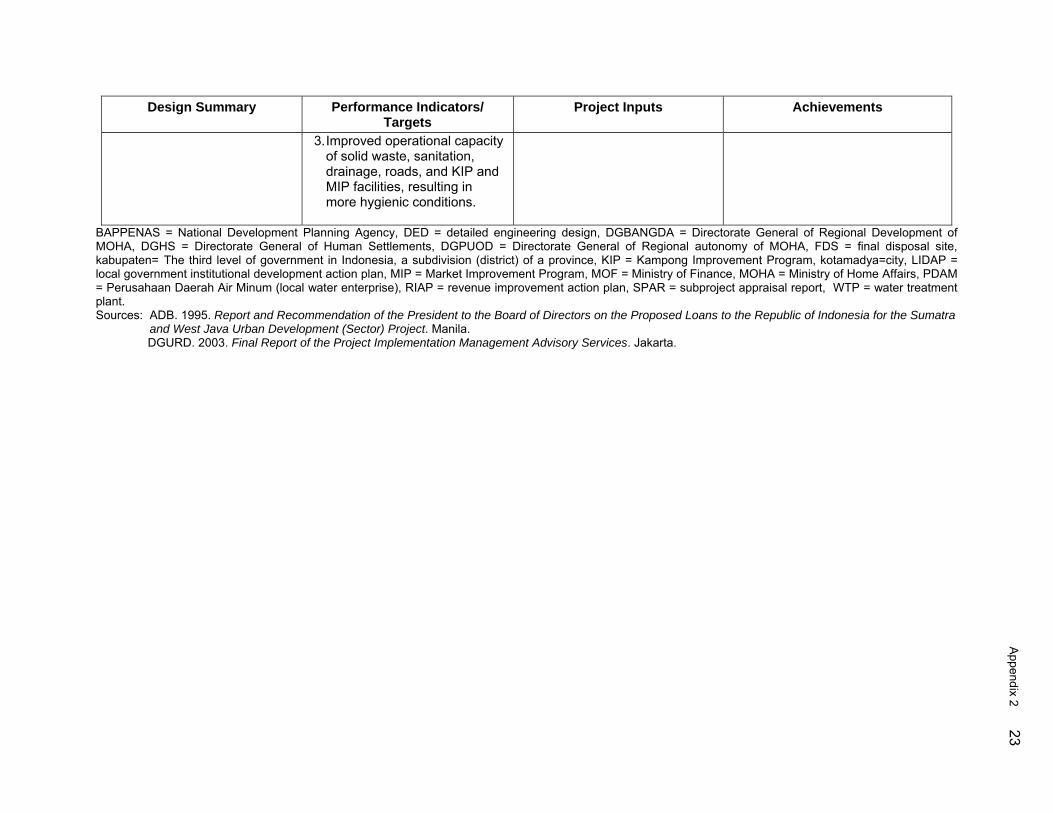
Appendix 2 23
Design Summary Performance Indicators/ Targets
Project Inputs Achievements
3. Improved operational capacity of solid waste, sanitation, drainage, roads, and KIP and MIP facilities, resulting in more hygienic conditions.
BAPPENAS = National Development Planning Agency, DED = detailed engineering design, DGBANGDA = Directorate General of Regional Development of MOHA, DGHS = Directorate General of Human Settlements, DGPUOD = Directorate General of Regional autonomy of MOHA, FDS = final disposal site, kabupaten= The third level of government in Indonesia, a subdivision (district) of a province, KIP = Kampong Improvement Program, kotamadya=city, LIDAP = local government institutional development action plan, MIP = Market Improvement Program, MOF = Ministry of Finance, MOHA = Ministry of Home Affairs, PDAM = Perusahaan Daerah Air Minum (local water enterprise), RIAP = revenue improvement action plan, SPAR = subproject appraisal report, WTP = water treatment plant. Sources: ADB. 1995. Report and Recommendation of the President to the Board of Directors on the Proposed Loans to the Republic of Indonesia for the Sumatra
and West Java Urban Development (Sector) Project. Manila. DGURD. 2003. Final Report of the Project Implementation Management Advisory Services. Jakarta.
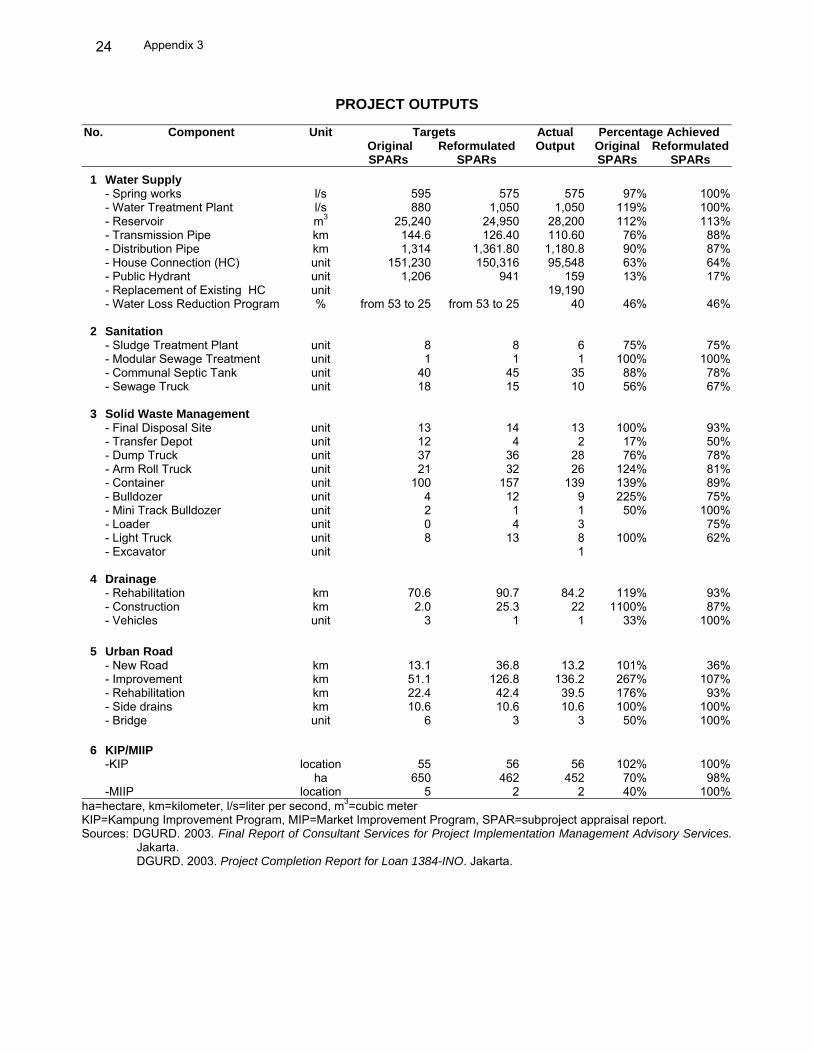
Appendix 3
24
PROJECT OUTPUTS
No. Component Unit Targets Actual Percentage Achieved Original
SPARs Reformulated
SPARs Output Original
SPARs Reformulated
SPARs 1 Water Supply - Spring works l/s 595 575 575 97% 100% - Water Treatment Plant l/s 880 1,050 1,050 119% 100% - Reservoir m3 25,240 24,950 28,200 112% 113% - Transmission Pipe km 144.6 126.40 110.60 76% 88% - Distribution Pipe km 1,314 1,361.80 1,180.8 90% 87% - House Connection (HC) unit 151,230 150,316 95,548 63% 64% - Public Hydrant unit 1,206 941 159 13% 17% - Replacement of Existing HC unit 19,190 - Water Loss Reduction Program % from 53 to 25 from 53 to 25 40 46% 46% 2 Sanitation - Sludge Treatment Plant unit 8 8 6 75% 75% - Modular Sewage Treatment unit 1 1 1 100% 100% - Communal Septic Tank unit 40 45 35 88% 78% - Sewage Truck unit 18 15 10 56% 67% 3 Solid Waste Management - Final Disposal Site unit 13 14 13 100% 93% - Transfer Depot unit 12 4 2 17% 50% - Dump Truck unit 37 36 28 76% 78% - Arm Roll Truck unit 21 32 26 124% 81% - Container unit 100 157 139 139% 89%
- Bulldozer unit 4 12 9 225% 75% - Mini Track Bulldozer unit 2 1 1 50% 100% - Loader unit 0 4 3 75% - Light Truck unit 8 13 8 100% 62% - Excavator unit 1
4 Drainage - Rehabilitation km 70.6 90.7 84.2 119% 93% - Construction km 2.0 25.3 22 1100% 87% - Vehicles unit 3 1 1 33% 100% 5 Urban Road - New Road km 13.1 36.8 13.2 101% 36% - Improvement km 51.1 126.8 136.2 267% 107% - Rehabilitation km 22.4 42.4 39.5 176% 93% - Side drains km 10.6 10.6 10.6 100% 100% - Bridge unit 6 3 3 50% 100% 6 KIP/MIIP
-KIP location 55 56 56 102% 100% ha 650 462 452 70% 98% -MIIP location 5 2 2 40% 100%ha=hectare, km=kilometer, l/s=liter per second, m3=cubic meter KIP=Kampung Improvement Program, MIP=Market Improvement Program, SPAR=subproject appraisal report. Sources: DGURD. 2003. Final Report of Consultant Services for Project Implementation Management Advisory Services.
Jakarta. DGURD. 2003. Project Completion Report for Loan 1384-INO. Jakarta.
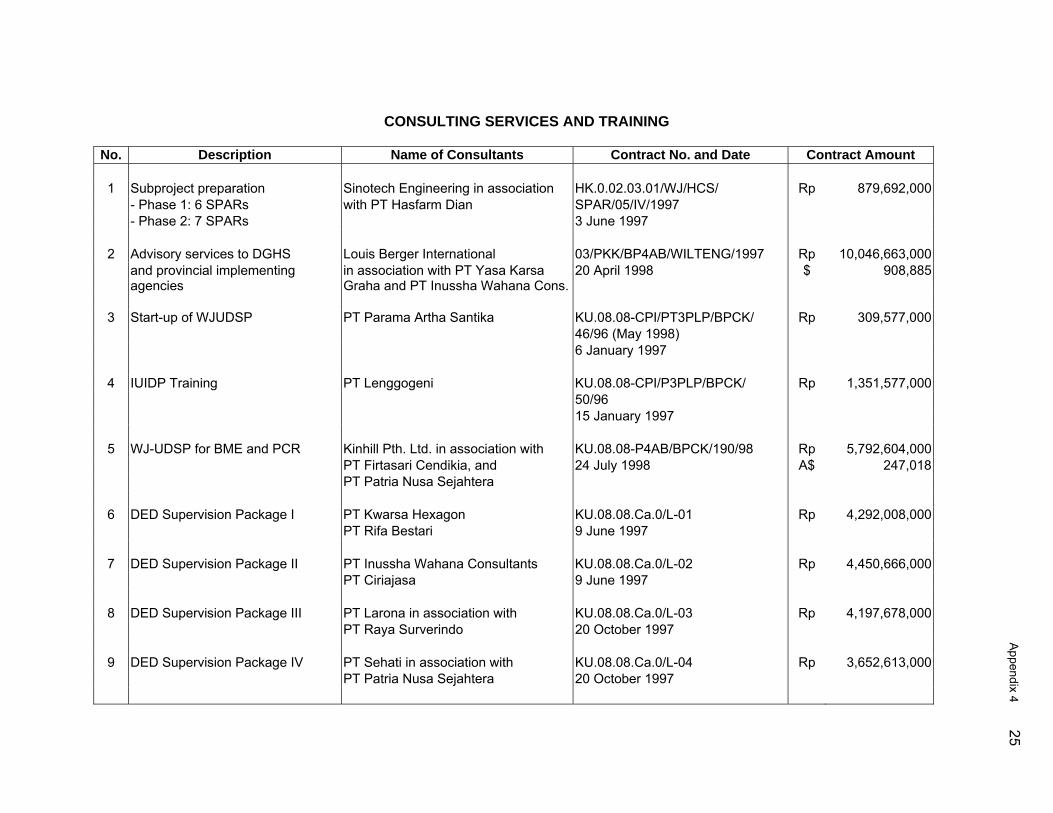
Appendix 4 25
CONSULTING SERVICES AND TRAINING
No. Description Name of Consultants Contract No. and Date Contract Amount
1 Subproject preparation Sinotech Engineering in association HK.0.02.03.01/WJ/HCS/ Rp 879,692,000 - Phase 1: 6 SPARs with PT Hasfarm Dian SPAR/05/IV/1997 - Phase 2: 7 SPARs 3 June 1997
2 Advisory services to DGHS Louis Berger International 03/PKK/BP4AB/WILTENG/1997 Rp 10,046,663,000 and provincial implementing
agencies in association with PT Yasa Karsa Graha and PT Inussha Wahana Cons.
20 April 1998 $ 908,885
3 Start-up of WJUDSP PT Parama Artha Santika KU.08.08-CPI/PT3PLP/BPCK/ Rp 309,577,000 46/96 (May 1998) 6 January 1997
4 IUIDP Training PT Lenggogeni KU.08.08-CPI/P3PLP/BPCK/ Rp 1,351,577,000 50/96 15 January 1997
5 WJ-UDSP for BME and PCR Kinhill Pth. Ltd. in association with KU.08.08-P4AB/BPCK/190/98 Rp 5,792,604,000 PT Firtasari Cendikia, and 24 July 1998 A$ 247,018 PT Patria Nusa Sejahtera
6 DED Supervision Package I PT Kwarsa Hexagon KU.08.08.Ca.0/L-01 Rp 4,292,008,000 PT Rifa Bestari 9 June 1997
7 DED Supervision Package II PT Inussha Wahana Consultants KU.08.08.Ca.0/L-02 Rp 4,450,666,000 PT Ciriajasa 9 June 1997
8 DED Supervision Package III PT Larona in association with KU.08.08.Ca.0/L-03 Rp 4,197,678,000 PT Raya Surverindo 20 October 1997
9 DED Supervision Package IV PT Sehati in association with KU.08.08.Ca.0/L-04 Rp 3,652,613,000 PT Patria Nusa Sejahtera 20 October 1997
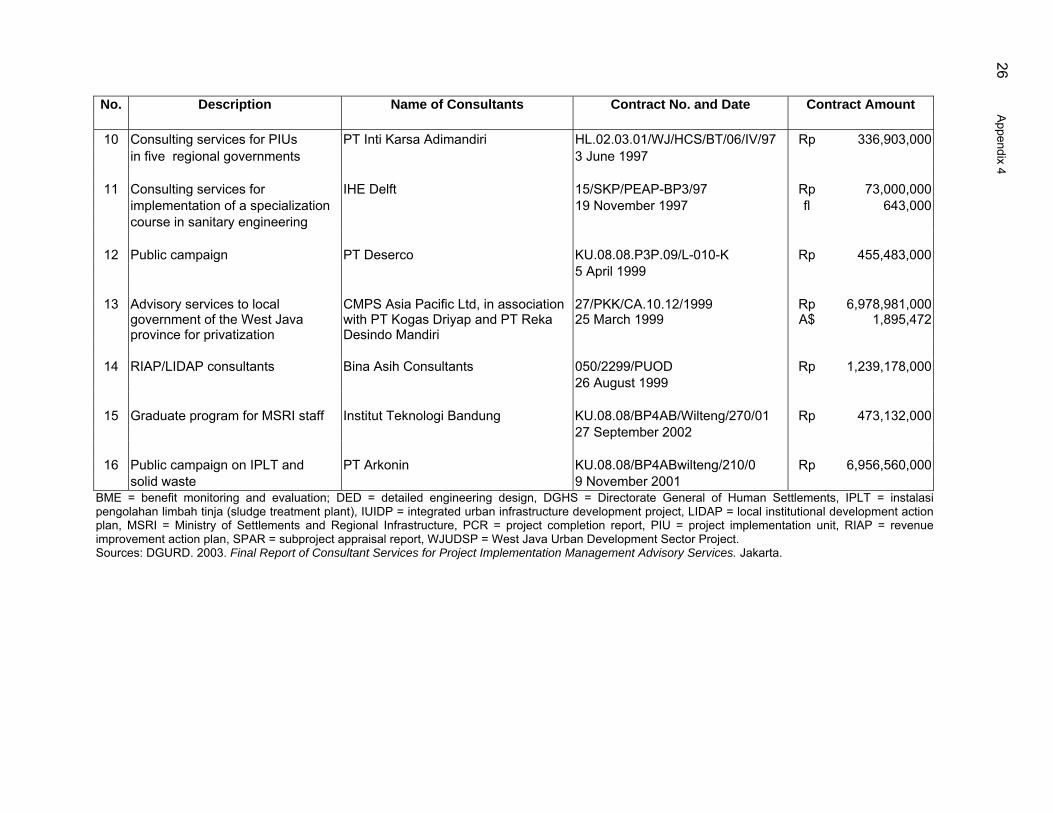
26 Appendix 4
No. Description Name of Consultants Contract No. and Date Contract Amount
10 Consulting services for PIUs PT Inti Karsa Adimandiri HL.02.03.01/WJ/HCS/BT/06/IV/97 Rp 336,903,000 in five regional governments 3 June 1997
11 Consulting services for IHE Delft 15/SKP/PEAP-BP3/97 Rp 73,000,000 implementation of a specialization 19 November 1997 fl 643,000 course in sanitary engineering
12 Public campaign PT Deserco KU.08.08.P3P.09/L-010-K Rp 455,483,000 5 April 1999
13 Advisory services to local government of the West Java province for privatization
CMPS Asia Pacific Ltd, in association with PT Kogas Driyap and PT Reka Desindo Mandiri
27/PKK/CA.10.12/1999 25 March 1999
Rp A$
6,978,981,0001,895,472
14 RIAP/LIDAP consultants Bina Asih Consultants 050/2299/PUOD Rp 1,239,178,000
26 August 1999
15 Graduate program for MSRI staff Institut Teknologi Bandung KU.08.08/BP4AB/Wilteng/270/01 Rp 473,132,000 27 September 2002
16 Public campaign on IPLT and PT Arkonin KU.08.08/BP4ABwilteng/210/0 Rp 6,956,560,000 solid waste 9 November 2001
BME = benefit monitoring and evaluation; DED = detailed engineering design, DGHS = Directorate General of Human Settlements, IPLT = instalasi pengolahan limbah tinja (sludge treatment plant), IUIDP = integrated urban infrastructure development project, LIDAP = local institutional development action plan, MSRI = Ministry of Settlements and Regional Infrastructure, PCR = project completion report, PIU = project implementation unit, RIAP = revenue improvement action plan, SPAR = subproject appraisal report, WJUDSP = West Java Urban Development Sector Project. Sources: DGURD. 2003. Final Report of Consultant Services for Project Implementation Management Advisory Services. Jakarta.
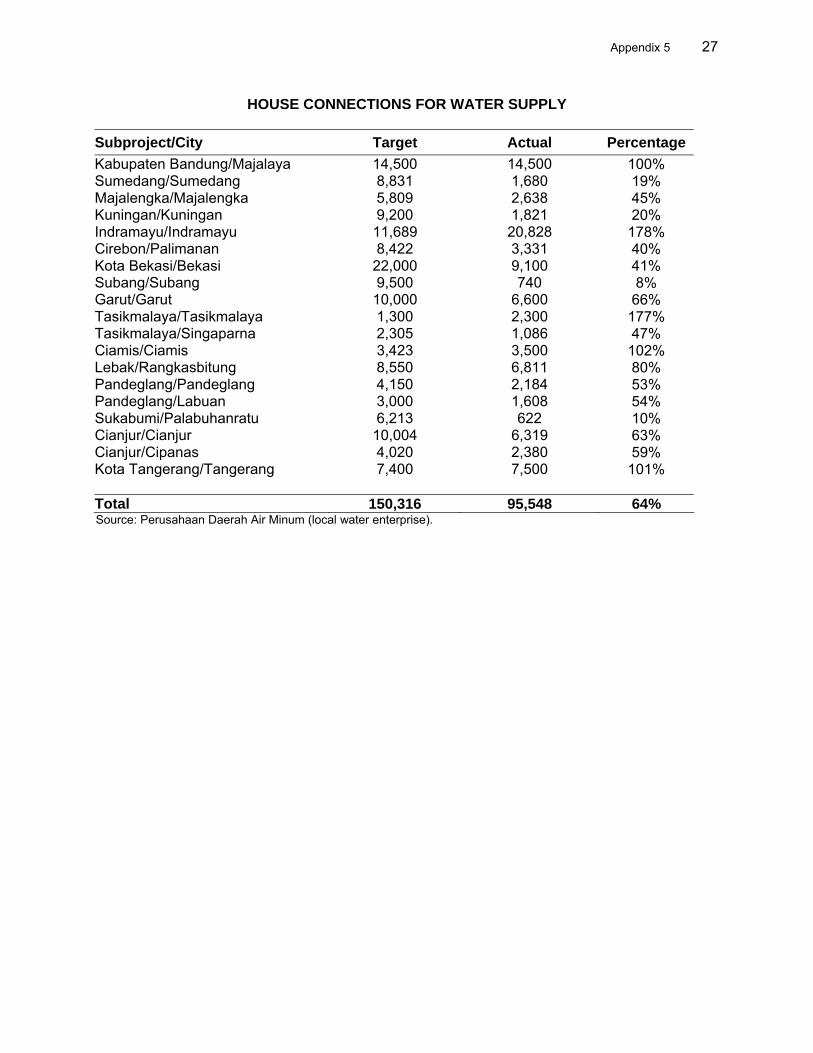
Appendix 5 27
HOUSE CONNECTIONS FOR WATER SUPPLY Subproject/City Target Actual Percentage Kabupaten Bandung/Majalaya 14,500 14,500 100% Sumedang/Sumedang 8,831 1,680 19% Majalengka/Majalengka 5,809 2,638 45% Kuningan/Kuningan 9,200 1,821 20% Indramayu/Indramayu 11,689 20,828 178% Cirebon/Palimanan 8,422 3,331 40% Kota Bekasi/Bekasi 22,000 9,100 41% Subang/Subang 9,500 740 8% Garut/Garut 10,000 6,600 66% Tasikmalaya/Tasikmalaya 1,300 2,300 177% Tasikmalaya/Singaparna 2,305 1,086 47% Ciamis/Ciamis 3,423 3,500 102% Lebak/Rangkasbitung 8,550 6,811 80% Pandeglang/Pandeglang 4,150 2,184 53% Pandeglang/Labuan 3,000 1,608 54% Sukabumi/Palabuhanratu 6,213 622 10% Cianjur/Cianjur 10,004 6,319 63% Cianjur/Cipanas 4,020 2,380 59% Kota Tangerang/Tangerang 7,400 7,500 101% Total 150,316 95,548 64% Source: Perusahaan Daerah Air Minum (local water enterprise).
28 Appendix 6
PROBLEMS ENCOUNTERED WITH SOME PROJECT COMPONENTS A. Water Supply Component 1. The water supply component established an installation target of 150,316 new house connections. However, only 95,548 new house connections had been installed before the Project Completion Review Mission in October 2004 for several reasons. First, start-up and implementation delays contributed to the lower-than-expected installations. For example, the construction of a broncaptering in Pandeglang took 2 years due to a dispute with the surrounding community. The works were not ready for use until 2002, 1 year before the loan closing date, delaying the installment of house connections. Second, changes in, or problems with, raw water sources adversely impacted installations. In Kuningan, for example, the source of raw water had to be changed from a spring to surface water as the former became unavailable because of a dispute with the surrounding community. As a result, Perusahaan Daerah Air Minum (PDAM) Kuningan had to allocate more funds for the construction of a water treatment plant (WTP). This, in turn, reduced its resources for the installation of house connections. Third, the demand projections were inaccurate. For example, only 622 house connections were connected in Palabuhanratu, compared with the target of 6,213. The forecast demand did not materialize, because a steel industry investment was canceled in the aftermath of the 1997 Asian financial crisis, and housing and business complexes that were planned to serve the steel facility were not built. Consequently, two new WTPs, each with a capacity of 40 liter per second, are not operational, as the upgraded existing WTP is sufficient to serve the current house connections. Similarly, only 3,331 of the targeted 8,422 house connections were installed in Palimanan, where the expected development of the city did not happen. The fourth reason for this component missing its house connections target was a change in administrative jurisdiction of the targeted service area. In 2001, a new jurisdiction (Kota Tasikmalaya), formerly within Kabupaten Tasikmalaya, was established, reducing the targeted market area. B. Sanitation Component
2. Sanitation was the least successful component under the Project as the six constructed sludge treatment plants (STPs) are not operational or operate at very low capacity. In Sumedang, the STP was abandoned. In Majalaya, a sludge truck has disposed of sewage sludge in the STP only once since January 2004. In Cianjur, the STP has been abandoned since its completion in 2001, and leaks in the facility have never been fixed. In Garut, the STP has not been used since its completion in 1998. The facility was badly damaged when its maturation pond was swept away by a flood. 3. The unsatisfactory outcome was the result of several factors. First, the demand forecasts in the subproject appraisal reports (SPARs) were overly optimistic, resulting in over-designed facilities. The SPARs forecast high demand for the STPs by assuming a large number of septic tanks would need to be served. However, the actual demand for the service was very low, due to the improper construction of septic tanks (i.e., they are not water tight, and often lack an appropriate base). People also are unaware that septic tanks must be cleaned regularly, which contributed to the low demand. For example, the STP in Indramayu, which was designed to treat about 10 trucks of sludge per day, is only loaded with three or four trucks of sludge per week. Second, local government staff was trained inadequately in the operation and maintenance (O&M) of the facilities. In some cases, those who had been trained were moved to other duties or locations. Third, a mechanism to enforce local sanitation regulations is lacking. Fourth, the O&M budget is inadequate and supporting equipment, such as desludging/vacuum
Appendix 6 29
trucks, are lacking. The service areas in most subprojects are very large and difficult to cover with limited O&M budgets and trucks are available. C. Solid Waste Management 4. The operation of final disposal sites (FDS) under this component has not met expectations. Designed as sanitary landfills, the 13 constructed and/or and rehabilitated FDSs are operated as open dumpsites or control landfills (semi-sanitary landfill). This has created environmental problems. In Garut, for example, the leachate treatment facilities are covered with garbage and overgrown with vegetation. Garbage is burned, and smoke, flies, and bad odor cover the site and the surrounding areas. Similar conditions can be found in Bandung (Majalaya), Sumedang, Pandeglang, and most other FDSs. In Kuningan, the FDS is operated as a control landfill. It is managed better than the others, and has the necessary equipment (bulldozer and excavator), ample covering soil, and trained and committed staff. However, Kuningan’s insufficient O&M budget has prevented the operation of the FDS as a fully sanitary landfill. 5. Poor access roads to the FDSs, and inadequate operational roads within the FDSs, pose major problems. In Singaparna, for example, a bulldozer procured in 2002 has been idle without adequate protection from direct sun and rain due to a poor operational road. As a result, some parts of the equipment have started to rust prematurely. Lack of local government commitment to providing adequate O&M budgets, as well as disputes with surrounding communities, also have undermined the outcome of the solid waste management component. For example, in Cianjur and Sukabumi, the FDSs completed in 2003 never have been used. The FDS in Sukabumi was abandoned because of an insufficient O&M budget, while the FDS in Cianjur was abandoned following a dispute with the surrounding community over the negative impact of the facility.
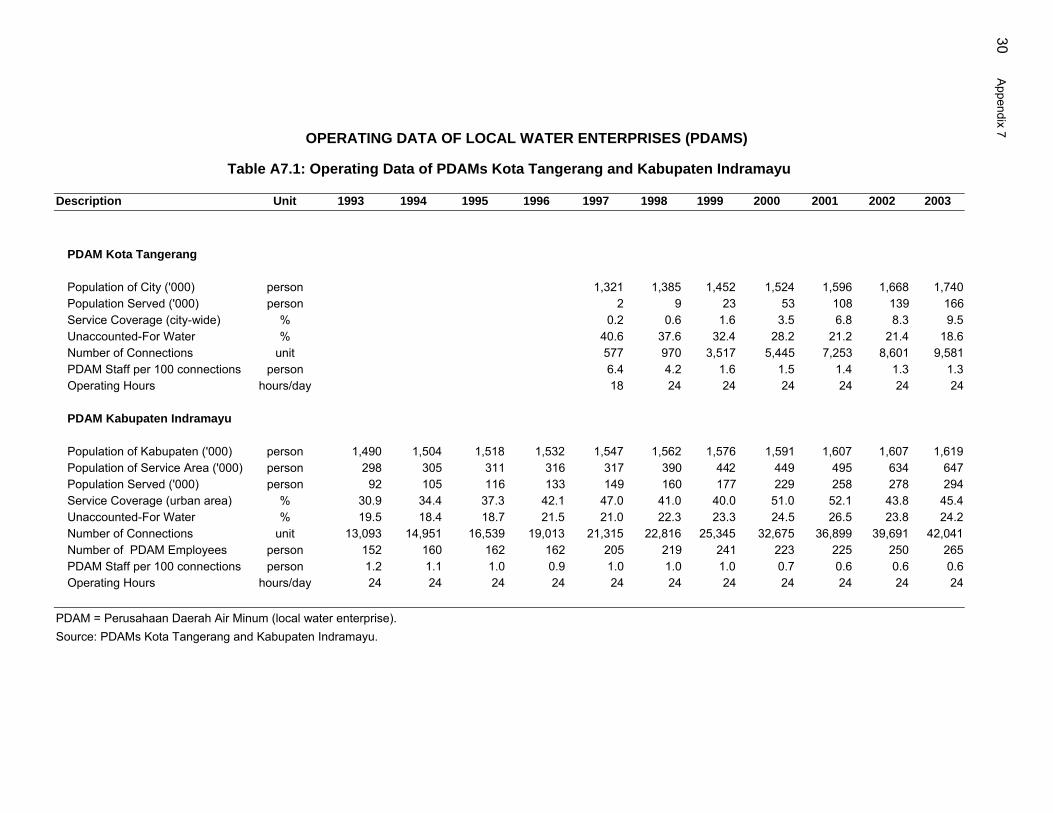
30 Appendix 7
OPERATING DATA OF LOCAL WATER ENTERPRISES (PDAMS)
Table A7.1: Operating Data of PDAMs Kota Tangerang and Kabupaten Indramayu
Description Unit 1993 1994 1995 1996 1997 1998 1999 2000 2001 2002 2003
PDAM Kota Tangerang Population of City ('000) person 1,321 1,385 1,452 1,524 1,596 1,668 1,740 Population Served ('000) person 2 9 23 53 108 139 166 Service Coverage (city-wide) % 0.2 0.6 1.6 3.5 6.8 8.3 9.5 Unaccounted-For Water % 40.6 37.6 32.4 28.2 21.2 21.4 18.6 Number of Connections unit 577 970 3,517 5,445 7,253 8,601 9,581 PDAM Staff per 100 connections person 6.4 4.2 1.6 1.5 1.4 1.3 1.3 Operating Hours hours/day 18 24 24 24 24 24 24 PDAM Kabupaten Indramayu Population of Kabupaten ('000) person 1,490 1,504 1,518 1,532 1,547 1,562 1,576 1,591 1,607 1,607 1,619 Population of Service Area ('000) person 298 305 311 316 317 390 442 449 495 634 647 Population Served ('000) person 92 105 116 133 149 160 177 229 258 278 294 Service Coverage (urban area) % 30.9 34.4 37.3 42.1 47.0 41.0 40.0 51.0 52.1 43.8 45.4 Unaccounted-For Water % 19.5 18.4 18.7 21.5 21.0 22.3 23.3 24.5 26.5 23.8 24.2 Number of Connections unit 13,093 14,951 16,539 19,013 21,315 22,816 25,345 32,675 36,899 39,691 42,041 Number of PDAM Employees person 152 160 162 162 205 219 241 223 225 250 265 PDAM Staff per 100 connections person 1.2 1.1 1.0 0.9 1.0 1.0 1.0 0.7 0.6 0.6 0.6 Operating Hours hours/day 24 24 24 24 24 24 24 24 24 24 24 PDAM = Perusahaan Daerah Air Minum (local water enterprise). Source: PDAMs Kota Tangerang and Kabupaten Indramayu.
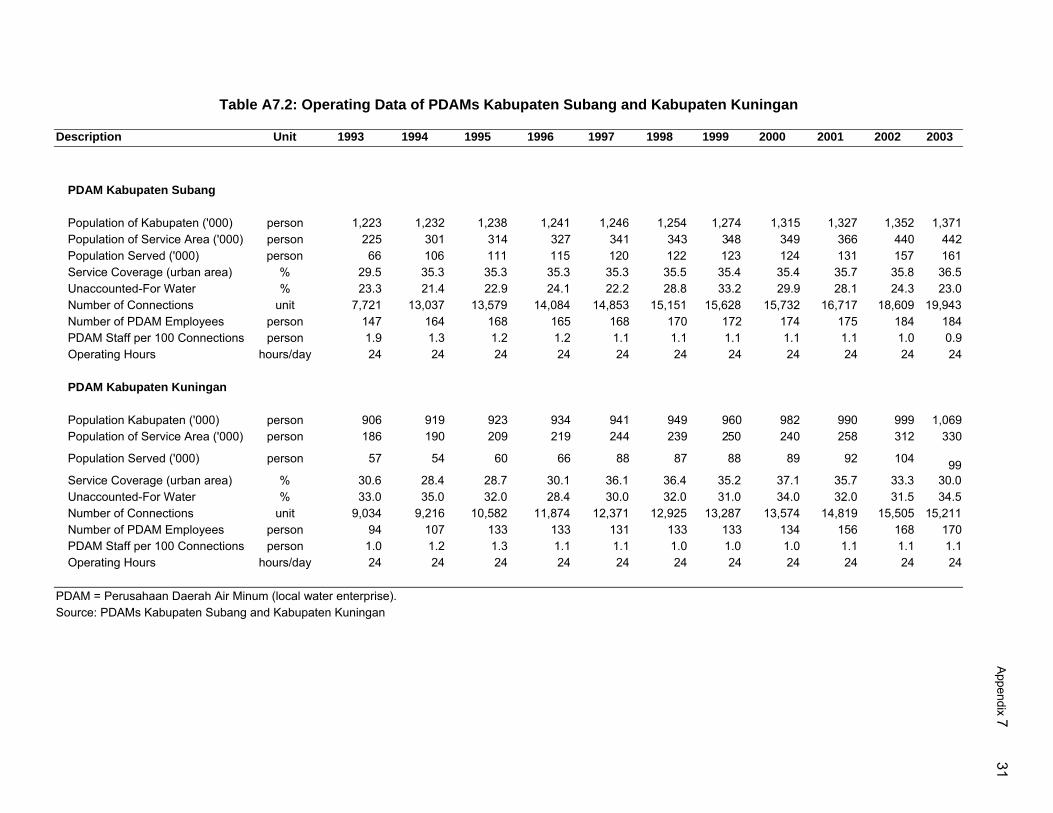
Appendix 7 31
Table A7.2: Operating Data of PDAMs Kabupaten Subang and Kabupaten Kuningan
Description Unit 1993 1994 1995 1996 1997 1998 1999 2000 2001 2002 2003
PDAM Kabupaten Subang Population of Kabupaten ('000) person 1,223 1,232 1,238 1,241 1,246 1,254 1,274 1,315 1,327 1,352 1,371 Population of Service Area ('000) person 225 301 314 327 341 343 348 349 366 440 442 Population Served ('000) person 66 106 111 115 120 122 123 124 131 157 161 Service Coverage (urban area) % 29.5 35.3 35.3 35.3 35.3 35.5 35.4 35.4 35.7 35.8 36.5 Unaccounted-For Water % 23.3 21.4 22.9 24.1 22.2 28.8 33.2 29.9 28.1 24.3 23.0 Number of Connections unit 7,721 13,037 13,579 14,084 14,853 15,151 15,628 15,732 16,717 18,609 19,943 Number of PDAM Employees person 147 164 168 165 168 170 172 174 175 184 184 PDAM Staff per 100 Connections person 1.9 1.3 1.2 1.2 1.1 1.1 1.1 1.1 1.1 1.0 0.9 Operating Hours hours/day 24 24 24 24 24 24 24 24 24 24 24 PDAM Kabupaten Kuningan Population Kabupaten ('000) person 906 919 923 934 941 949 960 982 990 999 1,069 Population of Service Area ('000) person 186 190 209 219 244 239 250 240 258 312 330
Population Served ('000) person 57 54 60 66 88 87 88 89 92 104 99 Service Coverage (urban area) % 30.6 28.4 28.7 30.1 36.1 36.4 35.2 37.1 35.7 33.3 30.0 Unaccounted-For Water % 33.0 35.0 32.0 28.4 30.0 32.0 31.0 34.0 32.0 31.5 34.5 Number of Connections unit 9,034 9,216 10,582 11,874 12,371 12,925 13,287 13,574 14,819 15,505 15,211 Number of PDAM Employees person 94 107 133 133 131 133 133 134 156 168 170 PDAM Staff per 100 Connections person 1.0 1.2 1.3 1.1 1.1 1.0 1.0 1.0 1.1 1.1 1.1 Operating Hours hours/day 24 24 24 24 24 24 24 24 24 24 24 PDAM = Perusahaan Daerah Air Minum (local water enterprise). Source: PDAMs Kabupaten Subang and Kabupaten Kuningan
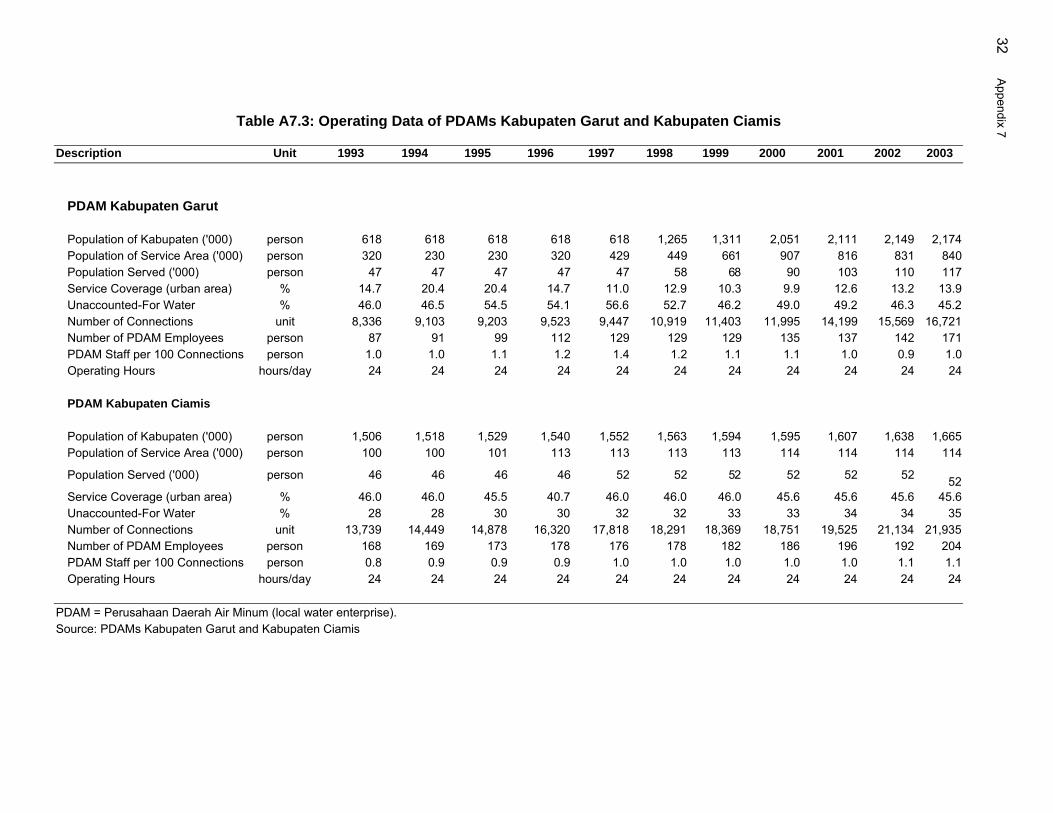
32 Appendix 7
Table A7.3: Operating Data of PDAMs Kabupaten Garut and Kabupaten Ciamis
Description Unit 1993 1994 1995 1996 1997 1998 1999 2000 2001 2002 2003 PDAM Kabupaten Garut
Population of Kabupaten ('000) person 618 618 618 618 618 1,265 1,311 2,051 2,111 2,149 2,174 Population of Service Area ('000) person 320 230 230 320 429 449 661 907 816 831 840 Population Served ('000) person 47 47 47 47 47 58 68 90 103 110 117 Service Coverage (urban area) % 14.7 20.4 20.4 14.7 11.0 12.9 10.3 9.9 12.6 13.2 13.9 Unaccounted-For Water % 46.0 46.5 54.5 54.1 56.6 52.7 46.2 49.0 49.2 46.3 45.2 Number of Connections unit 8,336 9,103 9,203 9,523 9,447 10,919 11,403 11,995 14,199 15,569 16,721 Number of PDAM Employees person 87 91 99 112 129 129 129 135 137 142 171 PDAM Staff per 100 Connections person 1.0 1.0 1.1 1.2 1.4 1.2 1.1 1.1 1.0 0.9 1.0 Operating Hours hours/day 24 24 24 24 24 24 24 24 24 24 24 PDAM Kabupaten Ciamis Population of Kabupaten ('000) person 1,506 1,518 1,529 1,540 1,552 1,563 1,594 1,595 1,607 1,638 1,665 Population of Service Area ('000) person 100 100 101 113 113 113 113 114 114 114 114
Population Served ('000) person 46 46 46 46 52 52 52 52 52 52 52 Service Coverage (urban area) % 46.0 46.0 45.5 40.7 46.0 46.0 46.0 45.6 45.6 45.6 45.6 Unaccounted-For Water % 28 28 30 30 32 32 33 33 34 34 35 Number of Connections unit 13,739 14,449 14,878 16,320 17,818 18,291 18,369 18,751 19,525 21,134 21,935 Number of PDAM Employees person 168 169 173 178 176 178 182 186 196 192 204 PDAM Staff per 100 Connections person 0.8 0.9 0.9 0.9 1.0 1.0 1.0 1.0 1.0 1.1 1.1 Operating Hours hours/day 24 24 24 24 24 24 24 24 24 24 24
PDAM = Perusahaan Daerah Air Minum (local water enterprise). Source: PDAMs Kabupaten Garut and Kabupaten Ciamis
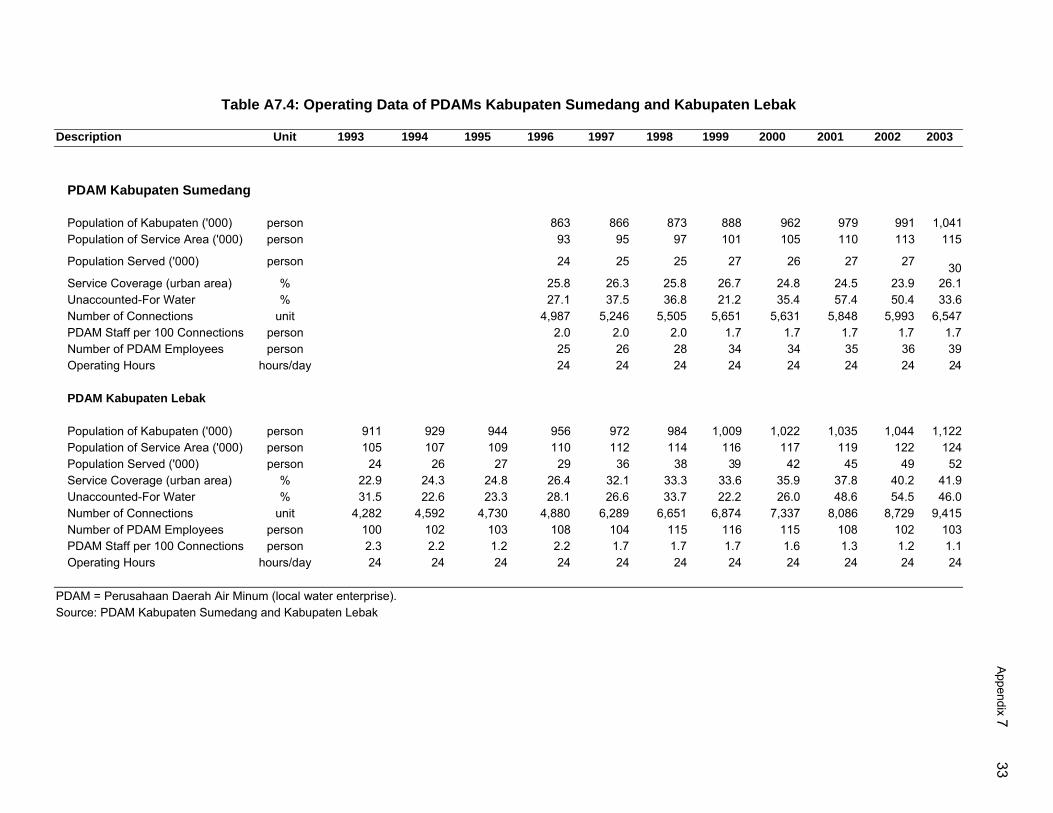
Appendix 7 33
Table A7.4: Operating Data of PDAMs Kabupaten Sumedang and Kabupaten Lebak
Description Unit 1993 1994 1995 1996 1997 1998 1999 2000 2001 2002 2003 PDAM Kabupaten Sumedang Population of Kabupaten ('000) person 863 866 873 888 962 979 991 1,041 Population of Service Area ('000) person 93 95 97 101 105 110 113 115 Population Served ('000) person 24 25 25 27 26 27 27 30 Service Coverage (urban area) % 25.8 26.3 25.8 26.7 24.8 24.5 23.9 26.1 Unaccounted-For Water % 27.1 37.5 36.8 21.2 35.4 57.4 50.4 33.6 Number of Connections unit 4,987 5,246 5,505 5,651 5,631 5,848 5,993 6,547 PDAM Staff per 100 Connections person 2.0 2.0 2.0 1.7 1.7 1.7 1.7 1.7 Number of PDAM Employees person 25 26 28 34 34 35 36 39 Operating Hours hours/day 24 24 24 24 24 24 24 24 PDAM Kabupaten Lebak Population of Kabupaten ('000) person 911 929 944 956 972 984 1,009 1,022 1,035 1,044 1,122 Population of Service Area ('000) person 105 107 109 110 112 114 116 117 119 122 124 Population Served ('000) person 24 26 27 29 36 38 39 42 45 49 52 Service Coverage (urban area) % 22.9 24.3 24.8 26.4 32.1 33.3 33.6 35.9 37.8 40.2 41.9 Unaccounted-For Water % 31.5 22.6 23.3 28.1 26.6 33.7 22.2 26.0 48.6 54.5 46.0 Number of Connections unit 4,282 4,592 4,730 4,880 6,289 6,651 6,874 7,337 8,086 8,729 9,415 Number of PDAM Employees person 100 102 103 108 104 115 116 115 108 102 103 PDAM Staff per 100 Connections person 2.3 2.2 1.2 2.2 1.7 1.7 1.7 1.6 1.3 1.2 1.1 Operating Hours hours/day 24 24 24 24 24 24 24 24 24 24 24
PDAM = Perusahaan Daerah Air Minum (local water enterprise). Source: PDAM Kabupaten Sumedang and Kabupaten Lebak
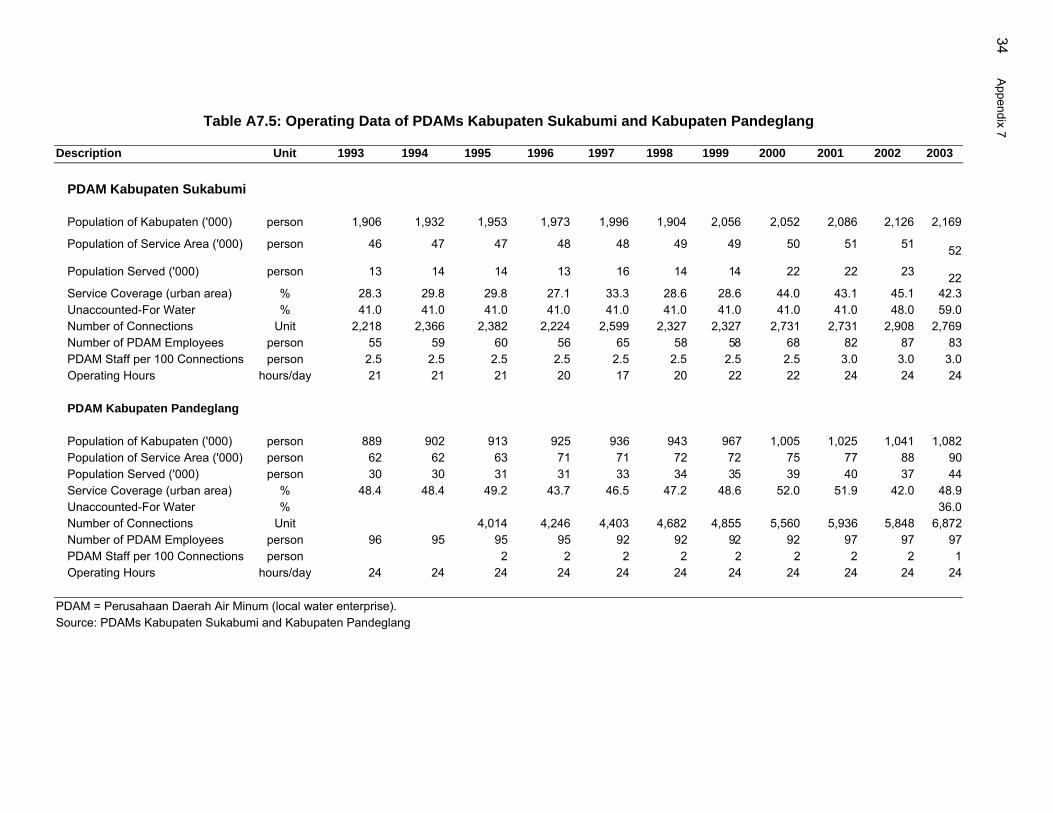
34 Appendix 7
Table A7.5: Operating Data of PDAMs Kabupaten Sukabumi and Kabupaten Pandeglang
Description Unit 1993 1994 1995 1996 1997 1998 1999 2000 2001 2002 2003
PDAM Kabupaten Sukabumi Population of Kabupaten ('000) person 1,906 1,932 1,953 1,973 1,996 1,904 2,056 2,052 2,086 2,126 2,169
Population of Service Area ('000) person 46 47 47 48 48 49 49 50 51 51 52
Population Served ('000) person 13 14 14 13 16 14 14 22 22 23 22 Service Coverage (urban area) % 28.3 29.8 29.8 27.1 33.3 28.6 28.6 44.0 43.1 45.1 42.3 Unaccounted-For Water % 41.0 41.0 41.0 41.0 41.0 41.0 41.0 41.0 41.0 48.0 59.0 Number of Connections Unit 2,218 2,366 2,382 2,224 2,599 2,327 2,327 2,731 2,731 2,908 2,769 Number of PDAM Employees person 55 59 60 56 65 58 58 68 82 87 83 PDAM Staff per 100 Connections person 2.5 2.5 2.5 2.5 2.5 2.5 2.5 2.5 3.0 3.0 3.0 Operating Hours hours/day 21 21 21 20 17 20 22 22 24 24 24 PDAM Kabupaten Pandeglang Population of Kabupaten ('000) person 889 902 913 925 936 943 967 1,005 1,025 1,041 1,082 Population of Service Area ('000) person 62 62 63 71 71 72 72 75 77 88 90 Population Served ('000) person 30 30 31 31 33 34 35 39 40 37 44 Service Coverage (urban area) % 48.4 48.4 49.2 43.7 46.5 47.2 48.6 52.0 51.9 42.0 48.9 Unaccounted-For Water % 36.0 Number of Connections Unit 4,014 4,246 4,403 4,682 4,855 5,560 5,936 5,848 6,872 Number of PDAM Employees person 96 95 95 95 92 92 92 92 97 97 97 PDAM Staff per 100 Connections person 2 2 2 2 2 2 2 2 1 Operating Hours hours/day 24 24 24 24 24 24 24 24 24 24 24 PDAM = Perusahaan Daerah Air Minum (local water enterprise). Source: PDAMs Kabupaten Sukabumi and Kabupaten Pandeglang
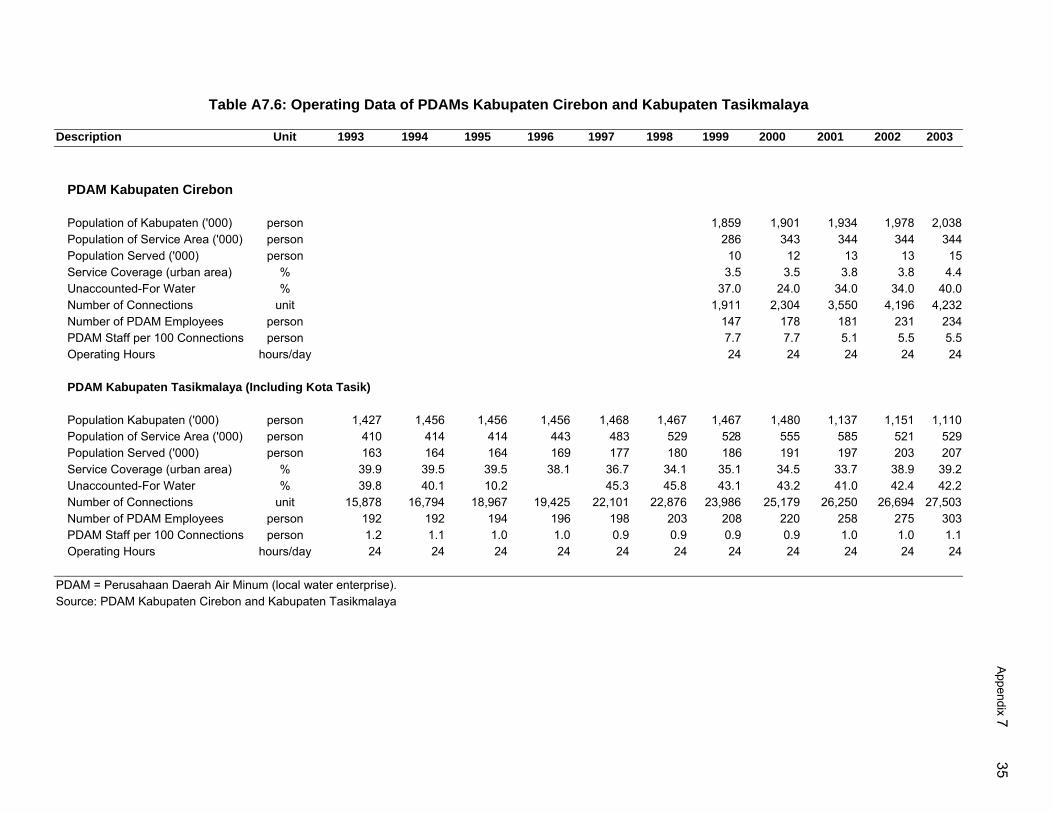
Appendix 7 35
Table A7.6: Operating Data of PDAMs Kabupaten Cirebon and Kabupaten Tasikmalaya
Description Unit 1993 1994 1995 1996 1997 1998 1999 2000 2001 2002 2003 PDAM Kabupaten Cirebon Population of Kabupaten ('000) person 1,859 1,901 1,934 1,978 2,038 Population of Service Area ('000) person 286 343 344 344 344 Population Served ('000) person 10 12 13 13 15 Service Coverage (urban area) % 3.5 3.5 3.8 3.8 4.4 Unaccounted-For Water % 37.0 24.0 34.0 34.0 40.0 Number of Connections unit 1,911 2,304 3,550 4,196 4,232 Number of PDAM Employees person 147 178 181 231 234 PDAM Staff per 100 Connections person 7.7 7.7 5.1 5.5 5.5 Operating Hours hours/day 24 24 24 24 24 PDAM Kabupaten Tasikmalaya (Including Kota Tasik) Population Kabupaten ('000) person 1,427 1,456 1,456 1,456 1,468 1,467 1,467 1,480 1,137 1,151 1,110 Population of Service Area ('000) person 410 414 414 443 483 529 528 555 585 521 529 Population Served ('000) person 163 164 164 169 177 180 186 191 197 203 207 Service Coverage (urban area) % 39.9 39.5 39.5 38.1 36.7 34.1 35.1 34.5 33.7 38.9 39.2 Unaccounted-For Water % 39.8 40.1 10.2 45.3 45.8 43.1 43.2 41.0 42.4 42.2 Number of Connections unit 15,878 16,794 18,967 19,425 22,101 22,876 23,986 25,179 26,250 26,694 27,503 Number of PDAM Employees person 192 192 194 196 198 203 208 220 258 275 303 PDAM Staff per 100 Connections person 1.2 1.1 1.0 1.0 0.9 0.9 0.9 0.9 1.0 1.0 1.1 Operating Hours hours/day 24 24 24 24 24 24 24 24 24 24 24
PDAM = Perusahaan Daerah Air Minum (local water enterprise). Source: PDAM Kabupaten Cirebon and Kabupaten Tasikmalaya
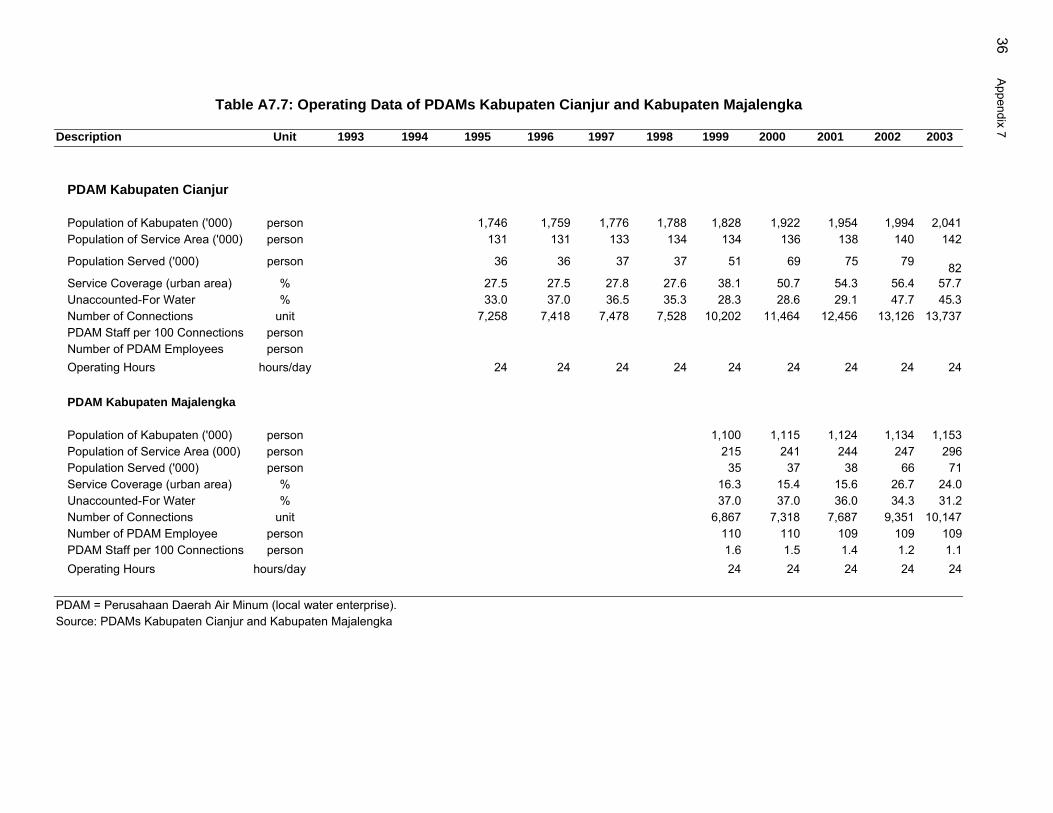
36 Appendix 7
Table A7.7: Operating Data of PDAMs Kabupaten Cianjur and Kabupaten Majalengka
Description Unit 1993 1994 1995 1996 1997 1998 1999 2000 2001 2002 2003 PDAM Kabupaten Cianjur Population of Kabupaten ('000) person 1,746 1,759 1,776 1,788 1,828 1,922 1,954 1,994 2,041 Population of Service Area ('000) person 131 131 133 134 134 136 138 140 142 Population Served ('000) person 36 36 37 37 51 69 75 79 82 Service Coverage (urban area) % 27.5 27.5 27.8 27.6 38.1 50.7 54.3 56.4 57.7 Unaccounted-For Water % 33.0 37.0 36.5 35.3 28.3 28.6 29.1 47.7 45.3 Number of Connections unit 7,258 7,418 7,478 7,528 10,202 11,464 12,456 13,126 13,737 PDAM Staff per 100 Connections person Number of PDAM Employees person Operating Hours hours/day 24 24 24 24 24 24 24 24 24 PDAM Kabupaten Majalengka Population of Kabupaten ('000) person 1,100 1,115 1,124 1,134 1,153 Population of Service Area (000) person 215 241 244 247 296 Population Served ('000) person 35 37 38 66 71 Service Coverage (urban area) % 16.3 15.4 15.6 26.7 24.0 Unaccounted-For Water % 37.0 37.0 36.0 34.3 31.2 Number of Connections unit 6,867 7,318 7,687 9,351 10,147 Number of PDAM Employee person 110 110 109 109 109 PDAM Staff per 100 Connections person 1.6 1.5 1.4 1.2 1.1 Operating Hours hours/day 24 24 24 24 24
PDAM = Perusahaan Daerah Air Minum (local water enterprise). Source: PDAMs Kabupaten Cianjur and Kabupaten Majalengka
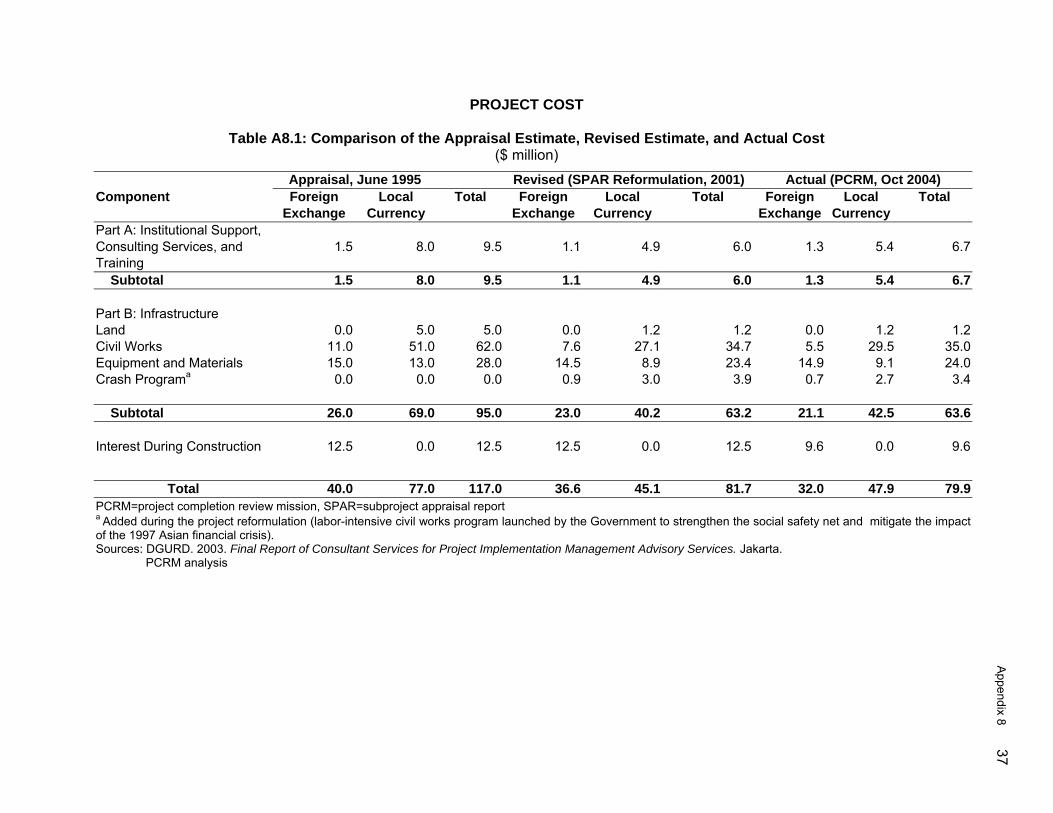
Appendix 8 37
PROJECT COST
Table A8.1: Comparison of the Appraisal Estimate, Revised Estimate, and Actual Cost ($ million)
Appraisal, June 1995 Revised (SPAR Reformulation, 2001) Actual (PCRM, Oct 2004) Component Foreign Local Total Foreign Local Total Foreign Local Total
Exchange Currency Exchange Currency Exchange Currency Part A: Institutional Support, Consulting Services, and 1.5 8.0 9.5 1.1 4.9 6.0 1.3 5.4 6.7Training Subtotal 1.5 8.0 9.5 1.1 4.9 6.0 1.3 5.4 6.7
Part B: Infrastructure Land 0.0 5.0 5.0 0.0 1.2 1.2 0.0 1.2 1.2Civil Works 11.0 51.0 62.0 7.6 27.1 34.7 5.5 29.5 35.0Equipment and Materials 15.0 13.0 28.0 14.5 8.9 23.4 14.9 9.1 24.0Crash Programa 0.0 0.0 0.0 0.9 3.0 3.9 0.7 2.7 3.4
Subtotal 26.0 69.0 95.0 23.0 40.2 63.2 21.1 42.5 63.6
Interest During Construction 12.5 0.0 12.5 12.5 0.0 12.5 9.6 0.0 9.6
Total 40.0 77.0 117.0 36.6 45.1 81.7 32.0 47.9 79.9PCRM=project completion review mission, SPAR=subproject appraisal report a Added during the project reformulation (labor-intensive civil works program launched by the Government to strengthen the social safety net and mitigate the impact of the 1997 Asian financial crisis). Sources: DGURD. 2003. Final Report of Consultant Services for Project Implementation Management Advisory Services. Jakarta. PCRM analysis
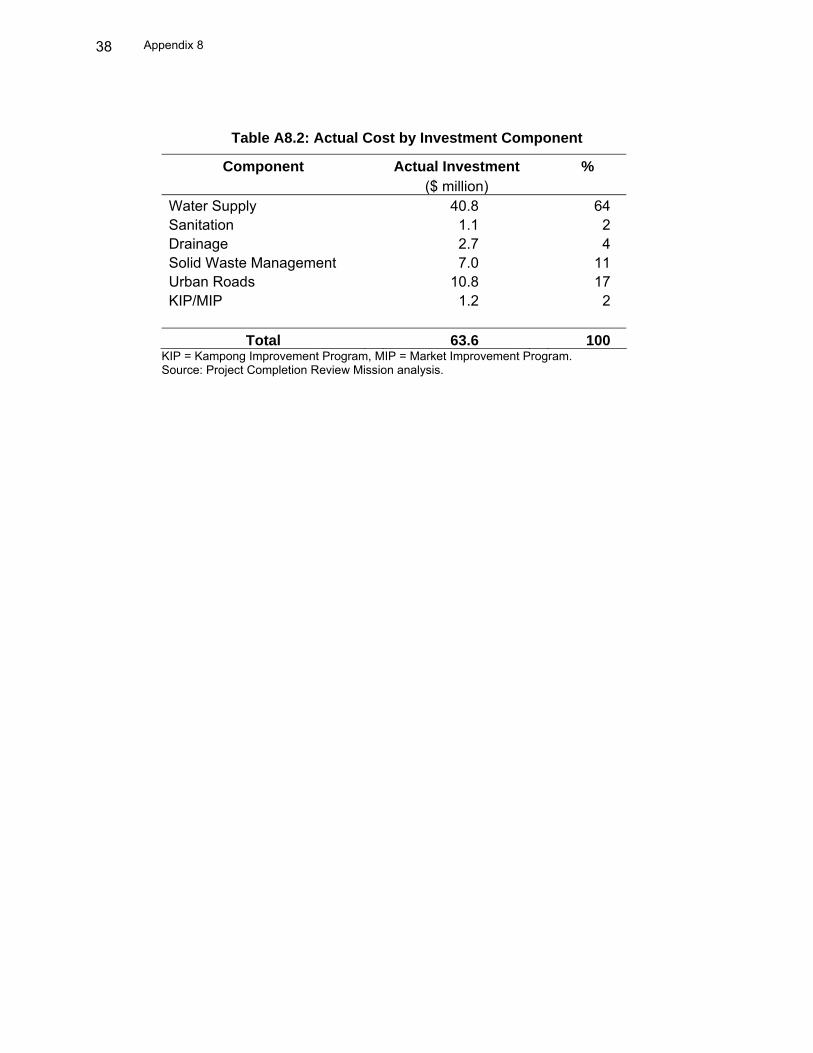
Appendix 8
38
Table A8.2: Actual Cost by Investment Component
Component Actual Investment % ($ million) Water Supply 40.8 64 Sanitation 1.1 2 Drainage 2.7 4 Solid Waste Management 7.0 11 Urban Roads 10.8 17 KIP/MIP 1.2 2
Total 63.6 100 KIP = Kampong Improvement Program, MIP = Market Improvement Program. Source: Project Completion Review Mission analysis.
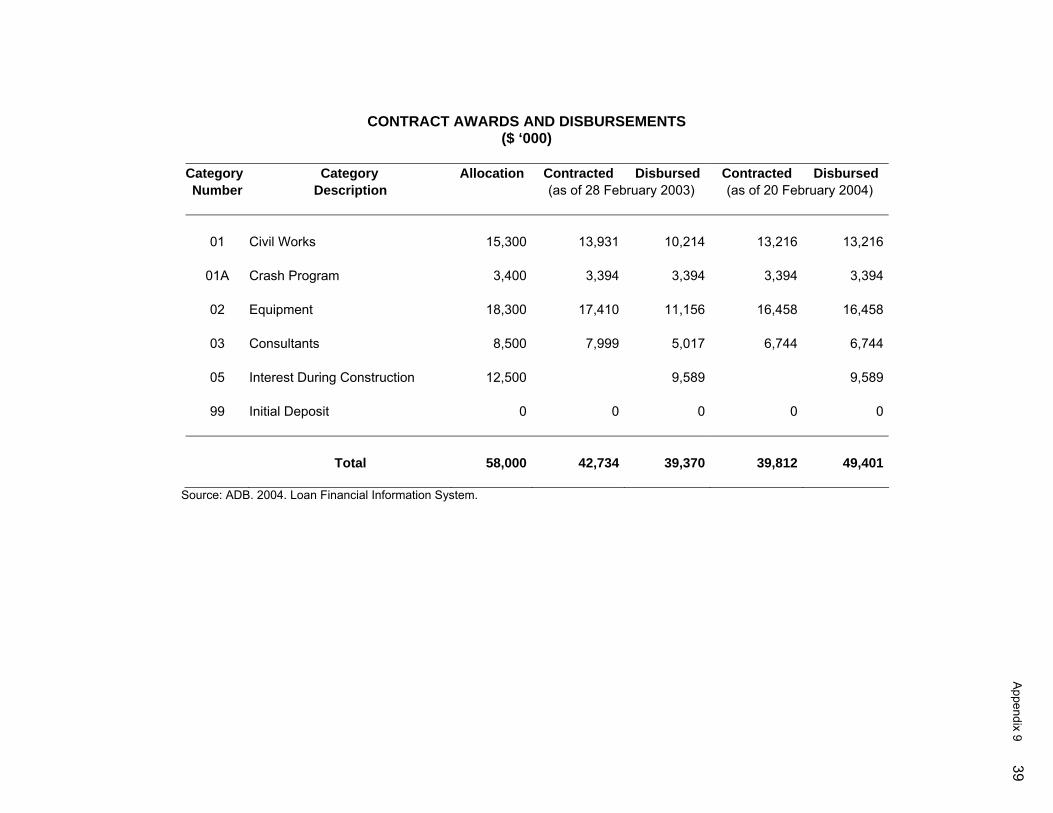
Appendix 9 39
CONTRACT AWARDS AND DISBURSEMENTS
($ ‘000)
Category Category Allocation Contracted Disbursed Contracted Disbursed Number Description (as of 28 February 2003) (as of 20 February 2004)
01 Civil Works 15,300 13,931 10,214 13,216 13,216
01A Crash Program 3,400 3,394 3,394 3,394 3,394
02 Equipment 18,300 17,410 11,156 16,458 16,458
03 Consultants 8,500 7,999 5,017 6,744 6,744
05 Interest During Construction 12,500 9,589 9,589
99 Initial Deposit 0 0 0 0 0 Total 58,000 42,734 39,370 39,812 49,401
Source: ADB. 2004. Loan Financial Information System.
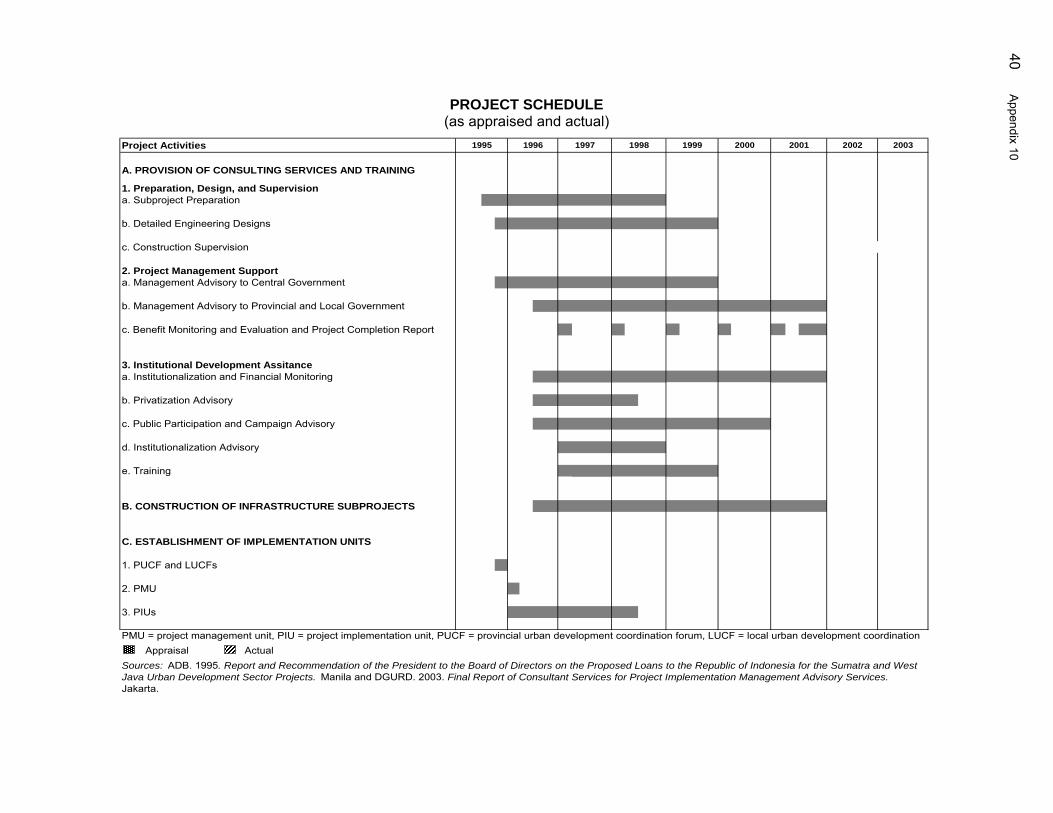
40 Appendix 10
PROJECT SCHEDULE (as appraised and actual)
Project Activities
A. PROVISION OF CONSULTING SERVICES AND TRAINING 1. Preparation, Design, and Supervisiona. Subproject Preparation
b. Detailed Engineering Designs
c. Construction Supervision
2. Project Management Supporta. Management Advisory to Central Government
b. Management Advisory to Provincial and Local Government
c. Benefit Monitoring and Evaluation and Project Completion Report
3. Institutional Development Assitancea. Institutionalization and Financial Monitoring
b. Privatization Advisory
c. Public Participation and Campaign Advisory
d. Institutionalization Advisory
e. Training
B. CONSTRUCTION OF INFRASTRUCTURE SUBPROJECTS
C. ESTABLISHMENT OF IMPLEMENTATION UNITS
1. PUCF and LUCFs
2. PMU
3. PIUs
Appraisal Actual Sources: ADB. 1995. Report and Recommendation of the President to the Board of Directors on the Proposed Loans to the Republic of Indonesia for the Sumatra and West Java Urban Development Sector Projects. Manila and DGURD. 2003. Final Report of Consultant Services for Project Implementation Management Advisory Services. Jakarta.
20031999 2000 2001 20021995
PMU = project management unit, PIU = project implementation unit, PUCF = provincial urban development coordination forum, LUCF = local urban development coordination
1996 1997 1998
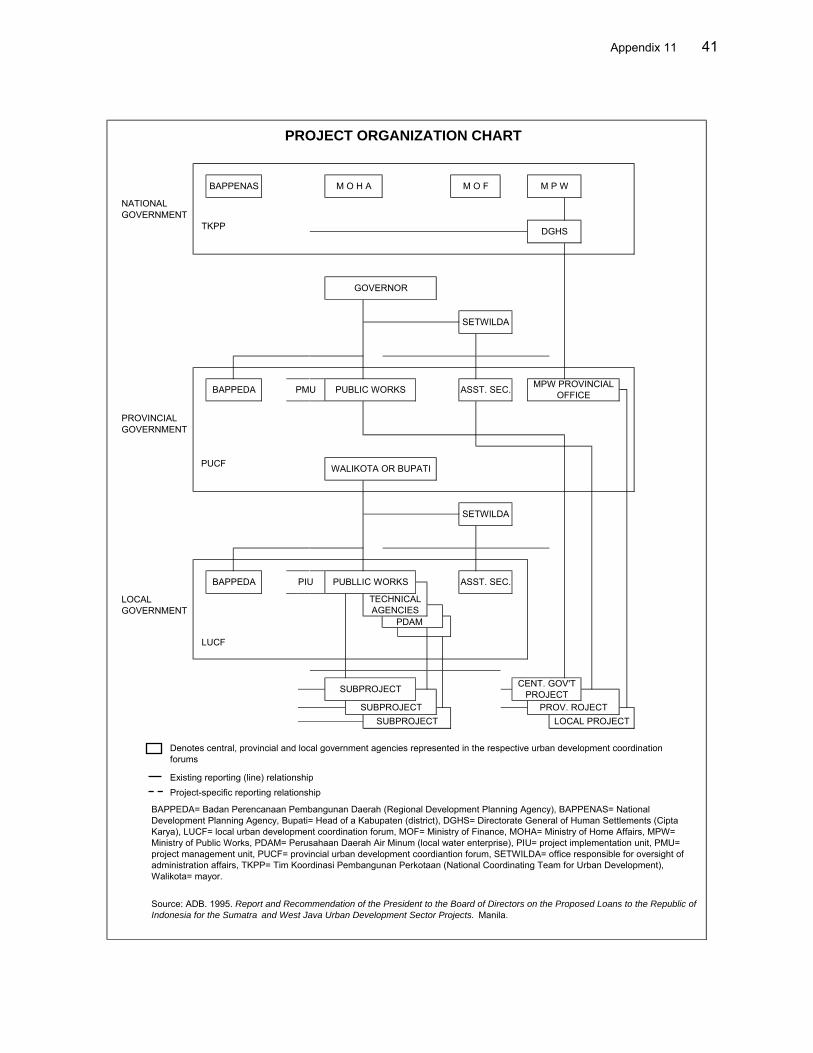
Appendix 11 41
PROJECT ORGANIZATION CHART
NATIONALGOVERNMENT
PROVINCIALGOVERNMENT
LOCALGOVERNMENT
Existing reporting (line) relationshipProject-specific reporting relationship
LOCAL PROJECTPROV. ROJECT
CENT. GOV'T PROJECT
WALIKOTA OR BUPATI
PDAM
SETWILDA
ASST. SEC.
PUCF
SUBPROJECTSUBPROJECT
SUBPROJECT
LUCF
PUBLLIC WORKS
TECHNICAL AGENCIES
BAPPEDA PIU
M P WM O H ABAPPENAS M O F
GOVERNOR
TKPP
SETWILDA
ASST. SEC.
BAPPEDA= Badan Perencanaan Pembangunan Daerah (Regional Development Planning Agency), BAPPENAS= National Development Planning Agency, Bupati= Head of a Kabupaten (district), DGHS= Directorate General of Human Settlements (Cipta Karya), LUCF= local urban development coordination forum, MOF= Ministry of Finance, MOHA= Ministry of Home Affairs, MPW= Ministry of Public Works, PDAM= Perusahaan Daerah Air Minum (local water enterprise), PIU= project implementation unit, PMU= project management unit, PUCF= provincial urban development coordiantion forum, SETWILDA= office responsible for oversight of administration affairs, TKPP= Tim Koordinasi Pembangunan Perkotaan (National Coordinating Team for Urban Development), Walikota= mayor.
Source: ADB. 1995. Report and Recommendation of the President to the Board of Directors on the Proposed Loans to the Republic of Indonesia for the Sumatra and West Java Urban Development Sector Projects. Manila.
Denotes central, provincial and local government agencies represented in the respective urban development coordination forums
PROJECT ORGANIZATION CHART
PUBLIC WORKSBAPPEDA
DGHS
MPW PROVINCIALOFFICEPMU
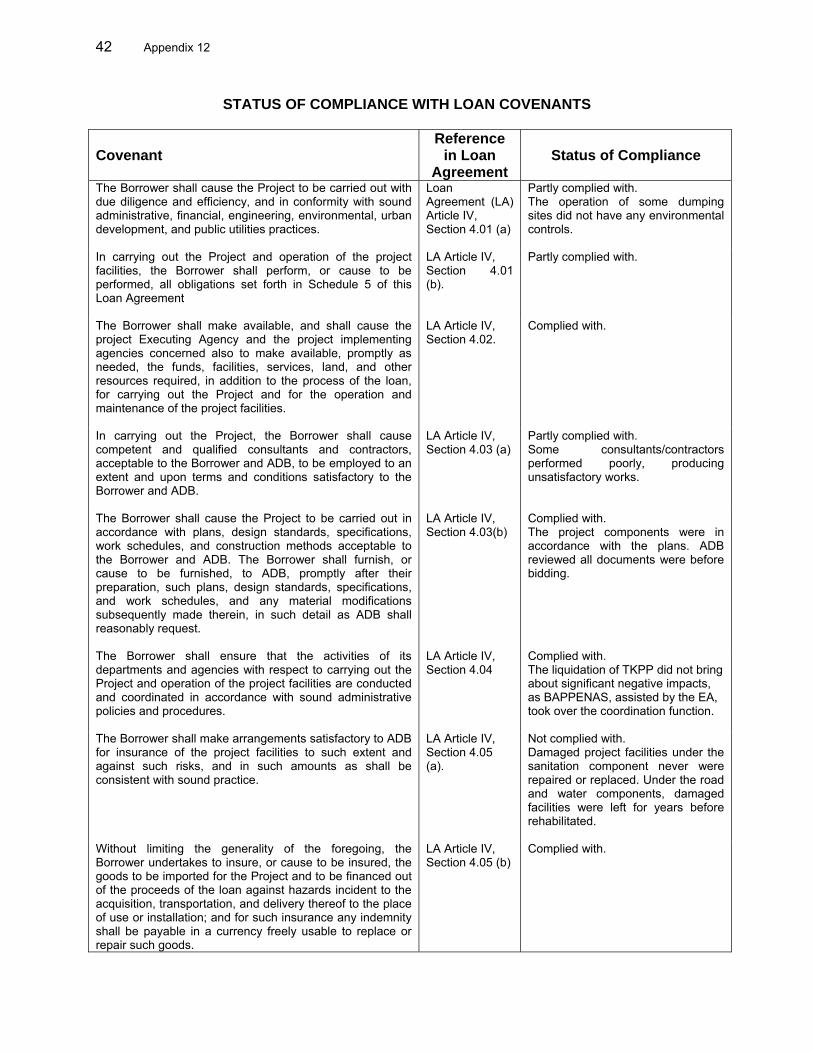
42 Appendix 12
STATUS OF COMPLIANCE WITH LOAN COVENANTS
Covenant
Reference in Loan
Agreement
Status of Compliance
The Borrower shall cause the Project to be carried out with due diligence and efficiency, and in conformity with sound administrative, financial, engineering, environmental, urban development, and public utilities practices.
Loan Agreement (LA) Article IV, Section 4.01 (a)
Partly complied with. The operation of some dumping sites did not have any environmental controls.
In carrying out the Project and operation of the project facilities, the Borrower shall perform, or cause to be performed, all obligations set forth in Schedule 5 of this Loan Agreement
LA Article IV, Section 4.01 (b).
Partly complied with.
The Borrower shall make available, and shall cause the project Executing Agency and the project implementing agencies concerned also to make available, promptly as needed, the funds, facilities, services, land, and other resources required, in addition to the process of the loan, for carrying out the Project and for the operation and maintenance of the project facilities.
LA Article IV, Section 4.02.
Complied with.
In carrying out the Project, the Borrower shall cause competent and qualified consultants and contractors, acceptable to the Borrower and ADB, to be employed to an extent and upon terms and conditions satisfactory to the Borrower and ADB.
LA Article IV, Section 4.03 (a)
Partly complied with. Some consultants/contractors performed poorly, producing unsatisfactory works.
The Borrower shall cause the Project to be carried out in accordance with plans, design standards, specifications, work schedules, and construction methods acceptable to the Borrower and ADB. The Borrower shall furnish, or cause to be furnished, to ADB, promptly after their preparation, such plans, design standards, specifications, and work schedules, and any material modifications subsequently made therein, in such detail as ADB shall reasonably request.
LA Article IV, Section 4.03(b)
Complied with. The project components were in accordance with the plans. ADB reviewed all documents were before bidding.
The Borrower shall ensure that the activities of its departments and agencies with respect to carrying out the Project and operation of the project facilities are conducted and coordinated in accordance with sound administrative policies and procedures.
LA Article IV, Section 4.04
Complied with. The liquidation of TKPP did not bring about significant negative impacts, as BAPPENAS, assisted by the EA, took over the coordination function.
The Borrower shall make arrangements satisfactory to ADB for insurance of the project facilities to such extent and against such risks, and in such amounts as shall be consistent with sound practice.
LA Article IV, Section 4.05 (a).
Not complied with. Damaged project facilities under the sanitation component never were repaired or replaced. Under the road and water components, damaged facilities were left for years before rehabilitated.
Without limiting the generality of the foregoing, the Borrower undertakes to insure, or cause to be insured, the goods to be imported for the Project and to be financed out of the proceeds of the loan against hazards incident to the acquisition, transportation, and delivery thereof to the place of use or installation; and for such insurance any indemnity shall be payable in a currency freely usable to replace or repair such goods.
LA Article IV, Section 4.05 (b)
Complied with.
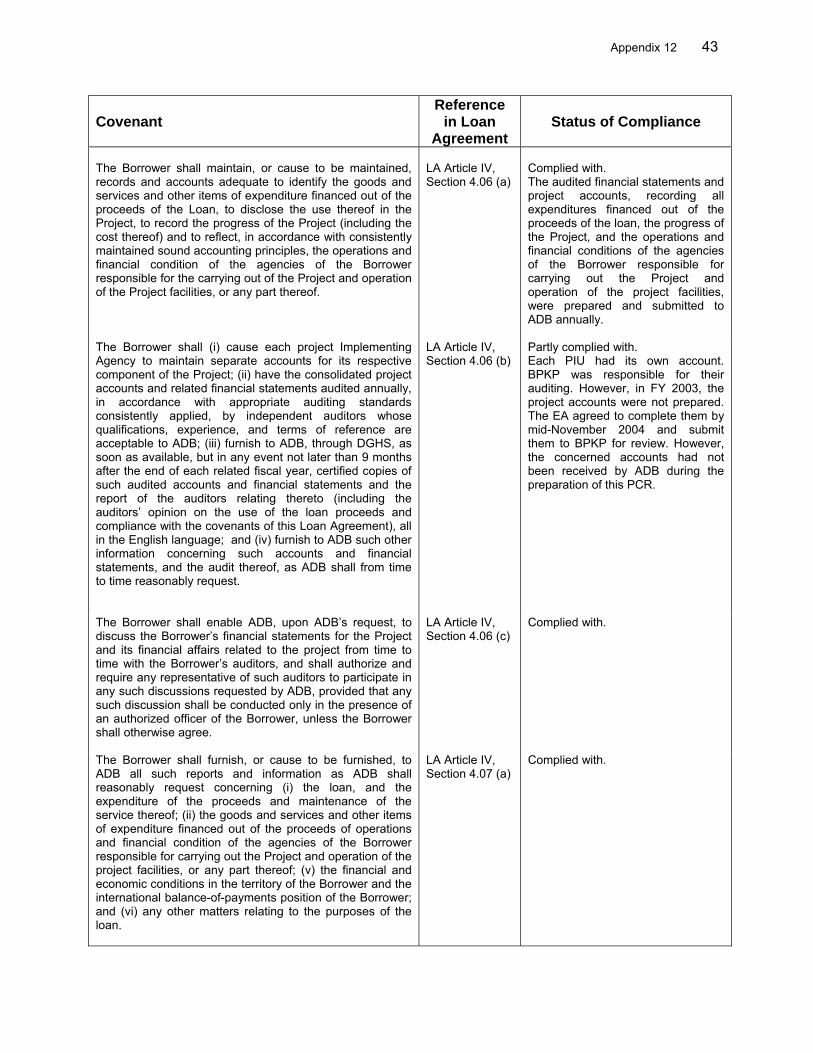
Appendix 12 43
Covenant
Reference in Loan
Agreement
Status of Compliance
The Borrower shall maintain, or cause to be maintained, records and accounts adequate to identify the goods and services and other items of expenditure financed out of the proceeds of the Loan, to disclose the use thereof in the Project, to record the progress of the Project (including the cost thereof) and to reflect, in accordance with consistently maintained sound accounting principles, the operations and financial condition of the agencies of the Borrower responsible for the carrying out of the Project and operation of the Project facilities, or any part thereof.
LA Article IV, Section 4.06 (a)
Complied with. The audited financial statements and project accounts, recording all expenditures financed out of the proceeds of the loan, the progress of the Project, and the operations and financial conditions of the agencies of the Borrower responsible for carrying out the Project and operation of the project facilities, were prepared and submitted to ADB annually.
The Borrower shall (i) cause each project Implementing Agency to maintain separate accounts for its respective component of the Project; (ii) have the consolidated project accounts and related financial statements audited annually, in accordance with appropriate auditing standards consistently applied, by independent auditors whose qualifications, experience, and terms of reference are acceptable to ADB; (iii) furnish to ADB, through DGHS, as soon as available, but in any event not later than 9 months after the end of each related fiscal year, certified copies of such audited accounts and financial statements and the report of the auditors relating thereto (including the auditors’ opinion on the use of the loan proceeds and compliance with the covenants of this Loan Agreement), all in the English language; and (iv) furnish to ADB such other information concerning such accounts and financial statements, and the audit thereof, as ADB shall from time to time reasonably request.
LA Article IV, Section 4.06 (b)
Partly complied with. Each PIU had its own account. BPKP was responsible for their auditing. However, in FY 2003, the project accounts were not prepared. The EA agreed to complete them by mid-November 2004 and submit them to BPKP for review. However, the concerned accounts had not been received by ADB during the preparation of this PCR.
The Borrower shall enable ADB, upon ADB’s request, to discuss the Borrower’s financial statements for the Project and its financial affairs related to the project from time to time with the Borrower’s auditors, and shall authorize and require any representative of such auditors to participate in any such discussions requested by ADB, provided that any such discussion shall be conducted only in the presence of an authorized officer of the Borrower, unless the Borrower shall otherwise agree.
LA Article IV, Section 4.06 (c)
Complied with.
The Borrower shall furnish, or cause to be furnished, to ADB all such reports and information as ADB shall reasonably request concerning (i) the loan, and the expenditure of the proceeds and maintenance of the service thereof; (ii) the goods and services and other items of expenditure financed out of the proceeds of operations and financial condition of the agencies of the Borrower responsible for carrying out the Project and operation of the project facilities, or any part thereof; (v) the financial and economic conditions in the territory of the Borrower and the international balance-of-payments position of the Borrower; and (vi) any other matters relating to the purposes of the loan.
LA Article IV, Section 4.07 (a)
Complied with.
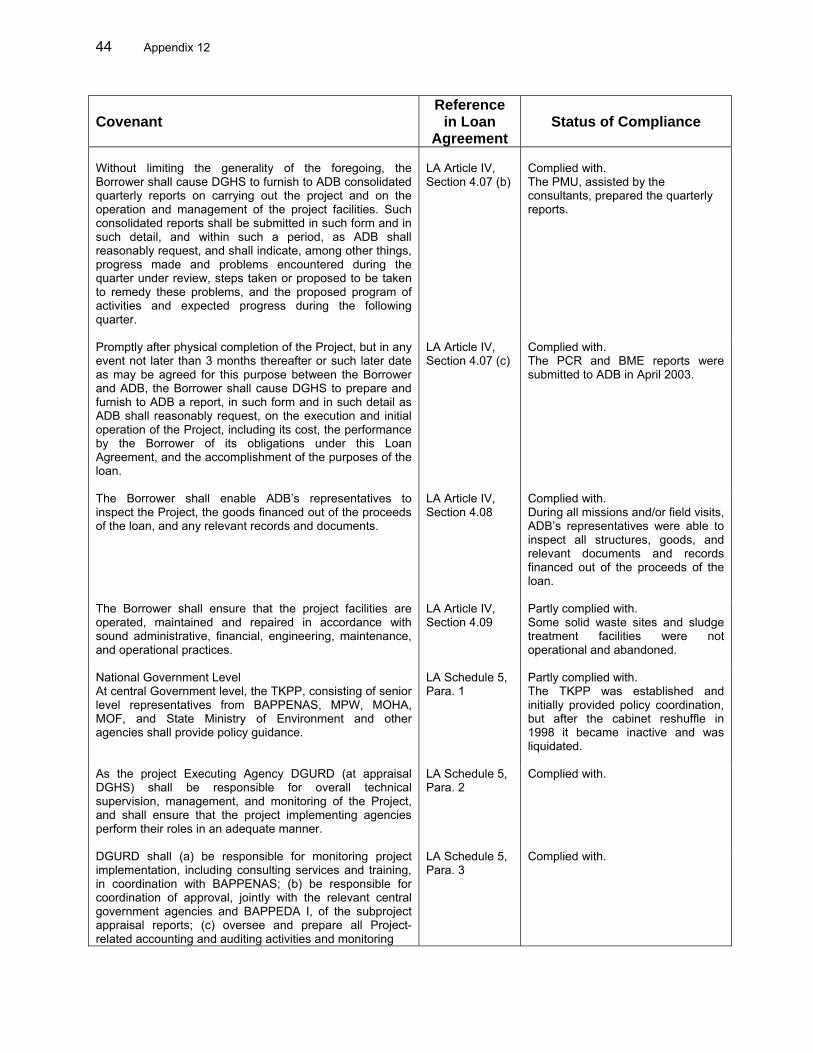
44 Appendix 12
Covenant
Reference in Loan
Agreement
Status of Compliance
Without limiting the generality of the foregoing, the Borrower shall cause DGHS to furnish to ADB consolidated quarterly reports on carrying out the project and on the operation and management of the project facilities. Such consolidated reports shall be submitted in such form and in such detail, and within such a period, as ADB shall reasonably request, and shall indicate, among other things, progress made and problems encountered during the quarter under review, steps taken or proposed to be taken to remedy these problems, and the proposed program of activities and expected progress during the following quarter.
LA Article IV, Section 4.07 (b)
Complied with. The PMU, assisted by the consultants, prepared the quarterly reports.
Promptly after physical completion of the Project, but in any event not later than 3 months thereafter or such later date as may be agreed for this purpose between the Borrower and ADB, the Borrower shall cause DGHS to prepare and furnish to ADB a report, in such form and in such detail as ADB shall reasonably request, on the execution and initial operation of the Project, including its cost, the performance by the Borrower of its obligations under this Loan Agreement, and the accomplishment of the purposes of the loan.
LA Article IV, Section 4.07 (c)
Complied with. The PCR and BME reports were submitted to ADB in April 2003.
The Borrower shall enable ADB’s representatives to inspect the Project, the goods financed out of the proceeds of the loan, and any relevant records and documents.
LA Article IV, Section 4.08
Complied with. During all missions and/or field visits, ADB’s representatives were able to inspect all structures, goods, and relevant documents and records financed out of the proceeds of the loan.
The Borrower shall ensure that the project facilities are operated, maintained and repaired in accordance with sound administrative, financial, engineering, maintenance, and operational practices.
LA Article IV, Section 4.09
Partly complied with. Some solid waste sites and sludge treatment facilities were not operational and abandoned.
National Government Level At central Government level, the TKPP, consisting of senior level representatives from BAPPENAS, MPW, MOHA, MOF, and State Ministry of Environment and other agencies shall provide policy guidance.
LA Schedule 5, Para. 1
Partly complied with. The TKPP was established and initially provided policy coordination, but after the cabinet reshuffle in 1998 it became inactive and was liquidated.
As the project Executing Agency DGURD (at appraisal DGHS) shall be responsible for overall technical supervision, management, and monitoring of the Project, and shall ensure that the project implementing agencies perform their roles in an adequate manner.
LA Schedule 5, Para. 2
Complied with.
DGURD shall (a) be responsible for monitoring project implementation, including consulting services and training, in coordination with BAPPENAS; (b) be responsible for coordination of approval, jointly with the relevant central government agencies and BAPPEDA I, of the subproject appraisal reports; (c) oversee and prepare all Project-related accounting and auditing activities and monitoring
LA Schedule 5, Para. 3
Complied with.
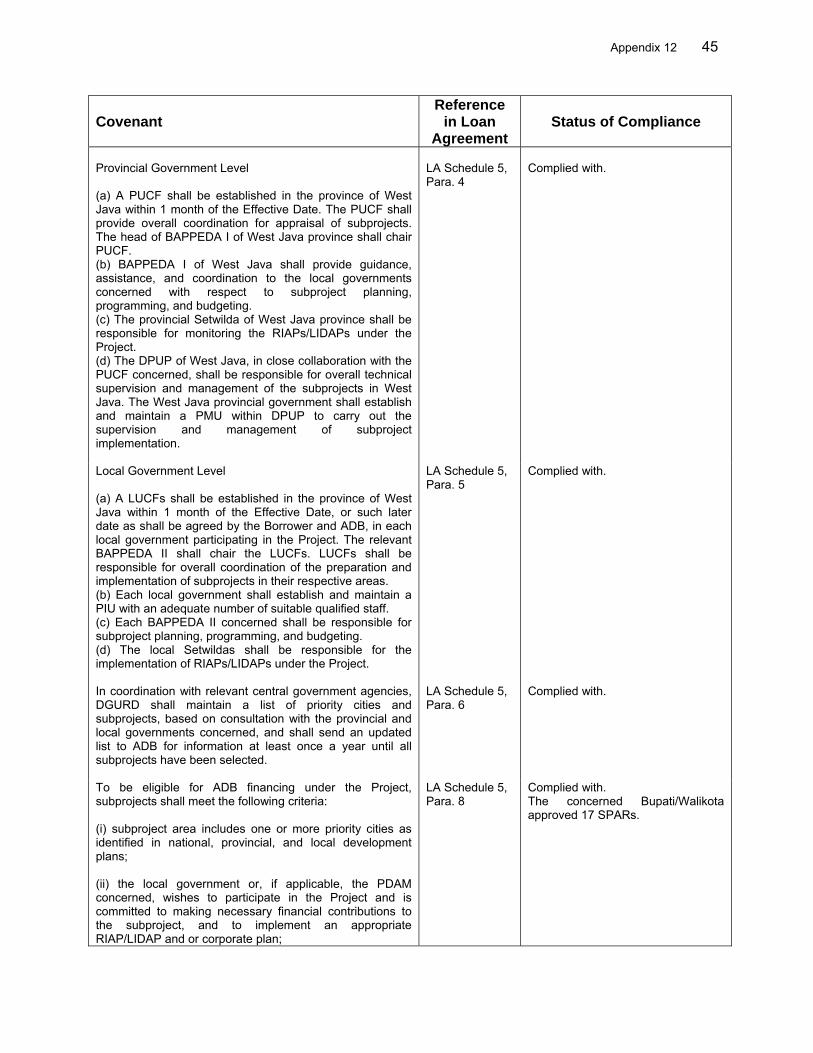
Appendix 12 45
Covenant
Reference in Loan
Agreement
Status of Compliance
Provincial Government Level (a) A PUCF shall be established in the province of West Java within 1 month of the Effective Date. The PUCF shall provide overall coordination for appraisal of subprojects. The head of BAPPEDA I of West Java province shall chair PUCF. (b) BAPPEDA I of West Java shall provide guidance, assistance, and coordination to the local governments concerned with respect to subproject planning, programming, and budgeting. (c) The provincial Setwilda of West Java province shall be responsible for monitoring the RIAPs/LIDAPs under the Project. (d) The DPUP of West Java, in close collaboration with the PUCF concerned, shall be responsible for overall technical supervision and management of the subprojects in West Java. The West Java provincial government shall establish and maintain a PMU within DPUP to carry out the supervision and management of subproject implementation.
LA Schedule 5, Para. 4
Complied with.
Local Government Level (a) A LUCFs shall be established in the province of West Java within 1 month of the Effective Date, or such later date as shall be agreed by the Borrower and ADB, in each local government participating in the Project. The relevant BAPPEDA II shall chair the LUCFs. LUCFs shall be responsible for overall coordination of the preparation and implementation of subprojects in their respective areas. (b) Each local government shall establish and maintain a PIU with an adequate number of suitable qualified staff. (c) Each BAPPEDA II concerned shall be responsible for subproject planning, programming, and budgeting. (d) The local Setwildas shall be responsible for the implementation of RIAPs/LIDAPs under the Project.
LA Schedule 5, Para. 5
Complied with.
In coordination with relevant central government agencies, DGURD shall maintain a list of priority cities and subprojects, based on consultation with the provincial and local governments concerned, and shall send an updated list to ADB for information at least once a year until all subprojects have been selected.
LA Schedule 5, Para. 6
Complied with.
To be eligible for ADB financing under the Project, subprojects shall meet the following criteria: (i) subproject area includes one or more priority cities as identified in national, provincial, and local development plans; (ii) the local government or, if applicable, the PDAM concerned, wishes to participate in the Project and is committed to making necessary financial contributions to the subproject, and to implement an appropriate RIAP/LIDAP and or corporate plan;
LA Schedule 5, Para. 8
Complied with. The concerned Bupati/Walikota approved 17 SPARs.
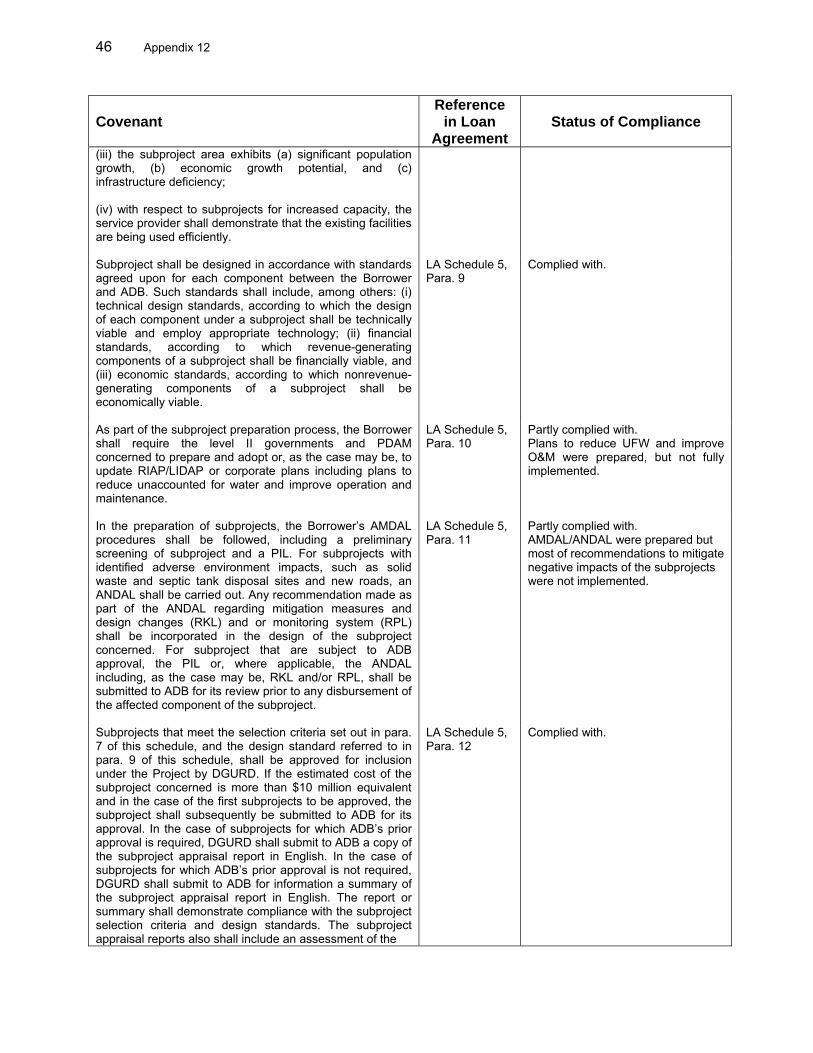
46 Appendix 12
Covenant
Reference in Loan
Agreement
Status of Compliance
(iii) the subproject area exhibits (a) significant population growth, (b) economic growth potential, and (c) infrastructure deficiency; (iv) with respect to subprojects for increased capacity, the service provider shall demonstrate that the existing facilities are being used efficiently.
Subproject shall be designed in accordance with standards agreed upon for each component between the Borrower and ADB. Such standards shall include, among others: (i) technical design standards, according to which the design of each component under a subproject shall be technically viable and employ appropriate technology; (ii) financial standards, according to which revenue-generating components of a subproject shall be financially viable, and (iii) economic standards, according to which nonrevenue-generating components of a subproject shall be economically viable.
LA Schedule 5, Para. 9
Complied with.
As part of the subproject preparation process, the Borrower shall require the level II governments and PDAM concerned to prepare and adopt or, as the case may be, to update RIAP/LIDAP or corporate plans including plans to reduce unaccounted for water and improve operation and maintenance.
LA Schedule 5, Para. 10
Partly complied with. Plans to reduce UFW and improve O&M were prepared, but not fully implemented.
In the preparation of subprojects, the Borrower’s AMDAL procedures shall be followed, including a preliminary screening of subproject and a PIL. For subprojects with identified adverse environment impacts, such as solid waste and septic tank disposal sites and new roads, an ANDAL shall be carried out. Any recommendation made as part of the ANDAL regarding mitigation measures and design changes (RKL) and or monitoring system (RPL) shall be incorporated in the design of the subproject concerned. For subproject that are subject to ADB approval, the PIL or, where applicable, the ANDAL including, as the case may be, RKL and/or RPL, shall be submitted to ADB for its review prior to any disbursement of the affected component of the subproject.
LA Schedule 5, Para. 11
Partly complied with. AMDAL/ANDAL were prepared but most of recommendations to mitigate negative impacts of the subprojects were not implemented.
Subprojects that meet the selection criteria set out in para. 7 of this schedule, and the design standard referred to in para. 9 of this schedule, shall be approved for inclusion under the Project by DGURD. If the estimated cost of the subproject concerned is more than $10 million equivalent and in the case of the first subprojects to be approved, the subproject shall subsequently be submitted to ADB for its approval. In the case of subprojects for which ADB’s prior approval is required, DGURD shall submit to ADB a copy of the subproject appraisal report in English. In the case of subprojects for which ADB’s prior approval is not required, DGURD shall submit to ADB for information a summary of the subproject appraisal report in English. The report or summary shall demonstrate compliance with the subproject selection criteria and design standards. The subproject appraisal reports also shall include an assessment of the
LA Schedule 5, Para. 12
Complied with.
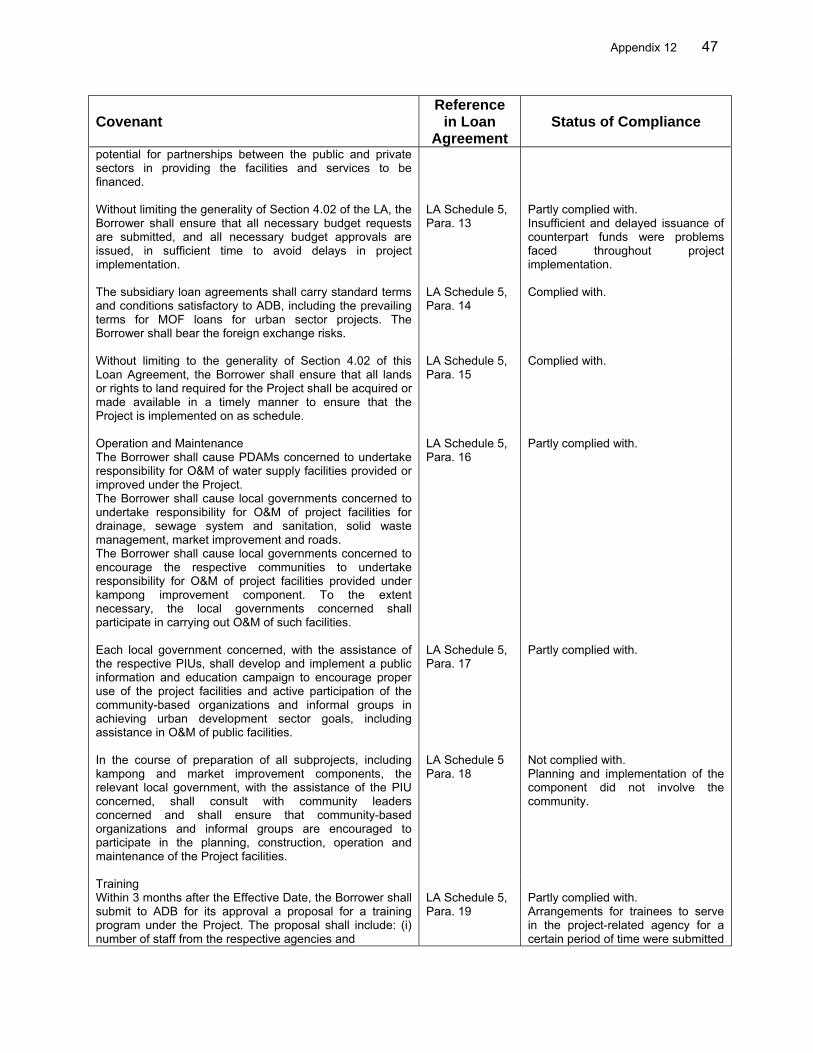
Appendix 12 47
Covenant
Reference in Loan
Agreement
Status of Compliance
potential for partnerships between the public and private sectors in providing the facilities and services to be financed.
Without limiting the generality of Section 4.02 of the LA, the Borrower shall ensure that all necessary budget requests are submitted, and all necessary budget approvals are issued, in sufficient time to avoid delays in project implementation.
LA Schedule 5, Para. 13
Partly complied with. Insufficient and delayed issuance of counterpart funds were problems faced throughout project implementation.
The subsidiary loan agreements shall carry standard terms and conditions satisfactory to ADB, including the prevailing terms for MOF loans for urban sector projects. The Borrower shall bear the foreign exchange risks.
LA Schedule 5, Para. 14
Complied with.
Without limiting to the generality of Section 4.02 of this Loan Agreement, the Borrower shall ensure that all lands or rights to land required for the Project shall be acquired or made available in a timely manner to ensure that the Project is implemented on as schedule.
LA Schedule 5, Para. 15
Complied with.
Operation and Maintenance The Borrower shall cause PDAMs concerned to undertake responsibility for O&M of water supply facilities provided or improved under the Project. The Borrower shall cause local governments concerned to undertake responsibility for O&M of project facilities for drainage, sewage system and sanitation, solid waste management, market improvement and roads. The Borrower shall cause local governments concerned to encourage the respective communities to undertake responsibility for O&M of project facilities provided under kampong improvement component. To the extent necessary, the local governments concerned shall participate in carrying out O&M of such facilities.
LA Schedule 5, Para. 16
Partly complied with.
Each local government concerned, with the assistance of the respective PIUs, shall develop and implement a public information and education campaign to encourage proper use of the project facilities and active participation of the community-based organizations and informal groups in achieving urban development sector goals, including assistance in O&M of public facilities.
LA Schedule 5, Para. 17
Partly complied with.
In the course of preparation of all subprojects, including kampong and market improvement components, the relevant local government, with the assistance of the PIU concerned, shall consult with community leaders concerned and shall ensure that community-based organizations and informal groups are encouraged to participate in the planning, construction, operation and maintenance of the Project facilities.
LA Schedule 5 Para. 18
Not complied with. Planning and implementation of the component did not involve the community.
Training Within 3 months after the Effective Date, the Borrower shall submit to ADB for its approval a proposal for a training program under the Project. The proposal shall include: (i) number of staff from the respective agencies and
LA Schedule 5, Para. 19
Partly complied with. Arrangements for trainees to serve in the project-related agency for a certain period of time were submitted
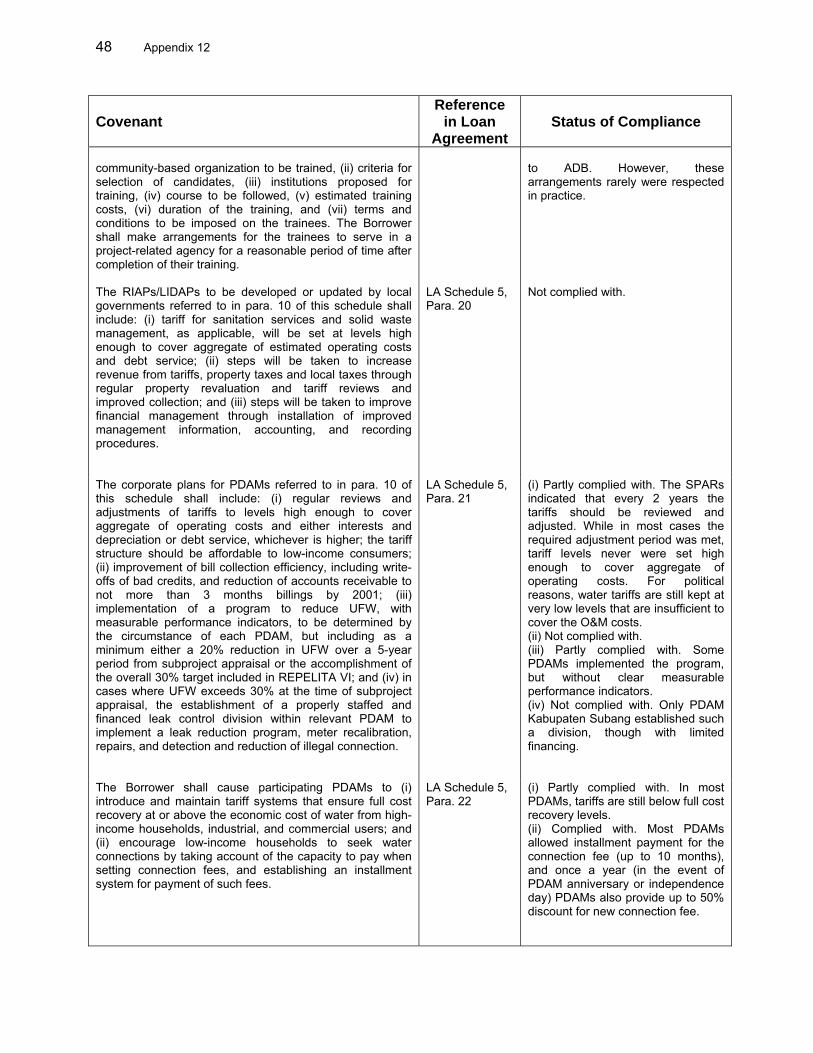
48 Appendix 12
Covenant
Reference in Loan
Agreement
Status of Compliance
community-based organization to be trained, (ii) criteria for selection of candidates, (iii) institutions proposed for training, (iv) course to be followed, (v) estimated training costs, (vi) duration of the training, and (vii) terms and conditions to be imposed on the trainees. The Borrower shall make arrangements for the trainees to serve in a project-related agency for a reasonable period of time after completion of their training.
to ADB. However, these arrangements rarely were respected in practice.
The RIAPs/LIDAPs to be developed or updated by local governments referred to in para. 10 of this schedule shall include: (i) tariff for sanitation services and solid waste management, as applicable, will be set at levels high enough to cover aggregate of estimated operating costs and debt service; (ii) steps will be taken to increase revenue from tariffs, property taxes and local taxes through regular property revaluation and tariff reviews and improved collection; and (iii) steps will be taken to improve financial management through installation of improved management information, accounting, and recording procedures.
LA Schedule 5, Para. 20
Not complied with.
The corporate plans for PDAMs referred to in para. 10 of this schedule shall include: (i) regular reviews and adjustments of tariffs to levels high enough to cover aggregate of operating costs and either interests and depreciation or debt service, whichever is higher; the tariff structure should be affordable to low-income consumers; (ii) improvement of bill collection efficiency, including write-offs of bad credits, and reduction of accounts receivable to not more than 3 months billings by 2001; (iii) implementation of a program to reduce UFW, with measurable performance indicators, to be determined by the circumstance of each PDAM, but including as a minimum either a 20% reduction in UFW over a 5-year period from subproject appraisal or the accomplishment of the overall 30% target included in REPELITA VI; and (iv) in cases where UFW exceeds 30% at the time of subproject appraisal, the establishment of a properly staffed and financed leak control division within relevant PDAM to implement a leak reduction program, meter recalibration, repairs, and detection and reduction of illegal connection.
LA Schedule 5, Para. 21
(i) Partly complied with. The SPARs indicated that every 2 years the tariffs should be reviewed and adjusted. While in most cases the required adjustment period was met, tariff levels never were set high enough to cover aggregate of operating costs. For political reasons, water tariffs are still kept at very low levels that are insufficient to cover the O&M costs. (ii) Not complied with. (iii) Partly complied with. Some PDAMs implemented the program, but without clear measurable performance indicators. (iv) Not complied with. Only PDAM Kabupaten Subang established such a division, though with limited financing.
The Borrower shall cause participating PDAMs to (i) introduce and maintain tariff systems that ensure full cost recovery at or above the economic cost of water from high-income households, industrial, and commercial users; and (ii) encourage low-income households to seek water connections by taking account of the capacity to pay when setting connection fees, and establishing an installment system for payment of such fees.
LA Schedule 5, Para. 22
(i) Partly complied with. In most PDAMs, tariffs are still below full cost recovery levels. (ii) Complied with. Most PDAMs allowed installment payment for the connection fee (up to 10 months), and once a year (in the event of PDAM anniversary or independence day) PDAMs also provide up to 50% discount for new connection fee.
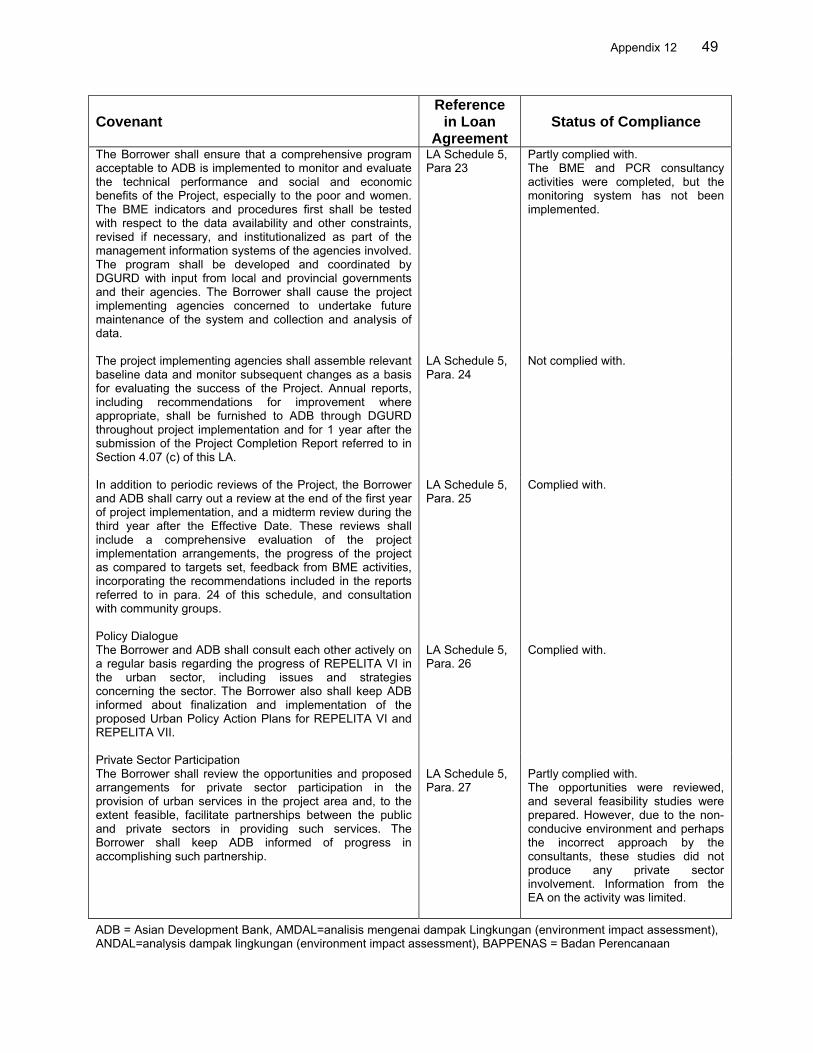
Appendix 12 49
Covenant
Reference in Loan
Agreement
Status of Compliance
The Borrower shall ensure that a comprehensive program acceptable to ADB is implemented to monitor and evaluate the technical performance and social and economic benefits of the Project, especially to the poor and women. The BME indicators and procedures first shall be tested with respect to the data availability and other constraints, revised if necessary, and institutionalized as part of the management information systems of the agencies involved. The program shall be developed and coordinated by DGURD with input from local and provincial governments and their agencies. The Borrower shall cause the project implementing agencies concerned to undertake future maintenance of the system and collection and analysis of data.
LA Schedule 5, Para 23
Partly complied with. The BME and PCR consultancy activities were completed, but the monitoring system has not been implemented.
The project implementing agencies shall assemble relevant baseline data and monitor subsequent changes as a basis for evaluating the success of the Project. Annual reports, including recommendations for improvement where appropriate, shall be furnished to ADB through DGURD throughout project implementation and for 1 year after the submission of the Project Completion Report referred to in Section 4.07 (c) of this LA.
LA Schedule 5, Para. 24
Not complied with.
In addition to periodic reviews of the Project, the Borrower and ADB shall carry out a review at the end of the first year of project implementation, and a midterm review during the third year after the Effective Date. These reviews shall include a comprehensive evaluation of the project implementation arrangements, the progress of the project as compared to targets set, feedback from BME activities, incorporating the recommendations included in the reports referred to in para. 24 of this schedule, and consultation with community groups.
LA Schedule 5, Para. 25
Complied with.
Policy Dialogue The Borrower and ADB shall consult each other actively on a regular basis regarding the progress of REPELITA VI in the urban sector, including issues and strategies concerning the sector. The Borrower also shall keep ADB informed about finalization and implementation of the proposed Urban Policy Action Plans for REPELITA VI and REPELITA VII.
LA Schedule 5, Para. 26
Complied with.
Private Sector Participation The Borrower shall review the opportunities and proposed arrangements for private sector participation in the provision of urban services in the project area and, to the extent feasible, facilitate partnerships between the public and private sectors in providing such services. The Borrower shall keep ADB informed of progress in accomplishing such partnership.
LA Schedule 5, Para. 27
Partly complied with. The opportunities were reviewed, and several feasibility studies were prepared. However, due to the non-conducive environment and perhaps the incorrect approach by the consultants, these studies did not produce any private sector involvement. Information from the EA on the activity was limited.
ADB = Asian Development Bank, AMDAL=analisis mengenai dampak Lingkungan (environment impact assessment), ANDAL=analysis dampak lingkungan (environment impact assessment), BAPPENAS = Badan Perencanaan
50 Appendix 12
Pembangunan Nasional (National Development Planning Agency), BAPPEDA = Badan Perencanaan Pembangunan Daerah (Regional Development Planning Agency), BME = benefit monitoring and evaluation, BPKP = Badan Pemeriksa Keuangan and Pembangunan (state audit agency), DGHS = Directorate General of Human Settlements, DGURD = Directorate General of Urban and Rural Development, DPUP = Dinas Pekerjaan Umum Propinsi (provincial public work agency), LIDAP = local government institutional development action plan, LUCF = local urban development coordination forum, MOHA = Ministry of Home Affairs, MPW = Ministry of Public Works, O&M=operation and maintenance, PCR = project completion report, PDAM = Perusahaan Daerah Air Minum (local water enterprise), PIL= penyajian informasi lingkungan (initial environment examinations), PIU=project implementation unit, PMU = project management unit, PUCF = provincial urban development coordination forum, RIAP = revenue improvement action plan, SPAR = subproject appraisal report; UFW = unaccounted-for water, REPELITA = Rencana Pembangunan Lima Tahun (five years development plan), TKPP = Tim Koordinasi Pembangunan Perkotaan (National Coordiation for Urban Development), RKL = rencana pengelolaan lingkungan (mitigation measures), RPL = rencana pemantauan lingkungan (monitoring system).
Source: Asian Development Bank’s Records
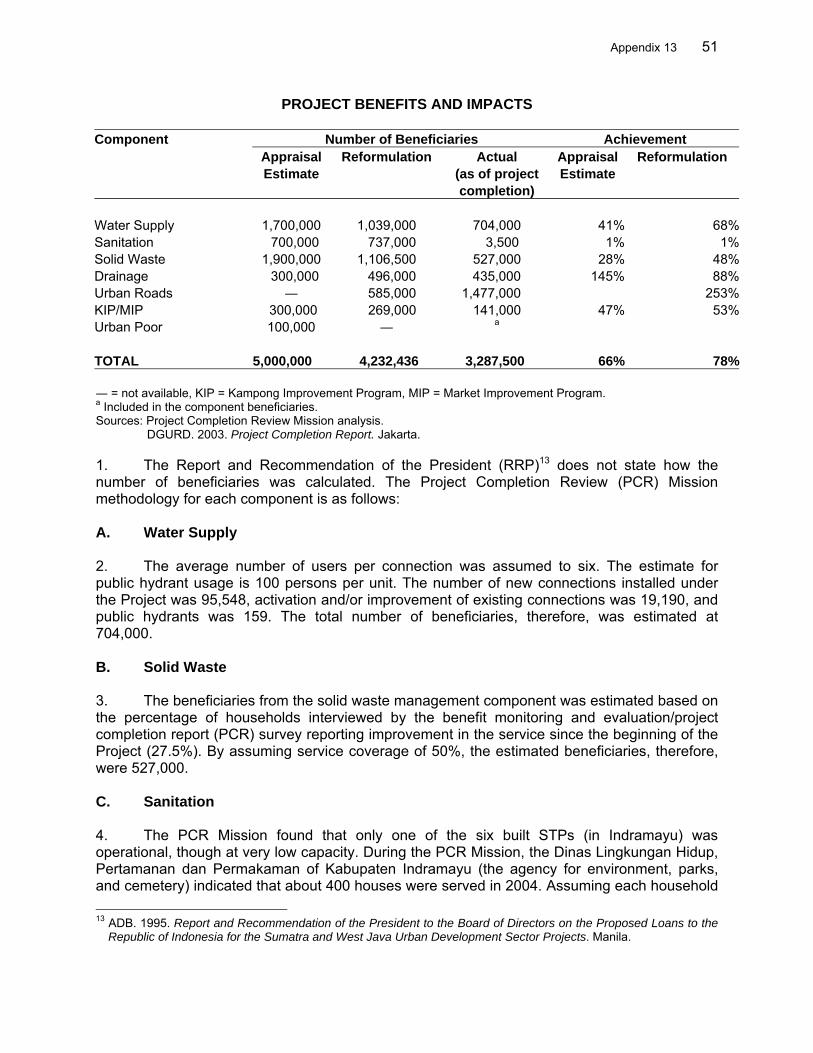
Appendix 13 51
PROJECT BENEFITS AND IMPACTS
Component Number of Beneficiaries Achievement Appraisal Reformulation Actual Appraisal Reformulation Estimate (as of project Estimate completion) Water Supply 1,700,000 1,039,000 704,000 41% 68%Sanitation 700,000 737,000 3,500 1% 1%Solid Waste 1,900,000 1,106,500 527,000 28% 48%Drainage 300,000 496,000 435,000 145% 88%Urban Roads ― 585,000 1,477,000 253%KIP/MIP 300,000 269,000 141,000 47% 53%Urban Poor 100,000 ― a TOTAL 5,000,000 4,232,436 3,287,500 66% 78% ― = not available, KIP = Kampong Improvement Program, MIP = Market Improvement Program. a Included in the component beneficiaries. Sources: Project Completion Review Mission analysis. DGURD. 2003. Project Completion Report. Jakarta. 1. The Report and Recommendation of the President (RRP)13 does not state how the number of beneficiaries was calculated. The Project Completion Review (PCR) Mission methodology for each component is as follows: A. Water Supply 2. The average number of users per connection was assumed to six. The estimate for public hydrant usage is 100 persons per unit. The number of new connections installed under the Project was 95,548, activation and/or improvement of existing connections was 19,190, and public hydrants was 159. The total number of beneficiaries, therefore, was estimated at 704,000. B. Solid Waste 3. The beneficiaries from the solid waste management component was estimated based on the percentage of households interviewed by the benefit monitoring and evaluation/project completion report (PCR) survey reporting improvement in the service since the beginning of the Project (27.5%). By assuming service coverage of 50%, the estimated beneficiaries, therefore, were 527,000. C. Sanitation 4. The PCR Mission found that only one of the six built STPs (in Indramayu) was operational, though at very low capacity. During the PCR Mission, the Dinas Lingkungan Hidup, Pertamanan dan Permakaman of Kabupaten Indramayu (the agency for environment, parks, and cemetery) indicated that about 400 houses were served in 2004. Assuming each household 13 ADB. 1995. Report and Recommendation of the President to the Board of Directors on the Proposed Loans to the
Republic of Indonesia for the Sumatra and West Java Urban Development Sector Projects. Manila.
52 Appendix 13
has six members, the beneficiaries from the STP is 2,400. Under component 35, communal septic tanks were constructed. Assuming that one unit communal septic tank is used by five households, the number of beneficiaries was estimated at 1,050. Thus, the total beneficiaries under this component was estimated at 3,500. D. Drainage 5. Areas of benefit were estimated at 0.5 square kilometer (km2) for primary drainage, 0.3 km2 for secondary drainage, and 0.1 km2 for tertiary drainage per linear km of construction. The number of beneficiaries was based on the urban density at the end of the Project. The number of beneficiaries, therefore, was approximately 435,000. E. Kampong Improvement Program (KIP)/Market Improvement Program (MIP) 6. Beneficiaries were estimated for each city by taking the area improved and assuming that population densities in these low-income areas were four times the average urban density. The result was 141,000 beneficiaries. F. Urban Roads 7. About 13 km of new roads were constructed, 137 km of roads were rehabilitated, and 40 km of roads were improved under the Project. Surveys and field observation conducted by the BME/PCR consultants indicated that about 1,477,000 persons benefit from the component.
Appendix 14 53
FINANCIAL AND ECONOMIC ANALYSIS
1. The Project Completion Review (PCR) Mission recalculated the economic internal rates of return (EIRRs) and financial internal rates of return (FIRRs) for several subprojects (based on the availability of data). The EIRRs were calculated for the water supply, sanitation, drainage, urban roads, and Kampung Improvement Program (KIP)/Market Improvement Program (MIP) components and the FIRRs for the water supply component. A summary of the economic and financial analyses is provided below. A. Assumptions and Methodology 2. For the economic analysis, duties, taxes, and other transfer payments were deducted from the investment costs. The economic life of infrastructure was assumed to be 15 years. All costs and revenue streams were converted to the 2004 price levels. 3. The approach used in the RRP14 was applied in the assessment of quantifiable benefits for the EIRR recalculation. The water supply improvements produced benefits to households with existing and new connections. Households previously connected to the piped water system benefited under the Project from the increased quantity of piped water. The households with new connections benefited from economic cost savings associated with switching from the non-pipe source to the piped system, and the consumer surplus on the incremental consumption. Market price data were collected as indicators of willingness to pay. 4. For the solid waste component, economic benefit was assumed to be 20% higher than the revenues from service charge. Losses in revenues due to collection inefficiency and revenue foregone from waste collected in public places, estimated at 30%, also were accounted for in the EIRR recalculation. 5. For roads, the concept of vehicle operating cost savings was used. This consisted of the reduction in operating time, savings in travel time for passengers and goods, and reduction in maintenance costs. Vehicle operating costs were calculated “with” and “without” the Project. Traffic counts were obtained from the provincial public works office. The savings in these costs benefited road transport operators and road users. 6. For drainage, quantifiable benefits consisted of savings on the repair and rehabilitation of houses and commercial properties damaged by flooding, as well as gains in ease of movement and improved environment. These factors were reflected in the significant difference between the land values in areas prone to flooding and those in adjacent areas with higher elevation. 7. Land values in disadvantaged kampongs (a residential area, usually for low-income classes, in a town or a city) and markets were generally low. The kampong and market improvement programs were expected to generate benefits that would be reflected in increased land values.
8. Because the social and environmental benefits generated by the Project were difficult to quantify, they were not included in the EIRR recalculation. The upgraded and better maintained water, solid waste management, and drainage systems improved public health and
14 ADB. 1995. Report and Recommendation of the President to the Board of Directors on the Proposed Loans to the
Republic of Indonesia for the Sumatra and West Java Urban Development Sector Projects. Manila.
54 Appendix 14
environmental conditions, reduced air and water pollution, and enhanced hygiene, sanitation, and visual impression. The solid waste management component reduced flood damage to property and infrastructure caused by overflowing drainage canals clogged with uncollected solid waste. B. Economic Analysis 9. The recalculated EIRRs of the water supply component ranged from 4.5% to 30.7% (Table A14.1). The EIRRs of PDAMs Kabupaten Ciamis, Kuningan, Garut, Lebak, and Pandeglang were about or close to the cut-off rate (ranged from 8.9% to 11.4%). Only the EIRR of PDAM Kabupaten Sukabumi was far below 12% (at 4.5%), probably due to the installation of fewer-than-expected new house connections (622 units compared with the target of 6,213). Kabupaten Indramayu registered the highest EIRR at 30.7%, which was attributable mainly to a high number of new house connections (20,828 units or 78% above the target). 10. For the solid waste management, the EIRRs for six of the 15 cities implementing the component were recalculated (Table A14.2). The EIRRs ranged from 5.2% (Pandeglang) to 32.2% (Tasikmalaya). A low service charge (Rp2,000/household, compared with Rp3,000/household in Tasikmalaya) was the main cause of the low EIRR for Pandeglang. Furthermore, the number of households served in Pandeglang (9,019 in 2004) was well below that in Tasikmalaya (23,264 households in 2004), as Pandeglang was less urbanized.
11. For the drainage component the EIRRs ranged from 15.2% to 29.1%, reflecting a substantial increase in land value before and after the Project. The recalculated EIRRs also indicated that all subprojects were economically viable. For the road component, the EIRRs ranged from 19.0% to 89.2%, showing that the subprojects were viable economically. Substantially reduced vehicle operating costs, derived from savings in travel time, was responsible for the unusually high EIRR in Majalaya. The EIRRs for the kampong and market improvement programs ranged from 10.5% to 26.8%. The EIRRs for the sanitation component were not recalculated, as most of the facilities built under the Project were not operational. C. Financial Analysis 12. The FIRRs ranged from –1.9% to 18.4% (Table A14.1). FIRRs for Tasikmalaya, Sukabumi, and Pandeglang could not be calculated as the net revenues were negative. The FIRRs for the solid waste management and sanitation components could not be calculated either, because the net revenues for the former were negative (with O&M costs exceeding revenue from service charges) and the latter was not used.
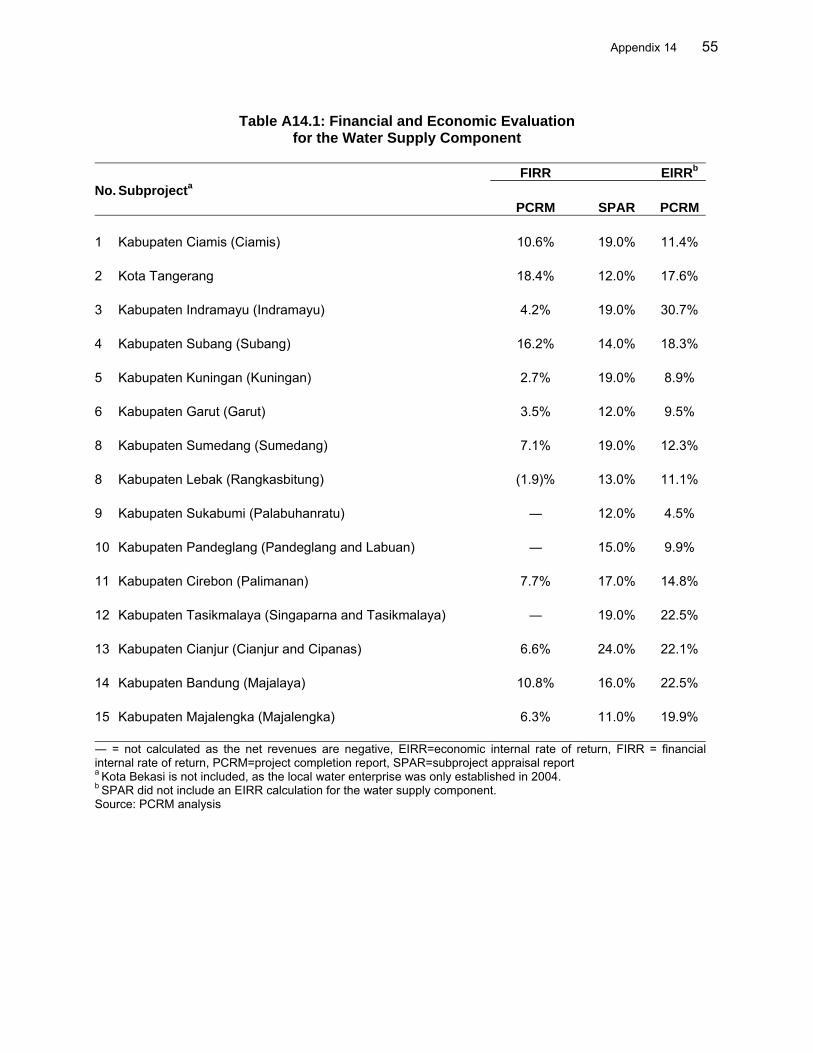
Appendix 14 55
Table A14.1: Financial and Economic Evaluation
for the Water Supply Component
FIRR EIRRb
No. Subprojecta PCRM SPAR PCRM 1 Kabupaten Ciamis (Ciamis) 10.6% 19.0% 11.4% 2 Kota Tangerang 18.4% 12.0% 17.6% 3 Kabupaten Indramayu (Indramayu) 4.2% 19.0% 30.7% 4 Kabupaten Subang (Subang) 16.2% 14.0% 18.3% 5 Kabupaten Kuningan (Kuningan) 2.7% 19.0% 8.9% 6 Kabupaten Garut (Garut) 3.5% 12.0% 9.5% 8 Kabupaten Sumedang (Sumedang) 7.1% 19.0% 12.3% 8 Kabupaten Lebak (Rangkasbitung) (1.9)% 13.0% 11.1% 9 Kabupaten Sukabumi (Palabuhanratu) ― 12.0% 4.5% 10 Kabupaten Pandeglang (Pandeglang and Labuan) ― 15.0% 9.9% 11 Kabupaten Cirebon (Palimanan) 7.7% 17.0% 14.8% 12 Kabupaten Tasikmalaya (Singaparna and Tasikmalaya) ― 19.0% 22.5% 13 Kabupaten Cianjur (Cianjur and Cipanas) 6.6% 24.0% 22.1% 14 Kabupaten Bandung (Majalaya) 10.8% 16.0% 22.5% 15 Kabupaten Majalengka (Majalengka) 6.3% 11.0% 19.9% ― = not calculated as the net revenues are negative, EIRR=economic internal rate of return, FIRR = financial internal rate of return, PCRM=project completion report, SPAR=subproject appraisal report a Kota Bekasi is not included, as the local water enterprise was only established in 2004. b SPAR did not include an EIRR calculation for the water supply component. Source: PCRM analysis
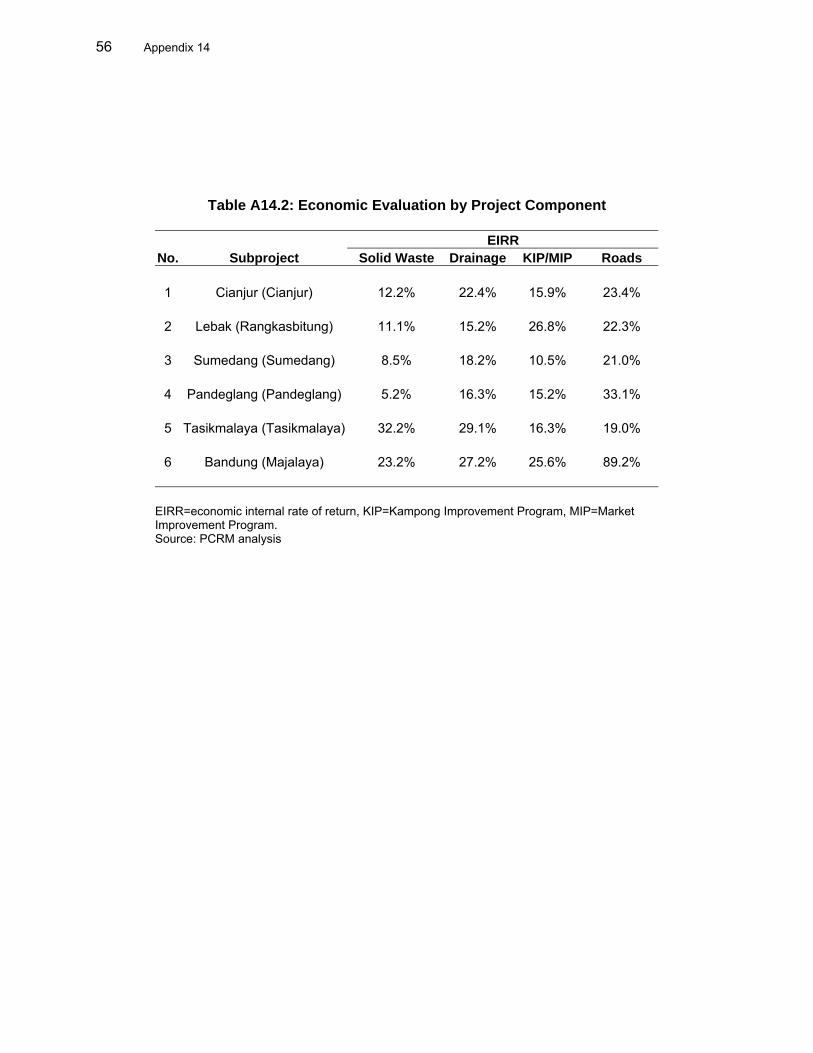
56 Appendix 14
Table A14.2: Economic Evaluation by Project Component EIRR
No. Subproject Solid Waste Drainage KIP/MIP Roads 1 Cianjur (Cianjur) 12.2% 22.4% 15.9% 23.4% 2 Lebak (Rangkasbitung) 11.1% 15.2% 26.8% 22.3% 3 Sumedang (Sumedang) 8.5% 18.2% 10.5% 21.0% 4 Pandeglang (Pandeglang) 5.2% 16.3% 15.2% 33.1% 5 Tasikmalaya (Tasikmalaya) 32.2% 29.1% 16.3% 19.0% 6 Bandung (Majalaya) 23.2% 27.2% 25.6% 89.2%
EIRR=economic internal rate of return, KIP=Kampong Improvement Program, MIP=Market Improvement Program. Source: PCRM analysis