Embed Size (px)
Citation preview

ASIAN DEVELOPMENT BANK
COUNTRY STRATEGY AND PROGRAM UPDATE 2005–2006
MARSHALL ISLANDS
August 2004

CURRENCY EQUIVALENTS
The United States dollar ($) is the unit of currency in the Marshall Islands.
ABBREVIATIONS
ADB – Asian Development Bank CSPU – country strategy and program update EPPSO – Economic Policy, Planning and Statistics Office FFMP – Fiscal and Financial Management Program GDP – gross domestic product MDG – Millennium Development Goal MIITF – Marshall Islands Intergenerational Trust Fund PDMC – Pacific developing member country PSC – Public Service Commission PSD – private sector development RMI – Republic of the Marshall Islands SOE – state-owned enterprise SWOT – strengths, weaknesses, opportunities, threats TA – technical assistance US – United States
NOTES
(i) The fiscal year (FY) of the Government ends on 30 September. FY before a
calendar year denotes the year in which the fiscal year ends. (ii) In this report, “$” refers to US dollars.

CONTENTS Page
I. CURRENT COUNTRY STRATEGY 1
II. CURRENT DEVELOPMENT TRENDS AND ISSUES 1 A. Recent Political Developments 1 B. Social and Environmental Assessment and Outlook 1 C. Economic Assessment and Outlook 2 D. Implications for the Country Strategy and Program 4
III. IMPLEMENTATION OF THE COUNTRY STRATEGY AND PROGRAM 5 A. Progress in Poverty Reduction 5 B. Progress in the Country Strategy and Program Focus Areas 6 C. Highlights in Coordination of External Funding and Partnership Arrangements 8
IV. PORTFOLIO MANAGEMENT ISSUES 8 A. Portfolio Performance and Performance Monitoring and Evaluation 8
V. COUNTRY PERFORMANCE AND ASSISTANCE LEVELS 9 A. Proposed Lending Level 9 B. Nonlending Program and Changes to Program 9
APPENDIXES
1. Summary Statement of Proposed Strategy 10 2. Country and Portfolio Indicators, and Assistance Pipeline 12 Table A2.1: Progress Toward the Millennium Development Goals and Targets 12 Table A2.2: Country Economic Indicators 15 Table A2.3: Country Poverty Indicators 16 Table A2.4: Country Social Indicators 17 Table A2.5: Country Environment Indicators 19 Table A2.6: Development Coordination Matrix 20 Table A2.7: Portfolio Indicators—Amounts and Ratings, Disbursements, Net Transfers of Resources 23 Table A2.8: Portfolio Indicators—Evaluation Rating by Sector 24 Table A2.9: Portfolio Implementation Status 25 Table A2.10: Assistance Pipeline for Lending Products 26 Table A2.11: Assistance Pipeline for Nonlending Products and Services 27 3. Concept Papers for Nonlending Products and Services 28 4. Assistance Program for 2004 Table A4.1: Assistance Program for Nonlending Products and Services, 2004 38 5. Analysis of Public Sector Strengths, Weaknesses, Opportunities, Threats 39 6. RMI Country Strategy Problem and Objective Tree 41 7. Road Maps: Social Sector and Private Sector 43
I. CURRENT COUNTRY STRATEGY
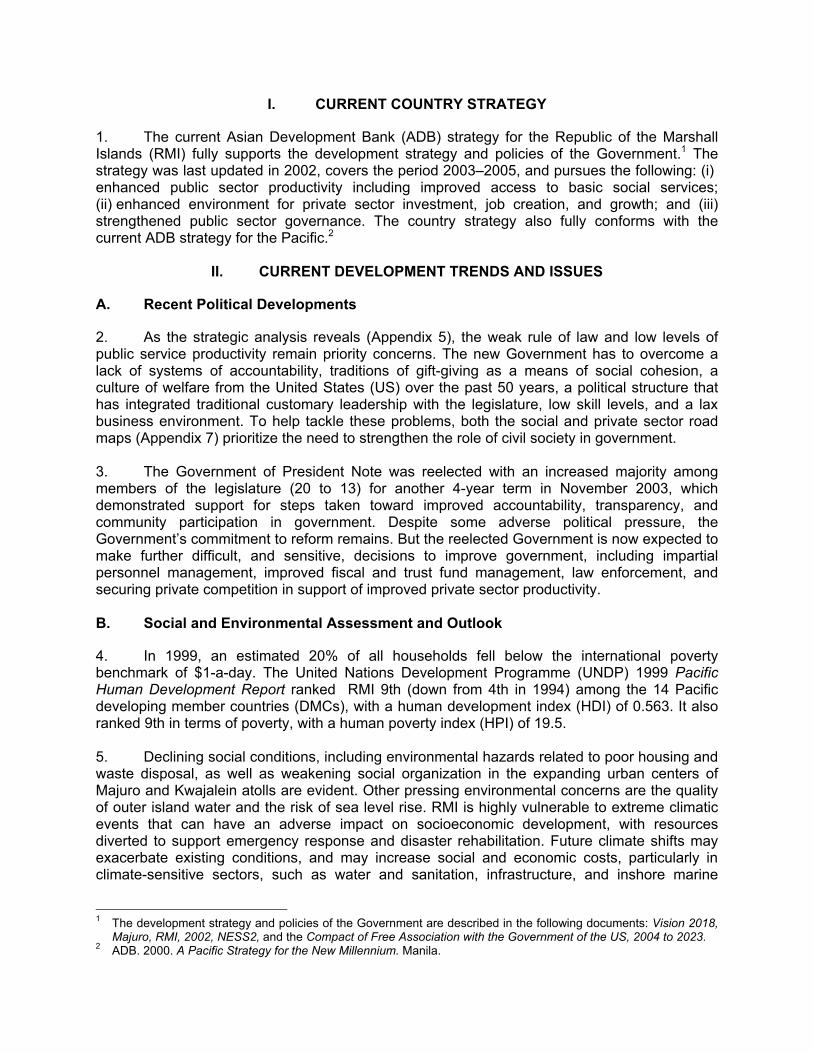
1. The current Asian Development Bank (ADB) strategy for the Republic of the Marshall Islands (RMI) fully supports the development strategy and policies of the Government.1 The strategy was last updated in 2002, covers the period 2003–2005, and pursues the following: (i) enhanced public sector productivity including improved access to basic social services; (ii) enhanced environment for private sector investment, job creation, and growth; and (iii) strengthened public sector governance. The country strategy also fully conforms with the current ADB strategy for the Pacific.2
II. CURRENT DEVELOPMENT TRENDS AND ISSUES
A. Recent Political Developments
2. As the strategic analysis reveals (Appendix 5), the weak rule of law and low levels of public service productivity remain priority concerns. The new Government has to overcome a lack of systems of accountability, traditions of gift-giving as a means of social cohesion, a culture of welfare from the United States (US) over the past 50 years, a political structure that has integrated traditional customary leadership with the legislature, low skill levels, and a lax business environment. To help tackle these problems, both the social and private sector road maps (Appendix 7) prioritize the need to strengthen the role of civil society in government. 3. The Government of President Note was reelected with an increased majority among members of the legislature (20 to 13) for another 4-year term in November 2003, which demonstrated support for steps taken toward improved accountability, transparency, and community participation in government. Despite some adverse political pressure, the Government’s commitment to reform remains. But the reelected Government is now expected to make further difficult, and sensitive, decisions to improve government, including impartial personnel management, improved fiscal and trust fund management, law enforcement, and securing private competition in support of improved private sector productivity. B. Social and Environmental Assessment and Outlook
4. In 1999, an estimated 20% of all households fell below the international poverty benchmark of $1-a-day. The United Nations Development Programme (UNDP) 1999 Pacific Human Development Report ranked RMI 9th (down from 4th in 1994) among the 14 Pacific developing member countries (DMCs), with a human development index (HDI) of 0.563. It also ranked 9th in terms of poverty, with a human poverty index (HPI) of 19.5. 5. Declining social conditions, including environmental hazards related to poor housing and waste disposal, as well as weakening social organization in the expanding urban centers of Majuro and Kwajalein atolls are evident. Other pressing environmental concerns are the quality of outer island water and the risk of sea level rise. RMI is highly vulnerable to extreme climatic events that can have an adverse impact on socioeconomic development, with resources diverted to support emergency response and disaster rehabilitation. Future climate shifts may exacerbate existing conditions, and may increase social and economic costs, particularly in climate-sensitive sectors, such as water and sanitation, infrastructure, and inshore marine
1 The development strategy and policies of the Government are described in the following documents: Vision 2018,
Majuro, RMI, 2002, NESS2, and the Compact of Free Association with the Government of the US, 2004 to 2023. 2 ADB. 2000. A Pacific Strategy for the New Millennium. Manila.

2
resources. The Government recognizes the risk of rising sea levels and supports all related international conventions on climate change. Management of the environment is reported to be good, with the exception of urban housing and solid waste disposal. C. Economic Assessment and Outlook
1. Economy
6. Real gross domestic product (GDP) is likely to have risen by close to 3% in fiscal year (FY) 2003 (ended 30 September 2003), after growing by 4.0% in FY2002. Statistical weakness makes it, however, difficult to assess economic performance and an earlier International Monetary Fund figure estimates GDP growth in 2003 at only 1%. The public sector remains the main driver of economic growth. In 2003, copra production expanded on account of higher copra prices, continued government subsidies, and more frequent shipping. Also, the tuna processing plant turned in higher production figures than in 2002. Future growth in the short term is also anticipated in response to Compact of Free Association-funded capital projects. Government spending expanded, though at a much slower rate than in FY2002. The budget estimate for FY2003 is of an overall surplus equivalent to 15.4% of GDP, slightly lower compared with the 14.8% share to GDP surplus in FY2002. The FY2004 budget provides for a substantial increase in public expenditure, particularly in the health and education sectors. This is expected to create a demand-side stimulus to the economy, which is expected to grow by 2–3% in FY2004. Budget outcomes have improved in recent years but budget and trust fund management remains weak. However, the third tranche conditions of ADB’s Fiscal and Financial Management Program (FFMP) were substantially met with funds approved by the ADB Board in early October 2003. Weak personnel management, an inequitable and inefficient tax system, and weak tax collection remain serious governance concerns. A public sector assessment (strengths, weaknesses, opportunities, threats—SWOT, Appendix 5) and social sector road map (Appendix 7)3 have been prepared by ADB and shared with the Government. These will guide the design of further ADB assistance. 7. The reexport of diesel fuel associated with the fishing transshipment activities in Majuro remained the largest export in FY2003, while domestically generated exports were limited mainly to copra cake and coconut oil. Modest import growth kept the trade deficit substantial. Net income receipts and external transfers ensured another substantial current account surplus. The domestic and international investment outlook is poor. Dominated by ADB concessional loans, external public debt was just over 50% of GDP in FY2003. 8. Surplus government funds in FY2003 were allocated as a contribution to the Marshall Islands Intergenerational Trust Fund (MIITF), which at the end of FY2003 had a total capital of $31 million, that was to be seed money for the Compact Trust Fund to be established in FY2004. However, prior to the general elections in November 2003, $7 million of the MIITF was provided as a deposit to the Marshall Islands Development Bank for onlending at concessional rates to two major retailers. Both the IMF and ADB have expressed concern over this transaction. 9. Inflation tends to track that of the US, which supplies 50–60% of total imports. The estimated inflation rate in FY2003 was 2.5%, compared with 2.0% in FY2002. Inflation is forecast to remain in the 2–3% range in FY2004–FY2005. Due to persistent defaults on
3 The private sector road map was completed under ADB. 2002. Regional Technical Assistance on Private Sector
Development Strategy for the Pacific. Manila. The social sector road map was prepared under a staff consultancy.

3
consumer loan repayments, the commercial banks (Bank of Guam and Bank of the Marshall Islands) raised their lending rates on consumer loans slightly, to 18.5% in FY2003. In contrast, the Marshall Islands Development Bank offered consumer loans at about 14%. The interest rate spread remained in the 7–12% range. Relatively high interest rates reflect the lack of secured lending. Given government dominance in the labor market, and government influence on prices through state-owned enterprises (SOEs) and subsidies, the wage and price outlook is poor.
2. Compact of Free Association
10. Payments by the US under the Compact of Free Association have contributed an estimated 50–70% of gross domestic product over the past 16 years. However, average per capita growth has been zero over the same period. Misdirected public investment, a poor environment for private sector development, undeveloped land markets, and more generally, the lack of international competitiveness, have constrained the economy’s capacity for growth. Substantial funding provided under the first 15-year Compact period did not prevent social and economic decline and may have created a state of dependency. The critical policy development in 2003 was the passage into US law in late November of the Compact of Free Association Amendments Act 2003. The amended Compact sets out the nature and terms of US financial assistance for the period FY2004–FY2023.
Table: Annual Grant Funding and Trust Fund Contributions ($ million)
FY Annual Grants Section 211
Audit Grants Section 213
Trust Fund Section 216
Kwajalein Impact Section 212 Total
2004 35.2 0.5 7.0 15.0 57.7 2005–2013
Decline from 40.8 to 36.8 (0.5 annually)
0.5 annually Increase from 7.5 to 11.5 (0.5 annually)
15.0 annually 63.8 annually
2014–2023
Decline from 32.2 to 28.3 (0.5 annually)
0.5 annually Increase from 12.0 to 16.5 (0.5 annually)
18.0 annually 68.8 annually
Source: ADB Board Paper. Compacts of Free Association of the United States of America with Federated States of Micronesia and Republic of Marshall Islands, 2 February 2004.
11. Amended Compact funding is summarized in the Table. Annual grant assistance is to gradually decline over the 20-year period, with the annual reductions being matched by partially inflation-adjusted contributions to the Compact Trust Fund. This trust fund is intended eventually to generate sufficient revenue to substitute for the grant component of US assistance at the end of FY2023. The overall annual financial support potentially receivable during FY2004–FY2023, prior to inflation and other adjustments, is in the order of $66.0 million, or about 60% of the current nominal GDP level. Under the amended Compact, there will be a shift from general budgetary grants to sector grants, characterized by enhanced measures for accountability. Sector grant assistance is to be targeted at the key areas of education, health, environment, private sector development, public sector capacity building, and public sector infrastructure and maintenance.4 Direct grant assistance for private sector development will aim at attracting foreign investment, increasing indigenous business activity, promoting adherence to core labor standards, and maintaining progress toward privatization of SOEs. Medium-term expenditure plans for the key areas will be scrutinized by a Joint Economic Management and Financial Accountability Committee that has majority US membership and that will fulfill a review and monitoring role with regard to economic development and public financial management. The 4 Five percent of the grant amount allocated to infrastructure, combined with a matching amount from the
Government, is to be placed into an Infrastructure Maintenance Fund. This will result in an annual average of $13.5 million for capital acquisition and $700,000 for maintenance.

4
amended Compact also provides for continuing access to several US federal programs, continues the military use of Kwajalein atoll, and preserves the right of RMI citizens to reside in the US. As Compact funds decline and the trust fund is being capitalized, it will become more and more important for the Government to reduce domestic expenditures, raise revenues, and develop domestic economic activity in support of this adjustment.
3. Private Sector
12. The strategic analysis (Appendix 5) gives the constraints to development and prioritizes the need to attend to awareness raising, domestic governance, domestic economic settings, and the social fabric. Without significant further reform to the environment for private sector development, it is highly unlikely that there will be a significant medium-term expansion in the private sector independent of public sector investments. Foreign investment in export-oriented ventures is needed. Pilot private investments in outer island tourism, seaweed farming, black pearls, and other fisheries have yet to establish commercial viability. There has been no notable foreign investment since 1997, beyond establishment of the tuna processing plant and small services sector activity. 13. The Land Registration Authority Act was amended in 2003 in order to mobilize land on a voluntary basis and thereby facilitate private sector development. The Land Registration Authority (LRA) that will implement the Act is being established with ADB technical assistance (TA). The availability of land, and the securitization of land and other property in support of business and commerce, will remain a problem for many years. Transaction costs for business are unnecessarily high and there has been no discernible progress in reforming the taxation system or strengthening tax collection administration. The financial performance of most public enterprises continues to be poor and is a drain on government revenues, though a notable recent development is the privatization of the government-owned hotel. ADB regional TA has started to review administrative barriers to business and to examine the legal environment for business.5 Employment increased slightly in FY2003, primarily as a result of the filling of some civil service vacancies. However, growth in labor demand falls well short of the annual increase in labor supply and overall unemployment continues to increase, most especially youth unemployment. D. Implications for the Country Strategy and Program
14. The country strategy and program update (CSPU) is guided by: (i) the above, updated data, and new strategic analyses; (ii) the review of progress with the current country strategy (below); and (iii) the 2004 CSPU consultations and participatory processes that culminated in the National Coordination Committee meeting held in Majuro on 29 March 2004. Based on all these assessments and processes, it is proposed that the country strategy for 2005 and beyond essentially continue as it is, but that it be refined to focus on greater community participation in development processes to raise ownership and the demand for social and economic progress that is needed if the deeper, more systemic, constraints to improved productivity are to be resolved. The 2004 participatory CSPU also determined the following order of priority of assistance: (i) A participatory review and reform of the civil service and rationalization of government assets. This includes improving personnel management and raising the effective demand for, and improving the delivery of, essential social services. This will include a stronger focus on urban areas and (in part due to other external agency funding of other social
5 ADB. 2000. Private Sector Development in the Pacific. Manila; ADB. 2003. Improving the Legal Business
Environment in the Pacific Region. Manila.

5
infrastructure) urgent attention to improving the management of urban waste disposal; (ii) Engaging all relevant stakeholders in a longer-term process to ease, if not resolve, the barriers associated with land or other security, high transaction costs, and other administrative barriers to improving the environment for competitive, private sector development; and (iii) Further improving governance, particularly participatory budgetary and fiscal formulation and management, as well as broad participatory economic, thematic, and sector policy formulation and management, including regular public expenditure reviews. 15. Given both the nature of constraints to development as well as the commencement in 2004 of the 20-year revised Compact, this presents both a need and an opportunity for ADB to focus assistance beyond the 3-year CSPU period. The revised Compact also presents an opportunity for ADB to help catalyze and extend the yield of these resources. A summary statement of the proposed revised strategy, together with proposed indicators, is attached as Appendix 1.
III. IMPLEMENTATION OF THE COUNTRY STRATEGY AND PROGRAM
A. Progress in Poverty Reduction
16. Progress toward the Millennium Development Goals (MDGs) in RMI is also slow. Education indicators have slightly improved, though retention rates, secondary enrollment, and learning outcomes are poor. One in four of the population is illiterate. The target of eliminating gender disparities in primary and secondary education has almost been achieved. Access to safe water and improved sanitation facilities has increased slightly but there are significant differences between urban and rural or outer islands areas. Child mortality rates (both under-5 and infant mortality rates) have fallen significantly and the country is likely to meet the target of reducing child mortality by two thirds by 2015. Almost one child in five is underweight, and almost one household in five does not have access to safe water. The disease profile is transitional, combining lifestyle diseases (which are usually associated with affluence) and infectious diseases (which are usually found in poor countries). However, life expectancy at birth increased from 60 to 65 years, and the gross primary school enrollment ratio rose from 54% to 72% during 1980–2000. Poverty seems to have worsened over the last 5 years in both urban and rural areas. As recorded in the participatory poverty assessment financed by ADB, the poor of the Marshall Islands prioritize improved delivery of essential public goods and services, and more jobs and other income opportunities.6 17. The Government signed a poverty partnership with ADB on 15 June 2002. This commits both the Government and ADB to monitor progress in reducing poverty against the MDGs and other critical poverty reduction indicators. Progress is to be monitored annually. ADB has committed to help the RMI monitor and evaluate poverty reduction efforts and this will, in part, be provided by ADB TA 4199-RMI to strengthen the Economic Policy, Planning and Statistics Office (EPPSO). A significant development in the conduct of the poverty partnership was the meeting of the National Coordination Committee on 29 March 2004. This was the culmination of extensive consultations and participatory processes that focused on prioritizing the ADB CSPU in support of future efforts to reduce poverty, including the means to establish indicators and monitor progress.
6 ADB. 2003. Priorities of the People. Hardship in the Marshall Islands. Manila.
6
B. Progress in the Country Strategy and Program Focus Areas
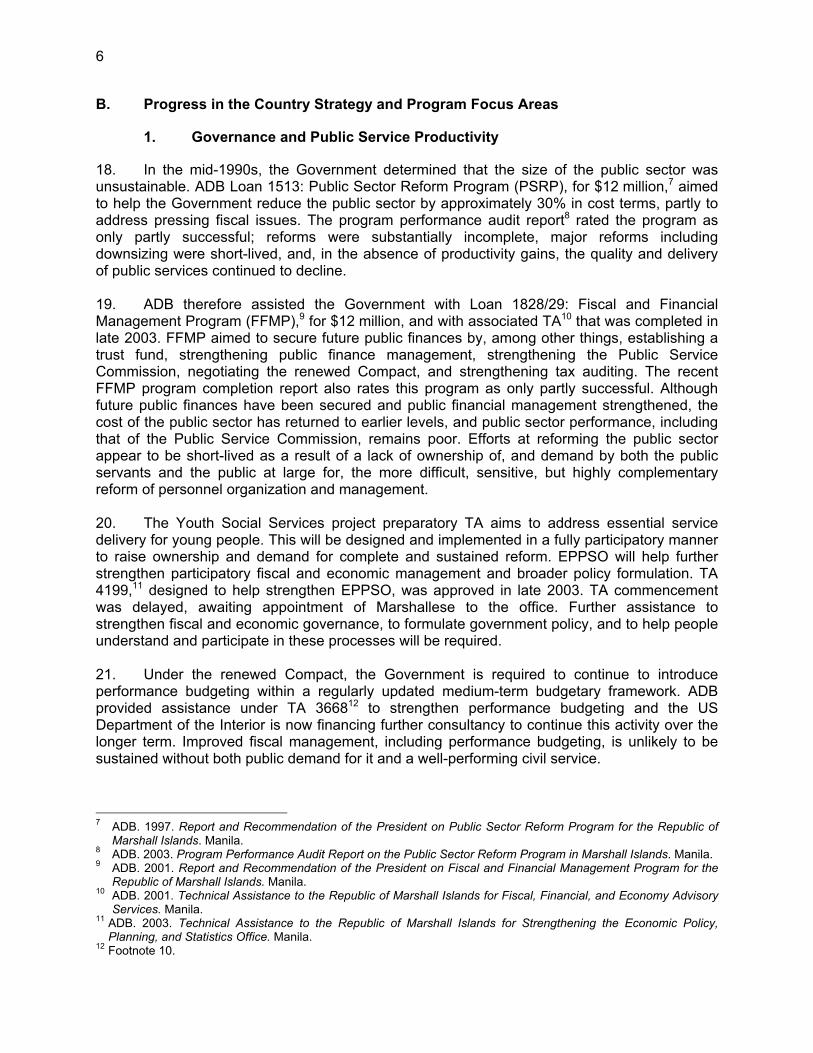
1. Governance and Public Service Productivity
18. In the mid-1990s, the Government determined that the size of the public sector was unsustainable. ADB Loan 1513: Public Sector Reform Program (PSRP), for $12 million,7 aimed to help the Government reduce the public sector by approximately 30% in cost terms, partly to address pressing fiscal issues. The program performance audit report8 rated the program as only partly successful; reforms were substantially incomplete, major reforms including downsizing were short-lived, and, in the absence of productivity gains, the quality and delivery of public services continued to decline. 19. ADB therefore assisted the Government with Loan 1828/29: Fiscal and Financial Management Program (FFMP),9 for $12 million, and with associated TA10 that was completed in late 2003. FFMP aimed to secure future public finances by, among other things, establishing a trust fund, strengthening public finance management, strengthening the Public Service Commission, negotiating the renewed Compact, and strengthening tax auditing. The recent FFMP program completion report also rates this program as only partly successful. Although future public finances have been secured and public financial management strengthened, the cost of the public sector has returned to earlier levels, and public sector performance, including that of the Public Service Commission, remains poor. Efforts at reforming the public sector appear to be short-lived as a result of a lack of ownership of, and demand by both the public servants and the public at large for, the more difficult, sensitive, but highly complementary reform of personnel organization and management. 20. The Youth Social Services project preparatory TA aims to address essential service delivery for young people. This will be designed and implemented in a fully participatory manner to raise ownership and demand for complete and sustained reform. EPPSO will help further strengthen participatory fiscal and economic management and broader policy formulation. TA 4199,11 designed to help strengthen EPPSO, was approved in late 2003. TA commencement was delayed, awaiting appointment of Marshallese to the office. Further assistance to strengthen fiscal and economic governance, to formulate government policy, and to help people understand and participate in these processes will be required. 21. Under the renewed Compact, the Government is required to continue to introduce performance budgeting within a regularly updated medium-term budgetary framework. ADB provided assistance under TA 366812 to strengthen performance budgeting and the US Department of the Interior is now financing further consultancy to continue this activity over the longer term. Improved fiscal management, including performance budgeting, is unlikely to be sustained without both public demand for it and a well-performing civil service.
7 ADB. 1997. Report and Recommendation of the President on Public Sector Reform Program for the Republic of
Marshall Islands. Manila. 8 ADB. 2003. Program Performance Audit Report on the Public Sector Reform Program in Marshall Islands. Manila. 9 ADB. 2001. Report and Recommendation of the President on Fiscal and Financial Management Program for the
Republic of Marshall Islands. Manila. 10 ADB. 2001. Technical Assistance to the Republic of Marshall Islands for Fiscal, Financial, and Economy Advisory
Services. Manila. 11 ADB. 2003. Technical Assistance to the Republic of Marshall Islands for Strengthening the Economic Policy,
Planning, and Statistics Office. Manila. 12 Footnote 10.

7
2. Poverty Reduction and Outer Island Development
22. The poverty situation of RMI remains undiminished. Although the 2002 Household Income and Expenditure Survey is still being analyzed, there is increasing incidence of squalor, while greater inequalities are apparent, most especially in urban areas and despite the relatively large levels of aid. Loan 1694: Ebeye Health and Infrastructure Project, addressed urgent health and sanitation issues in Ebeye. But the quality of primary preventative health care remains a persistent concern throughout the country. While Loan 1791: Skills Training and Vocational Education will address the more immediate skills training needs of young people, the delivery of high-quality primary education also remains a concern. ADB, as other international agencies, has tried to stem more immediate social and economic development problems, but again, without stronger ownership and demand for improved services among both the public and public servants, these efforts are unlikely to be sustained. 23. Implementation of Loan 1948: Outer Island Transport Infrastructure and the associated TA 400413 has been delayed due to the slow recruitment of the project implementation consultants. With Marshallese moving to the urban population centers of Majuro and Ebeye, as the road maps suggest (Appendix 7), the electoral emphasis on assistance to the outer islands needs to be reassessed. The Government also needs to assess to what extent the remaining outer island economies are viable. Loan 1948 allows for flexible implementation and individual projects can be reprioritized.
3. Enhanced Private Sector Environment
24. The most recent RMI economic report (Meto 2000)14 indicates the potential for some private sector growth; however, as revealed in the strategic analysis (Appendix 5), and as is currently being revealed under the regional TA to examine administrative barriers,15 much greater, longer-term, efforts are needed to foster a more conducive climate for expanded and competitive private investment for this growth to be realized. The private sector road map lists the following as the main issues influencing private sector development (PSD) in RMI: (i) a stagnant macroeconomy, (ii) concentrated economic power and unnecessarily high-cost business environment, (iii) undeveloped financial markets, and (iv) limited consultations between government and private sector businesses. 25. SOE reform would lead to the reduction of subsidies, help reduce private transaction costs, improve service delivery, and create room for private sector participation. However, all earlier governments have proven most reluctant to relinquish control of the SOEs. The very recent privatization of the government-owned hotel is noteworthy, although the urgency with which it was carried out is of concern. The earlier 1997 TA 2757: Support to the Private Sector Unit16 achieved very little in rationalizing SOEs, and ADB should await proof of further commitment from the Government to SOE reform before providing further TA in this area. The National Telecommunications Authority, which is majority-owned by the Government, is negotiating with the Government of the Federated States of Micronesia and the US military base on Kwajalein for installation of a fiber optic cable that will vastly improve international communications. RMI’s share of the investment is estimated at $22 million. The project could 13 ADB. 2002. Technical Assistance to the Republic of Marshall Islands for Improving the Delivery of Sea and Air
Transport Services. Manila. 14 ADB. 2001. Republic of the Marshall Islands. Meto 2000 Economic Report and Statement of Development
Strategies. Manila. 15 ADB. 2000. Regional Technical Assistance on Private Sector Development in the Pacific. Manila. 16 Approved on 30 January 1997 for $760,000.

8
present an opportunity to secure future competition in the provision of domestic telecommunications services. 26. A key factor in undeveloped financial markets is the lack of adequate collateral security arrangements. This is initially being addressed under TA 3941: Land Mobilization.17 This TA is proceeding well, with the LRA now operational. Another advisory TA18 is being processed in 2004 to continue the work of the LRA over the longer term, to establish an effective framework for secured lending on movable property, further revise relevant commercial laws, improve the codification of law, and further study land market development. The design of this TA will be supported by earlier regional TA.19 There is much that the Government can do to improve the environment for PSD, provided that society understands and supports this—hence the need for greater community consultation. C. Highlights in Coordination of External Funding and Partnership Arrangements
27. The revised compact with the US Government was signed in January 2004. The International Monetary Fund undertook Article IV consultations in October 2003. The relevant public information notice refers to recent economic growth, a stagnant private commercial sector, and a weakened fiscal position. The last observation may be revised by more recent fiscal data. The Government also receives significant assistance from Japan and Taipei,China. Japan is financing a project to rehabilitate and equip the hospital in Majuro to Japanese specifications, though some of this assistance may raise recurrent cost concerns. The European Union also recently established a 5-year assistance program to the RMI starting in late 2004, consisting of $4.6 million and covering grant assistance to renewable energy, outer island education, nongovernment organization capacity building, and disaster management funding. 28. ADB is not, comparatively, a major financer of development; but as the only multilateral development bank with an active program of assistance in the country, ADB has an important role to play in helping formulate overall development strategy, economic reform, policy, and institutional development, in timely efforts aimed at structural adjustment. A future focus by ADB on helping improve public and private sector productivity complements other external assistance well. An external agency and government retreat is planned for August 2004, possibly to be followed by a more formal consultative group meeting later in the year. The retreat will likely focus on the constraints to improved public and private sector performance, and related policy and institutional reforms.
IV. PORTFOLIO MANAGEMENT ISSUES
A. Portfolio Performance and Performance Monitoring and Evaluation
29. RMI joined ADB in 1990. Since then it has received 12 loans totaling $78.1 million and 44 TAs totaling $17.15 million, of which two loans of $15.5 million and five TAs of $2.62 million were active as of end-2003. The February 2004 ADB country portfolio review mission expressed concern over the delay in recruitment of counterpart staff (EPPSO TA)20 and full-time management staff (Loan 1948: Outer Island Transport Infrastructure and TA 4004, footnote 13), weak personnel management, and the lack of firm, central organization, management, and direction, including full sharing of information within the public service and between the public 17 Approved on 16 October 2002 for $420,000. 18 Improving the Environment for Private Sector Development in the Marshall Islands. 19 ADB. 2003. Improving the Legal Business Environment in the Pacific Region. Manila. 20 Footnote 11.

9
service and the community at large. 30. None of the RMI portfolio was in the at-risk category in 2003 (compared with the ADB-wide average of 14.5%). No loans have potential problems. As such, RMI performance in 2003 was better than both the regional and ADB-wide average. In 2003, the contract award ratio reached 38.5%, higher than the ADB-wide average of 17.3%. Actual contract awards totaled $5.9 million, or 106% of projections in 2003, compared with 77.3% of the projection for 2002. In 2003, the disbursement ratio was 30.8%, higher than the ADB-wide average of 20.2%. Actual disbursement of $5.0 million, or 164% of the projection in 2003, compared favorably with 78.3% of the projection for 2002. Of the active TAs, all except one were performing satisfactorily. The 2002 and 2003 country performance assessments were rated as base/high.
V. COUNTRY PERFORMANCE AND ASSISTANCE LEVELS
A. Proposed Lending Level
31. Asian Development Fund allocations will be determined under the revised performance-based allocation policy (in process). For planning purposes, the rolling 3-year allocation has been set at $10.7 million, but this will be subject to change based on the revised performance-based allocation policy. The Government is aware that this can be increased or decreased depending on performance. The participatory national planning process prioritized future borrowing from ADB for urban solid waste disposal. B. Nonlending Program and Changes to Program
32. Two TA channel funds submissions are proposed for 2004.21 These aim to help strengthen ownership and effective demand, primarily among the poor, for improved public services and for an improved urban environment (solid waste disposal). They will also complement a project preparatory TA in Solid Waste Disposal and Management in 2005, with a possible loan in 2006, and an advisory TA in support of civil service reform and government asset rationalization in 2005. The proposed Youth Social Services loan has slipped to 2005. An advisory TA to continue to help improve the environment for PSD has been prepared for approval in 2004. A study of land tenure and the potential economic and social impact of further land mobilization, in part through reclamation of the atoll-adjacent reef, is included in this TA. Further small-scale TA in support of continuing the current regional work on removing administrative barriers is proposed for late 2004, with further advisory TA also targeted for 2006. Current TA in support of EPPSO will be continued with the preparation of an economic report and further TA to strengthen sector and thematic policy formulation from 2005. 33. US Department of the Interior cofinancing may be possible for all these areas of TA if the RMI Government supports this. 34. For reference, the 2004 Assistance Program for Nonlending Products and Services is provided in Table A4.1.
21 Poverty Environment Program and the Governance Cooperation Fund.

10 Appendix 1
SUMMARY STATEMENT OF PROPOSED STRATEGY (2005–2007)
Item Public Sector Productivity
A review and reform of the civil service and rationalization of government assets.
Private Sector Productivity Further improving the environment for competitive, private sector development.
Economic Governance Further strengthening government-wide policy formulation with enhanced participation.
Priority 1 2 3
Long-Term Impacts and Indicators (5 to 10 years) (MDG goal and target)
Improved delivery of essential public goods and services Literacy rate of 15 to 24 year olds (MDG 3/8) Infant mortality rate (MDG 5/14) Ratio of literate females to males of 15 to 24 year olds (MDG 4/10) Waste disposal environmental indicators (Monitored by EPPSO reporting)
Increased private sector contribution to the economy Share of poorest quintile in national consumption (MDG 1/3) Levels of private sector credit, growth in GDP/capita, number of private sector jobs, private sector contribution to GDP. Proportion of people with access to secure tenure (MDG 11/31) (Monitored by Chamber of Commerce)
Greater quality policy advice to all of Government PBA country performance assessment of improved governance. (Monitored by EPPSO reporting)
Strategic Medium-Term Outcomesa
• Improve the organization, management, delivery and quality of public services, most especially primary education and primary health in support of the priorities of people in hardship.
• Strengthen the participation, ownership, and effective demand for improved, essential public services.
• Strengthen the participation, ownership, and effective demand for improved urban management.
• Reduced time to issue business licenses, work permits, and other business approvals.
• Easier land and other property registration in support of land mobilization and securitization of loans.
• Lower costs of doing business.
• Establishment of participatory budget formulation, improved budget execution, improved public expenditure management.
• Provision of wide range of regular, quality, advice to Government on economic sector and thematic policy and institutional development.
Ongoing and Proposed Loansb
• Youth Social Services (2005) • Solid Waste Management and
Disposal (2006)
None None
a Medium-term progress indicators will be reported on annually in future country strategy and program updates. b (i) Deliverables to be defined in respective RRP and TA logframes; (ii) note other external complementary assistance, especially extensive assistance under renewed US Compact to education, health, capacity building, infrastructure, and the private sector.

Appendix 1 11
Item Public Sector Productivity A review and reform of the civil service and rationalization of government assets.
Private Sector Productivity Further improving the environment for competitive, private sector development
Economic Governance Further strengthening government-wide policy formulation with enhanced participation.
Ongoing and Proposed Technical Assistancec
• Raising ownership and demand for improved public services (GCF) (2004)
• Raising ownership and demand for improved urban management (PEP) (2004)
• Youth Social Services (2004) • Reviewing and reforming the civil
service and rationalizing government assets (2005)
• Solid Waste Management (2005).
• Enhancing the Environment for Private Sector Development (2004)
• Removing Administrative Barriers to Business (2004)
• Further Strengthening the Environment for Private Sector Development (2007).
• Strengthening EPPSO (2004)
• Improving Sector and Thematic, Policy and Institutional Development and Preparation of an Economic Report (2005)
• Strengthening Government-wide Policy Formulation (EPPSO II) (2006)
Medium-Term Progress Indicators (1 to 3 years)
Ministry of Education annual report on examination scores and completion rates. Ministry of Education annual report on teacher absenteeism records. Office of the President's action plan and work program for civil service reform. Ministry of Health survey of clinics stocks of viable medicines. Government asset rationalization road map. NCC held every year Monthly secretaries meetings Proposed 2005 GCF funded annual people's report on public service delivery. Proposed 2005 PEP funded annual people's report on urban waste management. (Benchmarks to be established and reported on by TA consultants)
Telecom, internet connections, number of business start-ups, number of asset registrations, by private sector assessment updates. Number of voluntary registered land holdings. Number of leases of private movable property. Establishment of regular consultations between private sector and government. (Benchmarks to be established and reported on by TA consultants)
EPPSO participatory task force reports on budget processes and procedures. Regular meetings of EPPSO task force. Action plan for further strengthening policy formulation. (Benchmarks to be established and reported on by TA consultants)
ADTA = advisory technical assistance, CPA = country performance assessment, EPPSO = Economic Policy, Planning and Statistics Office, GDP = gross domestic product, GCF = Governance Cooperation Fund, HIES = household income and expenditure survey, LRA = Land Registration Authority, MDG = Millennium Development Goal, NCC = National Coordination Committee, PBA = performance-based allocation, PEP = Poverty Environment Program, PPTA = project preparatory technical assistance, RRP = report and recommendation of the President, SSTA = small-scale technical assistance, TA = technical assistance. c See table note a. Source: Mission

12 Appendix 2
COUNTRY AND PORTFOLIO INDICATORS, AND ASSISTANCE PIPELINE
Table A2.1: Progress Toward the Millennium Development Goals and Targets
Goals and Targets 1990 1995 Latest Year Goal 1 Eradicate Extreme Poverty and Hunger
Target 1: Reduce incidence of extreme poverty by half from 1990 to 2015
1. Proportion of population below $1 per day (PPP-
values) (%) Total Outer Islands (Rural)
— —
— —
20.0 65.0
(1999) (1999)
2. Poverty gap ratio — — — 3. Share of poorest quintile in national consumption
(%) — — < 5.0 (1999)
Target 2: Reduce the proportion of people who suffer from hunger by half from 1990 to 2015
4. Prevalence of child malnutrition (% of children
under 5) 19.0 (1991)
— 27.0 (1997)
5. Proportion of population below minimum level of dietary energy consumption (%) a
— — —
Goal 2 Achieve Universal Primary Education Target 3: Attain 100% primary school enrollment by 2015
6. Net enrollment ratio in: (%) Primary education Secondary education
81.9 (1989) 46.7 (1989)
95.0b (1994) —
84.1c 69.5c
(1999) (1999)
7. Proportion of pupils starting Grade 1 who reach Grade 5
— — —
8. Literacy rate of 15–24 year olds (%) 68.6d 72.2d 76.9d (2002)
Goal 3 Promote Gender Equality and Empower
Women
Target 4: Eliminate gender disparities in primary and secondary education by 2005 and at all levels of education no later than 2015
9. Ratio of girls to boys in: (%) Primary education Secondary education
— —
93.0e (1998) —
97.0 97.0
(1999) (1999)
10. Ratio of young literate females to males (% of age group 15–24)
— — 1.0 (1999)
11. Share of women in wage employment in the nonagricultural sector
— — 31.0 (1999)
12. Proportion of seats held by women in national parliament
3.0f (1991)
3.0f (1999)
3.0e (2001–2003)

Appendix 2 13
Goals and Targets 1990 1995 Latest Year Goal 4 Reduce Child Mortality
Target 5: Reduce infant and child mortality by two thirds from 1990 to 2015
13. Under-5 mortality rate (per ‘000 live births) 92.0e 81.0e 48.0 (1999)
66.0e (2002)
14. Infant mortality rate (per ‘000 live births) 63.0e
59.0e 37.0
(1999) 54.0e (2002)
15. Proportion of 1 year old children immunized against measles
67.0e 70.0 (1998)
80.0e (2002)
Goal 5 Improve Maternal Health Target 6: Reduce maternal mortality ratio by three-quarters between 1990 and 2015
16. Maternal mortality ratio (per 100,000 live births) — 0.0g (1996)
0.0b (1998)
17. Births attended by skilled health staff (% of live births)
— 94.8g (1998)
95.0e
(1995–2002)
Goal 6 Combat HIV/AIDS, Malaria and Other
Diseases
Target 7: Have halted by 2015, and begun to reverse, the spread of HIV/AIDS
18. HIV prevalence rate among 15–24 year old pregnant women
0.0 0.0 0.0h,i (2001)
19. Contraceptive prevalence rate (% of women aged 15-49)
— 25.2i (1996)
36.9i (2000)
20. Number of children orphaned by HIV/AIDS — — —
Target 8: Have halted by 2015, and begun to reverse, the incidence of malaria and other major diseases
21. Malaria: Prevalence rate (per 100,000 people) Death rate (per 100,000 people)
— —
— —
— 15.0e,g
(2000)
22. Proportion of population in malaria risk areas using effective malaria prevention and treatment measures
— — —
23. Tuberculosis: Prevalence rate (per 100,000 people) Death rate (per 100,000 people)
— —
107.3i —
133.7i 3.0i
(2001) (2001)
24. Proportion of tuberculosis cases detected and cured under DOTS (%)
— — 71.0i (2000)
82.0i (2001)
Goal 7 Ensure Environmental Sustainability Target 9: Integrate the principles of sustainable development into country policies and programs and reverse the loss of environmental resources
25. Forest area (% of total land area) 0.0 0.0 0.0 26. Nationally protected areas (% of total land area) — — 0.0j (2003) 27. GDP per unit of energy use (PPP $ per kg oil
equivalent) — — —
28. Carbon dioxide emissions (per capita metric tons) — — —

14 Appendix 2
Goals and Targets 1990 1995 Latest Year Target 10: Halve, by 2015, the proportion of people without sustainable access to safe drinking water
29. Access to an improved water source (% of population)
— 82.0b (1997)
90.1i (1999)
Target 11: By 2010, to have achieved a significant improvement in the lives of at least 100 million slum dwellers
30. Access to improved sanitation (% of population) Total Urban Rural/Outer Islands
— — —
77.0b (1997) — —
75.6 90.3 42.3
(1999) (1999) (1999)
31. Access to secure tenure (% of population) — — — — = not available, ADB = Asian Development Bank, AIDS = acquired immunodeficiency syndrome, DOTS = directly observed treatment, short course, GDP = gross domestic product, kg = kilogram, HIV = human immunodeficiency virus, PPP = purchasing power parity, UNDP = United Nations Development Programme, UNESCO = United Nations Educational, Scientific and Cultural Organization, WHO = World Health Organization. a Data not available, but figure is estimated to be small as 2002 survey indicates that 43% of population are obese and a further 35% are overweight. b UNDP, Pacific Human Development Report (1994, 1999); UNDP, Human Development Report (2000–2003) c Primary age group refers to 6–13 years old and secondary refers to 14–18 years old. Data are from the Social Statistics Bulletin (Jun 2002) of the Office of Planning and Statistics, Republic of the Marshall Islands. d UNESCO, Institute for Statistics, available: http://portal.unesco.org/uis. e United Nations Statistics Division (UNSD), Millennium Indicator Database (2003), available: http://millenniumindicators.un.org. f Inter-Parliamentary Union (IPU), Information on National Parliaments, available: http://www.ipu.org. g WHO, Western Pacific Region Health Data Bank (rev/2001), available: http://wpro.who.int. h As percentage of screened persons in Majuro only. i Ministry of Health, Health Profile of the Marshall Islands 2002. j World Resources Institute, Earth Trends 2003 (http://earthtrends.wri.org). Sources: Unless otherwise specified, data are from ADB’s TA 6002-REG discussion papers (December 2002), (which are primarily based on the 1999 Census and preliminary figures from the 2002 Household Income and Expenditure Survey.

Appendix 2 15
Table A2.2: Country Economic Indicators
Item Fiscal Year 1999 2000 2001 2002 2003
A. Income and Growth 1. GDP per Capita ($, current) 1,914 1,879 1,863 1,894 1,924 2. GDP Growth (%, in constant prices) 0.8 (2.0) (1.5) 4.0 3.0 a. Agriculture (28.6) 15.5 4.2 — — b. Industry 12.0 11.7 2.9 — — c. Services (0.5) (2.9) (2.3) — —
B. Saving and Investment (current market prices) (% of GDP) 1. Gross Domestic Investment — — — — — 2. Gross Domestic Saving — — — — —
C. Money and Inflation (annual % change) 1. Consumer Price Indexa 1.7 1.6 1.7 2.0 2.5 2. Total Deposits 14.7 (1.9) 25.0 (0.5) 1.3
D. Government Finance (% of GDP) 1. Total Revenue and Grants 67.3 74.7 96.1 93.0 90.6 2. Total Expenditure and Onlending 56.8 65.8 93.9 78.2 75.3 3. Overall Fiscal Surplus/(Deficit) 10.5 8.9 2.2 14.8 15.4
E. Balance of Payments 1. Merchandise Trade Balance (% of GDP) (63.0) (46.1) (38.1) (40.4) — 2. Current Account Balance (% of GDP) (7.9) 21.4 38.2 29.7 — 3. Merchandise Export ($) growth (CIF, annual % change) 32.7 19.1 11.8 — — 4. Merchandise Import ($) growth (CIF, annual % change) 2.4 (20.6) (10.6) — —
F. External Payments Indicators 1. Gross Official Reserves ($ million, end of period) — — — — — (in months of imports) — — — — — 2. External Debt Service (% of exports of goods & services)
115.8 53.5 60.4 6.6 —
3. External Debt (% of GDP) 101.2 87.6 65.9 54.24 —
G. Memorandum Items: 1. GDP (current prices, million local currency) 97.3 99.0 101.7 107.3 113.2 2. Exchange Rate ( $ per dollar, annual average) 1.0 1.0 1.0 1.0 1.0 3. Population (million) 0.051 0.053 0.055 0.057 0.059
— = not available, CIF = cost, insurance, freight, GDP = gross domestic product. a Period average. Note: The fiscal year ends on 30 September. Sources: Republic of the Marshall Islands Economic, Policy, Planning and Statistics Office, Statistical Abstract 2001, 14th edition; International Monetary Fund, Marshall Islands Selected Issues Paper, January 2002; budget documents; staff estimates.

16 Appendix 2
Table A2.3: Country Poverty Indicators
Item 1990 1995 Latest Year
1. Development Progress Indices Human Development Index (HDI) ― 0.611
(1994) 0.563 (1999)
PDMC Rank ― 4/12 9/14 Human Poverty Index (HPI) ― ― 19.5 (1999)
PDMC Rank (out of 14 PDMC) ― ― 9 Composite Vulnerability Index ― ― ―
PDMC Rank ― ― ― Gender-Related Development Index ― ― ―
Global Rank ― ― ― 2. Poverty Indicators
Headcount Index (% poor of total households)
― ― ―
Poverty Severity Index (%) ― ― ― 3. Inequality Indicators
Gini Coefficient ― ― ― Household Income (% of total)
National H25 ― ― 65.0 (1999) L25 ― ― ―
Outer Islands H25 ― ― 70.0 (1999) L25 ― ― ―
Income Ratio (H25/L25) National ― ― 22.0 (1999) Outer Islands ― ― 20.0 (1999)
― = not available; H25 = highest income quartile group; H25/L25 = ratio of share in total income of the highest income quartile group to the lowest income quartile group; L25 = lowest income quartile group; PDMC = Pacific developing member country Sources: Asian Development Bank, Discussion Paper on Assessment of Hardship and Poverty (November 2002), under regional technical assistance (RETA) 6002: Consultation Workshops for Poverty Reduction Strategies in Selected Pacific Developing Member Countries (PDMCs); United Nations Development Programme, Pacific Human Development Report (1994, 1999).

Appendix 2 17
Table A2.4: Country Social Indicators
Item 1990 1995 Latest Year 1. Demographic Indicators
Total Population (‘000) 44.0a 47.4a 58.8a (2003 est.) Annual Population Growth Rate (% change) 1.5 1.5 3.9 Dependency Ratio (% of dependents to working age) 117.0
(1988)82.2
(1999) 77.9b
(2002 est.)
Total Fertility Rate (births per woman) 7.0c 6.4c 5.5d (2002) Ave. Household Size 8.7
(1988)― 7.8 (1999)
Urban ― ― 8.1 Outer Islands ― ― 7.4
2. Health
Life Expectancy at Birth (years) 61.6(1988)
67.5 (1999)
62.7d (2002)
Male 60.6 65.7 61.1d Female 62.5 69.4 64.6d
Population with Access to Health Services (%) ― 95.0 (1995–97)
―
Population per Doctor ― 2,735 (1995–97)
1,770 (2002)
Government Expenditure on Health As % of Total Government Spending ― 12.5
(1994/95–1999/00)
10.8 (2000/01)
8.0(2001/02 est.)
As % of GDP ― 4.0e (1999)
5.8 (2000/01)
3. Education
Adult Literacy Rate (%) 74.4f
(1988)98.3
(1999) 91.0f (2001)
Male 79.0 98.3 Female 69.0 98.4
Combined Gross School Enrollment Ratio 94.1g
(1993/94)86.3g
(1995/96) 81.7g (2000/01)
Male ― ― ― Female ― ― ―
Gross Primary Enrollment (% of aged 5–14 years) 117.3g
(1993/94)108.9g
(1995/96) 105.0g (2000/01)
Male ― ― ― Female ― ― ―
Gross Secondary Enrollment (% of aged 15–19 years) 46.1g
(1993/94)42.8g
(1995/96) 47.1g (2000/01)
Male ― ― ― Female ― ― ―
Student/Teacher Ratio (no. of students per teacher) Primary 22.7g
(1990/91)20.0g
(1995/96) 17.2g (2000/01)
Secondary 13.7g
(1990/91)16.5g
(1995/96) 17.7g (2000/01)

18 Appendix 2
Item 1990 1995 Latest Year
Government Expenditure on Education As % of Total Government Spending ― 21.5
(1994/95–1999/00)
21.0 (2000/01)
As % of GDP ― 16.9h (1998/99)
11.3 (2000/01)
not available, ADB = Asian Development Bank, GDP = gross domestic product. a Estimates from Asian Development Outlook 2004 population database. b Ministry of Health, Health Profile of the Marshall Islands 2002. c Secretariat of the Pacific Community (SPC), Pacific Regional Information System (PRISM), available: http://www.spc.int/PRISM. d World Health Organization (WHO), The World Health Report 2003. e WHO, Western Pacific Region Health Data Bank (rev/2001), available: http://wpro.who.int. f United Nations Development Programme (UNDP), Pacific Human Development Report 1999; UNDP, Human Development Report 2003. g Office of Planning and Statistics, Republic of the Marshall Islands, Social Statistics Bulletin (June 2002), Table 9.10 and Table 9.11. h United Nations Educational, Scientific and Cultural Organization (UNESCO), Institute for Statistics, available: http://portal.unesco.org/uis. Sources: Unless otherwise specified, data are from ADB’s TA 6002-REG discussion papers (December 2002) which are primarily based on the household income and expenditure surveys (1994 and 2002) and the national censuses (1988 and 1999).

Appendix 2 19
Table A2.5: Country Environment Indicators
Item 1990 Latest Year 1. Energy Efficiency of Emissions
Traditional Fuel Use (% of total energy use) ― ― 2. Water Pollution
Water Bodies Exceeding Contact Recreation Standards Biological Oxygen Demand (BOD) ― ― Chemical Oxygen Demand (COD) ― ―
3. Air Pollution Carbon Dioxide (CO2) Emissions
Total (millions of metric tons) ― ― Per unit of GDP (kg/PPP$ GDP) ― ―
Sulfur Dioxide (SO2) Emissions Per capita (kg) ― ―
4. Land Use and Deforestation Total Land Area (km2) 181.0 181.0 Average Annual Deforestation
Area (remaining km2) ― ― % change ― ―
Arable Land (% of total land) 0.0(1993)
16.7 (1998)
Cropland, Permanent (% of total land) 60.0(1993)
0.0 (1998)
Pastures, Permanent (% of total land) 0.0(1993)
―
Population Density, Rural (people per square mile) 233.0(1988)
246.0 (1999)
5. Biodiversity and Protected Areas Nationally Protected Area(s)
Area (km2) ― 11.3 (1998) Number ― 1 (1998)
World Heritage Sites (number) ― ― Mammals (number of threatened species) ― 1 (2002) Birds (number of threatened species) 2
(1987)1 (2002)
6. Urban Areas Urban Population
% of total population 65.0(1988)
65.2 (1999)
Per Capita Water Use (liters/day) ― ― Wastewater Treated (%) ― ― Solid Waste Generated per Capita (kg/day) ― ―
― = data not available, GDP = gross domestic product, kg = kilogram, km2 = square kilometer, PPP = purchasing power parity. Sources: Central Intelligence Agency, The World Factbook (2001–2003), available: http://cia.gov; Secretariat of the Pacific Community (SPC), Pacific Regional Information System (PRISM), available: http://www.spc.int/PRISM; South Pacific Regional Environment Programme (SPREP), Action Strategy for Nature Conservation in the Pacific Islands Region (1999–2002); SPREP/ADB, Republic of the Marshall Islands State of the Environment Report 1992; World Bank, The Little Green Data Book (2002, 2003).

2020
Appendix 2
Table A2.6: Development Coordination Matrix
Sector/Thematic/Area ADB Strategy/Activities Other Development Partners’ Strategy/Activities
A. Law and Public Sector Management
Ongoing • TA 4199: Strengthening EPPSO • TA 3668-RMI: Fiscal, Financial, and Economy
Advisory Services (almost completed) • TA 3941: Land Mobilization Programmed • Civil Service Review and Reform and
Government Asset Rationalization • Strengthening Sector and Thematic Policy and
Institutional Development (EPPSO II)
• US compact funded MIITF. • DOI support to strengthening performance
budgeting. • Budget support (Taipei,China) • Auditing and accounting training, capital
maintenance planning, Ministry of Finance intern program (DOI)
• US Federal grant support to Judiciary, Foreign Affairs, Internal Affairs, Public Works, and Finance.
• Immigration System Improvements (AusAID) • Other US assistance—FAA, NOAA, USDA.
B. Private Sector Development
Programmed • Enhancing Environment for Private Sector
Development (2004) • Further Enhancing the Environment for Private
Sector Development
• Focus of US Compact but so far only financing
ongoing tourism, trade and industry recurrent operations.
• Small Business Development (US)
C. Education
Ongoing • Loan 1791: Skills Training and Vocational
Education
• Major US Compact focus • Other US Federal Support. • Small Grants for Education, Education
Statistics, Textbooks and Computers, College Scholarships (AusAID)
• Library Improvements, Elementary Schools • Solar Small Scale Pilot Project (Canada) • Small-scale projects (Japan) • Small-scale projects (Taipei,China) • Small-scale projects (EU)

21Appendix 2
21
Sector/Thematic/Area ADB Strategy/Activities Other Development Partners’
Strategy/Activities
D. Health, Nutrition, and Social Protection
• Major US Compact focus • Special Supplement Health Programs (US) • Youth to Youth in Health (AusAID) • FAO Telefood Program (UN) • Majuro Hospital Reconstruction (Japan) • Small-scale projects (Taipei,China)
E. Inclusive Social Development
Ongoing • Loan 1791: Skills Training and Vocational
Education • Youth Social Services PPTA Programmed • Youth Social Services Loan
• Youth to Youth in Health (AusAID) • Community Center on Outer Island (Canada) • Mili Atoll Community Center, Majuro Atoll Road
Paving (Japan) • Renovation and Construction of Government
Buildings (Japan)
F. Transportation and Communication Ongoing • Loan 1948: Outer Island Transport
Infrastructure and TA 4004: Improving the Delivery of Sea and Air Transport Services
• TA 5990-REG: ICT Assessment in the Pacific • Outer Island Transport Infrastructure Project
(2002)
• Major US Compact Focus • Waan Elon Kein (Canoes of these Islands)
(AusAID) • Eijit Island Dock (Japan) • Outer Island Transportation Infrastructure,
Majuro Airport Hangar (Taipei,China) • Fiberglass Boat/Canoe Program (US) • Secondary Road Paving (Japan)
G. Energy • Solar Tubes for Outer Island Schools (Canada)
• Solar Project—Namdrik Atoll and Mejit Island (EU)
• Solar Electrification Project (France) • Wotje Island Power Plant

2222
Appendix 2
Sector/Thematic/Area ADB Strategy/Activities Other Development Partners’ Strategy/Activities
H. Water Supply Sanitation and Waste Management
Programmed • Urban Solid Waste Management
• Small-scale projects (Japan) • Small-scale projects (Taipei,China)
I. Industry and Trade • Equipment Upgrade of Tobolar Copra Processing Plant (Taipei,China)
• Ebeye Infrastructure Grant, Rural Housing Grants/Loans (US)
J. Environmental Sustainability
None
• Major US Compact Focus • Water Catchments for 2 Outer Island Atolls
(Australia) • Disaster Preparedness Grant (US)
K. Agriculture and Natural Resources
None
• Small-scale Outer Island Fisheries Projects
(Japan) • Agriculture Training; Agriculture Projects in
Jaluit, Majuro and Wotje Atolls (Taipei,China) • Animal Husbandry, Support of Agriculture
Activities in the Outer Islands (FAO) • Agriculture Research Grant, Outer Island
Agriculture Training (US) • Outer Island Development Fund (Taipei,China)
AusAID = Australian Aid for International Development, DOI = US Department of the Interior, EPPSO = Economic Policy, Planning and Statistics Office, EU = European Union, FAA = Federal Aviation Authority, FAO = Food and Agriculture Organization of the United Nations, ICT = information and communications technology, MIITF = Marshall Islands Intergenerational Trust Fund, NOAA = National Oceanic and Atmospheric Administration, REG = Regional, RMI = Republic of the Marshall Islands, USDA = United States Department of Agriculture, TA = technical assistance, UN = United Nations, US = United States.

Appendix 2 23
Table A2.7: Portfolio Indicators—Amounts and Ratings, Disbursements, and Net Transfers of Resources
(public sector loans, as of 31 December 2003) Net Loan Amount Total Ratinga HS S PS U PPb At Riskc
Sector ($ million) (%) (no.) (%) (no.) (%) (no.) (%) (no.) (%) (no.) (%) (no.) (%) (no.) (%)
Agriculture and Natural Resources
Energy
Finance
Industry and Nonfuel Minerals
Multisector
Others
Social Infrastructure 7.6 49.1 1 50.0 1 100.0
Transport and Communications 7.9 50.9 1 50.0 1 100.0
Total 15.5 100.0 2 100.0 2 100.0 HS = Highly satisfactory , PP = potential problem, PS = partly satisfactory, S = satisfactory, U = unsatisfactory. a One rating for implementation progress and development objectives, based on the lower rating of either. b Potential problem loans are satisfactory loans but have four or more risk factors associated with partly satisfactory or unsatisfactory performance. c A loan is "at risk" if it is rated as partly satisfactory, as unsatisfactory, or as a potential problem. Source: Asian Development Bank Project Coordination and Procurement Division. Disbursements and Transfers OCR ADF Total Disbursements a Total Funds Available for Withdrawal ($ million) 4.0 32.8 36.8 Disbursed Amount ($ million, cumulative) 4.0 20.2 24.2 Percentage Disbursed (disbursed amt/total available) 100.0 61.5 65.7 Disbursements ($ million, latest year) 0.5 4.6 5.0 Disbursement Ratio (%) b 100.0 28.8 30.8 Net Transfer of Resources ($ million) 1999 3.6 3.6 2000 9.5 9.5 2001 2.0 5.9 7.9 2002 1.3 6.3 7.6 2003 0.2 4.0 4.2 ADF = Asian Development Fund, OCR = ordinary capital resources. a Includes ongoing loans and loans with disbursements in 2003. Ratio of disbursements during the year over the undisbursed net loan balance at the beginning of the year less cancellations during the year. Effective loans during the year have also been added to the beginning balance of undisbursed loans. Source: Asian Development Bank Project Coordination and Procurement Division.

24
Appendix 2
Table A2.8: Portfolio Indicators—Evaluation Rating by Sector
(as of 31 January 2004)
Rep. of the Marshall Islands GS/HS/S PS US Total No. % No. % No. % No. % Agriculture & Natural Resources 0 0 0 0 Energy 0 0 0 0 Industry & Nonfuel Minerals 0 0 0 0 Transport & Communications 0 0 0 0 Social Infrastructure 0 0 0 0 Finance 0 0 0 0 Multisector 0 0 0 0 Others 0 1 100.0 0 0.0 1 100.0
Total 0 1 100.0 0 0.0 1 100.0GS = generally successful; HS = highly successful, PS = partly successful, S = successful, US = unsuccessful. Source: OED/PEIS.

Appendix 2
25
Table A2.9: Portfolio Implementation Status (public sector loans, as of 31 December 2003)
Net Loan Amount Closing Date Rating
No. Sector Loan No. Seg. Title
OCR ($ million)
ADF ($ million)
Approval Date
Effective-ness Date Orig Rev
Progress (% complete)
Cumulative Contracts/
Commitments ($ million)
Cumulative Disbursements
($ million) IP DOPotential Problema
At Riskb
1 SOC 1791
Skills Training & Vocational Education Project 7.6 29 Nov 00 29 Jan 01 30 Jun 05 30 3.9 2.8 S S No No
2 T&C 1948
Outer Island Transport Infrastructure Project 7.9 28 Nov 02 05 Jun 03 30 Jun 07 5 0.0 0.0 S S No No
Total 15.5 3.9 2.8
ADF = Asian Development Fund, DO = development objectives, IP = implementation progress, OCR = ordinary capital resources, PS = partly satisfactory, S = satisfactory, Seg = segment (pertaining to loans with more than one withdrawal authority), SOC = social infrastructure, T&C = Transport & Communications, U = unsatisfactory. a "Yes" for loans with four or more risk factors associated with partly satisfactory or unsatisfactory performance. b A loan is considered "at risk" if it is rated as "PS" or "U" in either implementation progress or development objectives, or if it is a potential problem loan. Source: Asian Development Bank Project Coordination and Procurement Division.

2626
Appendix 2
Table A2.10: Assistance Pipeline for Lending Products, 2005–2006
Year of Sector Project Cost ($ million) Project/Program Thematic Preparatory ADB Cofi- Name Priority Division Assistance Total OCR ADF Total Gov't nancing 2005 Firm Loans Health, Nutrition and Social Protection
Youth Social Services ISD PAHQ 2004 8.50 6.00 6.00 2.50 Total 8.50 6.00 6.00 2.50 2006 Firm Loans Water Supply, Sanitation and Waste Management
Urban Solid Waste Disposal ES PAHQ 2005 10.00 7.50 7.50 2.50 Total 10.00 7.50 7.50 2.50
Total 18.50 13.50 13.50 5.00 ADB = Asian Development Bank, ADF = Asian Development Fund, ES = Environmental Sustainability, ISD = Inclusive Social Development, OCR = ordinary capital resources, PAHQ = Pacific Operations Division, PPTA = project preparatory technical assistance. Source: Asian Development Bank staff estimates.

Appendix 2
27
Table A2.11: Assistance Pipeline for Nonlending Products and Services, 2005–2006
Sources of Funding ADB Others Sector Responsible Assistance Amount Amount Total Assistance Name Division Type Source ($'000) Source ($'000) ($'000) 2005 Water Supply, Sanitation and Waste
Management
1. Urban Solid Waste Disposal and Management
PAHQ PP TASF 400.00 100.00 500.00
Subtotal 400.00 100.00 500.00 Law and Public Sector Management 1 Developing the Civil Service and
Rationalizing Government Assets PAHQ ID JSF 650.00 150.00 800.00
2. Preparation of Economic Report, Improving Sector and Thematic Policy and Institutional Development
PAHQ ETSW JSF 250.00 250.00
Subtotal 900.00 150.00 1,050.00 Total 1,300.00 250.00 1,550.00 2006 Law and Public Sector Management 1. Strengthening Sector and
Thematic Policy and Institutional Development (EPPSO II)
PAHQ AD TASF 650.00 350.00 1,000.00
Subtotal 650.00 350.00 1,000.00 Total 650.00 350.00 1,000.00
Total 1,950.00 600.00 2,550.00 AD = advisory, ADB = Asian Development Bank, EPPSO = Economic Policy, Planning and Statistics Office, ETSW = economic, thematic, and sector work, ID = institutional development, JSF = Japan Special Fund, PAHQ = Pacific Operations Division, PP = project preparatory, TASF = Technical Assistance Special Fund. Source: Asian Development Bank staff estimates.

Appendix 3 28
CONCEPT PAPERS FOR NONLENDING PRODUCTS AND SERVICES
This appendix contains the concept papers for projected nonlending products and services:
(i) Table A3.1: Urban Solid Waste Disposal and Management (ii) Table A3.2: Developing the Civil Service and Rationalizing Government Assets (iii) Table A3.3: Preparation of Economic Report, Improving Sector and Thematic
Policy and Institutional Development

Appendix 3 29
CONCEPT PAPERS FOR NONLENDING PRODUCTS AND SERVICES
Table A3.1: Urban Solid Waste Disposal and Management
1. Type/modality of assistance (double-click on appropriate box)
Lending Project loan Program loan Sector loan Sector development program loan Other: Nonlending Project preparatory Other than project preparatory Economic, thematic, and sector work Institutional development Other:
2. Assistance Focus
a. If assistance focuses on a particular sector or subsector, specify the Sector(s): Water Supply, Sanitation and Waste Management Subsector(s): Waste Management
b. For project preparatory and lending, classification Core poverty intervention Poverty intervention
Other
c. Key thematic area(s) Sustainable economic growth Environmental sustainability Inclusive social development Regional cooperation Governance Private sector development Gender and development
3. Coverage
Country Subregional Interregional Internal policy development
4. Responsible division/department: PARD, PAHQ
5. Responsible ADB officer(s): Nancy Convard
6. Description of assistance(s)
a. Background/linkage to country/regional strategy: During the 2004 participatory CSPU, the community raised the need for improved urban solid waste disposal and management as a high priority for ADB assistance. With Marshallese moving from outer islands to the urban areas of Ebeye and Majuro and with almost 70% of Marshallese now resident in these two areas, municipal authorities; utilities, land, and other institutions; and relevant policies have been unable to adjust to and accommodate increasing populations. Solid waste disposal has long been a problem for these societies, compounded by the lack of land on the land scarce atolls. Inadequate solid waste disposal and management now presents serious environmental, health, lifestyle, and tourism concerns. A variety of technical and financial solutions have been tried, but none has been sustained. An important, associated problem is likely to be the lack of ownership, effective demand, and commitment among the community for a lasting, sustainable solution. Within the urban areas, those most vulnerable are the poorest settlements where there is excessive concentration of housing, and no sanitation, water supply, or other utilities. Solutions to solid waste management for the urban atolls of Ebeye and Majuro could provide important lessons for other atoll Pacific DMCs.

Appendix 3 30
b. Goal and purpose: To design community-supported solution(s) to urban atoll solid waste management and disposal, incorporating design of further assistance as necessary. This should include comprehensive assessment of financial and economic viability of alternative interventions, including potential impacts on poverty and society including matters associated with land tenure, resettlement, indigenous persons, and gender. c. Components and outputs: (i) Institutional analyses of all existing local municipal, NGO, and national institutions responsible for urban solid waste disposal and management. (ii) Review earlier projects and other assistance to urban solid waste disposal and management in the RMI, in other similar atoll countries, and in other developing countries. (iii) A participatory review and assessment of alternative technical solutions, their costing and assessment of commercial and economic viability, together with all relevant stakeholders. (iv) A user survey, and assessment of demand and capacity of users to pay for alternative improved disposal systems. (v) A review and assessment of potential social impact (gender, poorest communities, resettlement, indigenous persons). (vi) All analyses and reviews would be reported on, with summary reports presented to the Government and ADB. d. Expected results and deliverables: (i) Report on participatory processes and outcomes. (ii) Report on alternative systems of waste disposal and viability. (iii) Presentation of preferred solution for consideration for ADB financing. e. Social or environmental issues or concerns: (i) Social and environmental concerns will be subject to particular study and a full environmental impact assessment. Most especially to take account of capabilities of atoll environment to store imported waste (e.g. chemicals). f. Plans for disseminating results/deliverables: There will be participatory processes to ensure that the community and relevant stakeholders are engaged in determining the preferred system.
7. Proposed executing/implementing agency or agencies: Relevant Municipal Authorities, Ministry of Health and Environment and Ministry of Public Works.
8. Nature/extent of government/beneficiary involvement in identifying or conceptualizing the assistance:
This was prioritized by the community and the Government during the participatory CSPU in 2004.
9. Timetable for assistance design, processing, and implementation
a. Year included in CSPU: 2004
b. Expected date of submission for approval Lending: Nonlending (project preparatory): 2005 Nonlending (other than project preparatory):
c. Period and duration of assistance Lending: Nonlending: 1 year.

Appendix 3 31
10. Financing Plan
a. For lending Ordinary capital resources: $ Asian Development Fund: $ Other: $
If cofinancing is required, indicate amount and sources sought: $____, from ____________. If known, provide cost estimates and financing arrangements.
Source Amount ($) ADB Financing Government Financing Other Financing Total Cost Source:
b. For nonlending No resources required, other than ADB staff ADB's administrative budget: $ Grant TA funds $400,000 Other:
If cofinancing is required, indicate amount and sources sought: $____, from ____________. If known, provide cost estimates and financing arrangements.
Source Amount ($) ADB Financing 400,000 Government Financing 100,000 Other Financing Total Cost 500,000
Source: Mission estimates. ADB = Asian Development Bank, DMC = developing member country, CSP = country strategy and program, CSPU = country strategy and program update, PAHQ = Pacific Operations Division, PARD = Pacific Department, RCSP = regional cooperation strategy and program, TA = technical assistance.

Appendix 3 32
Table A3.2: Developing the Civil Service and Rationalizing Government Assets
1. Type/modality of assistance
Lending Project loan Program loan Sector loan Sector development program loan Other: Nonlending Project preparatory Other than project preparatory Economic, thematic, and sector work Institutional development Other
2. Assistance Focus
a. If assistance focuses on a particular sector or subsector, specify the Sector: Law and Public Sector Management
Subsector: National Government Administration
b. For project preparatory and lending, classification Core poverty intervention Poverty intervention
c. Key thematic area(s) Sustainable economic growth Environmental sustainability Inclusive social development Regional cooperation Governance Private sector development Gender and development
3. Coverage
Country Subregional Interregional Internal policy development
4. Responsible division/department: PAHQ/PARD
5. Responsible ADB officer(s): Steve Pollard
6. Description of assistance(s)
a. Background/linkage to country/regional strategy: Successive RMI governments have struggled since independence to form an effective, efficient, and productive civil and public service. ADB has previously sought to assist earlier governments in such endeavors. Most significantly, ADB has provided assistance in support of public sector reform through two program loans (January 1997, Loan 1513: Public Sector Reform Program; and June 2001, Loans 1828, 1829 Fiscal and Financial Management Program). As recorded by OED evaluation of Loan 1513 and PARD PCR of Loan 1828/29, neither of these program loans fulfilled all their respective objectives. Program loan-associated TA (TA 2295: Policy Advisory Team for Economic Management, TA 3668: Fiscal, Financial and Economy Advisory Services) have also failed to make much sustained impact on improved public sector productivity. In contrast, some sector TA, most especially in fisheries (TA 2349: National Fisheries Development Plan and TA 2854: Fisheries Management) has been most successful, providing some guidance for institutional strengthening. At the same time, the Government is a major lessee of lands and a major owner of physical assets. The population that is served by these assets has moved; most noticeable is the movement of people to Majuro and Ebeye. Current asset holdings may not serve the greatest public interest. One of the two priorities of the poor and those in hardship, as recorded by the participatory poverty assessment of late 2002, is the need to improve access to basic, high-quality social services, especially primary health and primary education.

Appendix 3 33
The current Government of President Note was reelected in November 2003 on a renewed mandate to continue improving the state of good governance. This Government fully supports a review and fundamental reform of the civil service and associated rationalization of government assets. The CSPU for 2005–2007 was prepared in a highly participatory manner, culminating in a National Coordination Committee (NCC) meeting at the end of March 2004. This process and the NCC accorded high priority to review and reform of the civil service and associated rationalization of government assets. b. Goal and purpose: The TA will aim to design and assist the Government and people of RMI to gradually implement sustained improvements in the efficiency and effectiveness of the public service, especially in support of improved delivery of primary health and primary education, which is a priority of those who experience the greatest hardship in RMI. c. Components and outputs: The grant assistance will cover the following: (i) a review of previous efforts of civil service and administrative reforms and summary of lessons learned; (ii) a fully participatory review and widespread, people assessment, followed by a nationwide dissemination of the state of civil service performance and productivity; (iii) an impartial assessment of the readiness and strength of support for civil service reform, the vision for reform, and sustainability of reform; (iv) an impartial assessment of best timing, duration, and possible sequencing and speed of reforms; (v) an assessment of other externally funded programs and the coherence and consistency of support for intended program of reforms; (vi) an assessment of the best agency or agencies to implement reforms; (vii) an assessment of NGO capacity to monitor reform implementation; (viii) an associated review and proposed rationalization of government assets; (ix) a program for the participatory implementation of the findings of the civil service review and asset rationalization; and (x) design and implementation of system to monitor delivery of essential public services. d. Expected results and deliverables: A gradual improvement in the delivery of public services, especially those that are a priority of the poor. e. Social or environmental issues or concerns: None. f. Plans for disseminating results/deliverables: An essential component of the TA will be the engagement of all relevant media in a program to monitor and publish the recorded delivery of public services (especially primary health and primary education).
7. Proposed executing/implementing agencies: Office of the President.
8. Nature/extent of government/beneficiary involvement in identifying or conceptualizing the assistance: The Government and people of RMI were fully involved in the participatory processes, from December 2003 to end-March 2004, that led to the formulation of the CSPU for 2005–2007. This culminated in the NCC of 29 March 2004 and the prioritization of this TA.
9. Timetable for assistance design, processing, and implementation a. Year included in CSPU: 2004
b. Expected date of submission for approval Lending: Nonlending (project preparatory): Nonlending (other than project preparatory): September 2005. Activities financed by JFICT or JFPR:
c. Period and duration of assistance Lending: Nonlending: 4 years Activities financed by JFICT or JFPR:

Appendix 3 34
10. Financing Plan
a. For lending Ordinary capital resources: $ Asian Development Fund: $ Other: $
If cofinancing is required, indicate amount and sources sought: $____, from ____________. If known, provide cost estimates and financing arrangements.
Source Amount ($) ADB Financing Government Financing Other Financing Total Cost Source:
b. For nonlending No resources required, other than ADB staff ADB's administrative budget: $ Grant TA funds $650,000 Other:
If cofinancing is required, indicate amount and sources sought: $____, from ____________. If known, provide cost estimates and financing arrangements.
Source Amount ($) ADB Financing 650,000 Government Financing 150,000 Other Financing Total Cost 800,000
Source: Mission estimates
Table A4.3: Further Enhancing the Environment for Private Sector Development
ADB = Asian Development Bank, CSPU = country strategy and program update, JFICT = Japan Fund forInformation and Communication Technology, JFPR = Japan Fund for Poverty Reduction, NGO = nongovernmentorganization, OED = Operations Evaluation Department, PAHQ = Pacific Operations Division, PARD = PacificDepartment, SCSP = subregional cooperation strategy and program, TA = technical assistance.

Appendix 3 35
Table A3.3: Preparation of Economic Report, Improving Sector and Thematic Policy and
Institutional Development
1. Type/modality of assistance
Lending Project loan Program loan Sector loan Sector development program loan Other: Nonlending Project preparatory Other than project preparatory Economic, thematic, and sector work Institutional development Other
2. Assistance Focus
a. If assistance focuses on a particular sector or subsector, specify the Sector: Law and Public Sector Management Subsector: Economic Management
b. For project preparatory and lending, classification Core poverty intervention Poverty intervention
c. Key thematic area(s) Sustainable economic growth Environmental sustainability Inclusive social development Regional cooperation Governance Private sector development Gender and development
3. Coverage
Country Subregional Interregional Internal policy development
4. Responsible division/department: PAHQ/PARD
5. Responsible ADB officer(s): Giovanni Capannelli
6. Description of assistance(s)
a. Background/linkage to country/regional strategy: Previous economic reports for the RMI were published in 1996 under the Pacific Islands Economic Report series, and in 2000 as Meto 2000. These economic reports were comprehensive in their coverage of current macroeconomic and sector status, trends, and policy issues. Each of these reports supported the design of subsequent ADB-funded program loans that aimed to strengthen central fiscal and economic management and policy formulation, to secure government revenues, and to aid structural economic adjustment. The first program loan was additionally, particularly, concerned to aid a downsizing of government. While some progress has been made in improving fiscal management, tax auditing, managing financial information, negotiating a renewed aid agreement with the Government of the US, establishing an institution to support voluntary land registration, and sustaining future finances through the establishment of a trust fund, much more work remains. This includes establishing an improved tax regime, further strengthening policy formulation, further improving the policy and institutional environment in support of private sector development, and improving public sector performance. TA 4199: Strengthening EPPSO, is a further attempt by ADB to strengthen central fiscal and economic policy formulation by strengthening the new Economic Policy, Planning and Statistics Office. ADB is also formulating TA to commence in 2004 to help improve the environment for private sector development. However, traditional social organization and society’s expectations can curtail the improvement of public administration. Given

Appendix 3 36
these endemic constraints to improved economic productivity, further policy and institutional analysis is needed to guide the design of further TA to help improve public sector performance. b. Goal and purpose: The proposed TA will assist the RMI to analyze and report on the constraints to social adaptation toward a modern domestic economy, and to guide relevant policy and institutional formulation. The report will help guide ADB and other assistance to the RMI. The proposed TA will also help guide future capacity building in participatory sector and thematic policy formulation beyond the Office of the President and Ministry of Finance, which are the primary recipients of assistance under TA 4199. c. Components and outputs: The TA will (i) analyze the current social and economic trends and prospects as background to social adaptation of the public sector; (ii) identify major issues, constraints, and alternative strategies in support of improved public sector performance in the medium term; (iii) examine and present reasoned argument for new policy positions on urban development, subsidies, particularly the copra price subsidy, and labor market, wages, and remittance earnings; and (iv) prepare a social and economic report, road map(s), and other forward-looking strategic guidance that will form the basis for a future plan of assistance. d. Expected results and deliverables: A full economic report, and a summary RMI reader-friendly booklet, produced in a timely manner, in form suitable for publication. e. Social or environmental issues or concerns: Society's expectations may not support a more productive public sector.
f. Plans for disseminating results/deliverables: The reports will be widely disseminated to all interest parties in RMI with the assistance of all relevant media in the RMI. 7. Proposed executing/implementing agencies: Economic Policy, Planning and Statistics Office, Office of the President.
8. Nature/extent of government/beneficiary involvement in identifying or conceptualizing the assistance: Government and community of RMI worked with participatory CSPU process in 2004 that prioritized this proposed assistance.
9. Timetable for assistance design, processing, and implementation a. Year included in CSPU: 2004
b. Expected date of submission for approval Lending: Nonlending (project preparatory): Nonlending (other than project preparatory): March 2005 Activities financed by JFICT or JFPR:
c. Period and duration of assistance Lending: Nonlending: 6 months Activities financed by JFICT or JFPR:

Appendix 3 37
10. Financing Plan
a. For lending Ordinary capital resources: $ Asian Development Fund: $ Other: $
If cofinancing is required, indicate amount and sources sought: $____, from ____________. If known, provide cost estimates and financing arrangements.
Source Amount ($) ADB Financing Government Financing Other Financing Total Cost Source:
b. For nonlending No resources required, other than ADB staff ADB's administrative budget: $ Grant TA funds $250,000 Other:
If cofinancing is required, indicate amount and sources sought: $____, from ____________. If known, provide cost estimates and financing arrangements.
Source Amount ($) ADB Financing 250,000 Government Financing Other Financing Total Cost 250,000
Source:
ADB = Asian Development Bank, CSPU = country strategy and program update, EPPSO = Economic Policy,Planning and Statistics Office, JFICT = Japan Fund for Information and Communication Technology, JFPR = JapanFund for Poverty Reduction, PAHQ = Pacific Operations Division, PARD = Pacific Department, RMI = Republic ofthe Marshall Islands, SCSP = subregional cooperation strategy and program, TA = technical assistance.

38
Appendix 4
Table A4.1: Assistance Program for Nonlending Products and Services, 2004
Sources of Funding ADB Others Sector Responsible Assistance Amount Amount Total Assistance Name Division Type Source ($'000) Source ($'000) ($'000) 2004 Private Sector Development 1. Enhancing the Environment for
Private Sector Development PAHQ AO TASF 650.00 650.00
Total 650.00 650.00 AO = advisory and operational, ADB = Asian Development Bank, PAHQ = Pacific Operations Division, TASF = Technical Assistance Special Fund. Source: Asian Development Bank staff estimates.
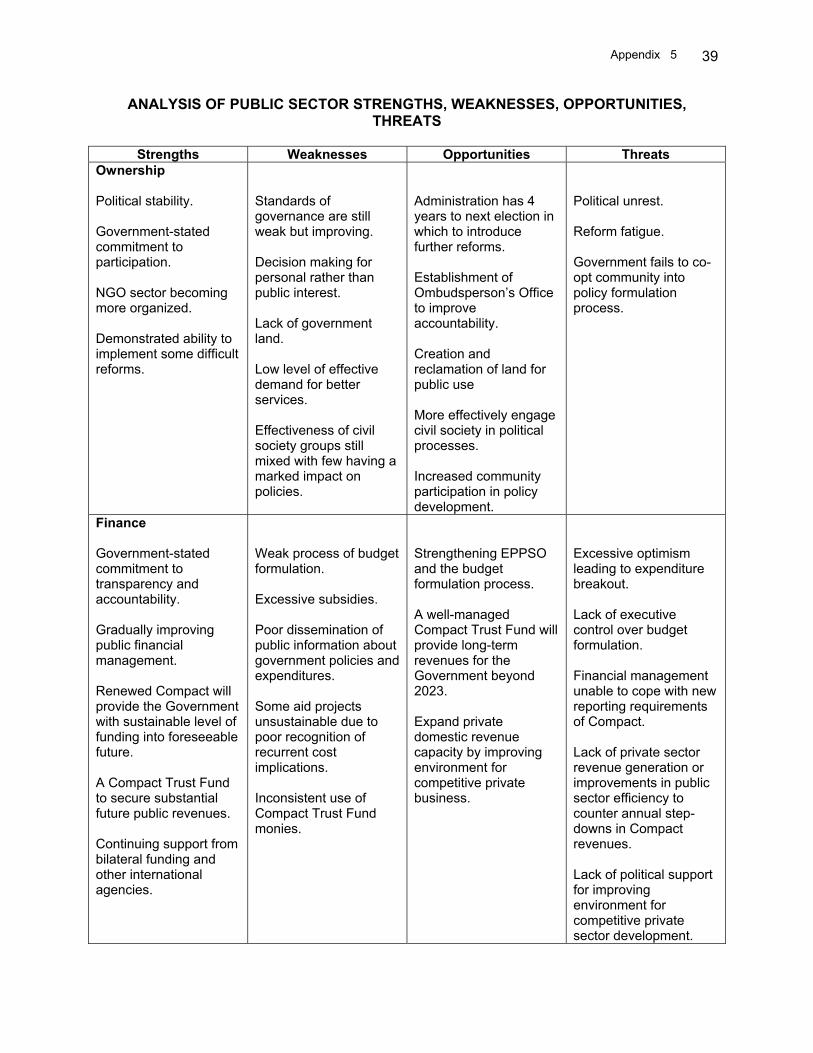
Appendix 5 39
ANALYSIS OF PUBLIC SECTOR STRENGTHS, WEAKNESSES, OPPORTUNITIES, THREATS
Strengths Weaknesses Opportunities Threats
Ownership Political stability. Government-stated commitment to participation. NGO sector becoming more organized. Demonstrated ability to implement some difficult reforms.
Standards of governance are still weak but improving. Decision making for personal rather than public interest. Lack of government land. Low level of effective demand for better services. Effectiveness of civil society groups still mixed with few having a marked impact on policies.
Administration has 4 years to next election in which to introduce further reforms. Establishment of Ombudsperson’s Office to improve accountability. Creation and reclamation of land for public use More effectively engage civil society in political processes. Increased community participation in policy development.
Political unrest. Reform fatigue. Government fails to co-opt community into policy formulation process.
Finance Government-stated commitment to transparency and accountability. Gradually improving public financial management. Renewed Compact will provide the Government with sustainable level of funding into foreseeable future. A Compact Trust Fund to secure substantial future public revenues. Continuing support from bilateral funding and other international agencies.
Weak process of budget formulation. Excessive subsidies. Poor dissemination of public information about government policies and expenditures. Some aid projects unsustainable due to poor recognition of recurrent cost implications. Inconsistent use of Compact Trust Fund monies.
Strengthening EPPSO and the budget formulation process. A well-managed Compact Trust Fund will provide long-term revenues for the Government beyond 2023. Expand private domestic revenue capacity by improving environment for competitive private business.
Excessive optimism leading to expenditure breakout. Lack of executive control over budget formulation. Financial management unable to cope with new reporting requirements of Compact. Lack of private sector revenue generation or improvements in public sector efficiency to counter annual step-downs in Compact revenues. Lack of political support for improving environment for competitive private sector development.

Appendix 5 40
Strengths Weaknesses Opportunities Threats Delivery High level of nongovernment provision of education and health services.
Public sector tries to do too much and resources are spread too thinly. Weak public service delivery to all areas. No attention to regulatory environment. Weak support for improvement of private sector tax collection, audit, enforcement as well as tax structure.
Reducing the range of public sector activities to prioritize core areas of education, health, and law enforcement. Increase nongovernment sector involvement in provision of public services.
Public sector expands its scope of activities. Continued crowding out of private sector activity.
Staff Improved morale of public service since RIF. Influx of young graduates.
Lack of skilled human resources and low productivity. Lack of career paths for talented public servants. Poor human resource management and ineffective PSC.
Reform of PSC. Establishment of cadre of prestigious civil servants trained for senior levels of public service.
Continued growth in staff numbers and wage levels. Inability to harness ability of skilled staff. Erosion of morale.
Management Improved performance of MISSA, MIVA, and MIMRA. Infrastructure maintenance plan under preparation.
Weak management of public infrastructure, utilities. Poor policy evaluation and coordination. Lack of ownership for maintenance.
Undertake backlog maintenance and develop necessary social and economic infrastructure to support service delivery. Implementation of EPPSO. Reform of SOEs that could deliver substantial improvements in efficiency.
Continuation of “build and deteriorate” model of infrastructure development. Effect of capital demands of SOEs on government finances.
EPPSO = Economic Policy, Planning and Statistics Office, MIMRA = Marshall Islands Marine Resources Authority, MIVA = Marshall Islands Visitors Authority, MISSA = Marshall Islands Social Security Administration, PSC = Public Service Commission, RIF = Reduction in Force.

Appendix 6 41
Source: PARD RMI Country Team
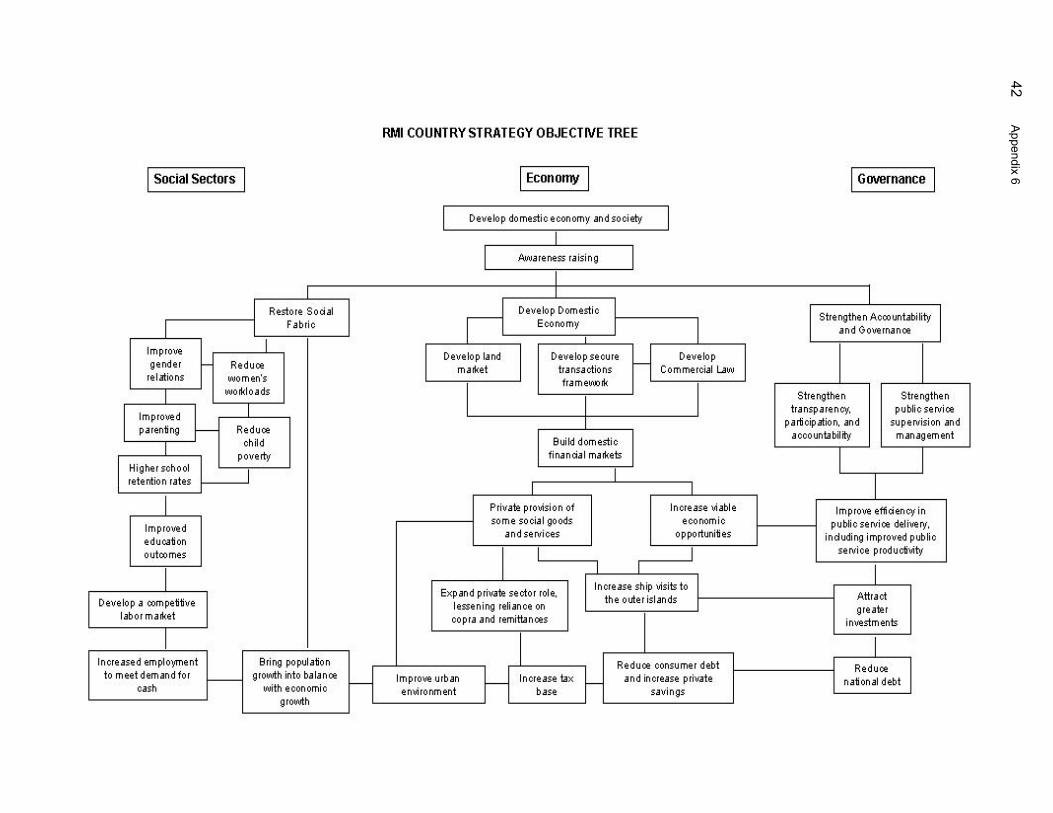
42
Appendix 6

Appendix 7 43
ROAD MAPS: SOCIAL SECTOR AND PRIVATE SECTOR (February 2003)
I. Road Map for Social Sector Development
A. Background 1. The Republic of the Marshall Islands (RMI) faces some of the most daunting development challenges of any country in the world. In common with its immediate neighbors—the Federated States of Micronesia and Kiribati—the RMI has a small population living on a tiny land area scattered over an immense area of the central Pacific with few natural resources to sustain the population. The combination of limited resources and vast distances results in a high-cost environment. In many ways, it is fortunate that the RMI has a close and apparently enduring relationship with the United States (US). Without this relationship and the resources and opportunities it provides for the Marshallese, the RMI would be one of the poorest nations in the world. B. History1 2. The first Marshallese came to the islands 2,000 years ago. Their way of life and social structure developed to fit the constraints imposed by a remote and resource-poor environment. A hierarchical culture based on land tenure developed with land ownership and authority being vested in chiefs of varying status. The ordinary people provided support for the chiefs and in turn depended upon the chiefs to provide for their needs. The population levels were ruthlessly controlled to match the carrying capacity of the land with family size normally being limited to two children. The population in the pre-colonial period was around 14,000. 3. While notionally a Spanish colony from the 1500s, the Marshallese had little contact with Europeans until the German period from 1860 to 1914. German trading companies established a network of trading stations, which were used to buy copra in exchange for trade goods. This period ended in September 1914 when the Japanese declared war on Germany and occupied the islands. The Japanese took over the German operations and continued the copra trade until World War II when, after a series major sea and air attacks, the US wrested control of the islands from the Japanese. After a short period of occupation, the US was granted trusteeship of the Micronesian islands by the United Nations. The US constructed a military base on Kwajalein and used what are now the RMI as one of their principal nuclear testing sites. During this period, the US detonated 67 nuclear devices at Bikini and Eniwetok atolls. The fallout from several of these tests exposed many Marshallese to radiation with appalling consequences for the victims and their descendants. In addition to the radiation damage, many Marshallese were forced to relocate from their home islands and reduced to living in squalid conditions in densely populated urban environments. Not surprisingly, many Marshallese came to view themselves as victims of events that were beyond their control. The trust territory period was characterized by, at best, a paternalistic administration. From an outsider’s perspective it appears that for much of the period the US viewed the Marshallese as somewhat of an inconvenience to its global agenda in the era of the cold war. 4. The trust territory period came to an end in 1986 when the US entered into a Compact of Free Association with the newly formed RMI. The terms of this Compact included the payment
1 Source: ADB. 2001. Republic of the Marshall Islands. Meto 2000 Economic Report and Statement of Development
Strategies.

Appendix 7 44
by the US of relatively large sums of money to support the RMI as it transited from trust territory status to full independence. From the US perspective these payments were seen as an exit strategy. From the Marshallese perspective they were seen as the first installments in a permanent relationship. The first Compact period ended in 2000 and the second period has recently been negotiated. C. Geography 5. The RMI consists of 29 low-lying coral atolls and five islands. The atolls and islands cover a total lagoon area of 6,511 square kilometers (km2) that is situated in an exclusive economic zone (EEZ) encompassing 1.2 million km2 of the central Pacific Ocean. In marked contrast to the vast size of the EEZ, the total land area is miniscule, at around 110 km2. Most of this land consists of relatively infertile coral sands. D. Population 6. In 2000, the resident population of RMI was 51,526, over 70% of whom live in the two urban centers, Majuro and Ebeye. The remaining 14,600 live on 19 of the outer islands with most islands having fewer than 500 residents. Only four have more than 1,000 residents. During the 10 years to 1988, the population grew at an annual average rate of 4.3%.2 In the decade since 1988, the annual average growth rate of the population fell to 1.5%. This marked change in population growth rate reflects the significant out-migration to the US since the mid-1990s. In 1999, the national median age was 16.3 years (ADB 2002),3 and young people (15–24 years) accounted for 22% of the population. The population is also characterized by relatively high dependency ratios, which reflect the increasing out-migration of economically active adults to the US. E. Economy 7. The RMI has a dual economy with both subsistence and monetary activities making contributions to national production. Gross domestic production (GDP) is currently estimated to be around $100 million ($1,910 per capita) (Table A6.1). While important in some outer islands, subsistence production contributes little to the livelihood of the Marshallese living on Majuro and Ebeye. The monetary part of the economy is narrowly based on (i) payments under the Compact of Free Association with the US; (ii) payments by the US for the use of Kwajalein atoll as a military base; (iii) compensation payments to the people adversely affected by nuclear fallout from the US nuclear tests; (iv) employment at the Kwajalein military base; (v) fees paid by international fishing fleets for access to the offshore fish resources; (vi) copra production; (vii) some adventure tourism (principally diving and game fishing); and recently, (viii) fish processing. Over 80% of foreign exchange earnings are transfers from the US and payments by international fishing fleets. This heavy reliance on compensation and usage payments has created an extreme version of a rentier economy. The dependence on rents leaves the economy very vulnerable to changes in US strategic interests and the whims of the international tuna fishery. Given RMI’s limited natural resources and the geographic constraints, the country has few, if any, other options to develop the economy. The RMI must therefore make the most of its opportunities to capture the rents.
2 See footnote 1. 3 See footnote 1.

Appendix 7 45
Table A6.1: Basic Economic Statistics Est. Proj.
1995/96 1996/97 1997/98 1998/99 1999/00 2000/01
GDP at current market prices (US$ mn.) 97.0 92.2 95.7 97.3 96.0 98.8Growth rate (percent change) -7.8 -5.0 3.8 1.7 -1.4 3.0
Real sector (calendar year basis)Real GDP (percent change) -16.6 -10.1 0.8 -0.3 0.5 1.0Consumer prices (percent change) 10.5 5.8 2.9 2.0 -1.9 2.0
Central government finance (percent of GDP)Revenue and grants 80.5 74.6 74.7 67.3 64.7 68.9
Revenue 37.1 30.2 25.8 27.4 23.4 24.9Grants 43.4 44.5 48.9 39.9 41.3 44.0
Expenditure 62.0 65.5 59.2 56.8 58.7 53.6Current 55.4 55.2 53.6 48.9 51.3 44.5Capital 6.6 10.3 5.7 7.9 7.3 9.2
Overall balance 18.5 9.1 15.5 10.5 6.1 15.2Stock of domestic arrears 1.4 1.0 1.3 1.0 1.8 1.7
Commercial banks (US$ mn.; end-December)Foreign assets 21.1 18.0 22.2 25.0 30.7 …Loans 30.5 32.3 30.4 34.9 37.9 …Total deposits 48.6 45.0 48.3 56.6 62.2 …
Balance of payments (US$ mn.)Trade balance -35.4 -33.8 -41.9 -44.3 -43.0 -44.1Net services and income -5.6 -4.2 -22.7 -16.5 -4.1 -4.0Private and official transfers 50.7 49.8 55.5 46.6 49.2 51.3Current account including official transfers 9.7 11.8 -9.1 -14.2 2.2 3.2
(In percent of GDP) 10.0 12.8 -9.6 -14.6 2.3 3.2Current account excluding official transfers -40.5 -37.5 -64.0 -60.2 -46.4 -47.4
(In percent of GDP) -41.8 -40.7 -66.9 -61.9 -48.4 -48.0Overall balance2 -8.3 -0.6 3.1 -7.6 -4.6 1.6
(In percent of GDP) -8.5 -0.7 3.2 -7.8 -4.8 1.6
External debt (US$ mn.; end of period)3 135.6 127.8 116.0 88.3 76.0 56.1(In percent of GDP) 139.8 138.6 121.3 90.7 79.2 56.8
External debt service (US$ mn.) 25.0 25.1 25.6 37.3 20.2 25.8(In percent of exports of goods and services) 108.8 146.6 250.7 371.0 136.4 169.2
Government usable financial assets (US$mm.; end of perio 9.9 9.3 12.4 4.8 0.2 1.8(In months of imports of goods and services) 1.5 1.6 2.0 0.8 0.0 0.3
Exchange rateExchange rate regime U.S. dollar is the domestic currency
Source: IMF Staff Reports
1 On a fiscal year basis; the fiscal year ends on September 30. 2 Approximated as the change in government usable financial assets after adjusting for valuation changes. 3 Government and public enterprise debt only. 4 Indicator of official reserves.

Appendix 7 46
Table A6.2: Social Sector Development
Key issues: • Increasing social problems due to:
- Increasing urbanization of population; - Limited opportunities for gainful employment; and - Top-down approach to provision of services
Framework for action:
• Strengthen social cohesiveness of the community Actions needed (in order of priority):
• Strengthen the role of civil society in political and government processes • Strengthen educational performance • Address increasing social problems, particularly with young people • Improving the situation in outer islands • Substantially reduce incidence of infectious and lifestyle diseases
Source: Consultant's description. F. Social Sector Situation Report 8. The need to improve education opportunities and health services has been well documented. Information gathered during the ADB poverty assessment4 indicated that most of the families interviewed were concerned about the lack of opportunities for employment and the inadequacy of the services provided by the Government. Despite having one of the highest per capita GDPs among the Pacific developing member countries (DMCs), the RMI has some of the worst social indicators. Among other things, infectious and lifestyle diseases are at close to epidemic proportions, the rate of infant and child mortality is high albeit improving slowly, teenage pregnancies are increasing, alcohol and tobacco use are high, and the rate of suicide is alarming. The responses obtained during the poverty assessment provide some insights into the issue. The lack of employment opportunities lead to a sense of futility and erodes people’s self-worth. The concern about the adequacy of Government services in large part reflects the prevailing opinion that it is the responsibility of the Government (among others) to look after the needs of people. 9. For several generations Marshallese have become accustomed to being provided for by the US Administration and, more recently, their own Government. This top-down supply-driven approach has eroded people’s sense of control over their destiny. Many Marshallese now consider it to be the Government’s duty to provide for them with little to no effort on their part to contribute to their own welfare. This approach to providing government services has eroded their sense of self-reliance and responsibility and has led to apathy and a sense of dependency. 10. In addition, Marshallese society is undergoing a significant transformation. The migration of a large proportion of the Marshallese from outer islands to Majuro, Ebeye, and the US is eroding the traditional structure of society. Some of the problems associated with this are
4 ADB. 2003. Priorities of the People. Hardship in the Marshall Islands. Manila.

Appendix 7 47
manifested by the increasing difficulties controlling the behavior of young people; the high suicide rate; the breakdown of family discipline; and the indifference of many to the quality of education, the adequacy of health services, and the pollution of the physical environment. 11. There is a pressing need to strengthen the social cohesiveness of the community. A resilient economy requires a confident population capable of enunciating its needs and ensuring that those needs are met to the extent possible with the resources available to the nation. The top-down supply approach used in the past must be replaced with an approach that draws the community into the decision-making process. The basic development strategy must change from being supply driven to being demand driven. The aim should be to give everyone a sense of control over their own destiny. G. Sector Constraints and Opportunities 12. Strengthen the role of civil society in political and government processes. This issue has been identified in the past and some efforts have already been made to address it, notably ADB Loan 1316-RMI[SF]: Health and Population, including programs of community involvement in health delivery. These included national seminars on health issues and the establishment of community health councils. To date, the results of these efforts have been mixed. While the seminars did succeed in raising general awareness of health issues, the uptake of that information has been slow. There has also been a mixed result with the community health councils: some are very active and involved in the provision of and demand for health services, others have done little beyond sending their staff to attend initial briefings. Similar attempts to establish community-based schools failed. This failure seems be closely associated with the lack of resources available to or committed by local government councils. The fact that there have been changes does not mean that the process should not continue. The reason for these mixed results should be more closely examined. 13. Strengthen educational performance. Now and into the foreseeable future, Marshallese will be heavily dependent upon their right to enter and work in the US. One of the main constraints to maximizing the benefit from this right is the substandard educational outcome in the RMI. This issue can be attributed to the quality of the public education system and the indifferent attitude of many Marshallese to the education of their children. Many primary school students entering secondary schools have difficulty with basic literacy skills. This reduces their capacity to learn and forces teachers to spend scarce time on basic literacy training. Statistics from 1996 show that only 40% of students entering secondary school in 9th grade graduate from 12th grade. Most of those that do succeed in graduating from high school perform poorly in the US-standardized tests. 14. Address increasing social problems, particularly with young people. The emergence of US-style gangs is an alarming trend. Recent gang fights have resulted in at least one death and the indiscriminate stoning of vehicles in some areas of Majuro. This type of behavior is almost completely alien to traditional Marshallese culture in which conformity to community values is very strongly emphasized. In practice, this development of gangs is only one symptom of a more pervasive issue. Marshallese are becoming increasingly urbanized with over 70% of the domestic population now living in either Majuro or Ebeye. In the process the checks and balances of traditional Marshallese society are breaking down. This is quite a common occurrence whenever any society changes from being rural based to urban based and the problems associated with the change continue to be experienced in many countries, including highly developed countries. In RMI, the situation is exacerbated by the lack of opportunities to find work and the difficult living conditions. The process of change from a rural-

Appendix 7 48
based to urban-based society is evolutionary and it is neither possible nor sensible to try and force the process. The primary strategy and first priority must be to facilitate the participation of civil society in the decisions that affect people’s lives and thereby provide the ground from which new systems and structures can emerge. Given the difficult challenges facing the RMI, it is very important to foster the effective empowerment of the wider community. 15. Improving the situation in the outer islands. The problems associated with living in the outer islands are well documented. Life on a remote atoll with few natural resources is challenging at the best of times. The lack of economic resources, substandard education and health facilities, infrequent and unreliable communication and transport combine to make life very difficulty. Out-migration of economically active adults has created a situation where most outer islands have a very high dependency ratio. The average population of an outer island is 500 with only four of the 19 inhabited island having populations in excess of 1,000. The attention that funding agencies have given to addressing the problems of the outer islands is evidenced by the long list of outer island projects. While it is clear that outer islands do have special problems that need to be addressed, it is equally clear that vast majority of Marshallese live in two urban centers in quite difficult circumstances. The extent to which the heavy emphasis given to the outer islands results from the desire of politicians to provide services for their communities should be taken into to account when designing projects and programs for the RMI. More thought should be given to striking a balancing in the destination of the assistance provided. 16. Substantially reduce incidence of infectious and lifestyle diseases. As reported in PCR:RMI 263225 for the ADB’s Health and Population Loan: “Health pattern in the Marshall Islands is characterized by the coexistence of infectious diseases characteristic of developing countries, including a high prevalence of tuberculosis, pulmonary infections, sexually transmitted infections, gastro-enteritis, with a very high prevalence of noncommunicable diseases such as diabetes and hypertension.” Aside from the obvious personal distress that these health problems cause many people, they also have a substantial impact on the economy of the RMI. The cost of caring for the ill is significant, especially since many of the more serious cases must be sent overseas for treatment. The productivity of the workforce is reduced by illness and premature death. The potential health risk to travelers is also a disincentive to tourists and other travelers. In addition to the infectious and lifestyle diseases, some Marshallese are still suffering from radiation sickness caused by US nuclear tests into the late 1960s. There is credible evidence that the effect of radiation has been passed through the second generation into the third generation of the families affected. While these families have received compensation for the damages and have funds set aside for their treatment, there are ongoing problems that have yet to be adequately addressed.
5 Health and Population Loan: 1316-RMI[SF], November 2002.

Appendix 7 49
H. Strengths, Weaknesses, Opportunities, Threats
Table A6.3: Analysis of Strengths, Weaknesses, Opportunities, Threats
Strengths Weaknesses Opportunities Threats
Renewed Compact will provide the Government with sustainable level of funding into foreseeable future
Continuing support from bilateral funding and other international agencies
Standards of governance are improving
Women’s groups, nongovernment organization groups, youth groups, and other community groups already exist
Urbanization of society leading to the breakdown of traditional checks and balances
Weak public infrastructure
Private markets substantially limited to supplying goods and services
Effectiveness of civil society groups is mixed with few having a marked impact on policies
Low quality of educational infrastructure, materials, and human resources
Low commitment to education
Secondary graduates not adequately prepared for employment in the country or the United States
Land tenure system prevents use of land for mortgage security
Creating a sense of ownership for society’s resources
More effectively engaging civil society in the political process
Introducing empowerment concepts and procedures through forthcoming constitutional convention
Increasing employment opportunities and worker productivity
Accelerating erosion of social cohesiveness leading to problems with civil and social disorder
Political unrest
Disaffected young people causing civil and social disorder
Source: TA 3668 Consultant's analysis.

1. Sector Outcomesa. Improvement in HDI indexb. Improvement in HPI indexc. Reduction in infant and child mortalityd. Reduction in incidence of diabetes and infectious diseasese. Increased secondary school graduation ratef. Improvement in students' average TOEFL and SAT scores
2. Sector Issues/Constraints/Actions
a. Strengthen the role of civil society in political and Gov't processes X X X XPPTA: Outer Island Basic Social Services X X X X
b. Address increasing social problems, particularly with youth X X X X X X X X X X X X X XPPTA: Outer Island Basic Social Services X X X XLoan 1791-RMI: Skills Training and Vocational Education X X X X X X X X X X X X X X
c. Strengthen educational performance X X X X X X X X X X X X X XLoan 1791-RMI: Skills Training and Vocational Education X X X X X X X X X X X X X XPPTA: Outer Islands Basic Social Services X X X X
d. Substantially reduce incidence of infectious and life-style diseases X X X XPPTA: Outer Island Basic Social Services X X X XLoan 1694-RMI: Ebeye Health and InfrastructureTA 2164-RMI: Health Management Information System & Health Planning
e. Improving the situation in the Outer Islands X X X XPPTA: Outer Island Basic Social Services X X X XLoan 1948-RMI: Outer Island Transport Infrastructure
40% (1999)
Current
0.56
25/26 (1998)
Table A6.4: SOCIAL SECTOR ROAD MAP
18.7
Indicators
5 yrs (2007)*
0.6220.6
n.a.
23/2436%n.a.
2003 2004 2005 2006 2007
n.a.(2000)n.a.(1998)
50 A
ppendix 7

Appendix 7 51
II. Road Map for Private Sector Development A. Introduction 17. In spite of levels of aid that on a per capita basis are among the highest in the world, the RMI economy has registered many years of low or negative growth and per capita income is now 20% below what it was at independence in 1986. The Government has announced that future growth depends on a thriving private sector and is interested in promoting private sector-friendly policies within a sustainable development framework. Although the Government has made the important commitment to improving the private sector environment, however, several important steps are necessary to improve the prospects for higher private sector growth that will make the economy more competitive, including changing some aspects of the role of the state in the economy, undertaking institutional reform that will promote private contracting, and encouraging financial market growth. For various reasons, the time is ripe for a national debate regarding the role of the state, the role of business, and how reform should proceed that could provide opportunities for reform that will lead to long-lasting change. B. Major Issues and Challenges 18. The main issues influencing private sector development in the RMI are:
(i) Stagnant macroeconomy. There has been no sustained growth in the RMI since independence. There is no real discretionary control over macroeconomic instruments. The RMI rate of inflation is tied to that in the US as is the preponderance of its trade. With few or no discretionary instruments in the Government’s hands to influence the economy, the stagnation of output is a result of the poor incentives provided by the very high-cost business environment.
(ii) Low rate of return on capital. Indirect evidence suggests that the rate of return
on capital in the RMI is low, which has resulted in the private sector being a net exporter of capital. The most likely explanations are the crowding out of the private sector by the state, weak institutions, and the very high-cost business environment.
(iii) Costly business environment. A number of factors combine to raise the costs
of doing business in the RMI, including utility costs, poor infrastructure, the high costs of domestic and international communications, and high import duties. Most of these costs arise from the pervasive influence of the state in the economy and together they greatly exacerbate the impact of the small size and the remoteness of the RMI.
(iv) Concentrated Economic Power. The small size of the economy has led to a
concentration of economic power in the services and distribution sectors, which has decreased competition and increased costs. Lack of competition is exacerbated by the fact that in a small economy like the RMI, many prominent businesspeople and politicians often wear both private and public “hats” moving between the private and public sectors, so that there is a blurring of roles along with potential significant conflicts of interest. Although an influx of entrepreneurs from Asia is having a positive effect by increasing competition, it has resulted in

Appendix 7 52
increased societal tensions as well as Government accusations of business tax and regulation avoidance.
(v) Undeveloped financial markets. The institutional foundation of financial
markets in the RMI is very underdeveloped. Property rights in land are uncertain because of communal ownership and because movable property rights, the basis for pledging assets as collateral against lending, are very weak. The result is that lending for business support is made only to those who have substantial assets. Other important financial market issues include possible regulatory concerns with the largest commercial bank on the island and the poor state of the development bank.
(vi) Limited business-to-government consultation. Consultant's discussions with
both the Government and private sector in the RMI revealed disturbing differences in understanding, agreement, and the goals and obligations of the Government and private sector in a market economy. In the longer term, this situation will harm economic development. The report1 recommends strongly that the parties involved devise a forum for regular consultation to promote the development of a common vision for private sector development, and ultimately the growth and prosperity of the RMI.
(vii) Private sector development in the outer islands. Since most private sector
activity occurs in the larger population centers, the summary assessment focuses on issues that exist there. Yet the conclusions apply equally, if not more strongly, to the outer islands. High-cost, poor, or nonexistent infrastructure in an already isolated environment has a disproportionately large impact. Unreliable transport facilities have a devastating effect on initiatives to increase trade, not only with the outside world, but also within the islands themselves. Tourism cannot grow if air service does not exist. Factors that inhibit private sector development in the main centers have an even larger impact in isolated communities.
C. Priority Issues
1. Role of the State in the Economy 19. In the RMI, the state plays a pervasive role in the economy. Despite a program to downsize public sector employment, including closure of the Ministry of Public Works, the state continues to employ a substantial proportion of the workforce. Public sector wages are higher than those in the private sector and are unrelated to productivity. Many private sector operators complain that the Government drives up wages and salaries to the point where it is difficult to find workers at competitive wages. The RMI has the second highest level of development assistance in the Pacific region, which already has the highest level of aid per capita in the world. The major source of aid is payments under the US Compact. Aid amounts to the equivalent of about 35% of GDP. It is striking that the very high levels of aid have not resulted in any growth in the economy over the past 15 years. Part of the explanation lies in the incentives of Compact transfers toward creating a bloated public sector that crowds out private sector activity.
1 Holden, Paul. Republic of the Marshall Islands Private Sector Assessment. Promoting Growth Through Reform.
Consultant's report for TA 6037-REG: Private Sector Development Strategy for the Pacific. 2002. ADB. Manila.
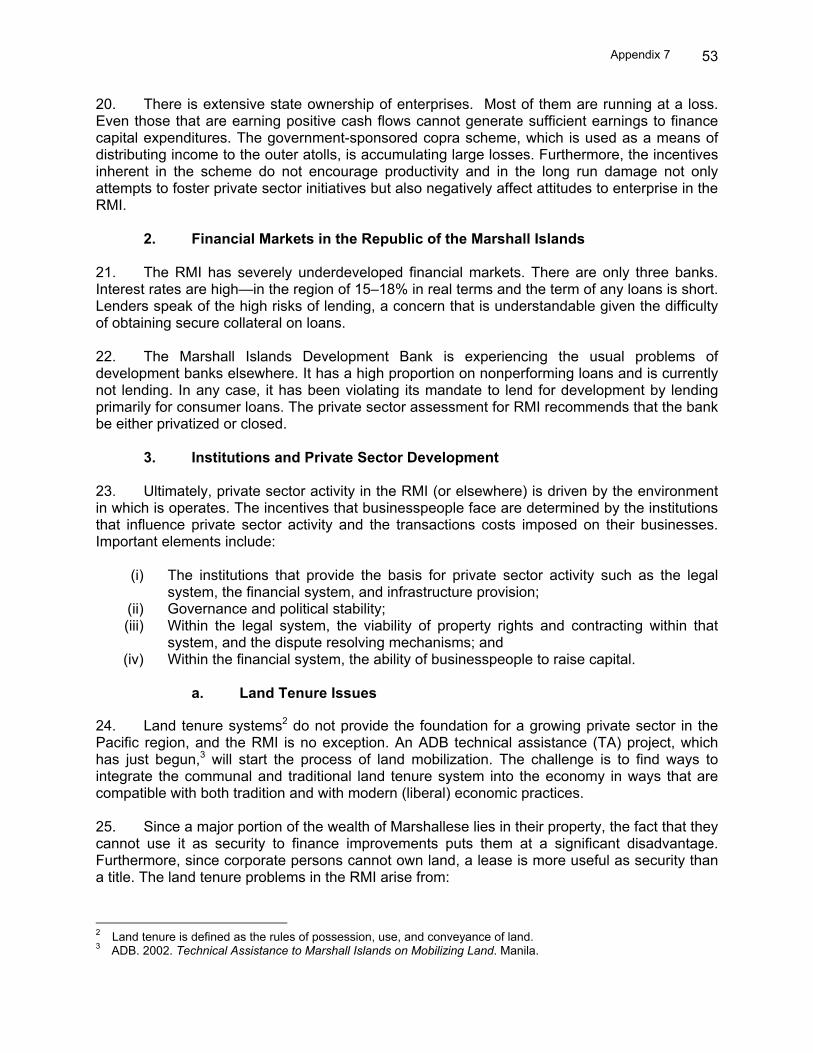
Appendix 7 53
20. There is extensive state ownership of enterprises. Most of them are running at a loss. Even those that are earning positive cash flows cannot generate sufficient earnings to finance capital expenditures. The government-sponsored copra scheme, which is used as a means of distributing income to the outer atolls, is accumulating large losses. Furthermore, the incentives inherent in the scheme do not encourage productivity and in the long run damage not only attempts to foster private sector initiatives but also negatively affect attitudes to enterprise in the RMI.
2. Financial Markets in the Republic of the Marshall Islands 21. The RMI has severely underdeveloped financial markets. There are only three banks. Interest rates are high—in the region of 15–18% in real terms and the term of any loans is short. Lenders speak of the high risks of lending, a concern that is understandable given the difficulty of obtaining secure collateral on loans. 22. The Marshall Islands Development Bank is experiencing the usual problems of development banks elsewhere. It has a high proportion on nonperforming loans and is currently not lending. In any case, it has been violating its mandate to lend for development by lending primarily for consumer loans. The private sector assessment for RMI recommends that the bank be either privatized or closed.
3. Institutions and Private Sector Development 23. Ultimately, private sector activity in the RMI (or elsewhere) is driven by the environment in which is operates. The incentives that businesspeople face are determined by the institutions that influence private sector activity and the transactions costs imposed on their businesses. Important elements include:
(i) The institutions that provide the basis for private sector activity such as the legal system, the financial system, and infrastructure provision;
(ii) Governance and political stability; (iii) Within the legal system, the viability of property rights and contracting within that
system, and the dispute resolving mechanisms; and (iv) Within the financial system, the ability of businesspeople to raise capital.
a. Land Tenure Issues
24. Land tenure systems2 do not provide the foundation for a growing private sector in the Pacific region, and the RMI is no exception. An ADB technical assistance (TA) project, which has just begun,3 will start the process of land mobilization. The challenge is to find ways to integrate the communal and traditional land tenure system into the economy in ways that are compatible with both tradition and with modern (liberal) economic practices. 25. Since a major portion of the wealth of Marshallese lies in their property, the fact that they cannot use it as security to finance improvements puts them at a significant disadvantage. Furthermore, since corporate persons cannot own land, a lease is more useful as security than a title. The land tenure problems in the RMI arise from:
2 Land tenure is defined as the rules of possession, use, and conveyance of land. 3 ADB. 2002. Technical Assistance to Marshall Islands on Mobilizing Land. Manila.

Appendix 7 54
(i) Unclear ownership and boundaries largely because of lack of recording; (ii) Restrictions on the transferability of land (mandated because of unclear ownership); (iii) Unclear definition of the different land tenure rights; (iv) Weak (and unrecorded) dispute resolution practices; and (v) Problems of enforcement.
26. If the ongoing ADB TA to strengthen land rights succeeds in addressing some of these issues, it will have made a promising start in the mobilization of land in the RMI.
b. Secured Lending and Movable Property Rights
27. The RMI also has no effective framework for secured lending against movable property. There is no way of registering a security interest in movable property, let alone ensuring that there are no prior claims on the assets being offered as security—there are no registries, even for automobiles. Finally, repossession in the event of default takes months or even years. While banks do take some assets as security, they place little store by it and require a large multiple of the value of the loan. In essence, the secured transactions framework is deficient. 28. The legal framework for secured lending needs to be clarified and updated. The new system must mesh closely with a customary system of land rights yet permit more land to serve as collateral. This arrangement requires a diagnostic study and the preparation of a draft law to focus discussion of the issues. Developing a consensus is a necessary part of the process but it will take time. It needs to start now.
c. Commercial Codes
29. The commercial laws underlying private sector transactions in the RMI are outdated and unsuited to modern business practices. Many of them date from the 1960s and 1970s and are based on US commercial codes from the 1950s. A particular problem is that there is no bankruptcy code. There is a provision by which companies can elect to close themselves down, but there is no law through which creditors can apply to the court for liquidation and sale of assets of companies that are unable to pay their debts. 30. A further problem is the haphazard codification of laws governing business transactions. It is extremely difficult to obtain information on the laws that have actually been passed and combing parliamentary minutes to obtain information, as difficult as it is, is frequently the only way to obtain information on rules that apply to particular commercial transactions. Similarly, obtaining information on precedent from legal rulings is difficult and costly, which contributes to the high costs of doing business in the RMI.
4. Foreign Investment Issues
31. Companies report difficulties and delays in obtaining permits for foreign workers. Like other Pacific islands, RMI is critically short of skills of all types—one of the reasons for the region’s low productivity. Yet, it is difficult to obtain work permits for foreigners possessing such skills. This policy has a counterproductive effect: it drives down overall productivity levels, thereby keeping salaries low, which in turn encourages emigration of skilled Marshallese. Although the RMI has improved the laws governing foreign investment, there are still substantial administrative delays.

Appendix 7 55
D. External Assistance 32. The primary source of external assistance is payments under the Compact of Free Association with the United States. The first Compact ran from 1986 to 2001. The next Compact contains provisions for paying approximately $30 million per year for 20 years to the government, plus additional payments for the lease of the missile base on Kwajalein as well as further compensation payments for the 4 northern atolls affected by the nuclear testing in the 1950s. All told, the payments will total some $1.1 billion. ADB has provided some $71 million in lending over the past 14 years and envisages further program and project loans of $8.5 million in the next 3 years. In addition, ADB has so far financed 37 TA projects totaling over $15 million. A further one or two TAs in each future year are also envisaged. 33. With the exception of some Compact funds that are earmarked for private sector development (PSD), and ADB TA to improve the policy and institutional environment for PSD, external assistance is not provided for the private sector. E. Asian Development Bank Strategy 34. The ADB country strategy for RMI has three key components:
(i) Strengthening public sector governance and enhancing public sector productivity; (ii) Improving access to basic social services; and (iii) Enhancing the environment for private sector investment, job creation, and growth.
35. In addition to financing the private sector assessment for the RMI under regional TA, in support of private sector development, ADB has financed extensive reviews of macro- and microeconomic policy; tourism and fisheries sector policy; institutional development; public sector, in particular SOE, reform; labor skills development; tax and tariff review; and land mobilization. The further means to developing the private sector will be a particular feature of ADB’s program in 2004, and could also appear under future programs or other lending. F. Performance Monitoring 36. Medium- and long-term sector impact and performance can be monitored through indicators gauging the ratio of private sector credit to GDP, the extent to which the governance of SOEs and government departments is consolidated under a single managing body, the progress on identifying land ownership, the extent to which commercial laws are codified and modernized, and the progress on introducing a modern secured transactions framework.

Appendix 7 56
Table A6.5: Private Sector Development Plan Item
Indicators
Current
(2002) 10 Years
1. Thematic Outcomes/Impact
• Consistent positive growth in per capita GDP Negative +3.0% • Higher bank credit to business 5% 25% • Lower interest rates 15–18% 10% • Long-term mortgages None 1,000 • Higher rates of investment < 5% of GDP 10% of GDP • Positive foreign direct investment Negative + $20 million p.a.
2. Thematic Outputs
• Business-government consultation established None Established/ improved
• Formation of a body to manage SOEs, number of competitive management contracts established, and number of privatizations
None Established/ improved
• Commercial code strengthened Weak Improved • Secure property rights in land established None Established • Secured transactions framework established/reformed None Established
3. Thematic Issues/Constraints
• Dominant role of the state in the economy • Very poor communication between Government and the private sector • Limited understanding of the role of the private sector in the economy on the part of
government officials, including misperception on the part of the Government that the private sector consists of the few larger businesses in the country
• Unreliable and costly infrastructure and communications • Extremely underdeveloped financial sector does not provide financing for business and
investment • Poor commercial law does not provide a sound basis for contracting • Weak property rights for movable property and for land • Risk that elections and political instability will weaken commitment to private sector
development GDP = gross domestic product, p.a. = per annum, SOE = state-owned enterprise.