Embed Size (px)
Citation preview
Anchor themes
For the rest of 2014, focus will be on data prices, competition, M&A, 4G rollout...and slightly less on regulations.
Nomura vs consensus
Stocks have moved up this year, but earnings haven't. P/E of 19-20x is expensive. So we are cautious. We prefer select large-cap telcos with earnings, dividend and valuation support.
Research analysts
Asia Telecoms
Sachin Gupta, CFA - NSL [email protected] +65 6433 6968
Daisaku Masuno, CFA - NSC
[email protected] +81 3 6703 1180
Leping Huang, PhD - NIHK
[email protected] +852 2252 1598
Neeraja Natarajan - NSL
[email protected] +65 6433 6961
Eric Cha - NFIK
[email protected] +82 2 3783 2337
Pankaj Suri - NSL
[email protected] +65 6433 6965
Gopakumar Pullaikodi - NSFSPL
[email protected] +91 22 4053 3733
Shweta Dixit - NSFSPL
[email protected] +91 22 672 35457
David Hao - NIHK [email protected]
+852 2252 2153
Asia telecoms
EQUITY: TELECOMS
1H14 report card
More splendour than reasoning
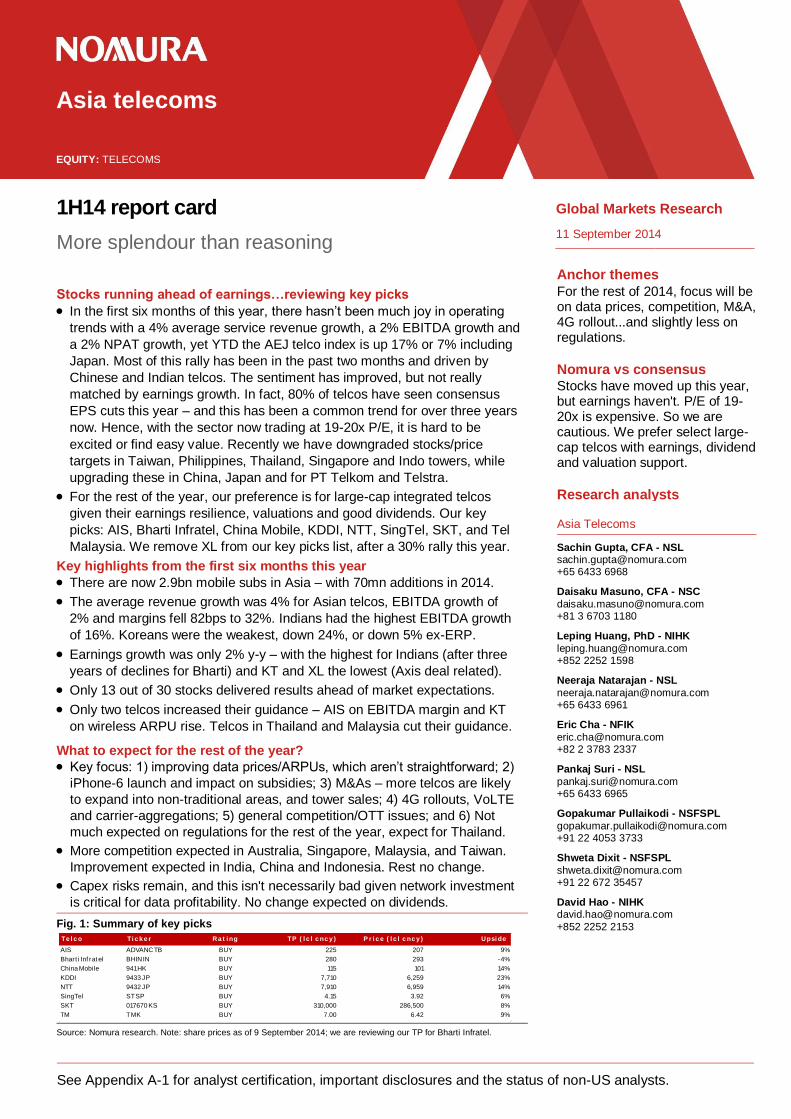
Stocks running ahead of earnings…reviewing key picks
In the first six months of this year, there hasn’t been much joy in operating
trends with a 4% average service revenue growth, a 2% EBITDA growth and
a 2% NPAT growth, yet YTD the AEJ telco index is up 17% or 7% including
Japan. Most of this rally has been in the past two months and driven by
Chinese and Indian telcos. The sentiment has improved, but not really
matched by earnings growth. In fact, 80% of telcos have seen consensus
EPS cuts this year – and this has been a common trend for over three years
now. Hence, with the sector now trading at 19-20x P/E, it is hard to be
excited or find easy value. Recently we have downgraded stocks/price
targets in Taiwan, Philippines, Thailand, Singapore and Indo towers, while
upgrading these in China, Japan and for PT Telkom and Telstra.
For the rest of the year, our preference is for large-cap integrated telcos
given their earnings resilience, valuations and good dividends. Our key
picks: AIS, Bharti Infratel, China Mobile, KDDI, NTT, SingTel, SKT, and Tel
Malaysia. We remove XL from our key picks list, after a 30% rally this year.
Key highlights from the first six months this year
There are now 2.9bn mobile subs in Asia – with 70mn additions in 2014.
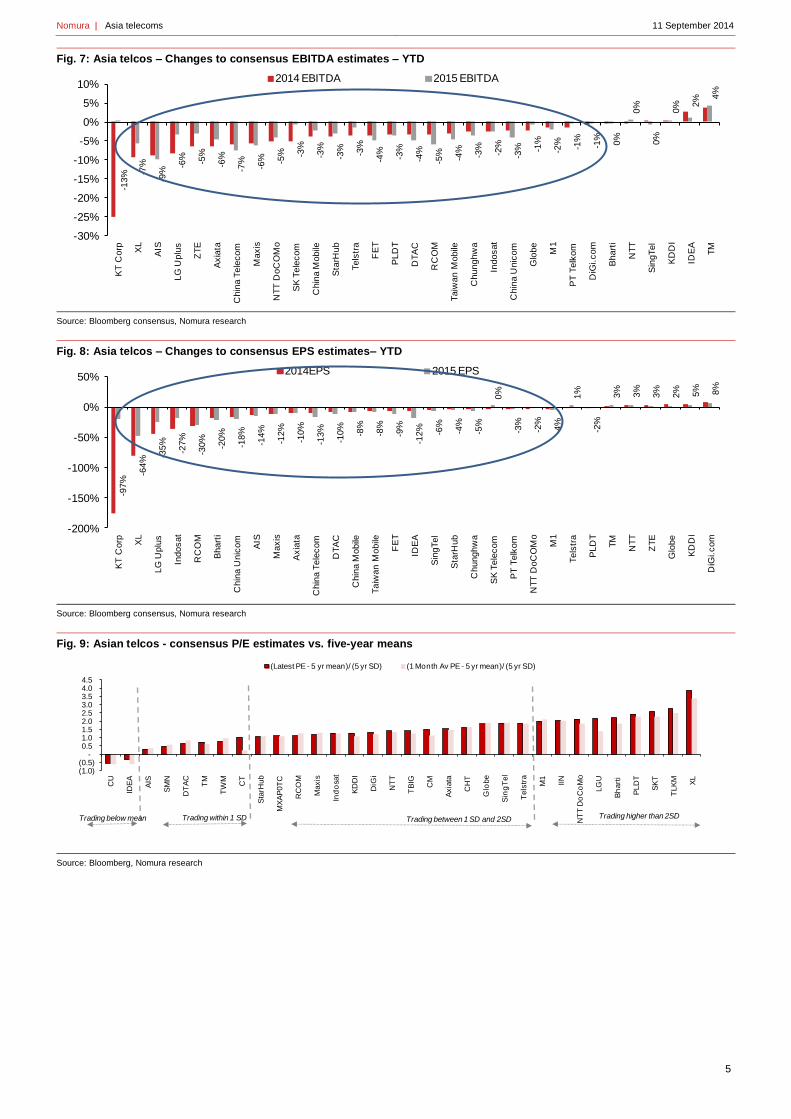
The average revenue growth was 4% for Asian telcos, EBITDA growth of
2% and margins fell 82bps to 32%. Indians had the highest EBITDA growth
of 16%. Koreans were the weakest, down 24%, or down 5% ex-ERP.
Earnings growth was only 2% y-y – with the highest for Indians (after three
years of declines for Bharti) and KT and XL the lowest (Axis deal related).
Only 13 out of 30 stocks delivered results ahead of market expectations.
Only two telcos increased their guidance – AIS on EBITDA margin and KT
on wireless ARPU rise. Telcos in Thailand and Malaysia cut their guidance.
What to expect for the rest of the year?
Key focus: 1) improving data prices/ARPUs, which aren’t straightforward; 2)
iPhone-6 launch and impact on subsidies; 3) M&As – more telcos are likely
to expand into non-traditional areas, and tower sales; 4) 4G rollouts, VoLTE
and carrier-aggregations; 5) general competition/OTT issues; and 6) Not
much expected on regulations for the rest of the year, expect for Thailand.
More competition expected in Australia, Singapore, Malaysia, and Taiwan.
Improvement expected in India, China and Indonesia. Rest no change.
Capex risks remain, and this isn't necessarily bad given network investment
is critical for data profitability. No change expected on dividends.
Fig. 1: Summary of key picks
Source: Nomura research. Note: share prices as of 9 September 2014; we are reviewing our TP for Bharti Infratel.
Te l c o Ti c k e r Ra t i ng TP ( l c l c nc y ) P r i c e ( l c l c nc y ) Upsi de
AIS ADVANC TB BUY 225 207 9%
Bhart i Inf rat el BHIN IN BUY 280 293 -4%
China Mobile 941 HK BUY 115 101 14%
KDDI 9433 JP BUY 7,710 6,259 23%
NTT 9432 JP BUY 7,910 6,959 14%
SingTel ST SP BUY 4.15 3.92 6%
SKT 017670 KS BUY 310,000 286,500 8%
TM T MK BUY 7.00 6.42 9%
Global Markets Research
11 September 2014
See Appendix A-1 for analyst certification, important disclosures and the status of non-US analysts.

Nomura | Asia telecoms 11 September 2014
2
Contents
Our sector view – relatively cautious ...................................................... 3
Recent key changes to our views after results .............................................. 6
First-half 2014 report-card .................................................................... 10
Topical issues with Asian telcos ........................................................... 17
Improving prices and ARPUs – Korea leading the charge ........................... 17
M&As – more to come? .............................................................................. 18
Towers – kicking off regionally… ................................................................ 20
Competition risks – risks in Singapore, Taiwan and Malaysia ..................... 21
Regulations – keep an eye on Thailand and Singapore .............................. 22
1H14 marketwise detailed trends .......................................................... 24
Australia – wireless focus ........................................................................... 24
China – much more action expected .......................................................... 24
India – better operational trends ................................................................. 26
Japan – iPhones and NTT’s FTTH wholesaling in focus ............................. 28
Indonesia ................................................................................................... 28
Malaysia – wireless slow, fixed is strong ..................................................... 31
The Philippines – concerns remain ............................................................. 33
Singapore – rising risks .............................................................................. 35
South Korea – irrational marketing coming to an end? ................................ 36
Taiwan – good 1H trends as expected, 4G competition in 2H ..................... 37
Thailand – Regulations/weak macro play spoilsport in 1H14 ....................... 38
Asian telcos’ June 2014 results – in detail ............................................ 40
Total revenue trends .................................................................................. 40
Service revenue trends .............................................................................. 42
EBITDA trends ........................................................................................... 43
ARPU and subscriber trends ...................................................................... 45
Earnings trends .......................................................................................... 46
Appendix A-1 ........................................................................................ 47

Nomura | Asia telecoms 11 September 2014
3
Our sector view – relatively cautious • In the first six months of this year, there hasn’t been much joy in the operating trends
with a 4% average service revenue growth, a 2% EBITDA growth and a 2% NPAT
growth, yet the AEJ telco index was up 17% ex-Japan or 7%, including Japan YTD.
– Most of this rally has been in the past two months and largely driven by Chinese and
Indian telcos. The sentiment has improved, but not really matched by earnings
growth. In fact, 80% of telcos have seen consensus EPS estimate cuts this year –
and this has been a common trend for over three years now. So with the sector now
trading at 19-20x P/E, it is hard to be excited or find easy value, in our view.
• For the rest of the year, our preference is for large-cap integrated telcos given their
earnings resilience, better valuations and good dividends/ prospects. Our key picks are:
AIS, Bharti Infratel, China Mobile, KDDI, NTT, SingTel, SKT, and Tel Malaysia. We
remove XL from our key picks list, after a 30% rally this year.
Fig. 2: Reviewing our key picks
Source: Nomura research
Fig. 3: Our thoughts on each market and key drivers
Source: Nomura research
Market Key themes for 2014 CompetitionData
economics
Regulatory
riskCapex risks
Dividend
outlook
Consensus
EPS revision
trends
M&A Key stock
AustraliaWireless competition, data
monetisation & NBNHigher
No change, but
yield focusMedium Flat TLS up Flat Unlikely Telstra
China4G rollout (TD/FDD), low er
subsidies, capex, tow er set-upLow er Better Low Up No change Flat to up Unlikely China Mobile
IndiaSpectrum auctions, pricing trends,
3G take-up, R-Jio
Improving (R-Jio
is a risk)No change Medium Up No change Flat to up Likely
Bharti, Bharti
Infratel
IndonesiaCompetition, consolidation, data
grow th, tow er saleImproving
Likely to
improveMedium Flat
Specials from
Telkom Flat
Likely in CDMA,
tow ersXL
JapanData grow th, cash return,
overseas expansion No change No change Low Dow n No change Flat Likely KDDI, NTT
MalaysiaData economics, LTE rollout,
HSBB trendsHigher No change Low Up No change Flat to dow n Unlikely TM, Axiata
PhilippinesData adoption, netw ork upgrades,
voice/ SMS cannabalisation Mixed
Challenges
from subsidiesLow Up No change Flat to dow n
Likely (Digital
services / media)PLDT
Singapore Data repricing, w ireless
competition, broadband pressure Higher Better Higher Flat M1 specials Flat to dow n
Likely (SingTel
Digital Life)SingTel
South KoreaARPU focus, handset dist'b bill,
marketing intensity, regulationsImproving No change Moderate Flat KT no dividend Up Unlikely SKT
Thailand3G handset uptake, capex and
competition, auctionsMixed Better High Up No change Flat to dow n Unlikely
AIS
DTAC
Taiwan 4G launch and promotions,
voice/data competition, bundlingHigher
Challenging
w ith promotionsModerate Up
Earnings
decline a riskDow n Unlikely CHT

Nomura | Asia telecoms 11 September 2014
4
Fig. 4: Summary of key picks
Source: Nomura research. Note: share prices as of 9 September 2014; we are reviewing our TP for Bharti Infratel.
Fig. 5: YTD absolute share price performances
Source: Bloomberg, Nomura research
Fig. 6: Asia telcos – Changes to consensus revenue estimates – YTD
Source: Bloomberg consensus, Nomura research
Telco Ticker RatingTP (lcl
cncy)
Price (lcl
cncy)Upside
AIS ADVANC TB BUY 225 207 9%
Bharti Infratel BHIN IN BUY 280 293 -4%
China Mobile 941 HK BUY 115 101 14%
KDDI 9433 JP BUY 7710 6,259 23%
NTT 9432 JP BUY 7910 6,959 14%
SingTel ST SP BUY 4.15 3.92 6%
SKT 017670 KS BUY 310000 286,500 8%
TM T MK BUY 7.0 6.4 9%
-20%
-10%
0%
10%
20%
30%
40%
50%
60%
RC
OM
Maxis
FE
T
TW
M
Sta
rHub
KD
DI
Ind
osa
t
Ch
un
ghw
a
Axia
ta
AIS
Idea
DT
AC
Sin
gT
el
MX
AP
0T
C
NT
T D
oC
oM
o
Tels
tra
LG
U+
M1
KT
TM
Glo
be
DiG
i
ZT
E
Ch
ina U
nic
om
Sm
arT
on
e
NT
T
Bh
art
i
SK
Tel
Ch
ina M
obile
PLD
T
XL
TLK
M
Ch
ina T
el
Tru
e
-8%
-8% -7
% -6%
-4%
-5%
-5%
-4%
-4%
-3%
-3% -2
%
-2%
-2%
-2% -1
%
-1%
-1%
-1%
0% 1%
0%
-1%
2% 2%
1%
2% 3%
4% 5%
-10%
-8%
-6%
-4%
-2%
0%
2%
4%
6%
Max
is
M1
DT
AC
Chin
a U
nic
om
LG
Uplu
s
RC
OM
Sta
rHub
AIS
Chin
a T
ele
com
Tels
tra
Taiw
an M
obile
NT
T D
oC
OM
o
Axia
ta
Sin
gTel
ISA
T
Ch
ina
Mo
bile
Bh
art
i
FE
T
KT
Co
rp
SK
Tele
com
PT
Te
lko
m
DiG
i.com
Ch
un
gh
wa
XL
TM
PL
DT
IDE
A
NT
T
KD
DI
Glo
be
2014 Sales 2015 Sales
Nomura | Asia telecoms 11 September 2014
5
Fig. 7: Asia telcos – Changes to consensus EBITDA estimates – YTD
Source: Bloomberg consensus, Nomura research
Fig. 8: Asia telcos – Changes to consensus EPS estimates– YTD
Source: Bloomberg consensus, Nomura research
Fig. 9: Asian telcos - consensus P/E estimates vs. five-year means
Source: Bloomberg, Nomura research
-13
% -7%
-9%
-6% -5%
-6%
-7%
-6% -5
% -3%
-3%
-3%
-3%
-4%
-3%
-4%
-5%
-4%
-3%
-2%
-3% -1
%
-2%
-1%
-1%
0%
0%
0%
0% 2
% 4%
-30%
-25%
-20%
-15%
-10%
-5%
0%
5%
10%
KT
Co
rp XL
AIS
LG
Up
lus
ZT
E
Axia
ta
Ch
ina
Te
leco
m
Ma
xis
NT
T D
oC
OM
o
SK
Te
leco
m
Ch
ina M
obile
Sta
rHu
b
Te
lstr
a
FE
T
PL
DT
DT
AC
RC
OM
Ta
iwa
n M
ob
ile
Ch
un
gh
wa
Ind
os
at
Ch
ina
Un
ico
m
Glo
be
M1
PT T
elk
om
DiG
i.c
om
Bh
art
i
NT
T
Sin
gTe
l
KD
DI
IDE
A
TM
2014 EBITDA 2015 EBITDA
-97%
-64
%
-35
%
-27
%
-30
%
-20
%
-18
%
-14%
-12
%
-10
%
-13%
-10%
-8%
-8%
-9%
-12
% -6%
-4%
-5%
0%
-3%
-2%
-4%
1%
-2%
3%
3%
3%
2% 5% 8%
-200%
-150%
-100%
-50%
0%
50%
KT
Co
rp XL
LG
Up
lus
Ind
os
at
RC
OM
Bh
art
i
Ch
ina
Un
ico
m
AIS
Ma
xis
Axia
ta
Ch
ina
Te
lec
om
DT
AC
Ch
ina
Mo
bile
Ta
iwa
n M
ob
ile
FE
T
IDE
A
Sin
gTe
l
Sta
rHu
b
Ch
un
gh
wa
SK
Te
leco
m
PT
Te
lko
m
NT
T D
oC
OM
o
M1
Te
lstr
a
PL
DT
TM
NT
T
ZT
E
Glo
be
KD
DI
DiG
i.co
m
2014EPS 2015 EPS
(1.0)(0.5)
-0.5 1.0 1.5 2.0 2.5 3.0 3.5 4.0 4.5
CU
IDE
A
AIS
SM
N
DT
AC
TM
TW
M
CT
Sta
rHub
MX
AP
0T
C
RC
OM
Maxis
Ind
osa
t
KD
DI
DiG
i
NT
T
TB
IG
CM
Axia
ta
CH
T
Glo
be
Sin
gT
el
Tels
tra
M1
IIN
NT
T D
oC
oM
o
LG
U
Bh
art
i
PLD
T
SK
T
TLK
M XL
(Latest PE - 5 yr mean)/ (5 yr SD) (1 Month Av PE - 5 yr mean)/ (5 yr SD)
Trading within 1 SD Trading between 1 SD and 2SD Trading higher than 2SDTrading below mean

Nomura | Asia telecoms 11 September 2014
6
Recent key changes to our views after results
• Australia – We increased Telstra’s earnings estimates and target price to
AUD5.90 given the operational momentum (Telstra - Impressive).
• China - We have increased our target prices for Chinese telcos given easing
concerns around marketing and subsidies. CM (Buy) is our preferred pick as we think
that it is about to enter a major turning point, in reversing its declining profit and ARPU
trends. (China Mobile - Raise TP by 28% to HKD115, reiterate Buy)
• Indonesia – We increased Telkom’s target price to IDR2.7k post good results.
• Philippines – We downgraded both Philippines telcos to Reduce following the
recent share price runs. These stocks are trading at 18-20x P/E with some operational
risks ahead. (The Philippines telecoms - Lock in the gains)
• Singapore – We downgraded M1 to Neutral given the recent stock performance and
lack of incremental positive surprises. (M1 -Downgrade to Neutral)
• Japan – We have increased price targets for Japanese telcos given market P/E
multiple increase and strong cash return to shareholders. We expect higher dividends
from 16/3 for NTT DoCoMo and upgraded the rating to Buy.
• Taiwan – We turned more cautious on Taiwanese telcos and downgraded FET to
Reduce and TWM to Neutral. (Downgrade FET and Taiwan Mobile)
• Thailand – We cut our target prices for Thai telcos due to auction delays and the
macro slowdown seen in 1H. But, we remain positive over the longer-term still.
(Thailand telecoms - Hold your nerve)
• Towers – We downgraded TBIG to Neutral given the recent share price strength. We
had upgraded TP for Bharti Infratel to INR280 on expectations of higher tenancies
(from R-Jio and recent cancellation of 3G-ICR bans). (Reaffirm Buy with a TP upgrade to INR280). We are again reviewing our price target.

Nomura | Asia telecoms 11 September 2014
7
Fig. 10: Recent changes to our views / stock basket after results
Source: Nomura research
Market Company Change Ticker Rating TP Currency
Thailand AIS ADVANC TB Buy 225 ↓ THB
DTAC DTAC TB Buy 120 ↓ THB
Philiipines PLDT TEL PM Reduce ↓ 3,000 PHP
Globe GLO PM Reduce ↓ 1,700 ↑ PHP
Singapore M1Post a strong run, further positive catalyts for
upside surprises could be limitedM1 SP Neutral ↓ 3.9 SGD
Taiwan CHT 2412 TT Neutral 91 ↓ TWD
FET 4904 TT Reduce ↓ 55 ↓ TWD
TWM 3045 TT Neutral ↓ 89 ↓ TWD
China China Mobile
We think CM is about to enter a major turning
point, in reversing its declining profit and
ARPU trends
941 HK Buy 115 ↑ HKD
Australia Telstra
Strong operational momentum for TLS should
continue; Growing NAS revenue –
domestically and within Asia a focus
TLS AU Buy 5.9 ↑ AUD
Japan NTT
Buy on NTT in view of structural reforms at its
telecom business in Japan and shareholder
returns
9432 JP Buy 7,910 ↑ JPY
NTT Docomo
With earnings likely to recover from 16/3, we
think management will 1) start to hike DPS for
the first time in three years from 16/3 as well
as 2) do substantial share buybacks.
9437 JP Buy ↑ 2,080 ↑ JPY
KDDI
Increasingly undervalued; au Wallet e-money
service, entry into Myanmar and expansion
of overseas data centers could add ¥20bn in
total to operating profits in 17/3.
9433 JP Buy 7,710 ↑ JPY
India BHINExpecting higher tenancies and sound
cashflowsBHIN IN Buy 280 ↑ INR
TLKMSingle digit EPS growth and good share price
performanceTLKM IJ Neutral 2,700 ↑ IDR
TBIGLack of new catalysts coupled with storng
price performanceTBIG IJ Neutral ↓ 8,300 ↑ IDR
More cautious on Philippines following strong
share price performance and
margin/cannibalisation risks
ARPU concern as 4G competition picked up -
incumbent telcos reacting more aggressively
than expected; Hon Hai's launch could see
further price cuts
More cautious in the near-term on regulatory
noise
Indonesia

Nomura | Asia telecoms 11 September 2014
8
Fig. 11: Asia telcos – Valuation comps
Source: Bloomberg, company data, Nomura estimates. Pricing as on 9 September 2014
Fig. 12: MSCI Asia sector indices: YTD performance
Source: Bloomberg, Nomura research
Fig. 13: MSCI Asia ex-Japan sector indices: YTD
performance
Source: Bloomberg, Nomura research
Bloomberg Local Mkt Cap
ticker price (US$ mn) 14E 15E 14E 15E 14E 15E 14E 15E 14E 15E 14E 15E 14E 15E 14E 15E
Wireless
AIS ADVANC TB Buy THB 207 19,173 17.0 16.9 9.7 9.4 5.9% 5.9% 1.7% 2.5% -1% 3% 1% 4% -1% 1% 0.5 0.8
Axiata AXIATA MK Buy MYR 6.94 18,380 21.5 19.9 8.9 8.3 3.7% 4.5% -1.1% 4.3% 6% 6% 2% 7% 0% 8% 1.3 1.2
Bharti Airtel BHARTI IN Buy INR 406 25,445 29.5 23.0 7.3 6.6 0.8% 1.3% 5.3% 7.3% 10% 9% 11% 10% 31% 28% 2.5 2.0
CM 941 HK Buy HK$ 101 262,288 13.8 13.3 4.8 4.4 3.1% 3.3% 0.9% 3.9% 1% 6% 3% 11% -4% 4% -1.5 -1.4
DiGi Digi MK Neutral MYR 5.85 14,264 22.9 22.6 14.3 13.8 4.4% 4.4% 3.5% 4.2% 5% 5% 5% 4% 17% 2% 0.2 0.2
FET 4904 TT Reduce NT$ 60.20 6,547 17.7 18.3 8.5 8.5 5.6% 5.5% 4.9% 5.3% 2% 3% 0% 1% -6% -3% 0.8 0.9
Globe GLO PM Reduce PHP 1,911 5,777 18.4 17.8 8.3 7.7 4.3% 4.7% 0.2% 2.0% 8% 8% 4% 7% 18% 3% 1.9 1.9
IDEA IDEA IN Neutral INR 175 9,526 25.5 23.0 8.2 7.3 0.4% 0.7% 3.7% 4.6% 13% 13% 15% 11% 13% 11% 1.9 1.5
Maxis Maxis MK Reduce MYR 6.49 15,264 22.5 21.9 12.1 11.8 6.2% 6.2% 5.2% 5.3% 4% 2% 2% 3% 1% 3% 1.5 1.6
MobileOne M1 SP Neutral S$ 3.70 2,662 19.6 18.2 10.7 10.0 4.1% 4.1% 3.9% 5.8% 8% 5% 7% 6% 8% 8% 0.7 0.5
XL EXCL IJ Buy IDR 6,750 4,880 nm nm 8.5 7.4 0.2% 0.4% -14.5% 1.4% 12% 9% 0% 14% -84% 114% 2.9 2.5
RCOM RCOM IN Neutral INR 114 3,878 24.4 18.9 8.4 8.0 0.6% 0.8% n/a n/a 3% 5% 2% 6% 37% 29% 5.0 4.4
SKT 017670 KS Buy KRW 286,500 22,393 10.9 9.0 5.9 5.3 3.3% 3.3% 7.1% 8.9% 5% 4% 0% 12% 14% 20% 1.0 0.7
TWM 3045 TT Neutral NT$ 91 8,171 21.3 21.6 9.3 9.2 5.4% 5.3% 4.5% 4.6% 3% 4% 0% 2% -6% -2% 1.5 1.6
DTAC DTAC TB Buy THB 103 7,561 19.9 19.6 8.4 8.0 4.5% 4.6% 4.7% 3.1% -5% 2% 7% 5% 9% 1% 0.7 0.8
Average 19.7 18.5 8.6 8.1 3.5% 3.7% 2.2% 4.6% 4.7% 5.4% 3.4% 6.7% 9.1% 8.6% 1.1 1.0
Median 19.9 18.9 8.5 8.0 3.9% 4.2% 3.7% 4.6% 4.5% 4.6% 2.1% 6.3% 6.8% 6.1% 1.1 1.0
Integrated
CT 728 HK Neutral HK$ 5.17 53,985 20.0 19.7 4.7 4.3 1.7% 1.8% 3.0% -1.3% 0% 5% -2% 11% -5% 1% 1.0 0.9
CU 762 HK Buy HK$ 13.90 42,261 21.5 19.6 4.4 4.2 1.8% 1.9% -3.5% 2.7% 6% 4% 4% 5% 21% 10% 1.4 1.2
CHT 2412 TT Neutral NT$ 92.30 23,899 19.8 20.7 9.2 9.3 4.5% 4.3% 4.7% 4.8% 0% 1% -4% -1% -9% -4% -0.2 -0.2
KDDI 9433 JP Buy JPY 6,259 49,215 12.2 10.6 4.8 4.3 2.6% 3.0% 4.3% 6.3% 7% 4% 8% 8% 17% 15% 0.5 0.4
KT Corp 030200 KS Neutral KRW 35,750 9,036 n/m 10.0 6.4 4.2 2.2% 2.2% -2.8% 16.9% 0% 0% -24% 52% n/m 10% 3.0 1.7
LG Uplus 032640 KS Buy KRW 12,100 6,030 19.6 12.3 5.2 4.6 2.1% 2.5% -4.7% 8.2% 1% 2% 7% 13% -4% 60% 2.2 1.9
NTT 9432 JP Buy JPY 6,959 69,832 13.6 11.4 4.3 4.1 2.6% 2.7% 6.5% 8.0% 3% 14% 1% 2% 3% 14% 1.3 1.2
PLDT TEL PM Reduce PHP 3,404 16,793 18.7 18.4 10.3 10.2 5.4% 5.4% 5.3% 5.4% 3% 3% 1% 1% 2% 2% 0.9 0.9
Indosat ISAT IJ Neutral IDR 4,060 1,875 25.2 21.3 5.7 6.7 2.0% 2.1% 0.8% 1.2% 6% 6% 5% 6% -21% 18% 1.9 1.8
TLKM TLKM IJ Neutral IDR 2,820 24,156 18.7 17.4 6.4 5.9 3.7% 4.0% 5.9% 7.2% 9% 8% 9% 7% 5% 8% 0.0 -0.1
SingTel ST SP Buy S$ 3.90 49,361 17.0 16.0 9.0 8.6 4.4% 4.6% 3.9% 5.8% 0% 2% 1% 5% 1% 6% 1.0 0.9
StarHub STH SP Neutral S$ 4.12 5,605 18.8 19.1 10.1 10.1 4.9% 4.9% 4.6% 4.6% 2% 2% 1% 0% 1% -1% 0.6 0.6
TM T MK Buy MYR 6.42 7,200 27.3 30.7 7.3 7.3 3.3% 3.0% 1.8% 1.2% 7% 7% 6% 2% -22% -11% 1.2 1.3
Telstra TLS AU Buy A$ 5.68 65,567 17.0 16.1 7.4 7.4 5.2% 5.4% 7.0% 5.6% 2% 1% 2% 0% 6% 4% 1.1 1.0
Average 19.0 17.1 6.8 6.5 3.1% 3.2% 2.5% 5.1% 4.9% 4.2% 2.9% 7.9% -0.4% #### 1.3 1.1
Median 18.8 17.4 6.4 6.2 2.6% 3.0% 3.9% 5.4% 2.7% 3.4% 2.4% 5.2% 1.5% 7.6% 1.1 1.0
EV/EBITDA (x) Div Yield (%) FCF Yield (%) Revenue growth EBITDA growth Net Debt/EBITDARating Cncy
NI GrowthPE (x)
-4%
-2%
0%
2%
4%
6%
8%
10%
12%
Co
ns
um
er
Dis
cre
tio
na
ry
Ma
teria
ls
Fin
an
cia
ls
Ind
us
tria
ls
MS
CI
As
ia
Co
nsu
me
r S
taple
s
Uti
litie
s
Te
lco
Se
rvic
es
Info
Te
ch
En
erg
y
He
alth
Ca
re
0%
5%
10%
15%
20%
25%
Co
ns
um
er
Dis
cre
tio
na
ry
Ma
teri
als
Indu
str
ials
Co
ns
um
er
Sta
ple
s
MS
CI A
sia
ex J
apa
n
Fin
ancia
ls
En
erg
y
Info
Tech
Utilit
ies
Te
lco
Serv
ice
s
He
alt
h C
are

Nomura | Asia telecoms 11 September 2014
9
Fig. 14: Asia telecom services vs. indices: YTD performance
Source: Bloomberg, Nomura research
Fig. 15: AEJ telecom services vs. indices: YTD performance
Source: Bloomberg, Nomura research
-5%
0%
5%
10%
15%
20%
25%
30%
35%
TO
PIX
KL
CI
KO
SP
I
AS
51
HS
CE
I
FS
ST
I
MX
AP
0T
C
HS
I
TW
SE
JC
I
SE
T
Pcom
p
SE
NS
EX
-5%
0%
5%
10%
15%
20%
25%
30%
35%
TO
PIX
KL
CI
KO
SP
I
AS
51
HS
CE
I
FS
STI
HS
I
TW
SE
MX
AP
JTC
JC
I
SE
T
Pc
om
p
SE
NS
EX

Nomura | Asia telecoms 11 September 2014
10
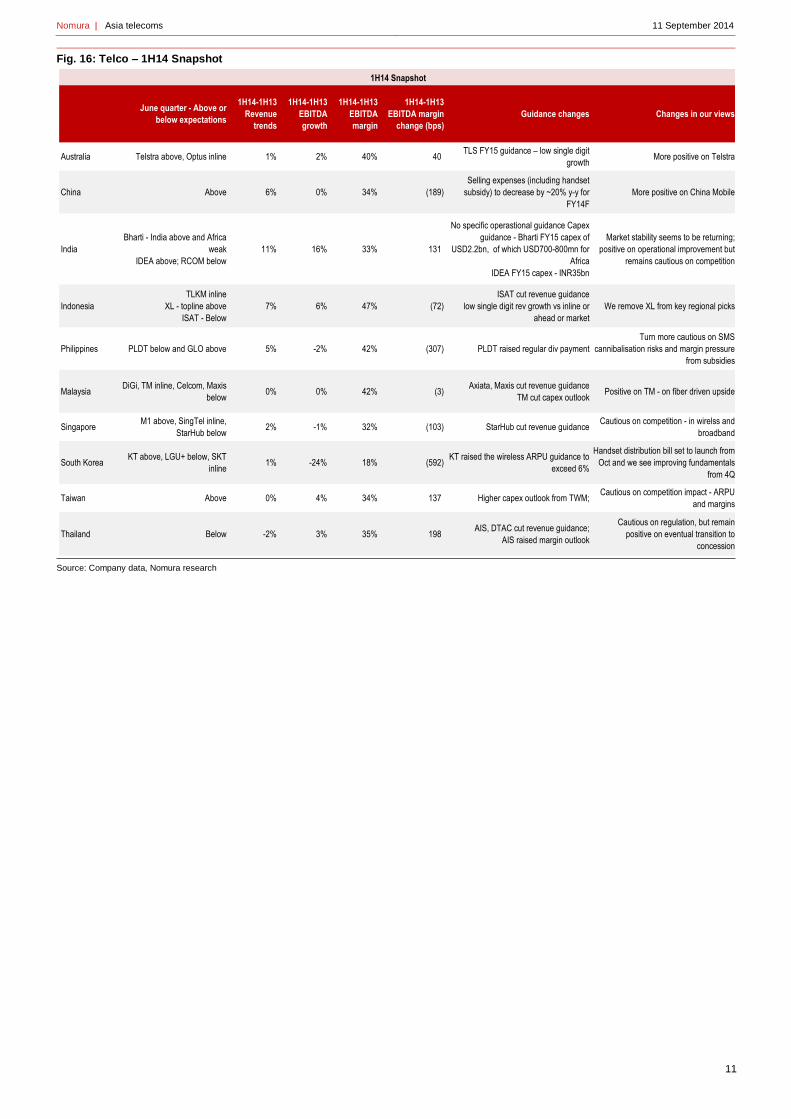
First-half 2014 report-card • For 1H14, the average service revenue growth was 4% for Asian telcos, EBITDA
growth of 2% and margins fell by 82bps to 32%.
– CU, CT, XL and IDEA led with +10% service revenue growth.
– Indian telcos had the highest EBITDA growth of 16% on an average.
– South Koreans were the weakest (driven by ERP expenses), down 24%, or down 5%
excluding ERP.
– Thai telcos reported around 200bps EBITDA margin improvement, Indians and the
Taiwanese had 130-140bps increase. Margins fell for Korean, Chinese and
Philippines telcos.
• Earnings growth was only 2% y-y – with the highest for Indians (after three-four years
of declines for Bharti) and KT and XL the lowest (Axis deal-related).
• Only 13 out of 30 stocks delivered results ahead of expectations.
• Around 80% of telcos had negative consensus EPS revisions.
– Biggest negative consensus revisions were seen for KT Corp, XL, LGU and ISAT,
while DiGi, TM, GLO, KDDI and NTT had positive earnings revisions YTD.
• Only two telcos increased their guidance – AIS on EBITDA margin and KT on
wireless ARPU increase.
• The following cut their revenue guidance – Thailand telcos (due to slow macro),
Malaysia telcos (competition, mature market), Indosat (because of weak 1H and
network issues) and StarHub (competition in broadband), while TM and TWM revised
their capex outlook.
• No material changes to the dividend policy either.
• There are now 2.9bn mobile subscribers in Asia – with 70mn additions in 2014.
– Korea still leads with 59% of subscribers for 4G.
Nomura | Asia telecoms 11 September 2014
11
Fig. 16: Telco – 1H14 Snapshot
Source: Company data, Nomura research
June quarter - Above or
below expectations
1H14-1H13
Revenue
trends
1H14-1H13
EBITDA
growth
1H14-1H13
EBITDA
margin
1H14-1H13
EBITDA margin
change (bps)
Guidance changes Changes in our views
Australia Telstra above, Optus inline 1% 2% 40% 40 TLS FY15 guidance – low single digit
growthMore positive on Telstra
China Above 6% 0% 34% (189)
Selling expenses (including handset
subsidy) to decrease by ~20% y-y for
FY14F
More positive on China Mobile
India
Bharti - India above and Africa
weak
IDEA above; RCOM below
11% 16% 33% 131
No specific operastional guidance Capex
guidance - Bharti FY15 capex of
USD2.2bn, of which USD700-800mn for
Africa
IDEA FY15 capex - INR35bn
Market stability seems to be returning;
positive on operational improvement but
remains cautious on competition
Indonesia
TLKM inline
XL - topline above
ISAT - Below
7% 6% 47% (72)
ISAT cut revenue guidance
low single digit rev growth vs inline or
ahead or market
We remove XL from key regional picks
Philippines PLDT below and GLO above 5% -2% 42% (307) PLDT raised regular div payment
Turn more cautious on SMS
cannibalisation risks and margin pressure
from subsidies
MalaysiaDiGi, TM inline, Celcom, Maxis
below0% 0% 42% (3)
Axiata, Maxis cut revenue guidance
TM cut capex outlookPositive on TM - on fiber driven upside
SingaporeM1 above, SingTel inline,
StarHub below2% -1% 32% (103) StarHub cut revenue guidance
Cautious on competition - in wirelss and
broadband
South KoreaKT above, LGU+ below, SKT
inline1% -24% 18% (592)
KT raised the wireless ARPU guidance to
exceed 6%
Handset distribution bill set to launch from
Oct and we see improving fundamentals
from 4Q
Taiwan Above 0% 4% 34% 137 Higher capex outlook from TWM; Cautious on competition impact - ARPU
and margins
Thailand Below -2% 3% 35% 198 AIS, DTAC cut revenue guidance;
AIS raised margin outlook
Cautious on regulation, but remain
positive on eventual transition to
concession
1H14 Snapshot

Nomura | Asia telecoms 11 September 2014
12
Fig. 17: Asia telcos - June 2014 results vs. our/consensus expectations
Source: Company data, Bloomberg, Nomura research
TelcoAbove/Below
estimatesComments Guidance/Outlook
AIS Below Good 3G uptake and margins, however, slowing revenue in 1H
Revised down service revenue ex-IC growth guidance to 1-2% y-y
Revised up 3G-2.1GHz subscriber target to 85% of total subs
Revised down 3G device penetration to 45% using 3G devices
EBITDA margin: service margin to improve 300bps y-y (maintained).
Consolidated margin to increase 100bps y-y; Maintained THB40bn capex
100% dividend payout target maintained
DTAC Below Good 3G uptake and margins, however, slowing revenue in 1H
Cut service revenues ex IC - to be flat
EBITDA margins guidance of 35-37% maintained
Capex – minimum of THB13bn maintained
Bharti Above Healthy performance in domestic mobile
IDEA Above Strong operational trends FY15 capex of INR35bn (excluding spectrum related payments)
RCOM Below Lagged peers on trends. Focus on deleveraging FY15F capex of INR15-20bn
Axiata InlineXL-Axis' integration ahead of expectations
Strong performance at associates, Robi and Smart; weak Celcom
Cut revenue -- Mid-single-digit revenue growth
Capex at MYR4.4bn
DiGi Inline Strong operational trends
4% - 6% revenue growth
EBITDA margins to sustain at the 2013 levels
Capex of MYR900mn, which includes 86% population coverage on 3G and 1.5k LTE sites.
Maxis Below Slowing revenues with transformation
Cut service revenue to be slightly lower than 2013
EBITDA margins to be similar to FY13 level (50%)
Capex: MYR1.1bn; 1H14 capex was MYR273mn
TMRevenue above
EBITDA BelowGood HSBB/fiber upselling
Revenue growth of 5.0-5.5%.
5% EBIT growth, excluding HSBB-2.
2016F outlook: 6% revenue growth and 8% EBIT growth.
Cut capex -- expected to be around 20% of sales
TLKMInline but still a
commendable result
Performance and execution have improved
Strong data growth, good sub trends and network advantage continue to
expand
Revenues - in line or above market both at the group level and Telkomsel.
Margins - flat to down.
Capex to be 20-25% of sales for Telkom (60% of this is for Telkomsel).
XL
Revenue/EBITDA
above
Axis' integration underway with margin improvement expected; Below
EBITDA line adjustments for interest, FX and hedging will vary, which
may lead to different interpretations on the underlying NPAT.
Low-teens revenue
Mid-30s margin
IDR7tn of capex
ISAT Below
Revenue growth below peers - growth in Java regions where network
modernisation hasn’t been able to compensate for the decline outside
Java
Cut revenue outlook - low single digit revenue growth vs inline or ahead or market
FETRevenue below
EBITDA/NPAT aboveGood 4G takeup and decent cost controls in 1H
Total revenue growth of 2.8%; EBITDA growth of 1.5% with 30bp decline in EBITDA margin ; 7%
decline in NPAT ; Capex of TWD13bn
For 3Q14, it expects NPAT of TWD2.7bn
TWMRevenue below
EBITDA/NPAT aboveGood 4G take up, continuing turnaround for momo
For 3Q14F, TWM expects 5% y-y revenue growth
EBITDA to decline by 2% y-y on higher 4G opex, and EPS to decline 19% y-y
For 2014F, raised capex of TWD15.4bn
CHTRevenue below
EBITDA/NPAT aboveMobile decent, fixed weak FY14 :flat revenue and 3-10% decline in EBITDA and NPAT. Capex will be lilely cut by 5-10%
SingTel
Revenue/EBITDA
above
NPAT below
Not much excitement - Singapore decent; Australia losing share still;
associates good
FY15 guidance is for stable group revenue, EBITDA and FCF.
Capex of SGD2.3bn and this excludes SGD900mn for Optus 700MHz spectrum payment.
Dividend payout maintained at 60-75% range for FY15 vs. 74% in FY14
StarHub BelowSlow revenue growth continues with a decline in broadband and flat
wireless
Cut 2014F service revenue -- now expected to be flat vs. low single-digit growth earlier.
~32% EBITDA margin on service revenue; cash capex at 13% of sales
S20c DPS for FY14F maintained.
M1 AboveContinuing benefits from data repricing; postpaid good but prepaid was
weak; decent fiber trends
Moderate growth in NPAT.
Capex to be around SGD130mn
PLDT Below SMS decline not offset by mobile data. EBITDA decline is a concern
Regular dividend payout was raised to 75% of core net income vs. 70% (has paid 100% in div for the
past seven years)
Core net income of PHP39.5bn or 2% y-y growth; capex of PHP31-32bn
Globe AboveGood revenue growth, while EBITDA is relatively slow. Core NI
benefitting from low D&A; postpaid was weak with high churn
For 2014, revenue is expected to be up mid-to-high single digit – driven by sub growth, additional
network capacity and robust economic outlook.
EBITDA margins of high-30s to low-40s – it expects SACs to moderate somewhat. The IT
transformation costs will be around PHP1bn this year.
Accelerated depreciation of PHP1.5bn and capex of USD600-650mn.
SKTInline
NPAT below
High SAC appeared to have pushed up marketing expenses despite
MNP suspensions; NPAT lower than expected due to SK Hynix one-offs
6% revenue growth for FY14F.
OP/EBITDA flat for NP double digit growth due to Hynix contribution
Year-end dividend likely to remain at KRW8,400
KT corp Above
OP loss which was widely expected owing to ERP. Wireless ARPU trend
continued to show up-beat trend. Mgmt mentioned dividend unlikely for
this year
Flat revenue for FY14F.
Negative OP expected for FY14F due to ERP related expense.
Dividend not likely for FY14F.
LGU+ Below1) High marketing cost due to extreme competition; and 2) handset
vendor related one-off expense led to earnings miss.
+5% service revenue growth for FY14F
1H14 EBITDA showed disappointing trend (2.1% vs. our estimate of 5.7% y-y growth in 1H14) but
trend likely to improve in 2H14F, owing to benign competition in 3Q14 (vs. our expectations) and
handset distribution bill from Oct
China Telecom Inline with our forecast
Despite CT reporting outperforming revenue and profit growth in 1H14
driven by an unexpected 4% y-y ARPU uplift, we also see growth is
actually stemming from its structurally declining voice business, and its
supposedly high-growth data revenue is largely lagging that of CM and
CU
Lower selling & subsidies expenses in 2014 by CNY7bn or 2% of revenues
2014 capex 80.3bn
FY15F capex of ~CNY90bn, with the majority to be used for LTE and cloud.
Fixed-line capex will decline and expects LTE capex to peak in 2015.
China Unicom Broadly in lineCU is well positioned to benefit from the regulatory changes including
sales and marketing expense cut, towerco, and SOE reform
Expects a decline in selling & handset expenses in 2H
2014 CAPEX CNY80bn, don't expect major uplift in 2015.
2014 4G capex budget is CNY11bn. Plans to deploy 100k BTS by end-2014.
To cover 200 cities by FD-LTE and 300 cities by TD-LTE by end-2014.
3G/4G BTS: 491k BTS by June 2014 and more than 500k by end-2014
China Mobile Above
Slowing ARPU decline a positive
4G migration in 2H14 should further accelerate data revenue growth;
Network rollout faster than expected
CNY20bn reduction in selling & subsidy expenses, with further reduction in 2015/16
2014 capex of CNY225bn; capex will remain at high for 4G and may drop in 2016.
500k+ TD-LTE BTS on 4G this year

Nomura | Asia telecoms 11 September 2014
13
Fig. 18: Total revenue growth - marketwise
Source: Company data, Nomura research
Fig. 19: EBITDA growth - marketwise
Source: Company data, Nomura research. Axis capped at +/-15%
Fig. 20: EBITDA margins change in 1H
Source: Company data, Nomura research
Fig. 21: 1H14 EBITDA margins – Asian telcos
Source: Company data, Nomura research
Fig. 22: Total revenue trends – 1H13 to 1H14
Source: Company data, Nomura research
-4%
-2%
0%
2%
4%
6%
8%
10%
12%
Th
ailand
Mala
ysia
Taiw
an
So
uth
Ko
rea
Austr
alia
Sin
gapore
Jap
an
Ph
ilip
pin
es
Ch
ina
Ind
onesi
a
Ind
ia
1H14-1H13 total revenue growth
Average growth
-15%
-10%
-5%
0%
5%
10%
15%
So
uth
Ko
rea
Ph
ilip
pin
es
Jap
an
Sin
gapore
Mala
ysia
Ch
ina
Austr
alia
Th
ailand
Taiw
an
Ind
onesi
a
Ind
ia
1H14-1H13 EBITDA growth
Average growth
(700)
(600)
(500)
(400)
(300)
(200)
(100)
-
100
200
300
So
uth
Ko
rea
Ph
ilip
pin
es
Ch
ina
Jap
an
Sin
gapore
Ind
onesi
a
Mala
ysia
Austr
alia
Ind
ia
Taiw
an
Th
ailand
1H14-1H13 EBITDA margin change (bps)
Average margin change
0%
5%
10%
15%
20%
25%
30%
35%
40%
45%
50%
So
uth
K
ore
a
Jap
an
Sin
gapore
Ind
ia
Taiw
an
Ch
ina
Th
ailand
Austr
alia
Ph
ilip
pin
es
Mala
ysia
Ind
onesi
a
1H14 EBITDA margin Average margin
-15%
-10%
-5%
0%
5%
10%
15%
20%
Ma
xis
DT
AC
Op
tus
AIS
Ce
lco
m
Do
co
mo
Sta
rHu
b
M1
RC
OM
CH
T
LG
U+
VH
A
Ind
os
at
KT
FE
T
Te
lstr
a
TW
M
NTT
PL
DT
CU
SK
T
Sin
gT
el
DiG
i
TR
UE
CT
CM
Glo
be
TM
TL
KM
KD
DI
XL
Bh
art
i
IDE
A
Total revenue growth 1H14-1H13 Average growth

Nomura | Asia telecoms 11 September 2014
14
Fig. 23: Service revenue growth – 1H13 to 1H14
Source: Company data, Nomura research
Fig. 24: EBITDA margins in 1H14
Source: Company data, Nomura research
Fig. 25: EBITDA growth – 1H14
Source: Company data, Nomura research. For KT, EBITDA declined by 51% in 1H
Fig. 26: EBITDA margins
Source: Company data, Nomura research.
-10%
-5%
0%
5%
10%
15%
20%M
ax
is
NT
T
Do
co
mo
Op
tus
Ind
os
at
DT
AC
Ce
lco
m
Sta
rHub
AIS
PL
DT
CH
T
RC
OM KT
SK
T
FE
T
Sin
gTel
TW
M
DiG
i
M1
CM
Te
lstr
a
Glo
be
TR
UE
KD
DI
Bh
art
i
Telk
om
sel
LG
U+
CU
CT
XL
IDE
A
Mobile Service rev ex handset growth 1H14-1H13
Average growth
5%
10%
15%
20%
25%
30%
35%
40%
45%
50%
55%
KT
LG
U+
TR
UE
SK
T
KD
DI
NT
T
TW
M
Op
tus
CT
FE
T
Sin
gT
el
Sta
rHu
b
CU
IDE
A
TM
RC
OM
Bh
art
i
Do
co
mo
M1
CM
DT
AC XL
CH
T
Glo
be
Te
lstr
a
Ind
os
at
Ce
lco
m
AIS
PL
DT
DiG
i
Ma
xis
TL
KM
1H14 EBITDA margin Average margin
-20%
-10%
0%
10%
20%
30%
KT
Ma
xis
Do
co
mo
Ind
os
at
RC
OM
SK
TC
elc
om
CM
PL
DT
NT
TS
tarH
ub
Op
tus
Sin
gT
el
AIS
Glo
be
CT
LG
U+
XL
Te
lstr
aC
HT
TW
MTR
UE
M
1D
iGi
TM
KD
DI
DTA
CF
ET
TL
KM
CU
Bh
art
iID
EA
Total EBITDA growth 1H14-1H13
Average growth
5%
10%
15%
20%
25%
30%
35%
40%
45%
50%
55%
KT
LG
U+
TR
UE
S
KT
KD
DI
NTT
TW
MO
ptu
sC
TF
ET
Sin
gT
el
Sta
rHu
bC
UID
EA
TM
RC
OM
Bhart
iD
oc
om
oM
1C
MD
TA
C XL
CH
TG
lobe
Te
lstr
aIn
dosat
Ce
lco
mA
ISP
LD
TD
iGi
Ma
xis
TL
KM
1H14 EBITDA margin Average margin

Nomura | Asia telecoms 11 September 2014
15
Fig. 27: Asia telco – postpaid ARPU
Source: Company data, Nomura estimates
Fig. 28: Asia telcos – implied blended ARPU
Source: Company data, Nomura research
Units Mar-11 Jun-11 Sep-11 Dec-11 Mar-12 Jun-12 Sep-12 Dec-12 Mar-13 Jun-13 Sep-13 Dec-13 Mar-14 Jun-14
Telstra A$ 64.1 63.3 63.4 63.4 61.2 59.0 59.0 58.9 58.6 58.3 58.6 58.8 58.6 58.5
Optus A$ 68.0 66.0 67.0 66.0 62.0 60.0 59.0 58.0 54.0 54.0 54.0 54.0 52.0 53.0
SingTel S$ 87.0 87.0 85.0 86.0 82.0 80.0 80.0 81.0 78.0 79.0 79.0 78.0 75.0 76.0
StarHub S$ 72.0 73.0 74.0 76.0 69.0 71.0 69.0 70.0 68.0 72.0 70.0 69.0 66.0 68.0
M1 S$ 63.8 64.0 63.3 64.0 63.3 63.3 62.0 62.1 61.1 62.3 61.8 62.2 62.3 62.3
Celcom MYR 94.0 92.0 95.0 96.0 96.0 90.0 88.0 91.0 87.0 88.0 87.0 88.0 85.0 85.0
DiGi MYR 83.0 84.0 85.0 86.0 85.0 85.0 82.0 83.0 82.0 83.0 82.0 83.0 81.0 83.0
Maxis MYR 104.0 107.0 108.0 108.0 105.0 109.0 106.0 107.0 102.0 103.0 100.0 101.0 96.0 97.0
PT Telkom IDR k 168.7 157.5 171.1 166.0 165.3 161.9 163.3 167.6 167.1 166.8 167.3 169.6 159.4 169.2
PT Indosat IDR k 204.2 219.6 214.8 196.6 252.7 384.1 438.9 475.4 448.7 420.2 370.8 346.7 329.4 333.9
PT XL Axiata IDR k 183.0 195.0 187.0 182.0 156.0 152.0 148.0 145.0 127.0 133.0 136.0 136.0 136.0 126.0
FET NT$ 808 826 851 854 871 885 897 882 864 872 875 867 849 856
Taiwan Mobile NT$ 781 770 789 795 806 806 799 829 847 840 831 837
Globe Php 1,090 957 915 1,152 1,162 1,205 1,173 1,208 1,105 1,274 1,178 1,178 1,140 1,207
SK Telecom KRW 33,317 33,592 33,214 32,587 32,151 32,923 33,135 33,761 33,668 34,012 34,909 35,650 35,309 36,013
KT Corp KRW 30,247 30,178 29,609 28,826 28,722 29,447 29,970 30,697 31,117 31,615 31,332 32,160 32,902 33,619
LG U+ KRW 24,956 25,472 25,944 26,213 26,677 29,903 30,633 31,085 32,616 33,834 34,495 35,388 35,362 35,636
AIS THB 646 642 647 687 672 674 676 683 683 686 698 658 639 647
DTAC THB 557 555 568 580 581 592 589 592 611 605 589 591 600 596
True Corp THB 548 605 593 574 540 539 524 550 552 555 582 568 555 na
Units Mar-11 Jun-11 Sep-11 Dec-11 Mar-12 Jun-12 Sep-12 Dec-12 Mar-13 Jun-13 Sep-13 Dec-13 Mar-14 Jun-14
Telstra A$ 49 48 48 48 46 44 44 44 44 43 43 43 43 42
Optus A$ 47 45 47 46 43 43 43 43 40 40 41 41 40 41
CM RMB 67 72 71 75 65 69 69 72 63 66 66 68 62 64
CT RMB 50 54 52 54 52 54 53 56 54 54 55 55 55 57
CU RMB 45 48 48 47 48 49 49 46 48 49 49 47 48 47
SingTel S$ 53 53 52 53 51 51 50 51 50 50 50 50 49 49
StarHub S$ 45 46 46 46 43 44 44 45 44 45 44 44 42 44
M1 S$ 40 40 39 40 40 41 40 40 40 40 40 40 39 42
Celcom MYR 50 49 50 51 51 49 50 49 47 47 47 47 46 46
DiGi MYR 50 50 50 50 49 48 48 47 47 48 48 48 47 48
Maxis MYR 45 46 47 47 47 47 47 48 46 46 48 49 48 50
TLKM 000 IDR 35 36 38 37 35 35 36 36 34 36 37 37 35 36
ISAT 000 IDR 29 31 29 27 26 29 32 29 28 29 30 29 26 27
XL 000 IDR 32 32 32 32 30 30 31 32 28 28 28 27 27 25
Bharti INR 194 190 183 187 189 185 177 185 193 200 192 195 196 202
RCOM INR 107 103 101 100 99 98 102 119 128 119 120 125 128 136
IDEA INR 161 160 155 159 160 156 148 158 167 174 164 169 173 181
CHT NT$ 606 591 610 590 584 596 606 595 601 612 623 609 588 590
FET NT$ 693 707 730 727 737 746 755 741 724 731 735 729 714 718
TWM NT$ 707 715 734 718 734 733 739 733 725 749 762 750 737 731
PLDT Php 146 163 152 146 132 129 125 128 121 122 119 129 124 125
Globe Php 194 188 181 186 181 178 173 177 167 175 167 166 155 154
SK Telecom KRW 33,317 33,592 33,214 32,587 32,151 32,923 33,135 33,761 33,668 34,012 34,909 35,650 35,309 36,013
KT Corp KRW 30,247 30,178 29,609 28,826 28,722 29,447 29,970 30,697 31,117 31,615 31,332 32,160 32,902 33,619
LG U+ KRW 24,956 25,472 25,944 26,213 26,677 29,903 30,633 31,085 32,616 33,834 34,495 35,388 35,362 35,636
AIS THB 241 240 242 253 265 261 259 268 263 253 245 234 225 223
DTAC THB 212 208 212 214 211 211 211 211 210 214 211 210 208 203
True Corp THB 102 99 114 116 119 122 121 123 122 118 126 123 129 123

Nomura | Asia telecoms 11 September 2014
16
Fig. 29: Adjusted earnings growth – 1H14-1H13
Source: Company data, Nomura research; Y axis capped at +/-20%
Fig. 30: Reported earnings growth – 1H14-1H13
Source: Company data, Nomura research. Y axis capped at +/-20%
-20%
-15%
-10%
-5%
0%
5%
10%
15%
20%S
ou
th K
ore
a
Ind
on
es
ia
Th
aila
nd
Sin
ga
po
re
Ja
pa
n
Ch
ina
Ma
laysia
Au
str
alia
Ph
ilip
pin
es
Ta
iwa
n
India
1H14-1H13 adjusted NPAT growth
Average earnings growth
-20%
-15%
-10%
-5%
0%
5%
10%
15%
20%
Sou
th K
ore
a
Sin
ga
po
re
Ind
on
es
ia
Ja
pa
n
Ch
ina
Th
aila
nd
Mala
ysia
Ta
iwa
n
Au
str
alia
Ph
ilip
pin
es
India
1H14-1H13 reported NPAT growth
Average earnings growth

Nomura | Asia telecoms 11 September 2014
17
Topical issues with Asian telcos
Improving prices and ARPUs – Korea leading the charge
• Most telcos are focussing intensely on data price increases or similar adjustments (and
far less discussion on voice except for India). Prices have been adjusted to move away
from unlimited data in pretty much every market, including Taiwan recently (after
promotions).
• However, not many telcos have reported ARPU increases, though – some of this is
mathematical due to double-SIM phenomenon or data sharing plans impact. But in
many cases customers have stuck with their original price plans and are moving more
to WiFi.
• Going forward, though, there is still scope for ARPU increase, especially as data usage
continues to rise in most countries. Increasingly, too, there is more and more
discussion too on if/ how telcos can charge OTT players.
• In Singapore, SingTel recently adjusted its 4G plans (new and recontracts) to charge
SGD3 extra for 2GB, but this additional data allowance is over WiFi hotspots, which the
company is expecting to increase to over 1,000 by next year.
• In Korea, 59% of subscribers are on 4G, and this has also translated into decent ARPU
trends. Wireless ARPU growth continues to be relatively strong, given high LTE
penetration rate (1H14 ARPU up 6% vs. 1H13), driven by up-selling from unlimited LTE
voice/data tariff plans.
• In Taiwan, while there was a case for ARPU increases with the launch of 4G, we have
now turned more cautious given a pick-up in competition. With the recent launch of
services by Taiwan Star, all incumbents have extended promotions and this could
remain until we see a launch by Hon Hai.
• In China, 3G ARPUs continue to remain higher than blended ARPUs, however the
challenge for blended ARPU’s is more due to declines in voice which is still the largest
contributor to mobile service revenue.
– China Telecom has seen some blended ARPU improvements in 1H because of
unexpected growth in voice revenue, which would raise some concerns especially
when CT’s data revenue growth significantly lagged behind CM and CU.
– On the other hand, China Mobile’s blended ARPU decline was not as steep because
of faster-than-expected growth in mobile data revenue, which is a positive signal that
CM’s structural transition from 2G to 3G/4G is making solid progress.
• In India, revenue per minute (RPM) continue to firm up and are up by an average 8%
y-y in 1H. The concern is more on what R-JIO will do.
• In Malaysia, with Maxis looking to defend share, we don’t think there has been much in
terms of price increases. However, all telcos remain focused on pricing data right and
there are already usage caps for data in this market.
• In the Philippines, the focus is on stoking data take-up and not on re-pricing data as
such. However, telcos are trying to offer bundles in a way that overall ARPUs/customer
spend are maintained, if not improved.
• In Indonesia, XL and TSEL have both alluded to improving yields on data, especially
as competition has remained relatively stable in the past one-two quarters.

Nomura | Asia telecoms 11 September 2014
18
Fig. 31: Korea ARPU trend
Source: Company data, Nomura estimates
Fig. 32: Indian RPM trend
Source: Company data, Nomura research
Fig. 33: Singapore ARPU trends
Source: Company data, Nomura estimates
Fig. 34: China – ARPU comparison by telcos and user segment (1H14)
Source: Company data, Nomura estimates
M&As – more to come?
• There has already been a fair bit of M&As for Asian telcos this year – China Mobile
with TRUE and SingTel expanding its digital businesses, PLDT with Rocket Internet,
Tel Malaysia with P1, etc. Most of these investments don't look cheap to us and not
even easy to analyse given majority of these are loss-making businesses. However, we
can still expect a lot more M&As ahead, as: 1) organic growth is a struggle for telcos; 2)
regardless of capex risks, there is plenty of cash still – the financial capacity of around
USD50bn for Asian telcos, ex China-Mobile; and 3) business diversity is necessary for
convergence, to manage OTT risks, and for ROIC enhancement.
• A number of Asian telcos already have a foreign partner or large government/SWF
holdings, so M&As are more likely to be in the form of: 1) telcos buying minority
stakes; and 2) buying non-traditional businesses. For the latter, considerations such as
scale, cross-selling ability, finding a niche, control and management are very critical.
• Stocks to watch: Axiata (Buy, Axiata MK), China Mobile (Buy, 941 HK), PT Telkom
(Neutral, TLKM IJ), PLDT (Reduce, TEL PM), SingTel (Buy, ST SP), SKT (Buy, 017670
KS), Telstra (Buy, TLS AU), NTT (9432 JP, Buy) and KDDI (Buy, 9433 JP).
• Market wise, we expect in-market consolidation in India and Indonesia, and tower
deals too in these markets. Bharti is expected to offload more African towers, according
to the company.
22,000
24,000
26,000
28,000
30,000
32,000
34,000
36,000
38,000
40,000
1Q11
2Q11
3Q11
4Q11
1Q12
2Q12
3Q12
4Q12
1Q13
2Q13
3Q13
4Q13
1Q14
2Q14
3Q14
F
4Q14
F
SKT KT LGU+(KRW)
0.30
0.35
0.40
0.45
0.50
0.55
0.60
1Q11
2Q11
3Q11
4Q11
1Q12
2Q12
3Q12
4Q12
1Q13
2Q13
3Q13
4Q13
1Q14
2Q14
3Q14
4Q14
1Q15
Bharti RCOM Idea Vodafone(INR)
50
55
60
65
70
75
80
85
90
Mar '1
1
Jun
'11
Sep
'11
Dec '1
1
Mar '1
2
Jun
'12
Sep
'12
Dec '1
2
Mar '1
3
Jun
'13
Sep
'13
Dec '1
3
Mar '1
4
Jun
'14
StarHub M1 SingTelSGD

Nomura | Asia telecoms 11 September 2014
19
Fig. 35: Asian telecoms – Assessing financial capacity
Source: Company, Nomura estimates
37
9
170
26
(2)
164
43
14
204
28
161
28
166
30
190
-50
0
50
100
150
200
250
Fre
e c
ash
flow
Div
idends
Surp
lus c
ash
Excess d
ebt i
f ND
/ E
BIT
DA
= 1
.5x
To
tal c
ap
aci
ty
Fre
e c
ash
flow
Div
idends
Surp
lus c
ash
Excess d
ebt i
f ND
/ E
BIT
DA
= 1
.5x
To
tal c
ap
aci
ty
Fre
e c
ash
flow
Div
idends
Surp
lus c
ash
Excess d
ebt i
f ND
/ E
BIT
DA
= 1
.5x
To
tal c
ap
aci
ty
(USDbn)
2013 2014F 2015F

Nomura | Asia telecoms 11 September 2014
20
Towers – kicking off regionally…
• There is a lot more chatter and developments on tower companies. So far only
Indonesia and India have listed stand-alone tower companies, but other telcos in
China, Malaysia, etc, are looking to set up such companies.
• The big development in 1H was the announcements around Chinese towercos, which
will be responsible for construction, maintenance, and operation of telecom towers and
ancillary facilities, and maintenance of base station equipment. We expect towercos to
start building new towers by end-2014F; the injection of existing assets can be
expected in 2015F. We think a detailed execution plan will be announced soon.
• In India, RJIO’s entry has been a driver for tower sharing agreements in addition to 3G
rollouts.
• Bharti in Africa is in the process of divesting its towers and to date has divested 7k in
10 markets (raising close to USD1bn, we estimate). It could also be looking to divest
towers in Nigeria – this is largely in order to de-lever its balance sheet. Please see our
notes titled, Another USD500mn tower sale and Africa tower sale kicks off.
• Even in Indonesia, all three telcos are looking to divest their tower portfolio – but since
the Indosat -TBIG deal, there has been limited progress. XL has announced its
intention to divest a portion of its towers by the year-end in order to de-lever its balance
sheet.
• Axiata in Malaysia recently formed its regional tower company – E.co. At this stage, the
towers in Malaysia have been fully carved out into E.co and the focus is on improving
operational efficiencies here. In other markets like Sri Lanka and Bangladesh, progress
has been slow due to regulatory and tax considerations. Axiata also continues to look
for M&A opportunities in this space. Please see our note titled, AXIATA - Catching up
with the GCFO and Head of IR, for details.
Fig. 36: China’s telecom capex breakdown
Source: Company data, Nomura estimates
Nomura | Asia telecoms 11 September 2014
21
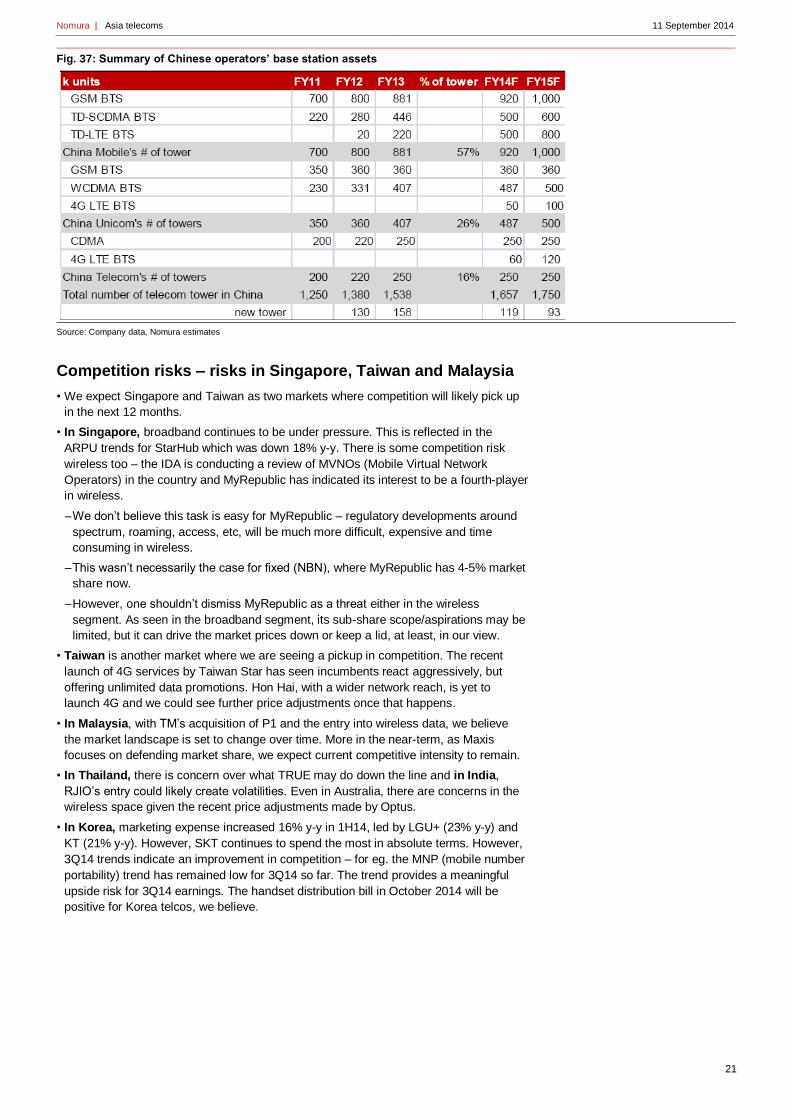
Fig. 37: Summary of Chinese operators’ base station assets
Source: Company data, Nomura estimates
Competition risks – risks in Singapore, Taiwan and Malaysia
• We expect Singapore and Taiwan as two markets where competition will likely pick up
in the next 12 months.
• In Singapore, broadband continues to be under pressure. This is reflected in the
ARPU trends for StarHub which was down 18% y-y. There is some competition risk
wireless too – the IDA is conducting a review of MVNOs (Mobile Virtual Network
Operators) in the country and MyRepublic has indicated its interest to be a fourth-player
in wireless.
– We don’t believe this task is easy for MyRepublic – regulatory developments around
spectrum, roaming, access, etc, will be much more difficult, expensive and time
consuming in wireless.
– This wasn’t necessarily the case for fixed (NBN), where MyRepublic has 4-5% market
share now.
– However, one shouldn’t dismiss MyRepublic as a threat either in the wireless
segment. As seen in the broadband segment, its sub-share scope/aspirations may be
limited, but it can drive the market prices down or keep a lid, at least, in our view.
• Taiwan is another market where we are seeing a pickup in competition. The recent
launch of 4G services by Taiwan Star has seen incumbents react aggressively, but
offering unlimited data promotions. Hon Hai, with a wider network reach, is yet to
launch 4G and we could see further price adjustments once that happens.
• In Malaysia, with TM’s acquisition of P1 and the entry into wireless data, we believe
the market landscape is set to change over time. More in the near-term, as Maxis
focuses on defending market share, we expect current competitive intensity to remain.
• In Thailand, there is concern over what TRUE may do down the line and in India,
RJIO’s entry could likely create volatilities. Even in Australia, there are concerns in the
wireless space given the recent price adjustments made by Optus.
• In Korea, marketing expense increased 16% y-y in 1H14, led by LGU+ (23% y-y) and
KT (21% y-y). However, SKT continues to spend the most in absolute terms. However,
3Q14 trends indicate an improvement in competition – for eg. the MNP (mobile number
portability) trend has remained low for 3Q14 so far. The trend provides a meaningful
upside risk for 3Q14 earnings. The handset distribution bill in October 2014 will be
positive for Korea telcos, we believe.

Nomura | Asia telecoms 11 September 2014
22
Regulations – keep an eye on Thailand and Singapore
• In Thailand, the delay in 4G auctions has once again raised regulatory concerns.
This auction was critical to gain visibility on the spectrum roadmap where the
concessions for AIS and TRUE over 1,800MHz have already ended and AIS’ 900MHz
license is set to expire in 2015. Also, with likely delays, there are other aspects such as
reserve prices that could be reviewed. More importantly, it seems restructuring the
SOEs (State Owned Enterprises) is now being made to be a priority, and is perhaps
even the cause for delay.
– Overall, we note regulatory uncertainty isn't entirely new to Thailand telcos (3G
auctions, too, saw many delays with stock price volatility before they were
successfully concluded in 2012). This time, too, we think the transition into the
licensing regime should occur.
• In India, recent newsflow suggests overhauling some old telecom regulations and
formation of a super-regulator (Source: Govt mulls 'super regulator' to replace TRAI,
TDSAT, Moneycontrol, 1 Sep 2014). Among regional telcos, Indian regulations remain
the most complex and confusing given different circle regimes and license and access
fees. Also, the sector needs more clarity/action on a lot of pending issues such as the
roadmap ahead for auctions, spectrum trading and sharing and M&A norms – the new
communications bill could address these issues. The change in the government this
year could see better regulatory clarity evolve, though these are early days, in our view.
• In Korea, Handset distribution bill is set to launch from October in Korea. The key
factor from the handset distribution bill is that the telcos now have to disclose the
subsidy level per handset. Korea telcos’ profitability was often hit by extreme subsidy
driven marketing cost, but with telcos bound by law to disclose subsidy level
beforehand, the likelihood of guerrilla-type subsidy marketing (which is the key driver of
marketing expense surges) is low and thus we see improving fundamentals from 4Q.
Key risks from this bill are: 1) competition moving on to price and 2) telcos coming up
with some other ‘creative’ means to provide extra subsidy.
• In Malaysia, clarity on HSBB phase 2 from the government/TM is awaited.
• In Japan, the Information and Communications Council will publish the draft report of
2020 basic ICT policy at the end of September or in early October. We think there is
likely to be further progress toward the lifting of restrictions on NTT Docomo and
approval of NTT’s FTTH wholesaling services. The subcommittee agreed to revise and
ensure the viability of guidelines to allow SIM unlocking. The focus of the debate is now
likely to shift to the timetable for the new guidelines.
• In Indonesia, consolidation remains a focus – the regulator was supportive of XL-Axis
deal, plus has made considerable progress for consolidation of Telkom’s and Indosat’s
CDMA businesses with GSM. This would imply additional 2.5 – 3 MHz of 800 Mhz
spectrum for both the companies, which is likely to be declared technology neutral too.
• Across the region, one topical area of regulatory debate is around charging OTT
providers. This was recently taken up in India (though the regulator did not change its
stance), and China as well. The Indonesian regulator is looking into it too, but not clear
how and when it would be done.

Nomura | Asia telecoms 11 September 2014
23
Fig. 38: Regulatory events to be mindful of
Source: Nomura research
Country Risks? Likely regulatory events
Australia Medium NBN structure and Telstra's (and others') involement
China Low Tower set-up details, VAT reform, FDD license issuance
India Medium Spectrum auctions roadmap; M&A regulations
Indonesia Medium Resale of 2100MHz spectrum returned by XL/ Axis, CDMA consolidation
Japan Low Allocation of 3.5GHz spectrum
Malaysia Low Update on business trust rules (DiGi); towerco rules (Axiata)
Phillipines Low Views on MVNOs
Singapore Higher MVNOs and wirless competition
South Korea Moderate Interconnection to be reset in 2H14F; handset distribution bill
Taiwan Moderate Spectrum, Pricing regulations
Thailand High Spectrum auctions; potential price-caps; SOE restructuring

Nomura | Asia telecoms 11 September 2014
24
1H14 marketwise detailed trends
Australia – wireless focus
Key highlights from 1H
• The focus was again on the wireless segment where Telstra continues to gain ground
with around 50% sub-share. Optus has adjusted prices recently (on shared-data plans)
and is looking to boost share. VHA has also made network investments, we
understand.
• Telstra seems more focussed on seeking Asian growth opportunities – especially in the
NAS segment. It recently signed a JV with Telkom Indonesia.
• No further major developments on NBN.
Comparative analysis
• On wireless revenue, Telstra had 4% growth y-y vs. a 3% decline for Optus – but the
Optus service revenue decline run-rate has improved in recent quarters.
• TLS is winning subscriber share, too. This year it has added 198k subs compared with
23k subscriber loss at Optus and 137k loss for VHA.
• TLS’ EBITDA margins, too, are held stable at around 42% compared with 30% for
Optus.
What to expect for the rest of the year?
• We expect some moderation in Telstra’s wireless share, but no significant deterioration
given its strong execution, extensive network reach and customer focus.
• Telstra’s fixed declines will see some offset from NBN payments and management
seems quite focussed on growing NAS revenue – domestically and within Asia.
• For Optus, there is still some work to be done to gain revenue/subscriber share – while
its cost equation has improved significantly.
– Optus has recently turned more aggressive, which should be good for revenue trends,
on shared data plans and also offering incentives for customers to move from other
operators’ networks on its own (via AUD200 credits on contract break-fees) and
around AUD250 for trade-ins on old smartphones.
Fig. 39: Optus vs. Telstra trends
Source: Company data, Nomura research
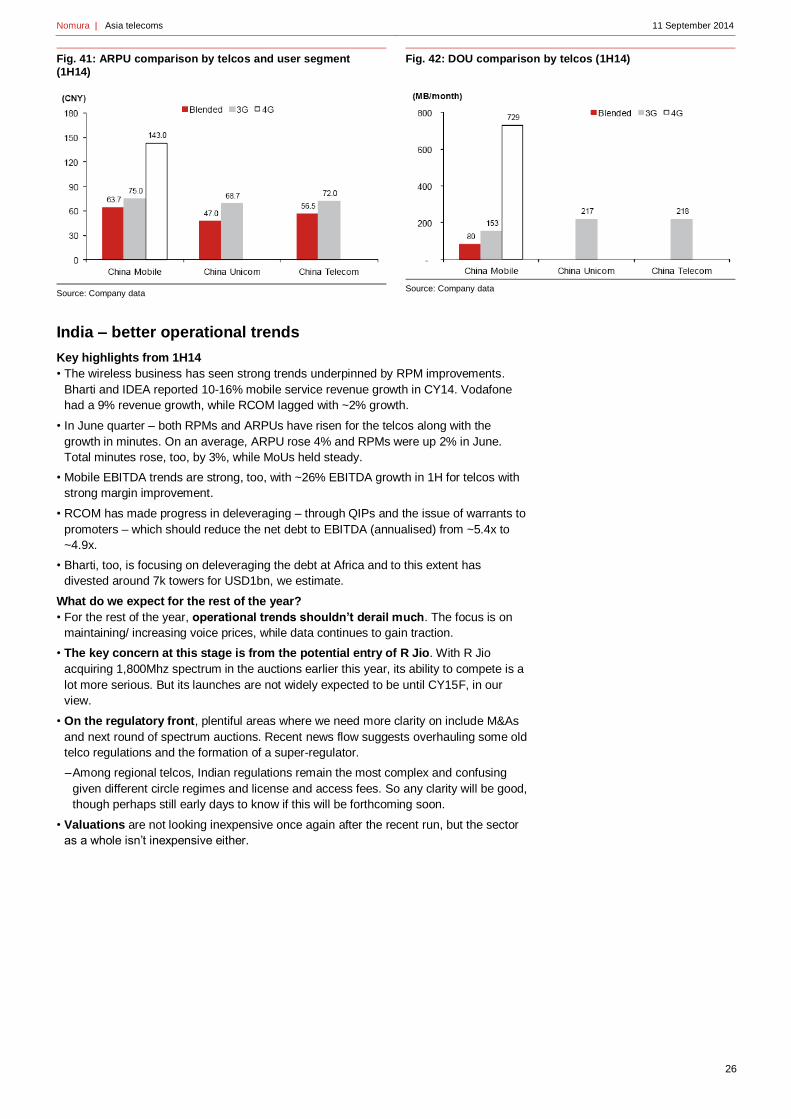
China – much more action expected
Key highlights from 1H14
• China Mobile: ARPU decline slowed down from 3.7% in 2H14 to 2.6% in 1H14 due to
the growth of data services (+52% y-y to 24% of service revenue). In addition, CM’s
network rollout is faster than expected, already reaching 410k units (500k target for
2014).
• China Unicom: 3G/4G mobile DOU increased 29% y-y to 217MB. The company will
make reductions in selling expenses at a similar magnitude as CM/CT by 15~20% y-y,
compared to last year’s selling expenses.
Jun-12 Dec-12 Jun-13 Dec-13 Jun-14
Revenue growth Telstra 1% -2% -4% 4% 8%
Optus -2% -5% -5% -5% -4%
Wireless revenues Telstra 6% 5% 7% 6% 4%
Optus -3% -6% -7% -6% -3%
Total margins Telstra 42% 40% 42% 41% 43%
Optus 27% 25% 30% 30% 30%
Sub adds Telstra 610 608 649 739 198
Optus 103 54 (33) (102) (23)

Nomura | Asia telecoms 11 September 2014
25
• China Telecom: CT’s outperforming revenue and profit growth were driven by an
unexpected 4% y-y ARPU uplift and voice data revenue, despite its total subscriber
declining by 5.3mn. However, its supposedly high-growth data revenue is lagging, in
our view.
Comparative analysis
• China Mobile: CM’s 4G subscribers are showing encouraging results, as each 4G user
generates 8x and 4x more data traffic than a 2G and 3G user, respectively. As the
timing for FD-LTE license issue remains uncertain, we think CM will continue to benefit
from its first-mover advantage in 4G services.
• China Unicom: relatively better positioned than CT to benefit from its 3G (WCDMA) to
4G (hybrid-LTE) network upgrade, due to: 1) lower capex; and 2) better subscriber net
add.
• China Telecom: Its data revenue growth lagged significantly CM and CU. We think CT
is still in an unfavourable competitive position with its peers due to: 1) its technology
disadvantages in 3G; and 2) the government’s slower-than-expected official issue of
FD-LTE license.
What to expect for the rest of the year?
• China Mobile: to build a 500k+ TD-LTE network by end-2014. We think CM is about to
enter a turning point. We expect CM’s 3G/4G subscriber net add growth to accelerate in
2H14F, which will lead to improvements in ARPU. We believe the impact of VAT reform will
begin to be felt in 2H14F, leading to downward pressure on revenue and earnings. The
impact of VAT reform should begin to be felt in 2H14F, leading to downward pressure on
revenue and earnings.
• China Unicom/China Telecom: to expand their TD/FD-LTE hybrid networks to 40 cities
each, under the trial FD-LTE license. We expect their 3G/4G subscriber net add to finally
pick up, after a weak 1H14F. The impact of VAT reform will begin to be felt in 2H14, leading
to downward pressure on revenue and earnings.
• CT targets 140k LTE BTS in 2014 and 280k BTS in 2015; CU targets 100k LTE BTS in
2014.
Fig. 40: Comparison of mobile data and mobile voice y-y growth by telcos (1H14)
Source: Company data
Nomura | Asia telecoms 11 September 2014
26
Fig. 41: ARPU comparison by telcos and user segment (1H14)
Source: Company data
Fig. 42: DOU comparison by telcos (1H14)
Source: Company data
India – better operational trends
Key highlights from 1H14
• The wireless business has seen strong trends underpinned by RPM improvements.
Bharti and IDEA reported 10-16% mobile service revenue growth in CY14. Vodafone
had a 9% revenue growth, while RCOM lagged with ~2% growth.
• In June quarter – both RPMs and ARPUs have risen for the telcos along with the
growth in minutes. On an average, ARPU rose 4% and RPMs were up 2% in June.
Total minutes rose, too, by 3%, while MoUs held steady.
• Mobile EBITDA trends are strong, too, with ~26% EBITDA growth in 1H for telcos with
strong margin improvement.
• RCOM has made progress in deleveraging – through QIPs and the issue of warrants to
promoters – which should reduce the net debt to EBITDA (annualised) from ~5.4x to
~4.9x.
• Bharti, too, is focusing on deleveraging the debt at Africa and to this extent has
divested around 7k towers for USD1bn, we estimate.
What do we expect for the rest of the year?
• For the rest of the year, operational trends shouldn’t derail much. The focus is on
maintaining/ increasing voice prices, while data continues to gain traction.
• The key concern at this stage is from the potential entry of R Jio. With R Jio
acquiring 1,800Mhz spectrum in the auctions earlier this year, its ability to compete is a
lot more serious. But its launches are not widely expected to be until CY15F, in our
view.
• On the regulatory front, plentiful areas where we need more clarity on include M&As
and next round of spectrum auctions. Recent news flow suggests overhauling some old
telco regulations and the formation of a super-regulator.
– Among regional telcos, Indian regulations remain the most complex and confusing
given different circle regimes and license and access fees. So any clarity will be good,
though perhaps still early days to know if this will be forthcoming soon.
• Valuations are not looking inexpensive once again after the recent run, but the sector
as a whole isn’t inexpensive either.

Nomura | Asia telecoms 11 September 2014
27
Fig. 43: Indian telcos- Summary trends
Source: Company data, Nomura research
Jun-11 Sep-11 Dec-11 Mar-12 Jun-12 Sep-12 Dec-12 Mar-13 Jun-13 Sep-13 Dec-13 Mar-14 Jun-14
1Q12 2Q12 3Q12 4Q12 1Q13 2Q13 3Q13 4Q13 1Q14 2Q14 3Q14 4Q14 1Q15
Implied service revenues
q-q change %
Bharti 3% -1% 4% 4% 1% -3% 3% 5% 6% -3% 4% 4% 6%
RCOM 3% 2% 1% 1% 0% -3% 2% 1% 3% -1% 0% 0% 1%
Idea 7% 2% 9% 7% 2% -4% 5% 9% 9% -4% 5% 6% 9%
Vodafone 6% 3% 2% 6% 2% -2% 2% 6% 8% -2% 3% 3% 3%
Total mobile revenues 5% 2% 4% 4% 2% -3% 3% 5% 6% -2% 3% 3% 5%
ARPU (INR per sub per month)
Bharti 190 183 187 189 185 177 185 193 200 192 195 196 202
RCOM 103 101 100 99 98 95 112 117 119 120 125 128 136
Idea 160 155 159 160 156 148 158 167 174 164 169 173 181
Vodafone 169 168 167 173 174 169 176 187 196 191 193 192 193
Average ARPU 156 152 153 155 153 147 158 166 172 167 171 172 178
q-q change %
Bharti -2% -4% 2% 1% -2% -4% 5% 4% 4% -4% 2% 1% 3%
RCOM -4% -2% -1% -1% -1% -3% 18% 4% 2% 1% 4% 2% 6%
Idea -1% -3% 3% 1% -3% -5% 7% 6% 4% -6% 3% 2% 5%
Vodafone -1% -1% -1% 4% 1% -3% 4% 6% 5% -3% 1% -1% 1%
Average ARPU change -2% -2% 1% 1% -1% -4% 8% 5% 4% -3% 2% 1% 4%
RPM (INR per min per sub)
Bharti 0.43 0.43 0.45 0.44 0.43 0.42 0.43 0.42 0.44 0.44 0.45 0.45 0.46
RCOM 0.44 0.45 0.45 0.44 0.43 0.40 0.41 0.40 0.42 0.43 0.44 0.43 0.44
Idea 0.41 0.43 0.43 0.42 0.41 0.41 0.41 0.41 0.44 0.45 0.45 0.44 0.45
Vodafone 0.55 0.57 0.55 0.54 0.54 0.54 0.54 0.54 0.57 0.57 0.58 0.57 0.57
Average RPM 0.43 0.44 0.44 0.43 0.42 0.41 0.42 0.41 0.43 0.44 0.44 0.44 0.45
q-q change %
Bharti -1% 1% 3% -2% -3% -1% 0% 0% 4% 0% 2% 0% 4%
RCOM 0% 0% 0% -2% -1% -7% 3% -3% 4% 3% 0% -1% 1%
Idea 1% 4% 1% -2% -3% 0% 0% 0% 6% 2% 1% -3% 4%
Vodafone -1% 3% -3% -1% -2% 1% -1% 1% 4% 1% 1% -1% 0%
Average RPM change 0% 2% 0% -2% -2% -2% 1% 0% 5% 1% 1% -1% 2%
MoU (minutes per sub per month)
Bharti 445 423 419 431 433 417 435 455 455 437 434 437 435
RCOM 233 227 224 227 228 236 270 290 282 277 288 296 311
Idea 391 364 369 379 379 359 384 406 398 368 376 397 401
Vodafone 308 297 303 318 324 313 329 344 346 334 334 335 336
Average 344 328 329 339 341 331 354 374 370 354 358 366 371
q-q change %
Bharti -1% -5% -1% 3% 0% -4% 4% 5% 0% -4% -1% 1% 0%
RCOM -3% -3% -1% 1% 0% 4% 14% 7% -3% -2% 4% 3% 5%
Idea -2% -7% 1% 3% 0% -5% 7% 6% -2% -8% 2% 6% 1%
Vodafone 0% -4% 2% 5% 2% -3% 5% 5% 0% -4% 0% 0% 0%
Average -1% -5% 0% 3% 1% -3% 7% 5% -1% -4% 1% 2% 1%

Nomura | Asia telecoms 11 September 2014
28
Japan – iPhones and NTT’s FTTH wholesaling in focus
Key highlights from first six months this year
• Key takeaways in first 6-months this year were sudden ease of aggressive MNP
cashback from April, NTT DoCoMo’s announcement of JPY 500bn share buybacks,
and NTT’s announcement of FTTH wholesaling. NTT’s calculation appears to be that
higher volumes and lower promotional spending as a result of increased FTTH demand
and cost savings, for example no longer being responsible for FTTH installation costs,
will fully offset the dent to revenues at NTT East and NTT West from existing FTTH
cable users switching over to wholesaling services.
Comparative analysis
• In KDDI's 15/3 Q1, operating profit rose 9% y-y to ¥194.8bn, similar to our forecast of
¥194bn, and 27% of full-year guidance for ¥730bn. We made no change to our 15/3
operating profit estimate of ¥740.4bn. Mobile ARPU in the personal services segment
rose 1.7% y-y and we expect this to continue rising.
• For NTT DoCoMo, we slightly lowered our near-term forecasts for mobile ARPU, but
raised our forecasts for cost savings based on 15/3 Q1 results.
• In NTT’s 15/3 Q1, operating profit was at ¥298.0bn, down 14.6% y-y, but not a surprise
in light of the results already announced by its subsidiaries. The long distance and
international communications segment saw sales rise by ¥48.9bn y-y, on acquisition
benefits, but operating profit contract by ¥7.9bn. The regional communications segment
saw sales fall ¥23.1bn y-y and operating profit decline ¥2.8bn.
What to expect for the rest of the year?
• We recommend KDDI because a drop in its share price has once again highlighted how
undervalued it looks. We think its au Wallet prepaid e-money service, its entry into the
Myanmar mobile phone market, and expansion of overseas data centers will add
¥20bn in total to the operating profit in 17/3. We also expect the company to keep
increasing DPS by ¥30 per year and have a dividend yield higher than that of NTT in
17/3 (as on 1 September).
Indonesia
Key highlights from 1H
• Telkom (Neutral, TLKM IJ) was and continues to be one of preferred stocks for many
investors – its revenue trends have exceeded peers for almost two years now, which is
a reflection of its network advantage, stable market conditions and improved execution.
However, operating leverage (at EBITDA level) has been somewhat limited (with low
single digit growth).
• XL-Axis was also topical which closed in 1H. In recent results, it appears that most of
the integration is already done and some network elements are pending. The recent 2Q
results attracted a lot of attention, both on core trends and interest burden from Axis,
which appears to be lower (around 6%) than what we or the market had expected.
• Indosat has been range-bound and its results have failed to meet our and market’s
expectations and below peers. There has been a lot of talk about ‘network
modernization’ but it is hard to pin-point any benefits yet. Plus, its heavily geared USD
balance sheet is not helping the financials either.
• On towers, TBIG and Protelindo reported strong tower additions. Protelindo regained
momentum in 2Q after a slow 1Q and its 1H14 KPIs are trending ahead of full-year
guidance – 1H revenue and EBITDA growth of 27-29% is ahead of 17-21% guidance,
and 1H tower adds are at 1,060 vs. full-year guidance of 1,500-2,000.
• TBIG had a good half – 1H revenue and EBITDA growth of 24-25% y-y was decent and
tenant growth of 1.6k+ is trending in line with its full-year guidance of 3.3k. Tenant
additions in 2Q were strong, at 930 to a total of 17k now.

Nomura | Asia telecoms 11 September 2014
29
Comparative trends – 1H
• XL led the revenue growth on reported numbers with a 12% jump, TSEL had a 10%
growth, while Indosat declined 2%. As a result, XL’s and TSE’s revenue market share
expanded 80-110bps to 22% and 60%, respectively, whereas Indosat lost 190bps to
18%.
• Telkomsel reported the highest EBITDA growth of 9% followed by XL with a 2% growth,
while Indosat reported a 5% drop. On reported numbers, EBITDA shares are:
Telkomsel at 65% (+240bps y-y), Indosat at 19% (-200bps y-y) and XL at 16% (-40bps
q-q).
• XL and TSEL added 2-6mn subs during 1H, while ISAT lost ~5mn subs.
– XL gained 170bps subscriber market share to 25%, mainly driven by the acquisition of
Axis, we think. TSEL gained 70bps y-y subs market share, while Indosat lost 240bps
y-y.
• TSEL added the highest number of BTS (~10k) during 1H, followed by 4k additions by
ISAT and ~3k additions by XL. TSEL now owns 80k BTS, while ISAT and XL have 28-
48k BTS.
What to expect for the rest of the year?
• Current comments from the operators suggest stable market conditions for now and the
focus is on increasing voice and data prices. These were specifically made by Telkom
and XL, and even Indosat thinks 2Q14 should be the bottom. Indosat has struggled
operationally in recent quarters and may look to be more aggressive to regain share.
Hutch is always the other wildcard, but unfortunately we don’t get much clarity on their
intentions/ strategy until post the event, but we understand their network investment
continues.
• We may also hear more on spectrum/ networks especially, as CDMA businesses are
dissolved by operators and integrated into GSM.
• For towers, the most likely deal could be that XL could offload some of its towers in 2H,
where the review is ongoing, we understand. This should be the next catalyst for the
stock – and good for deleveraging. Indosat is also looking at its second round of tower
sale, but seems to be more of a 2015-16 event. For Mitratel (unlisted) too, listing is
slated for next year, we think.

Nomura | Asia telecoms 11 September 2014
30
Fig. 44: Quarterly summary
Source: Company data, Nomura research
Fig. 45: Operational trends
Source: Company data, Nomura research
1Q11 2Q11 3Q11 4Q11 1Q12 2Q12 3Q12 4Q12 1Q13 2Q13 3Q13 4Q13 1Q14 2Q14
Revenues (Rpbn)
Telkomsel 11,297 11,925 12,807 12,704 12,298 13,128 14,432 14,673 13,928 14,543 15,524 16,036 15,290 16,040
Indosat 3,964 4,262 4,360 4,164 4,080 4,406 5,035 5,034 4,751 4,821 4,908 4,895 4,651 4,714
XL Axiata 4,482 4,556 4,777 4,899 4,893 5,279 5,524 5,273 5,023 5,269 5,518 5,455 5,513 6,036
Total revenues 19,743 20,743 21,944 21,767 21,271 22,813 24,991 24,980 23,702 24,633 25,950 26,386 25,454 26,790
Revenue growth rates
Telkomsel -1.6% 5.6% 7.4% -0.8% -3.2% 6.7% 9.9% 1.7% -5.1% 4.4% 6.7% 3.3% -4.7% 4.9%
Indosat -3.6% 7.5% 2.3% -4.5% -2.0% 8.0% 14.3% 0.0% -5.6% 1.5% 1.8% -0.3% -5.0% 1.4%
XL Axiata -3.6% 1.7% 4.9% 2.6% -0.1% 7.9% 4.6% -4.5% -4.7% 4.9% 4.7% -1.1% 1.1% 9.5%
Total revenue growth -2.5% 5.1% 5.8% -0.8% -2.3% 7.3% 9.5% 0.0% -5.1% 3.9% 5.3% 1.7% -3.5% 5.2%1Q11 2Q11 3Q11 4Q11 1Q12 2Q12 3Q12 4Q12 1Q13 2Q13 3Q13 4Q13 1Q14 2Q14
EBITDA (Rpbn)
Telkomsel 6,245 6,877 7,428 6,999 7,075 7,347 8,272 7,870 7,838 8,119 9,256 8,656 8,465 8,928
Indosat 2,224 2,276 2,648 2,263 2,338 2,537 2,824 2,869 2,629 2,682 2,655 2,410 2,611 2,421
XL Axiata 2,362 2,396 2,272 2,320 2,392 2,546 2,505 2,302 2,025 2,139 2,255 2,239 2,201 2,064
Total EBITDA 10,831 11,549 12,348 11,582 11,805 12,430 13,601 13,041 12,492 12,940 14,166 13,305 13,276 13,414
EBITDA growth rates
Telkomsel -7.6% 10.1% 8.0% -5.8% 1.1% 3.8% 12.6% -4.9% -0.4% 3.6% 14.0% -6.5% -2.2% 5.5%
Indosat -9.8% 2.3% 16.4% -14.6% 3.3% 8.5% 11.3% 1.6% -8.4% 2.0% -1.0% -9.2% 8.3% -7.3%
XL Axiata -5.4% 1.4% -5.2% 2.1% 3.1% 6.4% -1.6% -8.1% -12.0% 5.6% 5.4% -0.7% -1.7% -6.2%
Total EBITDA growth -7.6% 6.6% 6.9% -6.2% 1.9% 5.3% 9.4% -4.1% -4.2% 3.6% 9.5% -6.1% -0.2% 1.0%
EBITDA margin
Telkomsel 55% 58% 58% 55% 58% 56% 57% 54% 56% 56% 60% 54% 55% 56%
Indosat 46% 44% 50% 43% 47% 48% 47% 47% 45% 45% 44% 40% 45% 41%
XL Axiata 53% 53% 48% 47% 49% 48% 45% 44% 40% 41% 41% 41% 40% 34%
Total margin 55% 56% 56% 53% 55% 54% 54% 52% 53% 53% 55% 50% 52% 50%
1Q11 2Q11 3Q11 4Q11 1Q12 2Q12 3Q12 4Q12 1Q13 2Q13 3Q13 4Q13 1Q14 2Q14
Mobile subs ('000)
Telkomsel 99,365 102,291 104,149 107,017 109,881 117,235 121,477 125,146 120,611 125,091 127,904 131,512 132,651 137,169
Indosat 45,700 47,300 51,500 51,700 52,100 50,900 55,400 58,500 55,900 56,500 53,800 59,600 59,800 54,900
XL Axiata 39,286 38,896 43,397 46,406 46,413 45,828 42,341 45,755 49,054 54,128 58,132 60,577 68,454 62,891
Total subs 184,351 188,487 199,046 205,123 208,394 213,963 219,218 229,401 225,565 235,719 239,836 251,689 260,905 254,960
Mobile subs share
Telkomsel 54% 54% 52% 52% 53% 55% 55% 55% 53% 53% 53% 52% 51% 54%
Indosat 25% 25% 26% 25% 25% 24% 25% 26% 25% 24% 22% 24% 23% 22%
XL Axiata 21% 21% 22% 23% 22% 21% 19% 20% 22% 23% 24% 24% 26% 25%
Total subs 100% 100% 100% 100% 100% 100% 100% 100% 100% 100% 100% 100% 100% 100%
BTS
Telkomsel 37,830 39,609 41,037 42,623 44,797 47,254 51,005 54,297 57,664 62,225 65,653 69,864 74,326 79,560
Indosat 18,368 18,408 18,776 19,253 20,063 21,039 21,642 21,930 22,097 22,449 23,207 24,280 26,255 28,439
XL Axiata 23,267 24,971 26,245 28,273 30,732 33,737 36,101 39,452 39,819 41,293 42,796 44,946 45,600 47,814
Total BTS 79,465 82,988 86,058 90,149 95,592 102,030 108,748 115,679 119,580 125,967 131,656 139,090 146,181 155,813
BTS additions
Telkomsel 37,830 1,779 1,428 1,586 2,174 2,457 3,751 3,292 3,367 4,561 3,428 4,211 4,462 5,234
Indosat 260 40 368 477 810 976 603 288 167 352 758 1,073 1,975 2,184
XL Axiata 23,267 1,704 1,274 2,028 2,459 3,005 2,364 3,351 367 1,474 1,503 2,150 654 2,214
Total BTS additions 61,357 3,523 3,070 4,091 5,443 6,438 6,718 6,931 3,901 6,387 5,689 7,434 7,091 9,632

Nomura | Asia telecoms 11 September 2014
31
Malaysia – wireless slow, fixed is strong
Key highlights from 1H
• Wireless revenue growth was down 1% y-y in 1H, mostly due to the weakness at
Celcom (flat service revenue affected by its IT transformation) and Maxis (a 5%
decline). DiGi, on the other hand, had a decent first half with a 4% service revenue
growth.
– Voice revenues are down 3%, while SMS is declining sharply by 18-30% across the
three players.
– Competition from U-Mobile appears to have picked up, too.
• On EBITDA, DiGi had a 7% growth in 1H compared with a 5-7% decline for Celcom
and Maxis. EBITDA margins are up slightly at ~47% on an average.
• In fixed, TM’s HSBB net adds have slowed down in the past few quarters (current
conversion is 43% on 1.5mn premises) and TM noted a pickup in churn on which it is
working to address. However, it is also focusing on up-selling services and ARPUs
have risen nicely by 4-8% y-y ARPU on both fibre and DSL. HSBB 2 details should also
help towards driving broadband growth, in our view.
What do we expect for the rest of the year?
• Valuations are a key pushback for Malaysian telcos in general.
• Wireless trends should remain muted, though with some recovery in the in the second
half.
• Competitive intensity will likely remain, though is not irrational either. TM’s strategy after
P1 is important, though we believe its LTE rollout will take time.
• On fixed line, we expect HSBB 2 details shortly – we understand delays are more
administrative at this stage.
Fig. 46: Service revenue growth, y-y
Source: Company data, Nomura research
Fig. 47: Industry voice/SMS/pure data revenue trends
Source: Company data, Nomura research
-8%
-6%
-4%
-2%
0%
2%
4%
6%
8%
10%
12%
1Q11
2Q11
3Q11
4Q11
1Q12
2Q12
3Q12
4Q12
1Q13
2Q13
3Q13
4Q13
1Q14
2Q14
Celcom Digi Maxis Total
-40%
-30%
-20%
-10%
0%
10%
20%
30%
1Q12
2Q12
3Q12
4Q12
1Q13
2Q13
3Q13
4Q13
1Q14
2Q14
SMS revenue growth y-y
Data revenue growth y-y
Voice revenue growth y-y

Nomura | Asia telecoms 11 September 2014
32
Fig. 48: Revenue and EBITDA share in wireless
Source: Company reports, Nomura research
SERVICE REVENUES (RM mn) 1Q11 2Q11 3Q11 4Q11 1Q12 2Q12 3Q12 4Q12 1Q13 2Q13 3Q13 4Q13 1Q14 2Q14
Service revenue market share
Celcom 33% 33% 33% 33% 34% 34% 34% 34% 34% 34% 34% 34% 34% 34%
DiGi 27% 27% 27% 27% 27% 27% 27% 27% 28% 28% 29% 29% 29% 29%
Max is 40% 40% 40% 40% 38% 39% 38% 39% 39% 38% 38% 37% 37% 37%
EBITDA (RM mn) 1Q11 2Q11 3Q11 4Q11 1Q12 2Q12 3Q12 4Q12 1Q13 2Q13 3Q13 4Q13 1Q14 2Q14
EBITDA market share
Celcom 31% 31% 31% 31% 31% 32% 33% 32% 32% 32% 32% 32% 31% 31%
Digi 26% 26% 27% 27% 27% 28% 27% 27% 26% 27% 27% 29% 29% 29%
Max is* 43% 43% 43% 42% 42% 41% 40% 40% 41% 41% 41% 39% 40% 39%
Margins
Celcom 46% 45% 44% 43% 44% 45% 45% 44% 44% 44% 45% 44% 44% 43%
Digi 46% 46% 47% 47% 47% 48% 45% 44% 44% 45% 45% 47% 45% 46%
Max is 51% 51% 50% 49% 51% 50% 48% 46% 48% 51% 52% 49% 51% 51%
Average 48% 47% 47% 46% 47% 48% 46% 45% 45% 47% 47% 46% 47% 47%

Nomura | Asia telecoms 11 September 2014
33
The Philippines – concerns remain
Key highlights from 1H
• Cannibalisation risks: Recent 1H numbers indicate weak SMS trends with SMS
revenue dropping by 7% y-y. Importantly, total non-voice (SMS and mobile internet)
declined 1% in 1H14 for the industry vs. an 8% growth in 2013. While temporary
promos (Facebook in particular) could be the reason, this is a risk to watch for.
• Margin decline continues, partly from subsidies: In 1H14, we note that Globe’s
overall EBITDA margins declined by 253 bps y-y. Subsidy and marketing expenses
were at 15% of service revenue vs. 13% a year ago. Despite slower net adds, SACs
(as reported by the company) were up ~30% y-y. For PLDT, wireless margins declined
477bps y-y in 1H14, though this was only partly on account of subsidies. Subsidy +
marketing expenses (in wireless) grew 14% y-y to 14% of service revenue (12% in
1H13). In 2013, subsidy + marketing were up to 13% from 11.6% in 2012.
Comparative trends
• PLDT’s wireless revenue was flat vs. up 5% for Globe in 1H.
• Wireless EBITDA was down 5% y-y% for the industry with average margins at 45% vs.
46% in 2013.
– PLDT’s wireless EBITDA was down by 9% y-y, while Globe’s wireless EBITDA was
up by 2% y-y. Globe’s EBITDA share is now at 40% vs. 37% in 2013.
• Voice trends were better and were up 6% y-y. While non-voice (data and SMS) was
down 1% y-y. This is compared to an average 8% y-y growth seen in non-voice.
– In 1H14, SMS revenue was down 7% y-y vs. a 2% y-y growth in 2013.
– Mobile internet was up 29% vs. 47% the year before. Mobile internet revenue for
PLDT was up 77% y-y, while for Globe it was up 11% y-y.
• On cost, selling and promotion expenses for Globe grew 29% y-y vs. a 15% y-y growth
for PLDT. Subsidy cost is also witnessing increasing trends for both the telcos.
– Subsidy and marketing cost for PLDT and Globe were 14-15% of service revenue
during 1H vs. ~13% in 1H13.
What do we expect in 2014F?
• We expect Globe to continue outpacing PLDT in market share, as PLDT remains a
price-follower.
• We still expect risks/volatility to EBITDA margins, given the ongoing focus on post-paid.

Nomura | Asia telecoms 11 September 2014
34
Fig. 49: The Philippines telcos – key trends
Source: Company data, Nomura research
1Q12 2Q12 3Q12 4Q12 1Q13 2Q13 3Q13 4Q13 1Q14 2Q14
Wireless revenue share
Globe 39% 39% 39% 40% 40% 41% 41% 40% 41% 42%
PLDT 61% 61% 61% 60% 60% 59% 59% 60% 59% 58%
VOICE VS DATA 1Q12 2Q12 3Q12 4Q12 1Q13 2Q13 3Q13 4Q13 1Q14 2Q14
Voice
Globe 7,936 8,156 7,978 8,376 7,670 8,268 8,052 8,377 8,658 8,684
PLDT 12,493 12,207 12,175 12,751 12,187 12,869 12,733 13,595 12,868 13,049
Total 20,429 20,363 20,153 21,127 19,857 21,137 20,785 21,972 21,526 21,733
Chg % y-y
Globe 6% 5% 3% 5% -3% 1% 1% 0% 13% 5%
PLDT 14% 12% 19% 7% -2% 5% 5% 7% 6% 1%
Total 11% 9% 13% 7% -3% 4% 3% 4% 8% 3%
SMS
Globe 6,745 6,693 6,452 6,662 6,961 7,349 7,097 7,387 7,008 7,233
PLDT 12,024 12,174 11,885 12,212 11,934 11,938 11,535 11,883 10,789 10,527
Total 18,769 18,867 18,337 18,874 18,895 19,287 18,632 19,270 17,797 17,760
Chg % y-y
Globe 3% 10% 10% 11% 1% -2%
PLDT -1% -2% -3% -3% -10% -12%
Total 1% 2% 2% 2% -6% -8%
Mobile Internet
Globe 1,890 1,861 2,147 2,293 2,493 3,100 3,083 2,927 2,790 3,425
PLDT 688 725 768 940 979 1,126 1,283 1,580 1,769 1,957
Total 2,578 2,586 2,915 3,233 3,472 4,226 4,366 4,507 4,559 5,382
Chg % y-y
Globe 32% 67% 44% 28% 12% 10%
PLDT 42% 55% 67% 68% 81% 74%
Total 35% 63% 50% 39% 31% 27%
Data (SMS + MI)
Globe 8,635 8,554 8,599 8,955 9,454 10,449 10,180 10,314 9,798 10,658
PLDT 12,712 12,899 12,653 13,152 12,913 13,064 12,818 13,463 12,558 12,484
Total 21,347 21,453 21,252 22,107 22,367 23,513 22,998 23,777 22,356 23,142
Chg % y-y
Globe 9% 22% 18% 15% 4% 2%
PLDT 2% 1% 1% 2% -3% -4%
Total 5% 10% 8% 8% 0% -2%
MI as a % of total cellular revenues
Globe 11% 13% 13% 15% 17% 17% 16% 15% 18%
PLDT 3% 3% 4% 4% 4% 5% 6% 7% 8%
Total 6% 7% 7% 8% 9% 10% 10% 10% 12%
EBITDA 1Q12 2Q12 3Q12 4Q12 1Q13 2Q13 3Q13 4Q13 1Q14 2Q14
Wireless margins
Globe 49% 49% 52% 42% 45% 49% 46% 41% 44% 47%
PLDT 50% 50% 49% 43% 50% 47% 45% 45% 46% 42%
Average 50% 49% 50% 43% 48% 48% 46% 43% 45% 45%
Wireless EBITDA share
Globe 36% 37% 38% 37% 35% 40% 39% 36% 38% 43%
PLDT 64% 63% 62% 63% 65% 60% 61% 64% 62% 57%

Nomura | Asia telecoms 11 September 2014
35
Singapore – rising risks
Key highlights from 1H
• In the first six months in 2014, total industry revenue for telcos was up 2%. SingTel
(Singapore segment) had 5% revenue growth this year, while M1 and StarHub had a
2% revenue decline on the back of lower handset sales in the first half.
• The wireless service revenue rose 2%, which was, however, weaker than in the same
period last year.
– M1 had 4% growth, SingTel 3% growth, while StarHub remained flat.
• SingTel recently announced data-WiFi bundles for SGD3 extra and has also waived the
4G-VAS charge indefinitely. We may see others defer/ waive these charges, too, so the
ARPU upside potential is more likely from higher usage rather than from direct price
increases – the current usage is around 2.5-3.0GB.
• In wireless, the regulator is looking to increase competition and there is risk that
MyRepublic could be looking to enter this space as well.
• Broadband has been competitive and prices/ARPU have continued to decline.
• In pay TV, telcos benefitted from some revenue/ARPU upside from FIFA package -
which was part of the cross-carriage regulations.
• 1H14, industry EBITDA was down 1% - StarHub down 3%, SingTel down 1%, while M1
had a 6% EBITDA growth.
• On consolidated margins, M1 had 240bps improvement, while SingTel had 175bps
decline. StarHub’s EBITDA margins were down 30bps.
What do we expect for 2014?
• In wireless, while one should not dismiss the MyRepublic as a threat in wireless, there
are hurdles around networks, regulatory clarity on spectrum roaming, access, etc,
which will be much more difficult, expensive and time consuming.
• In broadband, price decline will likely remain under pressure over coming quarters,
especially as StarHub looks to regain market share and to maximize its adoption
grants, in our view.
Fig. 50: Total revenue y-y growth – 1H14 from 1H13
Source: Company data, Nomura research
Fig. 51: Mobile revenue y-y growth – 1H14 from 1H13
Source: Company data, Nomura research. Note – 1H14 - January to June 2014
-2%
-1%
0%
1%
2%
3%
4%
5%
StarHub M1 SingTel Industry-1%
0%
1%
1%
2%
2%
3%
3%
4%
4%
5%
StarHub Industry SingTel M1

Nomura | Asia telecoms 11 September 2014
36
Fig. 52: Mobile service revenue y-y growth
Source: Company data, Nomura research
Fig. 53: Mobile service revenue share change in 1H14 – 1H13
Source: Company data, Nomura research. Note – 1H14 - Jan to June 2014
South Korea – irrational marketing coming to an end?
Key highlights from 1H
• The mobile ARPU trend is continuing to show a solid trend despite rising LTE
penetration with the introduction of unlimited LTE voice/data plan working well for
Korea telcos.
• 1H14, EBITDA is not 'clean' as it is impacted by KT's one-off ERP expense of
KRW1.05tn. If we adjust this cost, Korea telcos’ 1H14 EBITDA declined c.5%, owing to
intense competition.
• KT has done well in 1H14 in terms of blended mobile net additions by offering mid-end
handset models at low prices, in our view. Blended subscriber (MNO + MVNO) net
additions recorded 76K, 301K, and 132K for SKT, KT, LGU+, respectively, for 2Q14.
• Dividend has become a key focus for Korea telcos as the Korean government is
emphasizing dividend increase as one of the key initiatives to boost domestic spending.
• Contrary to 1H14, the MNP (mobile number portability) trend has remained low for
3Q14 so far. The trend provides a meaningful upside risk for 3Q14 earnings. The
market will also be focused on the marketing trend from October as the handset
distribution bill will come into effect.
• SKT led EBITDA margins with 26% in 1H14, due to decreased marketing expense.
KT's EBITDA came in low with 10.3% EBITDA margins, and LGU+'s EBITDA margins
slightly increased at 16.8%. This trend of lower EBITDA margins for LGU+ and KT
indicates that they have incurred higher marketing cost during 1H14.
• In total, the marketing expense increased by 16% y-y for Korea telcos during 1H14.
The marketing cost for LGU+ increased the most at 23% y-y, and KT at 21% y-y during
1H14. SKT's marketing cost increased in a smaller percentage at 9% y-y, but its
marketing cost was the largest at KRW1,925bn during 1H14.
What do we expect for 2014?
• For 2014F, we maintain our preference for SKT (Buy) and LGU+ (Buy). The handset
distribution bill, to be introduced in October 2014, will be a positive for Korea telcos
overall but we are especially positive on SKT (largely a market share player) and LGU+
(highest operating leverage in the event of lowered marketing expense). The market
will continue to like SKT and LGU+ for their dividend merits, while on the other hand
KT's lack of dividend may steer investors away, in our view. KT is showing signs of
improvement in the mobile business, but a structural decline in the fixed business is
keeping us at Neutral.
• Handset distribution bill is set to launch from October in Korea. Key factor from the
handset distribution bill is that the telcos now have to disclose the subsidy level per
handset. Korea telcos profitability was often hit by extreme subsidy driven marketing
cost, but with telcos bounded by law to disclose subsidy level beforehand, the
-4%
-2%
0%
2%
4%
6%
8%
10%
12%
14%
16%M
ar '1
0
Jun
'10
Sep
'10
Dec '1
0
Mar '1
1
Jun
'11
Sep
'11
Dec '1
1
Mar '1
2
Jun
'12
Sep
'12
Dec '1
2
Mar '1
3
Jun
'13
Sep
'13
Dec '1
3
Mar '1
4
Jun
'14
StarHub M1 SingTel
(80)
(60)
(40)
(20)
-
20
40
60
StarHub M1 SingTel

Nomura | Asia telecoms 11 September 2014
37
likelihood of guerrilla-type subsidy marketing (which is the key driver of marketing
expense surges) is low and thus we see improving fundamentals from 4Q. Key risks
from this bill are: 1) competition moving on to price; and 2) telcos coming up with some
other ‘creative’ means to provide extra subsidy.
Taiwan – good 1H trends as expected, 4G competition in 2H
Key highlights from 1H
• For 1H14, Taiwan telcos reported 1-2% mobile service revenue growth, 3-9% EBITDA
growth and 5-11% earnings growth. Both EBITDA and NPAT trends were ahead of
guidance, while revenues were softer. This was due to the lower usage and softer
handset sales in anticipation of 4G launches and should pick up in 2H, we think.
• The greater concern for the market is 4G competition in 2H - which was immediately
visible after 4G launch from Taiwan Star. Telcos have extended their promotions and
are now offering unlimited data for the whole contract period on select plans.
• For CHT, 1H14 revenue was down 1% vs. its flat full-year guidance. Mobile non-voice
growth was offset by weak voice and another 5% decline in fixed where structural and
regulatory issues should keep revenue under pressure.
– Cost initiatives seem to be in place – EBITDA rose 3% YTD with 37% margins and
2Q EBITDA rose 1% with margins up 57bps. Earnings rose 5% in 1H and 4% q-q in
2Q.
• FET had a 2% revenue growth in 1H, which was slightly below its 3% guidance, while
EBITDA/NPAT grew by a strong 9%/11%, which was considerably ahead of its outlook.
• TWM’s revenue growth was weak in 2Q vs. its outlook, while EBITDA/earnings trends
are strong. The momo segment had good revenue and margin improvement in 2Q. Its
cable revenue trend is also reasonable.
– EBITDA grew 4-5% with 230bps margin improvement, while earnings rose 5%. 4G
rollout on 1800MHz should increase the handset support for both TWM and FET, in
our view.
What do we expect for the rest of the year?
• The incumbent telco’s reaction to TWS was aggressive and also surprising – and the
next few quarters will remain choppy.
• Given the heightened competition, we are turning more cautious on stocks – there are
earnings risks this year and next.
• The impending launch of Hon Hai’s 4G is the next risk – which could see further pricing
cuts.
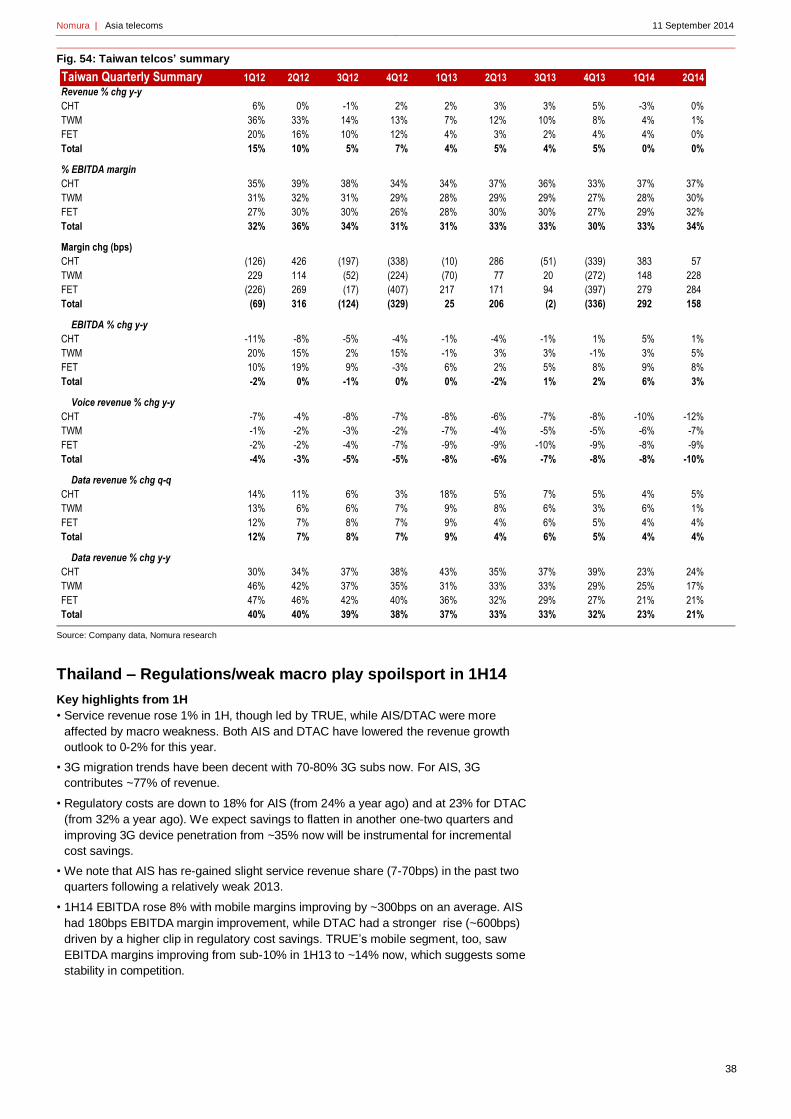
Nomura | Asia telecoms 11 September 2014
38
Fig. 54: Taiwan telcos’ summary
Source: Company data, Nomura research
Thailand – Regulations/weak macro play spoilsport in 1H14
Key highlights from 1H
• Service revenue rose 1% in 1H, though led by TRUE, while AIS/DTAC were more
affected by macro weakness. Both AIS and DTAC have lowered the revenue growth
outlook to 0-2% for this year.
• 3G migration trends have been decent with 70-80% 3G subs now. For AIS, 3G
contributes ~77% of revenue.
• Regulatory costs are down to 18% for AIS (from 24% a year ago) and at 23% for DTAC
(from 32% a year ago). We expect savings to flatten in another one-two quarters and
improving 3G device penetration from ~35% now will be instrumental for incremental
cost savings.
• We note that AIS has re-gained slight service revenue share (7-70bps) in the past two
quarters following a relatively weak 2013.
• 1H14 EBITDA rose 8% with mobile margins improving by ~300bps on an average. AIS
had 180bps EBITDA margin improvement, while DTAC had a stronger rise (~600bps)
driven by a higher clip in regulatory cost savings. TRUE’s mobile segment, too, saw
EBITDA margins improving from sub-10% in 1H13 to ~14% now, which suggests some
stability in competition.
Taiwan Quarterly Summary 1Q12 2Q12 3Q12 4Q12 1Q13 2Q13 3Q13 4Q13 1Q14 2Q14
Revenue % chg y-y
CHT 6% 0% -1% 2% 2% 3% 3% 5% -3% 0%
TWM 36% 33% 14% 13% 7% 12% 10% 8% 4% 1%
FET 20% 16% 10% 12% 4% 3% 2% 4% 4% 0%
Total 15% 10% 5% 7% 4% 5% 4% 5% 0% 0%
% EBITDA margin
CHT 35% 39% 38% 34% 34% 37% 36% 33% 37% 37%
TWM 31% 32% 31% 29% 28% 29% 29% 27% 28% 30%
FET 27% 30% 30% 26% 28% 30% 30% 27% 29% 32%
Total 32% 36% 34% 31% 31% 33% 33% 30% 33% 34%
Margin chg (bps)
CHT (126) 426 (197) (338) (10) 286 (51) (339) 383 57
TWM 229 114 (52) (224) (70) 77 20 (272) 148 228
FET (226) 269 (17) (407) 217 171 94 (397) 279 284
Total (69) 316 (124) (329) 25 206 (2) (336) 292 158
EBITDA % chg y-y
CHT -11% -8% -5% -4% -1% -4% -1% 1% 5% 1%
TWM 20% 15% 2% 15% -1% 3% 3% -1% 3% 5%
FET 10% 19% 9% -3% 6% 2% 5% 8% 9% 8%
Total -2% 0% -1% 0% 0% -2% 1% 2% 6% 3%
Voice revenue % chg y-y
CHT -7% -4% -8% -7% -8% -6% -7% -8% -10% -12%
TWM -1% -2% -3% -2% -7% -4% -5% -5% -6% -7%
FET -2% -2% -4% -7% -9% -9% -10% -9% -8% -9%
Total -4% -3% -5% -5% -8% -6% -7% -8% -8% -10%
Data revenue % chg q-q
CHT 14% 11% 6% 3% 18% 5% 7% 5% 4% 5%
TWM 13% 6% 6% 7% 9% 8% 6% 3% 6% 1%
FET 12% 7% 8% 7% 9% 4% 6% 5% 4% 4%
Total 12% 7% 8% 7% 9% 4% 6% 5% 4% 4%
Data revenue % chg y-y
CHT 30% 34% 37% 38% 43% 35% 37% 39% 23% 24%
TWM 46% 42% 37% 35% 31% 33% 33% 29% 25% 17%
FET 47% 46% 42% 40% 36% 32% 29% 27% 21% 21%
Total 40% 40% 39% 38% 37% 33% 33% 32% 23% 21%

Nomura | Asia telecoms 11 September 2014
39
What do we expect for 2014?
• Revenue growth is expected to improve in 2H, driven by better macro.
• Telcos’ strategy to increase 3G device penetration will be key. This should help drive
the next leg of regulatory cost savings.
• Most important is clarity on spectrum auctions – though this could be delayed into
2015F, we think.
Fig. 55: Thai telcos’ summary
Source: Company data, Nomura research
Fig. 56: Regulatory costs as a % of revenue
Source: Company data, Nomura research
Fig. 57: Marketing costs as a % of revenue
Source: Company data, Nomura research
1Q12 2Q12 3Q12 4Q12 1Q13 2Q13 3Q13 4Q13 1Q14 2Q14
Serv rev chg YY
AIS 16% 16% 15% 13% 7% 5% 4% -1% -2% 2%
DTAC 7% 8% 6% 12% 12% 14% 10% 6% 0% -2%
TRUE Mobile 12% 15% 13% 18% 14% 11% 18% 10% 9% 8%
Serv rev share
AIS 54.6% 54.4% 54.2% 53.9% 53.3% 52.6% 52.2% 52.0% 52.1% 52.7%
DTAC 30.7% 30.5% 30.7% 30.7% 31.3% 32.0% 31.4% 31.7% 31.3% 30.9%
TRUE Mobile 14.8% 15.1% 15.1% 15.3% 15.4% 15.3% 16.4% 16.3% 16.7% 16.3%
Voice rev chg YY
AIS 13% 12% 12% 7% 0% -1% -3% -9% -12% -12%
DTAC 1% -1% -4% -3% -3% -1% -4% -9% -13% -12%
TRUE Mobile 6% 1% 2% 1% -5% -7% -1% -3% 6% 1%
Non voice rev chg YY
AIS 32% 35% 32% 33% 29% 25% 23% 19% 24% 32%
DTAC 43% 51% 49% 53% 50% 51% 55% 42% 32% 28%
TRUE Mobile 60% 82% 66% 72% 71% 50% 50% 33% 27% 24%
EBITDA margin
AIS 43.4% 42.7% 43.7% 39.3% 42.3% 42.5% 44.5% 44.3% 45.1% 43.3%
DTAC 29.9% 30.6% 31.4% 27.9% 29.2% 31.2% 33.5% 30.8% 36.8% 36.5%
TRUE Mobile 9.4% 8.8% 5.6% 9.7% 10.6% 8.4% 7.3% 5.0% 15.1% 13.7%
10%
15%
20%
25%
30%
35%
1Q12 2Q12 3Q12 4Q12 1Q13 2Q13 3Q13 4Q13 1Q14 2Q14
AIS DTAC

Nomura | Asia telecoms 11 September 2014
40
Asian telcos’ June 2014 results – in detail • In the first six months of 2014, the average industry revenue rose 3%, service revenue
rose 4%, EBITDA rose 2%, while adjusted NPAT rose 2%.
• In revenue, Indian telcos had an 11% growth, while China and Indo grew 6-7%.
Thailand lagged with a 2% decline in 1H, while Malaysia was flat.
• Service revenue rose 4% in 1H with CU, CT, XL and IDEA leading with +10% service
revenue growth.
• Total EBITDA rose 2% on an average. Here, too, Indian telcos have led with a 16%
growth in the first six months in 2014.
– South Korea was weak – down 24% – driven by KT, where the EBIDTA was down by
51%, which was mostly due to the ERP expense reflected in 2Q. Adjusting for KT's
KRW1.05tn ERP expense, Korea telcos’ 1H14 EBITDA was down by 5% compared
to last year, on the back of heavy subsidy-driven marketing which took place during
January-February and May-June.
– Philippine telcos, too, had EBITDA declining on the back of promotions and
marketing expenses.
• EBITDA margins were down, however, by ~80bps. Thai telcos had ~200bps
consolidated EBITDA margins improvement.
– EBITDA margins for Taiwan and India too rose ~130-140bps.
– Korea, Philippines and Chinese telcos had margin declining in 1H, we note.
• Adjusted NPAT rose 2% on an average. Profit growth was the highest at Indian telcos,
CU and DiGi.
– KT, XL and TM had the highest NPAT decline.
• There are ~2.9bn mobile subscribers now for Asian telcos – with ~70mn additions in
2014.
• On ARPUs, Korean telcos had the highest ARPU improvement compared with Jun-13.
Indian telcos, too, had a decent ARPU growth.
– Thai telcos, Globe and XL had ARPU declining from 2013.
• Taiwan also has launched 4G in 2Q14 and with this most of the Asian markets have 4G
rolled out. Korea still leads with 59% of subscribers on 4G, which has also translated
into decent ARPU trends.
Total revenue trends
• 1H14 industry revenue rose by 3% on an average. XL, Bharti and IDEA had the highest
percentage growth of 12-16%, while revenue for Maxis and DTAC was down 9% and
Optus down 4%.
Marketwise
• In Australia, TLS had a 2% growth (normalised) compared with 1-4% decline for peers.
TLS continued to gain overall market share on the back of strong wireless and NAS
growth, while fixed was stable.
• Chinese telcos had ~6% revenue growth in 1H – CM had ~7% growth compared with 4-
5% for CU and CT.
• Indian telcos had the highest revenue growth with an average of 11% - led by 13-16%
growth for Bharti and IDEA in the first six months of this year.
• Indonesian telcos’ revenue grew 7% in 1H. Within this, XL and TLKM grew 8-12%,
whereas ISAT was weak with 1% decline.
• In Japan, KDDI had a 2% total revenue growth, while NTT showed 1% growth (y-y in
1Q).
• In Malaysian wireless, DiGi had a 5% growth in 1H compared with a 3% decline for
Celcom and a 9% decline for Maxis. Part of the challenges at Celcom has been due to
its billing/IT transformation which affected new product launches. Maxis continues to

Nomura | Asia telecoms 11 September 2014
41
face revenue weakness during its transformation. For TM, the growth was strong at 8%,
driven by uspelling on fibre and DSL.
• Singapore telcos had a 2% revenue growth in 1H driven by a 5% growth for SingTel.
M1 and StarHub had a 2% revenue decline on the back of lower handset sales.
• In South Korea, SKT had a 4% growth, KT was flat and LGU down 1%. SKT: despite a
3% wireless subscriber growth and a 5% wireless ARPU growth, SKT's parent revenue
growth was 3%, largely due to the increase in MVNO's in subscriber mix. (SKT's
reported wireless ARPU is only for MNOs).
– KT saw revenue increase in wireless and non-telco business but was offset by a
decline in the fixed business. LGU+’s wireless service revenue increased by 10%, but
was offset by the decline in equipment revenue, owing to the decrease in handset
price.
• Taiwan had flat revenue – driven by 1% decline at CHT. Compared to this, FET and
TWM had 2-3% revenue growth in 1H.
• Thailand telcos had a 2% revenue decline driven by weaker macro and lower handset
sales. Telcos, however, expect a recovery in 2H.
Fig. 58: Total revenue trends – 1H13 to 1H14
Source: Company data, Nomura research
Fig. 59: Total revenue growth – June-14 quarter q-q
Source: Company data, Nomura research
Fig. 60: Total revenue growth – June-14 quarter y-y
Source: Company data, Nomura research
-15%
-10%
-5%
0%
5%
10%
15%
20%
Ma
xis
DT
AC
Op
tus
AIS
Ce
lco
m
Do
co
mo
Sta
rHu
b
M1
RC
OM
CH
T
LG
U+
VH
A
Ind
os
at
KT
FE
T
Te
lstr
a
TW
M
NTT
PL
DT
CU
SK
T
Sin
gT
el
DiG
i
TR
UE
CT
CM
Glo
be
TM
TL
KM
KD
DI
XL
Bh
art
i
IDE
A
Total revenue growth 1H14-1H13 Average growth
-15%
-10%
-5%
0%
5%
10%
KD
DI
NT
TC
UF
ET
Tru
eT
WM
RC
OM
DT
AC
Sin
gTe
lD
oc
om
oM
ax
isC
TO
ptu
sL
GU
+M
1A
ISP
LD
TS
tarH
ub
Ind
os
at
CH
TD
iGi
Ce
lco
mS
KT
KT
Bh
art
iTL
KM
Glo
be
IDE
ATM XL
CM
June Qtr Total rev growth q -q
Average growth
-15%
-10%
-5%
0%
5%
10%
15%
20%
DT
AC
Ma
xis
Do
co
mo
Ce
lco
mO
ptu
sM
1S
tarH
ub
AIS
Ind
os
at
CU
FE
TC
HT
LG
U+
TW
M KT
NT
TK
DD
IP
LD
TR
CO
MS
ingTe
lC
TS
KT
Tru
eD
iGi
CM
Glo
be
TM
TL
KM
Bh
art
iX
LID
EA
June Qtr Total rev growth y-y
Average growth

Nomura | Asia telecoms 11 September 2014
42
Service revenue trends
• 1H14 industry service revenue rose by 4% on an average. Of this, IDEA, XL and CT
had the highest growth of 14-16%, while Maxis had the least service revenue growth –
down 5% in 1H. Optus was down 3%.
Marketwise
• In Australia, Telstra rose by a strong 4%, while Optus was down 3% in 1H. Telstra
continues to gain share in wireless given its network superiority and customer focus.
• Indian telcos had strong service revenue growth – Bharti rose 10%, while IDEA was up
16% in the first six months this year (RCOM lagged peers). Some sense of stability has
kicked into the market – in the June quarter, both RPMs and ARPUs have risen 2-4%.
Total minutes rose, too, by 3%, while MoUs were up 1%.
• Indonesia - XL led the revenue growth on reported numbers with a 12% jump, Tsel
had a 10% growth, while Indosat declined by 2%. As a result, XL’s and Tsel’s revenue
market share expanded by 80-110bps to 22% and 60%, respectively, whereas Indosat
lost 190bps to 18%.
• In Japan, KDDI had a 7% mobile service revenue growth due to sub growth and mobile
ARPU increase, while NTT was down 4% (y-y in 1Q).
• In Malaysia, in 1H14, DiGi’s service revenue rose 4%, Celcom was flat, while Maxis
was down 5%. We note that the industry growth has struggled in the past couple of
quarters. In 4Q13 and 1Q14, it was flat-to-negative for the industry as a whole – while
SMS and VAS have been on a structural decline, voice has been weak recently.
• The Philippines - Wireless revenue growth for PLDT was flat y-y vs. up 5% for Globe -
indicating strong market share gains for Globe. Voice trends were better and revenue
was up 6% y-y. Non-voice (data and SMS) was down 1% y-y. This is compared to an
average 8% y-y growth seen in non-voice in 1H14. The subdued trends in non-voice on
the back of promotions running in the market (free Facebook, etc) not only subdued
growth in mobile internet, but also triggered declines in SMS. 1H14, SMS revenue was
down 7% y-y (-2% in 2013), while mobile internet was up 29% vs. up 47% the year
before.
• Singapore wireless revenue rose 2% in 1H - M1 had a 4% growth, SingTel up 3%,
while StarHub remained flat. Some benefits of data repricing have come in and now
~60% of subscribers are on tiered plans. SingTel’s recent data-WiFi bundle (for SGD3
extra and no 4G-VAS charges) would imply that the ARPU upside could more likely
come from higher usage rather than from direct price increases – if others too rollout
similar plans. Broadband remains very competitive with declining ARPUs and there is
risk of new competition in wireless with MyRepublic could be looking to enter this space
as well.
• In South Korea, SKT and KT had a 2% mobile service revenue growth, while LGU was
stronger at 11%. With higher MVNO penetration for SKT and KT, mobile service
revenue growth is coming in lower than their mobile ARPU growth. LGU+ is less
affected by low MVNO contribution.
• Taiwan telcos had an average 2% service revenue growth – CHT up 1% and FET/TWM
up 2-3%. Though there is some decline in voice revenue, non-voice growth has held
up, driving overall revenue growth. 4G launch from the new entrant and telcos
extending promotions have raised competitive risks in the market which also could
mean that ARPU uplift would likely get delayed.
• Thailand telcos had 1% service revenue growth – AIS was flat, DTAC was down 1%
while TRUE had ~9% growth coming off a weak 2013. Within this, voice continues to
be weak for telcos – down 10% - while non-voice was stronger at a 28% average
growth. 37% of service revenue came from non-voice, we note.

Nomura | Asia telecoms 11 September 2014
43
Fig. 61: Service revenue growth – 1H13 to 1H14
Source: Company data, Nomura research
Fig. 62: Service revenue growth – June-14 quarter q-q
Source: Company data, Nomura research
Fig. 63: Service revenue growth – June-14 quarter y-y
Source: Company data, Nomura research
EBITDA trends
• Industry EBITDA rose 2% on an average. Bharti and IDEA had +20% growth in 1H. KT
Corp’s EBITDA was weak – down 51% in 1H. Maxis had a 7% EBITDA decline, but its
margins of 51% are still one of the highest in the region. ISAT had a 5% EBITDA
decline.
• On EBITDA margins, DATC had ~6pps margin improvement, while IDEA, FET, M1, AIS
and CU had +200bps margin improvement in 1H14. KT Corp had 12pps decline on the
back of weak EBITDA. XL’s margins were lower by 350bps, while Globe and PLDT
were down 260-300bps.
Marketwise
• In Australia, TLS had a 2% normalised EBITDA growth, while Optus had 1% decline.
On total margins, Telstra is stable at around 42% vs. 30% for Optus.
• Bharti and IDEA had strong EBITDA growth in India, while RCOM was weak. For IDEA,
June quarter margins rose 150bps, which were helped by SACs, which fell to 8.9% of
revenue (from 9.8% in 4Q), network opex, which fell to 24% of revenue (from 24.8% in
4Q), and roaming & access charges, which fell to 15% (from 15.8% in 4Q). Compared
to this, Bharti had 200bps margin expansion to 37% in the Indian business.
• In Indonesia, 1H EBITDA grew 2-9% for XL and TLKM, while it declined by 5% for
Indosat. During 1H, TLKM’s margins were flat y-y at 51% but XL’s and ISAT’s margins
witnessed a decline of 200-350bps y-y to 37% and 43%, respectively.
-10%
-5%
0%
5%
10%
15%
20%M
ax
is
NT
T
Do
co
mo
Op
tus
Ind
osa
t
DTA
C
Celc
om
Sta
rHub
AIS
PLD
T
CH
T
RC
OM KT
SK
T
FE
T
Sin
gT
el
TW
M
Tels
tra
DiG
i
M1
CM
Glo
be
TR
UE
KD
DI
Bhart
i
Telk
om
sel
LG
U+
CU
CT
XL
IDE
A
Mobile Service rev ex handset growth 1H14-1H13
Average growth
-6%
-4%
-2%
0%
2%
4%
6%
8%
10%
12%
14%
16%
NT
TD
oc
om
oT
RU
E
KD
DI
DT
AC
SK
TC
MC
TC
UM
ax
isP
LD
TT
WM KT
DiG
iC
elc
om
Ind
os
at
Sta
rHu
bF
ET
RC
OM
CH
TS
ingTel
Op
tus
LG
U+
AIS M1
Glo
be
Te
lko
ms
el
Bh
art
iID
EA
XL
June qtr Service rev ex handset q-q
Average growth
-10%
-5%
0%
5%
10%
15%
20%
Ma
xis
NTT
Doc
om
oIn
do
sa
tD
TA
CO
ptu
sS
tarH
ub
PLD
TC
elc
om
CH
TS
KT
RC
OM
TW
MA
ISF
ET
Sin
gT
el
KT
DiG
iG
lobe
M1
CM
KD
DI
TR
UE
L
GU
+B
ha
rti
Te
lko
ms
el
CU
CT
IDE
AX
L
June qtr mobile Service rev ex handset y-y
Average growth

Nomura | Asia telecoms 11 September 2014
44
• In Japan, KDDI had a 7% EBITDA growth with margin improvement to 32% from 30%,
while NTT’s EBITDA was down 5%.
• On EBITDA, DiGi had a 7% growth in 1H compared with 5-7% decline for Celcom and
Maxis. EBITDA margins were up slightly at ~47% on an average. TM had a strong 8%
EBITDA growth, reaffirming its cost focus.
• The Philippines telcos had weak EBITDA margins – down 260-320bps in 1H. Globe’s
overall EBITDA margins declined by 253 bps y-y. Subsidy and marketing expenses
were at 15% of service revenue vs. 13% a year ago. Despite slower net adds, SACs
were up ~30% y-y. For PLDT, wireless margins declined 477bps y-y in 1H14, though
this was only partly on account of subsidies. Subsidy + marketing expenses (in
wireless) grew 14% y-y to 14% of service revenue (12% in 1H13). In 2013, subsidy +
marketing were up to 13% from 11.6% in 2012.
• For Singapore, 1H14 industry EBITDA was down 1% - StarHub down 3%, SingTel
down 1%, while M1 had a 6% EBITDA growth;
• In South Korea, KT had ~50% EBITDA decline in 1H. This was drive by one-off cost
related to ERP cost, which reflected in 2Q. Adjusting for KRW1.05tn of ERP cost, KT’s
1H14 EBITDA declined by 9%. SKT had a 5% decline, which LGU had a 2% growth.
• Taiwan telcos had a decent EBITDA growth and margin improvement in 1H14, driven
by deferred 4G expenses. EBITDA rose 3-9%, while margins were up 40bps for TWM
and 150-200bps for CHT and FET. Nevertheless, these trends would reverse in 2H14F,
driven by higher costs of 4G and heightened competition pressure, in our view.
• Thailand - 1H14 EBITDA rose 8% for telcos with margins improving by ~300bps on an
average. AIS had 180bps EBITDA margin improvement, while DTAC had a stronger
640bps rise driven by a higher clip in regulatory cost savings. TRUE’s mobile segment,
too, saw EBITDA margin improving from sub-10% in 1H13 to ~14% now, which
suggests some stability in competition.
Fig. 64: EBITDA margins -- 1H14
Source: Company data, Nomura research
5%
10%
15%
20%
25%
30%
35%
40%
45%
50%
55%
KT
LG
U+
TR
UE
SK
T
KD
DI
NT
T
TW
M
Op
tus
CT
FE
T
Sin
gT
el
Sta
rHu
b
CU
IDE
A
TM
RC
OM
Bh
art
i
Do
co
mo
M1
CM
DT
AC XL
CH
T
Glo
be
Tels
tra
Ind
os
at
Ce
lco
m
AIS
PLD
T
DiG
i
Ma
xis
TLK
M
1H14 EBITDA margin Average margin

Nomura | Asia telecoms 11 September 2014
45
Fig. 65: EBITDA growth – 1H14
Source: Company data, Nomura research. For KT, EBITDA declined by 51% in 1H
Fig. 66: EBITDA margins change -- 1H14
Source: Company data, Nomura research. KT had ~13pps margin decline in 1H, while DTAC had 6pps improvement
ARPU and subscriber trends
• Compared to June -13, Korean telcos had the highest ARPU improvement. Indian
telcos, too, had a decent ARPU growth. Thai telcos, Globe and XL had ARPU decline
y-y.
• M1, RCOM, ISAT and IDEA had the highest sequential ARPU improvement. ARPUs
were down the most for XL, TRUE and DTAC. ~70% of telcos had sequential ARPU
improvement.
• In Japan, KDDI had a 2% mobile consumer ARPU increase and a 7% total mobile sub-
growth, while NTT’s total mobile ARPU was down 7% with a 3% sub-growth.
• Telcos have added a total of around 70mn subscribers this year to a total of 2.9bn
mobile subscribers.
• Taiwan telcos launched 4G in 2Q14 with telcos adding ~200k subscribers each within
three months of 4G launch.
• Korean telcos still lead on 4G with 33mn subscribers (59% of total mobile subscribers).
Mobile ARPU rose 5~7% in 1H14 for Korea telcos, driven by up-selling from unlimited
LTE voice/data tariff plans.
Fig. 67: Asia telcos’ subscriber trends
Source: Company data, Nomura research
Fig. 68: 2014 net adds
Source: Company data, Nomura research. Y axis capped at 12mn
-20%
-10%
0%
10%
20%
30%K
TM
ax
isD
oco
mo
Ind
os
at
RC
OM
SK
TC
elc
om
CM
PL
DT
NT
TS
tarH
ub
Op
tus
Sin
gT
el
AIS
Glo
be
CT
LG
U+
XL
Te
lstr
aC
HT
TW
MTR
UE
M
1D
iGi
TM
KD
DI
DTA
CF
ET
TL
KM
CU
Bh
art
iID
EA
Total EBITDA growth 1H14-1H13
Average growth
-500
-400
-300
-200
-100
0
100
200
300
400
500
KT
CM XL
PL
DT
Glo
be
SK
TIn
do
sat
Sin
gTe
lN
TT
CT
Doc
om
oR
CO
MK
DD
IC
elc
om
Sta
rHub
TR
UE
TM
Tels
tra
TLK
MT
WM
LG
U+
Optu
sD
iGi
Ma
xis
Bha
rti
CH
TA
ISF
ET
M1
CU
IDE
AD
TA
C
Total EBITDA margin growth (bps) 1H14-1H13
Average change
(2)
498
998
1,498
1,998
2,498
2,998
3,498
Mar 08
Jun 0
8S
ep 0
8D
ec 0
8M
ar 09
Jun 0
9S
ep 0
9D
ec 0
9M
ar 10
Jun 1
0S
ep 1
0D
ec 1
0M
ar 11
Jun 1
1S
ep 1
1D
ec 1
1M
ar 12
Jun 1
2S
ep 1
2D
ec 1
2M
ar 13
Jun 1
3S
ep 1
3D
ec 1
3M
ar 14
June 1
4
Total mobile subs (mn)
-2
0
2
4
6
8
10
12
RC
OM
CT
ISA
TP
LD
TM
ax
isM
1D
iGi
Sta
rHu
bO
ptu
sS
ingT
el
DT
AC
LG
U+
FE
TT
WM
Tels
tra
CH
TC
elc
om
TR
UE
K
T C
orp
SK
TD
oc
om
oK
DD
IA
IS XL
Glo
be
TLK
MID
EA
Bhart
iC
UC
M2014 net adds (mn)

Nomura | Asia telecoms 11 September 2014
46
Earnings trends
• Adjusted earnings rose 1% on an average in 1H14. Indian telcos had the highest NPAT
growth coming from a weaker 2013. KT, XL and ISAT were at the bottom.
• Earnings of South Korea telcos fell by 98% y-y in 1H14 on the back of: 1) KT's one-off
ERP cost in 2Q; 2) LGU+’s one-off additional corporate tax in 1Q; and 3) overall poor
recurring profits due to heavy marketing expense during 1H14.
• Around 80% of telcos had negative consensus EPS revisions. Highest revisions were
seen for KT Corp, XL and ISAT. DiGi, TM, KDDI and NTT had positive consensus
earnings revisions this year.
• In Australia, TLS had a 5% growth, while Optus had a 2% decline.
• Thai telcos had ~12% negative consensus EPS revisions YTD. In 1H14, earnings were
flat for DTAC and down 6% for AIS.
• In Taiwan, consensus downward EPS revisions were at 5-9%. 1H14 trends, however,
were better (no impact of 4G) and earnings rose 5-11%. However, telcos are guiding
for EPS declines in 2H14.
• In the Philippines, Globe had strong earnings growth – up 18%. PLDT was up 2%.
• In Singapore, SingTel had a 3% earnings decline compared with an 8% for StarHub.
M1 had an 8% growth in 1H.
Fig. 69: Adjusted earnings growth – 1H14-1H13
Source: Company data, Nomura research; Y axis capped at +/-50%
Fig. 70: Reported earnings growth – 1H14-1H13
Source: Company data, Nomura research. Y axis capped at +/-50%
-50%
-40%
-30%
-20%
-10%
0%
10%
20%
30%
40%
50%
KT
XL
Indo
sat
Doc
om
oTM
CM
Sta
rHub
Ma
xis
Ax
iata
SK
TA
ISS
ing
Te
lO
ptu
sD
TA
CP
LD
TN
TT
CH
TT
els
tra
TW
MTLK
MM
1F
ET
CT
Glo
be
DiG
iC
UK
DD
IID
EA
Bha
rti
RC
OM
1H14-1H13 adjusted NPAT growth
Average earnings growth
-50%
-40%
-30%
-20%
-10%
0%
10%
20%
30%
40%
50%LG
U+
RC
OM
Doc
om
o
Ax
iata
CM
Sta
rHu
b
Ma
xis
Op
tus
AIS
SK
T
Sin
gT
el
TM
NT
T
TLK
M
DT
AC
CH
T
TW
M
M1
FE
T
CT
PLD
T
Tels
tra
CU
KD
DI
DiG
i
IDE
A
Bh
art
i
Glo
be
1H14 % chg Average earnings growth

Nomura | Asia telecoms 11 September 2014
47
Appendix A-1
Analyst Certification
I, Sachin Gupta, hereby certify (1) that the views expressed in this Research report accurately reflect my personal views about
any or all of the subject securities or issuers referred to in this Research report, (2) no part of my compensation was, is or will be
directly or indirectly related to the specific recommendations or views expressed in this Research report and (3) no part of my
compensation is tied to any specific investment banking transactions performed by Nomura Securities International, Inc.,
Nomura International plc or any other Nomura Group company.
Issuer Specific Regulatory Disclosures
The term "Nomura Group" used herein refers to Nomura Holdings, Inc. or any of its affiliates or subsidiaries, and may refer to one or more
Nomura Group companies.
Materially mentioned issuers
Issuer Ticker Price Price date Stock rating Previous rating Date of change Sector rating
SK Telecom 017670 KS KRW 286,500 08-Sep-2014 Buy Strong Buy 02-Dec-2008 N/A
KT Corp 030200 KS KRW 35,750 08-Sep-2014 Neutral Buy 06-Jan-2012 N/A
LG Uplus Corp. 032640 KS KRW 12,100 08-Sep-2014 Buy Neutral 06-Jan-2012 N/A
Chunghwa Telecom 2412 TT TWD 91.9 10-Sep-2014 Neutral Buy 22-Jul-2011 N/A
Taiwan Mobile 3045 TT TWD 91.0 10-Sep-2014 Neutral Buy 09-Sep-2014 N/A
Far EasTone Telecom 4904 TT TWD 59.0 10-Sep-2014 Reduce Neutral 09-Sep-2014 N/A
China Telecom 728 HK HKD 4.99 10-Sep-2014 Neutral Buy 08-Jan-2014 N/A
China Unicom 762 HK HKD 13.44 10-Sep-2014 Buy Neutral 11-Feb-2010 N/A
China Mobile 941 HK HKD 98.70 10-Sep-2014 Buy Neutral 03-Jun-2014 N/A
Nippon Telegraph and Telephone 9432 JP JPY 7,060 10-Sep-2014 Buy Neutral 12-Apr-2013 N/A
KDDI 9433 JP JPY 6,305 10-Sep-2014 Buy Neutral 07-Sep-2012 N/A
NTT Docomo 9437 JP JPY 1,862.0 10-Sep-2014 Buy Neutral 25-Jul-2014 N/A
Advanced Info Service ADVANC TB THB 209.00 10-Sep-2014 Buy Not Rated 23-Aug-2012 N/A
Axiata Group Berhad AXIATA MK MYR 6.95 10-Sep-2014 Buy Neutral 11-Sep-2012 N/A
Bharti Airtel BHARTI IN INR 407 10-Sep-2014 Buy Neutral 06-Sep-2013 N/A
Bharti Infratel BHIN IN INR 284 10-Sep-2014 Buy Not Rated 21-Apr-2014 N/A
DiGi.Com DIGI MK MYR 5.85 10-Sep-2014 Neutral Buy 23-Jul-2012 N/A
Total Access
Communication DTAC TB THB 105.00 10-Sep-2014 Buy Not Rated 23-Aug-2012 N/A
XL Axiata EXCL IJ IDR 6,625 10-Sep-2014 Buy Neutral 27-Jun-2013 N/A
Globe Telecom GLO PM PHP 1,899.00 10-Sep-2014 Reduce Neutral 04-Sep-2014 N/A
Idea Cellular IDEA IN INR 170 10-Sep-2014 Neutral Reduce 14-Jan-2014 N/A
Indosat ISAT IJ IDR 3,950 10-Sep-2014 Neutral Buy 01-Nov-2013 N/A
M1 M1 SP SGD 3.67 10-Sep-2014 Neutral Buy 02-Sep-2014 N/A
Maxis Communications MAXIS MK MYR 6.49 10-Sep-2014 Reduce Neutral 11-Sep-2012 N/A
Reliance Communications RCOM IN INR 111 10-Sep-2014 Neutral Reduce 08-Sep-2011 N/A
Singapore Telecom ST SP SGD 3.90 10-Sep-2014 Buy Neutral 30-Nov-2012 N/A
StarHub STH SP SGD 4.12 10-Sep-2014 Neutral Reduce 07-Aug-2013 N/A
Telekom Malaysia T MK MYR 6.41 10-Sep-2014 Buy Neutral 14-Jan-2014 N/A
Tower Bersama
Infrastructure TBIG IJ IDR 8,300 10-Sep-2014 Neutral Buy 13-Aug-2014 N/A
Philippine Long Distance
Telephone TEL PM
PHP
3,378.00 10-Sep-2014 Reduce Neutral 04-Sep-2014 N/A
Telkom Indonesia TLKM IJ IDR 2,810 10-Sep-2014 Neutral Buy 24-Feb-2012 N/A
Telstra Corporation TLS AU AUD 5.62 10-Sep-2014 Buy Neutral 13-Feb-2014 N/A
Sarana Menara Nusantara TOWR IJ IDR 3,905 10-Sep-2014 Buy Not Rated 11-Apr-2012 N/A
Important Disclosures Online availability of research and conflict-of-interest disclosures Nomura research is available on www.nomuranow.com/research, Bloomberg, Capital IQ, Factset, MarkitHub, Reuters and ThomsonOne. Important disclosures may be read at http://go.nomuranow.com/research/globalresearchportal/pages/disclosures/disclosures.aspx or requested from Nomura Securities International, Inc., on 1-877-865-5752. If you have any difficulties with the website, please email [email protected] for help.

Nomura | Asia telecoms 11 September 2014
48
The analysts responsible for preparing this report have received compensation based upon various factors including the firm's total revenues, a portion of which is generated by Investment Banking activities. Unless otherwise noted, the non-US analysts listed at the front of this report are
not registered/qualified as research analysts under FINRA/NYSE rules, may not be associated persons of NSI, and may not be subject to FINRA Rule 2711 and NYSE Rule 472 restrictions on communications with covered companies, public appearances, and trading securities held by a research analyst account.
Nomura Global Financial Products Inc. (“NGFP”) Nomura Derivative Products Inc. (“NDPI”) and Nomura International plc. (“NIplc”) are
registered with the Commodities Futures Trading Commission and the National Futures Association (NFA) as swap dealers. NGFP, NDPI, and NIplc are generally engaged in the trading of swaps and other derivative products, any of which may be the subject of this report. Any authors named in this report are research analysts unless otherwise indicated. Industry Specialists identified in some Nomura International
plc research reports are employees within the Firm who are responsible for the sales and trading effort in the sector for which they have coverage. Industry Specialists do not contribute in any manner to the content of research reports in which their names appear. Distribution of ratings (Global) The distribution of all ratings published by Nomura Global Equity Research is as follows: 47% have been assigned a Buy rating which, for purposes of mandatory disclosures, are classified as a Buy rating; 41% of companies with this rating are investment banking clients of the Nomura Group*. 43% have been assigned a Neutral rating which, for purposes of mandatory disclosures, is classified as a Hold rating; 54% of companies with
this rating are investment banking clients of the Nomura Group*. 10% have been assigned a Reduce rating which, for purposes of mandatory disclosures, are classified as a Sell rating; 24% of companies with this rating are investment banking clients of the Nomura Group*. As at 30 June 2014. *The Nomura Group as defined in the Disclaimer section at the end of this report. Explanation of Nomura's equity research rating system in Europe, Middle East and Africa, US and Latin America, and Japan and Asia ex-Japan from 21 October 2013 The rating system is a relative system, indicating expected performance against a specific benchmark identified for each individual stock, subject to limited management discretion. An analyst’s target price is an assessment of the current intrinsic fair value of the stock based on an appropriate valuation methodology determined by the analyst. Valuation methodologies include, but are not limited to, discounted cash flow
analysis, expected return on equity and multiple analysis. Analysts may also indicate expected absolute upside/downside relative to the stated target price, defined as (target price - current price)/current price.
STOCKS A rating of 'Buy', indicates that the analyst expects the stock to outperform the Benchmark over the next 12 months. A rating of 'Neutral', indicates that the analyst expects the stock to perform in line with the Benchmark over the next 12 months. A rating of 'Reduce', indicates that
the analyst expects the stock to underperform the Benchmark over the next 12 months. A rating of 'Suspended', indicates that the rating, target price and estimates have been suspended temporarily to comply with applicable regulations and/or firm policies. Securities and/or companies that are labelled as 'Not rated' or shown as 'No rating' are not in regular research coverage. Investors should not expect continuing or
additional information from Nomura relating to such securities and/or companies. Benchmarks are as follows: United States/Europe/Asia ex-Japan: please see valuation methodologies for explanations of relevant benchmarks for stocks, which can be accessed at: http://go.nomuranow.com/research/globalresearchportal/pages/disclosures/disclosures.aspx; Global Emerging Markets (ex-Asia): MSCI
Emerging Markets ex-Asia, unless otherwise stated in the valuation methodology; Japan: Russell/Nomura Large Cap.
SECTORS A 'Bullish' stance, indicates that the analyst expects the sector to outperform the Benchmark during the next 12 months. A 'Neutral' stance, indicates that the analyst expects the sector to perform in line with the Benchmark during the next 12 months. A 'Bearish' stance, indicates that the analyst expects the sector to underperform the Benchmark during the next 12 months. Sectors that are labelled as 'Not rated' or shown as
'N/A' are not assigned ratings. Benchmarks are as follows: United States: S&P 500; Europe: Dow Jones STOXX 600; Global Emerging Markets (ex-Asia): MSCI Emerging Markets ex-Asia. Japan/Asia ex-Japan: Sector ratings are not assigned.
Explanation of Nomura's equity research rating system in Japan and Asia ex-Japan prior to 21 October 2013 STOCKS Stock recommendations are based on absolute valuation upside (downside), which is defined as (Target Price - Current Price) / Current Price,
subject to limited management discretion. In most cases, the Target Price will equal the analyst's 12-month intrinsic valuation of the stock, based on an appropriate valuation methodology such as discounted cash flow, multiple analysis, etc. A 'Buy' recommendation indicates that potential upside is 15% or more. A 'Neutral' recommendation indicates that potential upside is less than 15% or downside is less than 5%. A
'Reduce' recommendation indicates that potential downside is 5% or more. A rating of 'Suspended' indicates that the rating and target price have been suspended temporarily to comply with applicable regulations and/or firm policies in certain circumstances including when Nomura is acting in an advisory capacity in a merger or strategic transaction involving the subject company. Securities and/or companies that are labelled
as 'Not rated' or shown as 'No rating' are not in regular research coverage of the Nomura entity identified in the top banner. Investors should not expect continuing or additional information from Nomura relating to such securities and/or companies.
SECTORS A 'Bullish' rating means most stocks in the sector have (or the weighted average recommendation of the stocks under coverage is) a positive absolute recommendation. A 'Neutral' rating means most stocks in the sector have (or the weighted average recommendation of the stocks
under coverage is) a neutral absolute recommendation. A 'Bearish' rating means most stocks in the sector have (or the weighted average recommendation of the stocks under coverage is) a negative absolute recommendation. Target Price

Nomura | Asia telecoms 11 September 2014
49
A Target Price, if discussed, reflects in part the analyst's estimates for the company's earnings. The achievement of any target price may be impeded by general market and macroeconomic trends, and by other risks related to the company or the market, and may not occur if the company's earnings differ from estimates. Disclaimers This document contains material that has been prepared by the Nomura entity identified on page 1 and/or with the sole or joint contributions of one or more Nomura entities whose employees and their respective affiliations are also specified on page 1 or identified elsewhere in the
document. The term "Nomura Group" used herein refers to Nomura Holdings, Inc. or any of its affiliates or subsidiaries and may refer to one or more Nomura Group companies including: Nomura Securities Co., Ltd. ('NSC') Tokyo, Japan; Nomura International plc ('NIplc'), UK; Nomura Securities International, Inc. ('NSI'), New York, US; Nomura International (Hong Kong) Ltd. (‘NIHK’), Hong Kong; Nomura Financial Investment
(Korea) Co., Ltd. (‘NFIK’), Korea (Information on Nomura analysts registered with the Korea Financial Investment Association ('KOFIA') can be found on the KOFIA Intranet at http://dis.kofia.or.kr); Nomura Singapore Ltd. (‘NSL’), Singapore (Registration number 197201440E, regulated by the Monetary Authority of Singapore); Nomura Australia Ltd. (‘NAL’), Australia (ABN 48 003 032 513), regulated by the Austral ian Securities and
Investment Commission ('ASIC') and holder of an Australian financial services licence number 246412; P.T. Nomura Indonesia (‘PTNI’), Indonesia; Nomura Securities Malaysia Sdn. Bhd. (‘NSM’), Malaysia; NIHK, Taipei Branch (‘NITB’), Taiwan; Nomura Financial Adv isory and Securities (India) Private Limited (‘NFASL’), Mumbai, India (Registered Address: Ceejay House, Level 11, Plot F, Shivsagar Estate, Dr. Annie
Besant Road, Worli, Mumbai- 400 018, India; Tel: +91 22 4037 4037, Fax: +91 22 4037 4111; CIN No : U74140MH2007PTC169116, SEBI Registration No: BSE INB011299030, NSE INB231299034, INF231299034, INE 231299034, MCX: INE261299034) and NIplc, Madrid Branch (‘NIplc, Madrid’). ‘CNS Thailand’ next to an analyst’s name on the front page of a research report indicates that the analyst is employed by
Capital Nomura Securities Public Company Limited (‘CNS’) to provide research assistance services to NSL under a Research Assistance Agreement. THIS MATERIAL IS: (I) FOR YOUR PRIVATE INFORMATION, AND WE ARE NOT SOLICITING ANY ACTION BASED UPON IT; (II) NOT TO
BE CONSTRUED AS AN OFFER TO SELL OR A SOLICITATION OF AN OFFER TO BUY ANY SECURITY IN ANY JURISDICTION WHERE SUCH OFFER OR SOLICITATION WOULD BE ILLEGAL; AND (III) BASED UPON INFORMATION FROM SOURCES THAT WE CONSIDER RELIABLE, BUT HAS NOT BEEN INDEPENDENTLY VERIFIED BY NOMURA GROUP. Nomura Group does not warrant or represent that the document is accurate, complete, reliable, fit for any particular purpose or merchantable and does not accept liability for any act (or decision not to act) resulting from use of this document and related data. To the maximum extent permissible all warranties and other assurances by Nomura group are hereby excluded and Nomura Group shall have no liability for the use,
misuse, or distribution of this information. Opinions or estimates expressed are current opinions as of the original publication date appearing on this material and the information, including the opinions and estimates contained herein, are subject to change without notice. Nomura Group is under no duty to update th is document.
Any comments or statements made herein are those of the author(s) and may differ from views held by other parties within Nomura Group. Clients should consider whether any advice or recommendation in this report is suitable for their particular circumstances and, if appropriate, seek professional advice, including tax advice. Nomura Group does not provide tax advice. Nomura Group, and/or its officers, directors and employees, may, to the extent permitted by applicable law and/or regulation, deal as principal, agent, or otherwise, or have long or short positions in, or buy or sell, the securities, commodities or instruments, or options or other derivative instruments based thereon, of issuers or securities mentioned herein. Nomura Group companies may also act as market maker or liquidity
provider (within the meaning of applicable regulations in the UK) in the financial instruments of the issuer. Where the activity of market maker is carried out in accordance with the definition given to it by specific laws and regulations of the US or other jurisdictions, this will be separately disclosed within the specific issuer disclosures. This document may contain information obtained from third parties, including ratings from credit ratings agencies such as Standard & Poor’s. Reproduction and distribution of third-party content in any form is prohibited except with the prior written permission of the related third-party. Third-party content providers do not guarantee the accuracy, completeness, timeliness or availability of any information, including ratings, and
are not responsible for any errors or omissions (negligent or otherwise), regardless of the cause, or for the results obtained from the use of such content. Third-party content providers give no express or implied warranties, including, but not limited to, any warranties of merchantability or fitness for a particular purpose or use. Third-party content providers shall not be liable for any direct, indirect, incidental, exemplary,
compensatory, punitive, special or consequential damages, costs, expenses, legal fees, or losses (including lost income or profits and opportunity costs) in connection with any use of their content, including ratings. Credit ratings are statements of opinions and are not statements of fact or recommendations to purchase hold or sell securities. They do not address the suitability of securities or the suitability of securities for
investment purposes, and should not be relied on as investment advice. Any MSCI sourced information in this document is the exclusive property of MSCI Inc. (‘MSCI’). Without prior written permission of MSCI, this information and any other MSCI intellectual property may not be reproduced, re-disseminated or used to create any financial products, including any indices. This information is provided on an "as is" basis. The user assumes the entire risk of any use made of this information. MSCI, its
affiliates and any third party involved in, or related to, computing or compiling the information hereby expressly disclaim all warranties of originality, accuracy, completeness, merchantability or fitness for a particular purpose with respect to any of this informat ion. Without limiting any of the foregoing, in no event shall MSCI, any of its affiliates or any third party involved in, or related to, computing or compiling the information
have any liability for any damages of any kind. MSCI and the MSCI indexes are services marks of MSCI and its affiliates. Russell/Nomura Japan Equity Indexes are protected by certain intellectual property rights of Nomura Securities Co., Ltd. and Russell Investments. Nomura Securities Co., Ltd. and Russell Investments do not guarantee the accuracy, completeness, reliability, or usefulness
thereof and do not account for business activities and services that any index user and its affiliates undertake with the use of the Indexes. Investors should consider this document as only a single factor in making their investment decision and, as such, the report should not be viewed as identifying or suggesting all risks, direct or indirect, that may be associated with any investment decision. Nomura Group produces a
number of different types of research product including, among others, fundamental analysis and quantitative analysis; recommendations contained in one type of research product may differ from recommendations contained in other types of research product, whether as a result of differing time horizons, methodologies or otherwise. Nomura Group publishes research product in a number of different ways including the
posting of product on Nomura Group portals and/or distribution directly to clients. Different groups of clients may receive different products and services from the research department depending on their individual requirements. Figures presented herein may refer to past performance or simulations based on past performance which are not reliable indicators of future
performance. Where the information contains an indication of future performance, such forecasts may not be a reliable indicator of future performance. Moreover, simulations are based on models and simplifying assumptions which may oversimplify and not reflect the future distribution of returns. Certain securities are subject to fluctuations in exchange rates that could have an adverse effect on the value or price of, or income derived from, the investment. The securities described herein may not have been registered under the US Securities Act of 1933 (the ‘1933 Act’), and, in such case, may not
be offered or sold in the US or to US persons unless they have been registered under the 1933 Act, or except in compliance wi th an exemption from the registration requirements of the 1933 Act. Unless governing law permits otherwise, any transaction should be executed via a Nomura entity in your home jurisdiction.

Nomura | Asia telecoms 11 September 2014
50
This document has been approved for distribution in the UK and European Economic Area as investment research by NIplc. NIplc is authorised by the Prudential Regulation Authority and regulated by the Financial Conduct Authority and the Prudential Regulation Authority. NIplc is a member of the London Stock Exchange. This document does not constitute a personal recommendation within the meaning of applic able
regulations in the UK, or take into account the particular investment objectives, financial situations, or needs of individual investors. This document is intended only for investors who are 'eligible counterparties' or 'professional clients' for the purposes of applicable regulations in the UK, and may not, therefore, be redistributed to persons who are 'retail clients' for such purposes. This document has been approved by NIHK,
which is regulated by the Hong Kong Securities and Futures Commission, for distribution in Hong Kong by NIHK. This document has been approved for distribution in Australia by NAL, which is authorized and regulated in Australia by the ASIC. This document has also been approved for distribution in Malaysia by NSM. In Singapore, this document has been distributed by NSL. NSL accepts legal responsibility for the
content of this document, where it concerns securities, futures and foreign exchange, issued by their foreign affiliates in respect of recipients who are not accredited, expert or institutional investors as defined by the Securities and Futures Act (Chapter 289). Recipients of this document in Singapore should contact NSL in respect of matters arising from, or in connection with, this document. Unless prohibited by the provisions of
Regulation S of the 1933 Act, this material is distributed in the US, by NSI, a US-registered broker-dealer, which accepts responsibility for its contents in accordance with the provisions of Rule 15a-6, under the US Securities Exchange Act of 1934. The entity that prepared this document permits its separately operated affiliates within the Nomura Group to make copies of such documents available to their clients. This document has not been approved for distribution to persons other than ‘Authorised Persons’, ‘Exempt Persons’ or ‘Institutions’ (as defined by the Capital Markets Authority) in the Kingdom of Saudi Arabia (‘Saudi Arabia’) or 'professional clients' (as defined by the Dubai Financial Services Authority) in the United Arab Emirates (‘UAE’) or a ‘Market Counterparty’ or ‘Business Customers’ (as defined by the Qatar Financial
Centre Regulatory Authority) in the State of Qatar (‘Qatar’) by Nomura Saudi Arabia, NIplc or any other member of Nomura Group, as the case may be. Neither this document nor any copy thereof may be taken or transmitted or distributed, directly or indirectly, by any person other than those authorised to do so into Saudi Arabia or in the UAE or in Qatar or to any person other than ‘Authorised Persons’, ‘Exempt Persons’ or
‘Institutions’ located in Saudi Arabia or 'professional clients' in the UAE or a ‘Market Counterparty’ or ‘Business Customers’ in Qatar . By accepting to receive this document, you represent that you are not located in Saudi Arabia or that you are an ‘Authorised Person’, an ‘Exempt Person’ or an ‘Institution’ in Saudi Arabia or that you are a 'professional client' in the UAE or a ‘Market Counterparty’ or ‘Business Customers’ in
Qatar and agree to comply with these restrictions. Any failure to comply with these restrictions may constitute a violation of the laws of the UAE or Saudi Arabia or Qatar. NO PART OF THIS MATERIAL MAY BE (I) COPIED, PHOTOCOPIED, OR DUPLICATED IN ANY FORM, BY ANY MEANS; OR (II) REDISTRIBUTED WITHOUT THE PRIOR WRITTEN CONSENT OF A MEMBER OF NOMURA GROUP. If this document has been distributed
by electronic transmission, such as e-mail, then such transmission cannot be guaranteed to be secure or error-free as information could be intercepted, corrupted, lost, destroyed, arrive late or incomplete, or contain viruses. The sender therefore does not accept liability for any errors or omissions in the contents of this document, which may arise as a result of electronic transmission. If verification is required, please request a
hard-copy version. Nomura Group manages conflicts with respect to the production of research through its compliance policies and procedures (including, but not limited to, Conflicts of Interest, Chinese Wall and Confidentiality policies) as well as through the maintenance of Chinese walls and employee training. Additional information is available upon request and disclosure information is available at the Nomura Disclosure web page: http://go.nomuranow.com/research/globalresearchportal/pages/disclosures/disclosures.aspx Copyright © 2014 Nomura International (Hong Kong) Ltd. All rights reserved.