Embed Size (px)
Citation preview
8/6/2019 Asia Pacific Office Q1 2011 | Colliers International Thailand
http://slidepdf.com/reader/full/asia-pacific-office-q1-2011-colliers-international-thailand 1/24
AsiA PAciicOice Market Overview
1Q 2011
Accelerating success.
8/6/2019 Asia Pacific Office Q1 2011 | Colliers International Thailand
http://slidepdf.com/reader/full/asia-pacific-office-q1-2011-colliers-international-thailand 2/24
table O cOntentsAsiA PAciic oice mArket overview | 1Q 2011
rgna o 3
Ga chna 4-6
Beijing, China ....................................................................................................................................
Chengdu, China .................................................................................................................................
Guangzhou, China .............................................................................................................................
Shanghai, China ................................................................................................................................
Hong Kong SAR, China .....................................................................................................................Taipei, Taiwan ...................................................................................................................................
Nh Aa 7
Seoul, South Korea ...........................................................................................................................
Tokyo, Japan ........................ ....................... ........................ ....................... ........................ ...............
sha Aa 8-10
Jakarta, Indonesia ........................ ....................... ....................... ........................ ........................ .......
Kuala Lumpur, Malaysia ....................................................................................................................
Manila, Philippines ............................................................................................................................
Singapore ..........................................................................................................................................
Bangkok, Thailand ........................ ....................... ....................... ........................ ........................ ..... Ho Chi Minh City, Vietnam ...................... ........................ ....................... ........................ .................
inda 11-12
Bengaluru (Bangalore) ....................................................................................................................
Chennai ............................................................................................................................................
Mumbai ..................... ....................... ........................ ....................... ........................ ....................... ..
New Delhi ..................... ........................ ....................... ....................... ........................ .....................
Aaaa 13-16
Adelaide, Australia ...................... ........................ ....................... ........................ ....................... ......
Brisbane, Australia ...................... ....................... ........................ ....................... ........................ .....
Canberra, Australia ...................... ....................... ....................... ........................ ........................ ..... Melbourne, Australia ....................... ........................ ........................ ....................... ........................ .
Perth, Australia ........................ ....................... ........................ ....................... ........................ .........
Sydney, Australia ..................... ....................... ........................ ....................... ........................ .........
Auckland, New Zealand ....................... ....................... ........................ ....................... .....................
Wellington, New Zealand ..................... ....................... ........................ ....................... .....................
P o rna 17
tnd & a 18-19
Dfnn & tng 20-21
cna 22-23
8/6/2019 Asia Pacific Office Q1 2011 | Colliers International Thailand
http://slidepdf.com/reader/full/asia-pacific-office-q1-2011-colliers-international-thailand 3/24colliers iNterNAtioNAl | P. 3
regiOnal Overview
Fundamentally, overall oce demand in the region remained positive in Q , thanks to theabundant liquidity, the proactive measures by various governments to spur their economies
and the expansion needs rom a range o companies in the private sector. However, the
relaxed monetary measures adopted by the major central banks in the United States and
Europe have been criticised or creating unwanted price rises o commodities and other
actors o input, thus leading to growing inationary pressures. In view o the imminent
inationary threat, a number o central banks in Asia have made pre-emptive moves by
raising their interest rates. For example, as o Q , People’s Bank o China (PBOC) has
made our hikes since October , accounting or basis points.
sAles mArketNotwithstanding the recent interest rises, investment demand or oce real estate remained
strong in Q . Firstly, the potential capital appreciation remained promising, given the
continued rental catch-up in the market. Secondly, investors were encouraged by the
sustained low cost borrowing in Q . Lately, the U.S. Federal Reserve reiterated that
interest rates will stay low or an extended period, although the second stage o quantitative
easing is going to end in mid-.
Buoyed by strong investment demand, individual centres such as Hong Kong and Taipei
has seen their oce values reach new highs in Q . In addition, end-users remained
keen in acquiring their oce buildings or owner-occupation. In Beijing, China Minmetals
Corporation conrmed the expenditure o RMB. billion (US$ million) in acquiring Fith
Square or its oce building. In Shanghai, companies purchased strata oce oors suchas Shanghai World Financial Centre to accommodate their business needs.
leAsiNG treNDsOn the leasing ront, although the individual centres are going to see an increase o three to
our times o new supply in , oce rentals remained rm, thanks to the positive business
condence and encouraging pre-commitment rate or a number o new developments. Due
to the availability o new supply, companies took advantage o the current market conditions
to expand their overall requirements and upgrade their oces or quality development. For
example, in Singapore, BNP Paribas doubled its requirements at Ocean Financial Centre
rom , sq t to about , sq t in Q . Underpinned by the solid occupational
demand, the average oce rental in the region edge up urther by .% QoQ in Q .
mArket outlookLooking ahead, the prospective impact created by growing ination pressure is going to be the
key uncertainty envisaged by most players in the oce market. According to our research,
urther rental growth and capital growth in is anticipated. However, individual centres
with major developments due or completion in will provide a window o opportunity
or tenants going or corporate relocation and upgrading over the near to medium term.
In particular, seismic concerns in Japan are expected to prompt more tenants to go or
newer developments.
8/6/2019 Asia Pacific Office Q1 2011 | Colliers International Thailand
http://slidepdf.com/reader/full/asia-pacific-office-q1-2011-colliers-international-thailand 4/24P. 4 | colliers iNterNAtioNAl
asia pacific office market overview | 1Q 2011
cHiNA
Beijing
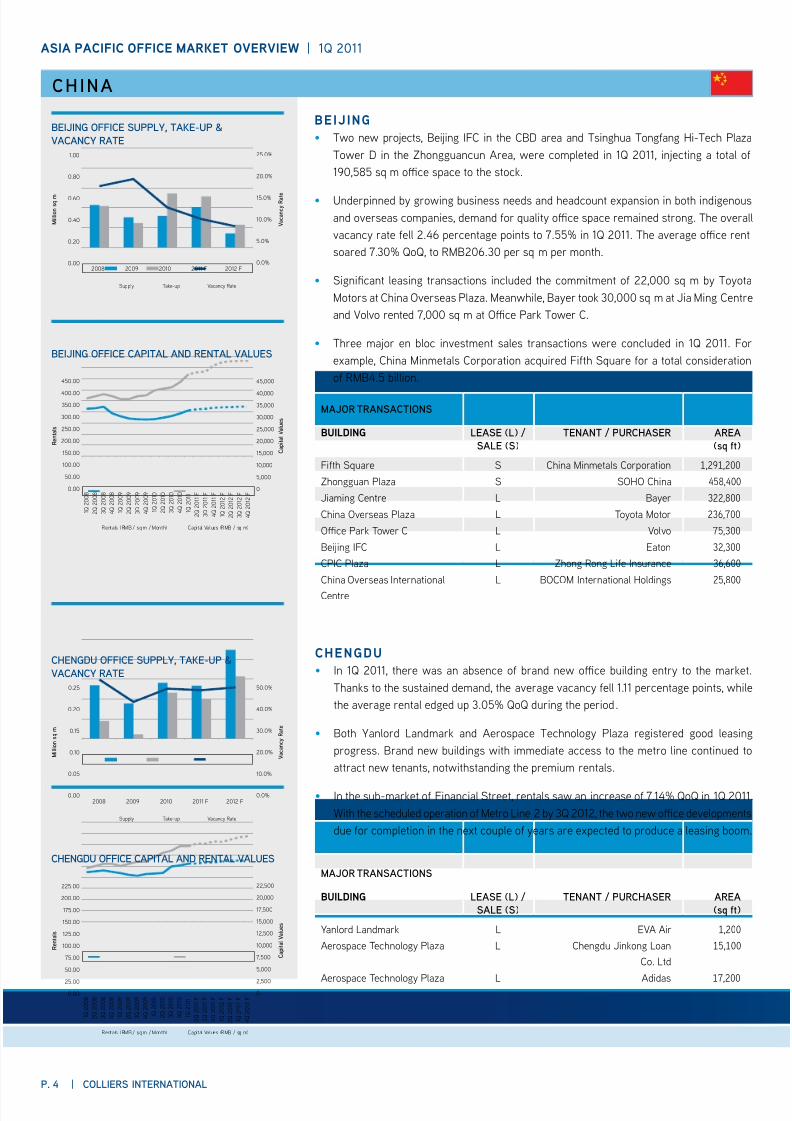
• Two new projects, Beijing IFC in the CBD area and Tsinghua Tongang Hi-Tech Plaza
Tower D in the Zhongguancun Area, were completed in Q , injecting a total o
, sq m oce space to the stock.
• Underpinned by growing business needs and headcount expansion in both indigenous
and overseas companies, demand or quality oce space remained strong. The overall
vacancy rate ell . percentage points to .% in Q . The average oce rent
soared .% QoQ, to RMB. per sq m per month.
• Signicant leasing transactions included the commitment o , sq m by Toyota
Motors at China Overseas Plaza. Meanwhile, Bayer took , sq m at Jia Ming Centre
and Volvo rented , sq m at Oce Park Tower C.
• Three major en bloc investment sales transactions were concluded in Q . For
example, China Minmetals Corporation acquired Fith Square or a total consideration
o RMB. billion.
mAjor trANsActioNs
Building leAse (l) /sAle (s)
teNANt / PurcHAser AreA(q )
Fith Square S China Minmetals Corporation 1,291,200
Zhongguan Plaza S SOHO China 458,400
Jiaming Centre L Bayer 322,800
China Overseas Plaza L Toyota Motor 236,700
Oce Park Tower C L Volvo 75,300
Beijing IFC L Eaton 32,300
CPIC Plaza L Zhong Rong Lie Insurance 36,600
China Overseas International
Centre
L BOCOM International Holdings 25,800
1 Q 2
0 0 8
2 Q 2
0 0 8
3 Q 2
0 0 8
4 Q 2
0 0 8
1 Q 2
0 0 9
2 Q 2
0 0 9
3 Q 2
0 0 9
4 Q 2
0 0 9
1 Q 2
0 1 0
2 Q 2
0 1 0
3 Q 2
0 1 0
4 Q 2
0 1 0
1 Q 2
0 1 1
2 Q 2
0 1 1 F
3 Q 2
0 1 1 F
4 Q 2
0 1 1 F
1 Q 2
0 1 2
F
2 Q 2
0 1 2
F
3 Q 2
0 1 2
F
4 Q 2
0 1 2
F0
5,000
10,000
15,000
20,000
25,000
30,000
35,000
40,000
45,000
0.00
50.00
100.00
150.00
200.00
250.00
300.00
350.00
400.00
450.00
Rentals (RMB / sq m / Month) Capital Values (RMB / sq m)
R e n t a l s
C a p i t a l V a l u e s
BEIJING OFFICE CAPITAL AND RENTAL VALUES
2008 2009 2010 2011 F 2012 F0.00
0.20
0.40
0.60
0.80
1.00
M i l l i o n s q m
0.0%
5.0%
10.0%
15.0%
20.0%
25.0%
V a c a n c y R a t e
Supply Take-up Vacancy Rate
BEIJING OFFICE SUPPLY, TAKE-UP &
VACANCY RATE
1 Q 2
0 0 8
2 Q 2
0 0 8
3 Q 2
0 0 8
4 Q 2
0 0 8
1 Q 2
0 0 9
2 Q 2
0 0 9
3 Q 2
0 0 9
4 Q 2
0 0 9
1 Q 2
0 1 0
2 Q 2
0 1 0
3 Q 2
0 1 0
4 Q 2
0 1 0
1 Q 2
0 1 1
2 Q 2
0 1 1 F
3 Q 2
0 1 1 F
4 Q 2
0 1 1 F
1 Q 2
0 1 2
F
2 Q 2
0 1 2
F
3 Q 2
0 1 2
F
4 Q 2
0 1 2
F0.00
25.00
50.00
75.00
100.00
125.00
150.00
175.00
200.00
225.00
R e n t a l s
0
2,500
5,000
7,500
10,000
12,500
15,000
17,500
20,000
22,500
C a p i t a l V a l u e s
Rentals (RMB / sq m / Month) Capital Values (RMB / sq m)
CHENGDU OFFICE CAPITAL AND RENTAL VALUES
CHENGDU OFFICE SUPPLY, TAKE-UP &
VACANCY RATE
2008 2009 2010 2011 F 2012 F0.00
0.05
0.10
0.15
0.20
0.25
M i l l i o n s q m
0.0%
10.0%
20.0%
30.0%
40.0%
50.0%
V a c a n c y R a t e
Supply Take-up Vacancy Rate
chengdu
• In Q , there was an absence o brand new oce building entry to the market.
Thanks to the sustained demand, the average vacancy ell . percentage points, while
the average rental edged up .% QoQ during the period.
• Both Yanlord Landmark and Aerospace Technology Plaza registered good leasing
progress. Brand new buildings with immediate access to the metro line continued to
attract new tenants, notwithstanding the premium rentals.
• In the sub-market o Financial Street, rentals saw an increase o .% QoQ in Q .
With the scheduled operation o Metro Line by Q , the two new oce developments
due or completion in the next couple o years are expected to produce a leasing boom.
mAjor trANsActioNs
Building leAse (l) /sAle (s)
teNANt / PurcHAser AreA(q )
Yanlord Landmark L EVA Air 1,200
Aerospace Technology Plaza L Chengdu Jinkong Loan
Co. Ltd
15,100
Aerospace Technology Plaza L Adidas 17,200
8/6/2019 Asia Pacific Office Q1 2011 | Colliers International Thailand
http://slidepdf.com/reader/full/asia-pacific-office-q1-2011-colliers-international-thailand 5/24
asia pacific office market overview | 1Q 2011
colliers iNterNAtioNAl | P. 5
guangzhou
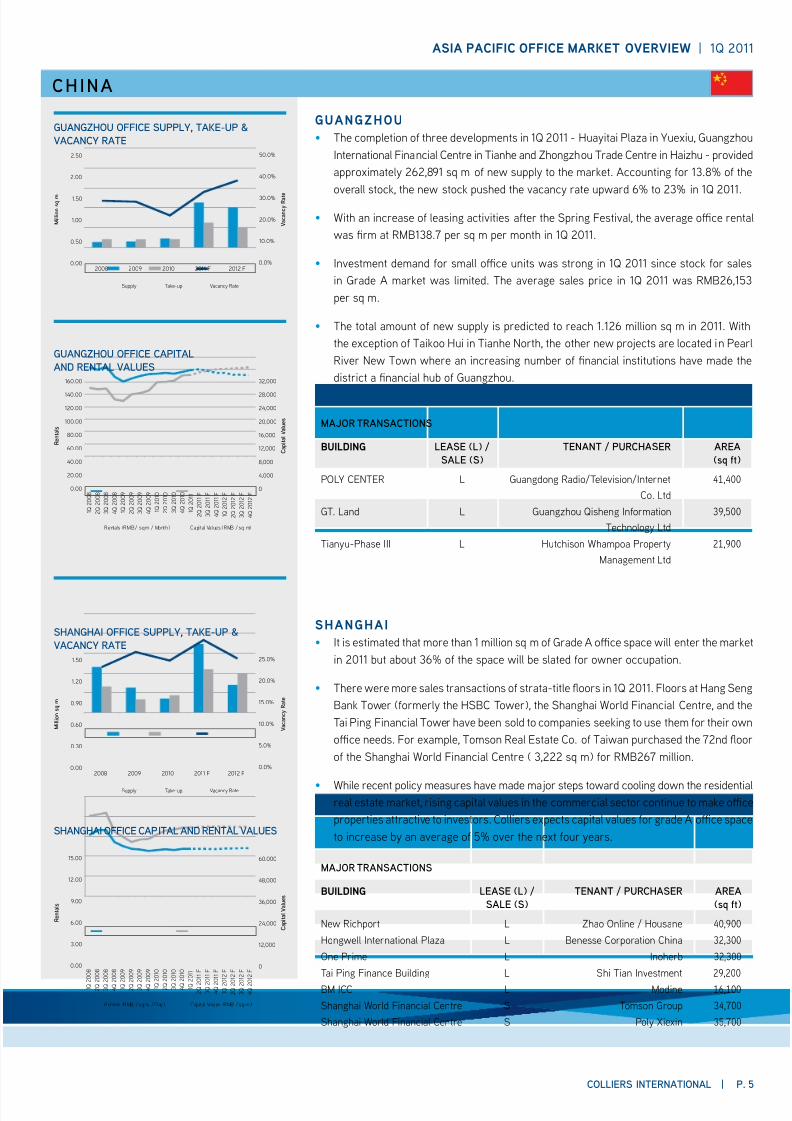
• The completion o three developments in Q - Huayitai Plaza in Yuexiu, Guangzhou
International Financial Centre in Tianhe and Zhongzhou Trade Centre in Haizhu - provided
approximately , sq m o new supply to the market. Accounting or .% o the
overall stock, the new stock pushed the vacancy rate upward % to % in Q .
• With an increase o leasing activities ater the Spring Festival, the average oce rental
was rm at RMB. per sq m per month in Q .
• Investment demand or small oce units was strong in Q since stock or sales
in Grade A market was limited. The average sales price in Q was RMB,
per sq m.
• The total amount o new supply is predicted to reach . million sq m in . With
the exception o Taikoo Hui in Tianhe North, the other new projects are located in Pearl
River New Town where an increasing number o nancial institutions have made the
district a nancial hub o Guangzhou.
mAjor trANsActioNs
Building leAse (l) /sAle (s)
teNANt / PurcHAser AreA(q )
POLY CENTER L Guangdong Radio/Television/Internet
Co. Ltd
41,400
GT. Land L Guangzhou Qisheng Inormation
Technology Ltd
39,500
Tianyu-Phase III L Hutchison Whampoa Property
Management Ltd
21,900
shanghai
• It is estimated that more than million sq m o Grade A oce space will enter the market
in but about % o the space will be slated or owner occupation.
• There were more sales transactions o strata-title oors in Q . Floors at Hang Seng
Bank Tower (ormerly the HSBC Tower), the Shanghai World Financial Centre, and the
Tai Ping Financial Tower have been sold to companies seeking to use them or their own
oce needs. For example, Tomson Real Estate Co. o Taiwan purchased the nd oor
o the Shanghai World Financial Centre ( , sq m) or RMB million.
• While recent policy measures have made major steps toward cooling down the residentialreal estate market, rising capital values in the commercial sector continue to make oce
properties attractive to investors. Colliers expects capital values or grade A oce space
to increase by an average o % over the next our years.
cHiNA
mAjor trANsActioNs
Building leAse (l) /sAle (s)
teNANt / PurcHAser AreA(q )
New Richport L Zhao Online / Housane 40,900
Hongwell International Plaza L Benesse Corporation China 32,300
One Prime L Inoherb 32,300
Tai Ping Finance Building L Shi Tian Investment 29,200
BM ICC L Modine 16,100
Shanghai World Financial Centre S Tomson Group 34,700
Shanghai World Financial Centre S Poly Xiexin 35,700
1 Q 2
0 0 8
2 Q 2
0 0 8
3 Q 2
0 0 8
4 Q 2
0 0 8
1 Q 2
0 0 9
2 Q 2
0 0 9
3 Q 2
0 0 9
4 Q 2
0 0 9
1 Q 2
0 1 0
2 Q 2
0 1 0
3 Q 2
0 1 0
4 Q 2
0 1 0
1 Q 2
0 1 1
2 Q 2
0 1 1 F
3 Q 2
0 1 1 F
4 Q 2
0 1 1 F
1 Q 2
0 1 2
F
2 Q 2
0 1 2
F
3 Q 2
0 1 2
F
4 Q 2
0 1 2
F
0.00
20.00
40.00
60.00
80.00
100.00
120.00
140.00
160.00
R e n t a l s
0
4,000
8,000
12,000
16,000
20,000
24,000
28,000
32,000
C a p i t a l V a l u e s
Rentals (RMB / sq m / Month) Capital Values (RMB / sq m)
GUANGZHOU OFFICE CAPITAL
AND RENTAL VALUES
1 Q 2
0 0 8
2 Q 2
0 0 8
3 Q 2
0 0 8
4 Q 2
0 0 8
1 Q 2
0 0 9
2 Q 2
0 0 9
3 Q 2
0 0 9
4 Q 2
0 0 9
1 Q 2 0 1 0
2 Q 2 0 1 0
3 Q 2 0 1 0
4 Q 2 0 1 0
1 Q 2 0 1 1
2 Q 2
0 1 1 F
3 Q 2
0 1 1 F
4 Q 2
0 1 1 F
1 Q 2 0
1 2
F
2 Q 2 0
1 2
F
3 Q 2 0
1 2
F
4 Q 2 0
1 2
F
0.00
3.00
6.00
9.00
12.00
15.00
R e n t a l s
0
12,000
24,000
36,000
48,000
60,000
C a p i t a l V a l u e s
Renta ls (RMB / sq m / Day) Capital Va lues (RMB / sq m)
SHANGHAI OFFICE CAPITAL AND RENTAL VALUES
2008 2009 2010 2011 F 2012 F
Supply Take-up Vacancy Rate
M i l l i o n s q m
0.00
0.30
0.60
0.90
1.20
1.50
0.0%
5.0%
10.0%
15.0%
20.0%
25.0%
V a c a n c y R a t e
SHANGHAI OFFICE SUPPLY, TAKE-UP &
VACANCY RATE
2008 2009 2010 2011 F 2012 F
0.50
1.00
1.50
2.00
2.50
0.00
M i l l i o n s q m
10.0%
20.0%
30.0%
40.0%
50.0%
0.0%
V a c a n c y R a t e
Supply Take-up Vacancy Rate
GUANGZHOU OFFICE SUPPLY, TAKE-UP &
VACANCY RATE
8/6/2019 Asia Pacific Office Q1 2011 | Colliers International Thailand
http://slidepdf.com/reader/full/asia-pacific-office-q1-2011-colliers-international-thailand 6/24P. 6 | colliers iNterNAtioNAl
asia pacific office market overview | 1Q 2011
HoNG koNG
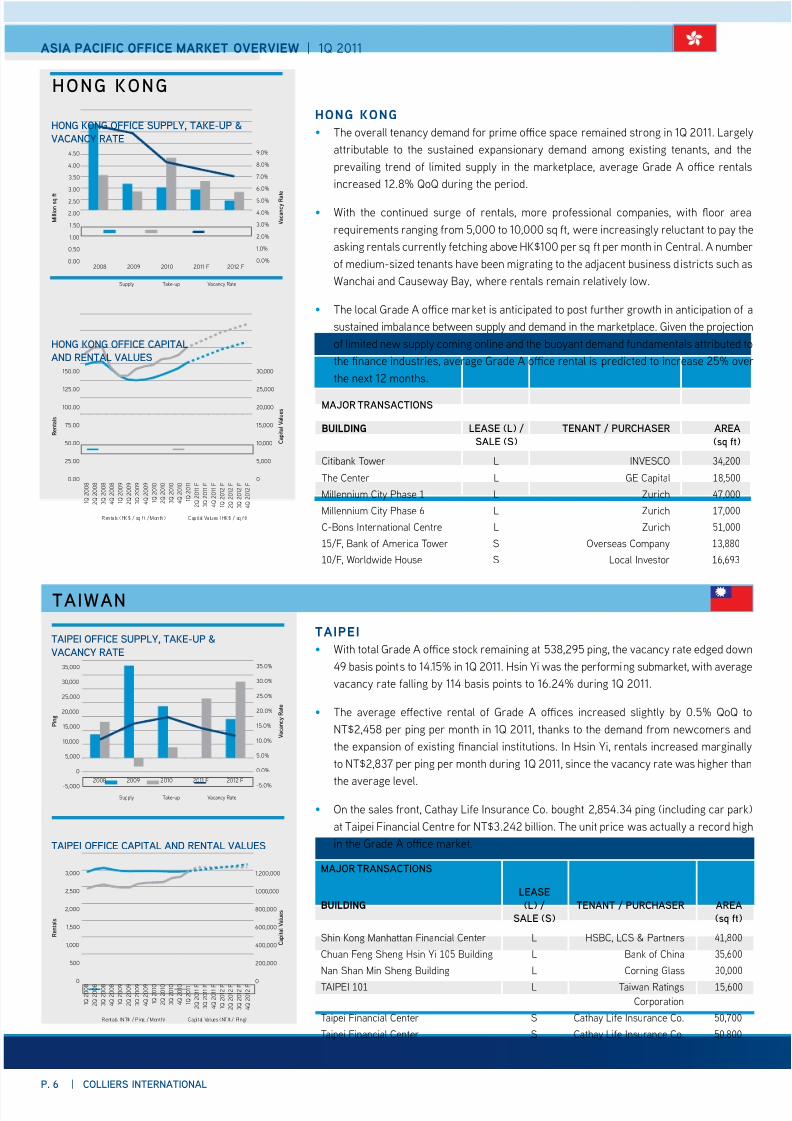
hong kong
• The overall tenancy demand or prime oce space remained strong in Q . Largely
attributable to the sustained expansionary demand among existing tenants, and the
prevailing trend o limited supply in the marketplace, average Grade A oce rentals
increased .% QoQ during the period.
• With the continued surge o rentals, more proessional companies, with oor area
requirements ranging rom , to , sq t, were increasingly reluctant to pay the
asking rentals currently etching above HK$ per sq t per month in Central. A number
o medium-sized tenants have been migrating to the adjacent business districts such as
Wanchai and Causeway Bay, where rentals remain relatively low.
• The local Grade A oce market is anticipated to post urther growth in anticipation o a
sustained imbalance between supply and demand in the marketplace. Given the projection
o limited new supply coming online and the buoyant demand undamentals attributed to
the nance industries, average Grade A oce rental is predicted to increase % over
the next months.
1 Q 2
0 0 8
2 Q 2
0 0 8
3 Q 2
0 0 8
4 Q 2
0 0 8
1 Q 2
0 0 9
2 Q 2
0 0 9
3 Q 2
0 0 9
4 Q 2
0 0 9
1 Q 2
0 1 0
2 Q 2
0 1 0
3 Q 2
0 1 0
4 Q 2
0 1 0
1 Q 2
0 1 1
2 Q 2
0 1 1 F
3 Q 2
0 1 1 F
4 Q 2
0 1 1 F
1 Q 2
0 1 2
F
2 Q 2
0 1 2
F
3 Q 2
0 1 2
F
4 Q 2
0 1 2
F
0.00
25.00
50.00
75.00
100.00
125.00
150.00
0
5,000
10,000
15,000
20,000
25,000
30,000
R e n t a l s
C a p i t a l V a l u e s
Renta ls (HK$ / sq ft / Month) Capital Va lues (HK$ / sq ft)
HONG KONG OFFICE CAPITAL
AND RENTAL VALUES
2008 2009 2010 2011 F 2012 F0.00
0.50
1.00
1.50
2.00
2.50
3.00
3.50
4.00
4.50
M i l l i o n s q f
t
0.0%
1.0%
2.0%
3.0%
4.0%
5.0%
6.0%
7.0%
8.0%
9.0%
V a c a n c y R a t e
Supply Take-up Vacancy Rate
HONG KONG OFFICE SUPPLY, TAKE-UP &
VACANCY RATE
1 Q 2
0 0 8
2 Q 2
0 0 8
3 Q 2
0 0 8
4 Q 2
0 0 8
1 Q 2
0 0 9
2 Q 2
0 0 9
3 Q 2
0 0 9
4 Q 2
0 0 9
1 Q 2
0 1 0
2 Q 2
0 1 0
3 Q 2
0 1 0
4 Q 2
0 1 0
1 Q 2
0 1 1
2 Q 2
0 1 1 F
3 Q 2
0 1 1 F
4 Q 2
0 1 1 F
1 Q 2
0 1 2
F
2 Q 2
0 1 2
F
3 Q 2
0 1 2
F
4 Q 2
0 1 2
F0
500
1,000
1,500
2,000
2,500
3,000
R e n t a l s
0
200,000
400,000
600,000
800,000
1,000,000
1,200,000
C a p i t a l V a l u e s
Rentals (NT$ / Ping / Month) Capital Values (NT$ / Ping)
TAIPEI OFFICE CAPITAL AND RENTAL VALUES
2008 2009 2010 2011 F 2012 F
Supply Take-up Vacancy Rate
-5,000
0
5,000
10,000
15,000
20,000
25,000
30,000
35,000
P i n g
-5.0%
0.0%
5.0%
10.0%
15.0%
20.0%
25.0%
30.0%
35.0%
V a c a n c y R a t e
TAIPEI OFFICE SUPPLY, TAKE-UP &
VACANCY RATE
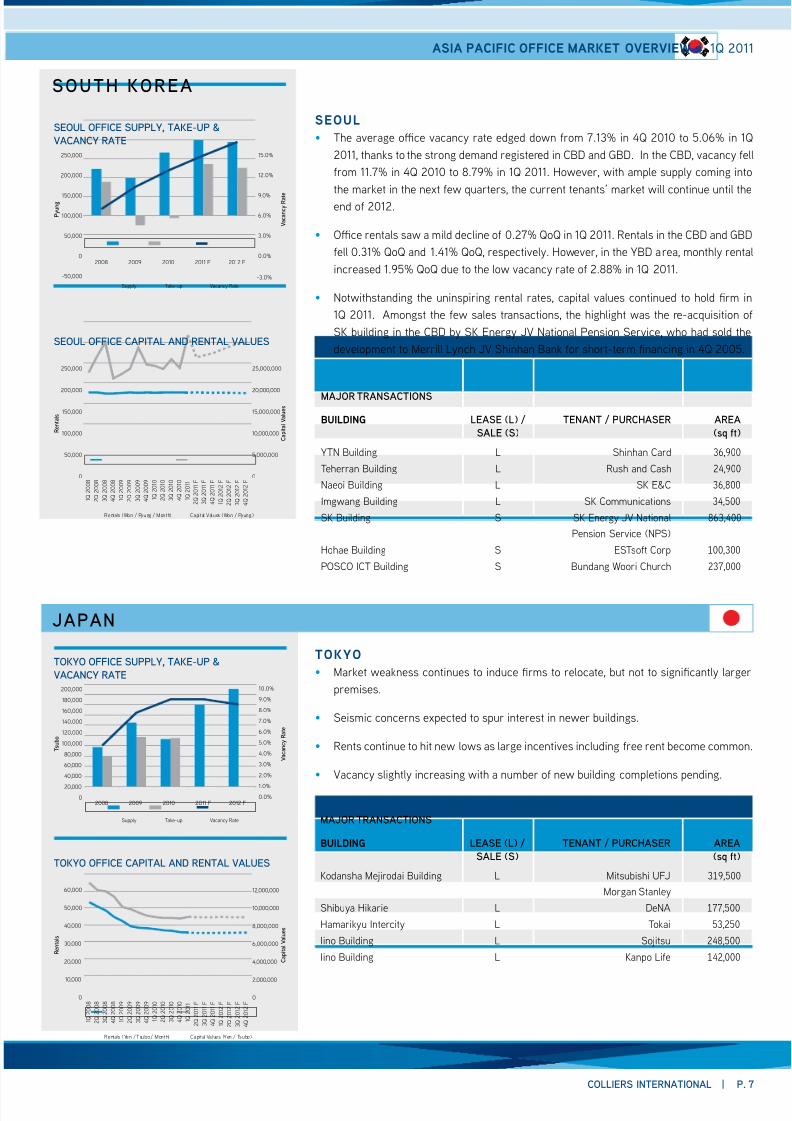
taipei
• With total Grade A oce stock remaining at , ping, the vacancy rate edged down
basis points to .% in Q . Hsin Yi was the perorming submarket, with average
vacancy rate alling by basis points to .% during Q .
• The average efective rental o Grade A oces increased slightly by .% QoQ to
NT$, per ping per month in Q , thanks to the demand rom newcomers and
the expansion o existing nancial institutions. In Hsin Yi, rentals increased marginally
to NT$, per ping per month during Q , since the vacancy rate was higher than
the average level.
• On the sales ront, Cathay Lie Insurance Co. bought ,. ping (including car park)
at Taipei Financial Centre or NT$. billion. The unit price was actually a record high
in the Grade A oce market.
tAiwAN
mAjor trANsActioNs
Building
leAse(l) /
sAle (s)teNANt / PurcHAser AreA
(q )
Shin Kong Manhattan Financial Center L HSBC, LCS & Partners 41,800
Chuan Feng Sheng Hsin Yi 105 Building L Bank o China 35,600
Nan Shan Min Sheng Building L Corning Glass 30,000
TAIPEI 101 L Taiwan Ratings
Corporation
15,600
Taipei Financial Center S Cathay Lie Insurance Co. 50,700
Taipei Financial Center S Cathay Lie Insurance Co. 50,800
mAjor trANsActioNs
Building leAse (l) /sAle (s)
teNANt / PurcHAser AreA(q )
Citibank Tower L INVESCO 34,200
The Center L GE Capital 18,500
Millennium City Phase 1 L Zurich 47,000
Millennium City Phase 6 L Zurich 17,000
C-Bons International Centre L Zurich 51,000
15/F, Bank o America Tower S Overseas Company 13,880
10/F, Worldwide House S Local Investor 16,693
8/6/2019 Asia Pacific Office Q1 2011 | Colliers International Thailand
http://slidepdf.com/reader/full/asia-pacific-office-q1-2011-colliers-international-thailand 7/24
asia pacific office market overview | 1Q 2011
colliers iNterNAtioNAl | P. 7
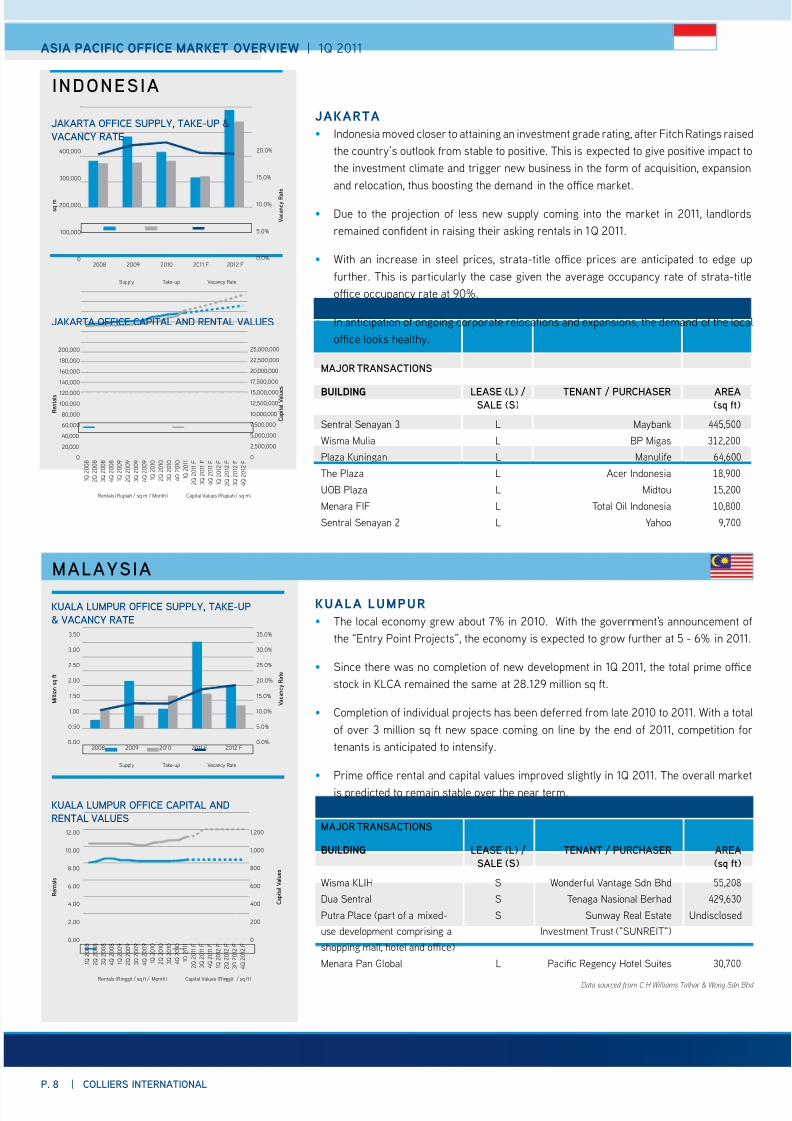
seoul
• The average oce vacancy rate edged down rom .% in Q to .% in Q
, thanks to the strong demand registered in CBD and GBD. In the CBD, vacancy ell
rom .% in Q to .% in Q . However, with ample supply coming into
the market in the next ew quarters, the current tenants’ market will continue until the
end o .
• Oce rentals saw a mild decline o .% QoQ in Q . Rentals in the CBD and GBD
ell .% QoQ and .% QoQ, respectively. However, in the YBD area, monthly rental
increased .% QoQ due to the low vacancy rate o .% in Q .
• Notwithstanding the uninspiring rental rates, capital values continued to hold rm in
Q . Amongst the ew sales transactions, the highlight was the re-acquisition o
SK building in the CBD by SK Energy JV National Pension Service, who had sold the
development to Merrill Lynch JV Shinhan Bank or short-term nancing in Q .
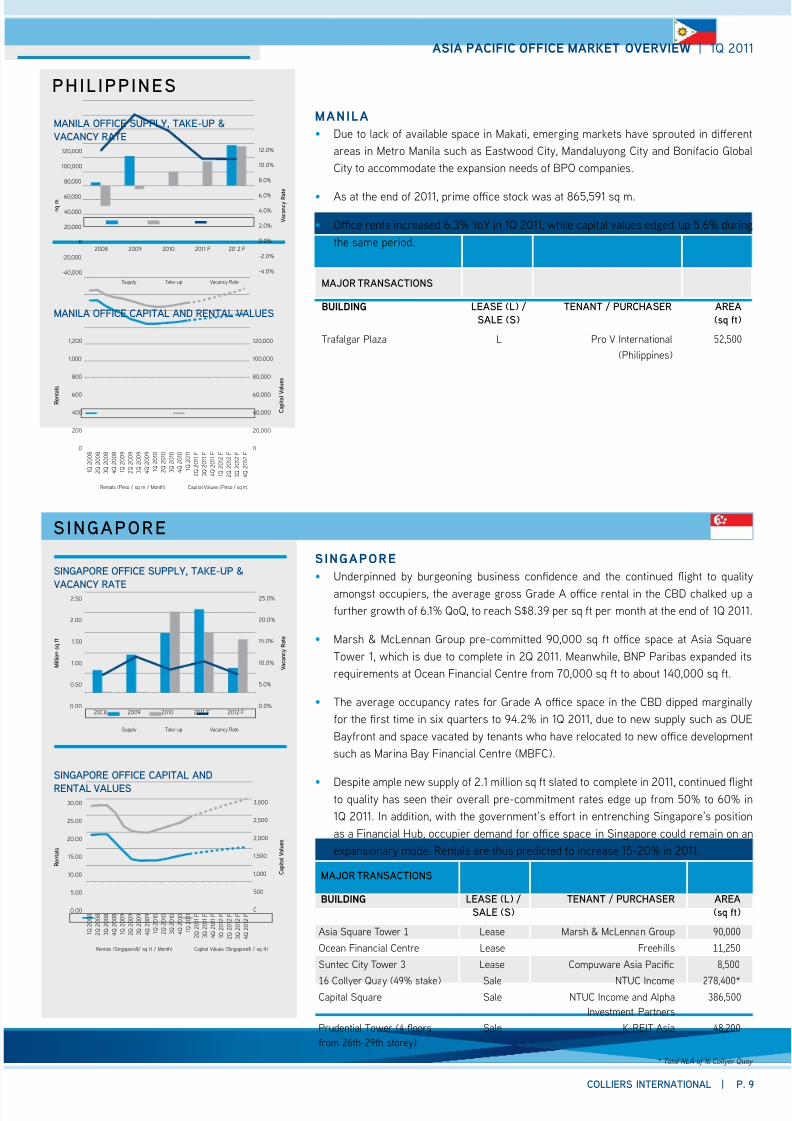
tokyo
• Market weakness continues to induce rms to relocate, but not to signicantly larger
premises.
• Seismic concerns expected to spur interest in newer buildings.
• Rents continue to hit new lows as large incentives including ree rent become common.
• Vacancy slightly increasing with a number o new building completions pending.
soutH koreA
mAjor trANsActioNs
Building leAse (l) /sAle (s)
teNANt / PurcHAser AreA(q )
Kodansha Mejirodai Building L Mitsubishi UFJ
Morgan Stanley
319,500
Shibuya Hikarie L DeNA 177,500
Hamarikyu Intercity L Tokai 53,250
Iino Building L Sojitsu 248,500
Iino Building L Kanpo Lie 142,000
1 Q 2
0 0 8
2 Q 2
0 0 8
3 Q 2
0 0 8
4 Q 2
0 0 8
1 Q 2
0 0 9
2 Q 2
0 0 9
3 Q 2
0 0 9
4 Q 2
0 0 9
1 Q 2
0 1 0
2 Q 2
0 1 0
3 Q 2
0 1 0
4 Q 2
0 1 0
1 Q 2
0 1 1
2 Q 2
0 1 1 F
3 Q 2
0 1 1 F
4 Q 2
0 1 1 F
1 Q 2
0 1 2
F
2 Q 2
0 1 2
F
3 Q 2
0 1 2
F
4 Q 2
0 1 2
F
0
50,000
100,000
150,000
200,000
250,000
R e n t a l s
0
5,000,000
10,000,000
15,000,000
20,000,000
25,000,000
C a p i t a l V a l u e s
Rentals (Won / Pyung / Month) Capital Values (Won / Pyung)
SEOUL OFFICE CAPITAL AND RENTAL VALUES
1 Q 2
0 0 8
2 Q 2
0 0 8
3 Q 2
0 0 8
4 Q 2
0 0 8
1 Q 2
0 0 9
2 Q 2
0 0 9
3 Q 2
0 0 9
4 Q 2
0 0 9
1 Q 2
0 1 0
2 Q 2
0 1 0
3 Q 2
0 1 0
4 Q 2
0 1 0
1 Q 2
0 1 1
2 Q 2
0 1 1 F
3 Q 2
0 1 1 F
4 Q 2
0 1 1 F
1 Q 2
0 1 2
F
2 Q 2
0 1 2
F
3 Q 2
0 1 2
F
4 Q 2
0 1 2
F
0
10,000
20,000
30,000
40,000
50,000
60,000
R e n t a l s
0
2,000,000
4,000,000
6,000,000
8,000,000
10,000,000
12,000,000
C a p i t a l V a l u e s
Rentals (Yen / Tsubo / Month) Capital Values (Yen / Tsubo)
TOKYO OFFICE CAPITAL AND RENTAL VALUES
TOKYO OFFICE SUPPLY, TAKE-UP &
VACANCY RATE
2008 2009 2010 2011 F 2012 F0
20,000
40,000
60,000
80,000
100,000
120,000
140,000
160,000
180,000
200,000
T s u b o
0.0%
1.0%
2.0%
3.0%
4.0%
5.0%
6.0%
7.0%
8.0%
9.0%
10.0%
V a c a n c y
R a t e
Supply Take-up Vacancy Rate
SEOUL OFFICE SUPPLY, TAKE-UP &
VACANCY RATE
-50,000
0
50,000
100,000
150,000
200,000
250,000
0.0%
3.0%
6.0%
9.0%
12.0%
15.0%
2008 2009 2010 2011 F 2012 F
-3.0%
Supply Take-up Vacancy Rate
P y u n g
V a c a n c y R a t e
jAPAN
mAjor trANsActioNs
Building leAse (l) /sAle (s)
teNANt / PurcHAser AreA(q )
YTN Building L Shinhan Card 36,900
Teherran Building L Rush and Cash 24,900
Naeoi Building L SK E&C 36,800
Imgwang Building L SK Communications 34,500
SK Building S SK Energy JV National
Pension Service (NPS)
863,400
Hohae Building S ESTsot Corp 100,300
POSCO ICT Building S Bundang Woori Church 237,000
8/6/2019 Asia Pacific Office Q1 2011 | Colliers International Thailand
http://slidepdf.com/reader/full/asia-pacific-office-q1-2011-colliers-international-thailand 8/24P. 8 | colliers iNterNAtioNAl
asia pacific office market overview | 1Q 2011
iNDoNesiA
jakarta
• Indonesia moved closer to attaining an investment grade rating, ater Fitch Ratings raised
the country’s outlook rom stable to positive. This is expected to give positive impact to
the investment climate and trigger new business in the orm o acquisition, expansion
and relocation, thus boosting the demand in the oce market.
• Due to the projection o less new supply coming into the market in , landlords
remained condent in raising their asking rentals in Q .
• With an increase in steel prices, strata-title oce prices are anticipated to edge up
urther. This is particularly the case given the average occupancy rate o strata-title
oce occupancy rate at %.
• In anticipation o ongoing corporate relocations and expansions, the demand o the local
oce looks healthy.
mAjor trANsActioNs
Building leAse (l) /sAle (s)
teNANt / PurcHAser AreA(q )
Sentral Senayan 3 L Maybank 445,500
Wisma Mulia L BP Migas 312,200
Plaza Kuningan L Manulie 64,600
The Plaza L Acer Indonesia 18,900
UOB Plaza L Midtou 15,200
Menara FIF L Total Oil Indonesia 10,800
Sentral Senayan 2 L Yahoo 9,700
1 Q 2
0 0 8
2 Q 2
0 0 8
3 Q 2
0 0 8
4 Q 2
0 0 8
1 Q 2
0 0 9
2 Q 2
0 0 9
3 Q 2
0 0 9
4 Q 2
0 0 9
1 Q 2
0 1 0
2 Q 2
0 1 0
3 Q 2
0 1 0
4 Q 2
0 1 0
1 Q 2
0 1 1
2 Q 2
0 1 1 F
3 Q 2
0 1 1 F
4 Q 2
0 1 1 F
1 Q 2
0 1 2
F
2 Q 2
0 1 2
F
3 Q 2
0 1 2
F
4 Q 2
0 1 2
F0
20,000
40,000
60,000
80,000
100,000
120,000
140,000
160,000
180,000
200,000
R e n t a l s
0
2,500,000
5,000,000
7,500,000
10,000,000
12,500,000
15,000,000
17,500,000
20,000,000
22,500,000
25,000,000
C a p i t a l V a l u e s
Rentals (Rupiah / sq m / Month) Capital Values (Rupiah / sq m)
JAKARTA OFFICE CAPITAL AND RENTAL VALUES
2008 2009 2010 2011 F 2012 F0
100,000
200,000
300,000
400,000
s q m
V a c a n c y R a t e
0.0%
5.0%
10.0%
15.0%
20.0%
Supply Take-up Vacancy Rate
JAKARTA OFFICE SUPPLY, TAKE-UP &
VACANCY RATE
1 Q 2
0 0 8
2 Q 2
0 0 8
3 Q 2
0 0 8
4 Q 2
0 0 8
1 Q 2
0 0 9
2 Q 2
0 0 9
3 Q 2
0 0 9
4 Q 2
0 0 9
1 Q 2
0 1 0
2 Q 2
0 1 0
3 Q 2
0 1 0
4 Q 2
0 1 0
1 Q 2
0 1 1
2 Q 2
0 1 1 F
3 Q 2
0 1 1 F
4 Q 2
0 1 1 F
1 Q 2
0 1 2
F
2 Q 2
0 1 2
F
3 Q 2
0 1 2
F
4 Q 2
0 1 2
F
0.00
2.00
4.00
6.00
8.00
10.00
12.00
R e n t a l s
200
400
600
800
1,000
1,200
C a p i t a l V a l u e s
Capital Values (Ringgit / sq ft)Rentals (Ringgit / sq ft / Month)
0
KUALA LUMPUR OFFICE CAPITAL AND
RENTAL VALUES
2008 2009 2010 2011 F 2012 F0.00
0.50
1.00
1.50
2.00
2.50
3.00
3.50
M i l l i o n s q f t
0.0%
5.0%
10.0%
15.0%
20.0%
25.0%
30.0%
35.0%
V a c a n c y R a t e
Supply Take-up Vacancy Rate
KUALA LUMPUR OFFICE SUPPLY, TAKE-UP
& VACANCY RATE
kuala lumpur
• The local economy grew about % in . With the government's announcement o
the “Entry Point Projects”, the economy is expected to grow urther at - % in .
• Since there was no completion o new development in Q , the total prime oce
stock in KLCA remained the same at . million sq t.
• Completion o individual projects has been deerred rom late to . With a total
o over million sq t new space coming on line by the end o , competition or
tenants is anticipated to intensiy.
• Prime oce rental and capital values improved slightly in Q . The overall market
is predicted to remain stable over the near term.
mAjor trANsActioNs
Building leAse (l) /sAle (s)
teNANt / PurcHAser AreA(q )
Wisma KLIH S Wonderul Vantage Sdn Bhd 55,208
Dua Sentral S Tenaga Nasional Berhad 429,630
Putra Place (part o a mixed-
use development comprising a
shopping mall, hotel and oce)
S Sunway Real Estate
Investment Trust ("SUNREIT")
Undisclosed
Menara Pan Global L Pacic Regency Hotel Suites 30,700
mAlAysiA
Data sourced rom C H Williams Talhar & Wong Sdn Bhd
8/6/2019 Asia Pacific Office Q1 2011 | Colliers International Thailand
http://slidepdf.com/reader/full/asia-pacific-office-q1-2011-colliers-international-thailand 9/24
asia pacific office market overview | 1Q 2011
colliers iNterNAtioNAl | P. 9
manila
• Due to lack o available space in Makati, emerging markets have sprouted in diferent
areas in Metro Manila such as Eastwood City, Mandaluyong City and Boniacio Global
City to accommodate the expansion needs o BPO companies.
• As at the end o , prime oce stock was at , sq m.
• Oce rents increased .% YoY in Q , while capital values edged up .% during
the same period.
mAjor trANsActioNs
Building leAse (l) /sAle (s)
teNANt / PurcHAser AreA(q )
Traalgar Plaza L Pro V International
(Philippines)
52,500
singapore
• Underpinned by burgeoning business condence and the continued ight to quality
amongst occupiers, the average gross Grade A oce rental in the CBD chalked up a
urther growth o .% QoQ, to reach S$. per sq t per month at the end o Q .
• Marsh & McLennan Group pre-committed , sq t oce space at Asia Square
Tower , which is due to complete in Q . Meanwhile, BNP Paribas expanded its
requirements at Ocean Financial Centre rom , sq t to about , sq t.
• The average occupancy rates or Grade A oce space in the CBD dipped marginally
or the rst time in six quarters to .% in Q , due to new supply such as OUE
Bayront and space vacated by tenants who have relocated to new oce development
such as Marina Bay Financial Centre (MBFC).
• Despite ample new supply o . million sq t slated to complete in , continued ightto quality has seen their overall pre-commitment rates edge up rom % to % in
Q . In addition, with the government’s efort in entrenching Singapore's position
as a Financial Hub, occupier demand or oce space in Singapore could remain on an
expansionary mode. Rentals are thus predicted to increase -% in .
PHiliPPiNes
1 Q 2
0 0 8
2 Q 2
0 0 8
3 Q 2
0 0 8
4 Q 2
0 0 8
1 Q 2
0 0 9
2 Q 2
0 0 9
3 Q 2
0 0 9
4 Q 2
0 0 9
1 Q 2
0 1 0
2 Q 2
0 1 0
3 Q 2
0 1 0
4 Q 2
0 1 0
1 Q 2
0 1 1
2 Q 2
0 1 1 F
3 Q 2
0 1 1 F
4 Q 2
0 1 1 F
1 Q 2
0 1 2
F
2 Q 2
0 1 2
F
3 Q 2
0 1 2
F
4 Q 2
0 1 2
F
0
200
400
600
800
1,000
1,200
R e n t a
l s
0
20,000
40,000
60,000
80,000
100,000
120,000
C a p i t a l V
a l u e s
Capital Values (Peso / sq m)Rentals (Peso / sq m / Month)
MANILA OFFICE CAPITAL AND RENTAL VALUES
1 Q 2
0 0 8
2 Q 2
0 0 8
3 Q 2
0 0 8
4 Q 2
0 0 8
1 Q 2
0 0 9
2 Q 2
0 0 9
3 Q 2
0 0 9
4 Q 2
0 0 9
1 Q 2
0 1 0
2 Q 2
0 1 0
3 Q 2
0 1 0
4 Q 2
0 1 0
1 Q 2
0 1 1
2 Q 2
0 1 1 F
3 Q 2
0 1 1 F
4 Q 2
0 1 1 F
1 Q 2
0 1 2
F
2 Q 2
0 1 2
F
3 Q 2
0 1 2
F
4 Q 2
0 1 2
F0.00
5.00
10.00
15.00
20.00
25.00
30.00
R e n t a l s
0
500
1,000
1,500
2,000
2,500
3,000
C a p i t a l V a l u e s
Capital Values (Singapore$ / sq ft)Rentals (Singapore$/ sq ft / Month)
SINGAPORE OFFICE CAPITAL AND
RENTAL VALUES
2008 2009 2010 2011 F 2012 F
Supply Take-up Vacancy Rate
0.0%
5.0%
10.0%
15.0%
20.0%
25.0%
V a c a n c y R a t e
0.00
0.50
1.00
1.50
2.00
2.50
M i l l i o n s q f t
SINGAPORE OFFICE SUPPLY, TAKE-UP &
VACANCY RATE
2008 2009 2010 2011 F 2012 F
-40,000
-20,000
0
20,000
40,000
60,000
80,000
100,000
120,000
s q m
-4.0%
-2.0%
0.0%
2.0%
4.0%
6.0%
8.0%
10.0%
V a c a n c y R a t e
12.0%
Supply Take-up Vacancy Rate
MANILA OFFICE SUPPLY, TAKE-UP &
VACANCY RATE
siNGAPore
mAjor trANsActioNs
Building leAse (l) /sAle (s)
teNANt / PurcHAser AreA(q )
Asia Square Tower 1 Lease Marsh & McLennan Group 90,000
Ocean Financial Centre Lease Freehills 11,250
Suntec City Tower 3 Lease Compuware Asia Pacic 8,500
16 Collyer Quay (49% stake) Sale NTUC Income 278,400*Capital Square Sale NTUC Income and Alpha
Investment Partners
386,500
Prudential Tower (4 oors
rom 26th-29th storey)
Sale K-REIT Asia 48,200
* Total NLA of 16 Collyer Quay
8/6/2019 Asia Pacific Office Q1 2011 | Colliers International Thailand
http://slidepdf.com/reader/full/asia-pacific-office-q1-2011-colliers-international-thailand 10/24P. 10 | colliers iNterNAtioNAl
asia pacific office market overview | 1Q 2011
tHAilAND
1 Q 2
0 0 8
2 Q 2
0 0 8
3 Q 2
0 0 8
4 Q 2
0 0 8
1 Q 2
0 0 9
2 Q 2
0 0 9
3 Q 2
0 0 9
4 Q 2
0 0 9
1 Q 2
0 1 0
2 Q 2
0 1 0
3 Q 2
0 1 0
4 Q 2
0 1 0
1 Q 2
0 1 1
2 Q 2
0 1 1 F
3 Q 2
0 1 1 F
4 Q 2
0 1 1 F
1 Q 2
0 1 2
F
2 Q 2
0 1 2
F
3 Q 2
0 1 2
F
4 Q 2
0 1 2
F
0
200
400
600
800
1,000
1,200
1,400
R e n t a l s
Capital Values (Baht / sq m)Rentals (Baht/ sq m / Month)
20,000
40,000
60,000
80,000
100,000
120,000
140,000
C a p i t a l V a l u e s
0
BANGKOK OFFICE CAPITAL AND RENTAL VALUES
2008 2009 2010 2011 F 2012 F0
20,000
40,000
60,000
80,000
100,000
120,000
s q m
0.0%
4.0%
8.0%
12.0%
16.0%
20.0%
24.0%
V a c a n c y R a t e
Supply Take-up Vacancy Rate
BANGKOK OFFICE SUPPLY, TAKE-UP &
VACANCY RATE
1 Q 2
0 0
8
2 Q 2
0 0
8
3 Q 2
0 0
8
4 Q 2
0 0
8
1 Q 2
0 0
9
2 Q 2
0 0
9
3 Q 2
0 0
9
4 Q 2
0 0
9
1 Q 2
0 1 0
2 Q 2
0 1 0
3 Q 2
0 1 0
4 Q 2
0 1 0
1 Q 2 0
1 1
2 Q 2
0 1 1
F
3 Q 2
0 1 1
F
4 Q 2
0 1 1
F
1 Q 2
0 1 2
F
2 Q 2
0 1 2
F
3 Q 2
0 1 2
F
4 Q 2
0 1 2
F0
10
20
30
40
50
60
70
R e n t a l s
Rentals (US/ sq m / Month)
HO CH MINH CITY OFFICE RENTAL VALUES
-30,000
0
30,000
60,000
90,000
120,000
150,000
180,000
-5.0%
0.0%
5.0%
10.0%
15.0%
20.0%
25.0%
30.0%
2008 2009 2010 2011 F 2012 F
s q m
V a c a n c y R a t e
Supply Take-up Vacancy Rate
HO CHI MINH CITY OFFICE SUPPLY,
TAKE-UP & VACANCY RATE
vietNAm
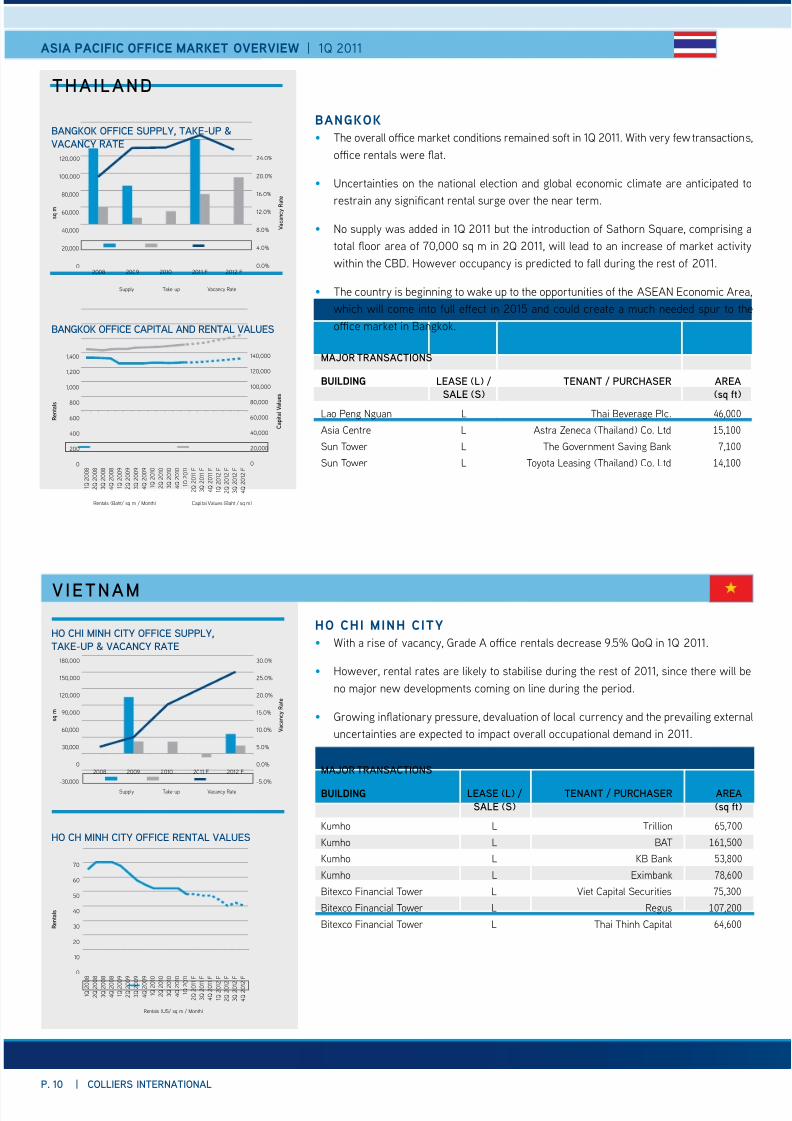
Bangkok
• The overall oce market conditions remained sot in Q . With very ew transactions,
oce rentals were at.
• Uncertainties on the national election and global economic climate are anticipated to
restrain any signicant rental surge over the near term.
• No supply was added in Q but the introduction o Sathorn Square, comprising a
total oor area o , sq m in Q , will lead to an increase o market activity
within the CBD. However occupancy is predicted to all during the rest o .
• The country is beginning to wake up to the opportunities o the ASEAN Economic Area,
which will come into ull efect in and could create a much needed spur to the
oce market in Bangkok.
mAjor trANsActioNs
Building leAse (l) /
sAle (s)
teNANt / PurcHAser AreA
(q )
Lao Peng Nguan L Thai Beverage Plc. 46,000
Asia Centre L Astra Zeneca (Thailand) Co. Ltd 15,100
Sun Tower L The Government Saving Bank 7,100
Sun Tower L Toyota Leasing (Thailand) Co. Ltd 14,100
ho chi minh city
• With a rise o vacancy, Grade A oce rentals decrease .% QoQ in Q .
• However, rental rates are likely to stabilise during the rest o , since there will be
no major new developments coming on line during the period.
• Growing inationary pressure, devaluation o local currency and the prevailing external
uncertainties are expected to impact overall occupational demand in .
mAjor trANsActioNs
Building leAse (l) /sAle (s)
teNANt / PurcHAser AreA(q )
Kumho L Trillion 65,700
Kumho L BAT 161,500
Kumho L KB Bank 53,800
Kumho L Eximbank 78,600
Bitexco Financial Tower L Viet Capital Securities 75,300
Bitexco Financial Tower L Regus 107,200
Bitexco Financial Tower L Thai Thinh Capital 64,600
8/6/2019 Asia Pacific Office Q1 2011 | Colliers International Thailand
http://slidepdf.com/reader/full/asia-pacific-office-q1-2011-colliers-international-thailand 11/24
asia pacific office market overview | 1Q 2011
colliers iNterNAtioNAl | P. 11
iNDiA
1 Q 2
0 0 8
2 Q 2
0 0 8
3 Q 2
0 0 8
4 Q 2
0 0 8
1 Q 2
0 0 9
2 Q 2
0 0 9
3 Q 2
0 0 9
4 Q 2
0 0 9
1 Q 2
0 1 0
2 Q 2
0 1 0
3 Q 2
0 1 0
4 Q 2
0 1 0
1 Q 2
0 1 1
2 Q 2
0 1 1 F
3 Q 2
0 1 1 F
4 Q 2
0 1 1 F
1 Q 2
0 1 2
F
2 Q 2
0 1 2
F
3 Q 2
0 1 2
F
4 Q 2
0 1 2
F
R e n t a l s
0
10
20
30
40
50
60
70
80
1,000
2,000
3,000
4,000
5,000
6,000
7,000
8,000
C a p i t a l V a l u e s
0
Capital Values (Rupee / sq ft)Rentals (Rupee/ sq ft / Month)
BENGALURU OFFICE CAPITAL AND
RENTAL VALUES
1 Q 2
0 0 8
2 Q 2
0 0 8
3 Q 2
0 0 8
4 Q 2
0 0 8
1 Q 2
0 0 9
2 Q 2
0 0 9
3 Q 2
0 0 9
4 Q 2
0 0 9
1 Q 2
0 1 0
2 Q 2
0 1 0
3 Q 2
0 1 0
4 Q 2
0 1 0
1 Q 2
0 1 1
2 Q 2
0 1 1 F
3 Q 2
0 1 1 F
4 Q 2
0 1 1 F
1 Q 2
0 1 2
F
2 Q 2
0 1 2
F
3 Q 2
0 1 2
F
4 Q 2
0 1 2
F
0
10
20
30
40
50
60
70
80
R e n t a l s
0
1,000
2,000
3,000
4,000
5,000
6,000
7,000
8,000
C a p i t a l V a l u e s
Capital Values (Rupee / sq ft)Rentals (Rupee/ sq ft / Month)
CHENNAI OFFICE CAPITAL AND
RENTAL VALUES
2008 2009 2010 2011 F 2012 F
0.0%
4.0%
8.0%
12.0%
16.0%
20.0%
24.0%
28.0%
32.0%
V a c a n c y R a t e
0.00
2.00
4.00
6.00
8.00
10.00
12.00
14.00
16.00
M i l l i o n s q f t
Supply Take-up Vacancy Rate
CHENNAI OFFICE SUPPLY, TAKE-UP &
VACANCY RATE
2008 2009 2010 2011 F 2012 F
0.00
2.00
4.00
6.00
8.00
10.00
12.00
M i l l i o n s q f t
0.0%
4.0%
8.0%
12.0%
16.0%
20.0%
24.0%
V a c a n c y R a t e
Supply Take-up Vacancy Rate
BENGALURU OFFICE SUPPLY, TAKE-UP &
VACANCY RATE
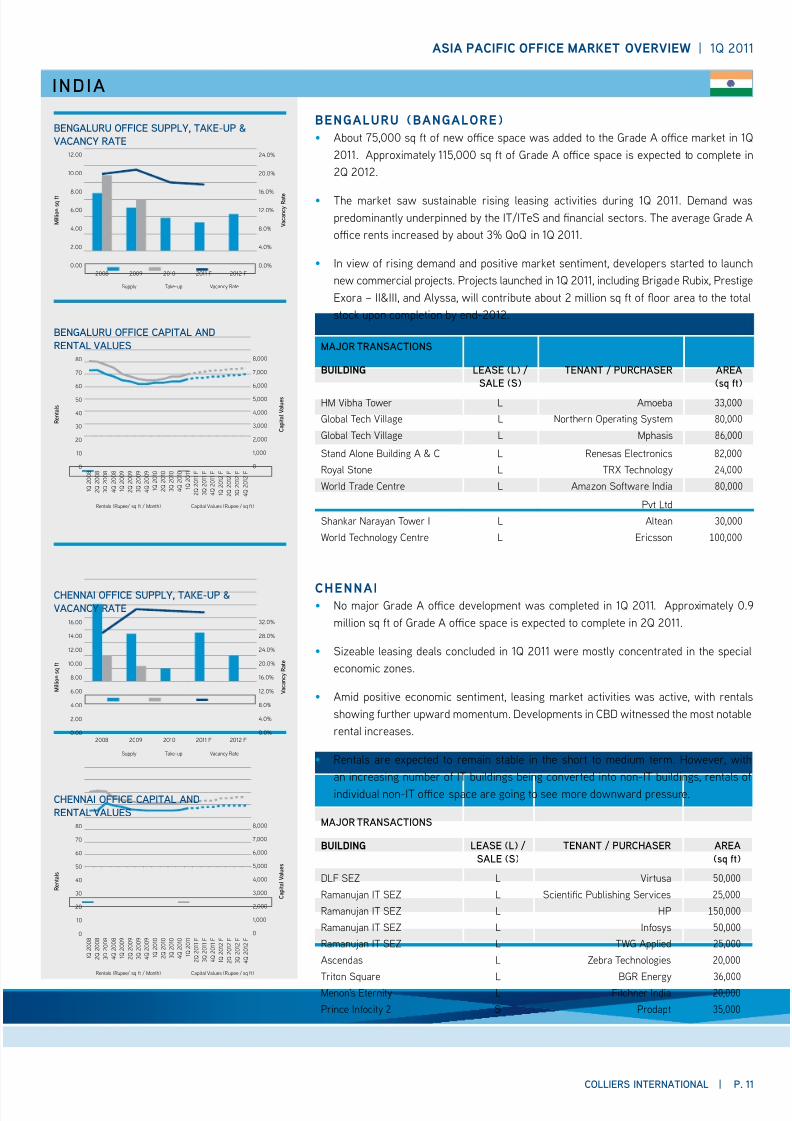
Bengaluru (Bangalore)
• About , sq t o new oce space was added to the Grade A oce market in Q
. Approximately , sq t o Grade A oce space is expected to complete in
Q .
• The market saw sustainable rising leasing activities during Q . Demand was
predominantly underpinned by the IT/ITeS and nancial sectors. The average Grade A
oce rents increased by about % QoQ in Q .
• In view o rising demand and positive market sentiment, developers started to launch
new commercial projects. Projects launched in Q , including Brigade Rubix, Prestige
Exora – II&III, and Alyssa, will contribute about million sq t o oor area to the total
stock upon completion by end-.
mAjor trANsActioNs
Building leAse (l) /sAle (s)
teNANt / PurcHAser AreA(q )
HM Vibha Tower L Amoeba 33,000
Global Tech Village L Northern Operating System 80,000
Global Tech Village L Mphasis 86,000
Stand Alone Building A & C L Renesas Electronics 82,000
Royal Stone L TRX Technology 24,000
World Trade Centre L Amazon Sotware India
Pvt Ltd
80,000
Shankar Narayan Tower I L Altean 30,000
World Technology Centre L Ericsson 100,000
chennai• No major Grade A oce development was completed in Q . Approximately .
million sq t o Grade A oce space is expected to complete in Q .
• Sizeable leasing deals concluded in Q were mostly concentrated in the special
economic zones.
• Amid positive economic sentiment, leasing market activities was active, with rentals
showing urther upward momentum. Developments in CBD witnessed the most notable
rental increases.
• Rentals are expected to remain stable in the short to medium term. However, with
an increasing number o IT buildings being converted into non-IT buildings, rentals o
individual non-IT oce space are going to see more downward pressure.
mAjor trANsActioNs
Building leAse (l) /sAle (s)
teNANt / PurcHAser AreA(q )
DLF SEZ L Virtusa 50,000
Ramanujan IT SEZ L Scientic Publishing Services 25,000
Ramanujan IT SEZ L HP 150,000
Ramanujan IT SEZ L Inosys 50,000
Ramanujan IT SEZ L TWG Applied 25,000
Ascendas L Zebra Technologies 20,000
Triton Square L BGR Energy 36,000Menon's Eternity L Fitchner India 20,000
Prince Inocity 2 S Prodapt 35,000
8/6/2019 Asia Pacific Office Q1 2011 | Colliers International Thailand
http://slidepdf.com/reader/full/asia-pacific-office-q1-2011-colliers-international-thailand 12/24P. 12 | colliers iNterNAtioNAl
asia pacific office market overview | 1Q 2011
iNDiA
1 Q 2
0 0 8
2 Q 2
0 0 8
3 Q 2
0 0 8
4 Q 2
0 0 8
1 Q 2
0 0 9
2 Q 2
0 0 9
3 Q 2
0 0 9
4 Q 2
0 0 9
1 Q 2
0 1 0
2 Q 2
0 1 0
3 Q 2
0 1 0
4 Q 2
0 1 0
1 Q 2
0 1 1
2 Q 2
0 1 1 F
3 Q 2
0 1 1 F
4 Q 2
0 1 1 F
1 Q 2
0 1 2
F
2 Q 2
0 1 2
F
3 Q 2
0 1 2
F
4 Q 2
0 1 2
F
0
50
100
150
200
250
300
350
R e n t a l s
0
10,000
20,000
30,000
40,000
50,000
60,000
70,000
C a p i t a l V a l u e s
Capital Values (Rupee / sq ft)Rentals (Rupee/ sq ft / Month)
MUMBAI OFFICE CAPITAL AND RENTAL VALUES
2008 2009 2010 2011 F 2012 F
M i l l i o n s q f t
0.00
3.00
6.00
9.00
12.00
15.00
18.00
0.0%
4.0%
8.0%
12.0%
16.0%
20.0%
24.0%
V a c a n c y R a t
e
Supply Take-up Vacancy Rate
MUMBAI OFFICE SUPPLY, TAKE-UP &
VACANCY RATE
1 Q 2
0 0 8
2 Q 2
0 0 8
3 Q 2
0 0 8
4 Q 2
0 0 8
1 Q 2
0 0 9
2 Q 2
0 0 9
3 Q 2
0 0 9
4 Q 2
0 0 9
1 Q 2
0 1 0
2 Q 2
0 1 0
3 Q 2
0 1 0
4 Q 2
0 1 0
1 Q 2
0 1 1
2 Q 2
0 1 1 F
3 Q 2
0 1 1 F
4 Q 2
0 1 1 F
1 Q 2
0 1 2
F
2 Q 2
0 1 2
F
3 Q 2
0 1 2
F
4 Q 2
0 1 2
F
0
50
100
150
200
250
300
350
R e n t a l s
0
5,000
10,000
15,000
20,000
25,000
30,000
C a p i t a l V a l u e s
35,000
Capital Values (Rupee / sq ft)Rentals (Rupee/ sq ft / Month)
NEW DELHI OFFICE CAPITAL AND RENTAL VALUES
2008 2009 2010 2011 F 2012 F0.00
2.00
4.00
6.00
8.00
10.00
12.00
M i l l i o n s q f t
0.0%
4.0%
8.0%
12.0%
16.0%
20.0%
24.0%
V a c a n c y R a t e
Supply Take-up Vacancy Rate
NEW DELHI OFFICE SUPPLY, TAKE-UP &
VACANCY RATE
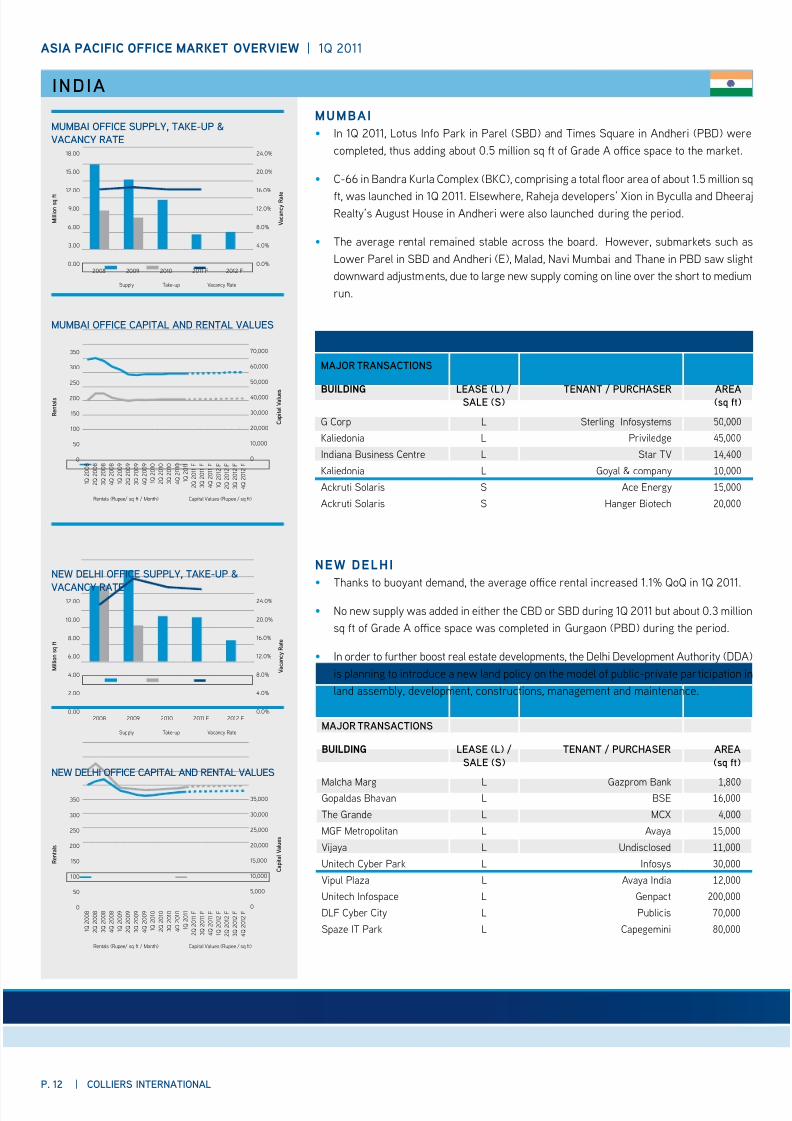
mumBai
• In Q , Lotus Ino Park in Parel (SBD) and Times Square in Andheri (PBD) were
completed, thus adding about . million sq t o Grade A oce space to the market.
• C- in Bandra Kurla Complex (BKC), comprising a total oor area o about . million sq
t, was launched in Q . Elsewhere, Raheja developers’ Xion in Byculla and DheerajRealty’s August House in Andheri were also launched during the period.
• The average rental remained stable across the board. However, submarkets such as
Lower Parel in SBD and Andheri (E), Malad, Navi Mumbai and Thane in PBD saw slight
downward adjustments, due to large new supply coming on line over the short to medium
run.
mAjor trANsActioNs
BuildingleAse (l) /sAle (s) teNANt / PurcHAser AreA(q )
G Corp L Sterling Inosystems 50,000
Kaliedonia L Priviledge 45,000
Indiana Business Centre L Star TV 14,400
Kaliedonia L Goyal & company 10,000
Ackruti Solaris S Ace Energy 15,000
Ackruti Solaris S Hanger Biotech 20,000
new delhi
• Thanks to buoyant demand, the average oce rental increased .% QoQ in Q .
• No new supply was added in either the CBD or SBD during Q but about . million
sq t o Grade A oce space was completed in Gurgaon (PBD) during the period.
• In order to urther boost real estate developments, the Delhi Development Authority (DDA)
is planning to introduce a new land policy on the model o public-private participation in
land assembly, development, constructions, management and maintenance.
mAjor trANsActioNs
Building leAse (l) /sAle (s)
teNANt / PurcHAser AreA(q )
Malcha Marg L Gazprom Bank 1,800Gopaldas Bhavan L BSE 16,000
The Grande L MCX 4,000
MGF Metropolitan L Avaya 15,000
Vijaya L Undisclosed 11,000
Unitech Cyber Park L Inosys 30,000
Vipul Plaza L Avaya India 12,000
Unitech Inospace L Genpact 200,000
DLF Cyber City L Publicis 70,000
Spaze IT Park L Capegemini 80,000
8/6/2019 Asia Pacific Office Q1 2011 | Colliers International Thailand
http://slidepdf.com/reader/full/asia-pacific-office-q1-2011-colliers-international-thailand 13/24
asia pacific office market overview | 1Q 2011
colliers iNterNAtioNAl | P. 13
AustrAliA
1 Q 2
0 0 8
2 Q 2
0 0 8
3 Q 2
0 0 8
4 Q 2
0 0 8
1 Q 2
0 0 9
2 Q 2
0 0 9
3 Q 2
0 0 9
4 Q 2
0 0 9
1 Q 2
0 1 0
2 Q 2
0 1 0
3 Q 2
0 1 0
4 Q 2
0 1 0
1 Q 2
0 1 1
2 Q 2
0 1 1 F
3 Q 2
0 1 1 F
4 Q 2
0 1 1 F
1 Q 2
0 1 2
F
2 Q 2
0 1 2
F
3 Q 2
0 1 2
F
4 Q 2
0 1 2
F0
100
200
300
400
500
600
700
R e n t a l s
0
1,000
2,000
3,000
4,000
5,000
6,000
7,000
C a p i t a l V a
l u e s
Capital Values (Australian $ / sq m)Rentals (Australian $/ sq m / Year)
ADELAIDE OFFICE CAPITAL AND RENTAL VALUES
1 Q 2
0 0 8
2 Q 2
0 0 8
3 Q 2
0 0 8
4 Q 2
0 0 8
1 Q 2
0 0 9
2 Q 2
0 0 9
3 Q 2
0 0 9
4 Q 2
0 0 9
1 Q 2
0 1 0
2 Q 2
0 1 0
3 Q 2
0 1 0
4 Q 2
0 1 0
1 Q 2
0 1 1
2 Q 2
0 1 1 F
3 Q 2
0 1 1 F
4 Q 2
0 1 1 F
1 Q 2
0 1 2
F
2 Q 2
0 1 2
F
3 Q 2
0 1 2
F
4 Q 2
0 1 2
F
R e n t a l s
0
200
400
600
800
1,000
1,200
C a p i t a l V a l u e s
10,000
12,000
0
2,000
4,000
6,000
8,000
Capital Values (Australian $ / sq m)Rentals (Australian $/ sq m / Year)
BRISBANE OFFICE CAPITAL AND RENTAL VALUES
s q m
0
20,000
40,000
60,000
80,000
100,000
120,000
140,000
160,000
180,000
V a c a n c y R a t e
0.0%
2.0%
4.0%
6.0%
8.0%
10.0%
12.0%
14.0%
16.0%
18.0%
Supply Take-up Vacancy Rate
2008 2009 2010 2011 F 2012 F
BRISBANE OFFICE SUPPLY, TAKE-UP &
VACANCY RATE
2008 2009 2010 2011 F 2012 F0.0%
1.0%
2.0%
3.0%
4.0%
5.0%
6.0%
7.0%
8.0%
9.0%
V a c a n c y R a
t e
Supply Take-up Vacancy Rate
0
10,000
20,000
30,000
40,000
50,000
60,000
70,000
80,000
90,000
s q m
ADELAIDE OFFICE SUPPLY, TAKE-UP &
VACANCY RATE
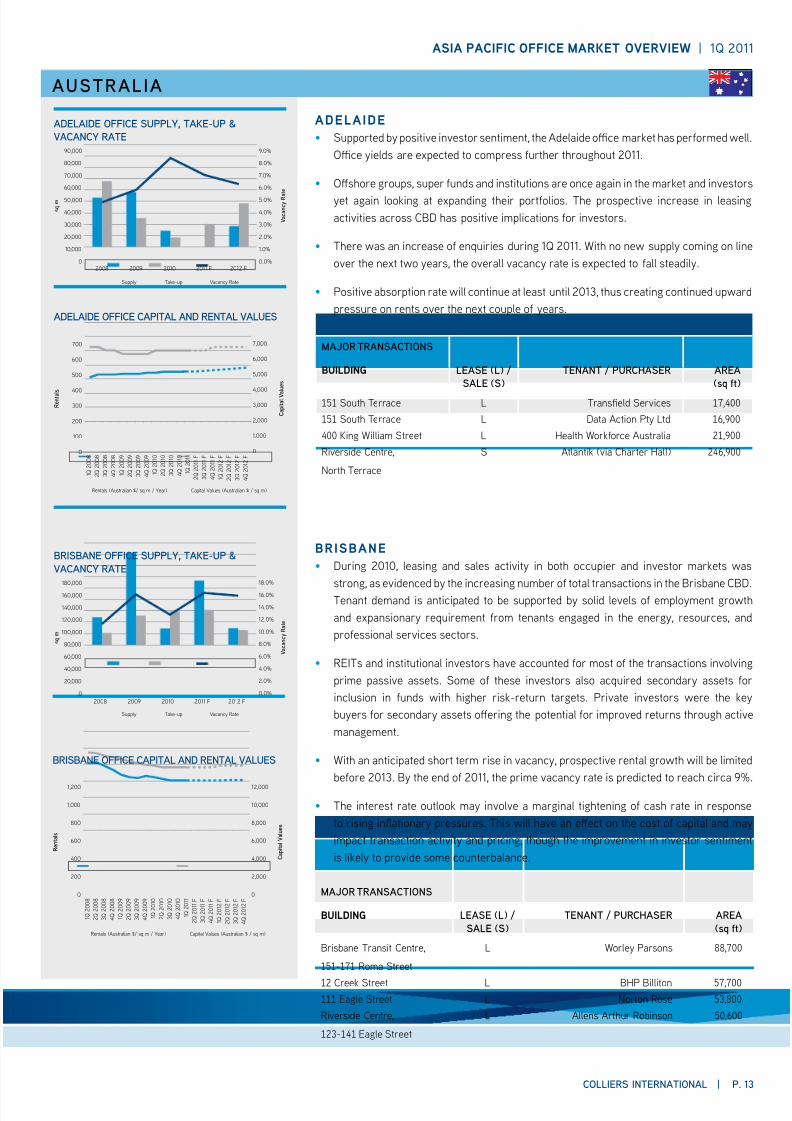
adelaide
• Supported by positive investor sentiment, the Adelaide oce market has perormed well.
Oce yields are expected to compress urther throughout .
• Ofshore groups, super unds and institutions are once again in the market and investors
yet again looking at expanding their portolios. The prospective increase in leasing
activities across CBD has positive implications or investors.
• There was an increase o enquiries during Q . With no new supply coming on line
over the next two years, the overall vacancy rate is expected to all steadily.
• Positive absorption rate will continue at least until , thus creating continued upward
pressure on rents over the next couple o years.
mAjor trANsActioNs
Building leAse (l) /sAle (s)
teNANt / PurcHAser AreA(q )
151 South Terrace L Transeld Services 17,400
151 South Terrace L Data Action Pty Ltd 16,900
400 King William Street L Health Workorce Australia 21,900
Riverside Centre,
North Terrace
S Atlantik (via Charter Hall) 246,900
BrisBane
• During , leasing and sales activity in both occupier and investor markets was
strong, as evidenced by the increasing number o total transactions in the Brisbane CBD.Tenant demand is anticipated to be supported by solid levels o employment growth
and expansionary requirement rom tenants engaged in the energy, resources, and
proessional services sectors.
• REITs and institutional investors have accounted or most o the transactions involving
prime passive assets. Some o these investors also acquired secondary assets or
inclusion in unds with higher risk-return targets. Private investors were the key
buyers or secondary assets ofering the potential or improved returns through active
management.
• With an anticipated short term rise in vacancy, prospective rental growth will be limited
beore . By the end o , the prime vacancy rate is predicted to reach circa %.
• The interest rate outlook may involve a marginal tightening o cash rate in response
to rising inationary pressures. This will have an efect on the cost o capital and may
impact transaction activity and pricing, though the improvement in investor sentiment
is likely to provide some counterbalance.
mAjor trANsActioNs
Building leAse (l) /sAle (s)
teNANt / PurcHAser AreA(q )
Brisbane Transit Centre,
151-171 Roma Street
L Worley Parsons 88,700
12 Creek Street L BHP Billiton 57,700111 Eagle Street L Norton Rose 53,800
Riverside Centre,
123-141 Eagle Street
L Allens Arthur Robinson 50,600
8/6/2019 Asia Pacific Office Q1 2011 | Colliers International Thailand
http://slidepdf.com/reader/full/asia-pacific-office-q1-2011-colliers-international-thailand 14/24P. 14 | colliers iNterNAtioNAl
asia pacific office market overview | 1Q 2011
AustrAliA
1 Q 2
0 0 8
2 Q 2
0 0 8
3 Q 2
0 0 8
4 Q 2
0 0 8
1 Q 2
0 0 9
2 Q 2
0 0 9
3 Q 2
0 0 9
4 Q 2
0 0 9
1 Q 2
0 1 0
2 Q 2
0 1 0
3 Q 2
0 1 0
4 Q 2
0 1 0
1 Q 2
0 1 1
2 Q 2
0 1 1 F
3 Q 2
0 1 1 F
4 Q 2
0 1 1 F
1 Q 2
0 1 2
F
2 Q 2
0 1 2
F
3 Q 2
0 1 2
F
4 Q 2
0 1 2
F
Capital Values (Australian $ / sq m)Rentals (Australian $/ sq m / Year)
0
100
200
300
400
500
600
700
R e n t a l s
0
1,000
2,000
3,000
4,000
5,000
6,000
7,000
C a p i t a l V a l u e s
MELBOURNE OFFICE CAPITAL AND
RENTAL VALUES
2008 2009 2010 2011 F 2012 F
0
50,000
100,000
150,000
200,000
250,000
s q m
0.0%
2.0%
4.0%
6.0%
8.0%
10.0%
V a c a n c y R a t e
MELBOURNE OFFICE SUPPLY, TAKE-UP &
VACANCY RATE
1 Q 2
0 0 8
2 Q 2
0 0 8
3 Q 2
0 0 8
4 Q 2
0 0 8
1 Q 2
0 0 9
2 Q 2
0 0 9
3 Q 2
0 0 9
4 Q 2
0 0 9
1 Q 2
0 1 0
2 Q 2
0 1 0
3 Q 2
0 1 0
4 Q 2
0 1 0
1 Q 2
0 1 1
2 Q 2
0 1 1 F
3 Q 2
0 1 1 F
4 Q 2
0 1 1 F
1 Q 2
0 1 2
F
2 Q 2
0 1 2
F
3 Q 2
0 1 2
F
4 Q 2
0 1 2
F
Capital Values (Australian $ / sq m)Rentals (Australian $/ sq m / Year)
0
100
200
300
400
500
600
700
800
R e n t a l s
0
1,000
2,000
3,000
4,000
5,000
6,000
7,000
8,000
C a p i t a l V a l u e s
CANBERRA OFFICE CAPITAL AND RENTAL VALUES
0
10,000
20,000
30,000
40,000
50,000
60,000
70,000
80,000
s q m
2008 2009 2010 2011 F 2012 F
Supply Take-up Vacancy Rate
0.0%
2.0%
4.0%
6.0%
8.0%
10.0%
12.0%
14.0%
16.0%
V a c a n c y R a t e
CANBERRA OFFICE SUPPLY, TAKE-UP &
VACANCY RATE
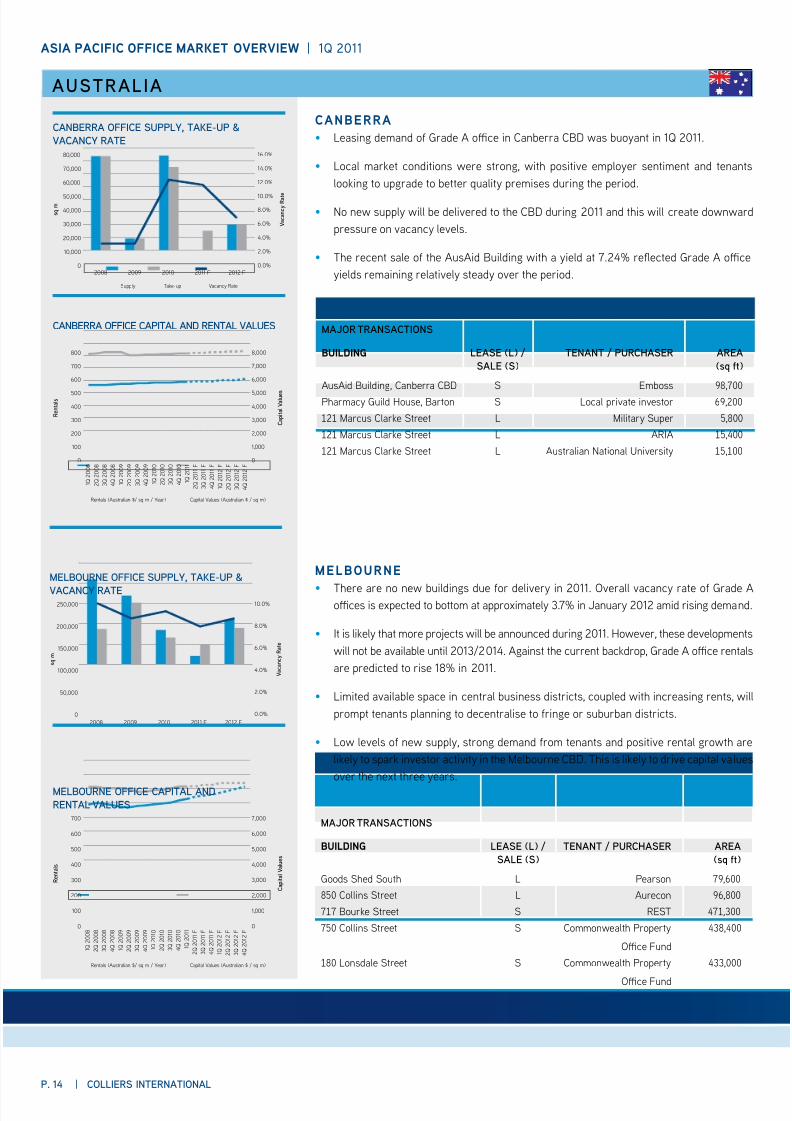
canBerra
• Leasing demand o Grade A oce in Canberra CBD was buoyant in Q .
• Local market conditions were strong, with positive employer sentiment and tenants
looking to upgrade to better quality premises during the period.
• No new supply will be delivered to the CBD during and this will create downward
pressure on vacancy levels.
• The recent sale o the AusAid Building with a yield at .% reected Grade A oce
yields remaining relatively steady over the period.
mAjor trANsActioNs
Building leAse (l) /sAle (s)
teNANt / PurcHAser AreA(q )
AusAid Building, Canberra CBD S Emboss 98,700
Pharmacy Guild House, Barton S Local private investor 69,200
121 Marcus Clarke Street L Military Super 5,800
121 Marcus Clarke Street L ARIA 15,400
121 Marcus Clarke Street L Australian National University 15,100
melBourne
• There are no new buildings due or delivery in . Overall vacancy rate o Grade Aoces is expected to bottom at approximately .% in January amid rising demand.
• It is likely that more projects will be announced during . However, these developments
will not be available until /. Against the current backdrop, Grade A oce rentals
are predicted to rise % in .
• Limited available space in central business districts, coupled with increasing rents, will
prompt tenants planning to decentralise to ringe or suburban districts.
• Low levels o new supply, strong demand rom tenants and positive rental growth are
likely to spark investor activity in the Melbourne CBD. This is likely to drive capital values
over the next three years.
mAjor trANsActioNs
Building leAse (l) /sAle (s)
teNANt / PurcHAser AreA(q )
Goods Shed South L Pearson 79,600
850 Collins Street L Aurecon 96,800
717 Bourke Street S REST 471,300
750 Collins Street S Commonwealth Property
Oce Fund
438,400
180 Lonsdale Street S Commonwealth Property
Oce Fund
433,000
8/6/2019 Asia Pacific Office Q1 2011 | Colliers International Thailand
http://slidepdf.com/reader/full/asia-pacific-office-q1-2011-colliers-international-thailand 15/24
asia pacific office market overview | 1Q 2011
colliers iNterNAtioNAl | P. 15
AustrAliA
1 Q 2
0 0 8
2 Q 2
0 0 8
3 Q 2
0 0 8
4 Q 2
0 0 8
1 Q 2
0 0 9
2 Q 2
0 0 9
3 Q 2
0 0 9
4 Q 2
0 0 9
1 Q 2
0 1 0
2 Q 2
0 1 0
3 Q 2
0 1 0
4 Q 2
0 1 0
1 Q 2
0 1 1
2 Q 2
0 1 1 F
3 Q 2
0 1 1 F
4 Q 2
0 1 1 F
1 Q 2
0 1 2
F
2 Q 2
0 1 2
F
3 Q 2
0 1 2
F
4 Q 2
0 1 2
F
0
100
200
300
400
500
600
700
800
900
1,000
R e n t a l s
0
1,000
2,000
3,000
4,000
5,000
6,000
7,000
8,000
9,000
10,000
C a p i t a l V a l u e s
Capital Values (Australian $ / sq m)Rentals (Australian $/ sq m / Year)
PERTH OFFICE CAPITAL AND RENTAL VALUES
2008 2009 2010 2011 F 2012 F
-40,000
-20,000
0
20,000
40,000
60,000
80,000
100,000
120,000
s q m
-4.0%
-2.0%
0.0%
2.0%
4.0%
6.0%
8.0%
10.0%
12.0%
V a c a n c y R a t e
Supply Take-up Vacancy Rate
PERTH OFFICE SUPPLY, TAKE-UP &
VACANCY RATE
1 Q 2
0 0 8
2 Q 2
0 0 8
3 Q 2
0 0 8
4 Q 2
0 0 8
1 Q 2
0 0 9
2 Q 2
0 0 9
3 Q 2
0 0 9
4 Q 2
0 0 9
1 Q 2
0 1 0
2 Q 2
0 1 0
3 Q 2
0 1 0
4 Q 2
0 1 0
1 Q 2
0 1 1
2 Q 2
0 1 1 F
3 Q 2
0 1 1 F
4 Q 2
0 1 1 F
1 Q 2
0 1 2
F
2 Q 2
0 1 2
F
3 Q 2
0 1 2
F
4 Q 2
0 1 2
F
R e n t a l s
0
200
400
600
800
1,000
1,200
1,400
1,600
0
2,000
4,000
6,000
8,000
10,000
12,000
14,000
16,000
C a p i t a l V a l u e s
Capital Values (Australian $ / sq m)Rentals (Australian $/ sq m / Year)
SYDNEY OFFICE CAPITAL AND RENTAL VALUES
-100,000
-50,000
0
50,000
100,000
150,000
200,000
-6.0%
-3.0%
0.0%
3.0%
6.0%
9.0%
12.0%
2008 2009 2010 2011 F 2012 F
Supply Take-up Vacancy Rate
V a c a n c y R a t e
s q m
SYDNEY OFFICE SUPPLY, TAKE-UP &
VACANCY RATE
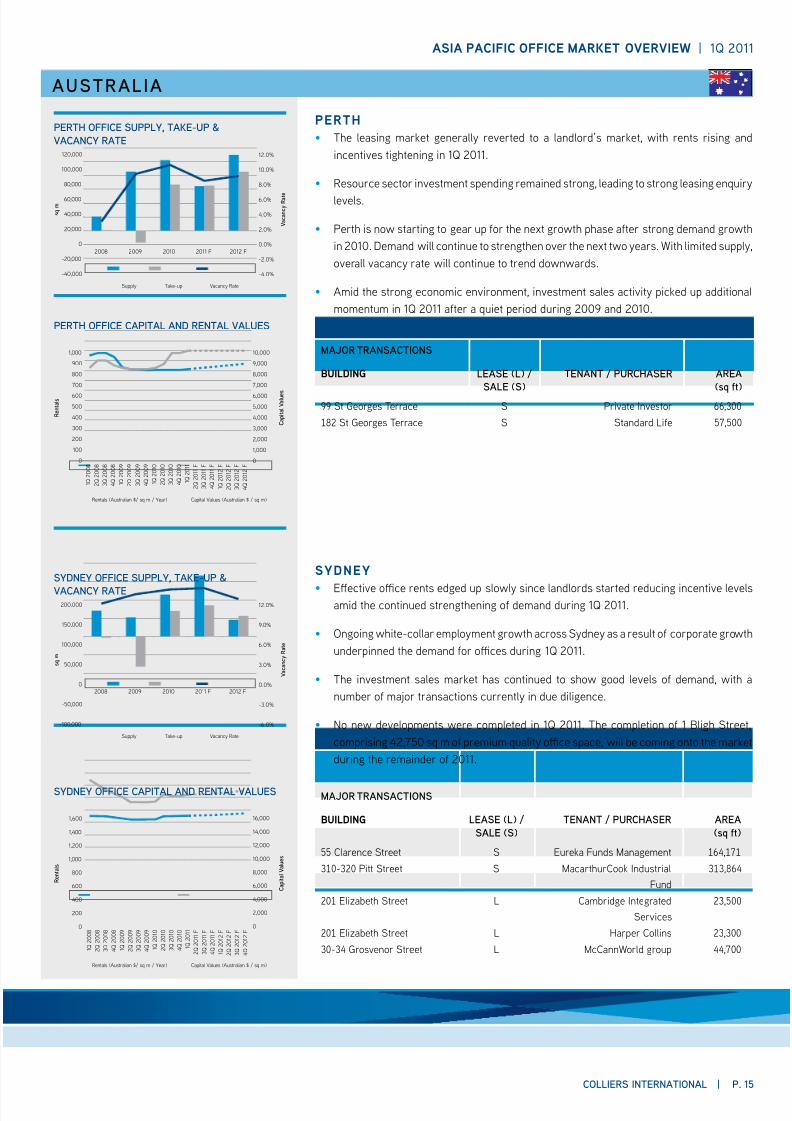
perth
• The leasing market generally reverted to a landlord’s market, with rents rising and
incentives tightening in Q .
• Resource sector investment spending remained strong, leading to strong leasing enquiry
levels.
• Perth is now starting to gear up or the next growth phase ater strong demand growth
in . Demand will continue to strengthen over the next two years. With limited supply,
overall vacancy rate will continue to trend downwards.
• Amid the strong economic environment, investment sales activity picked up additional
momentum in Q ater a quiet period during and .
mAjor trANsActioNs
Building leAse (l) /sAle (s)
teNANt / PurcHAser AreA(q )
99 St Georges Terrace S Private Investor 66,300
182 St Georges Terrace S Standard Lie 57,500
sydney
• Efective oce rents edged up slowly since landlords started reducing incentive levelsamid the continued strengthening o demand during Q .
• Ongoing white-collar employment growth across Sydney as a result o corporate growth
underpinned the demand or oces during Q .
• The investment sales market has continued to show good levels o demand, with a
number o major transactions currently in due diligence.
• No new developments were completed in Q . The completion o Bligh Street,
comprising , sq m o premium quality oce space, will be coming onto the market
during the remainder o .
mAjor trANsActioNs
Building leAse (l) /sAle (s)
teNANt / PurcHAser AreA(q )
55 Clarence Street S Eureka Funds Management 164,171
310-320 Pitt Street S MacarthurCook Industrial
Fund
313,864
201 Elizabeth Street L Cambridge Integrated
Services
23,500
201 Elizabeth Street L Harper Collins 23,300
30-34 Grosvenor Street L McCannWorld group 44,700
8/6/2019 Asia Pacific Office Q1 2011 | Colliers International Thailand
http://slidepdf.com/reader/full/asia-pacific-office-q1-2011-colliers-international-thailand 16/24P. 16 | colliers iNterNAtioNAl
asia pacific office market overview | 1Q 2011
New zeAlAND
1 Q 2
0 0 8
2 Q 2
0 0 8
3 Q 2
0 0 8
4 Q 2
0 0 8
1 Q 2
0 0 9
2 Q 2
0 0 9
3 Q 2
0 0 9
4 Q 2
0 0 9
1 Q 2
0 1 0
2 Q 2
0 1 0
3 Q 2
0 1 0
4 Q 2
0 1 0
1 Q 2
0 1 1
2 Q 2
0 1 1 F
3 Q 2
0 1 1 F
4 Q 2
0 1 1 F
1 Q 2
0 1 2
F
2 Q 2
0 1 2
F
3 Q 2
0 1 2
F
4 Q 2
0 1 2
F
Capital Values (New Zealand $ / sq m)Rentals (New Zealand $/ sq m / Year)
0
100
200
300
400
500
600
R e n t a l s
0
1,000
2,000
3,000
4,000
5,000
6,000
C a p i t a l V a l u e s
AUCKLAND OFFICE CAPITAL AND
RENTAL VALUES
0
10,000
20,000
30,000
40,000
50,000
60,000
70,000
80,000
s q m
V a c a n c y R a t e
0.0%
2.0%
4.0%
6.0%
8.0%
10.0%
12.0%
14.0%
16.0%
2008 2009 2010 2011 F 2012 F
Supply Take-up Vacancy Rate
AUCKLAND OFFICE SUPPLY, TAKE-UP &
VACANCY RATE
Capital Values (New Zealand $ / sq m)Rentals (New Zealand $/ sq m / Year)
R e n t a l s
C a p i t a l V a l u e s
1 Q 2
0 0 8
2 Q 2
0 0 8
3 Q 2
0 0 8
4 Q 2
0 0 8
1 Q 2
0 0 9
2 Q 2
0 0 9
3 Q 2
0 0 9
4 Q 2
0 0 9
1 Q 2
0 1 0
2 Q 2
0 1 0
3 Q 2
0 1 0
4 Q 2
0 1 0
1 Q 2
0 1 1
2 Q 2
0 1 1 F
3 Q 2
0 1 1 F
4 Q 2
0 1 1 F
1 Q 2
0 1 2
F
2 Q 2
0 1 2
F
3 Q 2
0 1 2
F
4 Q 2
0 1 2
F0
100
200
300
400
500
600
0
1,000
2,000
3,000
4,000
5,000
6,000
WELLINGTON OFFICE CAPITAL AND
RENTAL VALUES
0
20,000
40,000
60,000
80,000
100,000
s q m
0.0%
1.0%
2.0%
3.0%
4.0%
5.0%
V a c a n c y R a t e
2008 2009 2010 2011 F 2012 F
Supply Take-up Vacancy Rate
WELLINGTON OFFICE SUPPLY, TAKE-UP &
VACANCY RATE
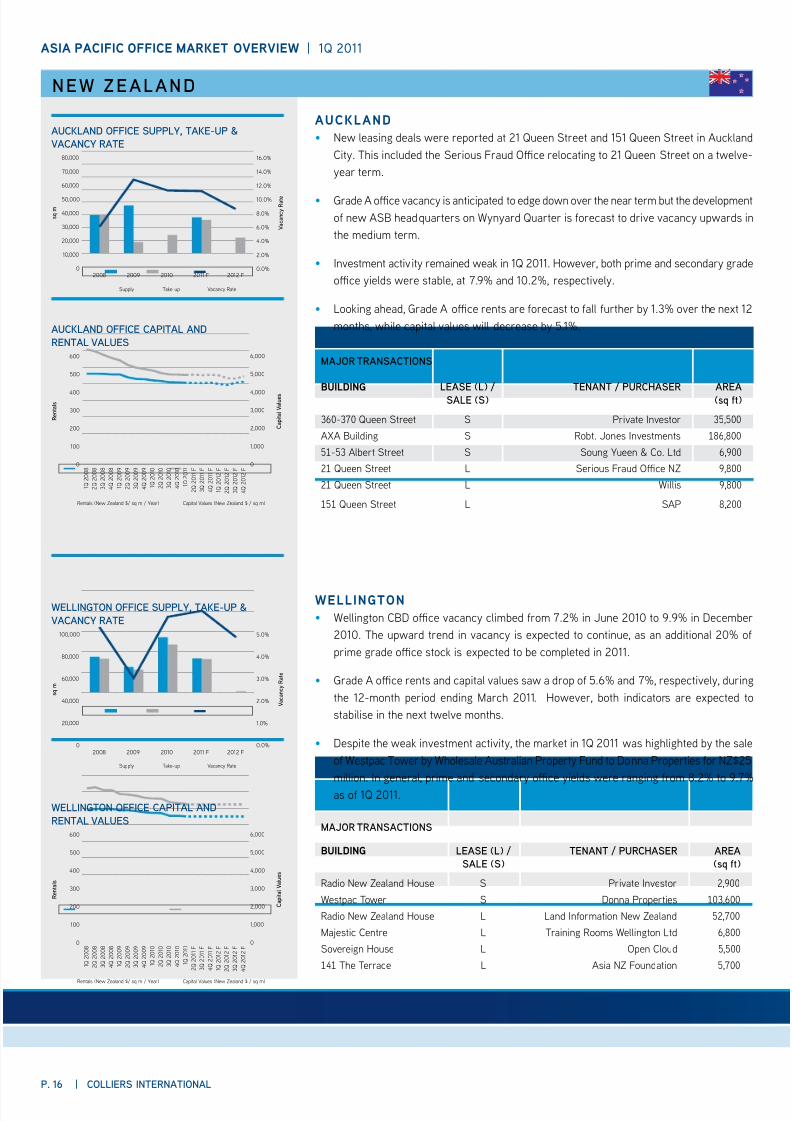
auckland
• New leasing deals were reported at Queen Street and Queen Street in Auckland
City. This included the Serious Fraud Oce relocating to Queen Street on a twelve-
year term.
• Grade A oce vacancy is anticipated to edge down over the near term but the development
o new ASB headquarters on Wynyard Quarter is orecast to drive vacancy upwards in
the medium term.
• Investment activity remained weak in Q . However, both prime and secondary grade
oce yields were stable, at .% and .%, respectively.
• Looking ahead, Grade A oce rents are orecast to all urther by .% over the next
months, while capital values will decrease by .%.
mAjor trANsActioNs
Building leAse (l) /sAle (s)
teNANt / PurcHAser AreA(q )
360-370 Queen Street S Private Investor 35,500
AXA Building S Robt. Jones Investments 186,800
51-53 Albert Street S Soung Yueen & Co. Ltd 6,900
21 Queen Street L Serious Fraud Oce NZ 9,800
21 Queen Street L Willis 9,800
151 Queen Street L SAP 8,200
wellington
• Wellington CBD oce vacancy climbed rom .% in June to .% in December
. The upward trend in vacancy is expected to continue, as an additional % o
prime grade oce stock is expected to be completed in .
• Grade A oce rents and capital values saw a drop o .% and %, respectively, during
the -month period ending March . However, both indicators are expected to
stabilise in the next twelve months.
• Despite the weak investment activity, the market in Q was highlighted by the sale
o Westpac Tower by Wholesale Australian Property Fund to Donna Properties or NZ$
million. In general, prime and secondary oce yields were ranging rom .% to .%
as o Q .
mAjor trANsActioNs
Building leAse (l) /sAle (s)
teNANt / PurcHAser AreA(q )
Radio New Zealand House S Private Investor 2,900
Westpac Tower S Donna Properties 103,600
Radio New Zealand House L Land Inormation New Zealand 52,700
Majestic Centre L Training Rooms Wellington Ltd 6,800
Sovereign House L Open Cloud 5,500
141 The Terrace L Asia NZ Foundation 5,700
8/6/2019 Asia Pacific Office Q1 2011 | Colliers International Thailand
http://slidepdf.com/reader/full/asia-pacific-office-q1-2011-colliers-international-thailand 17/24
asia pacific office market overview | 1Q 2011
colliers iNterNAtioNAl | P. 17
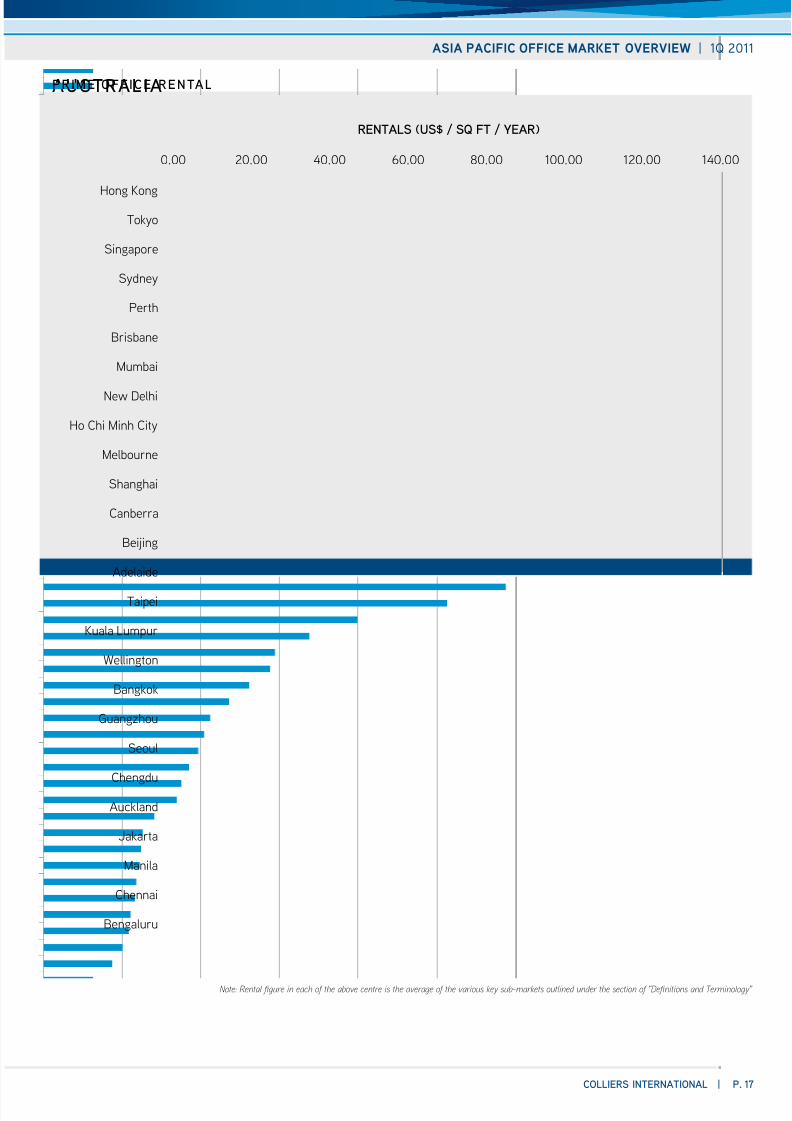
AustrAliAPrime oice reNtAl
Hong Kong
Tokyo
Singapore
Sydney
Perth
Brisbane
Mumbai
New Delhi
Ho Chi Minh City
Melbourne
Shanghai
Canberra
Beijing
Adelaide
Taipei
Kuala Lumpur
Wellington
Bangkok
Guangzhou
Seoul
Chengdu
Auckland
Jakarta
Manila
Chennai
Bengaluru
0.00 20.00 40.00 60.00 80.00 100.00 120.00 140.00
RENTALS (US$ / SQ FT / YEAR)
Note: Rental gure in each o the above centre is the average o the various key sub-markets outlined under the section o "Denitions and Terminology"
8/6/2019 Asia Pacific Office Q1 2011 | Colliers International Thailand
http://slidepdf.com/reader/full/asia-pacific-office-q1-2011-colliers-international-thailand 18/24
2011 2012 2011 2012 2011 2012 2011 2012 2011 2012
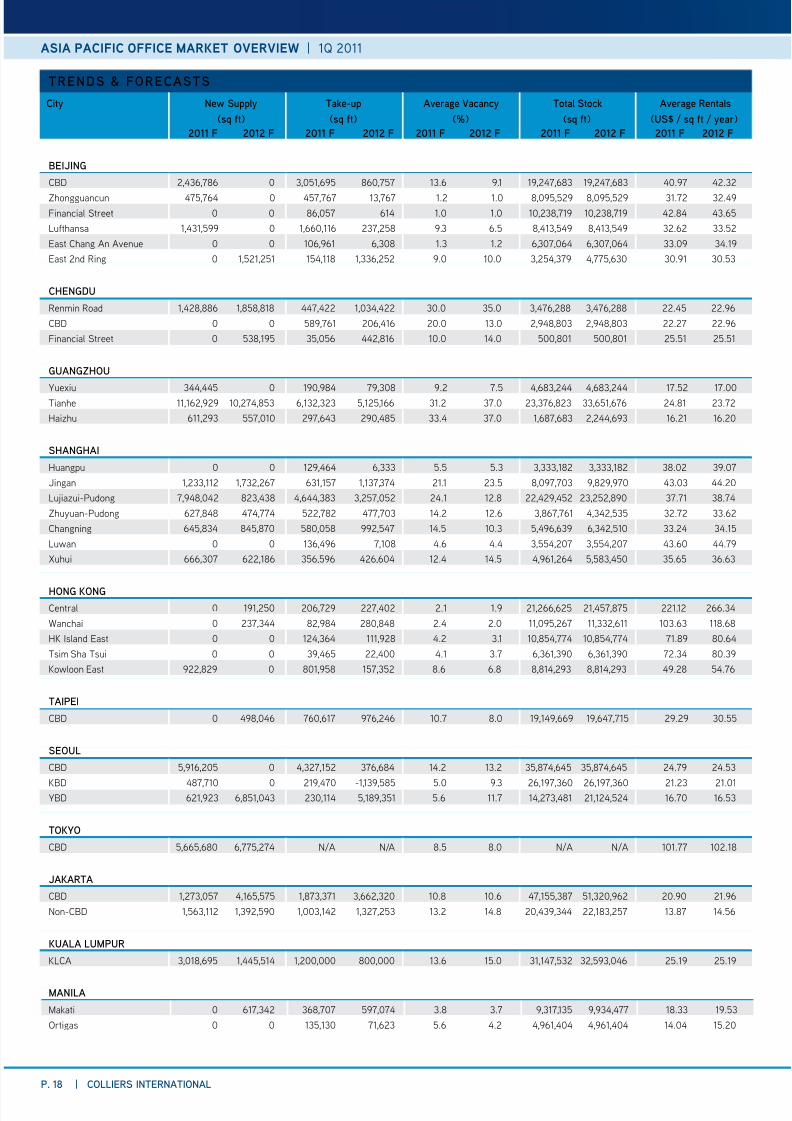
BeijiNG
CBD ,, ,, , . . ,, ,, . .
Zhongguancun , , , . . ,, ,, . .
Financial Street , . . ,, ,, . .
Luthansa ,, ,, , . . ,, ,, . .
East Chang An Avenue , , . . ,, ,, . .
East nd Ring ,, , ,, . . ,, ,, . .
cHeNGDu
Renmin Road ,, ,, , ,, . . ,, ,, . .
CBD , , . . ,, ,, . .
Financial Street , , , . . , , . .
GuANGzHou
Yuexiu , , , . . ,, ,, . .Tianhe ,, ,, ,, ,, . . ,, ,, . .
Haizhu , , , , . . ,, ,, . .
sHANGHAi
Huangpu , , . . ,, ,, . .
Jingan ,, ,, , ,, . . ,, ,, . .
Lujiazui-Pudong ,, , ,, ,, . . ,, ,, . .
Zhuyuan-Pudong , , , , . . ,, ,, . .
Changning , , , , . . ,, ,, . .
Luwan , , . . ,, ,, . .
Xuhui , , , , . . ,, ,, . .
HoNG koNG
Central , , , . . ,, ,, . .
Wanchai , , , . . ,, ,, . .
HK Island East , , . . ,, ,, . .
Tsim Sha Tsui , , . . ,, ,, . .
Kowloon East , , , . . ,, ,, . .
tAiPei
CBD , , , . . ,, ,, . .
seoul
CBD ,, ,, , . . ,, ,, . .
KBD , , -,, . . ,, ,, . .YBD , ,, , ,, . . ,, ,, . .
tokyo
CBD ,, ,, N/A N/A . . N/A N/A . .
jAkArtA
CBD ,, ,, ,, ,, . . ,, ,, . .
Non-CBD ,, ,, ,, ,, . . ,, ,, . .
kuAlA lumPur
KLCA ,, ,, ,, , . . ,, ,, . .
mANilA
Makati , , , . . ,, ,, . .
Ortigas , , . . ,, ,, . .
c N spp ta-p Aag vaan ta s Aag rna
(q ) (q ) (%) (q ) (us$ / q / a)
P. 18 | colliers iNterNAtioNAl
asia pacific office market overview | 1Q 2011
treNDs & orecAsts
8/6/2019 Asia Pacific Office Q1 2011 | Colliers International Thailand
http://slidepdf.com/reader/full/asia-pacific-office-q1-2011-colliers-international-thailand 19/24
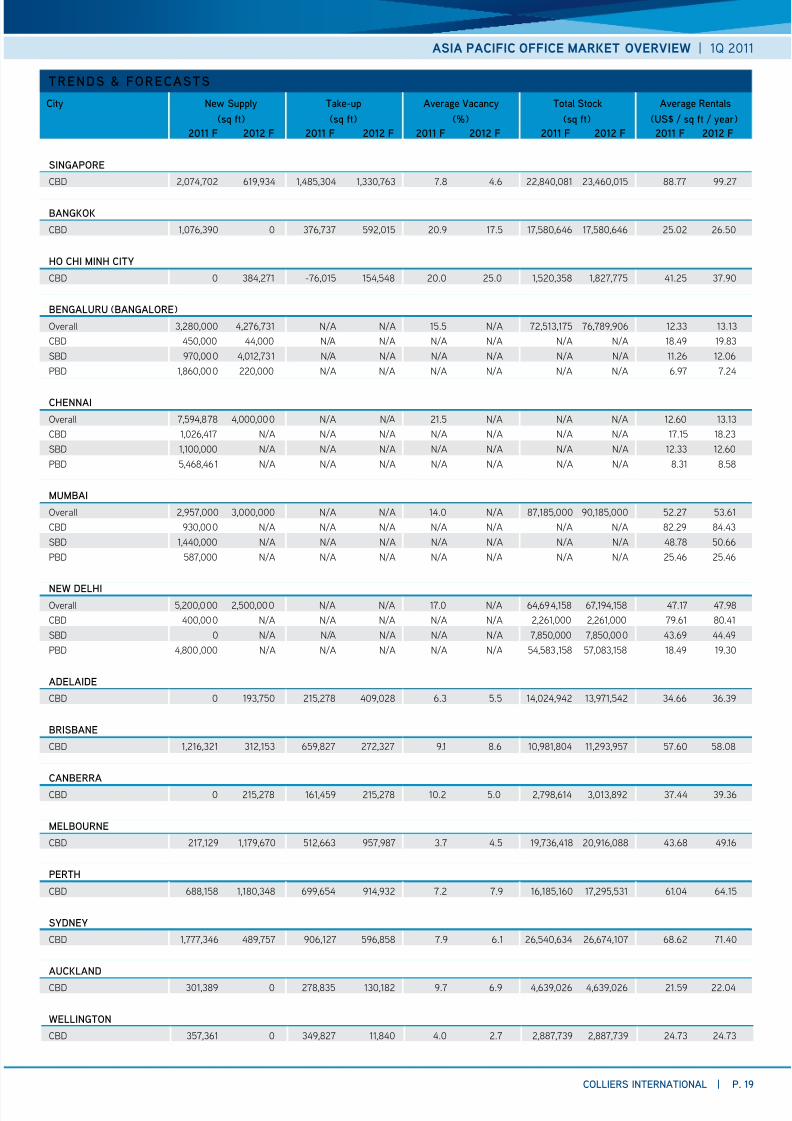
2011 2012 2011 2012 2011 2012 2011 2012 2011 2012
siNGAPore
CBD ,, , ,, ,, . . ,, ,, . .
BANGkok
CBD ,, , , . . ,, ,, . .
Ho cHi miNH city
CBD , -, , . . ,, ,, . .
BeNGAluru (BANGAlore)
Overall ,, ,, N/A N/A . N/A ,, ,, . .
CBD , , N/A N/A N/A N/A N/A N/A . .
SBD , ,, N/A N/A N/A N/A N/A N/A . .
PBD ,, , N/A N/A N/A N/A N/A N/A . .
cHeNNAi
Overall ,, ,, N/A N/A . N/A N/A N/A . .
CBD ,, N/A N/A N/A N/A N/A N/A N/A . .
SBD ,, N/A N/A N/A N/A N/A N/A N/A . .
PBD ,, N/A N/A N/A N/A N/A N/A N/A . .
mumBAi
Overall ,, ,, N/A N/A . N/A ,, ,, . .
CBD , N/A N/A N/A N/A N/A N/A N/A . .
SBD ,, N/A N/A N/A N/A N/A N/A N/A . .
PBD , N/A N/A N/A N/A N/A N/A N/A . .
New DelHiOverall ,, ,, N/A N/A . N/A ,, ,, . .
CBD , N/A N/A N/A N/A N/A ,, ,, . .
SBD N/A N/A N/A N/A N/A ,, ,, . .
PBD ,, N/A N/A N/A N/A N/A ,, ,, . .
ADelAiDe
CBD , , , . . ,, ,, . .
BrisBANe
CBD ,, , , , . . ,, ,, . .
cANBerrA
CBD , , , . . ,, ,, . .
melBourNe
CBD , ,, , , . . ,, ,, . .
PertH
CBD , ,, , , . . ,, ,, . .
syDNey
CBD ,, , , , . . ,, ,, . .
AucklAND
CBD , , , . . ,, ,, . .
welliNGtoN
CBD , , , . . ,, ,, . .
c N spp ta-p Aag vaan ta s Aag rna
(q ) (q ) (%) (q ) (us$ / q / a)
asia pacific office market overview | 1Q 2011
colliers iNterNAtioNAl | P. 19
treNDs & orecAsts
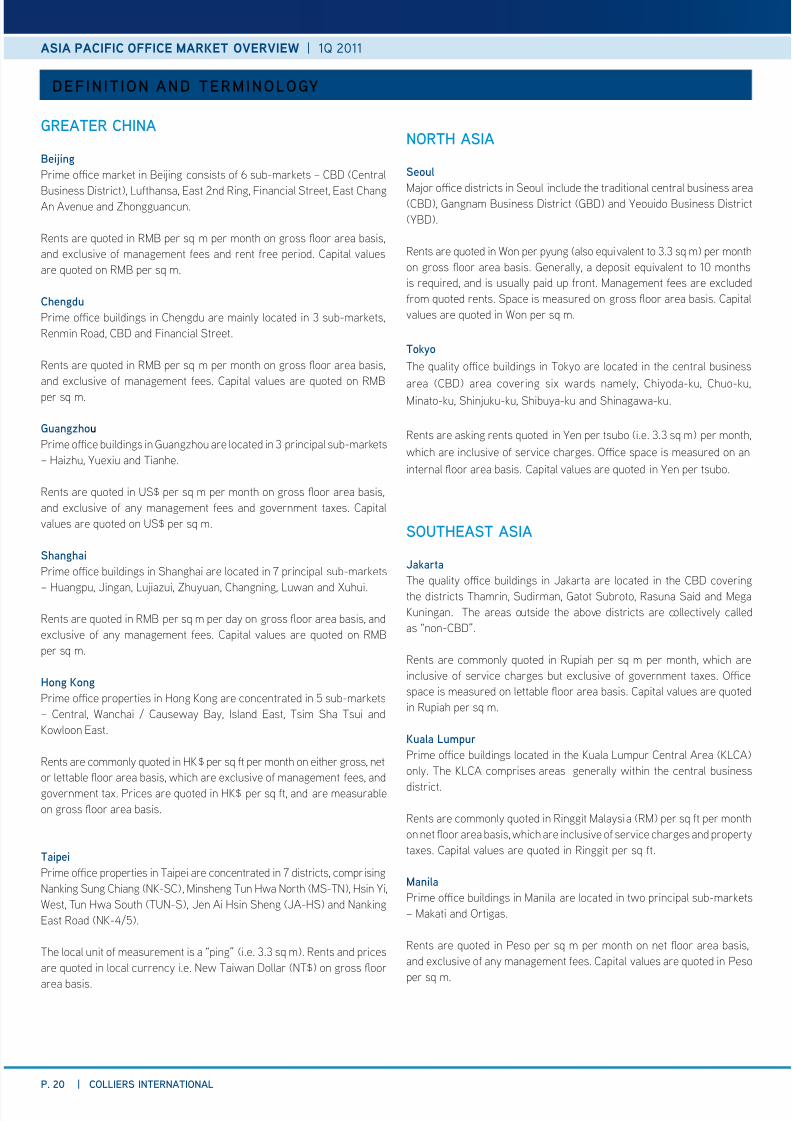
8/6/2019 Asia Pacific Office Q1 2011 | Colliers International Thailand
http://slidepdf.com/reader/full/asia-pacific-office-q1-2011-colliers-international-thailand 20/24P. 20 | colliers iNterNAtioNAl
asia pacific office market overview | 1Q 2011
DeiNitioN AND termiNoloGy
GreAter cHiNA
Bng
Pm o m bj o o 6 u-m – cbD (c
bu D), luh, e 2d r, s, e cha au d Zhouu.
r quod rMb p q m p moh o o oo ,
d xu o mm d pod. cp u
quod o rMb p q m.
chngd
Pm o ud chdu my od 3 u-m,
rm rod, cbD d s.
r quod rMb p q m p moh o o oo ,
d xu o mm . cp u quod o rMb
p q m.
Gangh
Pm o ud guzhou od 3 pp u-m
– Hzhu, Yuxu d th.
r quod Us$ p q m p moh o o oo ,
d xu o y mm d om x. cp
u quod o Us$ p q m.
shangha
Pm o ud shh od 7 pp u-m
– Hupu, J, lujzu, Zhuyu, ch, lu d Xuhu.
r quod rMb p q m p dy o o oo , d
xu o y mm . cp u quod o rMb
p q m.
Hng kng
Pm o pop Ho ko od 5 u-m
– c, wh / cuy by, id e, tm sh tu d
kooo e.
r ommoy quod Hk$ p q p moh o h o,
o oo , hh xu o mm , d
om x. P quod Hk$ p q , d mu
o o oo .
tap
Pm o pop tp od 7 d, omp
n su ch (nk-sc), Mh tu H noh (Ms-tn), H Y,
w, tu H souh (tUn-s), J a H sh (Ja-Hs) d n
e rod (nk-4/5).
th o u o mum “p” (.. 3.3 q m). r d p
quod o uy .. n t Do (nt$) o o oo
.
NortH AsiA
s
Mjo o d sou ud h do u
(cbD), gm bu D (gbD) d Youdo bu D
(YbD).
r quod wo p pyu (o qu o 3.3 q m) p moh
o o oo . gy, dpo qu o 10 moh
qud, d uuy pd up o. Mm xudd
om quod . sp mud o o oo . cp
u quod wo p q m.
t
th quy o ud toyo od h u
(cbD) o x d my, chyod-u, chuo-u,
Mo-u, shjuu-u, shuy-u d sh-u.
r quod Y p uo (.. 3.3 q m) p moh,
hh u o h. O p mud o
oo . cp u quod Y p uo.
soutHeAst AsiA
jaaa
th quy o ud J od h cbD o
h d thm, sudm, go suoo, ru sd d M
ku. th oud h o d oy d
“o-cbD”.
r ommoy quod ruph p q m p moh, hh
u o h u xu o om x. O
p mud o oo . cp u quod
ruph p q m.
kaa lp
Pm o ud od h ku lumpu c a (klca)
oy. th klca omp y h h u
d.
r ommoy quod r My (rM) p q p moh
o oo , hh u o h d popy
x. cp u quod r p q .
mana
Pm o ud M od o pp u-m
– M d O.
r quod Po p q m p moh o oo ,
d xu o y mm . cp u quod Po
p q m.
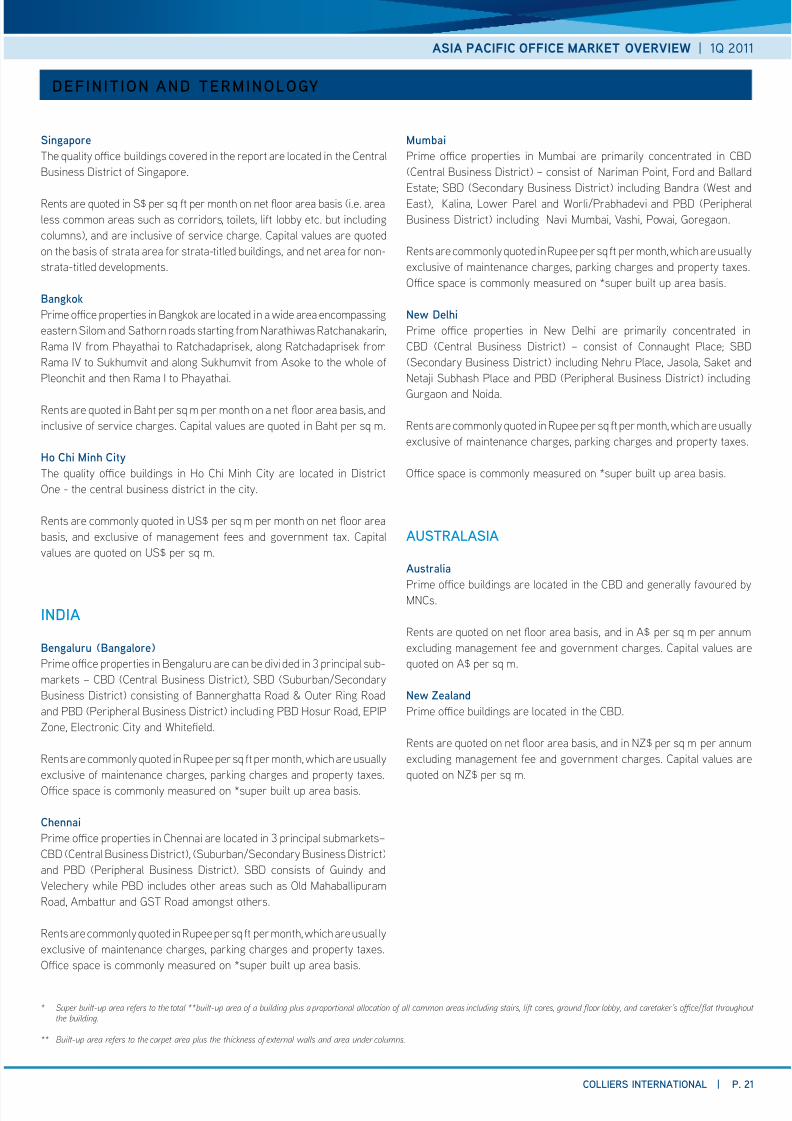
8/6/2019 Asia Pacific Office Q1 2011 | Colliers International Thailand
http://slidepdf.com/reader/full/asia-pacific-office-q1-2011-colliers-international-thailand 21/24
asia pacific office market overview | 1Q 2011
colliers iNterNAtioNAl | P. 21
DeiNitioN AND termiNoloGy
sngap
th quy o ud od h po od h c
bu D o spo.
r quod s$ p q p moh o oo (..
ommo uh odo, o, oy . u ud
oum), d u o h. cp u quod
o h o o -d ud, d o o-
-d dopm.
Bang
Pm o pop bo od d omp
som d sho od om nh rh,
rm iv om Phyh o rhdp, o rhdp om
rm iv o suhum d o suhum om ao o h ho o
Poh d h rm i o Phyh.
r quod bh p q m p moh o oo , d
u o h. cp u quod bh p q m.
H ch mnh c
th quy o ud Ho ch Mh cy od D
O - h u d h y.
r ommoy quod Us$ p q m p moh o oo
, d xu o mm d om x. cp
u quod o Us$ p q m.
iNDiA
Bnga (Banga)
Pm o pop buu ddd 3 pp u-
m – cbD (c bu D), sbD (suu/sody
bu D) o o bh rod & Ou r rod
d PbD (Pph bu D) ud PbD Hou rod, ePiP
Zo, eo cy d whd.
r ommoy quod rup p q p moh, hh uuy
xu o m h, p h d popy x.
O p ommoy mud o *up u up .
chnna
Pm o pop ch od 3 pp um–
cbD (c bu D), (suu/sody bu D)
d PbD (Pph bu D). sbD o o gudy d
vhy h PbD ud oh uh Od Mhpum
rod, amu d gst rod mo oh.
r ommoy quod rup p q p moh, hh uu y
xu o m h, p h d popy x.
O p ommoy mud o *up u up .
mba
Pm o pop Mum pmy od cbD
(c bu D) – o o nm Po, od d bd
e; sbD (sody bu D) ud bd (w d
e), k, lo P d wo/Phd d PbD (Pph
bu D) ud n Mum, vh, Po, goo.
r ommoy quod rup p q p moh, hh uu y
xu o m h, p h d popy x.
O p ommoy mud o *up u up .
N Dh
Pm o pop n Dh pmy od
cbD (c bu D) – o o couh P; sbD
(sody bu D) ud nhu P, Jo, s d
nj suhh P d PbD (Pph bu D) ud
guo d nod.
r ommoy quod rup p q p moh, hh uuy
xu o m h, p h d popy x.
O p ommoy mud o *up u up .
AustrAlAsiA
Aaa
Pm o ud od h cbD d y oud yMnc.
r quod o oo , d a$ p q m p um
xud mm d om h. cp u
quod o a$ p q m.
N zaand
Pm o ud od h cbD.
r quod o oo , d nZ$ p q m p um
xud mm d om h. cp u
quod o nZ$ p q m.
* Super built-up area reers to the total **built-up area o a building plus a proportional allocation o all common areas including stairs, lit cores, ground oor lobby, and caretaker’s ofce/at throughout the building.
** Built-up area reers to the carpet area plus the thickness o external walls and area under columns.
8/6/2019 Asia Pacific Office Q1 2011 | Colliers International Thailand
http://slidepdf.com/reader/full/asia-pacific-office-q1-2011-colliers-international-thailand 22/24P. 22 | colliers iNterNAtioNAl
asia pacific office market overview | 1Q 2011
greater china
Bng, chna502 to w3, O Pzno 1 e ch au,
Doh Dbj 100738t : 86 10 8518 1633x : 86 10 8518 1638Aanda GaM Do, noh [email protected]
chngd, chnaU 1504 Yod ldm1 rm souh rod so 2chdu 610016t : 86 28 8658 6288x : 86 28 8672 3226
ja tag M
Gangh, chna702 tm to,208 th rodguzhou 510620t : 86 20 3819 3888x : 86 20 3819 3899e laM [email protected]
shangha, chna16 Ho ko n wod to300 Huh Zho rodshh 200021t : 86 21 6141 3688x : 86 21 6141 3699lna wngM Do, e dsouh w [email protected]
Hng kng, HksAr5701 c Pz,
18 Hou rodwh, Ho Hocompy l no: c-006052t : 852 2828 9888x : 852 2828 9899rhad kM [email protected]
P Bnn (e-183614)ch exu O - [email protected]
tap, taan49 taiPei 101 tOwerno. 7 X Y rod s 5, tp 110t : 886 2 8101 2000x : 886 2 8101 2345
And lM [email protected]
north asia
s, sh ka10 ko toum Ozo bd.,10 D-do,Ju-u, sou 100-180t : 82 2 6740 2000x : 82 2 318 2015ja ynso Do & g M
t, japanHx bud3-16-26 roppoMo-u, toyo 106-0032 Jpt : 81 3 5563 2111x : 81 3 5563 2100ja nso M Do
south east asia
jaaa, indna10 wod td c,J Jd sudmk 29-31 J 12920t : 62 21 521 1400x : 62 21 521 1411m BM [email protected]
kaa lp, maaa/ ma lapad*
M Docopo souo | a Pt : 65 6531 8601x : 65 6557 [email protected]* bd spo
Research data provided by c H wa taha & wng sdn Bhd30-01, 30h ooM Mu-Pupo @ cpsqu8 J Muh aduhP O box 1215750100 ku lumpuMy
t : 603 2616 8888x : 603 2616 8899Url : hp://..om.my G jnM [email protected]
mana, Phppn10 to 2 rcbc Pz,ay au, M cyPhpp1226t : 63 2 888 9988
x : 63 2 845 2612Dad yngM [email protected]
sngap1 rf P#45-00 O rf Pspo 048616t : 65 6223 2323x : 65 6222 4901Dnn yM Dospo & idu s | a
Bang, thaand17/ Poh c2 suhum rodkooy, bo 10110t : 66 2 656 7000x : 66 2 656 7111Paa japaM [email protected]
H ch mnh c, vna
Ho ch Mh cy, vm7 bxo bud19-25 nuy Hu sD 1, Ho ch Mh cyt : 84 8 827 5665x : 84 8 827 5667P Dnnngg [email protected]
Han, vnavp - t tm bud,9h oo,39a no Quy s
Ho km D, Ho, vmt : 84 4 220 5888
84 4 220 5566x : 84 4 220 1133D l QanDpuy g [email protected]
h da, pa na:
8/6/2019 Asia Pacific Office Q1 2011 | Colliers International Thailand
http://slidepdf.com/reader/full/asia-pacific-office-q1-2011-colliers-international-thailand 23/24
asia pacific office market overview | 1Q 2011
colliers iNterNAtioNAl | P. 23
india
Bnga, indaP g, l 2, U no.201/20236 Uoo rod, buu 560 042
t : 91 80 4079 5500x : 91 80 4112 3131Ga chaabO [email protected]
chnna, indaU 1c, 1 oo, H compx,23 spu rod, chp,ch 600 031t : 91 44 2836 1064x : 91 44 2836 1377kah rddO Do
Ggan, indag3, nbd bu c,thoPo, Dl go couM so rodso 54, guo 122 002t : 91 124 4375807x : 91 124 4375806saah chaaO [email protected]
kaa, indaru bu c co, l 6,ko 700017t : 91 33 4400 0541x : 91 33 4400 0555j vghM Do
mba, inda31-a, 3d oo, m c,68 tdo rodMum 400 034t : 91 22 4050 4500
x : 91 22 2351 4272Pna mahanO [email protected]
Gg mkasouh a DoO & id [email protected]
N Dh, inda204/205, 2d oo,khju bud,18 bhm rodn Dh 110 001
t : 91 11 4360 7500x : 91 11 2335 6624P PaO [email protected]
Pn, indav bu c, l-5c w, Phh th P-1,YdPu 411 006t : 91 20 4011 1356x : 91 20 6640 3138sh can
australasia
Adad, Aaal 10, 99 g P,add sa 5000t : 61 8 8305 8888x : 61 8 8231 7712ja yngs ch exu
Bban, Aaal 20 c Pz O345 Qu sb QlD 4000t : 07 3229 1233x : 07 3120 4555sn Bns ch [email protected]
canba, Aaagoud oo, 21-23 Mu c s
c act 2601t : 61 2 6257 2121x : 61 2 6257 2937Pa Pds ch [email protected]
mbn, Aaal 32 367 co sMou vic 3000t : 61 3 9629 8888x : 61 3 9629 8549
jhn maas ch exu [email protected]
Ph, Aaal 19, 140 s go tPh wa 6000t : 61 8 9261 6666x : 61 8 9261 6665k. ian mhddns ch [email protected]
sdn, Aaal 12, goo P,225 go ssydy nsw 2000t : 61 2 9257 0222x : 61 2 9251 3297ma tns ch [email protected]
Aand, N zaandl 27, 151 Qu s, audt : 64 9 358 1888x : 64 9 358 1999
ma snnM [email protected]
wngn, N zaandl 10, 36 cuomhou Quywot : 64 4 473 4413x : 64 4 499 1550 (ay)
: 64 4 470 3902 (vuo)rhad ndaM [email protected]
This document has been prepared by Colliers International or advertising and general inormation only. Colliers International makes no guarantees, representations or warranties o any kind, expressed or implied,regarding the inormation including, but not limited to, warranties o content, accuracy and reliability. Any interested party should undertake their own inquiries as to the accuracy o the inormation. Colliers Internationalexcludes unequivocally all inerred or implied terms, conditions and warranties arising out o this document and excludes all liability or loss and damages arising there rom. This publication is the copyrighted propertyo Colliers International and/or its licensor(s). ©. All rights reserved.
Colliers International is the third largest global real estate services company.
8/6/2019 Asia Pacific Office Q1 2011 | Colliers International Thailand
http://slidepdf.com/reader/full/asia-pacific-office-q1-2011-colliers-international-thailand 24/24