Embed Size (px)
Citation preview
Asia in 2025Development prospects and challenges for middle-income countriesGaneshan Wignaraja, Judith Tyson, Annalisa Prizzon and
Dirk Willem te VeldeSeptember 2018
Report

Readers are encouraged to reproduce material from ODI publications for their own outputs, as long as they are not being sold commercially. As copyright holder, ODI
requests due acknowledgement and a copy of the publication. For online use, we ask readers to link to the original resource on the ODI website. The views presented in
this paper are those of the author(s) and do not necessarily represent the views of ODI.
© Overseas Development Institute 2018. This work is licensed under CC BY-NC 4.0.
Cover photo: Mega Kuningan, South Jakarta. Credit: Everyone Sinks Starco.
3
Acknowledgements
This report is an output of a partnership between Australia’s Department of Foreign Affairs and Trade (DFAT) and the Overseas Development Institute (ODI). We are grateful to colleagues from DFAT for encouragement and comments. Lars Engen provided research support for Section 5 and Appendix B. Pabasara Kannangara provided research assistance for Section 6. Sheila Page provided peer review.
The authors acknowledge financial support for this paper from DFAT as part of the partnership between DFAT and ODI. The views presented in this paper are those of the authors and do not necessarily represent the views of DFAT or the Commonwealth of Australia. The Commonwealth of Australia accepts no responsibility for any loss, damage or injury resulting from reliance on any of the information or views contained in this publication.
4
Contents
Acknowledgements 3
List of tables and figures 6
Acronyms and abbreviations 8
Executive summary 9
1 Introduction 11
1.1 Dissecting the ‘Asian century’ story 11
1.2 Aim of the study 11
2 Macroeconomic outlook up to 2025 13
2.1 Population growth 13
2.2 Gross domestic product growth 14
2.3 Share of world gross domestic product 16
2.4 Trade growth 16
2.5 Income per head 17
2.6 Inflation 18
2.7 Emerging risks and key ‘mega-trends’ 18
3 China-centred global value chains and implications for regional trade and investment 20
3.1 Introduction 20
3.2 Explaining the post-crisis slowdown 20
3.3 New global value chain trading opportunities 25
3.4 Business environment 27
3.5 Firm-level factors 29
3.6 Conclusion and implications for development partners 30
5
4 Macro-financial implications and risks of the Belt and Road Initiative for Asia’s economies 32
4.1 Introduction 32
4.2 Overview of the Belt and Road Initiative 32
4.3 Economic risks and opportunities 33
4.4 Project risks 34
4.5 Debt sustainability 34
4.6 Political risks 36
4.7 Conclusions and implications for development partners 36
5 Trends in poverty and inequality 38
5.1 Most countries in the region are now classified as middle-income 38
5.2 Progress on poverty eradication and human development 39
5.3 Selected development challenges for middle-income countries in the region 41
5.4 Conclusions and implications for development partners 42
6 Identifying successful and vulnerable Asian countries 44
6.1 The vulnerability score 44
6.2 Discussion of the findings 46
7 Conclusions: implications for development partners in the Asia region 51
Bibliography 54
Annex 1 Detailed macroeconomic forecasts 58
Annex 2 The changing development finance landscape in Asian countries 74
6
List of tables and figures
Tables
Table 1 World shares of intermediate goods exports, 2000–2016 (%) 21
Table 2 Ratio of intermediate goods imports to manufactured exports (%) 22
Table 3 Annual real growth in China’s goods imports from developing Asia (%) 24
Table 4 Business environment in China and major Chinese FDI recipients 28
Table 5 Alternative vulnerability indices 47
Table 6 Individual components of the vulnerability index 48
Table 7 Comparison with the UNDP HDI and the World Bank Doing Business scores 50
Table 8 A typology of donor actions in Asian countries 52
Table A1:1 Population, 2000, 2010, 2017, 2025 58
Table A1:2 Total dependency ratio 2000, 2010, 2017, 2025* 60
Table A1:3 GDP growth, 2000–2025 (% per year) 64
Table A1:4 Shares of world GPD, 2000–2025 66
Table A1:5 Trade growth, 2000–2025 (% per year) 68
Table A1:6 GDP per capita 2000, 2010, 2017 and 2025 70
Table A1:7 Annual inflation, 2000–2025 (% per year) 72
Table A2:1 Which Asian countries will cross the per capita income threshold triggering graduation from
non-concessional assistance? 76
7
Figures
Figure 1 Dependency ratio by sub-region, 2015 and 2025 14
Figure 2 Gross domestic product, constant prices, 2000–2025 14
Figure 3 Total volume of goods and services, 2000–2025 16
Figure 4 Income per head in 2025, by sub-region 17
Figure 5 Developing Asia’s five richest and five poorest countries by 2025 (GDP per capita) 18
Figure 6 Ratio of intermediate goods imports to manufactured exports, 2000–2016 (%) 22
Figure 7 NTMs in force imposed against China, 2000–2017 24
Figure 8 Key recipients of Chinese outward manufacturing FDI, 2005–2010 and 2011–2016 25
Figure 9 Value-added share of gross manufactured exports in China, 2000–2015 26
Figure 10 Debt to GNI ratios: 2016 debt and BRI-related debt 35
Figure 11 GDP growth rates and BRI-related debt 35
Figure 12 Asian countries: classification by income status, 2000–2025 38
Figure 13 Trends in absolute global poverty, 1990–2030 39
Figure 14 Evolution in relative poverty by region, 2000–2016 (share of population under relative poverty line) 40
Figure 15 Trends in human development indicators by region, 1990–2014 40
Figure 16 Globally, poor people are increasingly concentrated in fragile countries, 2000–2030 41
Figure 17 Share of population living below the absolute poverty line in Asia and the Pacific to 2025 41
Figure 18 The ‘vulnerability score’ by country/economy 45
Figure A2:1 Geographical allocation of CPA, 2010–2019 74
Figure A2:2 ODA/GNI ratio (2016 data) – DAC members and non-DAC members reporting to the DAC 75
Figure A2:3 The missing middle of development finance: the case of Indonesia (official finance and government
revenues as a % of GDP) 76
Figure A2:4 Other examples of the transition from concessional finance – Papua New Guinea, Viet Nam, Mongolia
and Sri Lanka, 2015–2019 (aid and government revenues as a % of GDP) 77
8
Acronyms and abbreviations
ADB Asian Development Bank
ADBI ADB Institute
AIIB Asian Infrastructure Investment Bank
BEC broad economic category
BRI Belt and Road Initiative
CPA country programmable aid
DAC Development Assistance Committee (OECD)
EC European Commission
EU European Union
FDI foreign direct investment
GDP gross domestic product
GNI gross national income
GVC global value chain
HDI Human Development Index
IFI international financial institution
IMF International Monetary Fund
ISO International Organization for Standards
MDB multilateral development bank
MIC middle-income country
MNC multinational corporation
NTM non-tariff measure
ODA official development assistance
ODI Overseas Development Institute
OECD Organisation for Economic Co-operation and Development
PPP purchasing power parity
PwC PricewaterhouseCoopers
R&D research and development
RMB renminbi
SITC Standard International Trade Classification
SMEs small and medium enterprises
UN United Nations
UNDP UN Development Programme
US United States
WTO World Trade Organization
9
Executive summary
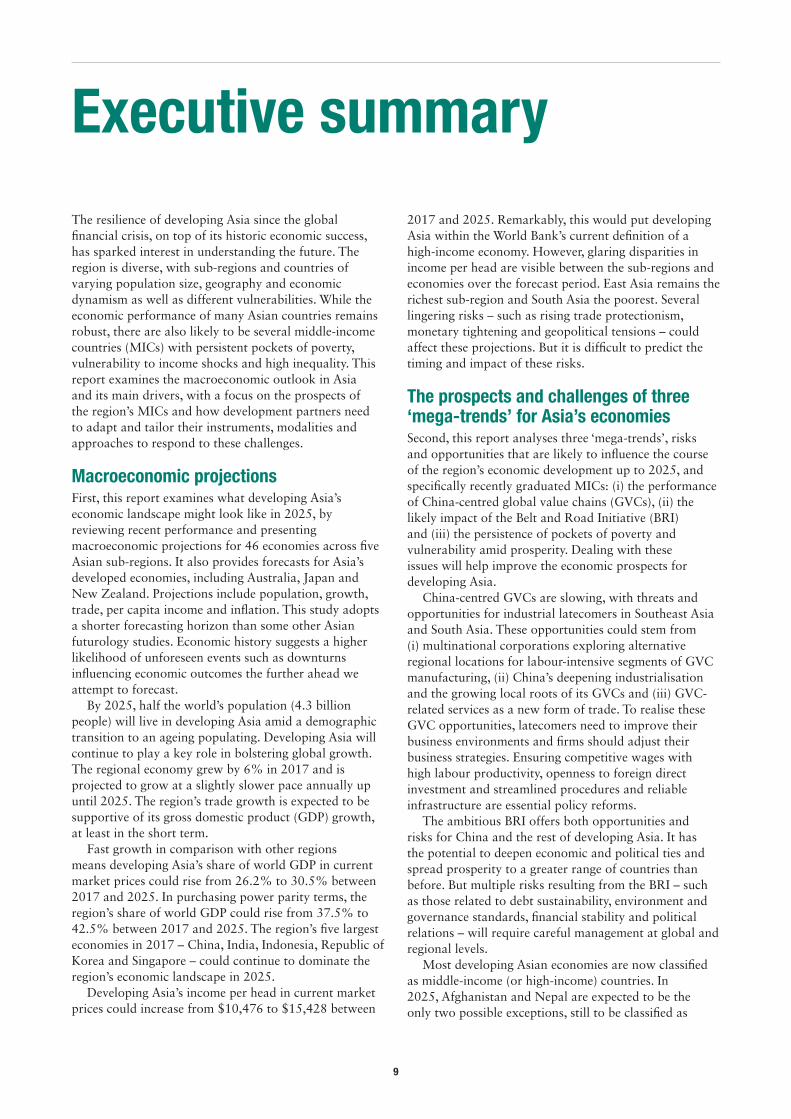
The resilience of developing Asia since the global financial crisis, on top of its historic economic success, has sparked interest in understanding the future. The region is diverse, with sub-regions and countries of varying population size, geography and economic dynamism as well as different vulnerabilities. While the economic performance of many Asian countries remains robust, there are also likely to be several middle-income countries (MICs) with persistent pockets of poverty, vulnerability to income shocks and high inequality. This report examines the macroeconomic outlook in Asia and its main drivers, with a focus on the prospects of the region’s MICs and how development partners need to adapt and tailor their instruments, modalities and approaches to respond to these challenges.
Macroeconomic projectionsFirst, this report examines what developing Asia’s economic landscape might look like in 2025, by reviewing recent performance and presenting macroeconomic projections for 46 economies across five Asian sub-regions. It also provides forecasts for Asia’s developed economies, including Australia, Japan and New Zealand. Projections include population, growth, trade, per capita income and inflation. This study adopts a shorter forecasting horizon than some other Asian futurology studies. Economic history suggests a higher likelihood of unforeseen events such as downturns influencing economic outcomes the further ahead we attempt to forecast.
By 2025, half the world’s population (4.3 billion people) will live in developing Asia amid a demographic transition to an ageing populating. Developing Asia will continue to play a key role in bolstering global growth. The regional economy grew by 6% in 2017 and is projected to grow at a slightly slower pace annually up until 2025. The region’s trade growth is expected to be supportive of its gross domestic product (GDP) growth, at least in the short term.
Fast growth in comparison with other regions means developing Asia’s share of world GDP in current market prices could rise from 26.2% to 30.5% between 2017 and 2025. In purchasing power parity terms, the region’s share of world GDP could rise from 37.5% to 42.5% between 2017 and 2025. The region’s five largest economies in 2017 – China, India, Indonesia, Republic of Korea and Singapore – could continue to dominate the region’s economic landscape in 2025.
Developing Asia’s income per head in current market prices could increase from $10,476 to $15,428 between
2017 and 2025. Remarkably, this would put developing Asia within the World Bank’s current definition of a high-income economy. However, glaring disparities in income per head are visible between the sub-regions and economies over the forecast period. East Asia remains the richest sub-region and South Asia the poorest. Several lingering risks – such as rising trade protectionism, monetary tightening and geopolitical tensions – could affect these projections. But it is difficult to predict the timing and impact of these risks.
The prospects and challenges of three ‘mega-trends’ for Asia’s economiesSecond, this report analyses three ‘mega-trends’, risks and opportunities that are likely to influence the course of the region’s economic development up to 2025, and specifically recently graduated MICs: (i) the performance of China-centred global value chains (GVCs), (ii) the likely impact of the Belt and Road Initiative (BRI) and (iii) the persistence of pockets of poverty and vulnerability amid prosperity. Dealing with these issues will help improve the economic prospects for developing Asia.
China-centred GVCs are slowing, with threats and opportunities for industrial latecomers in Southeast Asia and South Asia. These opportunities could stem from (i) multinational corporations exploring alternative regional locations for labour-intensive segments of GVC manufacturing, (ii) China’s deepening industrialisation and the growing local roots of its GVCs and (iii) GVC-related services as a new form of trade. To realise these GVC opportunities, latecomers need to improve their business environments and firms should adjust their business strategies. Ensuring competitive wages with high labour productivity, openness to foreign direct investment and streamlined procedures and reliable infrastructure are essential policy reforms.
The ambitious BRI offers both opportunities and risks for China and the rest of developing Asia. It has the potential to deepen economic and political ties and spread prosperity to a greater range of countries than before. But multiple risks resulting from the BRI – such as those related to debt sustainability, environment and governance standards, financial stability and political relations – will require careful management at global and regional levels.
Most developing Asian economies are now classified as middle-income (or high-income) countries. In 2025, Afghanistan and Nepal are expected to be the only two possible exceptions, still to be classified as
10
low-income. The region stands out when it comes to the rapid fall in the share of the population living below the extreme poverty line and to swift improvements in human development. However, such trends occur amid development challenges, including pockets of persistent poverty, income vulnerability and growing income inequality. Some countries continue to confront fragile situations associated with long-term and often subnational conflict.
Identifying successful and vulnerable countriesThird, we assess how vulnerable developing Asia-Pacific economies are against the macroeconomic outlook and the three ‘mega-trends’ – that is, China-centred GVCs; the impact of BRI investments on public debt; and persistent poverty gaps and growing income inequality. Each country is scored on six dimensions: economic prospects, trade capabilities, debt accumulation associated with the BRI, social development, population dependency and special vulnerabilities related to national circumstances, for example fragility or adverse geography (small island economy or landlocked country). Our modest objective is to synthesise the data already analysed in this study in an attempt to highlight vulnerability in developing Asia during the middle-income transition. We group countries in three distinct groups: (i) highly vulnerable, (ii) vulnerable and (iii) robust.
The three highly vulnerable economies mapped by macroeconomic prospects/shocks, population dependency and the three mega-trends are Afghanistan, Lao People’s Democratic Republic (PDR) and Tajikistan.
The 18 vulnerable economies are Armenia, Bangladesh, Bhutan, Cambodia, Georgia, Kazakhstan, Kyrgyz Republic, India, Indonesia, Maldives, Mongolia, Myanmar, Nepal, Pakistan, the Philippines, Sri Lanka, Turkmenistan and Uzbekistan.
Myanmar and Kyrgyz Republic seem to be at the higher end of the vulnerability scale and risk falling into the highly vulnerable category.
The remainder are considered robust, and comprise China, Hong Kong, Malaysia, Singapore, Republic of Korea, Taiwan and Thailand.
Sensitivity analysis suggests that the country classifications inevitably vary somewhat according to the composition of the indices used, but that a composite vulnerability index including all six dimensions is useful. A reasonable correlation also exists between our vulnerability index and the United Nations Development
Programme’s Human Development Index, as well as the World Bank’s Doing Business rankings. Thus, mapping different dimensions of vulnerability shows broadly similar country-level outcomes.
Implications for development partnersFinally, what do these trends mean for development partners? The region’s foreign aid landscape is fundamentally shifting, within the context of an ‘age of choice’ in terms of increasing providers of development finance, with some regional economies (such as China and India) shifting from being aid recipients to aid donors, but still having limited national fiscal space to finance development projects. Bilateral donors increasingly consider trade and investment linkages in addition to aid.
While being a simple tool to highlight exposure to risks, the vulnerability index can inform development partners on appropriate approaches in each country context. We divide such approaches of bilateral donor agencies in the region into three different categories:
1. In an aid-focused approach, development agencies help restore peace, rebuild countries after conflict or natural disasters and address the most basic human needs as well kickstart economic development, for example supporting highly vulnerable countries.
2. In an aid and trade approach, development agencies phase out aid grants and move towards loans on increasingly less concessional terms. This would involve an increased role for trade relationships to encourage countries to trade more, grow faster and raise domestic resources and reduce aid dependency, for instance focused on vulnerable economies.
3. In a trade and private investment approach, donors (using only very limited aid resources) are engaged in dialogue and foster mutually beneficial trade and investment linkages in those countries classified as ‘strong/robust’.
Development partners should not move from an aid relationship simply to no relationship at all as many vulnerabilities loom large in many countries. Instead, when partner countries transform, donors should be moving towards a different relationship; one that is based on aid and trade, and, eventually, trade and private investment, depending on the existing vulnerabilities in partner countries. In moving to a trade and investment relationship, development partners will need to respond to the specific vulnerabilities and opportunities of the countries in question.
11
1 Introduction
1 For different perspectives on the role of industrial policy in the rise of East Asia, see World Bank (1993), Lall (1994) and Stiglitz (2001).
1.1 Dissecting the ‘Asian century’ storyThe structural transformation of developing Asia from a poor, agricultural backwater to a prosperous, global manufacturing hub was the most important economic development achievement of the 20th century. The post-war reconstruction and re-industrialisation of Japan in the 1950s was the catalyst for Asia’s transformation story. This was followed in the 1960s and 1970s by the rise of the four East Asian super-exporters (Hong Kong, Republic of Korea, Singapore and Taiwan), and of neighbouring Southeast Asia in the 1980s. Nonetheless, it is the transformation of China and India in the 1980s and 1990s that was remarkable. China’s spectacular performance since ‘opening up’ in 1978 has been aptly described as the ‘largest growth surprise ever experienced by the world economy’ (Winters and Yusuf, 2007: 1). China began by attracting export-oriented foreign direct investment (FDI) into special economic zones in its southern coastal cities, and has over the past few decades evolved into Asia’s hub of global value chains (GVCs). Opening up relatively late in 1991, India has become a major exporter of information technology services. By 2010, the region’s per capita income reached nearly $5,000 in purchasing power parity (PPP) terms and nearly half a billion people were lifted out of poverty (measured using a $1.25 per day poverty line) (see Kohli et al., 2011).
One strand of literature has dissected and debated the causes of the region’s rapid transformation. An exploration of the details of this debate is beyond the scope of the present study. Suffice it to say that the switch from inward- to outward-oriented development strategies, a strong developmental state, a Confucian work ethic, high saving and investment rates, ample foreign aid for infrastructure development and a favourable world economy are among the popular explanations (for a selection of views see: Amsden, 1989; World Bank, 1993; Lall, 1994; Stiglitz, 2001; Winters and Yusuf, 2007; Bardhan, 2010; Wignaraja, 2012). While some argue that market-friendly policies underpin the rise of the East Asian super-exporters, others point to the plethora of sector- and even firm-specific industrial policies used to engineer shifts in comparative advantage over time to overcome various market failures.1 Whether industrial policies helped or hindered China’s rise in the global economy is also the topic of a contemporary debate.
Another strand of literature has charted the global rise of Asia over the long term partly on the assumption that the so-called ‘Asian century’ has been taking place on autopilot, with the region soaring effortlessly to its fair place in the world economy. In this view, the 21st century is equated with the global rise of Asia, and this is why it is dubbed the ‘Asian century’. An influential study by Kohli et al. (2011) constructs an optimistic Asian century scenario, extending Asia’s past success 40 years into the future. This scenario envisages that, by 2050, Asia could make up approximately half of global output, and that 3 billion additional Asians could be affluent by present-day standards. Asia could become the world’s largest grouping of consumers, producers and investors in global goods, services and technology markets. Examining likely shifts in global economic power in the future, PricewaterhouseCoopers (PwC) (2017a) projects that, by 2050, China will be the world’s largest economy, India will surpass the United States (US) to take second place, Indonesia will rise to fourth place and Japan will fall to eighth. The European Commission (EC) (2009) and AT Kearney (2015) also offer positive projections about the global rise of Asian economies.
However, the past few years have seen several political and economic shocks, such as the election of President Trump, the Brexit vote, rising oil prices and rising interest rates. All these have affected a fragile global economy still in recovery from the 2008–2009 global financial crisis. Political tensions between the US and China have also heightened, resulting in rivalry for global influence and an ongoing trade war. Partly to counter US global economic influence, China has launched the Belt and Road Initiative (BRI) and two new international financial institutions: the Asian Infrastructure Investment Bank and the New Development Bank. Accordingly, attempting to forecast macroeconomic aggregates for developing Asia decades into the future seems like a heroic task. Economic history suggests a higher likelihood of unforeseen events such as downturns influencing economic outcomes the further ahead we attempt to forecast.
1.2 Aim of the studyThis present study has more modest aims than Asian futurology studies such as Kohli et al. (2011) and PwC (2017a). It seeks to examine developing Asia’s future from a different vantage point. First, it examines what
12
developing Asia’s economic landscape might look like over the next eight years by presenting macroeconomic projections to 2025 for 46 economies across five of the region’s sub-regions. For comprehensiveness, projections to 2025 for the region’s three developed economies (Australia, Japan and New Zealand) are also provided.
The different international financial institutions (IFIs) adopt different classifications of developing Asian economies, and each is useful depending on the purpose at hand. For convenience, this study adopts the Asian Development Bank’s (ADB’s) sub-regional classification of developing Asia into East Asia, South Asia, Southeast Asia, Central Asia and the Pacific. Forty-six economies are thus classed as Asian developing economies. A further category comprises the three more-advanced regional economies, namely Australia, Japan and New Zealand. The ADB classification counts the Republic of Korea and Singapore under the heading of developing Asia and this study follows this convention. However, as the Republic of Korea and Singapore share certain characteristics of the region’s three developed economies (such as being high-income, and with the Republic of Korea also a member of the Organisation for Economic Co-operation and Development (OECD)), brief comparisons are made with the region’s developed economies.
The exercise focuses on forecasting the behaviour of a handful of key macroeconomic aggregates (including population growth, gross domestic product (GDP) growth and shares, trade growth, income per head and inflation). It does this by comparing projections from the IFIs (such as the International Monetary Fund (IMF), the World Bank and ADB) and the United Nations (UN) and supplements them with our own. Forecasts from IFIs tend to be more accurate than those made by global or national macroeconomic models,2 as they are based on inputs from skilled in-country economists with considerable access to data and insights on the economies they cover. The country forecasts are then checked for consistency by a central macroeconomics team.
Second, motivated by the economic outlook, this report digs deeper into the underlying dynamics of developing Asia’s transformation than some previous studies and analyses three key mega-trends that are likely to influence the course of the region’s economic
2 For instance, dynamic stochastic general equilibrium (DSGE) models attempt to anticipate the business cycles of large economies by modelling the behaviour of individual households and firms. However, DSGE models, for all their complicated structures and equations, make assumptions that oversimplify how markets work and consumers behave. Furthermore, the use of DSGE models for this study was impeded by severe data limitations for many economies in South Asia, Central Asia and the Pacific.
development in the lead-up to 2025. These mega-trends are (i) the performance of China-centred GVCs, (ii) the likely impact of the BRI and (iii) developments in poverty and inequality. Previous studies on Asia’s economic future have under-explored these critical mega-trends. And yet improving developing Asia’s economic prospects to 2025 involves dealing with them.
This report critically examines the prospects of middle-income countries (MICs) on the basis of how they may be affected by and respond to the identified mega-trends, using recent data and empirical methods. The analysis of the performance of China-centred GVCs studies the causes of the slowdown in GVC activity, the emergence of new GVC trading opportunities in the region (particularly shifts in GVC manufacturing beyond China) and the role of the business environment and firm-level factors in influencing the entry of latecomers into GVCs. The examination of the BRI appraises the opportunities and risks this offers to both host countries and China. Under BRI opportunities, it discusses infrastructure development and growth in trade; under BRI risks, it looks at both project-level risks and the complex issue of debt sustainability in recipient economies. Despite rapid falls in the share of the poor below the extreme poverty line and improvements on human development indicators, pockets of poverty persist, as does vulnerability to income shocks.
The remainder of this study is organised as follows. Section 2 reviews macroeconomic projections to 2025. Section 3 examines the recent performance of the China-centred GVCs. Section 4 analyses the BRI. Section 5 discusses current and future trends in poverty and inequality in the Asian region. Section 6 brings together the analysis in Sections 2–5 and identifies successful and vulnerable countries in developing Asia by using data on prospects combined with country-specific estimates of vulnerability to trade, debt and poverty. Section 7 concludes.
Appendix A contains the macroeconomic projections for developing Asia as well as the region’s developed economies. Appendix B contains a background note on the changing development finance landscape in Asian countries.
13
2 Macroeconomic outlook up to 2025
3 Futurology studies of Central Asia are rare, largely owing to data limitations. An early study of Central Asia’s economic prospects to 2015 was Dowling and Wignaraja (2006).
4 As Table A1:2 shows, the proportion of the population aged 65+ in developing Asia is projected to rise from 6.3% to 8.7% between 2015 and 2025. This is a sharp rise compared with an increase of 5.0% to 5.7% between 2000 and 2010.
This section reviews macroeconomic projections to 2025, covering population growth (2.1), GDP growth and shares (2.2 and 2.3), trade growth (2.4), income per head (2.5) and inflation (2.6). It does this by comparing IMF, World Bank, ADB and UN projections and supplementing them with our own. It then discusses the main risks to these macroeconomic projections and introduces three mega-trends, which we put forward for further analysis in Sections 3 through 5.
Although some studies adopt a shorter and arguably more realistic forecasting time horizon than Kohli et al. (2011) and PwC (2017a), they face two important shortcomings. One is that they deal with the booming pre-global financial crisis era and are bullish on Asia’s prospects. The EC (2009) charts Asia’s rise and ecological transition up to 2025 but uses data from prior to the global financial crisis, which means it is an example of a study overtaken by events such as the adverse effects of the crisis. Another shortcoming is its limited coverage of developing Asian economies. AT Kearney (2015) provides short-term macro forecasts up to 2020 for seven emerging economies, but covers only China, Malaysia and the Philippines. ADB and the ADB Institute (ADBI) (2014) adopt a longer-term forecast horizon to 2030, but coverage is restricted to the 10 Southeast Asian economies, China and India. Large swathes of developing Asia – the rest of South Asia as well as smaller Central Asian and Pacific economies – are excluded.3
2.1 Population growthIn terms of population, developing Asia is the largest region in the world, with over 4 billion people in 2017 (53.4% of the world’s population). While its population growth is expected to slow after 2017 amid a demographic transition to an ageing population,4 UN population projections in Table A1:1 (see Appendix A) suggest the region’s population will increase to 4.3 billion people (which constitutes a decline to 52.4% of the global population owing to strong population growth in Africa) by 2025.
Developing Asia is also somewhat remarkable for containing five sub-regions of varying population sizes and geographical characteristics. South Asia and East Asia collectively accounted for an enormous 44.7% of the world’s population in 2017 and occupy much of the landmass of continental Asia. While their combined share of world population is projected to fall to 42.5% by 2025, South Asia’s population will likely swell to 2 billion people and East Asia’s to an equally impressive 1.5 billion people by 2025. Asian giants India and China – respectively with 1.5 billion people and 1.4 billion people by 2025 – dominated their respective sub-regions. Pakistan and Bangladesh in South Asia are also likely to have notable populations.
Southeast Asia’s relatively stable share of world population (8.6% in 2017 to 8.5% in 2025) comes some way behind the South Asian and East Asian sub-regions. By 2025, Southeast Asia is likely to hold approximately 700 million people, with over a third of this total living in Indonesia, Asia’s third largest country in terms of population. The Philippines and Viet Nam are also expected to have over 100 million people each by 2025. Southeast Asia’s geography contains two large archipelagos (Indonesia and the Philippines).
Meanwhile, largely landlocked Central Asia and small, geographically dispersed Pacific Island economies have relatively small, stable populations. Despite small rises in population numbers, Central Asia’s share of the world population remains at 1.2% in both 2017 and 2025, while that of the Pacific remains stable at 0.2%. Papua New Guinea and Uzbekistan are major population centres in their respective sub-regions.
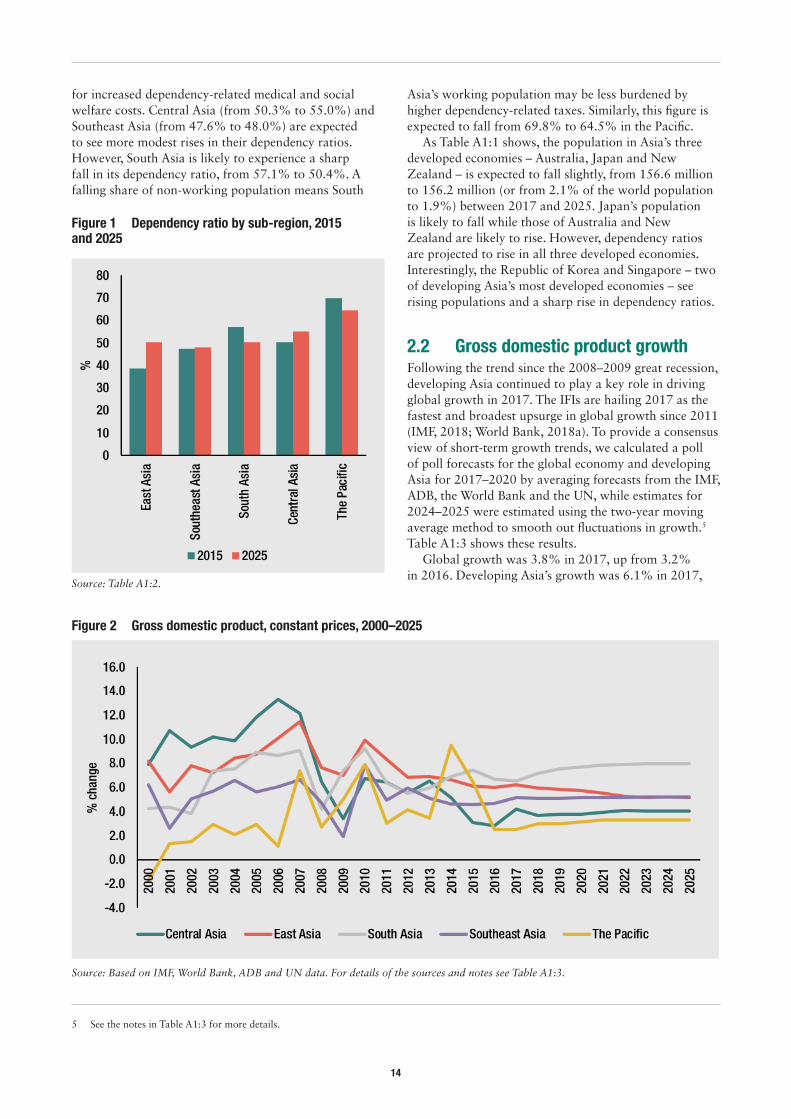
As Table A1:2 and Figure 1 show, total dependency ratios – the number of people of non-working age compared with the number of those of working age – vary significantly among the sub-regions in developing Asia. East Asia is likely to see the sharpest rise in its dependency ratio, from 38.8% to 50.3%, between 2015 and 2025. This suggests that, as the share of the non-working population rises, the working population in East Asia may have to pay higher taxes to compensate
14
for increased dependency-related medical and social welfare costs. Central Asia (from 50.3% to 55.0%) and Southeast Asia (from 47.6% to 48.0%) are expected to see more modest rises in their dependency ratios. However, South Asia is likely to experience a sharp fall in its dependency ratio, from 57.1% to 50.4%. A falling share of non-working population means South
5 See the notes in Table A1:3 for more details.
Asia’s working population may be less burdened by higher dependency-related taxes. Similarly, this figure is expected to fall from 69.8% to 64.5% in the Pacific.
As Table A1:1 shows, the population in Asia’s three developed economies – Australia, Japan and New Zealand – is expected to fall slightly, from 156.6 million to 156.2 million (or from 2.1% of the world population to 1.9%) between 2017 and 2025. Japan’s population is likely to fall while those of Australia and New Zealand are likely to rise. However, dependency ratios are projected to rise in all three developed economies. Interestingly, the Republic of Korea and Singapore – two of developing Asia’s most developed economies – see rising populations and a sharp rise in dependency ratios.
2.2 Gross domestic product growthFollowing the trend since the 2008–2009 great recession, developing Asia continued to play a key role in driving global growth in 2017. The IFIs are hailing 2017 as the fastest and broadest upsurge in global growth since 2011 (IMF, 2018; World Bank, 2018a). To provide a consensus view of short-term growth trends, we calculated a poll of poll forecasts for the global economy and developing Asia for 2017–2020 by averaging forecasts from the IMF, ADB, the World Bank and the UN, while estimates for 2024–2025 were estimated using the two-year moving average method to smooth out fluctuations in growth.5 Table A1:3 shows these results.
Global growth was 3.8% in 2017, up from 3.2% in 2016. Developing Asia’s growth was 6.1% in 2017,
Figure 2 Gross domestic product, constant prices, 2000–2025
Source: Based on IMF, World Bank, ADB and UN data. For details of the sources and notes see Table A1:3.
Figure 1 Dependency ratio by sub-region, 2015 and 2025
Source: Table A1:2.
15
above the 5.9% in 2016. Comparing the 2017 forecasts made in 2016 with the likely outcome based on the latest IMF forecasts (IMF, 2018) suggests that excessive pessimism around global and Asian growth may have been misplaced.6 But there is an ongoing debate as to whether the current upsurge signals the start of a cyclical global recovery following the global financial crisis or a blip on a long road to a timid and fragile global recovery.
The revised economic outlook for the world economy is attributed to an amplified global growth momentum, the likely effects of recently approved cuts in US corporation tax in terms of lifting investment and US growth, and an upturn in Europe (based on a sentiment that the continent is expected to be less adversely affected by Brexit). It is expected that these changes will translate into stronger external demand for Asia’s manufactured exports. Better-than-expected results in the third quarter of 2017 in a slowing China, the favourable effects of higher prices for commodity exporting developing countries and the expected fiscal impact of Japan’s 2018 supplementary budget are playing supporting roles.
Growth in developing Asia is expected to remain well above the global growth through to 2025. Some revisions to the forecasts suggest the region will probably experience stable growth of 6.0% in 2018 and 5.7% per year over 2019–2025 (see Table A1:3). This compares favourably with the projected figures of 3.9% and 3.8% for the world economy.
Growth across developing Asia has been fairly wide-ranging (see Figure 2 and Table A1:3). Growth in economically important East Asia increased from 6.0% to 6.3% between 2016 and 2017. This reflects a stabilising China delivering slightly better growth of 6.7% in 2016 and 6.9% in 2017 as well as a pick-up in other East Asian economies. Closely mirroring China’s moderating growth trajectory, East Asia’s growth is expected to slow to 6.0% in 2018 and thereafter to 5.4% annually over 2019–2025.
After years of rapid growth, China’s economy is slowing, which has been linked to an ageing population, rising wages and a looming middle-income trap. A soft growth landing in China is expected, with annual growth of 5.9% in 2019–2025, rather than a hard growth landing. To bolster growth, China is undertaking gradual domestic structural reforms. It has ended its one-child policy to boost the birth rate, reformed inefficient stated-owned enterprises and promoted high technology. China has also launched the ambitious BRI to foster regional infrastructure connectivity and help deal with surpluses
6 Interestingly, the World Bank seems more pessimistic about the short-term outlook for the global economy and many developing Asian economies than the IMF. This difference appears to be linked to different expectations of productivity growth. The January 2018 edition of the IMF’s World Economic Outlook projected steady global growth at 3.9% in both 2018 and 2019, whereas the World Bank’s January 2018 edition of Global Economic Prospects had lower estimates of 3.1% and 3.0%. For China, the IMF projected 6.6% and 6.4%, whereas the World Bank projected 6.4% and 6.3%. Similarly, for India, the IMF projected 7.4% and 7.8%, whereas the World Bank projected 7.3% and 7.5%.
in the country. Section 4 explores the opportunities and risks in the BRI .
South Asia shows a slight fall in growth from 6.7% to 6.5% between 2016 and 2017. While India’s growth declined from 7.1% to 6.7%, growth in Pakistan and smaller South Asian economies increased. South Asia – bolstered by a resurgent India – will see significant growth of 7.1% in 2018 and 7.8% per year over 2019–2025.
Recent Indian policy measures – demonetising large currency notes to fight corruption and introducing a general sales tax – have dented business confidence. But the Indian economy is recovering from these shocks and the sales tax lays the basis for healthier future public finances. Furthermore, growth is likely to be supported by investment climate reforms, a ‘Make in India’ initiative, fiscal reforms and increased public infrastructure investment. However, looming risks to India’s growth on the horizon are elections in 2019 and the country entering a middle-income trap. Pakistan and Sri Lanka will also likely see improved growth.
Growth in Southeast Asia increased from 4.7% to 5.1% between 2016 and 2017 underpinned by improved performance in major Association of Southeast Asian Nations economies such as Malaysia, Singapore, Thailand and Viet Nam. Southeast Asia will see stable growth of 5.1% in 2018 and 5.2% per year in 2019–2025. This will be underpinned by improved performance in Indonesia and the Philippines.
Central Asia’s growth – led by Kazakhstan and Kyrgyz Republic – increased from 2.8% to 4.5% between 2016 and 2017. Central Asia fares better in the future owing to the expectation of higher oil and gas prices. The sub-region is expected to see stable growth at 4.1% in both 2018 and 2019–2025.
Due to improved growth performance from Fiji and stable growth in Papua New Guinea, growth in the Pacific rose from 2.9% to 3.1% between 2016 and 2017. The Pacific will likely see stable growth of 2.7% in 2018 and 2.8% during 2019–2025, with Papua New Guinea and Fiji showing opposite trends.
Meanwhile, growth in the region’s three developed economies increased from 1.4% to 1.9% between 2016 and 2017. However, such growth is expected to slow to 1.6% in 2018 and 1.2% in 2019–2025. In 2018, both Australia and New Zealand are likely to grow at about 3.0% and Japan at 1.1%. Republic of Korea and Singapore are expected to follow a similar developed economy story of declining growth in 2018 and 2019–2025.
16
2.3 Share of world gross domestic productFaster growth compared with other major global regions means developing Asia’s global importance will likely continue to rise. Table A1:4 shows developing Asia’s share of world GDP in current market prices (in US dollars) and in PPP$ terms. By 2025, developing Asia could have increased its share of world GDP in current prices to 30.5%, up from 26.2% in 2017. East Asia could be the largest sub-region, with as much as 21.7% of world GDP in 2025. Coming someway behind East Asia, South Asia could account for 4.6% of world GDP, Southeast Asia for 3.7%, Central Asia for 0.4% and the Pacific a negligible share. The top five economies could be China (18.7%), India (4.0%), Republic of Korea (1.9%), Indonesia (1.3%) and Singapore (0.6%).
In PPP$ terms, developing Asia could comprise as much as 42.4% of the world economy by 2025, up from 37.5% in 2017. While East Asia could see a rise in its share to 23.5%, South Asia and Southeast Asia could see large rises in their shares to 11.2% and 6.8%, respectively. However, Central Asia’s share could remain small (0.9%) and the Pacific’s share smaller still. In PPP$ terms, China could make up 20.7% of world GDP, while India could see a big jump to 9.3%.7 Meanwhile, Indonesia could account for 2.8%, Republic of Korea for 1.5% and Singapore for 1.0%.
7 Our estimates for 2025 in PPP$ terms are similar to those of ADB and ADBI (2014) for 2030. ADB and ADBI project that, by 2030, China could account for 24% of world GDP, India for 11% and Southeast Asia for 5%.
8 Trade volume growth was estimated by taking the simple average of the growth of export volumes and the growth of import volumes.
The world GDP shares of Asia’s three developed economies in 2025 are likely to be 7.2% in current prices and 4.7% in PPP$ terms. These are both down from the shares in 2017. If the Republic of Korea and Singapore are taken as developed economies, the shares of this category would rise further to 9.7% in current prices and 7.2% in PPP$ terms in 2025.
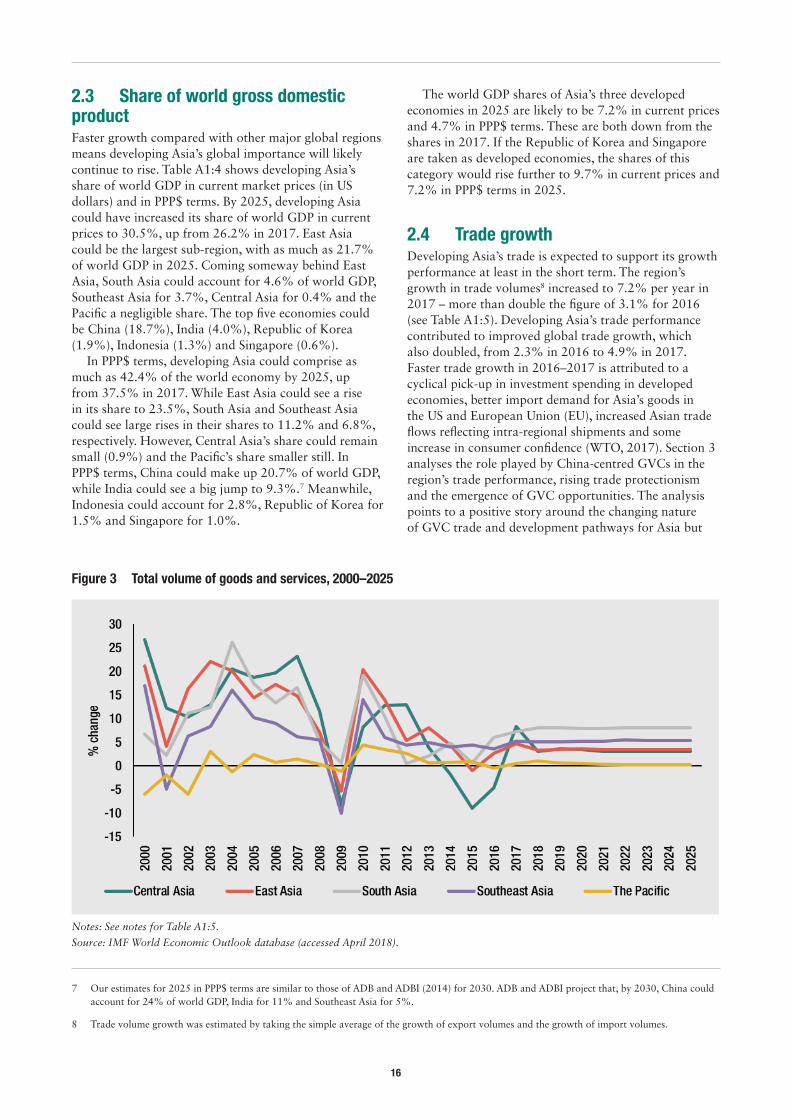
2.4 Trade growthDeveloping Asia’s trade is expected to support its growth performance at least in the short term. The region’s growth in trade volumes8 increased to 7.2% per year in 2017 – more than double the figure of 3.1% for 2016 (see Table A1:5). Developing Asia’s trade performance contributed to improved global trade growth, which also doubled, from 2.3% in 2016 to 4.9% in 2017. Faster trade growth in 2016–2017 is attributed to a cyclical pick-up in investment spending in developed economies, better import demand for Asia’s goods in the US and European Union (EU), increased Asian trade flows reflecting intra-regional shipments and some increase in consumer confidence (WTO, 2017). Section 3 analyses the role played by China-centred GVCs in the region’s trade performance, rising trade protectionism and the emergence of GVC opportunities. The analysis points to a positive story around the changing nature of GVC trade and development pathways for Asia but
Figure 3 Total volume of goods and services, 2000–2025
Notes: See notes for Table A1:5.
Source: IMF World Economic Outlook database (accessed April 2018).
17
highlights risks relating to trade protectionism and new technologies.
A broad-based upturn in trade has occurred within developing Asia (see Figure 3 and Table A1:5). Between 2016 and 2017, trade volume growth in East Asia increased significantly, from 2.6% to 7.1%, in South Asia from 5.7% to 7.9% and in Southeast Asia from 3.6% to 7.3%. Trade volume growth in Central Asia went from -1.9% to 5.5%, though the Pacific had a slight decline, of -0.1%, in both years. The Pacific figure must be misleading, owing to missing data for key traders such as Fiji and Tonga. Of the 35 economies for which data were available, 25 showed better trade volume growth in 2017 than in 2016. This includes most of the region’s largest traders: China, Hong Kong, India, Indonesia, Kazakhstan, Malaysia, Pakistan, Republic of Korea, Singapore, Taiwan and Thailand. However, trade growth in Azerbaijan, Bangladesh, Brunei, Cambodia, the Philippines and Sri Lanka was worse.
The region’s trade upturn is expected to moderate to 5.8% in 2018 and 5.0% per year in 2019–2025, related to slower trade growth in East Asia and Southeast Asia (see Table A1:5). Thus, the observed downward trend in developing Asia’s trade growth elasticity since the global financial crisis (see Wignaraja et al., 2017) seems likely to continue until 2025. Dividing trade growth by GDP growth in Tables A1.3 and A1.5 shows that developing Asia’s trade growth elasticity peaked before the crisis at 1.8 in 2000–2007. This means that trade grew nearly twice as fast as GDP growth during a period of rapid globalisation. The trade growth elasticity fell immediately after the crisis to 1.1 in 2010–2015 and is projected to fall to 1.0 in 2018 and 0.9 in 2019–2025. This is a worrying trend given the region’s historically high reliance on trade-led growth to fuel its prosperity.
Driven by a sharp trade upturn in Japan, trade growth in the region’s three developed economies increased more than seven-fold, from 0.7% to 5.3% per year, between 2016 and 2017. Trade growth in Asia’s developed economies is likely to be 5.1% in 2018 and 2.9% in 2019–2025. Trade growth in 2018 in both the Republic of Korea and Singapore is projected to be lower than in the developed economies. The Republic of Korea’s trade growth is likely to decline like other developed economies whereas Singapore’s is expected to pick up.
2.5 Income per headDeveloping Asia’s GDP per capita in current prices is projected to rise from $10,476 to $15,428 between 2017 and 2025 (see Table A1:6). This remarkably puts the region within the bounds of the World Bank’s current definition of high-income economies (i.e. those with per capita incomes in excess of $12,236).
9 Nominal GDP per capita (using market exchange rates) is often used to make international comparisons between countries but it does not take into account differences in the cost of living between countries and the results vary from one year to another based on fluctuations in the exchange rates between currencies. Comparisons using PPP exchange rates do adjust for differences in the cost of living in different countries but are more difficult to estimate.
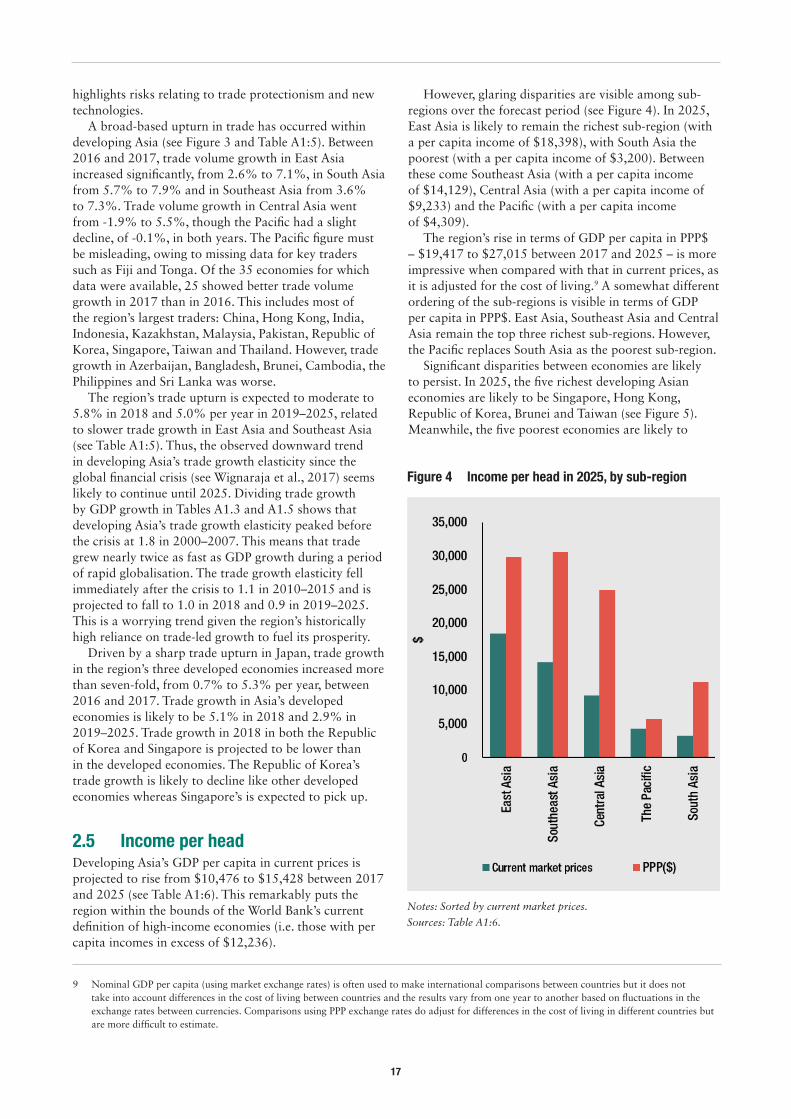
However, glaring disparities are visible among sub-regions over the forecast period (see Figure 4). In 2025, East Asia is likely to remain the richest sub-region (with a per capita income of $18,398), with South Asia the poorest (with a per capita income of $3,200). Between these come Southeast Asia (with a per capita income of $14,129), Central Asia (with a per capita income of $9,233) and the Pacific (with a per capita income of $4,309).
The region’s rise in terms of GDP per capita in PPP$ – $19,417 to $27,015 between 2017 and 2025 – is more impressive when compared with that in current prices, as it is adjusted for the cost of living.9 A somewhat different ordering of the sub-regions is visible in terms of GDP per capita in PPP$. East Asia, Southeast Asia and Central Asia remain the top three richest sub-regions. However, the Pacific replaces South Asia as the poorest sub-region.
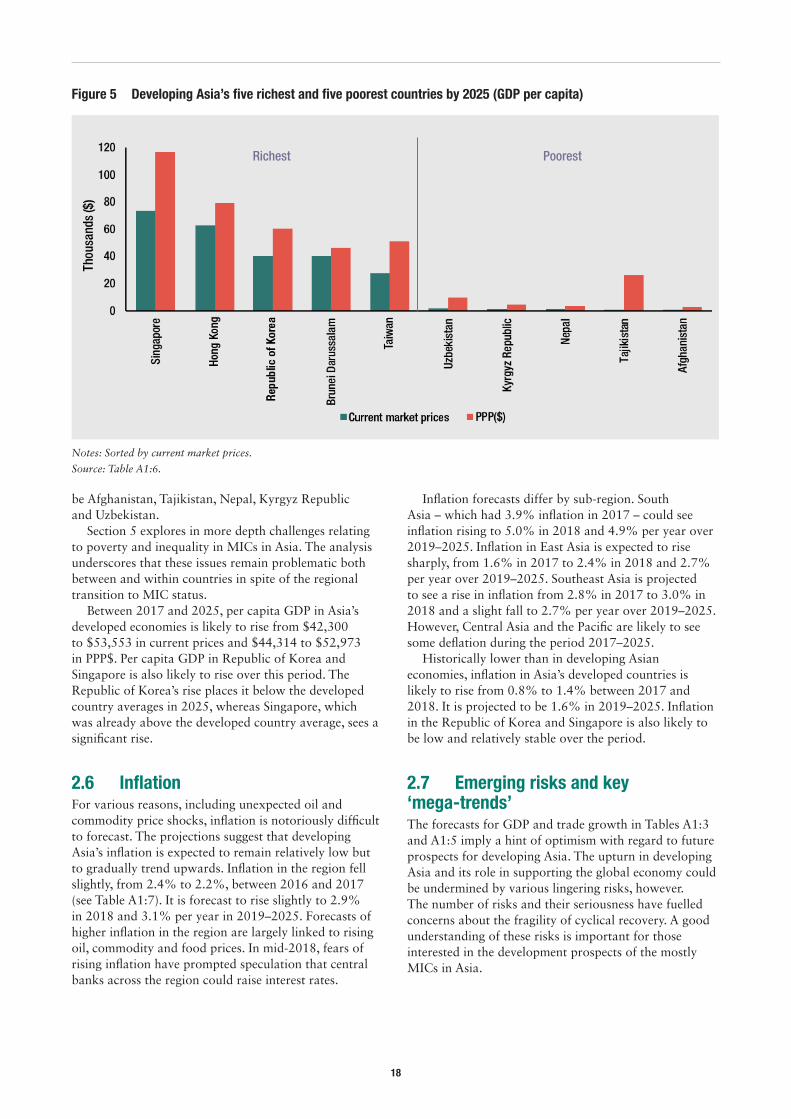
Significant disparities between economies are likely to persist. In 2025, the five richest developing Asian economies are likely to be Singapore, Hong Kong, Republic of Korea, Brunei and Taiwan (see Figure 5). Meanwhile, the five poorest economies are likely to
Figure 4 Income per head in 2025, by sub-region
Notes: Sorted by current market prices.
Sources: Table A1:6.
18
be Afghanistan, Tajikistan, Nepal, Kyrgyz Republic and Uzbekistan.
Section 5 explores in more depth challenges relating to poverty and inequality in MICs in Asia. The analysis underscores that these issues remain problematic both between and within countries in spite of the regional transition to MIC status.
Between 2017 and 2025, per capita GDP in Asia’s developed economies is likely to rise from $42,300 to $53,553 in current prices and $44,314 to $52,973 in PPP$. Per capita GDP in Republic of Korea and Singapore is also likely to rise over this period. The Republic of Korea’s rise places it below the developed country averages in 2025, whereas Singapore, which was already above the developed country average, sees a significant rise.
2.6 InflationFor various reasons, including unexpected oil and commodity price shocks, inflation is notoriously difficult to forecast. The projections suggest that developing Asia’s inflation is expected to remain relatively low but to gradually trend upwards. Inflation in the region fell slightly, from 2.4% to 2.2%, between 2016 and 2017 (see Table A1:7). It is forecast to rise slightly to 2.9% in 2018 and 3.1% per year in 2019–2025. Forecasts of higher inflation in the region are largely linked to rising oil, commodity and food prices. In mid-2018, fears of rising inflation have prompted speculation that central banks across the region could raise interest rates.
Inflation forecasts differ by sub-region. South Asia – which had 3.9% inflation in 2017 – could see inflation rising to 5.0% in 2018 and 4.9% per year over 2019–2025. Inflation in East Asia is expected to rise sharply, from 1.6% in 2017 to 2.4% in 2018 and 2.7% per year over 2019–2025. Southeast Asia is projected to see a rise in inflation from 2.8% in 2017 to 3.0% in 2018 and a slight fall to 2.7% per year over 2019–2025. However, Central Asia and the Pacific are likely to see some deflation during the period 2017–2025.
Historically lower than in developing Asian economies, inflation in Asia’s developed countries is likely to rise from 0.8% to 1.4% between 2017 and 2018. It is projected to be 1.6% in 2019–2025. Inflation in the Republic of Korea and Singapore is also likely to be low and relatively stable over the period.
2.7 Emerging risks and key ‘mega-trends’The forecasts for GDP and trade growth in Tables A1:3 and A1:5 imply a hint of optimism with regard to future prospects for developing Asia. The upturn in developing Asia and its role in supporting the global economy could be undermined by various lingering risks, however. The number of risks and their seriousness have fuelled concerns about the fragility of cyclical recovery. A good understanding of these risks is important for those interested in the development prospects of the mostly MICs in Asia.
Richest Poorest
Figure 5 Developing Asia’s five richest and five poorest countries by 2025 (GDP per capita)
Notes: Sorted by current market prices.
Source: Table A1:6.
19
According to the most recent annual Pacific Economic Cooperation Council survey of opinion-makers,10 the top five risks to growth in the Asia-Pacific economy are (PECC, 2017):
1. increased protectionism 2. lack of political leadership3. a slowdown in China4. a possible slowdown in world trade growth5. a failure of economies to implement structural reforms.
Early 2018 has seen heighted risk of increasing protectionism and the possibility of a trade war between major global economies, caused by the withdrawal of the US from the Trans-Pacific Partnership, the struggling North American Free Trade Agreement renegotiations, US-imposed tariffs on imports of steel and aluminium and Chinese retaliatory tariffs on US imports. Events are still unfolding, but there are concerns that all this could precipitate a worse-than-expected outlook for growth and trade in developing Asia in the short term. Open Asian economies that trade products that could be hit with tariffs are the most vulnerable. Additional emerging risks on the horizon include monetary tightening and rising interest rates in developed countries, geopolitical tensions (e.g. over the Democratic People’s Republic of Korea’s nuclear ambitions), political uncertainty in some countries and a rising economic toll from natural disasters.
Nonetheless, it is difficult to predict the timing and impact of these risks on developing Asia’s outlook. Instead, this study analyses three underlying mega-trends that will likely exert a marked influence on growth, trade and aid in the region in the lead-up to 2025. Improving the prospects of Asian economies involves facing these risks head-on.
First is the changing performance of China-centred GVCs in developing Asia. Joining sophisticated GVCs has powered the region’s rise to become the world’s factory, and has contributed to rapid trade-led growth
10 The survey obtained the views of 722 representatives of business, government and non-governmental organisations.
over several decades. However, GVC activity remains concentrated in East and Southeast Asia, with little dispersion elsewhere in the region. Another issue is that slowing GVC activity in East and Southeast Asia may be linked to the region’s slowing growth. On the positive side, China’s exit from some segments of GVCs in the wake of rising costs will likely bring business opportunities for industrial latecomers in GVCs and require policy reforms (Wignaraja et al., 2017). Section 3 studies the issues concerning the changing dynamics of GVCs and trade in developing Asia.
The second risk is the likely economic impact of the BRI. As part of its attempt to arrest slowing growth, China launched this ambitious initiative as a combination of a maritime silk road and a silk road economic belt. The BRI involves China allocating significant resources to regional infrastructure investment along the old silk route linking it with Europe. China’s motives include finding a profitable avenue for its vast foreign exchange reserves, tapping into new markets for Chinese companies and making Eurasia an economic and trading area to rival the US-dominated transatlantic area (Cai, 2017). The BRI is likely to contribute towards better infrastructure connectivity and improved infrastructure financing and be generally supportive of growth in developing Asia. However, it also poses various risks to developing Asian economies participating in BRI projects, including debt sustainability issues, strains on the stability of fragile financial systems, the stretching of weak project implementation capacity and environmental degradation. Section 4 explores these issues.
Third, in spite of the transition to middle-income status, the region is facing persistent poverty and income inequality issues, both between and within economies. Many Asian economies remain vulnerable and risk setbacks in terms of inequality and social development. Section 5 examines these issues.
20
3 China-centred global value chains and implications for regional trade and investment
11 This form of production may have begun at scale with the US agreements on cars with Canada and on maquiladoras with Mexico in 1966. It was carried on by European and US companies in Southeast Asia in the 1970s.
12 Factory Asia or global supply chains are sometimes called production fragmentation, or GVCs or global production networks, but these terms essentially refer to the same basic concept, just with subtle differences.
13 Kiyota et al. (2017) examine the industrial competitiveness in six Asian economies (China, Japan, India, Indonesia, Republic of Korea and Taiwan) using the World Input–Output Tables 1995–2011. They report that, unlike EU economies, Asian economies have generally been able to combine increased job opportunities in GVCs with increased real income. They conclude that GVC involvement in Asia presents a more successful development story than Europe’s.
3.1 IntroductionEast Asia is reputed for being able to produce a wide range of manufactured products at price to quality ratios unmatched by advanced economies. Underpinning this industrial success is a highly sophisticated form of industrial organisation that is different to a single national factory. Production stages (i.e. design, production, assembly, marketing and service activities) formerly undertaken in factories in Japan and the Republic of Korea11 have been seamlessly located across East Asia – creating what is referred to as ‘Factory Asia’ or GVC trade (Baldwin and Gonzalez, 2014).12 China’s rapid industrialisation has enabled it to become the supply chain hub in Asia, assembling parts and components produced elsewhere (WTO and IDE-JETRO, 2011). However, the global financial crisis of 2008–2009 marked a turning point. A post-crisis world trade slowdown compounded by increasingly inward-oriented trade policies globally and a slowing China, among other factors, are altering the China-centric pattern of GVC trade in developing Asia.
This section examines the recent performance of China-centred GVC trade in developing Asia to trace implications for trade and investment in the region. It examines three related issues caused by post-crisis developments in China-centred GVC trade. First, it discusses why the region’s China-centred GVC trade has slowed. Second, it examines the prospects for
GVC manufacturing and trade beyond China. Third, it analyses factors influencing latecomers joining GVC trade at the national and firm levels. It concludes with implications for latecomers and donors.
3.2 Explaining the post-crisis slowdown The structural transformation of East Asia from a poor, less-developed, agricultural periphery region to a wealthy global factory is considered an economic miracle. The extent of East Asia’s participation in GVC trade is significantly greater than that of the rest of developing Asia and has spurred the region’s global rise to coveted ‘Factory Asia’ status, with rapid growth and job creation over a long period (see Wignaraja, 2016; Kiyota et al., 2017).13
The rapid spread of GVC trade within East Asia was influenced largely by the relocation of Japanese production to the Republic of Korea and Southeast Asia after the Plaza Accord in 1985, the widespread adoption of outward-oriented development strategies, China joining the World Trade Organization (WTO) in 2001 and rapid technological change.
A simple and convenient proxy to represent GVC trade is trade in intermediate goods (also referred to as parts and components trade) estimated using the definition of items provided by Constantinescu
21
et al. (2015).14 Two measures are used here. Table 1 provides world shares of intermediate goods exports for developing Asia, the five sub-regions and advanced economies. Table 2 provides the ratio of intermediate goods imports to manufacturing exports in economies in East Asia, Southeast Asia and South Asia.
14 The mainstay of empirical work on GVC trade by international economists has involved defining trade in intermediate goods using national trade data from the UN Comtrade database. This so-called gross trade approach affords comprehensive, consistent and recent time series coverage of parts and components trade for all developing Asian economies. More recently, with the development of similar international input–output tables for some countries, there has been growing interest in measuring trade in value added (e.g. WTO and IDE-JETRO, 2011). Growth in the measured degree of imported input dependence between two points in time is interpreted as an indicator of GVC trade. However, input–output tables are either lacking or dated for several developing Asian economies.
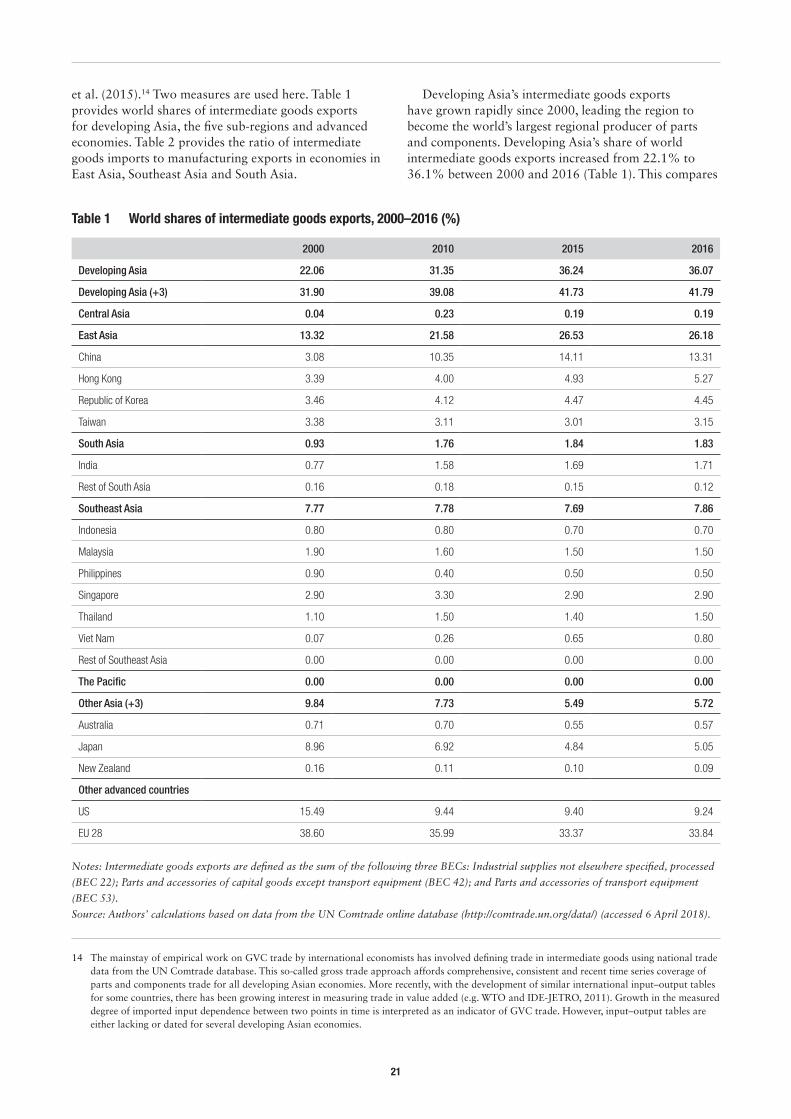
Developing Asia’s intermediate goods exports have grown rapidly since 2000, leading the region to become the world’s largest regional producer of parts and components. Developing Asia’s share of world intermediate goods exports increased from 22.1% to 36.1% between 2000 and 2016 (Table 1). This compares
2000 2010 2015 2016
Developing Asia 22.06 31.35 36.24 36.07
Developing Asia (+3) 31.90 39.08 41.73 41.79
Central Asia 0.04 0.23 0.19 0.19
East Asia 13.32 21.58 26.53 26.18
China 3.08 10.35 14.11 13.31
Hong Kong 3.39 4.00 4.93 5.27
Republic of Korea 3.46 4.12 4.47 4.45
Taiwan 3.38 3.11 3.01 3.15
South Asia 0.93 1.76 1.84 1.83
India 0.77 1.58 1.69 1.71
Rest of South Asia 0.16 0.18 0.15 0.12
Southeast Asia 7.77 7.78 7.69 7.86
Indonesia 0.80 0.80 0.70 0.70
Malaysia 1.90 1.60 1.50 1.50
Philippines 0.90 0.40 0.50 0.50
Singapore 2.90 3.30 2.90 2.90
Thailand 1.10 1.50 1.40 1.50
Viet Nam 0.07 0.26 0.65 0.80
Rest of Southeast Asia 0.00 0.00 0.00 0.00
The Pacific 0.00 0.00 0.00 0.00
Other Asia (+3) 9.84 7.73 5.49 5.72
Australia 0.71 0.70 0.55 0.57
Japan 8.96 6.92 4.84 5.05
New Zealand 0.16 0.11 0.10 0.09
Other advanced countries
US 15.49 9.44 9.40 9.24
EU 28 38.60 35.99 33.37 33.84
Table 1 World shares of intermediate goods exports, 2000–2016 (%)
Notes: Intermediate goods exports are defined as the sum of the following three BECs: Industrial supplies not elsewhere specified, processed
(BEC 22); Parts and accessories of capital goods except transport equipment (BEC 42); and Parts and accessories of transport equipment
(BEC 53).
Source: Authors’ calculations based on data from the UN Comtrade online database (http://comtrade.un.org/data/) (accessed 6 April 2018).
22
with the declining world shares of advanced economies: the EU’s fell from 38.6% to 33.8%, the US’s from 15.5% to 9.2% and Japan’s from about 9.0% to 5.1%. Japan’s figure seems understated, as Japanese firms are heavily involved in GVC trade in China and Southeast Asia. A similar story may apply to declining shares of US and EU firms.
With its world share doubling between 2000 and 2016, East Asia dominated the region’s growth in intermediate goods exports. By 2016, East Asia accounted for over a quarter of the world’s share of intermediate exports. China’s emergence as the regional supply chain hub is shown by a quadrupling of its share from 3.1% to 13.3% between 2000 and 2016. East Asia and China are followed someway behind by Southeast Asia (about 8%) and South Asia (under 2%). Meanwhile, Central Asia and the Pacific have negligible presence in world intermediate goods exports.
However, there was a fall in developing Asia’s share of world intermediate goods exports between 2015 and 2016 linked to a fall in East Asia’s share. China saw a notable fall in its share from a peak of 14.1% in 2015 to 13.3% in 2016. The Republic of Korea’s share remained stable; Hong Kong and Taiwan made some gains. South Asia’s share remained unchanged, reflecting India’s performance, but there was a decline in the rest of South Asia, from 0.2% to 0.1%. Southeast Asia’s share rose slightly from 7.7% to 7.9%, fuelled by some gains in Thailand and Viet Nam and unchanged shares in other Southeast Asian economies Indonesia, Malaysia, Singapore and Thailand.
2004–2006 2014–2016
East Asia
China 53.6 41.4
Hong Kong 61.4 75.6
Republic of Korea 45.7 39.7
Taiwan 55.2 46.3
South Asia
India 74.8 84.4
Pakistan 65.1 102.1
Sri Lanka 95.3 112.7
Southeast Asia
Indonesia 58.1 108.9
Malaysia 70.4 74.9
Philippines 90.8 80.9
Singapore 57.6 57.1
Thailand 74.0 66.8
Viet Nam 127.2 79.9
Advanced countries
Japan 29.6 36.3
Table 2 Ratio of intermediate goods imports to manufactured exports (%)
Notes: Please see Figure 6 notes.
Source: Authors’ estimates based on data from the UN Comtrade
online database (http://comtrade.un.org/data/) (accessed 1 April 2018).
Figure 6 Ratio of intermediate goods imports to manufactured exports, 2000–2016 (%)
Notes: Classification of intermediate goods, referred to as parts and components, is based on the concept used by Constantinescu et al.
(2015). Intermediate goods are defined as the sum of the following three BECs: Industrial supplies not elsewhere specified, processed (BEC
22); Parts and accessories of capital goods except transport equipment (BEC 42); and Parts and accessories of transport equipment (BEC 53).
Manufacturing products is defined as the sum of SITC categories 5, 6, 7 and 8 (less 68).
Source: Authors’ estimates based on data from the UN Comtrade online database (http://comtrade.un.org/data/).
23
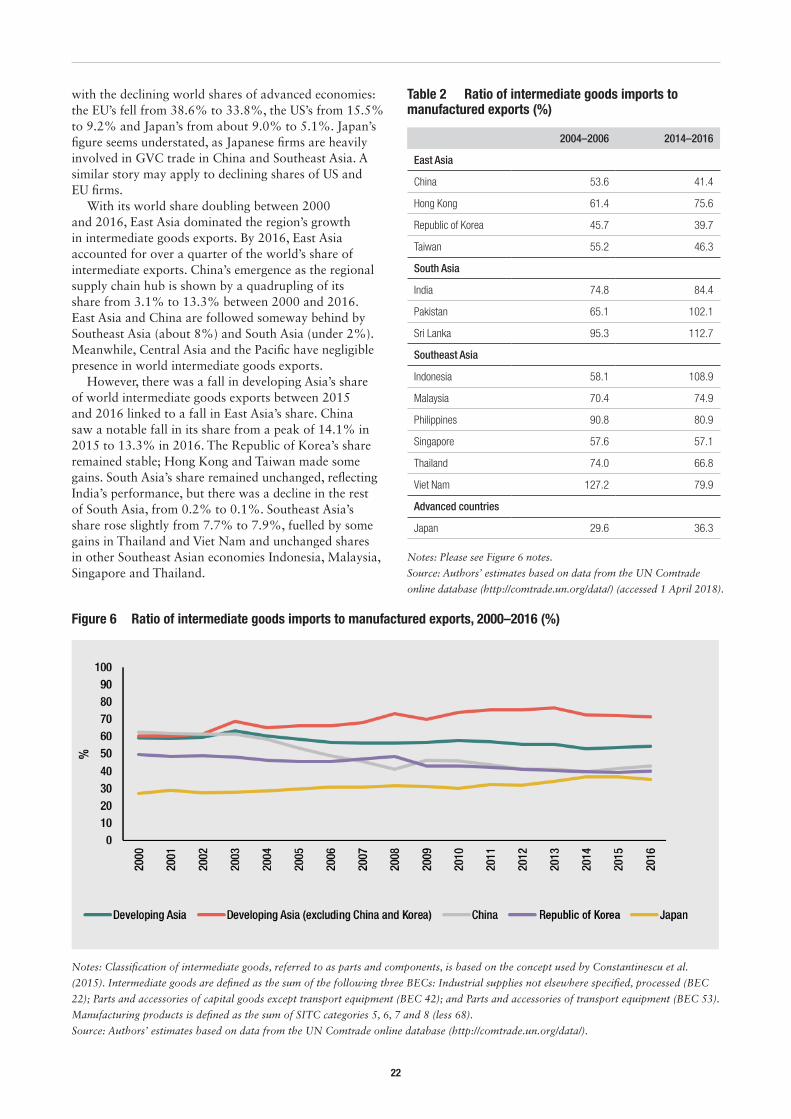
The slowdown in the region’s GVC trade actually began earlier and may be exacerbated by the effects of the crisis. As Figure 6 shows, developing Asia’s ratio of intermediate goods imports to manufactured exports fell from 59.3% to 56.2% between 2000 and 2009 and still further to 54.5% in 2016. This reflects a fall in China’s ratio from 62.5% to 41.2% between 2000 and 2009 and some levelling-off to 42.8% in 2016. The Republic of Korea’s ratio also fell. However, the figure for developing Asia excluding China and Republic of Korea rose from 60.4% to 73.2% between 2000 and 2009 before consolidating at 71.5% in 2016. Interestingly, Japan’s ratio also rose steadily over the period.
Developing Asia’s uneven post-crisis GVC slowdown is vividly illustrated by comparing the ratios immediately before the crisis (2004–2006) and in the recent post-crisis period (2014–2016). Within East Asia, there were significant falls in China’s figure, from 53.6% to 41.4%, Republic of Korea’s from 45.7% to 39.7% and Taiwan’s from 55.2% to 46.4% (Table 2). Japan’s ratio rose from 29.6% to 36.3% and Hong Kong’s from 61.4% to 75.6%. In addition, there were increases in other regional economies, including Indonesia and Malaysia in Southeast Asia and India, Pakistan and Sri Lanka in South Asia. The region is highly reliant on China as the main regional assembly hub in GVC trade, particularly in automotives, electronics and machinery. But there are signs that Japan and some other regional economies are starting to play an increasing role in GVC trade since the crisis.
We need to comprehend why the region’s China-centric GVC trade has slowed. A popular explanation is the lingering effects of a shock in external demand induced by the crisis. Lingering and weak import demand in advanced countries for Chinese and other developing Asian goods, related to sluggish domestic investment, partly explains developing Asia’s trade slowdown (Hong et al., 2016). Although differences have been visible in the demand for Asian imports among advanced economies since the crisis, this effect seems temporary and likely to be reversed with the expected global recovery in 2017–2018. As Section 2 discussed, the latest IMF forecasts (IMF, 2018) project the US to grow faster, lifted by higher corporate investment in the wake of cuts in US corporation tax, an upturn in Europe based on business sentiment that the continent will be less adversely affected by Brexit, and improved growth in Japan boosted by business investment and fiscal stimulus.
Macroeconomic or cyclical factors clearly explain part of the GVC slowdown in the region but are not the whole story. Several structural factors with a more permanent effect are notable, but so far it is difficult
15 These include anti-dumping duties, safeguards, pre-shipment inspection, sanitary and phytosanitary measures, technical barriers to trade and export subsidies.
to disentangle the factors and weigh their individual influence on developing Asia’s GVC trade slowdown.
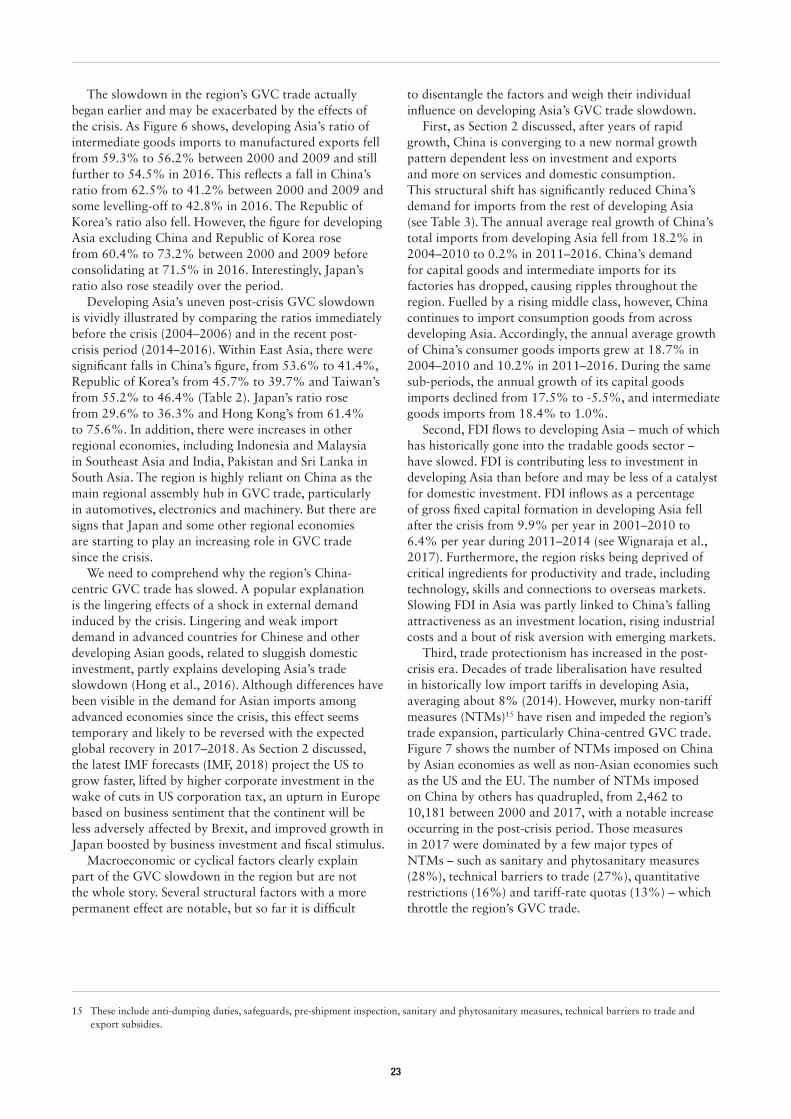
First, as Section 2 discussed, after years of rapid growth, China is converging to a new normal growth pattern dependent less on investment and exports and more on services and domestic consumption. This structural shift has significantly reduced China’s demand for imports from the rest of developing Asia (see Table 3). The annual average real growth of China’s total imports from developing Asia fell from 18.2% in 2004–2010 to 0.2% in 2011–2016. China’s demand for capital goods and intermediate imports for its factories has dropped, causing ripples throughout the region. Fuelled by a rising middle class, however, China continues to import consumption goods from across developing Asia. Accordingly, the annual average growth of China’s consumer goods imports grew at 18.7% in 2004–2010 and 10.2% in 2011–2016. During the same sub-periods, the annual growth of its capital goods imports declined from 17.5% to -5.5%, and intermediate goods imports from 18.4% to 1.0%.
Second, FDI flows to developing Asia – much of which has historically gone into the tradable goods sector – have slowed. FDI is contributing less to investment in developing Asia than before and may be less of a catalyst for domestic investment. FDI inflows as a percentage of gross fixed capital formation in developing Asia fell after the crisis from 9.9% per year in 2001–2010 to 6.4% per year during 2011–2014 (see Wignaraja et al., 2017). Furthermore, the region risks being deprived of critical ingredients for productivity and trade, including technology, skills and connections to overseas markets. Slowing FDI in Asia was partly linked to China’s falling attractiveness as an investment location, rising industrial costs and a bout of risk aversion with emerging markets.
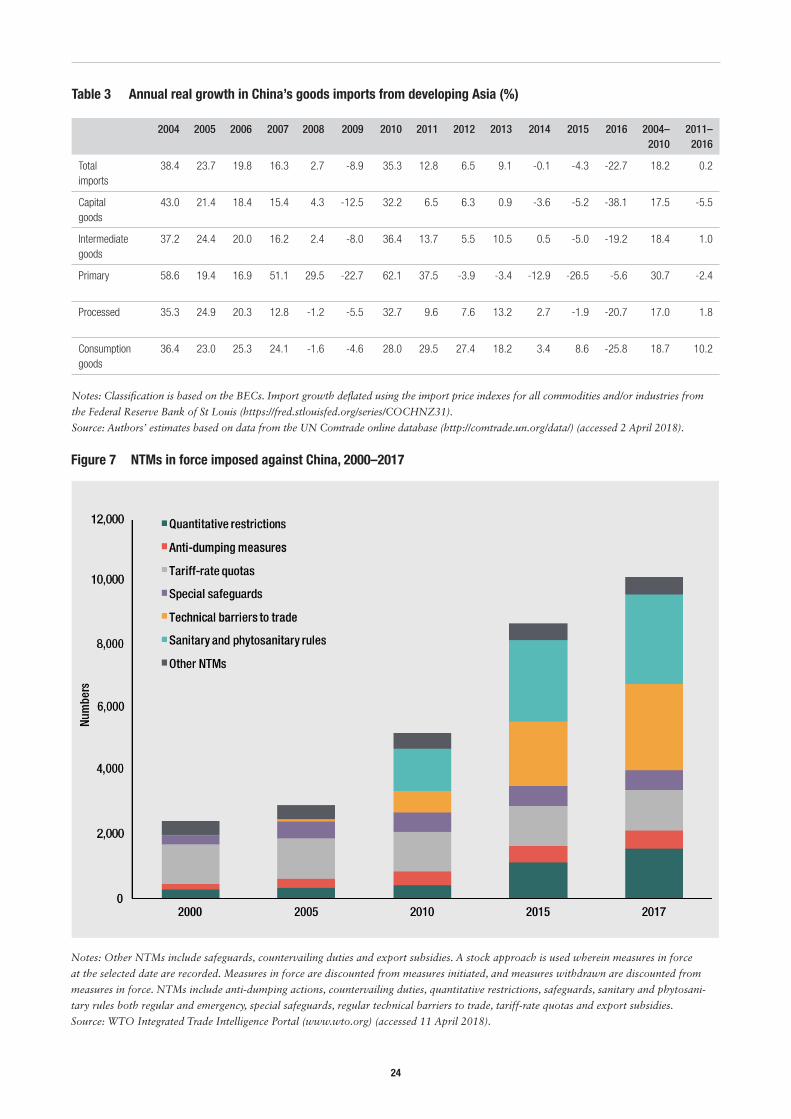
Third, trade protectionism has increased in the post-crisis era. Decades of trade liberalisation have resulted in historically low import tariffs in developing Asia, averaging about 8% (2014). However, murky non-tariff measures (NTMs)15 have risen and impeded the region’s trade expansion, particularly China-centred GVC trade. Figure 7 shows the number of NTMs imposed on China by Asian economies as well as non-Asian economies such as the US and the EU. The number of NTMs imposed on China by others has quadrupled, from 2,462 to 10,181 between 2000 and 2017, with a notable increase occurring in the post-crisis period. Those measures in 2017 were dominated by a few major types of NTMs – such as sanitary and phytosanitary measures (28%), technical barriers to trade (27%), quantitative restrictions (16%) and tariff-rate quotas (13%) – which throttle the region’s GVC trade.
24
2004 2005 2006 2007 2008 2009 2010 2011 2012 2013 2014 2015 2016 2004–2010
2011–2016
Total imports
38.4 23.7 19.8 16.3 2.7 -8.9 35.3 12.8 6.5 9.1 -0.1 -4.3 -22.7 18.2 0.2
Capital goods
43.0 21.4 18.4 15.4 4.3 -12.5 32.2 6.5 6.3 0.9 -3.6 -5.2 -38.1 17.5 -5.5
Intermediate goods
37.2 24.4 20.0 16.2 2.4 -8.0 36.4 13.7 5.5 10.5 0.5 -5.0 -19.2 18.4 1.0
Primary 58.6 19.4 16.9 51.1 29.5 -22.7 62.1 37.5 -3.9 -3.4 -12.9 -26.5 -5.6 30.7 -2.4
Processed 35.3 24.9 20.3 12.8 -1.2 -5.5 32.7 9.6 7.6 13.2 2.7 -1.9 -20.7 17.0 1.8
Consumption goods
36.4 23.0 25.3 24.1 -1.6 -4.6 28.0 29.5 27.4 18.2 3.4 8.6 -25.8 18.7 10.2
Table 3 Annual real growth in China’s goods imports from developing Asia (%)
Notes: Classification is based on the BECs. Import growth deflated using the import price indexes for all commodities and/or industries from
the Federal Reserve Bank of St Louis (https://fred.stlouisfed.org/series/COCHNZ31).
Source: Authors’ estimates based on data from the UN Comtrade online database (http://comtrade.un.org/data/) (accessed 2 April 2018).
Figure 7 NTMs in force imposed against China, 2000–2017
Notes: Other NTMs include safeguards, countervailing duties and export subsidies. A stock approach is used wherein measures in force
at the selected date are recorded. Measures in force are discounted from measures initiated, and measures withdrawn are discounted from
measures in force. NTMs include anti-dumping actions, countervailing duties, quantitative restrictions, safeguards, sanitary and phytosani-
tary rules both regular and emergency, special safeguards, regular technical barriers to trade, tariff-rate quotas and export subsidies.
Source: WTO Integrated Trade Intelligence Portal (www.wto.org) (accessed 11 April 2018).
25
3.3 New global value chain trading opportunities While the region’s China-centred GVC trade has slowed, undue trade pessimism seems misplaced. A recovery in the advanced economies could stimulate new sources of GVC trade in the region. China’s slowing growth can also open up new GVC trading opportunities for other regional economies and China. We discuss three recent developments.
One development is that multinational corporations (MNCs) are exploring alternative locations for GVC manufacturing within developing Asia. Data on Chinese outward FDI in manufacturing are not readily available from official Chinese sources. Fortunately, some information on cross-border greenfield FDI in the manufacturing sector is available from fDi Markets, a subscription online database from The Financial Times. Some of China’s GVC production stages – particularly labour-intensive ones – are beginning to migrate to lower-cost locations, as evidenced by a post-crisis rise in China’s outward FDI in manufacturing in developing Asia.
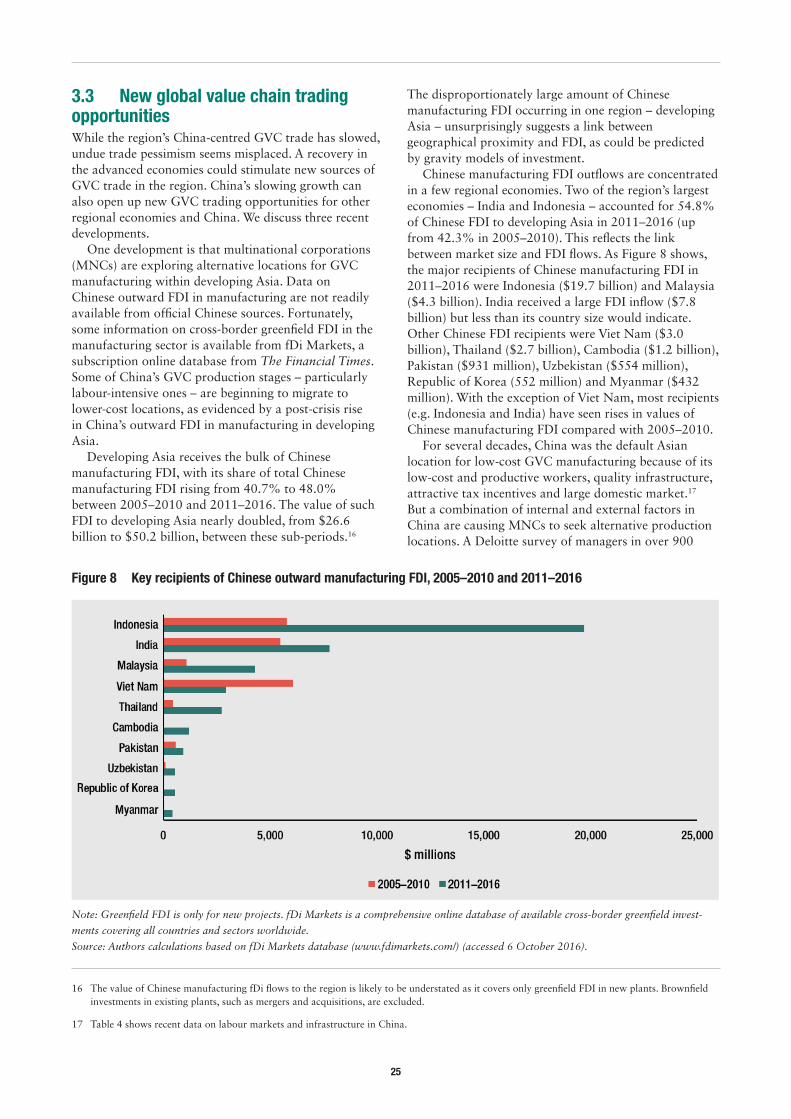
Developing Asia receives the bulk of Chinese manufacturing FDI, with its share of total Chinese manufacturing FDI rising from 40.7% to 48.0% between 2005–2010 and 2011–2016. The value of such FDI to developing Asia nearly doubled, from $26.6 billion to $50.2 billion, between these sub-periods.16
16 The value of Chinese manufacturing fDi flows to the region is likely to be understated as it covers only greenfield FDI in new plants. Brownfield investments in existing plants, such as mergers and acquisitions, are excluded.
17 Table 4 shows recent data on labour markets and infrastructure in China.
The disproportionately large amount of Chinese manufacturing FDI occurring in one region – developing Asia – unsurprisingly suggests a link between geographical proximity and FDI, as could be predicted by gravity models of investment.
Chinese manufacturing FDI outflows are concentrated in a few regional economies. Two of the region’s largest economies – India and Indonesia – accounted for 54.8% of Chinese FDI to developing Asia in 2011–2016 (up from 42.3% in 2005–2010). This reflects the link between market size and FDI flows. As Figure 8 shows, the major recipients of Chinese manufacturing FDI in 2011–2016 were Indonesia ($19.7 billion) and Malaysia ($4.3 billion). India received a large FDI inflow ($7.8 billion) but less than its country size would indicate. Other Chinese FDI recipients were Viet Nam ($3.0 billion), Thailand ($2.7 billion), Cambodia ($1.2 billion), Pakistan ($931 million), Uzbekistan ($554 million), Republic of Korea (552 million) and Myanmar ($432 million). With the exception of Viet Nam, most recipients (e.g. Indonesia and India) have seen rises in values of Chinese manufacturing FDI compared with 2005–2010.
For several decades, China was the default Asian location for low-cost GVC manufacturing because of its low-cost and productive workers, quality infrastructure, attractive tax incentives and large domestic market.17 But a combination of internal and external factors in China are causing MNCs to seek alternative production locations. A Deloitte survey of managers in over 900
Figure 8 Key recipients of Chinese outward manufacturing FDI, 2005–2010 and 2011–2016
Note: Greenfield FDI is only for new projects. fDi Markets is a comprehensive online database of available cross-border greenfield invest-
ments covering all countries and sectors worldwide.
Source: Authors calculations based on fDi Markets database (www.fdimarkets.com/) (accessed 6 October 2016).
26
US MNCs listed the following operational challenges in China (see Buelow et al., 2013):18
1. Labour costs and competition for skilled workers are rising in response to a tightening labour market.19
2. Other costs are increasing (including real estate costs, electricity rates and corporate income tax) while tax incentives are reducing or more difficult to obtain.
3. Intellectual property protection remains a notable risk. 4. Currency risks are looming in the wake of real
exchange rate appreciation and an eroding Chinese export competitiveness.
Accordingly, it has become increasingly difficult for China to compete on labour costs against lower-cost economies in labour-intensive low-skilled manufacturing sectors such as clothing and textiles. The rise in Chinese manufacturing FDI to the region also reflects an important external change – improvements in China’s competitors. The business environments in China and these other economies are compared in Section 3.4.
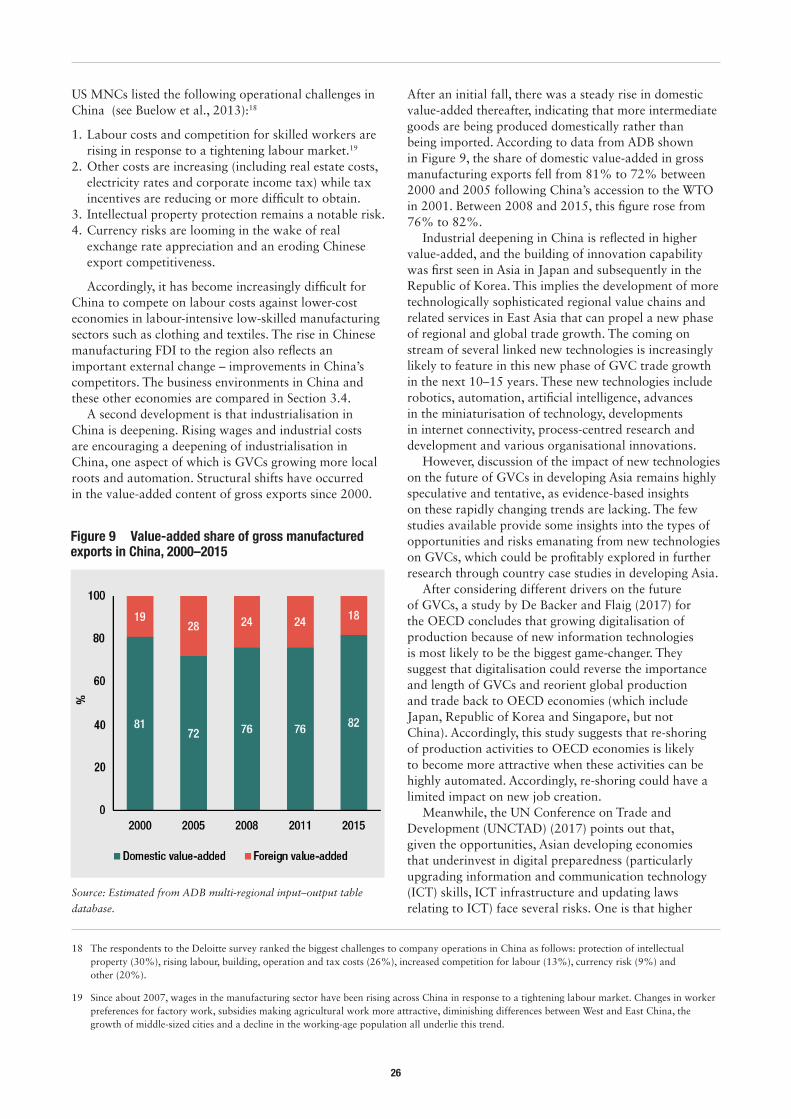
A second development is that industrialisation in China is deepening. Rising wages and industrial costs are encouraging a deepening of industrialisation in China, one aspect of which is GVCs growing more local roots and automation. Structural shifts have occurred in the value-added content of gross exports since 2000.
18 The respondents to the Deloitte survey ranked the biggest challenges to company operations in China as follows: protection of intellectual property (30%), rising labour, building, operation and tax costs (26%), increased competition for labour (13%), currency risk (9%) and other (20%).
19 Since about 2007, wages in the manufacturing sector have been rising across China in response to a tightening labour market. Changes in worker preferences for factory work, subsidies making agricultural work more attractive, diminishing differences between West and East China, the growth of middle-sized cities and a decline in the working-age population all underlie this trend.
After an initial fall, there was a steady rise in domestic value-added thereafter, indicating that more intermediate goods are being produced domestically rather than being imported. According to data from ADB shown in Figure 9, the share of domestic value-added in gross manufacturing exports fell from 81% to 72% between 2000 and 2005 following China’s accession to the WTO in 2001. Between 2008 and 2015, this figure rose from 76% to 82%.
Industrial deepening in China is reflected in higher value-added, and the building of innovation capability was first seen in Asia in Japan and subsequently in the Republic of Korea. This implies the development of more technologically sophisticated regional value chains and related services in East Asia that can propel a new phase of regional and global trade growth. The coming on stream of several linked new technologies is increasingly likely to feature in this new phase of GVC trade growth in the next 10–15 years. These new technologies include robotics, automation, artificial intelligence, advances in the miniaturisation of technology, developments in internet connectivity, process-centred research and development and various organisational innovations.
However, discussion of the impact of new technologies on the future of GVCs in developing Asia remains highly speculative and tentative, as evidence-based insights on these rapidly changing trends are lacking. The few studies available provide some insights into the types of opportunities and risks emanating from new technologies on GVCs, which could be profitably explored in further research through country case studies in developing Asia.
After considering different drivers on the future of GVCs, a study by De Backer and Flaig (2017) for the OECD concludes that growing digitalisation of production because of new information technologies is most likely to be the biggest game-changer. They suggest that digitalisation could reverse the importance and length of GVCs and reorient global production and trade back to OECD economies (which include Japan, Republic of Korea and Singapore, but not China). Accordingly, this study suggests that re-shoring of production activities to OECD economies is likely to become more attractive when these activities can be highly automated. Accordingly, re-shoring could have a limited impact on new job creation.
Meanwhile, the UN Conference on Trade and Development (UNCTAD) (2017) points out that, given the opportunities, Asian developing economies that underinvest in digital preparedness (particularly upgrading information and communication technology (ICT) skills, ICT infrastructure and updating laws relating to ICT) face several risks. One is that higher
Figure 9 Value-added share of gross manufactured exports in China, 2000–2015
Source: Estimated from ADB multi-regional input–output table
database.
27
productivity gains arising from digitalisation typically go to a small number of skilled people, which may contribute to polarisation and increasing income inequality. Another is that many jobs in the wide spectrum of manufacturing (e.g. textiles and garments) as well as services (e.g. retail trade and business process outsourcing) are likely to become obsolete with digitalisation. Finally, in the developed world, there are concerns about privacy and security with the spread of the internet and data flows. These pose a relatively greater risk to Asian developing countries, whose political and economic systems are less stable and whose populations may be less media-literate.
Third, GVC-related services are below the radar but a new source of GVC trade. Services are the largest sector in most developing Asian economies and services trade is growing. But services trade may not be properly reflected in international trade statistics because it is difficult to measure.20 GVC-related services, digital trade, professional services and financial services are areas with potential for trade growth. China is likely to further expand its role as an exporter and importer of services (Constantinescu et al., 2016). Over time, China is likely to develop a regional GVC-related services hub alongside its role as a regional manufacturing and assembly hub in GVC trade. India is also likely to expand its trade in IT services and witness the emergence of GVC-related services and other commercial services exports. Southeast and South Asian economies can further develop GVC-related services, tourism and other commercial services exports.
To realise these new GVC trading opportunities and mitigate risks, latecomers need to improve the business environment and firms should adjust their business strategies. These issues are explored next.
3.4 Business environmentEast Asia’s development experience suggests that many location-specific and policy factors influence the location of GVC trade (Kimura, 2016). Numerous government regulations may discourage it, such as restrictions on the entry and operation of FDI, import barriers, corporation tax and business start-up procedures. Supply-side factors and markets also matter, including trade infrastructure, labour markets and institutions. Lall (1990) and Dabla-Norris et al. (2013) suggest cross-country comparisons of
20 One problem in relation to GVC trade is how much of services trade is reflected in value-added in goods trading, for which there is a paucity of evidence. In addition, the potential for faster services trade growth is held back because of trade restrictions, skills gaps and problems with internet connectivity.
21 Data gaps meant that we omitted Uzbekistan from Table 4.
22 For a more comprehensive analysis of business environment indicators influencing Chinese manufacturing FDI in Asian and African economies, see Calabrese et al. (2017).
23 However, measuring labour productivity is problematic and comparable cross-country data are lacking for developing countries. Fortunately, a crude measure – GDP per person employed (as a percentage of US levels) – is provided by the Canadian Conference Board Total Economy Database for China and developing Asian economies for 2017.
national business environments provide valuable policy insights. Drawing on this tradition, a comparison is made of the business environments in China and nine of the major recipients of Chinese manufacturing FDI shown in Figure 8.21 For reference, data on Japan – the pioneer in relocating GVC manufacturing across developing Asia – is also shown. To keep the task manageable, these indicators are grouped under three headings: (i) wages and productivity, (ii) FDI and business start-up regulations and (iii) trade infrastructure (see Table 4).22
3.4.1 Competitive wages and high labour productivityCompetitive wages are the fundamental driver of the relocation of GVC activities from China to lower-cost locations. High labour productivity levels are associated with improvements in price, quality and delivery to world standards. The most recent estimates from various sources indicate that India, Indonesia and five other FDI recipients have cheaper hourly labour costs than China. However, labour costs in Japan and the Republic of Korea are much higher than China’s. Expressed as a share of Chinese wages, the figures are Myanmar (11%), Pakistan (19%), Viet Nam (22%), Indonesia (29%), India (52%), Malaysia (64%) and Thailand (68%). Even after over a decade of catching up, productivity levels in China remain considerably lower than for mature economies, according to estimates from the Canadian Conference Board.23 In 2017, China’s output per person was only 25% of the US level while the average for the nine Chinese FDI recipients was 24%. However, output per person varies significantly between these economies. Japan (65.0%), Republic of Korea (61%) and Malaysia (51%) have higher output per person than China; Thailand (26%) is on par with China. However, Indonesia (22%) and India (14%) as well as the others are lower than China.
3.4.2 Openness to FDI and streamlined business proceduresAs relocation of GVC activities is driven largely by MNCs, low barriers to FDI and streamlined procedures encourage intra-regional capital flows in GVC manufacturing activities, technology transfer, marketing linkages and MNC–local business relationships. OECD provides an FDI Regulatory Restrictiveness Index for 2016 where scores closer to 0 indicate an open FDI
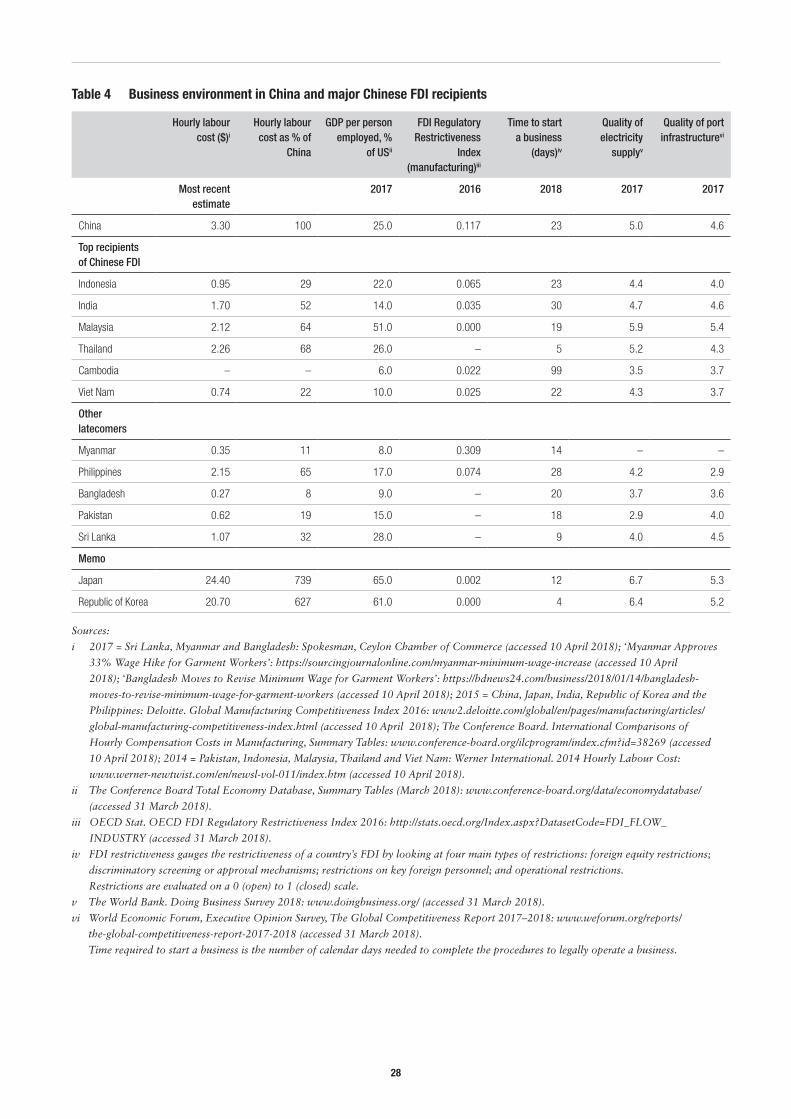
28
Hourly labour cost ($)i
Hourly labour cost as % of
China
GDP per person employed, %
of USii
FDI Regulatory Restrictiveness
Index
(manufacturing)iii
Time to start a business
(days)iv
Quality of electricity
supplyv
Quality of port infrastructurevi
Most recent estimate
2017 2016 2018 2017 2017
China 3.30 100 25.0 0.117 23 5.0 4.6
Top recipients of Chinese FDI
Indonesia 0.95 29 22.0 0.065 23 4.4 4.0
India 1.70 52 14.0 0.035 30 4.7 4.6
Malaysia 2.12 64 51.0 0.000 19 5.9 5.4
Thailand 2.26 68 26.0 – 5 5.2 4.3
Cambodia – – 6.0 0.022 99 3.5 3.7
Viet Nam 0.74 22 10.0 0.025 22 4.3 3.7
Other latecomers
Myanmar 0.35 11 8.0 0.309 14 – –
Philippines 2.15 65 17.0 0.074 28 4.2 2.9
Bangladesh 0.27 8 9.0 – 20 3.7 3.6
Pakistan 0.62 19 15.0 – 18 2.9 4.0
Sri Lanka 1.07 32 28.0 – 9 4.0 4.5
Memo
Japan 24.40 739 65.0 0.002 12 6.7 5.3
Republic of Korea 20.70 627 61.0 0.000 4 6.4 5.2
Table 4 Business environment in China and major Chinese FDI recipients
Sources:
i 2017 = Sri Lanka, Myanmar and Bangladesh: Spokesman, Ceylon Chamber of Commerce (accessed 10 April 2018); ‘Myanmar Approves
33% Wage Hike for Garment Workers’: https://sourcingjournalonline.com/myanmar-minimum-wage-increase (accessed 10 April
2018); ‘Bangladesh Moves to Revise Minimum Wage for Garment Workers’: https://bdnews24.com/business/2018/01/14/bangladesh-
moves-to-revise-minimum-wage-for-garment-workers (accessed 10 April 2018); 2015 = China, Japan, India, Republic of Korea and the
Philippines: Deloitte. Global Manufacturing Competitiveness Index 2016: www2.deloitte.com/global/en/pages/manufacturing/articles/
global-manufacturing-competitiveness-index.html (accessed 10 April 2018); The Conference Board. International Comparisons of
Hourly Compensation Costs in Manufacturing, Summary Tables: www.conference-board.org/ilcprogram/index.cfm?id=38269 (accessed
10 April 2018); 2014 = Pakistan, Indonesia, Malaysia, Thailand and Viet Nam: Werner International. 2014 Hourly Labour Cost:
www.werner-newtwist.com/en/newsl-vol-011/index.htm (accessed 10 April 2018).
ii The Conference Board Total Economy Database, Summary Tables (March 2018): www.conference-board.org/data/economydatabase/
(accessed 31 March 2018).
iii OECD Stat. OECD FDI Regulatory Restrictiveness Index 2016: http://stats.oecd.org/Index.aspx?DatasetCode=FDI_FLOW_
INDUSTRY (accessed 31 March 2018).
iv FDI restrictiveness gauges the restrictiveness of a country’s FDI by looking at four main types of restrictions: foreign equity restrictions;
discriminatory screening or approval mechanisms; restrictions on key foreign personnel; and operational restrictions.
Restrictions are evaluated on a 0 (open) to 1 (closed) scale.
v The World Bank. Doing Business Survey 2018: www.doingbusiness.org/ (accessed 31 March 2018).
vi World Economic Forum, Executive Opinion Survey, The Global Competitiveness Report 2017–2018: www.weforum.org/reports/
the-global-competitiveness-report-2017-2018 (accessed 31 March 2018).
Time required to start a business is the number of calendar days needed to complete the procedures to legally operate a business.
29
regime.24 While China’s FDI regime has improved over the 2000s (to reach a score of 0.117 in 2016), six of China’s FDI recipients, including India and Indonesia, appear to have more open FDI regimes. However, Myanmar’s FDI regime is more restrictive than China’s. A key indicator of behind-the-border regulations is the time taken to start a business (in calendar days), which the World Bank provides for 2018. Japan, Malaysia, Myanmar, Pakistan, Republic of Korea and Thailand have faster business start-up times than China while Indonesia and Viet Nam are on par with China. Cambodia and India lag China.
3.4.3 Efficient and reliable infrastructureReliable and competitively priced electricity is another crucial aspect of GVC manufacturing. So too is efficient port infrastructure and logistics, which reduce trade costs and transit times for the movement of goods and intermediate inputs from one link in the supply chain to the next. The World Economic Forum provides a ranking of the quality of electricity and ports for 2017 based on the perceptions of business and hard data where 7 is the best possible situation. While Japan, Malaysia , Republic of Korea and Thailand have superior electricity supply to China, the others lag. Interestingly, only Japan, Malaysia and Republic of Korea have better quality ports than China. Section 4 elaborates further on infrastructure needs and financing in developing Asia in the context of the BRI.
Thus, there are signs that China’s competitors are improving their business environment, which makes them increasingly attractive to receiving outward manufacturing FDI from China. Some economies in developing Asia offer relatively low wages with reasonably good labour productivity, are increasingly open to export-oriented FDI and have upgraded their energy and port infrastructure.
3.5 Firm-level factorsThe role of firms in GVC trade in developing Asia is a new frontier in research on international economics. The recent availability of micro-data from enterprise surveys has enabled identification of the characteristics of firms that have successfully joined GVC trade in developing Asian economies. Firms can play various roles in GVC
24 This tries to gauge the restrictiveness of a country’s FDI regulations by considering various restrictions: foreign equity limitations, approval mechanisms, restrictions on employing foreign labour and operational restrictions (e.g. restrictions on capital repatriation). A high score on the FDI index indicates greater restrictiveness. However, the FDI index does not fully measure how FDI regulations are implemented and state ownership in key sectors is not captured.
25 Adding a size-squared variable in the all manufacturing firms model was useful in clarifying the size effect. The coefficient on size-squared is negative and significant, implying a non-linear relationship.
trade, such as direct exporters, suppliers of intermediate goods to exporters (tier 1 suppliers) or suppliers to suppliers of exporters (tier 2 suppliers).
A recent study conducted econometric analysis on about 6,000 firms in five outward-oriented Southeast Asian economies (Indonesia, Malaysia, the Philippines, Thailand and Viet Nam) to examine the factors affecting firm-level entry into GVC trade (Wignaraja, 2015). It underscored the Melitz notion of firm heterogeneity in GVC trade (i.e. that firms are considered different in terms of efficiency and fixed and variable costs when involved in GVC trade). Several different models were estimated, including one for all manufacturing firms. The findings indicate that some firms are better than others in joining GVC trade and that these differences are linked to various factors.
One is that the size of firms affects the probability of joining GVC trade. This is indicated by the coefficient on firm size being positive and significant in the all manufacturing firms model. Being a big firm creates advantages to participating in supply chains, owing to the larger scale of production, better access to technology from abroad and the ability to pay higher wages for skilled labour and to spend more on marketing. Firm growth and collaborating with large firms (e.g. as sub-contractors or suppliers of inputs) are key for participating in GVC trade. Hence, smart business strategies, such as mergers, acquisitions and forming business alliances with multinationals or large local business houses, are rational approaches.
Another is that, under some circumstances, nimble small and medium enterprises (SMEs) can also join GVC trade.25 By clubbing together in industrial clusters, SMEs can overcome some of the disadvantages of being small and rely on the benefits of interdependence. Small firms located in clusters can jointly finance a training centre or a technical consultant to upgrade skills. Business associations can facilitate clustering by mitigating trust deficits to cooperation among SMEs, and by coordinating collective actions for cluster formation. For instance, major industrial clusters are located in Viet Nam near Hanoi and Ho Chi Minh City, where large firms are surrounded by thousands of SME suppliers and subcontractors making garments, agricultural machinery and electronics goods. To overcome the disadvantages of firm size, SMEs can also embark on niche market strategies.
30
However, firm size is not the whole story of entry into GVC trade in Southeast Asia.26 Efficiency and access to finance also influence the probability of joining GVC trade. This is indicated by positive and significant coefficients on the variables capturing technology, skills and access to credit from commercial banks in the all manufacturing firms model. Firms that have acquired higher levels of technological capabilities are more likely to succeed in GVC trade. This requires firms to undertake conscious investments in skills and information to operate imported technologies rather than simply learning by doing. Having higher levels of human capital, particularly literate secondary-level educated workers and tertiary-level educated managers, helps with technology absorption and formulating effective business strategies. In the presence of capital market imperfections, well-organised firms with collateral and an established record with commercial banks are more likely than others to join GVC trade.
These cross-country, cross-firm findings on the influences on firm-level entry in GVCs receive confirmation in another econometric study of 234 SMEs in Malaysia (Arudchelvan and Wignaraja, 2016). Arudchelvan and Wignaraja found that firm size was positive and significant, and even among SMEs it was the larger firms that were more likely to participate in GVCs. For example, the probability of participating in GVCs increases from 16% to 22% when firm size increases from 25 to 50 employees. It increases further from 29% to 37% when firm size increases from 75 to 100 employees. The results suggest economies of scale are important in overcoming the initial fixed costs of entering and maintaining a foothold in a GVC. The foreign technology licence variable is also positively significant. Having a foreign technology licence increases GVC participation by 20%. Research and development (R&D) expenditure as a proportion of sales also has a considerable effect on SME participation in GVCs. An increase in the R&D to sales ratio from 10% to 30% increases the probability of participation from 15% to 23%. An R&D to sales ratio of 50% increases the probability of participation to 35%. The results from Malaysia suggest that size and technological capability are positively associated with SME participation in GVCs.
3.6 Conclusion and implications for development partnersThis section has examined recent developments in GVC trade from both a macro and a firm-level viewpoint with a focus on the post-crisis period. East Asia’s impressive structural transformation is closely linked with its role
26 It is interesting to examine some predicted probabilities of the size variable holding all other variables at their means. In the all SMEs model, the probability of an SME participating in supply chain trade for a firm with 1–25 workers is 10%, compared with 35% for one that has 75–100 workers. Having an internationally agreed quality certificate (e.g. ISO) increases the probability of an SME joining supply chain trade from 16% to 25%, in the all SMEs model. Having a high school-educated workforce increases the probability of an SME joining supply chain trade from 14% to 21% in the all SMEs model.
in GVC trade over recent decades. However, GVC trade has slowed, particularly since the crisis, highlighting the region’s high reliance on China as the main regional assembly hub. This post-crisis slowdown is explained by a combination of the lingering effects of a shock in external demand, a shift in China’s growth pattern away from investment and exports, a slowdown in inward FDI and rising trade protectionism.
But undue trade pessimism in the post-crisis era seems misplaced: there are signs that other regional economies are starting to play an increasing role in GVC trade. Three recent developments in GVC trade are encouraging: (i) MNCs are exploring alternative locations for labour-intensive segments of GVC manufacturing within developing Asia, (ii) China’s industrialisation is deepening and its GVCs are growing local roots amid the spread of new technologies internationally and (iii) GVC-related services are emerging as a new source of trade. These trends are likely to benefit China as well as other regional economies, including India, Indonesia, Malaysia, Thailand and Viet Nam.
The evidence in this section suggests some implications for latecomers and development partners. First, GVC participation remains an important route to trade-led growth and achieving unprecedented prosperity in a post-crisis world economy. But this does not mean that joining GVCs is seamless and costless for latecomers beyond East Asia. The macro and micro evidence presented here indicates the differences in the ability of countries and firms to respond to and take part in the emergence of GVC trade. This ability is one of the determining factors of vulnerabilities and opportunities in developing Asia’s economies.
Second, foreign aid for implementing reforms can enable latecomers to join GVCs. While countries often pursue many policy reforms to achieve different objectives, it is important to get the basics right with regard to joining GVCs. The comparative macro-level analysis identified key factors associated with a more market-friendly business environment. These include ensuring flexible labour markets and upgrading skills geared to business needs, liberalising FDI entry regulations and streamlining behind-the-border procedures and improving the efficiency and reliability of trade-related infrastructure such as ports and energy. Targeting donor focus on these priorities and specific problems could help latecomers in their quest to participate in GVCs.
Third, there is a case for donor support for SMEs to participate in GVC activities. Micro-level evidence suggests that firms in latecomers need to actively adjust business strategies to participate in GVC trade, and that

31
SMEs face a disproportionate constraint in access to finance. Using smart business strategies enables firms to grow larger and helps entry into GVC trade. Firm graduation is rightly an activity to be determined by market conditions and not by governments or donor support. The evidence also suggests a more nuanced story than just firm size. It reveals that SMEs have the opportunity to overcome the disadvantage of firm size by clubbing together in industrial clusters and investing in improving efficiency and access to credit from commercial banks. Donor programmes in latecomers could provide some resources to helping SME associations and competitive SMEs form industrial clusters in sectors with a comparative advantage and improving access to finance from commercial banks.
Financial access can be supported by establishing credit rating agencies, reforming collateral laws and putting in place financial literacy training for SMEs.
Fourth, emerging risks are gathering on the region’s GVC horizon, including those linked to trade protectionism as well as disruptive technological progress and re-shoring of production activities back to OECD countries. There is a dearth of evidence on the impact of new technologies on the future of GVCs but developing Asian countries should invest in digital preparedness to mitigate the risks of marginalisation. Further research through country case studies in developing Asia would be invaluable to help map possible areas for donor support.
32
4 Macro-financial implications and risks of the Belt and Road Initiative for Asia’s economies
4.1 IntroductionThe Chinese Communist Party has been developing the BRI since 2015. Its formal title is ‘Visions and Actions on Jointly Building Silk Road Economic Belt and 21st-century Maritime Silk Road’. Since 2015, there has been a series of high-level policy meetings with approximately 68 countries expected to participate. In 2017, the Chinese Communist Party formally adopted the BRI. However, at the time of writing, many of these agreements remain relatively broad and lack detail in relation to specific projects, financing and other arrangements.
The policy goal of the BRI is to deliver ‘shared growth through discussion and collaboration’ within China’s strategy of international expansion of trade, investment and political engagement. This includes through increasing market access and trade and enhancing transportation and logistics efficiencies. More practically, the BRI also seeks to be a vehicle for spreading China’s industrial overcapacity – discussed further in Section 4.3.
Central to the BRI is an $8 trillion infrastructure construction programme of intercontinental transport, energy and telecommunications linking China to other Asian countries, Africa and Europe. The construction will be financed predominantly by China’s policy banks and carried out by Chinese firms. It will be accompanied by the encouragement and support of investments by private Chinese firms in host countries.
As this section discusses, the BRI offers significant opportunities for both China and partner countries. In particular, infrastructure development and growth in trade are key components in accelerating economic growth and prosperity.
However, there are also risks. The financing that China’s policy banks are providing consists predominantly of loans at variable interest rates, which could increase debt. There are risks that the boost to economic growth may not be sufficient to service debt or to maintain sustainable debt levels. Further, should there be issues in servicing the debt, this will have implications for the stability of the Chinese financial system.
There are also other risks, including relating to construction of infrastructure projects and ensuring that appropriate regulatory and environmental standards are met. The latter is of concern given China’s poor domestic history in relation to such standards.
Further, the BRI is likely to significantly rebalance political relationships in the region. As we discuss, this has already caused political tensions in Asia. Assessing and managing these political issues is essential, not only for the success of the BRI, but also for broader political stability in the region. Some implications for donors arising from the BRI are also discussed in this section.
Next we discuss in more detail the BRI and the opportunities and risks it offers to both host countries and China. This focuses on Asia, reflecting the scope of this report. However, many of the issues raised could apply equally to the European and African countries engaging in the BRI.
4.2 Overview of the Belt and Road InitiativeIn Asia, the broad strategy is to develop six economic corridors. There are four land routes: the Eurasian Land Bridge along the historical Silk Road in Western and Central Asia, the China–Mongolia–Russia corridor, a
33
corridor from China to Southeast Asia linking China to Lao PDR, Cambodia, Thailand, Malaysia and Singapore and the China–Pakistan corridor.
In addition, there are two sea routes – termed the ‘21st-century Maritime Silk Road’ – linking China to Bangladesh, India and Myanmar and to the Indonesian Peninsula. The land routes include long-distance railways from China to Central Asia, Pakistan and Southeast Asia. In addition, road networks and ports are being developed, including in Sri Lanka, Pakistan and Southeast Asia.
In relation to execution, some parts of these initiatives have been substantially completed whereas others remain at the very early stages.
In Central Asia, the BRI has already established significant new infrastructure. This includes long-distance railway lines across the region and oil and gas pipelines to China. Other developments include roads, bridges and tunnels and a dry port on the Kazakhstan–China border.
Pakistan has also been a focus for the BRI. Development of a trade corridor is planned between China’s Kashgar region and southern Pakistan, with committed investments of over $40 billion. Of this, 74% is allocated to developing power infrastructure, including coal mining and power plants, oil and gas pipelines and hydropower stations. The remaining financing is being used to develop transport infrastructure, including railways, road networks and deep-water ports with accompanying industrial zones in Pakistan’s southern city of Gwadar. The development of telecommunications will include fibre-optic networks. The IMF has estimated that Pakistan will see approximately 1% GDP growth in the medium term as a result of these BRI investments.
In Southeast Asia, the BRI has bought similar developments. These include a high-speed railway in Indonesia and, under construction, a railway line from China’s southern regions through Southeast Asia to Singapore.
The BRI also supports private sector firms from China to invest in BRI-participating countries, and there have been significant investments by such firms. For example, in the first three quarters of 2016 alone, Chinese enterprises signed nearly 7,000 new contracts for private projects relating to the BRI in over 60 countries, with a total contract value of $85 billion. This represented a 30.7% increase on the previous year and accounted for 51% of China’s foreign contract projects in this period.
The BRI is being financed through lending from Chinese policy banks. These include China’s Development bank, the Export Import Bank of China and the Agricultural Development Bank of China. The Chinese government has established the Silk Road Fund with $40 billion for equity investments. In addition, Chinese commercial banks, the Asian Infrastructure Investment Bank (AIIB), the World Bank and ADB have committed financing (PwC, 2017b).
4.3 Economic risks and opportunitiesThe BRI offers a significant opportunity for participating countries to accelerate economic growth, as it provides a way to finance and construct critical infrastructure in power and transport and to attract private sector investment for industrialisation and other key sectors, as well as, in the longer term, to create a vast, interlinked market converging on China.
The link with China is particularly attractive in this regard: not only is it accompanied by financing, but also it offers an opportunity to grow trade with the second largest economy in the world.
The BRI also offers significant opportunities for China. China has suffered from overcapacity in its domestic construction industry. The BRI is expected to absorb a significant amount of this excess capacity. This is because the main construction contractors for the BRI infrastructure projects are Chinese construction firms. To illustrate the scale of this, ADB has forecast that the BRI will absorb 25% of China’s annual output of cement and steel for the next 10 years.
China has also suffered from problems in its financial sector that have threatened to undermine financial stability. These have included excessive domestic credit growth for real estate development through commercial banks and non-regulated financial funds. In addition, China has significant lending capacity in its policy banks that needs to be redirected away from financing of domestic infrastructure development and industrialisation. As for the construction sector, the BRI has the potential to absorb this excess financing capacity.
A further goal of the BRI is establishing the Chinese currency, the renminbi (RMB), as an international reserve currency. As part of the BRI agreements, the Chinese have agreed swap agreements with central banks in participating countries and encouraged BRI lending to be denominated in RMB. To date, the RMB has already been adopted as an official reserve currency in a number of Asian countries, including Cambodia, Malaysia, the Philippines and the Republic of Korea and currently accounts for an estimated 5% of total foreign exchange reserves (Shanghai Stock Exchange, 2017).
Finally, from a Chinese perspective, the BRI offers an opportunity for growth for its western and north-eastern provinces. These include Xingjian, China’s westernmost province, which is at the core of BRI in Central Asia, and Fujian, a southern coastal province that lies between the major economic centres of Shanghai and Guangzhou and that is a key port on sea trade corridors. This is of importance because these provinces have not fully participated in the exceptionally good Chinese economic growth since 1990 and suffer from poverty and unemployment. Enhancing economic opportunity and growth in these regions is a key opportunity for China to tackle these problems in its more economically marginalised regions.
34
4.4 Project risksLarge infrastructure projects always carry significant risks in relation to project development, construction and operation. These risks are greater in developing countries where the institutional environment and capacity is weaker, including in relation to government capacity, legal and regulatory frameworks and construction capabilities. Given the huge scale and complexity of the BRI projects, these risks are significant (te Velde et al., 2015; Tyson, forthcoming).
In addition, regional infrastructure projects are notoriously difficult to deliver successfully because of the complex governance structures that are needed to develop and operate them across multiple countries. In Asia, the history of development of such governance structures has been mixed. For example, regional infrastructure projects developed by ADB took, on average, seven years to agree (te Velde et al., 2015).
In BRI announcements to date, there has been little focus on developing the legal, regulatory and governance frameworks that are the hallmarks of successful regional infrastructure projects. This is of concern. BRI projects have also been criticised for their lack of transparency in relation to agreements reached between China and national governments, with the terms and conditions not being made publicly available. They have also been criticised for not adhering to international standards for projects in relation to the environment. Engaging China to lead with high levels of international standards in relation to the project would be positive.
These risks have already been illustrated by problems in existing BRI projects that have seen significant project delays and multiple renegotiations of agreements. For example, there have been long project delays in Indonesia, where a $6 billion railway development is well behind schedule. Similar problems have plagued projects in Central Asia and Bangladesh. These problems have resulted from political tensions – discussed further in Section 4.6 – and problems in construction work, such as technical errors and failures to establish land rights.
4.5 Debt sustainabilityFinancing is often a major stumbling block for large-scale infrastructure projects in developing countries. However, positively, this is not the case for BRI projects because they are being accompanied by lending from Chinese banks.
However, the flipside of this is that participating countries are increasing their national debt. If the economic upside of the BRI is not realised, this threatens to make their debt unsustainable.
Figure 10 presents an analysis of the impact of the BRI on the ratios of national debt to gross national income (GNI). It takes the existing national debt in 2016, the cost of BRI projects announced in 2017 and 2018 and the resulting post-BRI debt. The figure then shows
the ratios of the pre- and post-BRI national debt to GNI, assuming a constant 2016 GDP.
As can be seen, for many countries, the BRI-related debt is not expected to cause countries’ debt to GNI ratio to exceed the 60% threshold that is generally considered acceptable for developing countries (Hurley et al., 2018). Of course, we recognise there is considerable debate on when debt is sustainable. But we have taken the 60% as one option.
This includes countries where the BRI-related debt is significantly increasing national debt in absolute terms but where it remains manageable because of initially low national debt levels. For example, this includes Pakistan, where the BRI-related debt increases national debt in absolute terms by 60% but the national debt to GNI ratio remains relatively moderate at 38%, Bangladesh where BRI-related debt increases national debt in absolute terms by 59% but the debt to GNI ratio remains moderate at 28% and the Maldives where the BRI increases national debt by 74% in absolute terms but its debt to GNI ratio remains moderate at 62%.
It should also be noted that there are a number of countries whose debt levels are of concern because they exceed the 60% threshold. However, this excess debt is not a result of the BRI but comes from other sources of national debt. Such countries include Armenia, Bhutan, Georgia and Indonesia.
However, there is a minority of countries where BRI-related debt is of concern. These countries are predominantly those with high levels of existing debt, which have then added to this through BRI projects in a significant way.
These countries are concentrated in Central and Northern Asia and include Kazakhstan, the Kyrgyz Republic, Mongolia and Tajikistan. These countries already have a high debt to GNI ratio and would add lending relating to BRI projects ranging from $2.4 billion to $4.5 billion, lifting national debt to GNI ratios to between 100% and 255%. Typically, such ratios are not considered sustainable. However, a possible counterbalance to these concerns is that the BRI projects in this region are predominantly extractives-related. An example is the building of pipelines and railways whose primary function will be to export extractive materials to China. This is positive in relation to indebtedness because such projects have the potential to provide very significant fiscal revenues and so may be self-financing. However, it should be noted that such projects often have little relationship to broader economic growth or to poverty alleviation and there has been no publicly available robust economic analysis of this.
A further consideration in terms of indebtedness relates to how much BRI-related projects will accelerate economic growth. As discussed earlier, the infrastructure projects and trade the BRI promises may accelerate economic growth. If this is successful, then the countries involved in the BRI will be able to sustain greater debt levels than their debt to 2016 GNI ratios suggest.
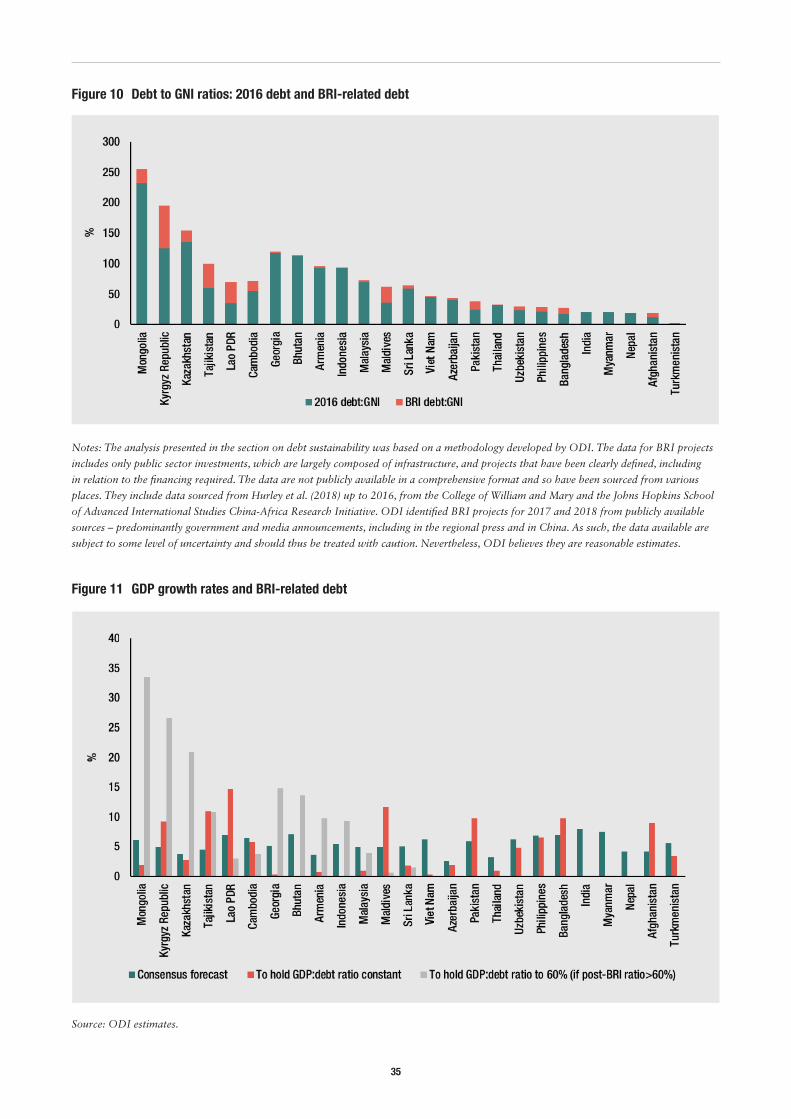
35
Figure 10 Debt to GNI ratios: 2016 debt and BRI-related debt
Notes: The analysis presented in the section on debt sustainability was based on a methodology developed by ODI. The data for BRI projects
includes only public sector investments, which are largely composed of infrastructure, and projects that have been clearly defined, including
in relation to the financing required. The data are not publicly available in a comprehensive format and so have been sourced from various
places. They include data sourced from Hurley et al. (2018) up to 2016, from the College of William and Mary and the Johns Hopkins School
of Advanced International Studies China-Africa Research Initiative. ODI identified BRI projects for 2017 and 2018 from publicly available
sources – predominantly government and media announcements, including in the regional press and in China. As such, the data available are
subject to some level of uncertainty and should thus be treated with caution. Nevertheless, ODI believes they are reasonable estimates.
Figure 11 GDP growth rates and BRI-related debt
Source: ODI estimates.
36
Figure 11 analyses this issue further. It examines the consensus GDP growth forecasts, as discussed earlier in this report, and compares them to those needed to maintain pre-BRI ratios and, for those whose post-BRI debt to 2016 GNI ratio exceeds 60%, the growth rate needed to bring debt to GNI ratios below the 60% threshold over a five-year period to 2023.
Again, for the majority of countries, this indicates that, assuming consensus growth forecasts are achieved, post BRI-related debt to GNI ratios are moderate and should not threaten debt sustainability.
However, the analysis also highlights some countries where debt sustainability is unlikely to be maintained under consensus growth forecasts. Again, those at high risk are concentrated in Central and Northern Asia. For example, Mongolia’s post-BRI debt to 2016 GNI is 255%, and it is forecast to have a consensus growth rate of 6%. In order for Mongolia’s debt to GNI ratio to return to the 60% threshold, its economy would need to grow at 34% annually to 2023.
In addition, there are countries at more moderate risk. These include countries that are dependent on high GDP growth rates to maintain debt sustainability. This is because they have borrowed heavily for BRI-related projects. If GDP growth were not as high as expected – for example, if there were shocks that disrupted their current strong economic growth – then they would be at risk of not being able to service their debt. Such countries include Bhutan, Cambodia, Georgia and Lao PDR.
In relation to this issue, it should also be noted that the figures presented are based only on BRI-related projects that have been announced to 2018. The ambitions of the BRI are much greater than these projects but remain at a strategic level, without specific projects or strategies having been made public. Because of this, the conclusions of this section need to be revisited as the roll-out of the BRI is developed.
Beyond this analysis, there are other risks, including related to the level of interest rates being charged on loans and the level of foreign exchange risk being assumed by borrowing countries through RMB-denominated loans. This is difficult to analyse because of the lack of transparency relating to the terms and conditions of loans. However, these factors may be adding to the debt sustainability risks, especially as such issues have been important factors in debt crises in other developing countries.
Finally, it is useful to recall the experience of African countries that have also borrowed significant amounts of financing from China to build infrastructure using Chinese construction companies. Some have been unable to service the related debt and have not only had to agree to reschedule and freeze debt repayments, but also have repaid loans by transferring assets to Chinese ownership or have granted long leaseholds. These problems serve as a salutary warning to countries in Asia in relation to the risks of the BRI.
4.6 Political risksAsia is politically complex, and a full analysis in this regard is beyond the scope of this report. However, the BRI is likely to be a factor in the political stability of the continent. It may provide a stabilising influence because it will deepen economic ties and reliance between countries within the region, which typically helps incentivise and build regional political stability.
However, it may also have a negative effect by deepening existing political problems or creating new ones. Issues have already materialised. For example, the BRI projects in Pakistan and Sri Lanka have caused India to raise concerns about the infringement of its sovereignty and security. Pakistan and India have had a long-standing tense political relationship that has included military intervention in disputed areas along shared borders. Similarly, Sri Lanka lies on the global East–West shipping route that carries two-thirds of the world’s oil and half of all container shipments. India sees China’s BRI projects in these countries as threatening its trade opportunities and military influence. This includes claiming that the ports in Pakistan and Sri Lanka are actually designed to be used as beachheads for Chinese military operations.
The BRI has also affected domestic political stability. For example, a number of investments have been made in Sri Lanka as part of the BRI. These include a $1.5 billion project to build ‘Port City Colombo’ but the $1.4 billion first phase suffered from stopping and starting under different presidencies. China also provided $1.5 billion to develop the southern port of Hambantota and $209 million to construct an international airport that has been underutilised. The ports and the airport suffered significant losses and the government was unable to service the related debts. Because of these difficulties, both ports were subject to the granting of 99-year leases and debt for equity swaps with the Chinese firms in exchange for debt forgiveness. This transference of assets to Chinese firms has proved politically controversial and led to civil unrest.
Such issues provide a taste of the potential negative political implications of the BRI in Asia, including affecting the delicate balance of political power in the region and national sovereignty and independence.
4.7 Conclusions and implications for development partnersThe BRI is in Asia for the long term and China seems intent on making it a success. The assessment in this section suggests that the BRI offers both risks and opportunities for China and for the Asian region, with different effects in different countries. It has the potential to deepen and stabilise economic and political ties and to allow fuller engagement in the economic prosperity of the region for a greater range of countries. Development partners will need to be aware of the opportunities and risks and support Asian countries in managing these.
37
The focus of policy should be to contribute to ensuring stability and positive outcomes in developing Asia. This includes managing the risks resulting from the BRI, including those related to debt sustainability, environment and governance standards, financial stability and political relations.
Examples of possible policy areas that would assist in this include institutional capacity-building in relation to debt sustainability, developing a greater focus on the financial stability risks that may result from cross-border lending, institutionalising the RMB and assessing the implications for the Chinese domestic financial system and engaging with China’s institutions to participate in meeting international standards for regulation, governance and the environment. Development partners are well placed to discuss debt sustainability given their long experience on these issues.
In addition, managing the political risks of the BRI and of the growing role of China in the region’s aid architecture may require new institutional forums for political engagement at both regional and global levels. One possibility for donors would be to make the case for a high-level aid conference in Asia. The participants of this conference should include traditional donors, non-traditional donors (including China and India), multinational banks and recipients. The conference could focus on knowledge transfers and financial instruments to support Asia’s orderly middle-income transition. It could be described as a stock-taking and knowledge-sharing event around good practices in programmes and projects. It would also ideally be held at a neutral venue in a developing Asian country rather than in a donor country. Furthermore, rather than a formal declaration or pledging event around financing specific initiatives,
participants could at the end of the event generate a simple conference statement emphasising the need for greater knowledge-sharing and aid cooperation for Asia’s middle-income transition.
The AIIB is supporting projects under the BRI, but it was not created exclusively for this initiative. It is possible that the AIIB will become an important implementing agency for BRI projects in the future. A second implication for donors relates to encouraging expansion of the co-financing of specific development projects in Asia between the AIIB, the World Bank and ADB. The AIIB and other development banks are currently co-financing a handful of development projects. This would help create trust and confidence among the different development banks, build the capacity of the AIIB, increase the spread of good international standards (on procurement practices, the environment and resettlement) and reduce the risks of financing large-scale infrastructure projects.
Finally, there is also a need to address the issue that the BRI excludes certain countries. In particular, the BRI is not currently engaging with Pacific island countries and lacks plans to do so for the foreseeable future. Accordingly, a third way forward for donors could be to continue to support the infrastructure and other development needs of Pacific countries. Examining how to provide such countries with an opportunity to participate in economic growth in the region should be a key policy goal, including through traditional aid, such as grants and concessional financing, in these countries. Rather than undertaking purely national projects, donors should increasingly emphasise sub-regional projects among Pacific countries and between Pacific countries and Southeast Asia.
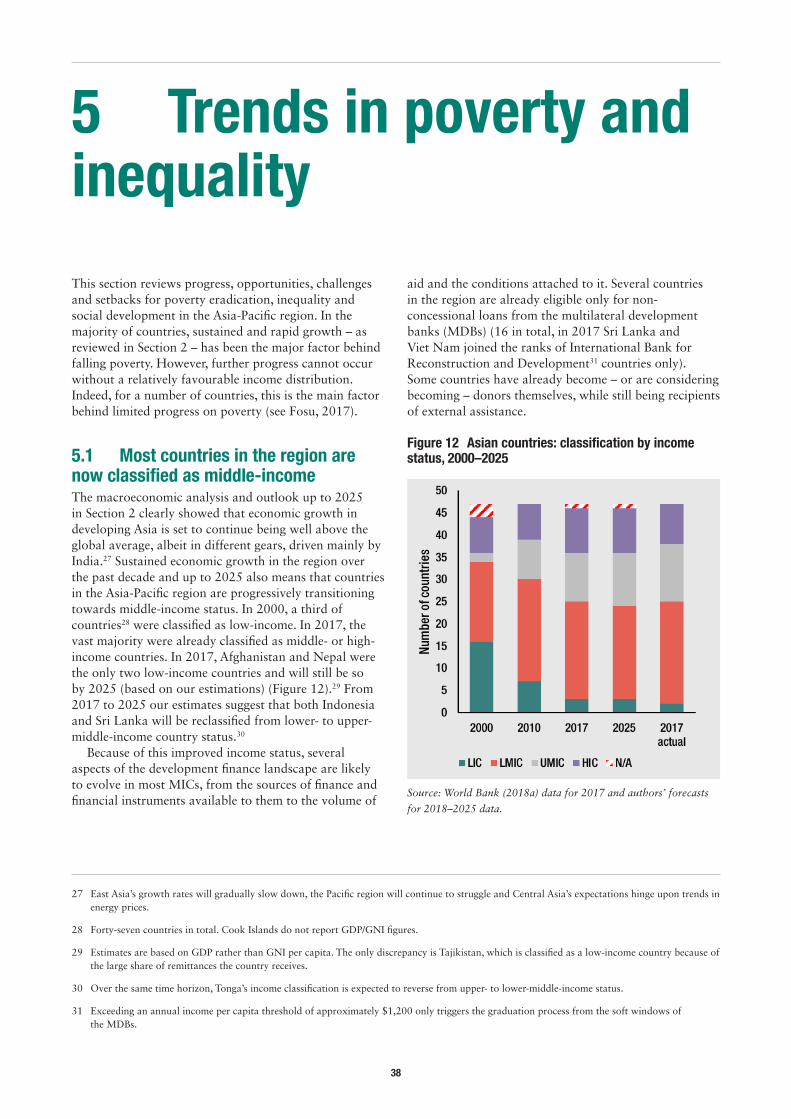
38
5 Trends in poverty and inequality
27 East Asia’s growth rates will gradually slow down, the Pacific region will continue to struggle and Central Asia’s expectations hinge upon trends in energy prices.
28 Forty-seven countries in total. Cook Islands do not report GDP/GNI figures.
29 Estimates are based on GDP rather than GNI per capita. The only discrepancy is Tajikistan, which is classified as a low-income country because of the large share of remittances the country receives.
30 Over the same time horizon, Tonga’s income classification is expected to reverse from upper- to lower-middle-income status.
31 Exceeding an annual income per capita threshold of approximately $1,200 only triggers the graduation process from the soft windows of the MDBs.
This section reviews progress, opportunities, challenges and setbacks for poverty eradication, inequality and social development in the Asia-Pacific region. In the majority of countries, sustained and rapid growth – as reviewed in Section 2 – has been the major factor behind falling poverty. However, further progress cannot occur without a relatively favourable income distribution. Indeed, for a number of countries, this is the main factor behind limited progress on poverty (see Fosu, 2017).
5.1 Most countries in the region are now classified as middle-income The macroeconomic analysis and outlook up to 2025 in Section 2 clearly showed that economic growth in developing Asia is set to continue being well above the global average, albeit in different gears, driven mainly by India.27 Sustained economic growth in the region over the past decade and up to 2025 also means that countries in the Asia-Pacific region are progressively transitioning towards middle-income status. In 2000, a third of countries28 were classified as low-income. In 2017, the vast majority were already classified as middle- or high-income countries. In 2017, Afghanistan and Nepal were the only two low-income countries and will still be so by 2025 (based on our estimations) (Figure 12).29 From 2017 to 2025 our estimates suggest that both Indonesia and Sri Lanka will be reclassified from lower- to upper-middle-income country status.30
Because of this improved income status, several aspects of the development finance landscape are likely to evolve in most MICs, from the sources of finance and financial instruments available to them to the volume of
aid and the conditions attached to it. Several countries in the region are already eligible only for non-concessional loans from the multilateral development banks (MDBs) (16 in total, in 2017 Sri Lanka and Viet Nam joined the ranks of International Bank for Reconstruction and Development31 countries only). Some countries have already become – or are considering becoming – donors themselves, while still being recipients of external assistance.
Figure 12 Asian countries: classification by income status, 2000–2025
Source: World Bank (2018a) data for 2017 and authors’ forecasts
for 2018–2025 data.
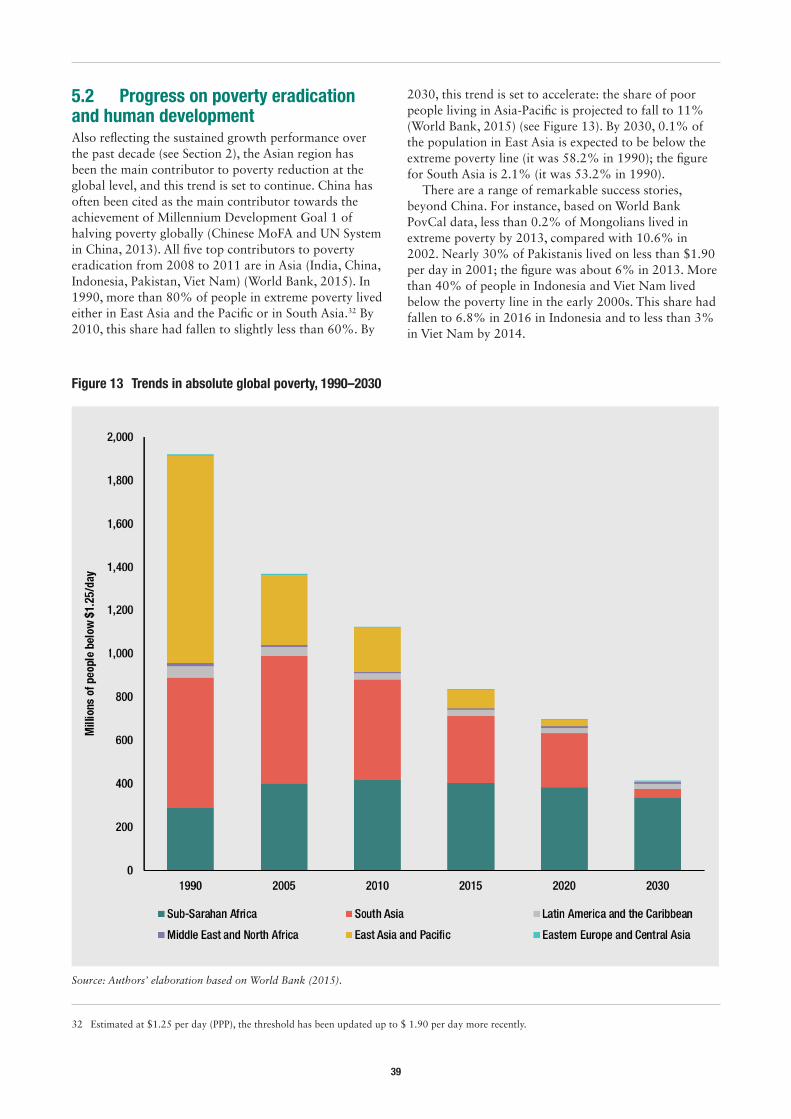
39
5.2 Progress on poverty eradication and human developmentAlso reflecting the sustained growth performance over the past decade (see Section 2), the Asian region has been the main contributor to poverty reduction at the global level, and this trend is set to continue. China has often been cited as the main contributor towards the achievement of Millennium Development Goal 1 of halving poverty globally (Chinese MoFA and UN System in China, 2013). All five top contributors to poverty eradication from 2008 to 2011 are in Asia (India, China, Indonesia, Pakistan, Viet Nam) (World Bank, 2015). In 1990, more than 80% of people in extreme poverty lived either in East Asia and the Pacific or in South Asia.32 By 2010, this share had fallen to slightly less than 60%. By
32 Estimated at $1.25 per day (PPP), the threshold has been updated up to $ 1.90 per day more recently.
2030, this trend is set to accelerate: the share of poor people living in Asia-Pacific is projected to fall to 11% (World Bank, 2015) (see Figure 13). By 2030, 0.1% of the population in East Asia is expected to be below the extreme poverty line (it was 58.2% in 1990); the figure for South Asia is 2.1% (it was 53.2% in 1990).
There are a range of remarkable success stories, beyond China. For instance, based on World Bank PovCal data, less than 0.2% of Mongolians lived in extreme poverty by 2013, compared with 10.6% in 2002. Nearly 30% of Pakistanis lived on less than $1.90 per day in 2001; the figure was about 6% in 2013. More than 40% of people in Indonesia and Viet Nam lived below the poverty line in the early 2000s. This share had fallen to 6.8% in 2016 in Indonesia and to less than 3% in Viet Nam by 2014.
Figure 13 Trends in absolute global poverty, 1990–2030
Source: Authors’ elaboration based on World Bank (2015).
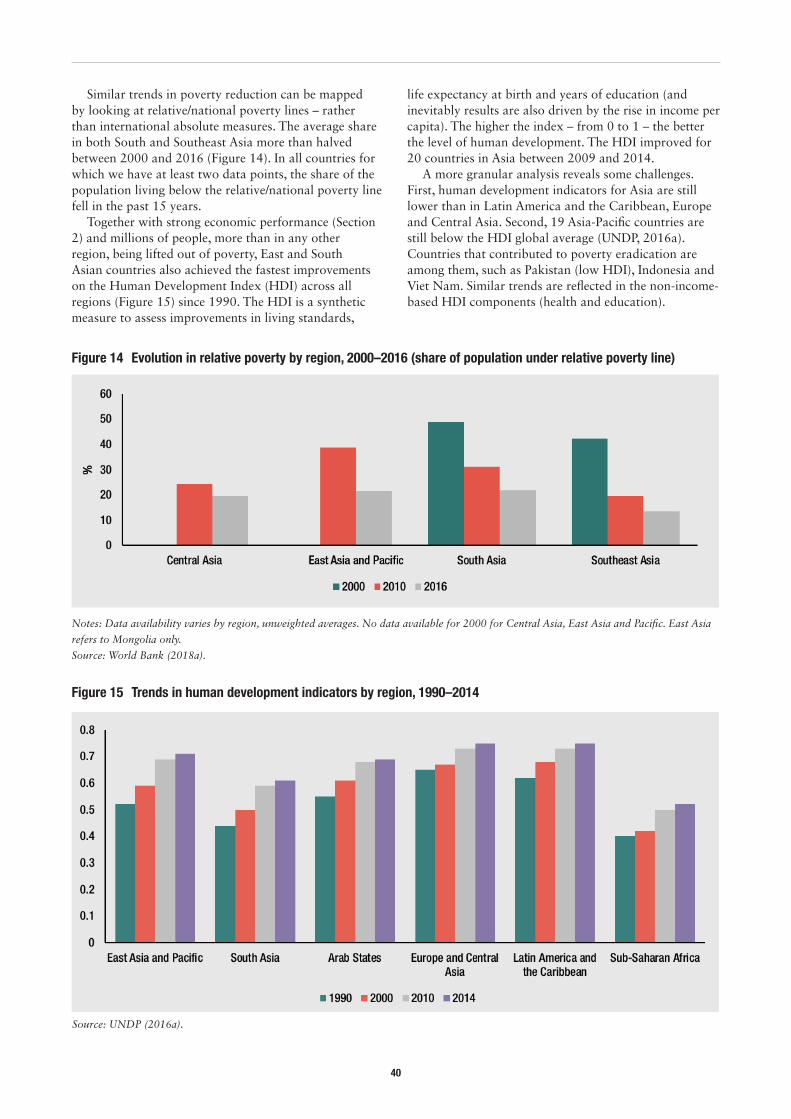
40
Similar trends in poverty reduction can be mapped by looking at relative/national poverty lines – rather than international absolute measures. The average share in both South and Southeast Asia more than halved between 2000 and 2016 (Figure 14). In all countries for which we have at least two data points, the share of the population living below the relative/national poverty line fell in the past 15 years.
Together with strong economic performance (Section 2) and millions of people, more than in any other region, being lifted out of poverty, East and South Asian countries also achieved the fastest improvements on the Human Development Index (HDI) across all regions (Figure 15) since 1990. The HDI is a synthetic measure to assess improvements in living standards,
life expectancy at birth and years of education (and inevitably results are also driven by the rise in income per capita). The higher the index – from 0 to 1 – the better the level of human development. The HDI improved for 20 countries in Asia between 2009 and 2014.
A more granular analysis reveals some challenges. First, human development indicators for Asia are still lower than in Latin America and the Caribbean, Europe and Central Asia. Second, 19 Asia-Pacific countries are still below the HDI global average (UNDP, 2016a). Countries that contributed to poverty eradication are among them, such as Pakistan (low HDI), Indonesia and Viet Nam. Similar trends are reflected in the non-income-based HDI components (health and education).
Figure 14 Evolution in relative poverty by region, 2000–2016 (share of population under relative poverty line)
Notes: Data availability varies by region, unweighted averages. No data available for 2000 for Central Asia, East Asia and Pacific. East Asia
refers to Mongolia only.
Source: World Bank (2018a).
Figure 15 Trends in human development indicators by region, 1990–2014
Source: UNDP (2016a).
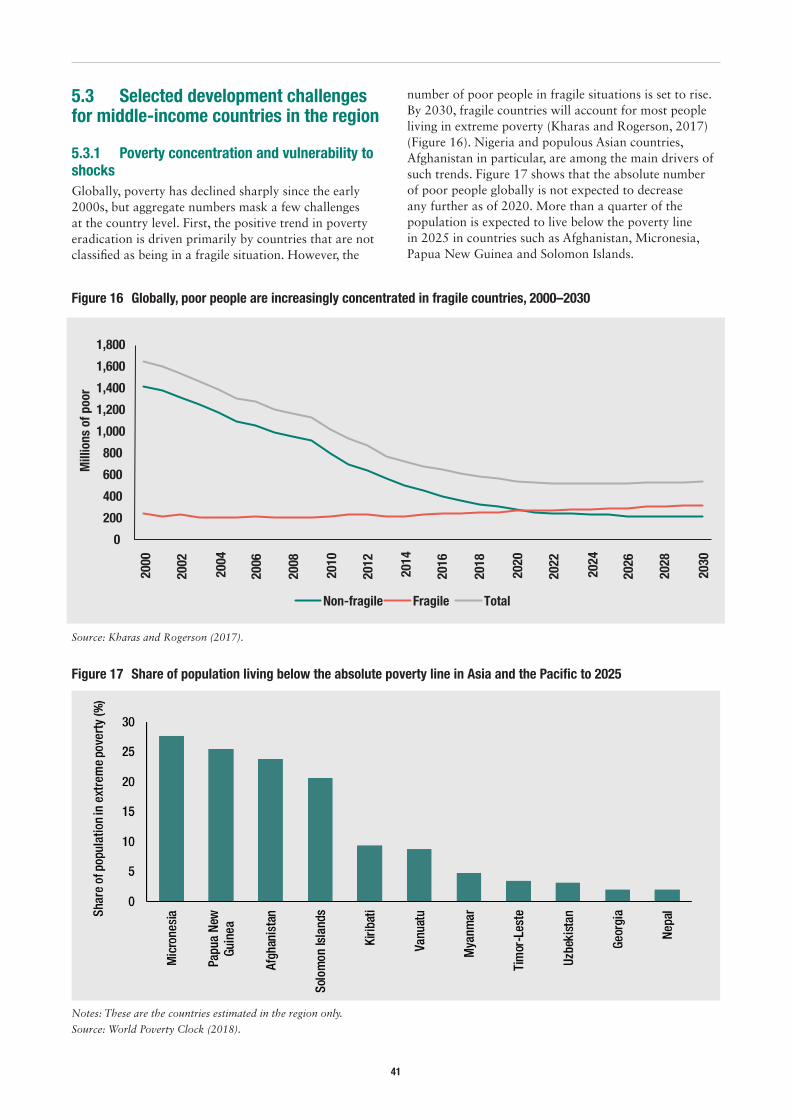
41
5.3 Selected development challenges for middle-income countries in the region
5.3.1 Poverty concentration and vulnerability to shocks Globally, poverty has declined sharply since the early 2000s, but aggregate numbers mask a few challenges at the country level. First, the positive trend in poverty eradication is driven primarily by countries that are not classified as being in a fragile situation. However, the
number of poor people in fragile situations is set to rise. By 2030, fragile countries will account for most people living in extreme poverty (Kharas and Rogerson, 2017) (Figure 16). Nigeria and populous Asian countries, Afghanistan in particular, are among the main drivers of such trends. Figure 17 shows that the absolute number of poor people globally is not expected to decrease any further as of 2020. More than a quarter of the population is expected to live below the poverty line in 2025 in countries such as Afghanistan, Micronesia, Papua New Guinea and Solomon Islands.
0
200
400
600
800
1,000
1,200
1,400
1,600
1,800
2000
2002
2004
2006
2008
2010
2012
2014
2016
2018
2020
2022
2024
2026
2028
2030
Non-fragile Fragile Total
Mill
ions
of p
oor
Figure 16 Globally, poor people are increasingly concentrated in fragile countries, 2000–2030
Source: Kharas and Rogerson (2017).
Figure 17 Share of population living below the absolute poverty line in Asia and the Pacific to 2025
Notes: These are the countries estimated in the region only.
Source: World Poverty Clock (2018).
42
Second, China and other Asian countries are often seen as the main contributors towards the achievement of Millennium Development Goal 1 of halving poverty globally. However, these countries are still home to the largest share of poor people, notably India (30% of poor people in 2011), followed by China (8%) (World Bank, 2014).
Third, lifting people out of extreme poverty does not tell us to what extent these people are vulnerable to falling back into poverty. Birdsall et al. (2014) define ‘strugglers’ as those who live with a daily income of between $4 and $10. They are not classified either as poor (below $1.90/day) or as middle class (above $10/day): they are highly vulnerable to falling back into poverty. This share is rising and this trend is expected to continue until 2030. Based on the latest poverty figures available, in several Asian MICs (China, India, Indonesia, the Philippines, Sri Lanka), the share of the population classified as ‘strugglers’ far exceeds that of the middle class. Furthermore, in India and Indonesia, more than 90% of the population will be either poor or ‘strugglers’ by 2030 (Birdsall, 2018).
Fourth, the overall declining share of people living below the national poverty line within regions masks very diverse snapshots across countries within South Asia and Southeast Asia. Afghanistan, Bangladesh, Cambodia, Myanmar, Pakistan and the Philippines are all well above their respective regional averages when it comes to people living below the national/relative poverty line.
5.3.2 Growing within-country inequality and fragile situations Within-country inequality is on the rise in most economies in the region. According to Zhuang et al. (2014), the Gini coefficient of per capita expenditure has worsened in 12 economies, including large populous ones such as China, India and Indonesia. The IMF (2016) reaches similar results: between 1990 and 2013, income inequality increased in nine countries in the region (Bangladesh, Cambodia, China, India, Indonesia, Lao PDR, Papua New Guinea, Sri Lanka and Viet Nam). However, income inequality fell over the same time span, albeit only marginally, in Fiji, Malaysia, Mongolia, Nepal, the Philippines and Thailand. More up-to-date analyses, let alone forecasts, are hampered by the paucity of time series data.
While most countries in fragile situations are in sub-Saharan Africa, several of them are on the Asian continent, associated either with long-term conflict or with natural/geographic conditions.33 Some of them are small island economies, notably Kiribati, Marshall Islands, Micronesia, Solomon Islands and Tuvalu. Others are still in active conflict (Afghanistan; this list also includes Myanmar and Papua New Guinea). The World Bank list of fragile situations does not capture whether
33 Based on the World Bank Harmonized List of Fragile Situations FY 2018: http://www.worldbank.org/en/topic/fragilityconflictviolence/brief/harmonized-list-of-fragile-situations
a country has ongoing conflicts at the subnational level. Prominent subnational conflicts in Asia include Mindanao in the Philippines, southern Thailand, Aceh and Papua in Indonesia, Assam and Kashmir in India, northern Sri Lanka and Baluchistan in Pakistan.
5.4 Conclusions and implications for development partners Sustained and strong economic performance in several countries in the region has meant that millions of people have been lifted out of extreme poverty over the past decade, and that many more people have been able to access and benefit from social services, notably education and health facilities.
Despite strong progress on human development, poverty reduction and access to finance, however, most countries in the region are still vulnerable to falling back into poverty and to setbacks on human development indicators. These countries will need to consolidate their achievements and avoid such setbacks. While lifting millions of people out of poverty, growth has not always been pro-poor, and has exacerbated income inequality within countries. Institutions in Afghanistan, Myanmar and Papua New Guinea are still weak: these countries have been for a long time on the World Bank list of fragile situations, together with small island economies in the Pacific (Kiribati, Marshall Islands, Micronesia, Solomon Islands and Tuvalu).
Against these trends in poverty and inequality in MICs, it is worth noting the challenges for financing development in MICs, at least when it comes to public domestic and external finance. Several countries in the region will find themselves stuck in the ‘missing middle’ of development finance, when total resources available fall as the country moves from low- until well into middle-income status (Kharas et al., 2014) (see Figures A2:3 and A2:4 in Appendix 2 for the data analysis). As they grow, MICs are likely to see a reduction in funding from bilateral donors, especially grant financing. When countries start to emerge from very-low-income status, their growth is constrained as domestic revenue mobilisation fails to expand fast enough to compensate for the fall in concessional assistance.
This has clear implications for development partners. Addressing vulnerability to income shocks, persistent pockets of poverty and rising within-country inequality poses several challenges for countries and their development partners. First of all, traditional development aid tends – or is expected – to prioritise those countries most in ‘need’ – usually either low-income countries or those with a large share of poverty.
Second, sectoral interventions should address the root causes of income vulnerability, or should mitigate its risks. Among these, policies and programmes could

43
include: tax policy design and strengthening the tax administration to expand the tax base and tax revenues; expanding and creating the right incentives for social safety nets; and support to sustainable economic growth, job creation and macroeconomic management to ensure greater opportunities and stability for investors.
Third, adapting sectoral interventions and objectives also requires a more sophisticated set of instruments and modalities, beyond traditional grant financing. This entails strengthening capacity-building/knowledge
transfer, risk mitigation instruments and guarantees for development.
Finally, several countries in Asia still face conflict at the sub-regional level but little finance has been directed to address these situations of fragility. Development actors can contribute to conflict prevention by ensuring interventions target needs in subnational regions, understanding how interventions can be targeted to ensure they support inclusion and cohesion and bridging centre–periphery divides.
44
6 Identifying successful and vulnerable Asian countries
34 See Atkins et al. (2000), UNDP (2016a) and www.doingbusiness.org/rankings
This section brings together the analysis in Sections 2–5 and identifies successful countries and vulnerable countries in developing Asia in terms of economic development achievements. It uses data on prospects from Section 2 and combines these with country-specific estimates of vulnerability to trade, debt, income inequality, population and special national circumstances. Section 6.1 constructs a vulnerability score and ranks countries in the region while Section 6.2 discusses the findings.
6.1 The vulnerability scoreThere are several possible ways of depicting economic vulnerability in developing Asian economies. Comprehensive and resource-intensive exercises over multiple years include the Commonwealth Secretariat’s Vulnerability Index for Small States, the UN Development Programme (UNDP) HDI and the World Bank’s Doing Business rankings. We look at these later in the section.34 Each of these is useful depending on the purpose at hand. Our study has a more modest objective of synthesising information already analysed in this study in an attempt to highlight economic vulnerability in developing Asia during the middle-income transition. Further research can profitably refine the data and methodology used here.
Previous sections presented information on the economic outlook, population dependency and the three mega-trends – GVCs, the BRI and poverty and inequality. While there is more clarity on the regional economic implications, the combined implications of these issues for individual countries are less clear. An improved understanding of the national-level impacts of these issues is essential to be able to design more effective economic policies and donor strategies in the future.
A practical way forward is to distil quantitative indicators from previous sections to construct a simple qualitative analytical tool to rank countries according to economic vulnerability. Alternative vulnerability
indices are presented in Table 5. Table 6 shows the data and scoring system for 31 developing Asian economies for which the requisite data were available. Figure 18 presents a comprehensive overall ‘vulnerability score’ for each country and its details are shown as Index 4 in Table 5. We exclude Pacific Island countries owing to data limitations.
The score for each country reflects the combined impact of the factors discussed previously:
1. The economic outlook, measured by expected GDP per capita in PPP$ in 2025.
2. Trade capability, measured by participation in world GVC trade in 2016.
3. Debt sustainability in 2023 factoring in the BRI pipeline of projects.
4. Social development, measured by income inequality (most recent estimates of the Gini coefficient). The poverty headcount ratio at $1.90 per day in 2025 is used as an alternative measure.
5. Population dependency ratio in 2025 (i.e. the ratio of population aged 0–14 years and 65+ years per 100 population aged 15–64 years). This reflects the combined effect of a demographic dividend from a youthful population and a demographic burden imposed by an ageing population.
6. Any special vulnerabilities linked to national circumstances (such as being a fragile and conflict-affected state, a small island state or a landlocked state).
For each of these factors, we set thresholds to define countries that are either ‘highly vulnerable’, ‘vulnerable’ or ‘robust’ (and given a score of 2, 1 or 0 respectively):
• For GDP per capita, the thresholds adopted are less than $1,200 for highly vulnerable and $1,201–4,500 for vulnerable. A score above $4,501 is regarded as robust.
• GVC participation is set based on the share of world intermediate goods exports, with a threshold of
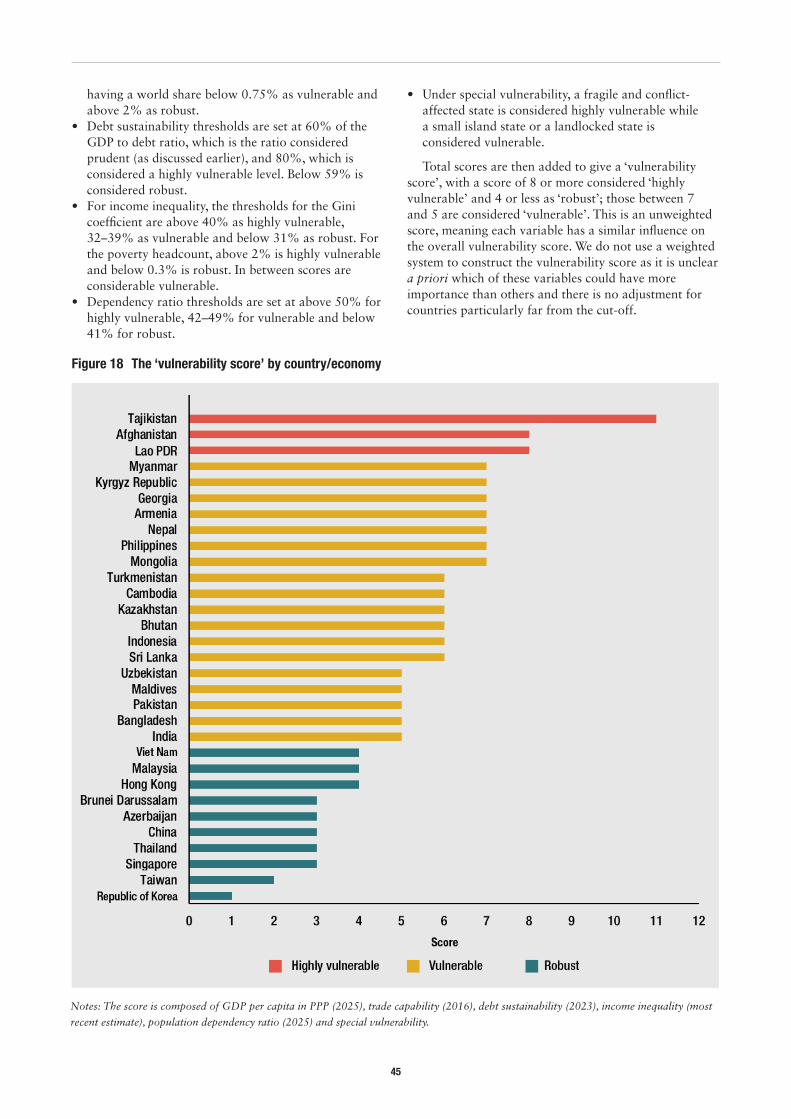
45
having a world share below 0.75% as vulnerable and above 2% as robust.
• Debt sustainability thresholds are set at 60% of the GDP to debt ratio, which is the ratio considered prudent (as discussed earlier), and 80%, which is considered a highly vulnerable level. Below 59% is considered robust.
• For income inequality, the thresholds for the Gini coefficient are above 40% as highly vulnerable, 32–39% as vulnerable and below 31% as robust. For the poverty headcount, above 2% is highly vulnerable and below 0.3% is robust. In between scores are considerable vulnerable.
• Dependency ratio thresholds are set at above 50% for highly vulnerable, 42–49% for vulnerable and below 41% for robust.
• Under special vulnerability, a fragile and conflict-affected state is considered highly vulnerable while a small island state or a landlocked state is considered vulnerable.
Total scores are then added to give a ‘vulnerability score’, with a score of 8 or more considered ‘highly vulnerable’ and 4 or less as ‘robust’; those between 7 and 5 are considered ‘vulnerable’. This is an unweighted score, meaning each variable has a similar influence on the overall vulnerability score. We do not use a weighted system to construct the vulnerability score as it is unclear a priori which of these variables could have more importance than others and there is no adjustment for countries particularly far from the cut-off.
Figure 18 The ‘vulnerability score’ by country/economy
Notes: The score is composed of GDP per capita in PPP (2025), trade capability (2016), debt sustainability (2023), income inequality (most
recent estimate), population dependency ratio (2025) and special vulnerability.
46
6.2 Discussion of the findingsAs Figure 18 shows, these ratings score three countries in the region as ‘highly vulnerable’. These are Afghanistan, Lao PDR and Tajikistan. The reasons for these vulnerabilities vary, but it is notable that they include two fragile and conflict-affected states – Afghanistan and Tajikistan – where political economy and governance issues are compounded by other economic factors, including high debt ratios and limited participation in GVCs. Lao PDR is a landlocked economy facing high trade costs, among other development challenges.
A total of 18 countries – the bulk of the region – fall into the ‘vulnerable’ category. They include several small island and landlocked states (e.g. Kyrgyz Republic) whose economic opportunities are limited by high trade costs, as well as Myanmar, as a fragile or conflict-affected economy. In our view, these issues seem particularly severe in Myanmar and Kyrgyz Republic, which are at the higher end of the vulnerability scale and risk falling into the highly vulnerable category.
The vulnerable category also include some countries with high levels of debt, some of which relates to the BRI (including Armenia, Bhutan, Georgia, Indonesia, Mongolia and Pakistan). Often, these high levels of debt combine with low participation in GVCs, making the possibilities for growth-led management of debt sustainability levels more difficult.
Furthermore, several countries are ‘vulnerable’ because they start at low levels of GDP per capita and high levels of income inequality, which, in combination with low or lower anticipated growth to 2025, including through a lack of GVC participation, means they are effectively unable to grow their economies sufficiently to tackle inequality. In some cases (e.g. Cambodia, Indonesia, Pakistan and the Philippines), an ageing population compounds these issues, has raised dependency ratios and has increased the burden on the shrinking working population and social services.
Finally, 10 countries are rated as ‘robust’ in the sense that they are considered success stories in terms of economic development. These include major economies in East Asia, notably China, Hong Kong, Republic of Korea, Singapore, Taiwan and Thailand. There are some countries at the lower end of the robust scale, such as Azerbaijan and Malaysia, that could slip into the vulnerable category.
Table 5 indicates that the countries identified as robust, vulnerable and highly vulnerable vary somewhat according to the composition of the indices used. For
35 The Spearman rho coefficient between our Vulnerability Index 4 and the UNDP HDI is -0.59. This shows a fairly moderate relationship as it is above 0.500. It is negative, which means that as the HDI score increases, the country score decreases. A higher HDI score would increase the tendency of a country to be robust. The Spearman rho coefficient between our Vulnerability Index 4 and the Ease of Doing Business score is -0.54. It is negative, which means that as ease of doing business increases, the country score decreases. A higher Ease of Doing Business score indicates a better business environment, which increases the tendency of being a robust country.
instance, using the poverty headcount ratio in Index 1 results in some countries, such as Bangladesh, Sri Lanka and Turkmenistan, being scored as robust – but these are widely regarded as vulnerable. India also scores as robust, whereas Myanmar becomes highly vulnerable. It is possible that the poverty data may be problematic and income inequality was substituted as a proxy measure to reflect social development. Furthermore, excluding the dependency ratio, as in Index 2, produces only one highly vulnerable country. Excluding income inequality in Index 3 results in four highly vulnerable countries, but India becomes robust. Accordingly, sensitivity analysis suggests that the comprehensive index in Figure 18 presents a more useful view of vulnerability in developing Asia than do partial indices.
Table 7 compares the country ratings in our vulnerability index in Figure 18 (or Vulnerability Index 4 in Table 5) with UNDP’s HDI and the World Bank’s Ease of Doing Business Distance to Frontier score. The UNDP HDI looks at levels of human development across countries and is made up of three indicators: life expectancy, education and income inequality. The World Bank’s Doing Business measure captures the market-friendly nature of the environment for the private sector across countries. It is calculated by considering the following 10 indicators: starting a business, dealing with construction permits, getting electricity, registering property, getting credit, protecting minority investors, paying taxes, trading across borders, enforcing contracts and resolving insolvency.
There is a reasonable correlation between our vulnerability indicator and those of UNDP and the World Bank.35 This suggests that mapping different dimensions of economic vulnerability points to broadly similar outcomes at country level. All three indicators produce a small number of highly vulnerable countries, a large number of vulnerable countries and a few robust economies. Hong Kong, Malaysia, Republic of Korea, Singapore and Taiwan turn out to be robust under all three indicators. At the other extreme, Afghanistan is highly vulnerable under all three indicators. As the different indicators capture different aspects of vulnerability, however, some differences are observed in the headings under which some countries fall. China, which is robust under our indicator, is classed as vulnerable under the HDI and World Bank indicators. Furthermore, Sri Lanka is classed as robust under the HDI but vulnerable under our indicator and the World Bank indicator.
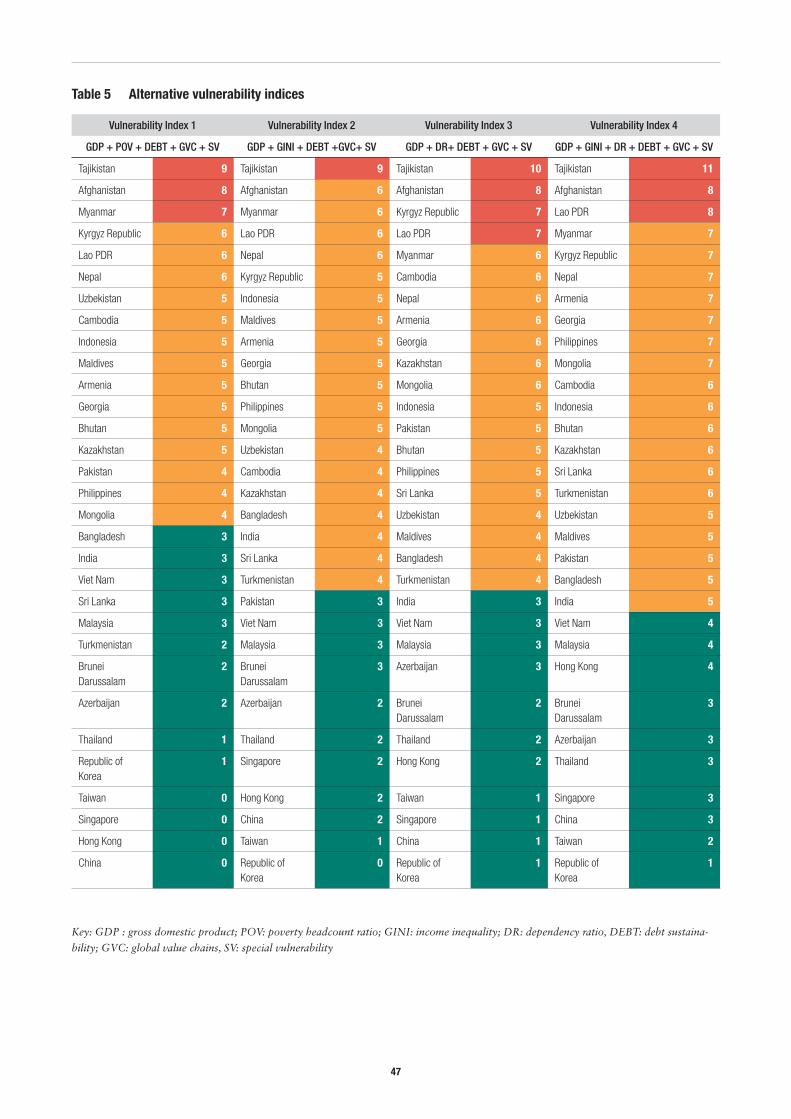
47
Vulnerability Index 1 Vulnerability Index 2 Vulnerability Index 3 Vulnerability Index 4
GDP + POV + DEBT + GVC + SV GDP + GINI + DEBT +GVC+ SV GDP + DR+ DEBT + GVC + SV GDP + GINI + DR + DEBT + GVC + SV
Tajikistan 9 Tajikistan 9 Tajikistan 10 Tajikistan 11
Afghanistan 8 Afghanistan 6 Afghanistan 8 Afghanistan 8
Myanmar 7 Myanmar 6 Kyrgyz Republic 7 Lao PDR 8
Kyrgyz Republic 6 Lao PDR 6 Lao PDR 7 Myanmar 7
Lao PDR 6 Nepal 6 Myanmar 6 Kyrgyz Republic 7
Nepal 6 Kyrgyz Republic 5 Cambodia 6 Nepal 7
Uzbekistan 5 Indonesia 5 Nepal 6 Armenia 7
Cambodia 5 Maldives 5 Armenia 6 Georgia 7
Indonesia 5 Armenia 5 Georgia 6 Philippines 7
Maldives 5 Georgia 5 Kazakhstan 6 Mongolia 7
Armenia 5 Bhutan 5 Mongolia 6 Cambodia 6
Georgia 5 Philippines 5 Indonesia 5 Indonesia 6
Bhutan 5 Mongolia 5 Pakistan 5 Bhutan 6
Kazakhstan 5 Uzbekistan 4 Bhutan 5 Kazakhstan 6
Pakistan 4 Cambodia 4 Philippines 5 Sri Lanka 6
Philippines 4 Kazakhstan 4 Sri Lanka 5 Turkmenistan 6
Mongolia 4 Bangladesh 4 Uzbekistan 4 Uzbekistan 5
Bangladesh 3 India 4 Maldives 4 Maldives 5
India 3 Sri Lanka 4 Bangladesh 4 Pakistan 5
Viet Nam 3 Turkmenistan 4 Turkmenistan 4 Bangladesh 5
Sri Lanka 3 Pakistan 3 India 3 India 5
Malaysia 3 Viet Nam 3 Viet Nam 3 Viet Nam 4
Turkmenistan 2 Malaysia 3 Malaysia 3 Malaysia 4
Brunei Darussalam
2 Brunei Darussalam
3 Azerbaijan 3 Hong Kong 4
Azerbaijan 2 Azerbaijan 2 Brunei Darussalam
2 Brunei Darussalam
3
Thailand 1 Thailand 2 Thailand 2 Azerbaijan 3
Republic of Korea
1 Singapore 2 Hong Kong 2 Thailand 3
Taiwan 0 Hong Kong 2 Taiwan 1 Singapore 3
Singapore 0 China 2 Singapore 1 China 3
Hong Kong 0 Taiwan 1 China 1 Taiwan 2
China 0 Republic of Korea
0 Republic of Korea
1 Republic of Korea
1
Table 5 Alternative vulnerability indices
Key: GDP : gross domestic product; POV: poverty headcount ratio; GINI: income inequality; DR: dependency ratio, DEBT: debt sustaina-
bility; GVC: global value chains, SV: special vulnerability
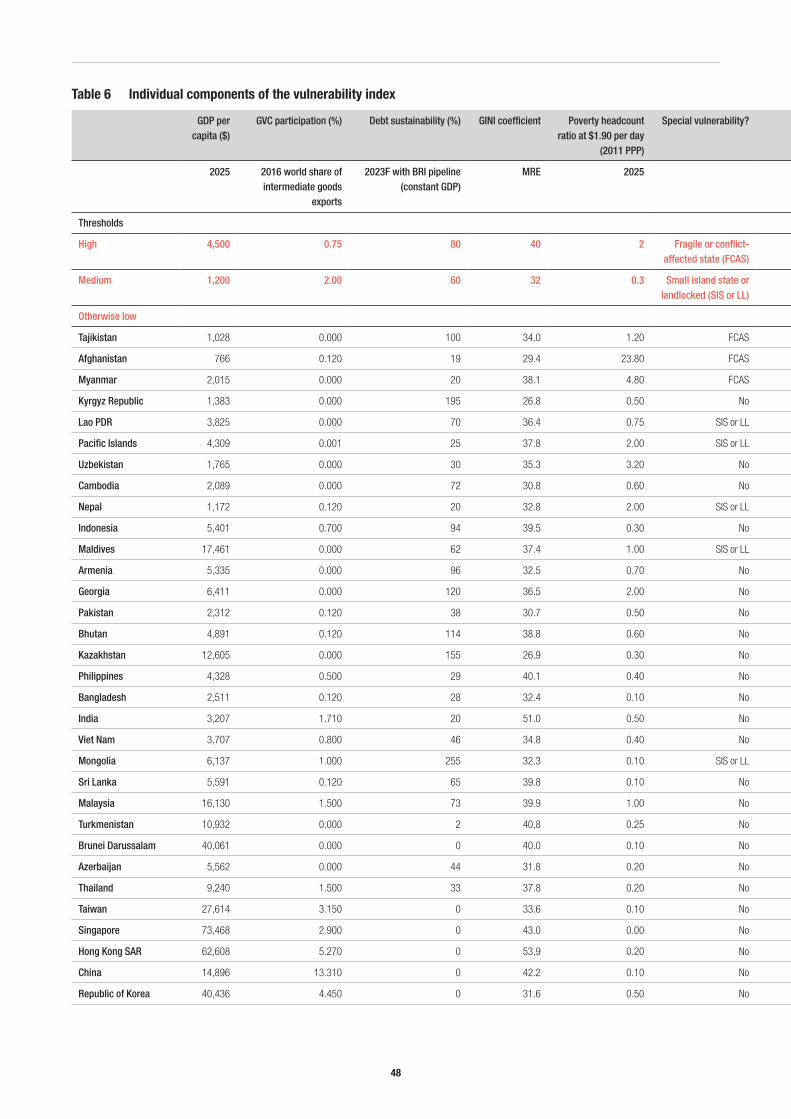
48
GDP per capita ($)
GVC participation (%) Debt sustainability (%) GINI coefficient Poverty headcount ratio at $1.90 per day
(2011 PPP)
Special vulnerability? Dependency ratio
Vulnerability score
2025 2016 world share of intermediate goods
exports
2023F with BRI pipeline (constant GDP)
MRE 2025 2025 GDP per capita
Poverty Post-BRI debt GVC participation
Dependency ratio
Special vulnerability
GINI coefficient
Total score Classification
Thresholds
High 4,500 0.75 80 40 2 Fragile or conflict-affected state (FCAS)
50 2 2 2 2 2 2 2 8 Highly vulnerable
Medium 1,200 2.00 60 32 0.3 Small island state or landlocked (SIS or LL)
42 1 1 1 1 1 1 1 5 Vulnerable
Otherwise low 0 0 0 0 0 0 0 0 Robust
Tajikistan 1,028 0.000 100 34.0 1.20 FCAS 63.5 2 1 2 2 2 2 1 11 Highly vulnerable
Afghanistan 766 0.120 19 29.4 23.80 FCAS 68.8 2 2 0 2 2 2 0 8 Highly vulnerable
Myanmar 2,015 0.000 20 38.1 4.80 FCAS 45.2 1 2 0 2 1 2 1 7 Vulnerable
Kyrgyz Republic 1,383 0.000 195 26.8 0.50 No 60.5 1 1 2 2 2 0 0 7 Vulnerable
Lao PDR 3,825 0.000 70 36.4 0.75 SIS or LL 52.1 1 1 1 2 2 1 1 8 Highly vulnerable
Pacific Islands 4,309 0.001 25 37.8 2.00 SIS or LL 64.5 1 1 0 2 2 1 1 7 Vulnerable
Uzbekistan 1,765 0.000 30 35.3 3.20 No 48.5 1 2 0 2 1 0 1 5 Vulnerable
Cambodia 2,089 0.000 72 30.8 0.60 No 53.5 1 1 1 2 2 0 0 6 Vulnerable
Nepal 1,172 0.120 20 32.8 2.00 SIS or LL 48.6 2 1 0 2 1 1 1 7 Vulnerable
Indonesia 5,401 0.700 94 39.5 0.30 No 46.9 0 1 2 2 1 0 1 6 Vulnerable
Maldives 17,461 0.000 62 37.4 1.00 SIS or LL 37.9 0 1 1 2 0 1 1 5 Vulnerable
Armenia 5,335 0.000 96 32.5 0.70 No 50.8 0 1 2 2 2 0 1 7 Vulnerable
Georgia 6,411 0.000 120 36.5 2.00 No 57.1 0 1 2 2 2 0 1 7 Vulnerable
Pakistan 2,312 0.120 38 30.7 0.50 No 60.5 1 1 0 2 2 0 0 5 Vulnerable
Bhutan 4,891 0.120 114 38.8 0.60 No 42.5 0 1 2 2 1 0 1 6 Vulnerable
Kazakhstan 12,605 0.000 155 26.9 0.30 No 57.3 0 1 2 2 2 0 0 6 Vulnerable
Philippines 4,328 0.500 29 40.1 0.40 No 55.6 1 1 0 2 2 0 2 7 Vulnerable
Bangladesh 2,511 0.120 28 32.4 0.10 No 44.4 1 0 0 2 1 0 1 5 Vulnerable
India 3,207 1.710 20 51.0 0.50 No 47.6 1 1 0 1 1 0 2 5 Vulnerable
Viet Nam 3,707 0.800 46 34.8 0.40 No 47.6 1 1 0 1 1 0 1 4 Robust
Mongolia 6,137 1.000 255 32.3 0.10 SIS or LL 53.6 0 0 2 1 2 1 1 7 Vulnerable
Sri Lanka 5,591 0.120 65 39.8 0.10 No 52.6 0 0 1 2 2 0 1 6 Vulnerable
Malaysia 16,130 1.500 73 39.9 1.00 No 45.5 0 1 1 1 1 0 1 4 Robust
Turkmenistan 10,932 0.000 2 40.8 0.25 No 56.4 0 0 0 2 2 0 2 6 Vulnerable
Brunei Darussalam 40,061 0.000 0 40.0 0.10 No 40.4 0 0 0 2 0 0 1 3 Robust
Azerbaijan 5,562 0.000 44 31.8 0.20 No 46.1 0 0 0 2 1 0 0 3 Robust
Thailand 9,240 1.500 33 37.8 0.20 No 44.9 0 0 0 1 1 0 1 3 Robust
Taiwan 27,614 3.150 0 33.6 0.10 No 48.3 0 0 0 0 1 0 1 2 Robust
Singapore 73,468 2.900 0 43.0 0.00 No 48.3 0 0 0 0 1 0 2 3 Robust
Hong Kong SAR 62,608 5.270 0 53.9 0.20 No 55.9 0 0 0 0 2 0 2 4 Robust
China 14,896 13.310 0 42.2 0.10 No 44.5 0 0 0 0 1 0 2 3 Robust
Republic of Korea 40,436 4.450 0 31.6 0.50 No 49 0 1 0 0 1 0 0 1 Robust
Table 6 Individual components of the vulnerability index
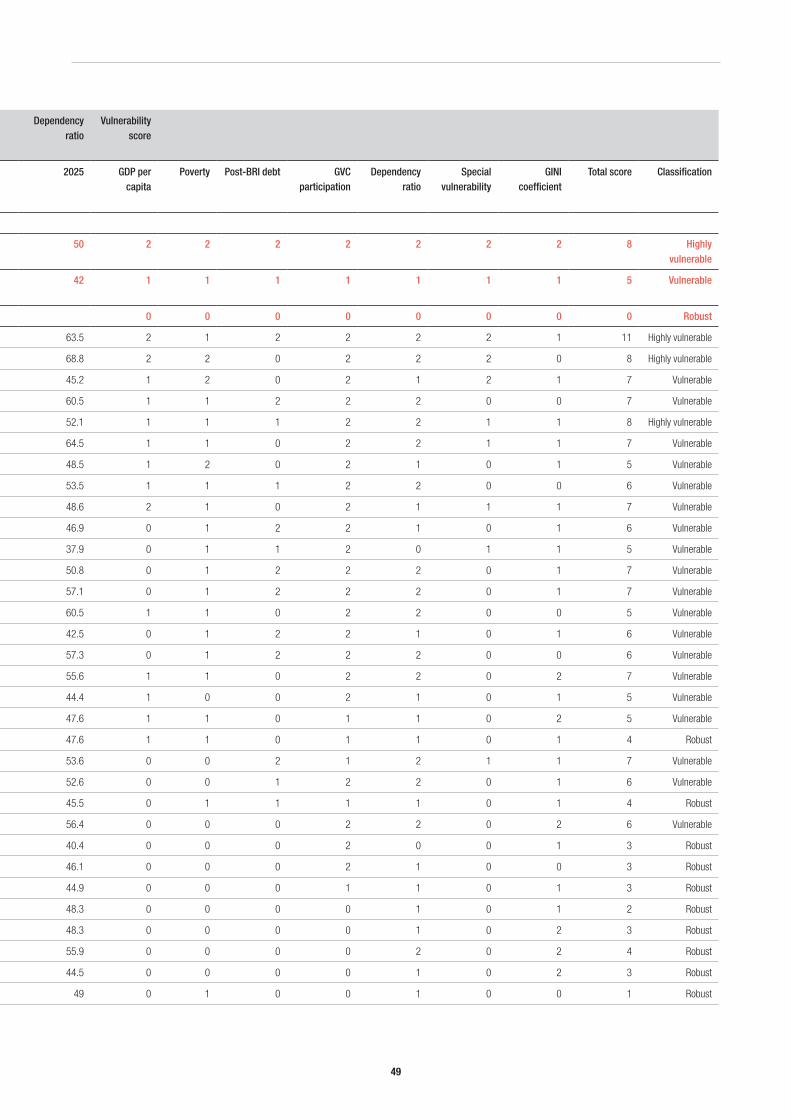
49
GDP per capita ($)
GVC participation (%) Debt sustainability (%) GINI coefficient Poverty headcount ratio at $1.90 per day
(2011 PPP)
Special vulnerability? Dependency ratio
Vulnerability score
2025 2016 world share of intermediate goods
exports
2023F with BRI pipeline (constant GDP)
MRE 2025 2025 GDP per capita
Poverty Post-BRI debt GVC participation
Dependency ratio
Special vulnerability
GINI coefficient
Total score Classification
Thresholds
High 4,500 0.75 80 40 2 Fragile or conflict-affected state (FCAS)
50 2 2 2 2 2 2 2 8 Highly vulnerable
Medium 1,200 2.00 60 32 0.3 Small island state or landlocked (SIS or LL)
42 1 1 1 1 1 1 1 5 Vulnerable
Otherwise low 0 0 0 0 0 0 0 0 Robust
Tajikistan 1,028 0.000 100 34.0 1.20 FCAS 63.5 2 1 2 2 2 2 1 11 Highly vulnerable
Afghanistan 766 0.120 19 29.4 23.80 FCAS 68.8 2 2 0 2 2 2 0 8 Highly vulnerable
Myanmar 2,015 0.000 20 38.1 4.80 FCAS 45.2 1 2 0 2 1 2 1 7 Vulnerable
Kyrgyz Republic 1,383 0.000 195 26.8 0.50 No 60.5 1 1 2 2 2 0 0 7 Vulnerable
Lao PDR 3,825 0.000 70 36.4 0.75 SIS or LL 52.1 1 1 1 2 2 1 1 8 Highly vulnerable
Pacific Islands 4,309 0.001 25 37.8 2.00 SIS or LL 64.5 1 1 0 2 2 1 1 7 Vulnerable
Uzbekistan 1,765 0.000 30 35.3 3.20 No 48.5 1 2 0 2 1 0 1 5 Vulnerable
Cambodia 2,089 0.000 72 30.8 0.60 No 53.5 1 1 1 2 2 0 0 6 Vulnerable
Nepal 1,172 0.120 20 32.8 2.00 SIS or LL 48.6 2 1 0 2 1 1 1 7 Vulnerable
Indonesia 5,401 0.700 94 39.5 0.30 No 46.9 0 1 2 2 1 0 1 6 Vulnerable
Maldives 17,461 0.000 62 37.4 1.00 SIS or LL 37.9 0 1 1 2 0 1 1 5 Vulnerable
Armenia 5,335 0.000 96 32.5 0.70 No 50.8 0 1 2 2 2 0 1 7 Vulnerable
Georgia 6,411 0.000 120 36.5 2.00 No 57.1 0 1 2 2 2 0 1 7 Vulnerable
Pakistan 2,312 0.120 38 30.7 0.50 No 60.5 1 1 0 2 2 0 0 5 Vulnerable
Bhutan 4,891 0.120 114 38.8 0.60 No 42.5 0 1 2 2 1 0 1 6 Vulnerable
Kazakhstan 12,605 0.000 155 26.9 0.30 No 57.3 0 1 2 2 2 0 0 6 Vulnerable
Philippines 4,328 0.500 29 40.1 0.40 No 55.6 1 1 0 2 2 0 2 7 Vulnerable
Bangladesh 2,511 0.120 28 32.4 0.10 No 44.4 1 0 0 2 1 0 1 5 Vulnerable
India 3,207 1.710 20 51.0 0.50 No 47.6 1 1 0 1 1 0 2 5 Vulnerable
Viet Nam 3,707 0.800 46 34.8 0.40 No 47.6 1 1 0 1 1 0 1 4 Robust
Mongolia 6,137 1.000 255 32.3 0.10 SIS or LL 53.6 0 0 2 1 2 1 1 7 Vulnerable
Sri Lanka 5,591 0.120 65 39.8 0.10 No 52.6 0 0 1 2 2 0 1 6 Vulnerable
Malaysia 16,130 1.500 73 39.9 1.00 No 45.5 0 1 1 1 1 0 1 4 Robust
Turkmenistan 10,932 0.000 2 40.8 0.25 No 56.4 0 0 0 2 2 0 2 6 Vulnerable
Brunei Darussalam 40,061 0.000 0 40.0 0.10 No 40.4 0 0 0 2 0 0 1 3 Robust
Azerbaijan 5,562 0.000 44 31.8 0.20 No 46.1 0 0 0 2 1 0 0 3 Robust
Thailand 9,240 1.500 33 37.8 0.20 No 44.9 0 0 0 1 1 0 1 3 Robust
Taiwan 27,614 3.150 0 33.6 0.10 No 48.3 0 0 0 0 1 0 1 2 Robust
Singapore 73,468 2.900 0 43.0 0.00 No 48.3 0 0 0 0 1 0 2 3 Robust
Hong Kong SAR 62,608 5.270 0 53.9 0.20 No 55.9 0 0 0 0 2 0 2 4 Robust
China 14,896 13.310 0 42.2 0.10 No 44.5 0 0 0 0 1 0 2 3 Robust
Republic of Korea 40,436 4.450 0 31.6 0.50 No 49 0 1 0 0 1 0 0 1 Robust
Table 6 Individual components of the vulnerability index
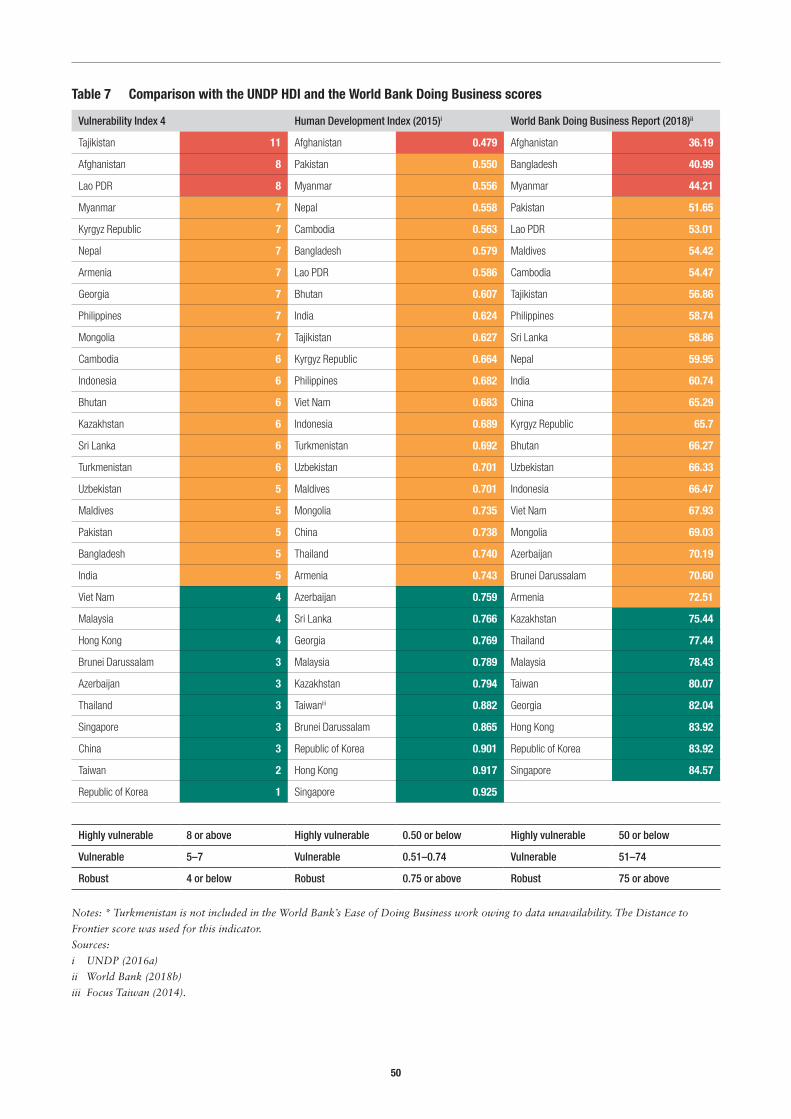
50
Vulnerability Index 4 Human Development Index (2015)i World Bank Doing Business Report (2018)ii
Tajikistan 11 Afghanistan 0.479 Afghanistan 36.19
Afghanistan 8 Pakistan 0.550 Bangladesh 40.99
Lao PDR 8 Myanmar 0.556 Myanmar 44.21
Myanmar 7 Nepal 0.558 Pakistan 51.65
Kyrgyz Republic 7 Cambodia 0.563 Lao PDR 53.01
Nepal 7 Bangladesh 0.579 Maldives 54.42
Armenia 7 Lao PDR 0.586 Cambodia 54.47
Georgia 7 Bhutan 0.607 Tajikistan 56.86
Philippines 7 India 0.624 Philippines 58.74
Mongolia 7 Tajikistan 0.627 Sri Lanka 58.86
Cambodia 6 Kyrgyz Republic 0.664 Nepal 59.95
Indonesia 6 Philippines 0.682 India 60.74
Bhutan 6 Viet Nam 0.683 China 65.29
Kazakhstan 6 Indonesia 0.689 Kyrgyz Republic 65.7
Sri Lanka 6 Turkmenistan 0.692 Bhutan 66.27
Turkmenistan 6 Uzbekistan 0.701 Uzbekistan 66.33
Uzbekistan 5 Maldives 0.701 Indonesia 66.47
Maldives 5 Mongolia 0.735 Viet Nam 67.93
Pakistan 5 China 0.738 Mongolia 69.03
Bangladesh 5 Thailand 0.740 Azerbaijan 70.19
India 5 Armenia 0.743 Brunei Darussalam 70.60
Viet Nam 4 Azerbaijan 0.759 Armenia 72.51
Malaysia 4 Sri Lanka 0.766 Kazakhstan 75.44
Hong Kong 4 Georgia 0.769 Thailand 77.44
Brunei Darussalam 3 Malaysia 0.789 Malaysia 78.43
Azerbaijan 3 Kazakhstan 0.794 Taiwan 80.07
Thailand 3 Taiwaniii 0.882 Georgia 82.04
Singapore 3 Brunei Darussalam 0.865 Hong Kong 83.92
China 3 Republic of Korea 0.901 Republic of Korea 83.92
Taiwan 2 Hong Kong 0.917 Singapore 84.57
Republic of Korea 1 Singapore 0.925
Highly vulnerable 8 or above Highly vulnerable 0.50 or below Highly vulnerable 50 or below
Vulnerable 5–7 Vulnerable 0.51–0.74 Vulnerable 51–74
Robust 4 or below Robust 0.75 or above Robust 75 or above
Table 7 Comparison with the UNDP HDI and the World Bank Doing Business scores
Notes: * Turkmenistan is not included in the World Bank’s Ease of Doing Business work owing to data unavailability. The Distance to
Frontier score was used for this indicator.
Sources:
i UNDP (2016a)
ii World Bank (2018b)
iii Focus Taiwan (2014).
51
7 Conclusions: implications for development partners in the Asia region
All in all, Asian countries are likely to continue to perform well and markedly improve living standards in the period up to 2025. Several countries are expected to graduate from multilateral assistance, losing access to development assistance or being granted less favourable terms and conditions. Middle-income status is often considered a signal for a successful development trajectory, hence the rationale for bilateral and multilateral development partners to play a progressively smaller role (see Jalles d’Orey and Prizzon, forthcoming).
There are, however, two major qualifications to these general trends in Asia, justifying continued efforts from and engagement of development partners in the region. First, two countries (Afghanistan and Nepal) are still expected to be low-income countries. Second, MICs are exposed to different types of vulnerabilities. These range from a large share of people at risk of failing back into poverty to rising income inequality, from lack of a market-friendly business environment and sufficient firm capabilities to take part in GVCs to challenges in servicing debt – especially associated with the BRI if economic growth slows down.
While overall financial support is expected to decline, such scenarios will require development partners to tailor and adapt their instruments and modalities to address changing demands from partner countries (as discussed further in the Appendix 2). Development partners offer more than just aid grants to Asian countries and more than concessional finance – including targeted technical assistance where governments have low capacity and risk mitigation instruments to support private sector development. Development partners are also important trade and investment partners, which could help support transforming Asian countries.
This report has focused on three ‘mega-trends’, risks and opportunities that are likely to influence the course of the region’s economic development up to 2025, and specifically recently graduated MICs: (i) the performance of China-centred GVCs and implications for latecomers,
(ii) the likely impact of the BRI on economic, political and project risks and on debt sustainability and (iii) the persistence of pockets of poverty and vulnerability amid prosperity.
We have reviewed how development partners could help Asian countries address these challenges. Three of the options we have consider are as follows.
Support latecomers to join GVCs by building a market-friendly business environment.At the macro level, projects and programmes should aim to ensure flexible labour markets, liberalised FDI entry regulations, streamlined border procedures and efficient and reliable infrastructure, such as ports and energy provision. At the micro level, projects and programmes should support SMEs to participate in GVCs. For example, development partners can promote SME associations and incentivise competitive SMEs to form industrial clusters in sectors with a comparative advantage. Development partners can support access to finance from commercial banks, help reform collateral laws and promote financial literacy training for SMEs.
Help with macroeconomic management, especially of debt obligations, and help develop legal, regulatory and governance frameworks. Assistance should focus on countries where institutional capacity for macroeconomic and debt management is weak, that are largely exposed to BRI lending and dependent on high GDP growth rates to maintain debt at sustainable levels. Projects and programmes should concentrate on building institutional capacity for debt management, for ensuring financial stability and for mitigating risks that may result from cross-border lending and the internationalisation of the RMB. At
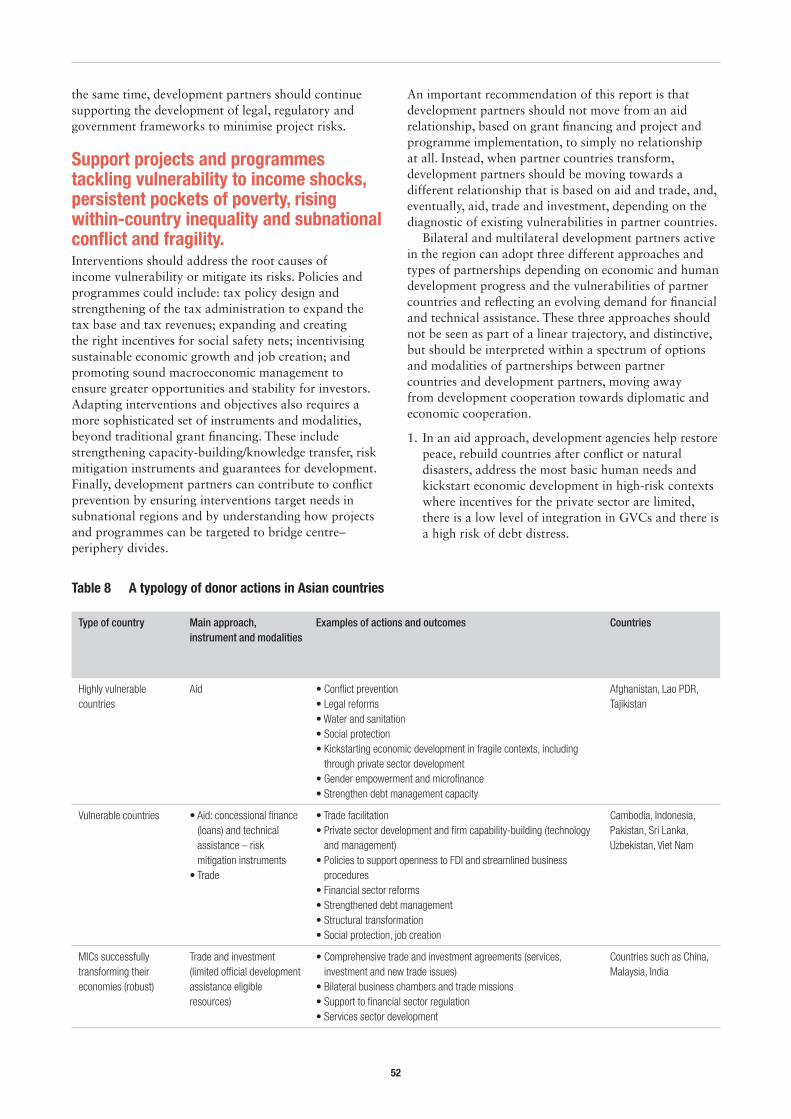
52
the same time, development partners should continue supporting the development of legal, regulatory and government frameworks to minimise project risks.
Support projects and programmes tackling vulnerability to income shocks, persistent pockets of poverty, rising within-country inequality and subnational conflict and fragility. Interventions should address the root causes of income vulnerability or mitigate its risks. Policies and programmes could include: tax policy design and strengthening of the tax administration to expand the tax base and tax revenues; expanding and creating the right incentives for social safety nets; incentivising sustainable economic growth and job creation; and promoting sound macroeconomic management to ensure greater opportunities and stability for investors. Adapting interventions and objectives also requires a more sophisticated set of instruments and modalities, beyond traditional grant financing. These include strengthening capacity-building/knowledge transfer, risk mitigation instruments and guarantees for development. Finally, development partners can contribute to conflict prevention by ensuring interventions target needs in subnational regions and by understanding how projects and programmes can be targeted to bridge centre–periphery divides.
An important recommendation of this report is that development partners should not move from an aid relationship, based on grant financing and project and programme implementation, to simply no relationship at all. Instead, when partner countries transform, development partners should be moving towards a different relationship that is based on aid and trade, and, eventually, aid, trade and investment, depending on the diagnostic of existing vulnerabilities in partner countries.
Bilateral and multilateral development partners active in the region can adopt three different approaches and types of partnerships depending on economic and human development progress and the vulnerabilities of partner countries and reflecting an evolving demand for financial and technical assistance. These three approaches should not be seen as part of a linear trajectory, and distinctive, but should be interpreted within a spectrum of options and modalities of partnerships between partner countries and development partners, moving away from development cooperation towards diplomatic and economic cooperation.
1. In an aid approach, development agencies help restore peace, rebuild countries after conflict or natural disasters, address the most basic human needs and kickstart economic development in high-risk contexts where incentives for the private sector are limited, there is a low level of integration in GVCs and there is a high risk of debt distress.
Type of country Main approach, instrument and modalities
Examples of actions and outcomes Countries
Highly vulnerable countries
Aid • Conflict prevention• Legal reforms• Water and sanitation• Social protection • Kickstarting economic development in fragile contexts, including
through private sector development • Gender empowerment and microfinance• Strengthen debt management capacity
Afghanistan, Lao PDR, Tajikistan
Vulnerable countries • Aid: concessional finance (loans) and technical assistance – risk mitigation instruments
• Trade
• Trade facilitation • Private sector development and firm capability-building (technology
and management)• Policies to support openness to FDI and streamlined business
procedures • Financial sector reforms• Strengthened debt management • Structural transformation • Social protection, job creation
Cambodia, Indonesia, Pakistan, Sri Lanka, Uzbekistan, Viet Nam
MICs successfully transforming their economies (robust)
Trade and investment (limited official development assistance eligible resources)
• Comprehensive trade and investment agreements (services, investment and new trade issues)
• Bilateral business chambers and trade missions• Support to financial sector regulation• Services sector development
Countries such as China, Malaysia, India
Table 8 A typology of donor actions in Asian countries
53
2. In a trade and aid approach, development agencies phase out aid grants and move towards loans on decreasingly concessional terms, as well as tailored technical assistance. Development agencies can help countries trade more, grow faster, raise domestic resources and reduce aid dependency, moving from development to economic diplomacy.
3. In a private investment, trade and aid approach, donors (using only very limited aid resources) are engaged in dialogue and foster trade and investment linkages.
Table 8 summarises appropriate actions for development partners depending on such strategies and the country context. It also provides some illustrative examples.
Working with vulnerable MICs (which have various financing options, as discussed in Appendix 2) and with MICs successfully transforming their economies would require using a broader set of instruments (equity, guarantees, possibly loans via national channels) than grants financing programmes enhancing economic
growth, for example. Such an approach would include using development finance institution equity and lending to support MICs beyond grant financing, including targeted technical assistance, guarantees and risk mitigation instruments. Offering insurance mechanisms and schemes could address the consequences of increased frequency, length and depth of crises and shocks. While several MICs are already in a position to finance their own national development plans for the most part, others are stuck in the ‘missing middle’ of development finance, where their tax ratios are rising but are still not enough to compensate for the fall in aid.
Development partners should continue their effort, projects and programmes in MICs, but the partnership needs to change gears. Development partners still have a role to play in helping MICs to consolidate their progress in human and economic development achieved so far and avoid setbacks, to mitigate financial risks that can have repercussions for the global economy and to enable partner countries to become trading partners in the global trade system.
54
Bibliography
Abiad, A., Lee, M., Pundit, M. and Ramayandi, A. (2016) ‘Moderating growth and structural change in the People’s Republic of China: implications for developing Asia and beyond’. Brief 53. Manila: ADB.
ADB – Asian Development Bank (2015) ‘ADB support to small Pacific Island countries’. Corporate Evaluation Study. Manila: ADB.
ADB (2017) ‘Asian Development Outlook 2017 update: sustaining development through public-private partnership’. Manila: ADB.
ADB (2018a) ‘Asian Development Outlook 2018 update: how technology affects jobs’. Manila: ADB.ADB (2018b) ‘Classification and graduation of developing member states’. Operational Manual – Policies and
Procedures, January. Manila: ADB.ADB and ADBI - ADB Institute (2014) ASEAN, the PRC and India: the great transformation. Manila and Tokyo: ADB
and ADBI. Amsden, A. (1989) Asia’s next giant: South Korea and late-industrialization. Oxford: Oxford University Press. Arudchelvan, M. and Wignaraja, G. (2016) ‘SME internationalization through global value chains and free trade
agreements: evidence from Malaysia’, in G. Wignaraja (ed.) Production networks and enterprises in East Asia: industry and firm-level analysis. Heidelberg and Tokyo: Springer.
Association of Chartered Certified Accountants (2017) ‘Benefits of the Modern Silk Road: the China–Pakistan Economic Corridor’. Joint publication of the Association of Chartered Certified Accountants and the Pakistan-China Institute.
Atkins, J. P., Mazzi, S. and Easter, C. (2000) ‘A Commonwealth Vulnerability Index for developing countries: the position of small states’. Commonwealth Economic Papers 40, London: Commonwealth Secretariat.
AT Kearney (2015) ‘2020 – seven growth economies: strategic issues assessment’. AT Kearney Global Policy and Business Council, August. (www.southeastasia.atkearney.com/innovation/asean-innovation)
Baldwin, R. and Gonzalez, J. V. (2014) ‘Supply-chain trade: a portrait of global patterns and several testable hypotheses’ The World Economy. DOI 10.111/twec.12189
Bardhan, P. (2010) Awakening giants feet of clay: assessing the economic rise of China and India. Princeton, NJ: Princeton University Press.
bdnews24.com (2018) ‘Bangladesh moves to revise minimum wage for garment workers’. 14 January. (https://bdnews24.com/business/2018/01/14/bangladesh-moves-to-revise-minimum-wage-for-garment-workers)
Bhattacharya, A., Kharas, H., Plant, M. and Prizzon, A. (2018) ‘The new global agenda and the future of the multilateral development bank system’. Washington, DC, and London: Brookings, CGD and ODI.
Birdsall, N. (2018) ‘Strugglers: this century’s new development challenge’. Keynote Speech, Australian Aid Conference, Canberra, 13 February.
Birdsall, N., Lustig, N. and Meyer, C. J. (2014) ‘The strugglers: the new poor in Latin America?’ World Development 60: 132–146.
Bracho, G. (2015) ‘In search of a narrative for Southern providers: the challenge of the emerging economies to the development cooperation agenda’. Bonn: GIZ.
Brautigam, D. (2013) ‘Rubbery numbers for Chinese aid to Africa’. (http://www.chinaafricarealstory.com/2013/04/rubbery-numbers-on-chinese-aid.html).
Buelow, D., Gish, D. and Timberlake, J. (2013) ‘Manufacturing beyond China. New options, new opportunities, new risks’. Deloitte. (https://www2.deloitte.com/insights/us/en/focus/business-trends/2013/manufacturing-beyond-china.html)
Cai, P. (2017) ‘Understanding China’s Belt and Road Initiative’. Sydney: Lowy Institute. Calabrese, L., Gelb, S. and Hou, J. (2017) What drives Chinese outward manufacturing investment? A review of
enabling factors in Asia and Africa. SET Paper. London: ODI. Chaturvedi, S. and Mulakala, A. (2016) India’s approach to development cooperation. Abingdon: Routledge. Chinese MoFA (Ministry of Foreign Affairs) and UN System in China (2013) ‘China’s progress towards the
Millennium Development Goals’. (www.cn.undp.org/content/dam/china/docs/Publications/UNDP-CH-MDGs2013_english.pdf)
Constantinescu, C, Mattoo, A. and Ruta, M. (2015) The global trade slowdown: cyclical or structural? Working Paper WP/15/6. Washington, DC: IMF.
Constantinescu, C., Mattoo, A. and Ruta, M. (2016) Global trade watch: trade developments in 2015. Washington, DC: World Bank.
55
Dabla-Norris, E., Ho, G., Kochhar, K., Kyobe, A. and Tchaidze, R. (2013) ‘Anchoring growth: the importance of productivity-enhancing reforms in emerging market and developing economies’. Staff Discussion Note SDN13/08, December. Washington, DC: IMF.
De Backer, K. and Flaig, D. (2017) ‘The future of global value chains: business as usual or “a new normal”?’ Science, Technology and Innovation Policy Paper 41, July. Paris: OECD.
Deloitte (2016) 2016 Global manufacturing competitiveness index. London: Deloitte Touche Tohmatsu Limited. (www2.deloitte.com/global/en/pages/manufacturing/articles/global-manufacturing-competitiveness-index.html)
Donaldson, B. (2018) ‘Myanmar approves 33% wage hike for garment workers’ Sourcing Journal. 9 January. (https://sourcingjournalonline.com/myanmar-minimum-wage-increase)
Dowling, M. and Wignaraja, G. (2006) Central Asia’s economy: mapping future prospects to 2015. Silk Road Paper Series. Washington, DC, and Baltimore, MD: Central Asia-Caucasus Institute, Silk Road Studies Program, and Johns Hopkins University: SAIS.
EC – European Commission (2009) The world in 2025: rising Asia and socio-ecological transition. Brussels: EC Directorate-General for Research.
Engen, L. and Prizzon, A. (2018) A guide to multilateral development banks. ODI Report. London: ODI. fDi Markets (2016) ‘fDi Markets database’. London: fDi Markets (www.fdimarkets.com)Focus Taiwan (2014) ‘Taiwan ranks 21st in world human development index’. 18 September. (http://focustaiwan.tw/
news/asoc/201409180039.aspx)Fosu, A. (2017) ‘Growth, inequality, and poverty reduction in developing countries: recent global evidence’ Research in
Economics 71(2): 306–336.Greenhill, R. (2013) The age of choice for development finance: Cambodia in the new aid landscape. ODI Report.
London: ODI.Greenhill, R. and Mustapha, S. (2016) An age of choice for development finance: the case of Laos. ODI Report.
London: ODI.Gulrajani, N. and Swiss, L. (2017) Why do countries become donors? Assessing the drivers and implications of donor
proliferation. ODI Report. London: ODI.Hong, G. H., Lee, J., Liao, W. and Seniviratne, D. (2016) ‘China and Asia in global trade slowdown’. Working Paper
WP/16/105. Washington, DC: IMF.Hurley, J., Morris, S. and Portelance, G. (2018) Examine the debt implications of the Belt and Road Initiative from a
policy perspective. Washington, DC: CGD.IMF – International Monetary Fund (2016) ‘Regional economic outlook: Asia and Pacific –May’. Washington, DC:
IMF. IMF (2017) ‘World economic outlook update’. Washington, DC: IMF. IMF (2018a) ‘World economic outlook update’. Washington, DC: IMF. IMF (2018b) ‘World Economic Outlook database’. Washington, DC: IMF. (www.imf.org)Jalles d’Orey, M. A. and Prizzon, A. (forthcoming) How do donors decide and manage the transition away from aid?
An analysis of donors’ approaches. ODI Report. London: ODI.Kharas, H. and Rogerson, A. (2012) Horizon 2025: creative destruction in the aid industry. ODI Report. London:
ODI. Kharas, H. and Rogerson , A. (2017) Global development trends and challenges: Horizon 2025 revisited. ODI Report.
London: ODI.Kharas, H., Prizzon, A. and Rogerson, A. (2014) Financing the post-2015 Sustainable Development Goals: a rough
road map. ODI Report. London: ODI.Kimura, F. (2016) ‘Production networks in East Asia’ in G. Wignaraja (ed.) Production networks and enterprises in
East Asia: industry and firm-level analysis. Heidelberg and Tokyo: Springer. Kiyota, K., Oikawa, K. and Yoshioka, K. (2017) ‘The global value chains and the competitiveness of Asian countries’
Asian Economic Papers 16(3): 257–281. Kohli, H., Sharma, A. and Sood, A. (2011) ‘Introduction’ in H. Kohli, A. Sharma and A. Sood (eds) Asia 2050:
realising the Asian century. New Delhi: Sage Publications. Lall, S. (1990) Building industrial competitiveness in developing countries. Paris: OECD. Lall, S. (1994) ‘The East Asian miracle: does the bell toll for industrial strategy?’ World Development 22(4): 645–654. Mawdsley, E. (2012) From recipients to donors: the emerging powers and the changing development landscape.
London: Zed.OECD – Organisation for Economic Co-operation and Development (2014) The future of the DAC list of ODA
recipients. Paris: OECD.OECD (2016) ‘OECD FDI Regulatory Restrictiveness Index 2016’. Paris: OECD.Stat. (http://stats.oecd.org/Index.
aspx?DatasetCode=FDI_FLOW_INDUSTRY)OECD (2018a) ‘Country programmable aid’. OECD stats. (www.oecd.org/dac/aid-architecture/cpa.htm)
56
OECD (2018b) ‘Aid at a glance’. (https://public.tableau.com/views/AidAtAGlance/DACmembers?:embed=y&:display_ count=no?&:showVizHome=no#1)
PECC – Pacific Economic Cooperation Council (2017) State of the region, 2017-2018. Singapore: PECC International Secretariat.
Prizzon, A. (2016) ‘Graduation from ADB regular assistance: a critical analysis and policy option’. Paper prepared for the ADB Strategy and Policy Department.
Prizzon, A. and Rogerson, A. (2017) Moving away from aid: the case of Indonesia. ODI Report. London: ODI.Prizzon, A., Greenhill, R. and Mustapha, S. (2016) An age of choice for development finance: evidence from country
case studies. ODI Report. London: ODI.Prizzon, A., Humphrey, C., Kaul, I., Kodera, K., McKechnie, A. and Rogerson, A. (2017) ‘Six recommendations for
reforming multilateral development banks – an essay series’. London: ODI. PwC (2017a) The long view: how will the global economic order change by 2050. London: PwC. PwC – PricewaterhouseCoopers (2017b) ‘Repaving the ancient silk routes: realising opportunities along the belt and
road’. London: PwC. Schmaljohann, M. and Prizzon, A. (2015) An age of choice: Fiji and Vanuatu in the new aid landscape. Research
Report. London: ODI.Schmaljohann, M. and Prizzon, A. (2016) An age of choice for development finance: the case of Viet Nam. ODI
Report. London: ODI.Shanghai Stock Exchange (2017) ‘The Belt and Road Initiative: reshaping the global value chain’. Shanghai: Shanghai
Stock Exchange.Stiglitz, J .E. (2001) ‘From miracle to crisis to recovery: lessons from four decades of East Asian experience’, in J. E.
Stiglitz and S. Yusuf (eds) Rethinking the East Asian miracle. New York: Oxford University Press. Strange, A. M., Parks, B. C., Tierney, M. J., Fuchs, A., Dreher, A. and Ramachandran, V. (2013) ‘China’s development
finance to Africa: a media-based approach to data collection’. Working Paper 323. Washington, DC: CGD.te Velde, D.W., Tyson, J. and Steele, A. (2015) Regional infrastructure in Sub-Saharan Africa and South Asia:
unblocking constraints and enabling effective policy intervention. Topic Guide. London: Evidence on Demand. The Asia Foundation (2014a) Emerging Asian approaches to development cooperation. San Francisco, CA: The Asia
Foundation.The Asia Foundation (2014b) The changing aid landscape: the rise of non-DAC providers. San Francisco, CA: The
Asia Foundation. Tyson, J. (forthcoming) ‘Private financing of infrastructure in developing countries: five challenges, five solutions’.
London: ODI.The Conference Board (2018a) ‘International comparisons of hourly compensation costs in manufacturing: summary
tables’. (www.conference-board.org/ilcprogram/index.cfm?id=38269)The Conference Board (2018b) ‘Total Economy Database: summary tables’. (www.conference-board.org/data/
economydatabase/)UNCTAD – UN Conference on Trade and Development (2017) Information economy report 2017: digitalisation, trade
and development. Geneva: UNCTAD.UNCTAD (2018) World economic situation and prospects 2018: statistical annex. Geneva: UNCTAD. (http://unctad.
org/en/Pages/DITC/Trade-Analysis/TAB-World-Economic-Situation-and-Prospects.aspx)UNDESA – UN Department of Economic and Social Affairs (2017) World population prospects: the 2017 revision.
UNDESA Population Division’ (https://esa.un.org/unpd/wpp/DataQuery)UNDESA (2018) ‘UN Comtrade database’. New York, NY: UN Statistics Division. (http://comtrade.un.org/data/)UNDP – UN Development Programme (2016a) Human Development Report 2016: human development for everyone.
New York: UNDP. UNDP (2016b) Asia-Pacific Human Development Report, shaping the future: how changing demographics can power
human development. New York: UNDP.UNESCAP – UN Economic Commission for Asia and the Pacific (2017) ‘Economic and social survey of Asia and the
Pacific 2017: governance and fiscal management’. Bangkok: UNESCAP. Werner International (2014) ‘2014 hourly labour cost’. (www.werner-newtwist.com/en/newsl-vol-011/index.htm)Wignaraja, G. (2012) ‘Commercial policy and experience in the giants: China and India’ in M. E. Kreinin and M. G.
Plummer (eds) The Oxford handbook of commercial policy. Oxford: Oxford University Press. Wignaraja, G. (2015) ‘Factors affecting entry into supply chain trade: an analysis of firms in Southeast Asia’ Asia and
the Pacific Policy Studies 2(3): 623–642. Wignaraja, G. (ed.) (2016) Production networks and enterprises in East Asia: industry and firm-level analysis.
Heidelberg and Tokyo: Springer. Wignaraja, G., Mariasingham, M., Zhuang, J. and Duma-Cabauatan, M. (2017) ‘Changing patterns of trade and
global value chains in postcrisis Asia’. Brief 76, Manila: ADB.
57
Winters, L. A. and Yusuf, S. (2007) ‘Introduction: dancing with the giants’ in L. A. Winters and S. Yusuf (eds) Dancing with the giants: China, India and the global economy. Washington, DC, and Singapore: World Bank and Institute of Policy Studies.
World Bank (1993) East Asia miracle: economic growth and public policy. Washington, DC: World Bank.World Bank (2014) Prosperity for all: ending extreme poverty. Spring Meetings. Washington, DC: World Bank.World Bank (2015) Global monitoring report 2014/2015. Washington, DC: World Bank. World Bank (2018a) ‘Global economic prospects, January 2018’. Washington, DC: World Bank. World Bank (2018b) ‘Doing Business 2018: Reforming to Create Jobs’. Washington, DC: World Bank. World Economic Forum (2018) ‘Executive opinion survey’ in The Global Competitiveness Report 2017–2018. Geneva:
World Economic Forum. (www.weforum.org/reports/the-global-competitiveness-report-2017-2018)World Bank (2018c) ‘World Development Indicators database’. Washington, DC: World Bank. (https://datacatalog.
worldbank.org/dataset/world-development-indicators)World Bank (2018d) ‘Global Economic Prospects database’. Washington, DC: World Bank. (https://datacatalog.
worldbank.org/dataset/global-economic-prospects)World Poverty Clock (2018) (http://worldpoverty.io/)WTO – World Trade Organization (2017) ‘WTO upgrades forecast for 2017 as trade rebounds strongly’. Press Release
800. Geneva: WTO. WTO (2018) ‘Integrated Trade Intelligence Portal’. Geneva: WTO. (https://www.wto.org/english/res_e/statis_e/itip_e.htm)WTO and IDE-JETRO – Institute of Developing Economies-Japan External Trade Organization (2011) Trade patterns
and global value chains in East Asia: from trade in goods to trade in tasks. Geneva: WTO and IDE-JETRO. Zhuang, J., Kanbur, R. and Rhee, C. (2014) Rising inequality in Asia and policy implications. Working Paper 463.
Tokyo: ADBI.
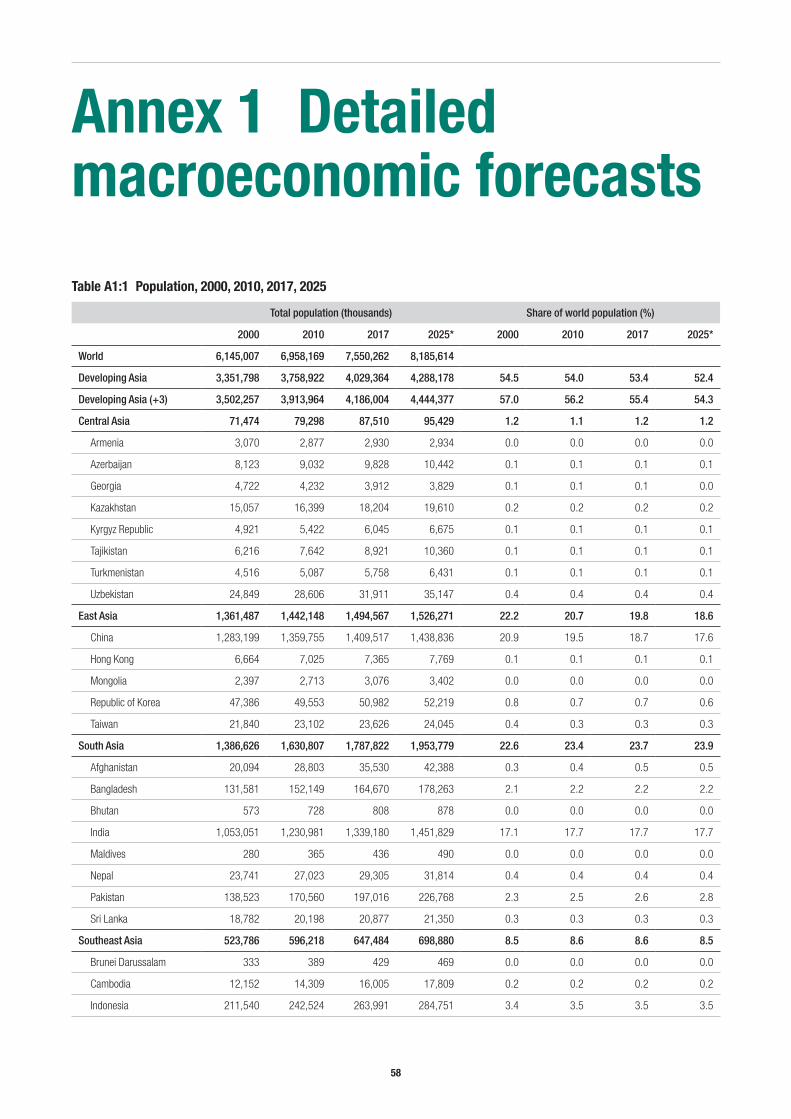
58
Annex 1 Detailed macroeconomic forecasts
Total population (thousands) Share of world population (%)
2000 2010 2017 2025* 2000 2010 2017 2025*
World 6,145,007 6,958,169 7,550,262 8,185,614
Developing Asia 3,351,798 3,758,922 4,029,364 4,288,178 54.5 54.0 53.4 52.4
Developing Asia (+3) 3,502,257 3,913,964 4,186,004 4,444,377 57.0 56.2 55.4 54.3
Central Asia 71,474 79,298 87,510 95,429 1.2 1.1 1.2 1.2
Armenia 3,070 2,877 2,930 2,934 0.0 0.0 0.0 0.0
Azerbaijan 8,123 9,032 9,828 10,442 0.1 0.1 0.1 0.1
Georgia 4,722 4,232 3,912 3,829 0.1 0.1 0.1 0.0
Kazakhstan 15,057 16,399 18,204 19,610 0.2 0.2 0.2 0.2
Kyrgyz Republic 4,921 5,422 6,045 6,675 0.1 0.1 0.1 0.1
Tajikistan 6,216 7,642 8,921 10,360 0.1 0.1 0.1 0.1
Turkmenistan 4,516 5,087 5,758 6,431 0.1 0.1 0.1 0.1
Uzbekistan 24,849 28,606 31,911 35,147 0.4 0.4 0.4 0.4
East Asia 1,361,487 1,442,148 1,494,567 1,526,271 22.2 20.7 19.8 18.6
China 1,283,199 1,359,755 1,409,517 1,438,836 20.9 19.5 18.7 17.6
Hong Kong 6,664 7,025 7,365 7,769 0.1 0.1 0.1 0.1
Mongolia 2,397 2,713 3,076 3,402 0.0 0.0 0.0 0.0
Republic of Korea 47,386 49,553 50,982 52,219 0.8 0.7 0.7 0.6
Taiwan 21,840 23,102 23,626 24,045 0.4 0.3 0.3 0.3
South Asia 1,386,626 1,630,807 1,787,822 1,953,779 22.6 23.4 23.7 23.9
Afghanistan 20,094 28,803 35,530 42,388 0.3 0.4 0.5 0.5
Bangladesh 131,581 152,149 164,670 178,263 2.1 2.2 2.2 2.2
Bhutan 573 728 808 878 0.0 0.0 0.0 0.0
India 1,053,051 1,230,981 1,339,180 1,451,829 17.1 17.7 17.7 17.7
Maldives 280 365 436 490 0.0 0.0 0.0 0.0
Nepal 23,741 27,023 29,305 31,814 0.4 0.4 0.4 0.4
Pakistan 138,523 170,560 197,016 226,768 2.3 2.5 2.6 2.8
Sri Lanka 18,782 20,198 20,877 21,350 0.3 0.3 0.3 0.3
Southeast Asia 523,786 596,218 647,484 698,880 8.5 8.6 8.6 8.5
Brunei Darussalam 333 389 429 469 0.0 0.0 0.0 0.0
Cambodia 12,152 14,309 16,005 17,809 0.2 0.2 0.2 0.2
Indonesia 211,540 242,524 263,991 284,751 3.4 3.5 3.5 3.5
Table A1:1 Population, 2000, 2010, 2017, 2025
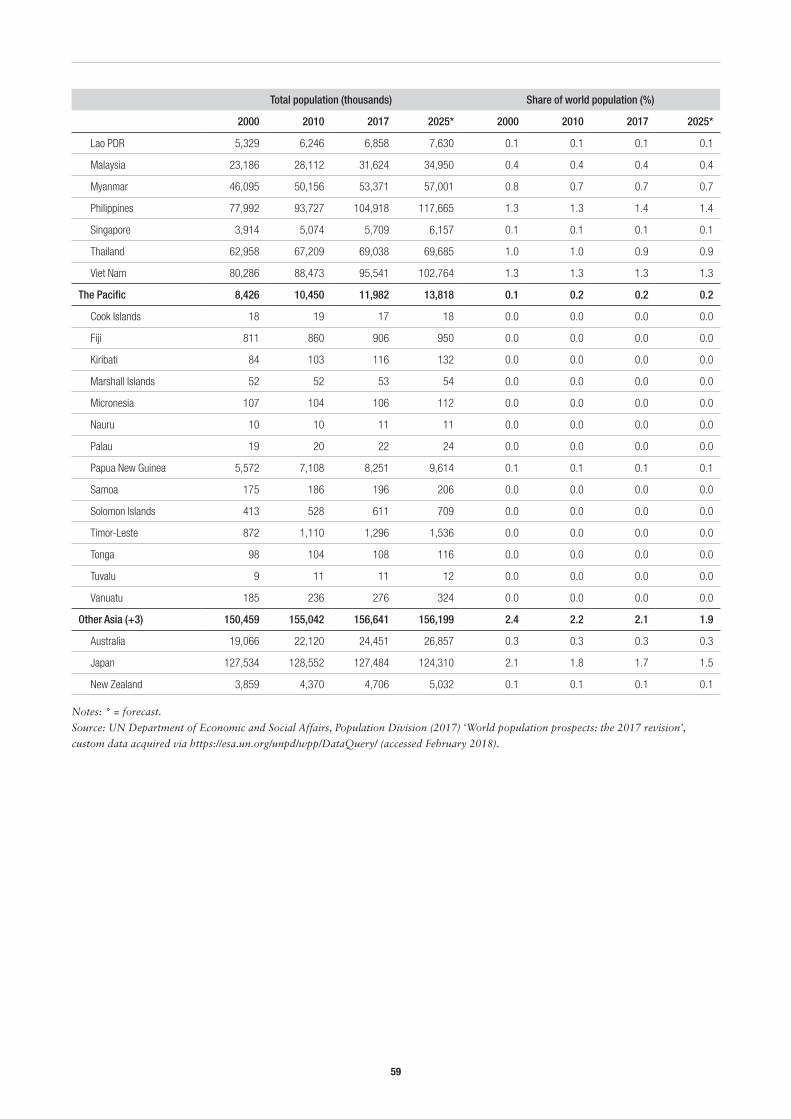
59
Total population (thousands) Share of world population (%)
2000 2010 2017 2025* 2000 2010 2017 2025*
Lao PDR 5,329 6,246 6,858 7,630 0.1 0.1 0.1 0.1
Malaysia 23,186 28,112 31,624 34,950 0.4 0.4 0.4 0.4
Myanmar 46,095 50,156 53,371 57,001 0.8 0.7 0.7 0.7
Philippines 77,992 93,727 104,918 117,665 1.3 1.3 1.4 1.4
Singapore 3,914 5,074 5,709 6,157 0.1 0.1 0.1 0.1
Thailand 62,958 67,209 69,038 69,685 1.0 1.0 0.9 0.9
Viet Nam 80,286 88,473 95,541 102,764 1.3 1.3 1.3 1.3
The Pacific 8,426 10,450 11,982 13,818 0.1 0.2 0.2 0.2
Cook Islands 18 19 17 18 0.0 0.0 0.0 0.0
Fiji 811 860 906 950 0.0 0.0 0.0 0.0
Kiribati 84 103 116 132 0.0 0.0 0.0 0.0
Marshall Islands 52 52 53 54 0.0 0.0 0.0 0.0
Micronesia 107 104 106 112 0.0 0.0 0.0 0.0
Nauru 10 10 11 11 0.0 0.0 0.0 0.0
Palau 19 20 22 24 0.0 0.0 0.0 0.0
Papua New Guinea 5,572 7,108 8,251 9,614 0.1 0.1 0.1 0.1
Samoa 175 186 196 206 0.0 0.0 0.0 0.0
Solomon Islands 413 528 611 709 0.0 0.0 0.0 0.0
Timor-Leste 872 1,110 1,296 1,536 0.0 0.0 0.0 0.0
Tonga 98 104 108 116 0.0 0.0 0.0 0.0
Tuvalu 9 11 11 12 0.0 0.0 0.0 0.0
Vanuatu 185 236 276 324 0.0 0.0 0.0 0.0
Other Asia (+3) 150,459 155,042 156,641 156,199 2.4 2.2 2.1 1.9
Australia 19,066 22,120 24,451 26,857 0.3 0.3 0.3 0.3
Japan 127,534 128,552 127,484 124,310 2.1 1.8 1.7 1.5
New Zealand 3,859 4,370 4,706 5,032 0.1 0.1 0.1 0.1
Notes: * = forecast.
Source: UN Department of Economic and Social Affairs, Population Division (2017) ‘World population prospects: the 2017 revision’,
custom data acquired via https://esa.un.org/unpd/wpp/DataQuery/ (accessed February 2018).
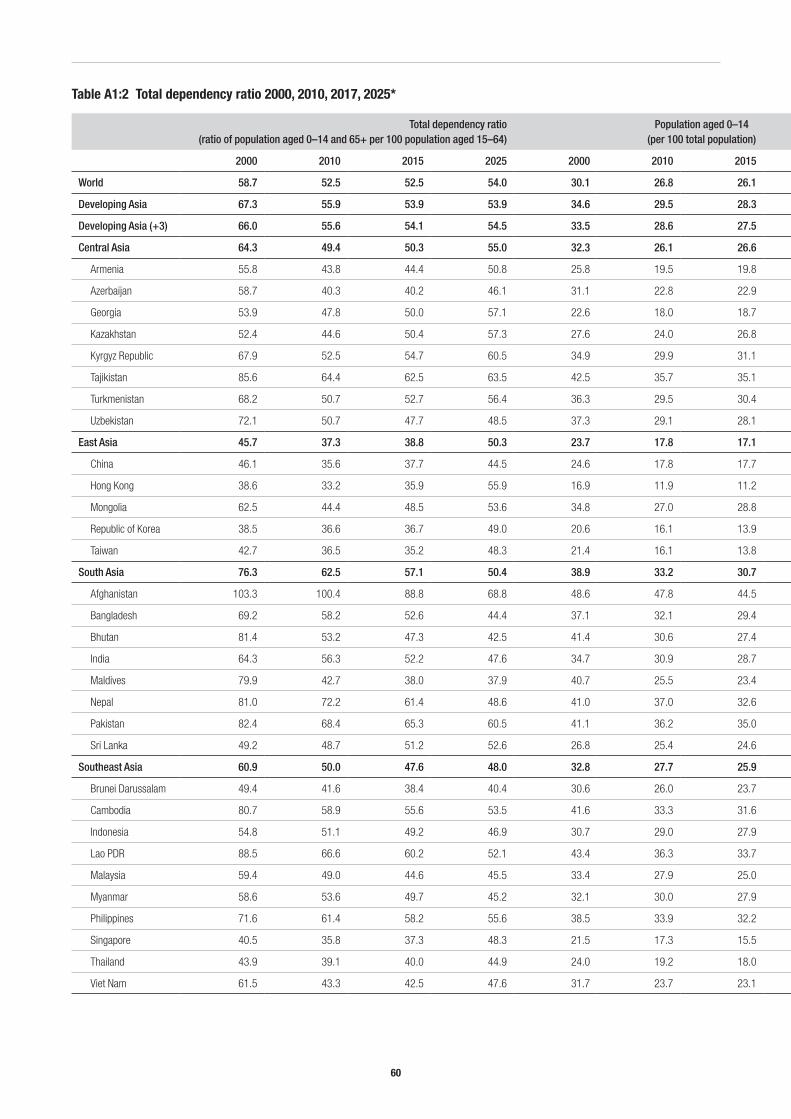
60
Table A1:2 Total dependency ratio 2000, 2010, 2017, 2025*
Total dependency ratio (ratio of population aged 0–14 and 65+ per 100 population aged 15–64)
Population aged 0–14 (per 100 total population)
Population aged 15–64 (per 100 total population)
Population aged 65+ (per 100 total population)
2000 2010 2015 2025 2000 2010 2015 2025 2000 2010 2015 2025 2000 2010 2015 2025
World 58.7 52.5 52.5 54.0 30.1 26.8 26.1 24.6 63.0 65.6 65.6 64.9 6.9 7.6 8.3 10.4
Developing Asia 67.3 55.9 53.9 53.9 34.6 29.5 28.3 26.0 60.4 64.8 65.5 65.2 5.0 5.7 6.3 8.7
Developing Asia (+3) 66.0 55.6 54.1 54.5 33.5 28.6 27.5 25.4 60.9 64.9 65.4 64.9 5.6 6.5 7.1 9.6
Central Asia 64.3 49.4 50.3 55.0 32.3 26.1 26.6 26.3 61.1 67.1 66.7 64.6 6.6 6.8 6.7 9.1
Armenia 55.8 43.8 44.4 50.8 25.8 19.5 19.8 18.8 64.2 69.5 69.2 66.3 10.0 11.0 10.9 14.9
Azerbaijan 58.7 40.3 40.2 46.1 31.1 22.8 22.9 22.6 63.0 71.3 71.4 68.4 5.8 5.9 5.7 9.0
Georgia 53.9 47.8 50.0 57.1 22.6 18.0 18.7 19.4 65.0 67.7 66.7 63.7 12.4 14.3 14.6 16.9
Kazakhstan 52.4 44.6 50.4 57.3 27.6 24.0 26.8 27.7 65.6 69.1 66.5 63.6 6.8 6.8 6.8 8.7
Kyrgyz Republic 67.9 52.5 54.7 60.5 34.9 29.9 31.1 31.5 59.6 65.6 64.6 62.3 5.5 4.5 4.3 6.2
Tajikistan 85.6 64.4 62.5 63.5 42.5 35.7 35.1 34.1 53.9 60.8 61.6 61.2 3.6 3.4 3.3 4.7
Turkmenistan 68.2 50.7 52.7 56.4 36.3 29.5 30.4 30.2 59.5 66.3 65.5 63.9 4.3 4.1 4.1 5.9
Uzbekistan 72.1 50.7 47.7 48.5 37.3 29.1 28.1 26.3 58.1 66.4 67.7 67.4 4.6 4.5 4.2 6.4
East Asia 45.7 37.3 38.8 50.3 23.7 17.8 17.1 17.2 68.9 72.9 72.1 66.6 7.5 9.3 10.8 16.2
China 46.1 35.6 37.7 44.5 24.6 17.8 17.7 16.6 68.5 73.8 72.6 69.2 6.9 8.4 9.7 14.2
Hong Kong 38.6 33.2 35.9 55.9 16.9 11.9 11.2 13.7 72.1 75.1 73.6 64.2 11.0 13.0 15.2 22.1
Mongolia 62.5 44.4 48.5 53.6 34.8 27.0 28.8 29.5 61.5 69.2 67.3 65.1 3.7 3.8 3.9 5.5
Republic of Korea 38.5 36.6 36.7 49.0 20.6 16.1 13.9 13.0 72.2 73.2 73.1 67.1 7.2 10.7 13.0 19.9
Taiwan 42.7 36.5 35.2 48.3 21.4 16.1 13.8 13.3 70.1 73.2 74.0 67.4 8.5 10.7 12.3 19.3
South Asia 76.3 62.5 57.1 50.4 38.9 33.2 30.7 26.6 57.1 62.2 64.2 66.8 4.0 4.7 5.2 6.7
Afghanistan 103.3 100.4 88.8 68.8 48.6 47.8 44.5 37.9 49.2 49.9 53.0 59.2 2.2 2.3 2.5 2.9
Bangladesh 69.2 58.2 52.6 44.4 37.1 32.1 29.4 24.7 59.1 63.2 65.5 69.3 3.8 4.7 5.0 6.0
Bhutan 81.4 53.2 47.3 42.5 41.4 30.6 27.4 23.6 55.1 65.3 67.9 70.2 3.5 4.2 4.7 6.3
India 64.3 56.3 52.2 47.6 34.7 30.9 28.7 24.8 60.9 64.0 65.7 67.7 4.4 5.1 5.6 7.5
Maldives 79.9 42.7 38.0 37.9 40.7 25.5 23.4 22.0 55.6 70.1 72.5 72.5 3.7 4.5 4.1 5.5
Nepal 81.0 72.2 61.4 48.6 41.0 37.0 32.6 26.0 55.2 58.1 62.0 67.3 3.8 4.9 5.5 6.7
Pakistan 82.4 68.4 65.3 60.5 41.1 36.2 35.0 32.8 54.8 59.4 60.5 62.3 4.1 4.4 4.5 4.9
Sri Lanka 49.2 48.7 51.2 52.6 26.8 25.4 24.6 21.1 67.0 67.3 66.1 65.5 6.2 7.3 9.3 13.4
Southeast Asia 60.9 50.0 47.6 48.0 32.8 27.7 25.9 23.2 62.7 66.9 68.0 67.6 4.6 5.4 6.2 9.2
Brunei Darussalam 49.4 41.6 38.4 40.4 30.6 26.0 23.7 21.0 67.0 70.6 72.2 71.2 2.4 3.4 4.1 7.8
Cambodia 80.7 58.9 55.6 53.5 41.6 33.3 31.6 29.3 55.3 62.9 64.3 65.1 3.1 3.7 4.1 5.5
Indonesia 54.8 51.1 49.2 46.9 30.7 29.0 27.9 25.0 64.6 66.2 67.0 68.1 4.7 4.8 5.1 6.9
Lao PDR 88.5 66.6 60.2 52.1 43.4 36.3 33.7 29.4 53.1 60.0 62.4 65.7 3.6 3.7 3.9 4.8
Malaysia 59.4 49.0 44.6 45.5 33.4 27.9 25.0 23.0 62.7 67.1 69.2 68.7 3.9 4.9 5.9 8.3
Myanmar 58.6 53.6 49.7 45.2 32.1 30.0 27.9 23.5 63.0 65.1 66.8 68.9 4.8 4.9 5.3 7.6
Philippines 71.6 61.4 58.2 55.6 38.5 33.9 32.2 29.8 58.3 62.0 63.2 64.3 3.3 4.1 4.6 5.9
Singapore 40.5 35.8 37.3 48.3 21.5 17.3 15.5 13.4 71.2 73.6 72.8 67.4 7.3 9.0 11.7 19.2
Thailand 43.9 39.1 40.0 44.9 24.0 19.2 18.0 15.0 69.5 71.9 71.4 69.0 6.5 8.9 10.6 16.0
Viet Nam 61.5 43.3 42.5 47.6 31.7 23.7 23.1 22.2 61.9 69.8 70.2 67.7 6.4 6.6 6.7 10.1
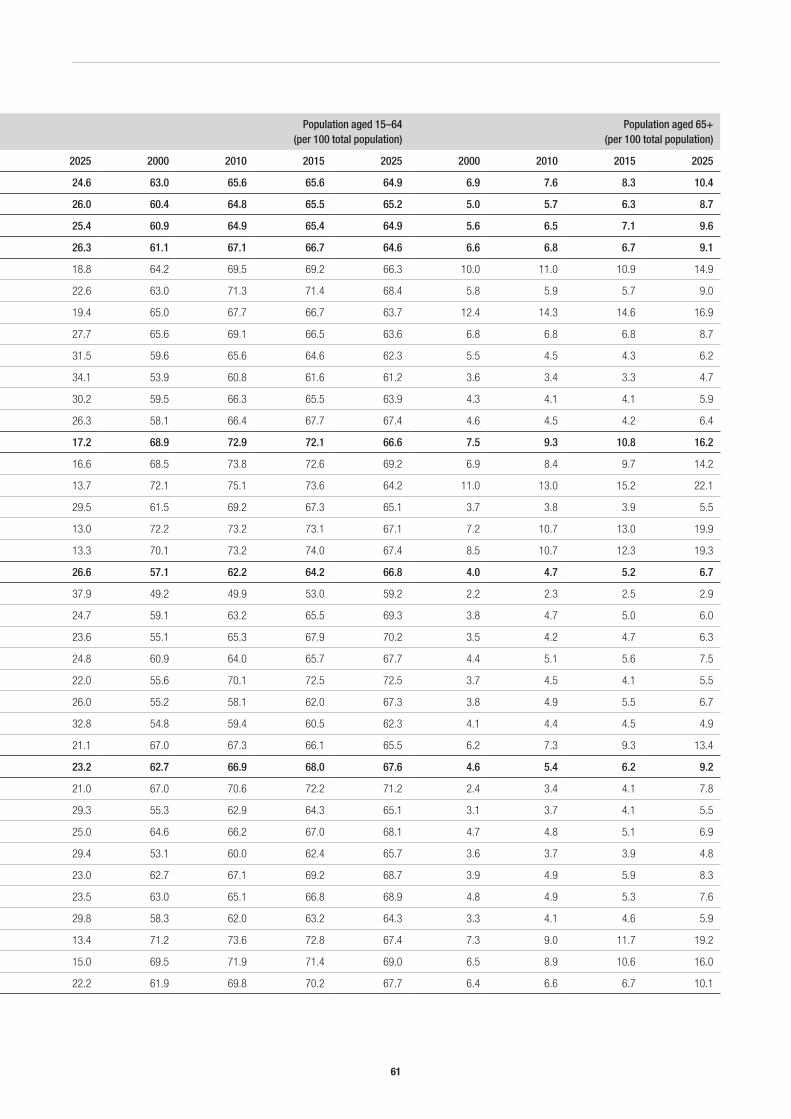
61
Total dependency ratio (ratio of population aged 0–14 and 65+ per 100 population aged 15–64)
Population aged 0–14 (per 100 total population)
Population aged 15–64 (per 100 total population)
Population aged 65+ (per 100 total population)
2000 2010 2015 2025 2000 2010 2015 2025 2000 2010 2015 2025 2000 2010 2015 2025
World 58.7 52.5 52.5 54.0 30.1 26.8 26.1 24.6 63.0 65.6 65.6 64.9 6.9 7.6 8.3 10.4
Developing Asia 67.3 55.9 53.9 53.9 34.6 29.5 28.3 26.0 60.4 64.8 65.5 65.2 5.0 5.7 6.3 8.7
Developing Asia (+3) 66.0 55.6 54.1 54.5 33.5 28.6 27.5 25.4 60.9 64.9 65.4 64.9 5.6 6.5 7.1 9.6
Central Asia 64.3 49.4 50.3 55.0 32.3 26.1 26.6 26.3 61.1 67.1 66.7 64.6 6.6 6.8 6.7 9.1
Armenia 55.8 43.8 44.4 50.8 25.8 19.5 19.8 18.8 64.2 69.5 69.2 66.3 10.0 11.0 10.9 14.9
Azerbaijan 58.7 40.3 40.2 46.1 31.1 22.8 22.9 22.6 63.0 71.3 71.4 68.4 5.8 5.9 5.7 9.0
Georgia 53.9 47.8 50.0 57.1 22.6 18.0 18.7 19.4 65.0 67.7 66.7 63.7 12.4 14.3 14.6 16.9
Kazakhstan 52.4 44.6 50.4 57.3 27.6 24.0 26.8 27.7 65.6 69.1 66.5 63.6 6.8 6.8 6.8 8.7
Kyrgyz Republic 67.9 52.5 54.7 60.5 34.9 29.9 31.1 31.5 59.6 65.6 64.6 62.3 5.5 4.5 4.3 6.2
Tajikistan 85.6 64.4 62.5 63.5 42.5 35.7 35.1 34.1 53.9 60.8 61.6 61.2 3.6 3.4 3.3 4.7
Turkmenistan 68.2 50.7 52.7 56.4 36.3 29.5 30.4 30.2 59.5 66.3 65.5 63.9 4.3 4.1 4.1 5.9
Uzbekistan 72.1 50.7 47.7 48.5 37.3 29.1 28.1 26.3 58.1 66.4 67.7 67.4 4.6 4.5 4.2 6.4
East Asia 45.7 37.3 38.8 50.3 23.7 17.8 17.1 17.2 68.9 72.9 72.1 66.6 7.5 9.3 10.8 16.2
China 46.1 35.6 37.7 44.5 24.6 17.8 17.7 16.6 68.5 73.8 72.6 69.2 6.9 8.4 9.7 14.2
Hong Kong 38.6 33.2 35.9 55.9 16.9 11.9 11.2 13.7 72.1 75.1 73.6 64.2 11.0 13.0 15.2 22.1
Mongolia 62.5 44.4 48.5 53.6 34.8 27.0 28.8 29.5 61.5 69.2 67.3 65.1 3.7 3.8 3.9 5.5
Republic of Korea 38.5 36.6 36.7 49.0 20.6 16.1 13.9 13.0 72.2 73.2 73.1 67.1 7.2 10.7 13.0 19.9
Taiwan 42.7 36.5 35.2 48.3 21.4 16.1 13.8 13.3 70.1 73.2 74.0 67.4 8.5 10.7 12.3 19.3
South Asia 76.3 62.5 57.1 50.4 38.9 33.2 30.7 26.6 57.1 62.2 64.2 66.8 4.0 4.7 5.2 6.7
Afghanistan 103.3 100.4 88.8 68.8 48.6 47.8 44.5 37.9 49.2 49.9 53.0 59.2 2.2 2.3 2.5 2.9
Bangladesh 69.2 58.2 52.6 44.4 37.1 32.1 29.4 24.7 59.1 63.2 65.5 69.3 3.8 4.7 5.0 6.0
Bhutan 81.4 53.2 47.3 42.5 41.4 30.6 27.4 23.6 55.1 65.3 67.9 70.2 3.5 4.2 4.7 6.3
India 64.3 56.3 52.2 47.6 34.7 30.9 28.7 24.8 60.9 64.0 65.7 67.7 4.4 5.1 5.6 7.5
Maldives 79.9 42.7 38.0 37.9 40.7 25.5 23.4 22.0 55.6 70.1 72.5 72.5 3.7 4.5 4.1 5.5
Nepal 81.0 72.2 61.4 48.6 41.0 37.0 32.6 26.0 55.2 58.1 62.0 67.3 3.8 4.9 5.5 6.7
Pakistan 82.4 68.4 65.3 60.5 41.1 36.2 35.0 32.8 54.8 59.4 60.5 62.3 4.1 4.4 4.5 4.9
Sri Lanka 49.2 48.7 51.2 52.6 26.8 25.4 24.6 21.1 67.0 67.3 66.1 65.5 6.2 7.3 9.3 13.4
Southeast Asia 60.9 50.0 47.6 48.0 32.8 27.7 25.9 23.2 62.7 66.9 68.0 67.6 4.6 5.4 6.2 9.2
Brunei Darussalam 49.4 41.6 38.4 40.4 30.6 26.0 23.7 21.0 67.0 70.6 72.2 71.2 2.4 3.4 4.1 7.8
Cambodia 80.7 58.9 55.6 53.5 41.6 33.3 31.6 29.3 55.3 62.9 64.3 65.1 3.1 3.7 4.1 5.5
Indonesia 54.8 51.1 49.2 46.9 30.7 29.0 27.9 25.0 64.6 66.2 67.0 68.1 4.7 4.8 5.1 6.9
Lao PDR 88.5 66.6 60.2 52.1 43.4 36.3 33.7 29.4 53.1 60.0 62.4 65.7 3.6 3.7 3.9 4.8
Malaysia 59.4 49.0 44.6 45.5 33.4 27.9 25.0 23.0 62.7 67.1 69.2 68.7 3.9 4.9 5.9 8.3
Myanmar 58.6 53.6 49.7 45.2 32.1 30.0 27.9 23.5 63.0 65.1 66.8 68.9 4.8 4.9 5.3 7.6
Philippines 71.6 61.4 58.2 55.6 38.5 33.9 32.2 29.8 58.3 62.0 63.2 64.3 3.3 4.1 4.6 5.9
Singapore 40.5 35.8 37.3 48.3 21.5 17.3 15.5 13.4 71.2 73.6 72.8 67.4 7.3 9.0 11.7 19.2
Thailand 43.9 39.1 40.0 44.9 24.0 19.2 18.0 15.0 69.5 71.9 71.4 69.0 6.5 8.9 10.6 16.0
Viet Nam 61.5 43.3 42.5 47.6 31.7 23.7 23.1 22.2 61.9 69.8 70.2 67.7 6.4 6.6 6.7 10.1
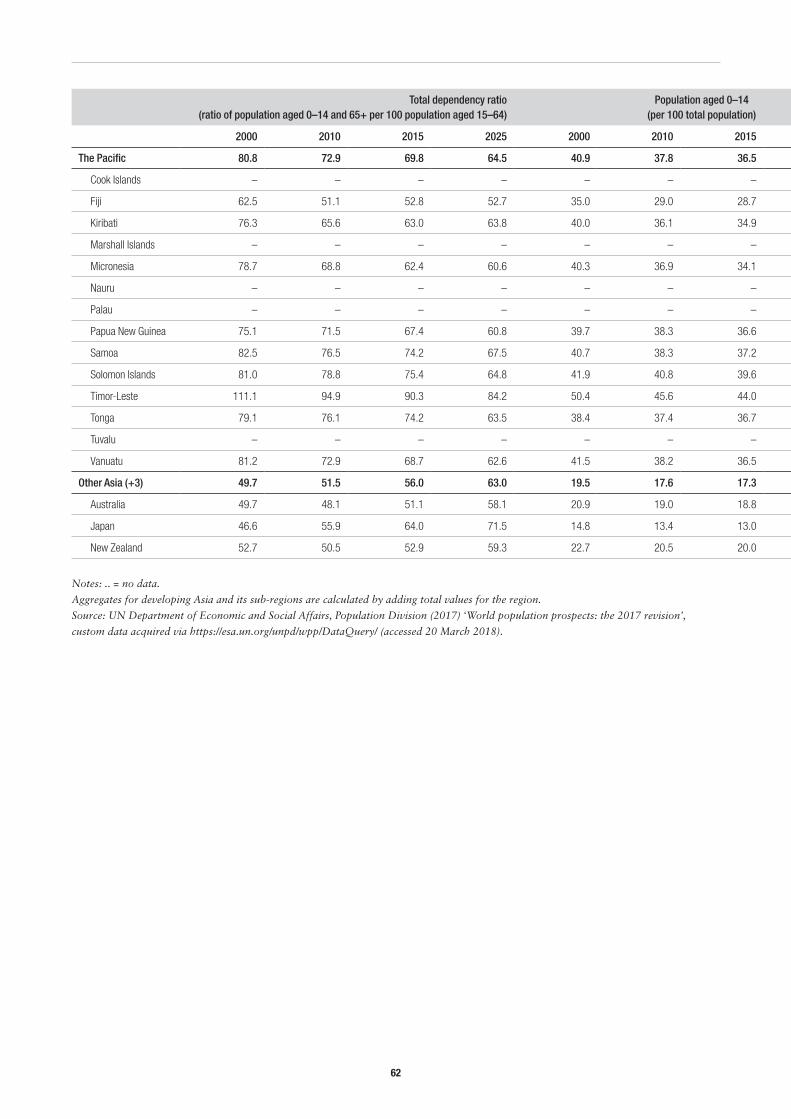
62
Total dependency ratio (ratio of population aged 0–14 and 65+ per 100 population aged 15–64)
Population aged 0–14 (per 100 total population)
Population aged 15–64 (per 100 total population)
Population aged 65+ (per 100 total population)
2000 2010 2015 2025 2000 2010 2015 2025 2000 2010 2015 2025 2000 2010 2015 2025
The Pacific 80.8 72.9 69.8 64.5 40.9 37.8 36.5 33.4 55.5 58.1 59.1 60.9 3.6 4.1 4.4 5.7
Cook Islands – – – – – – – – – – – – – – – –
Fiji 62.5 51.1 52.8 52.7 35.0 29.0 28.7 26.2 61.5 66.2 65.4 65.5 3.4 4.8 5.8 8.3
Kiribati 76.3 65.6 63.0 63.8 40.0 36.1 34.9 34.1 56.7 60.4 61.4 61.0 3.3 3.5 3.7 4.9
Marshall Islands – – – – – – – – – – – – – – – –
Micronesia 78.7 68.8 62.4 60.6 40.3 36.9 34.1 31.4 56.0 59.3 61.6 62.3 3.7 3.8 4.4 6.3
Nauru – – – – – – – – – – – – – – – –
Palau – – – – – – – – – – – – – – – –
Papua New Guinea 75.1 71.5 67.4 60.8 39.7 38.3 36.6 33.3 57.1 58.3 59.7 62.2 3.2 3.4 3.6 4.5
Samoa 82.5 76.5 74.2 67.5 40.7 38.3 37.2 33.1 54.8 56.7 57.4 59.7 4.5 5.1 5.3 7.2
Solomon Islands 81.0 78.8 75.4 64.8 41.9 40.8 39.6 35.3 55.2 55.9 57.0 60.7 2.8 3.3 3.4 4.0
Timor-Leste 111.1 94.9 90.3 84.2 50.4 45.6 44.0 41.9 47.4 51.3 52.5 54.3 2.2 3.1 3.5 3.8
Tonga 79.1 76.1 74.2 63.5 38.4 37.4 36.7 32.1 55.8 56.8 57.4 61.2 5.7 5.9 5.9 6.7
Tuvalu – – – – – – – – – – – – – – – –
Vanuatu 81.2 72.9 68.7 62.6 41.5 38.2 36.5 33.3 55.2 57.9 59.3 61.5 3.3 3.9 4.2 5.2
Other Asia (+3) 49.7 51.5 56.0 63.0 19.5 17.6 17.3 16.8 66.8 66.0 64.2 61.4 13.7 16.3 18.5 21.8
Australia 49.7 48.1 51.1 58.1 20.9 19.0 18.8 19.0 66.8 67.5 66.2 63.2 12.3 13.4 15.0 17.8
Japan 46.6 55.9 64.0 71.5 14.8 13.4 13.0 12.4 68.2 64.1 61.0 58.3 17.0 22.5 26.0 29.3
New Zealand 52.7 50.5 52.9 59.3 22.7 20.5 20.0 18.9 65.5 66.4 65.4 62.8 11.8 13.1 14.6 18.3
Notes: .. = no data.
Aggregates for developing Asia and its sub-regions are calculated by adding total values for the region.
Source: UN Department of Economic and Social Affairs, Population Division (2017) ‘World population prospects: the 2017 revision’,
custom data acquired via https://esa.un.org/unpd/wpp/DataQuery/ (accessed 20 March 2018).
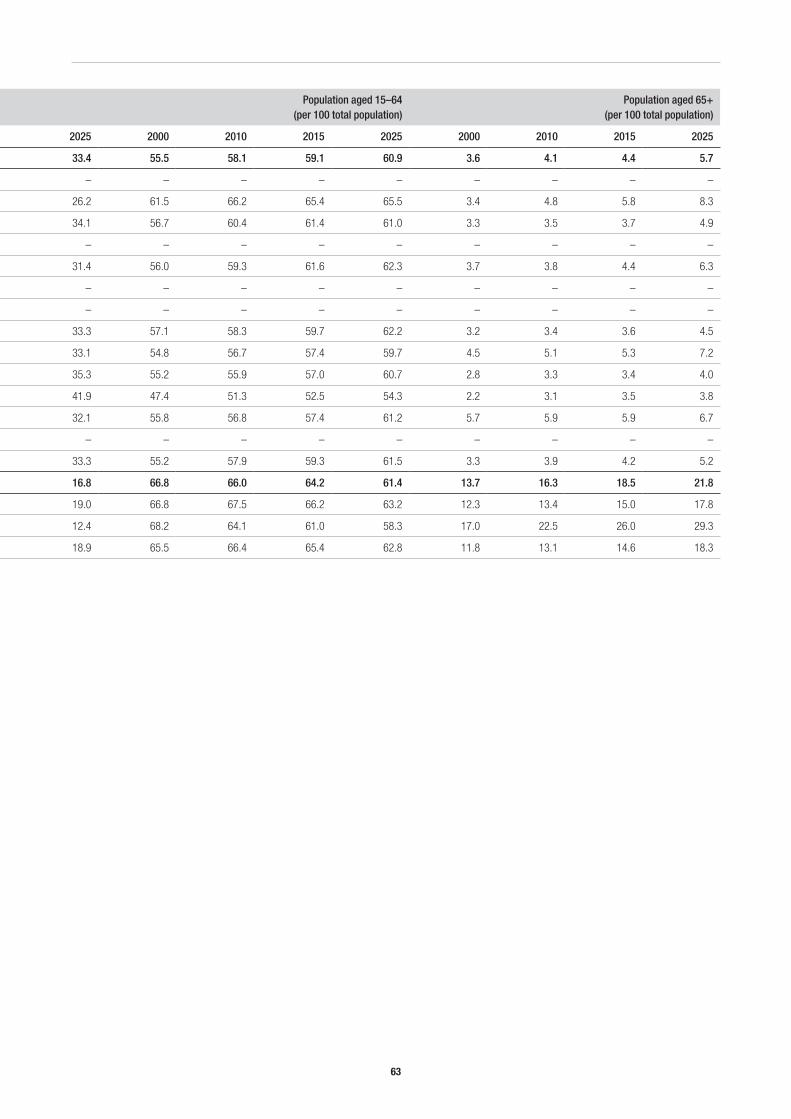
63
Total dependency ratio (ratio of population aged 0–14 and 65+ per 100 population aged 15–64)
Population aged 0–14 (per 100 total population)
Population aged 15–64 (per 100 total population)
Population aged 65+ (per 100 total population)
2000 2010 2015 2025 2000 2010 2015 2025 2000 2010 2015 2025 2000 2010 2015 2025
The Pacific 80.8 72.9 69.8 64.5 40.9 37.8 36.5 33.4 55.5 58.1 59.1 60.9 3.6 4.1 4.4 5.7
Cook Islands – – – – – – – – – – – – – – – –
Fiji 62.5 51.1 52.8 52.7 35.0 29.0 28.7 26.2 61.5 66.2 65.4 65.5 3.4 4.8 5.8 8.3
Kiribati 76.3 65.6 63.0 63.8 40.0 36.1 34.9 34.1 56.7 60.4 61.4 61.0 3.3 3.5 3.7 4.9
Marshall Islands – – – – – – – – – – – – – – – –
Micronesia 78.7 68.8 62.4 60.6 40.3 36.9 34.1 31.4 56.0 59.3 61.6 62.3 3.7 3.8 4.4 6.3
Nauru – – – – – – – – – – – – – – – –
Palau – – – – – – – – – – – – – – – –
Papua New Guinea 75.1 71.5 67.4 60.8 39.7 38.3 36.6 33.3 57.1 58.3 59.7 62.2 3.2 3.4 3.6 4.5
Samoa 82.5 76.5 74.2 67.5 40.7 38.3 37.2 33.1 54.8 56.7 57.4 59.7 4.5 5.1 5.3 7.2
Solomon Islands 81.0 78.8 75.4 64.8 41.9 40.8 39.6 35.3 55.2 55.9 57.0 60.7 2.8 3.3 3.4 4.0
Timor-Leste 111.1 94.9 90.3 84.2 50.4 45.6 44.0 41.9 47.4 51.3 52.5 54.3 2.2 3.1 3.5 3.8
Tonga 79.1 76.1 74.2 63.5 38.4 37.4 36.7 32.1 55.8 56.8 57.4 61.2 5.7 5.9 5.9 6.7
Tuvalu – – – – – – – – – – – – – – – –
Vanuatu 81.2 72.9 68.7 62.6 41.5 38.2 36.5 33.3 55.2 57.9 59.3 61.5 3.3 3.9 4.2 5.2
Other Asia (+3) 49.7 51.5 56.0 63.0 19.5 17.6 17.3 16.8 66.8 66.0 64.2 61.4 13.7 16.3 18.5 21.8
Australia 49.7 48.1 51.1 58.1 20.9 19.0 18.8 19.0 66.8 67.5 66.2 63.2 12.3 13.4 15.0 17.8
Japan 46.6 55.9 64.0 71.5 14.8 13.4 13.0 12.4 68.2 64.1 61.0 58.3 17.0 22.5 26.0 29.3
New Zealand 52.7 50.5 52.9 59.3 22.7 20.5 20.0 18.9 65.5 66.4 65.4 62.8 11.8 13.1 14.6 18.3
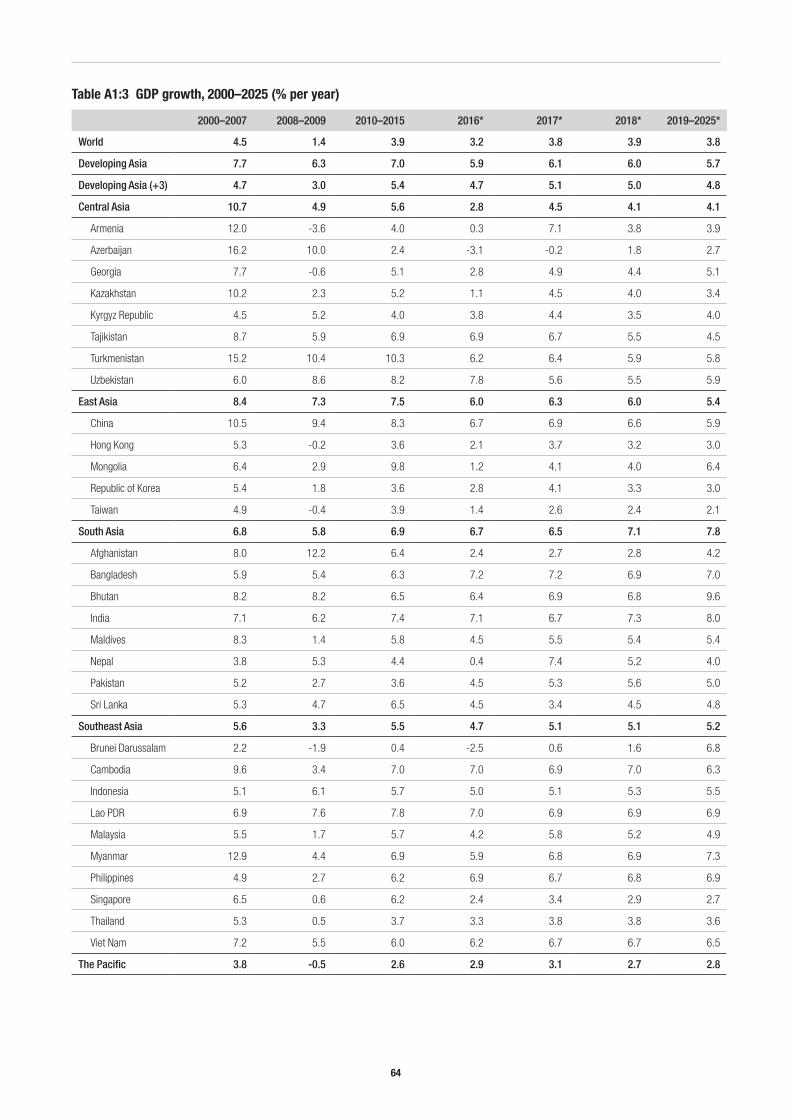
64
2000–2007 2008–2009 2010–2015 2016* 2017* 2018* 2019–2025*
World 4.5 1.4 3.9 3.2 3.8 3.9 3.8
Developing Asia 7.7 6.3 7.0 5.9 6.1 6.0 5.7
Developing Asia (+3) 4.7 3.0 5.4 4.7 5.1 5.0 4.8
Central Asia 10.7 4.9 5.6 2.8 4.5 4.1 4.1
Armenia 12.0 -3.6 4.0 0.3 7.1 3.8 3.9
Azerbaijan 16.2 10.0 2.4 -3.1 -0.2 1.8 2.7
Georgia 7.7 -0.6 5.1 2.8 4.9 4.4 5.1
Kazakhstan 10.2 2.3 5.2 1.1 4.5 4.0 3.4
Kyrgyz Republic 4.5 5.2 4.0 3.8 4.4 3.5 4.0
Tajikistan 8.7 5.9 6.9 6.9 6.7 5.5 4.5
Turkmenistan 15.2 10.4 10.3 6.2 6.4 5.9 5.8
Uzbekistan 6.0 8.6 8.2 7.8 5.6 5.5 5.9
East Asia 8.4 7.3 7.5 6.0 6.3 6.0 5.4
China 10.5 9.4 8.3 6.7 6.9 6.6 5.9
Hong Kong 5.3 -0.2 3.6 2.1 3.7 3.2 3.0
Mongolia 6.4 2.9 9.8 1.2 4.1 4.0 6.4
Republic of Korea 5.4 1.8 3.6 2.8 4.1 3.3 3.0
Taiwan 4.9 -0.4 3.9 1.4 2.6 2.4 2.1
South Asia 6.8 5.8 6.9 6.7 6.5 7.1 7.8
Afghanistan 8.0 12.2 6.4 2.4 2.7 2.8 4.2
Bangladesh 5.9 5.4 6.3 7.2 7.2 6.9 7.0
Bhutan 8.2 8.2 6.5 6.4 6.9 6.8 9.6
India 7.1 6.2 7.4 7.1 6.7 7.3 8.0
Maldives 8.3 1.4 5.8 4.5 5.5 5.4 5.4
Nepal 3.8 5.3 4.4 0.4 7.4 5.2 4.0
Pakistan 5.2 2.7 3.6 4.5 5.3 5.6 5.0
Sri Lanka 5.3 4.7 6.5 4.5 3.4 4.5 4.8
Southeast Asia 5.6 3.3 5.5 4.7 5.1 5.1 5.2
Brunei Darussalam 2.2 -1.9 0.4 -2.5 0.6 1.6 6.8
Cambodia 9.6 3.4 7.0 7.0 6.9 7.0 6.3
Indonesia 5.1 6.1 5.7 5.0 5.1 5.3 5.5
Lao PDR 6.9 7.6 7.8 7.0 6.9 6.9 6.9
Malaysia 5.5 1.7 5.7 4.2 5.8 5.2 4.9
Myanmar 12.9 4.4 6.9 5.9 6.8 6.9 7.3
Philippines 4.9 2.7 6.2 6.9 6.7 6.8 6.9
Singapore 6.5 0.6 6.2 2.4 3.4 2.9 2.7
Thailand 5.3 0.5 3.7 3.3 3.8 3.8 3.6
Viet Nam 7.2 5.5 6.0 6.2 6.7 6.7 6.5
The Pacific 3.8 -0.5 2.6 2.9 3.1 2.7 2.8
Table A1:3 GDP growth, 2000–2025 (% per year)
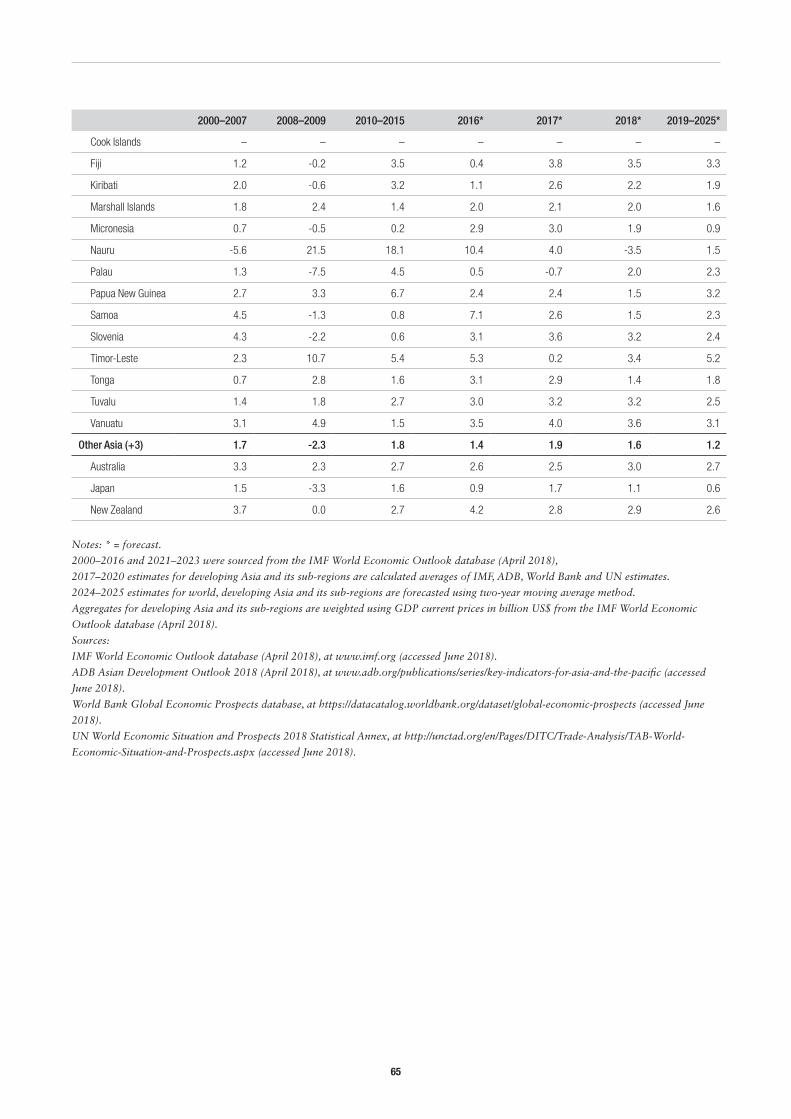
65
2000–2007 2008–2009 2010–2015 2016* 2017* 2018* 2019–2025*
Cook Islands – – – – – – –
Fiji 1.2 -0.2 3.5 0.4 3.8 3.5 3.3
Kiribati 2.0 -0.6 3.2 1.1 2.6 2.2 1.9
Marshall Islands 1.8 2.4 1.4 2.0 2.1 2.0 1.6
Micronesia 0.7 -0.5 0.2 2.9 3.0 1.9 0.9
Nauru -5.6 21.5 18.1 10.4 4.0 -3.5 1.5
Palau 1.3 -7.5 4.5 0.5 -0.7 2.0 2.3
Papua New Guinea 2.7 3.3 6.7 2.4 2.4 1.5 3.2
Samoa 4.5 -1.3 0.8 7.1 2.6 1.5 2.3
Slovenia 4.3 -2.2 0.6 3.1 3.6 3.2 2.4
Timor-Leste 2.3 10.7 5.4 5.3 0.2 3.4 5.2
Tonga 0.7 2.8 1.6 3.1 2.9 1.4 1.8
Tuvalu 1.4 1.8 2.7 3.0 3.2 3.2 2.5
Vanuatu 3.1 4.9 1.5 3.5 4.0 3.6 3.1
Other Asia (+3) 1.7 -2.3 1.8 1.4 1.9 1.6 1.2
Australia 3.3 2.3 2.7 2.6 2.5 3.0 2.7
Japan 1.5 -3.3 1.6 0.9 1.7 1.1 0.6
New Zealand 3.7 0.0 2.7 4.2 2.8 2.9 2.6
Notes: * = forecast.
2000–2016 and 2021–2023 were sourced from the IMF World Economic Outlook database (April 2018),
2017–2020 estimates for developing Asia and its sub-regions are calculated averages of IMF, ADB, World Bank and UN estimates.
2024–2025 estimates for world, developing Asia and its sub-regions are forecasted using two-year moving average method.
Aggregates for developing Asia and its sub-regions are weighted using GDP current prices in billion US$ from the IMF World Economic
Outlook database (April 2018).
Sources:
IMF World Economic Outlook database (April 2018), at www.imf.org (accessed June 2018).
ADB Asian Development Outlook 2018 (April 2018), at www.adb.org/publications/series/key-indicators-for-asia-and-the-pacific (accessed
June 2018).
World Bank Global Economic Prospects database, at https://datacatalog.worldbank.org/dataset/global-economic-prospects (accessed June
2018).
UN World Economic Situation and Prospects 2018 Statistical Annex, at http://unctad.org/en/Pages/DITC/Trade-Analysis/TAB-World-
Economic-Situation-and-Prospects.aspx (accessed June 2018).
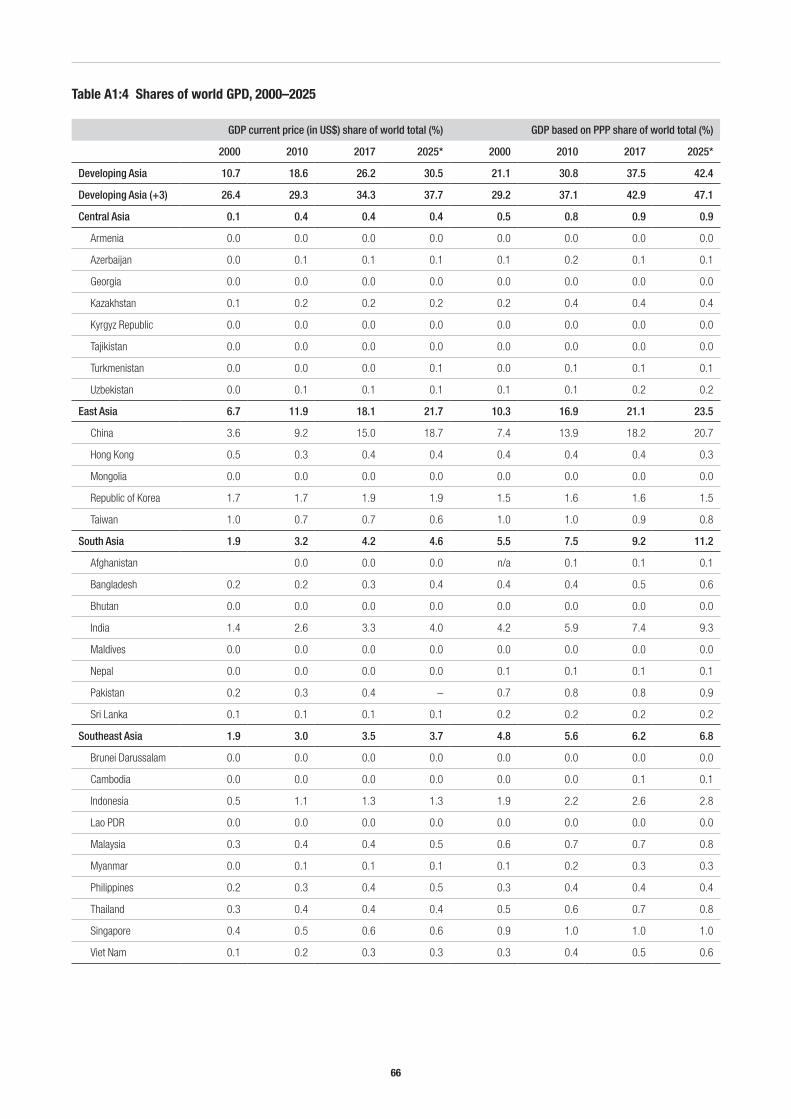
66
GDP current price (in US$) share of world total (%) GDP based on PPP share of world total (%)
2000 2010 2017 2025* 2000 2010 2017 2025*
Developing Asia 10.7 18.6 26.2 30.5 21.1 30.8 37.5 42.4
Developing Asia (+3) 26.4 29.3 34.3 37.7 29.2 37.1 42.9 47.1
Central Asia 0.1 0.4 0.4 0.4 0.5 0.8 0.9 0.9
Armenia 0.0 0.0 0.0 0.0 0.0 0.0 0.0 0.0
Azerbaijan 0.0 0.1 0.1 0.1 0.1 0.2 0.1 0.1
Georgia 0.0 0.0 0.0 0.0 0.0 0.0 0.0 0.0
Kazakhstan 0.1 0.2 0.2 0.2 0.2 0.4 0.4 0.4
Kyrgyz Republic 0.0 0.0 0.0 0.0 0.0 0.0 0.0 0.0
Tajikistan 0.0 0.0 0.0 0.0 0.0 0.0 0.0 0.0
Turkmenistan 0.0 0.0 0.0 0.1 0.0 0.1 0.1 0.1
Uzbekistan 0.0 0.1 0.1 0.1 0.1 0.1 0.2 0.2
East Asia 6.7 11.9 18.1 21.7 10.3 16.9 21.1 23.5
China 3.6 9.2 15.0 18.7 7.4 13.9 18.2 20.7
Hong Kong 0.5 0.3 0.4 0.4 0.4 0.4 0.4 0.3
Mongolia 0.0 0.0 0.0 0.0 0.0 0.0 0.0 0.0
Republic of Korea 1.7 1.7 1.9 1.9 1.5 1.6 1.6 1.5
Taiwan 1.0 0.7 0.7 0.6 1.0 1.0 0.9 0.8
South Asia 1.9 3.2 4.2 4.6 5.5 7.5 9.2 11.2
Afghanistan 0.0 0.0 0.0 n/a 0.1 0.1 0.1
Bangladesh 0.2 0.2 0.3 0.4 0.4 0.4 0.5 0.6
Bhutan 0.0 0.0 0.0 0.0 0.0 0.0 0.0 0.0
India 1.4 2.6 3.3 4.0 4.2 5.9 7.4 9.3
Maldives 0.0 0.0 0.0 0.0 0.0 0.0 0.0 0.0
Nepal 0.0 0.0 0.0 0.0 0.1 0.1 0.1 0.1
Pakistan 0.2 0.3 0.4 – 0.7 0.8 0.8 0.9
Sri Lanka 0.1 0.1 0.1 0.1 0.2 0.2 0.2 0.2
Southeast Asia 1.9 3.0 3.5 3.7 4.8 5.6 6.2 6.8
Brunei Darussalam 0.0 0.0 0.0 0.0 0.0 0.0 0.0 0.0
Cambodia 0.0 0.0 0.0 0.0 0.0 0.0 0.1 0.1
Indonesia 0.5 1.1 1.3 1.3 1.9 2.2 2.6 2.8
Lao PDR 0.0 0.0 0.0 0.0 0.0 0.0 0.0 0.0
Malaysia 0.3 0.4 0.4 0.5 0.6 0.7 0.7 0.8
Myanmar 0.0 0.1 0.1 0.1 0.1 0.2 0.3 0.3
Philippines 0.2 0.3 0.4 0.5 0.3 0.4 0.4 0.4
Thailand 0.3 0.4 0.4 0.4 0.5 0.6 0.7 0.8
Singapore 0.4 0.5 0.6 0.6 0.9 1.0 1.0 1.0
Viet Nam 0.1 0.2 0.3 0.3 0.3 0.4 0.5 0.6
Table A1:4 Shares of world GPD, 2000–2025
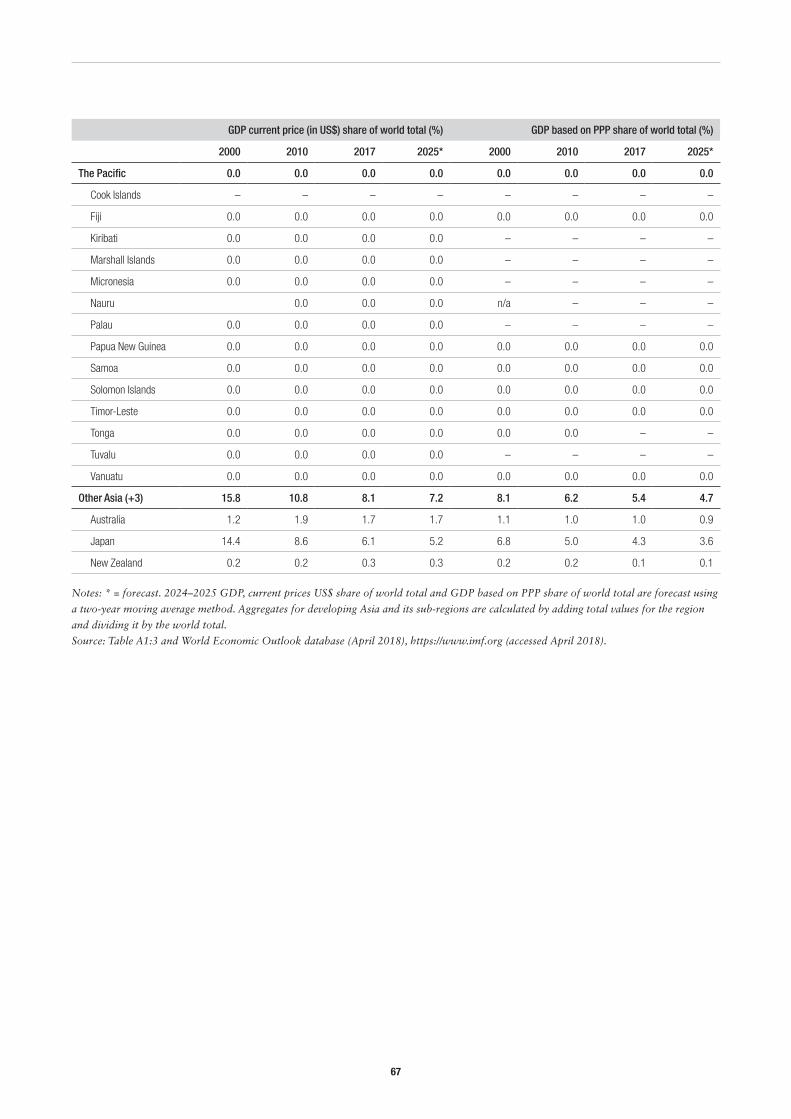
67
GDP current price (in US$) share of world total (%) GDP based on PPP share of world total (%)
2000 2010 2017 2025* 2000 2010 2017 2025*
The Pacific 0.0 0.0 0.0 0.0 0.0 0.0 0.0 0.0
Cook Islands – – – – – – – –
Fiji 0.0 0.0 0.0 0.0 0.0 0.0 0.0 0.0
Kiribati 0.0 0.0 0.0 0.0 – – – –
Marshall Islands 0.0 0.0 0.0 0.0 – – – –
Micronesia 0.0 0.0 0.0 0.0 – – – –
Nauru 0.0 0.0 0.0 n/a – – –
Palau 0.0 0.0 0.0 0.0 – – – –
Papua New Guinea 0.0 0.0 0.0 0.0 0.0 0.0 0.0 0.0
Samoa 0.0 0.0 0.0 0.0 0.0 0.0 0.0 0.0
Solomon Islands 0.0 0.0 0.0 0.0 0.0 0.0 0.0 0.0
Timor-Leste 0.0 0.0 0.0 0.0 0.0 0.0 0.0 0.0
Tonga 0.0 0.0 0.0 0.0 0.0 0.0 – –
Tuvalu 0.0 0.0 0.0 0.0 – – – –
Vanuatu 0.0 0.0 0.0 0.0 0.0 0.0 0.0 0.0
Other Asia (+3) 15.8 10.8 8.1 7.2 8.1 6.2 5.4 4.7
Australia 1.2 1.9 1.7 1.7 1.1 1.0 1.0 0.9
Japan 14.4 8.6 6.1 5.2 6.8 5.0 4.3 3.6
New Zealand 0.2 0.2 0.3 0.3 0.2 0.2 0.1 0.1
Notes: * = forecast. 2024–2025 GDP, current prices US$ share of world total and GDP based on PPP share of world total are forecast using
a two-year moving average method. Aggregates for developing Asia and its sub-regions are calculated by adding total values for the region
and dividing it by the world total.
Source: Table A1:3 and World Economic Outlook database (April 2018), https://www.imf.org (accessed April 2018).
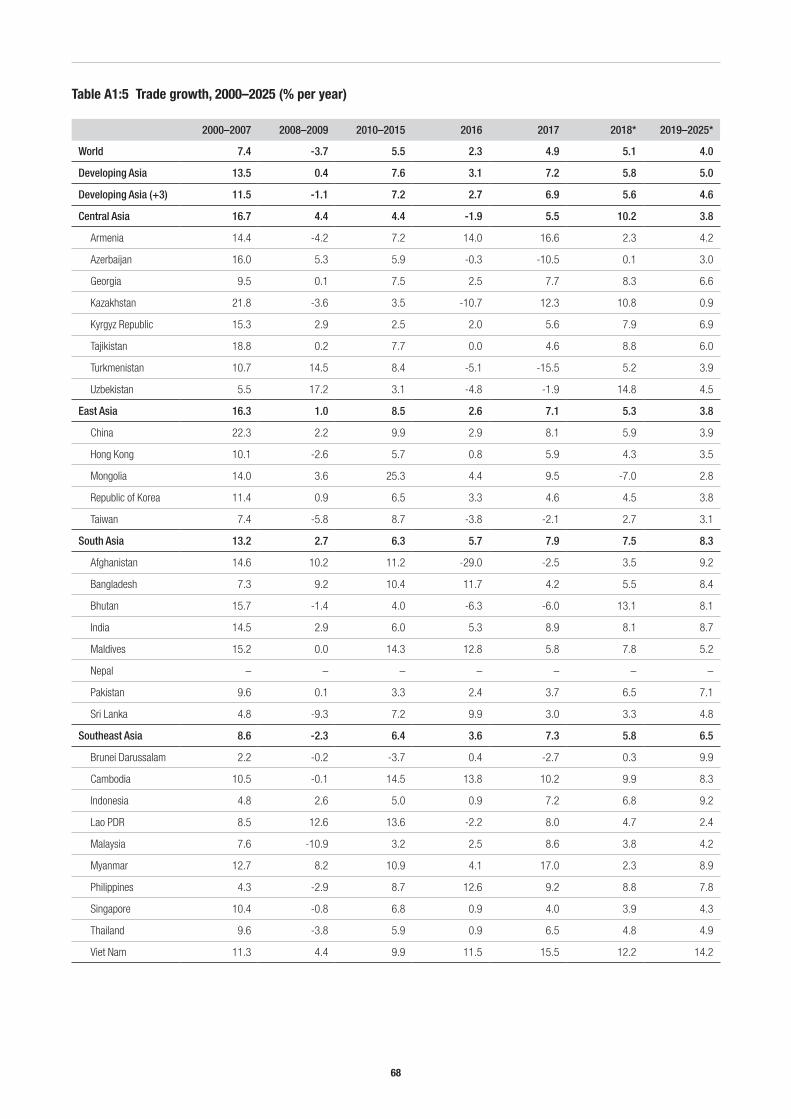
68
2000–2007 2008–2009 2010–2015 2016 2017 2018* 2019–2025*
World 7.4 -3.7 5.5 2.3 4.9 5.1 4.0
Developing Asia 13.5 0.4 7.6 3.1 7.2 5.8 5.0
Developing Asia (+3) 11.5 -1.1 7.2 2.7 6.9 5.6 4.6
Central Asia 16.7 4.4 4.4 -1.9 5.5 10.2 3.8
Armenia 14.4 -4.2 7.2 14.0 16.6 2.3 4.2
Azerbaijan 16.0 5.3 5.9 -0.3 -10.5 0.1 3.0
Georgia 9.5 0.1 7.5 2.5 7.7 8.3 6.6
Kazakhstan 21.8 -3.6 3.5 -10.7 12.3 10.8 0.9
Kyrgyz Republic 15.3 2.9 2.5 2.0 5.6 7.9 6.9
Tajikistan 18.8 0.2 7.7 0.0 4.6 8.8 6.0
Turkmenistan 10.7 14.5 8.4 -5.1 -15.5 5.2 3.9
Uzbekistan 5.5 17.2 3.1 -4.8 -1.9 14.8 4.5
East Asia 16.3 1.0 8.5 2.6 7.1 5.3 3.8
China 22.3 2.2 9.9 2.9 8.1 5.9 3.9
Hong Kong 10.1 -2.6 5.7 0.8 5.9 4.3 3.5
Mongolia 14.0 3.6 25.3 4.4 9.5 -7.0 2.8
Republic of Korea 11.4 0.9 6.5 3.3 4.6 4.5 3.8
Taiwan 7.4 -5.8 8.7 -3.8 -2.1 2.7 3.1
South Asia 13.2 2.7 6.3 5.7 7.9 7.5 8.3
Afghanistan 14.6 10.2 11.2 -29.0 -2.5 3.5 9.2
Bangladesh 7.3 9.2 10.4 11.7 4.2 5.5 8.4
Bhutan 15.7 -1.4 4.0 -6.3 -6.0 13.1 8.1
India 14.5 2.9 6.0 5.3 8.9 8.1 8.7
Maldives 15.2 0.0 14.3 12.8 5.8 7.8 5.2
Nepal – – – – – – –
Pakistan 9.6 0.1 3.3 2.4 3.7 6.5 7.1
Sri Lanka 4.8 -9.3 7.2 9.9 3.0 3.3 4.8
Southeast Asia 8.6 -2.3 6.4 3.6 7.3 5.8 6.5
Brunei Darussalam 2.2 -0.2 -3.7 0.4 -2.7 0.3 9.9
Cambodia 10.5 -0.1 14.5 13.8 10.2 9.9 8.3
Indonesia 4.8 2.6 5.0 0.9 7.2 6.8 9.2
Lao PDR 8.5 12.6 13.6 -2.2 8.0 4.7 2.4
Malaysia 7.6 -10.9 3.2 2.5 8.6 3.8 4.2
Myanmar 12.7 8.2 10.9 4.1 17.0 2.3 8.9
Philippines 4.3 -2.9 8.7 12.6 9.2 8.8 7.8
Singapore 10.4 -0.8 6.8 0.9 4.0 3.9 4.3
Thailand 9.6 -3.8 5.9 0.9 6.5 4.8 4.9
Viet Nam 11.3 4.4 9.9 11.5 15.5 12.2 14.2
Table A1:5 Trade growth, 2000–2025 (% per year)
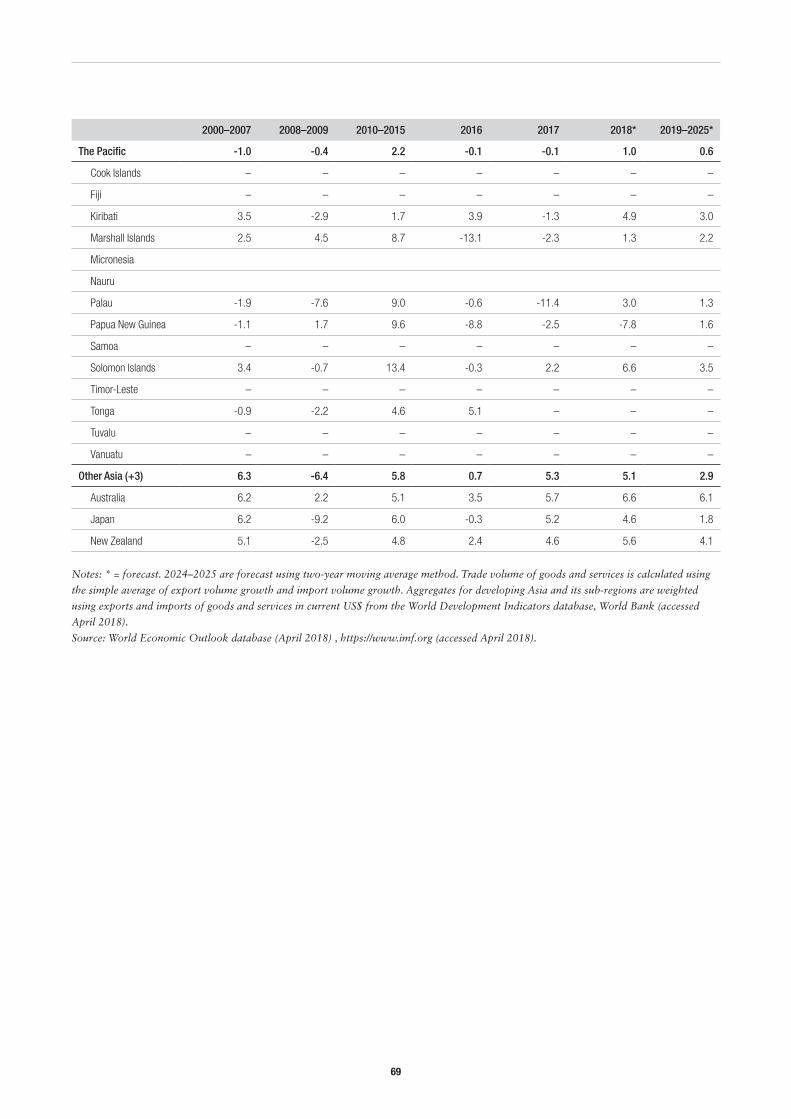
69
2000–2007 2008–2009 2010–2015 2016 2017 2018* 2019–2025*
The Pacific -1.0 -0.4 2.2 -0.1 -0.1 1.0 0.6
Cook Islands – – – – – – –
Fiji – – – – – – –
Kiribati 3.5 -2.9 1.7 3.9 -1.3 4.9 3.0
Marshall Islands 2.5 4.5 8.7 -13.1 -2.3 1.3 2.2
Micronesia
Nauru
Palau -1.9 -7.6 9.0 -0.6 -11.4 3.0 1.3
Papua New Guinea -1.1 1.7 9.6 -8.8 -2.5 -7.8 1.6
Samoa – – – – – – –
Solomon Islands 3.4 -0.7 13.4 -0.3 2.2 6.6 3.5
Timor-Leste – – – – – – –
Tonga -0.9 -2.2 4.6 5.1 – – –
Tuvalu – – – – – – –
Vanuatu – – – – – – –
Other Asia (+3) 6.3 -6.4 5.8 0.7 5.3 5.1 2.9
Australia 6.2 2.2 5.1 3.5 5.7 6.6 6.1
Japan 6.2 -9.2 6.0 -0.3 5.2 4.6 1.8
New Zealand 5.1 -2.5 4.8 2.4 4.6 5.6 4.1
Notes: * = forecast. 2024–2025 are forecast using two-year moving average method. Trade volume of goods and services is calculated using
the simple average of export volume growth and import volume growth. Aggregates for developing Asia and its sub-regions are weighted
using exports and imports of goods and services in current US$ from the World Development Indicators database, World Bank (accessed
April 2018).
Source: World Economic Outlook database (April 2018) , https://www.imf.org (accessed April 2018).
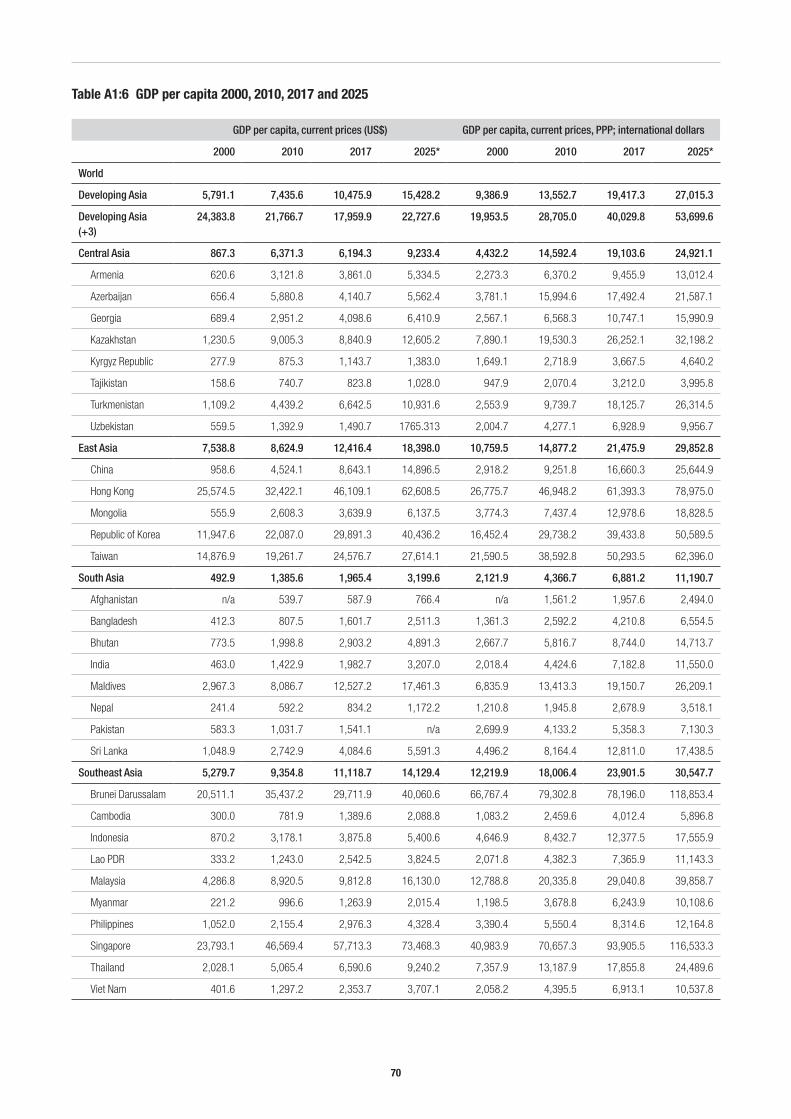
70
GDP per capita, current prices (US$) GDP per capita, current prices, PPP; international dollars
2000 2010 2017 2025* 2000 2010 2017 2025*
World
Developing Asia 5,791.1 7,435.6 10,475.9 15,428.2 9,386.9 13,552.7 19,417.3 27,015.3
Developing Asia (+3)
24,383.8 21,766.7 17,959.9 22,727.6 19,953.5 28,705.0 40,029.8 53,699.6
Central Asia 867.3 6,371.3 6,194.3 9,233.4 4,432.2 14,592.4 19,103.6 24,921.1
Armenia 620.6 3,121.8 3,861.0 5,334.5 2,273.3 6,370.2 9,455.9 13,012.4
Azerbaijan 656.4 5,880.8 4,140.7 5,562.4 3,781.1 15,994.6 17,492.4 21,587.1
Georgia 689.4 2,951.2 4,098.6 6,410.9 2,567.1 6,568.3 10,747.1 15,990.9
Kazakhstan 1,230.5 9,005.3 8,840.9 12,605.2 7,890.1 19,530.3 26,252.1 32,198.2
Kyrgyz Republic 277.9 875.3 1,143.7 1,383.0 1,649.1 2,718.9 3,667.5 4,640.2
Tajikistan 158.6 740.7 823.8 1,028.0 947.9 2,070.4 3,212.0 3,995.8
Turkmenistan 1,109.2 4,439.2 6,642.5 10,931.6 2,553.9 9,739.7 18,125.7 26,314.5
Uzbekistan 559.5 1,392.9 1,490.7 1765.313 2,004.7 4,277.1 6,928.9 9,956.7
East Asia 7,538.8 8,624.9 12,416.4 18,398.0 10,759.5 14,877.2 21,475.9 29,852.8
China 958.6 4,524.1 8,643.1 14,896.5 2,918.2 9,251.8 16,660.3 25,644.9
Hong Kong 25,574.5 32,422.1 46,109.1 62,608.5 26,775.7 46,948.2 61,393.3 78,975.0
Mongolia 555.9 2,608.3 3,639.9 6,137.5 3,774.3 7,437.4 12,978.6 18,828.5
Republic of Korea 11,947.6 22,087.0 29,891.3 40,436.2 16,452.4 29,738.2 39,433.8 50,589.5
Taiwan 14,876.9 19,261.7 24,576.7 27,614.1 21,590.5 38,592.8 50,293.5 62,396.0
South Asia 492.9 1,385.6 1,965.4 3,199.6 2,121.9 4,366.7 6,881.2 11,190.7
Afghanistan n/a 539.7 587.9 766.4 n/a 1,561.2 1,957.6 2,494.0
Bangladesh 412.3 807.5 1,601.7 2,511.3 1,361.3 2,592.2 4,210.8 6,554.5
Bhutan 773.5 1,998.8 2,903.2 4,891.3 2,667.7 5,816.7 8,744.0 14,713.7
India 463.0 1,422.9 1,982.7 3,207.0 2,018.4 4,424.6 7,182.8 11,550.0
Maldives 2,967.3 8,086.7 12,527.2 17,461.3 6,835.9 13,413.3 19,150.7 26,209.1
Nepal 241.4 592.2 834.2 1,172.2 1,210.8 1,945.8 2,678.9 3,518.1
Pakistan 583.3 1,031.7 1,541.1 n/a 2,699.9 4,133.2 5,358.3 7,130.3
Sri Lanka 1,048.9 2,742.9 4,084.6 5,591.3 4,496.2 8,164.4 12,811.0 17,438.5
Southeast Asia 5,279.7 9,354.8 11,118.7 14,129.4 12,219.9 18,006.4 23,901.5 30,547.7
Brunei Darussalam 20,511.1 35,437.2 29,711.9 40,060.6 66,767.4 79,302.8 78,196.0 118,853.4
Cambodia 300.0 781.9 1,389.6 2,088.8 1,083.2 2,459.6 4,012.4 5,896.8
Indonesia 870.2 3,178.1 3,875.8 5,400.6 4,646.9 8,432.7 12,377.5 17,555.9
Lao PDR 333.2 1,243.0 2,542.5 3,824.5 2,071.8 4,382.3 7,365.9 11,143.3
Malaysia 4,286.8 8,920.5 9,812.8 16,130.0 12,788.8 20,335.8 29,040.8 39,858.7
Myanmar 221.2 996.6 1,263.9 2,015.4 1,198.5 3,678.8 6,243.9 10,108.6
Philippines 1,052.0 2,155.4 2,976.3 4,328.4 3,390.4 5,550.4 8,314.6 12,164.8
Singapore 23,793.1 46,569.4 57,713.3 73,468.3 40,983.9 70,657.3 93,905.5 116,533.3
Thailand 2,028.1 5,065.4 6,590.6 9,240.2 7,357.9 13,187.9 17,855.8 24,489.6
Viet Nam 401.6 1,297.2 2,353.7 3,707.1 2,058.2 4,395.5 6,913.1 10,537.8
Table A1:6 GDP per capita 2000, 2010, 2017 and 2025
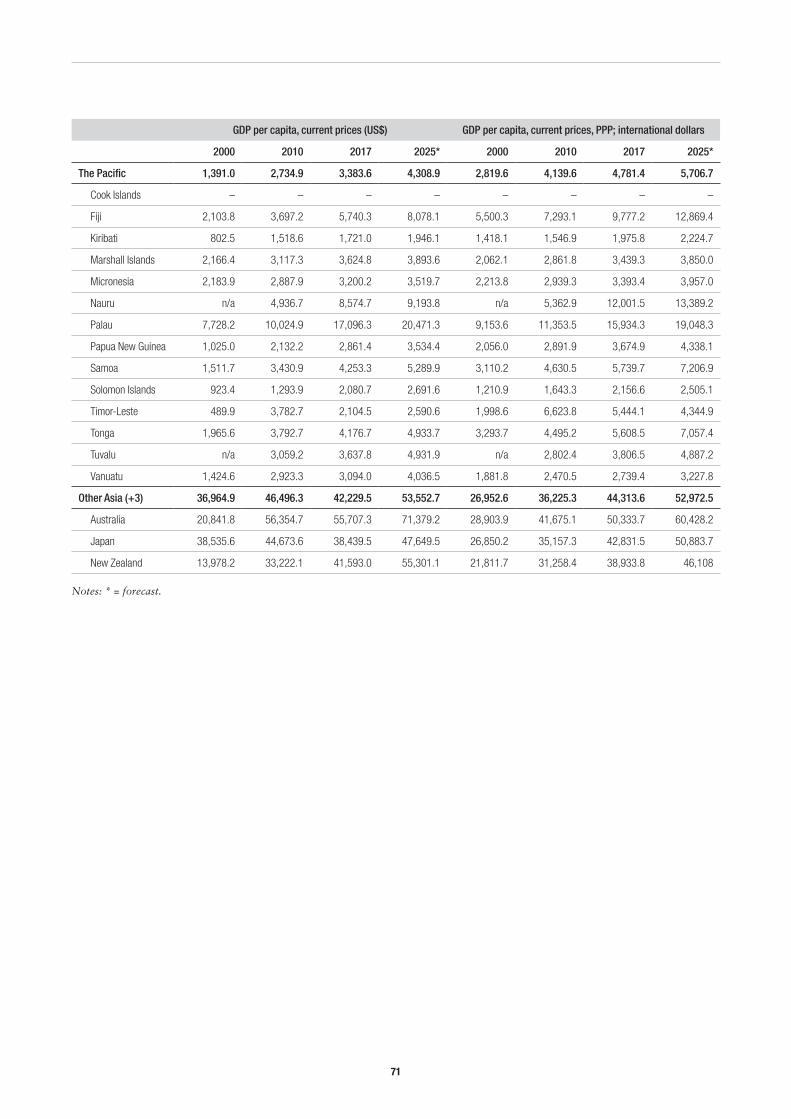
71
GDP per capita, current prices (US$) GDP per capita, current prices, PPP; international dollars
2000 2010 2017 2025* 2000 2010 2017 2025*
The Pacific 1,391.0 2,734.9 3,383.6 4,308.9 2,819.6 4,139.6 4,781.4 5,706.7
Cook Islands – – – – – – – –
Fiji 2,103.8 3,697.2 5,740.3 8,078.1 5,500.3 7,293.1 9,777.2 12,869.4
Kiribati 802.5 1,518.6 1,721.0 1,946.1 1,418.1 1,546.9 1,975.8 2,224.7
Marshall Islands 2,166.4 3,117.3 3,624.8 3,893.6 2,062.1 2,861.8 3,439.3 3,850.0
Micronesia 2,183.9 2,887.9 3,200.2 3,519.7 2,213.8 2,939.3 3,393.4 3,957.0
Nauru n/a 4,936.7 8,574.7 9,193.8 n/a 5,362.9 12,001.5 13,389.2
Palau 7,728.2 10,024.9 17,096.3 20,471.3 9,153.6 11,353.5 15,934.3 19,048.3
Papua New Guinea 1,025.0 2,132.2 2,861.4 3,534.4 2,056.0 2,891.9 3,674.9 4,338.1
Samoa 1,511.7 3,430.9 4,253.3 5,289.9 3,110.2 4,630.5 5,739.7 7,206.9
Solomon Islands 923.4 1,293.9 2,080.7 2,691.6 1,210.9 1,643.3 2,156.6 2,505.1
Timor-Leste 489.9 3,782.7 2,104.5 2,590.6 1,998.6 6,623.8 5,444.1 4,344.9
Tonga 1,965.6 3,792.7 4,176.7 4,933.7 3,293.7 4,495.2 5,608.5 7,057.4
Tuvalu n/a 3,059.2 3,637.8 4,931.9 n/a 2,802.4 3,806.5 4,887.2
Vanuatu 1,424.6 2,923.3 3,094.0 4,036.5 1,881.8 2,470.5 2,739.4 3,227.8
Other Asia (+3) 36,964.9 46,496.3 42,229.5 53,552.7 26,952.6 36,225.3 44,313.6 52,972.5
Australia 20,841.8 56,354.7 55,707.3 71,379.2 28,903.9 41,675.1 50,333.7 60,428.2
Japan 38,535.6 44,673.6 38,439.5 47,649.5 26,850.2 35,157.3 42,831.5 50,883.7
New Zealand 13,978.2 33,222.1 41,593.0 55,301.1 21,811.7 31,258.4 38,933.8 46,108
Notes: * = forecast.
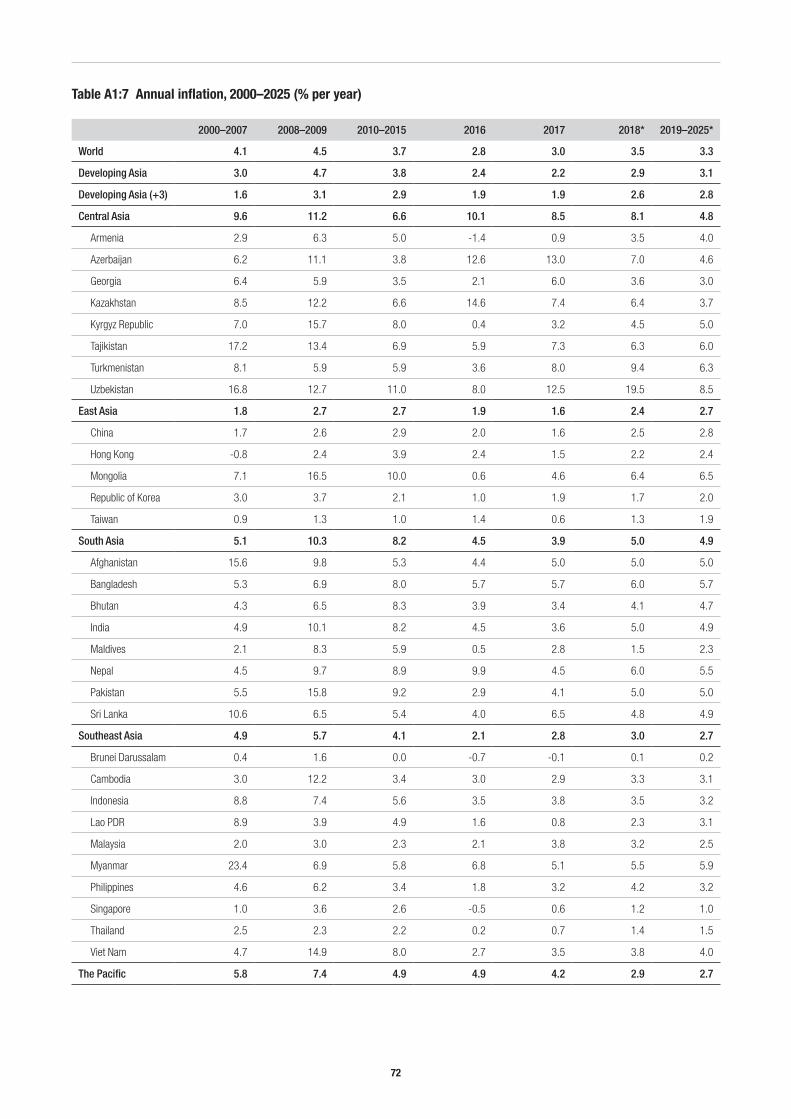
72
2000–2007 2008–2009 2010–2015 2016 2017 2018* 2019–2025*
World 4.1 4.5 3.7 2.8 3.0 3.5 3.3
Developing Asia 3.0 4.7 3.8 2.4 2.2 2.9 3.1
Developing Asia (+3) 1.6 3.1 2.9 1.9 1.9 2.6 2.8
Central Asia 9.6 11.2 6.6 10.1 8.5 8.1 4.8
Armenia 2.9 6.3 5.0 -1.4 0.9 3.5 4.0
Azerbaijan 6.2 11.1 3.8 12.6 13.0 7.0 4.6
Georgia 6.4 5.9 3.5 2.1 6.0 3.6 3.0
Kazakhstan 8.5 12.2 6.6 14.6 7.4 6.4 3.7
Kyrgyz Republic 7.0 15.7 8.0 0.4 3.2 4.5 5.0
Tajikistan 17.2 13.4 6.9 5.9 7.3 6.3 6.0
Turkmenistan 8.1 5.9 5.9 3.6 8.0 9.4 6.3
Uzbekistan 16.8 12.7 11.0 8.0 12.5 19.5 8.5
East Asia 1.8 2.7 2.7 1.9 1.6 2.4 2.7
China 1.7 2.6 2.9 2.0 1.6 2.5 2.8
Hong Kong -0.8 2.4 3.9 2.4 1.5 2.2 2.4
Mongolia 7.1 16.5 10.0 0.6 4.6 6.4 6.5
Republic of Korea 3.0 3.7 2.1 1.0 1.9 1.7 2.0
Taiwan 0.9 1.3 1.0 1.4 0.6 1.3 1.9
South Asia 5.1 10.3 8.2 4.5 3.9 5.0 4.9
Afghanistan 15.6 9.8 5.3 4.4 5.0 5.0 5.0
Bangladesh 5.3 6.9 8.0 5.7 5.7 6.0 5.7
Bhutan 4.3 6.5 8.3 3.9 3.4 4.1 4.7
India 4.9 10.1 8.2 4.5 3.6 5.0 4.9
Maldives 2.1 8.3 5.9 0.5 2.8 1.5 2.3
Nepal 4.5 9.7 8.9 9.9 4.5 6.0 5.5
Pakistan 5.5 15.8 9.2 2.9 4.1 5.0 5.0
Sri Lanka 10.6 6.5 5.4 4.0 6.5 4.8 4.9
Southeast Asia 4.9 5.7 4.1 2.1 2.8 3.0 2.7
Brunei Darussalam 0.4 1.6 0.0 -0.7 -0.1 0.1 0.2
Cambodia 3.0 12.2 3.4 3.0 2.9 3.3 3.1
Indonesia 8.8 7.4 5.6 3.5 3.8 3.5 3.2
Lao PDR 8.9 3.9 4.9 1.6 0.8 2.3 3.1
Malaysia 2.0 3.0 2.3 2.1 3.8 3.2 2.5
Myanmar 23.4 6.9 5.8 6.8 5.1 5.5 5.9
Philippines 4.6 6.2 3.4 1.8 3.2 4.2 3.2
Singapore 1.0 3.6 2.6 -0.5 0.6 1.2 1.0
Thailand 2.5 2.3 2.2 0.2 0.7 1.4 1.5
Viet Nam 4.7 14.9 8.0 2.7 3.5 3.8 4.0
The Pacific 5.8 7.4 4.9 4.9 4.2 2.9 2.7
Table A1:7 Annual inflation, 2000–2025 (% per year)
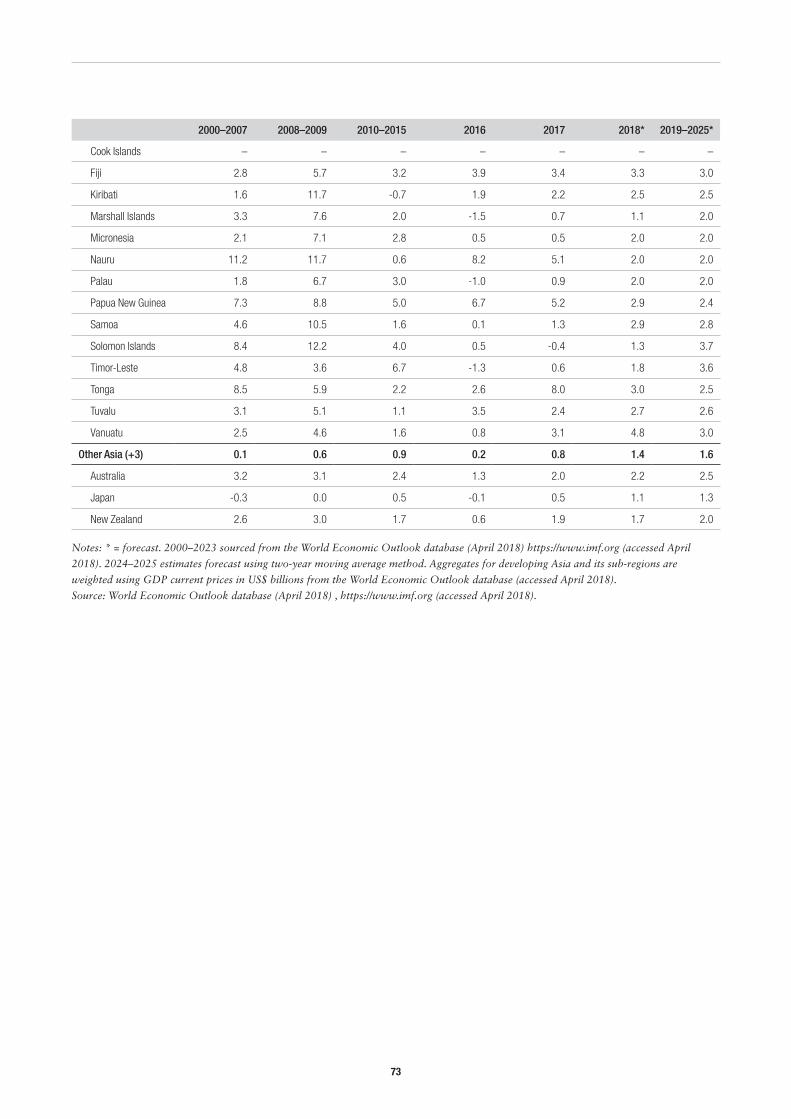
73
2000–2007 2008–2009 2010–2015 2016 2017 2018* 2019–2025*
Cook Islands – – – – – – –
Fiji 2.8 5.7 3.2 3.9 3.4 3.3 3.0
Kiribati 1.6 11.7 -0.7 1.9 2.2 2.5 2.5
Marshall Islands 3.3 7.6 2.0 -1.5 0.7 1.1 2.0
Micronesia 2.1 7.1 2.8 0.5 0.5 2.0 2.0
Nauru 11.2 11.7 0.6 8.2 5.1 2.0 2.0
Palau 1.8 6.7 3.0 -1.0 0.9 2.0 2.0
Papua New Guinea 7.3 8.8 5.0 6.7 5.2 2.9 2.4
Samoa 4.6 10.5 1.6 0.1 1.3 2.9 2.8
Solomon Islands 8.4 12.2 4.0 0.5 -0.4 1.3 3.7
Timor-Leste 4.8 3.6 6.7 -1.3 0.6 1.8 3.6
Tonga 8.5 5.9 2.2 2.6 8.0 3.0 2.5
Tuvalu 3.1 5.1 1.1 3.5 2.4 2.7 2.6
Vanuatu 2.5 4.6 1.6 0.8 3.1 4.8 3.0
Other Asia (+3) 0.1 0.6 0.9 0.2 0.8 1.4 1.6
Australia 3.2 3.1 2.4 1.3 2.0 2.2 2.5
Japan -0.3 0.0 0.5 -0.1 0.5 1.1 1.3
New Zealand 2.6 3.0 1.7 0.6 1.9 1.7 2.0
Notes: * = forecast. 2000–2023 sourced from the World Economic Outlook database (April 2018) https://www.imf.org (accessed April
2018). 2024–2025 estimates forecast using two-year moving average method. Aggregates for developing Asia and its sub-regions are
weighted using GDP current prices in US$ billions from the World Economic Outlook database (accessed April 2018).
Source: World Economic Outlook database (April 2018) , https://www.imf.org (accessed April 2018).
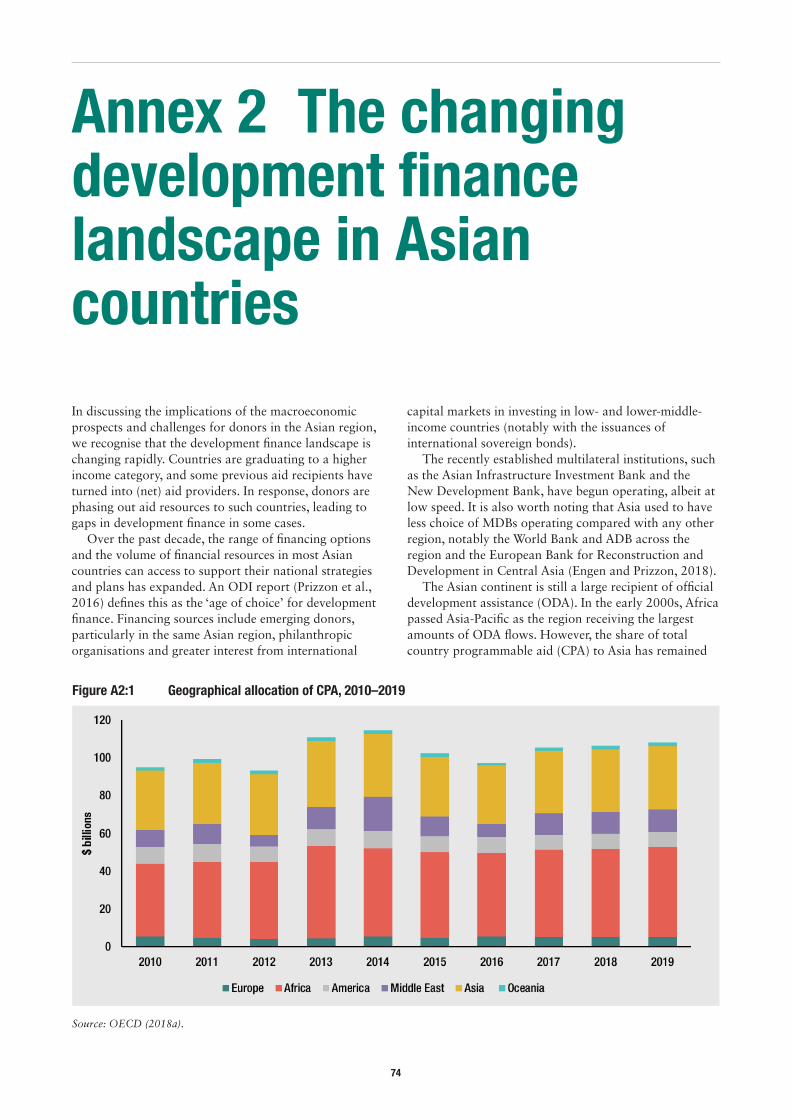
74
Annex 2 The changing development finance landscape in Asian countries
In discussing the implications of the macroeconomic prospects and challenges for donors in the Asian region, we recognise that the development finance landscape is changing rapidly. Countries are graduating to a higher income category, and some previous aid recipients have turned into (net) aid providers. In response, donors are phasing out aid resources to such countries, leading to gaps in development finance in some cases.
Over the past decade, the range of financing options and the volume of financial resources in most Asian countries can access to support their national strategies and plans has expanded. An ODI report (Prizzon et al., 2016) defines this as the ‘age of choice’ for development finance. Financing sources include emerging donors, particularly in the same Asian region, philanthropic organisations and greater interest from international
capital markets in investing in low- and lower-middle-income countries (notably with the issuances of international sovereign bonds).
The recently established multilateral institutions, such as the Asian Infrastructure Investment Bank and the New Development Bank, have begun operating, albeit at low speed. It is also worth noting that Asia used to have less choice of MDBs operating compared with any other region, notably the World Bank and ADB across the region and the European Bank for Reconstruction and Development in Central Asia (Engen and Prizzon, 2018).
The Asian continent is still a large recipient of official development assistance (ODA). In the early 2000s, Africa passed Asia-Pacific as the region receiving the largest amounts of ODA flows. However, the share of total country programmable aid (CPA) to Asia has remained
Figure A2:1 Geographical allocation of CPA, 2010–2019
Source: OECD (2018a).
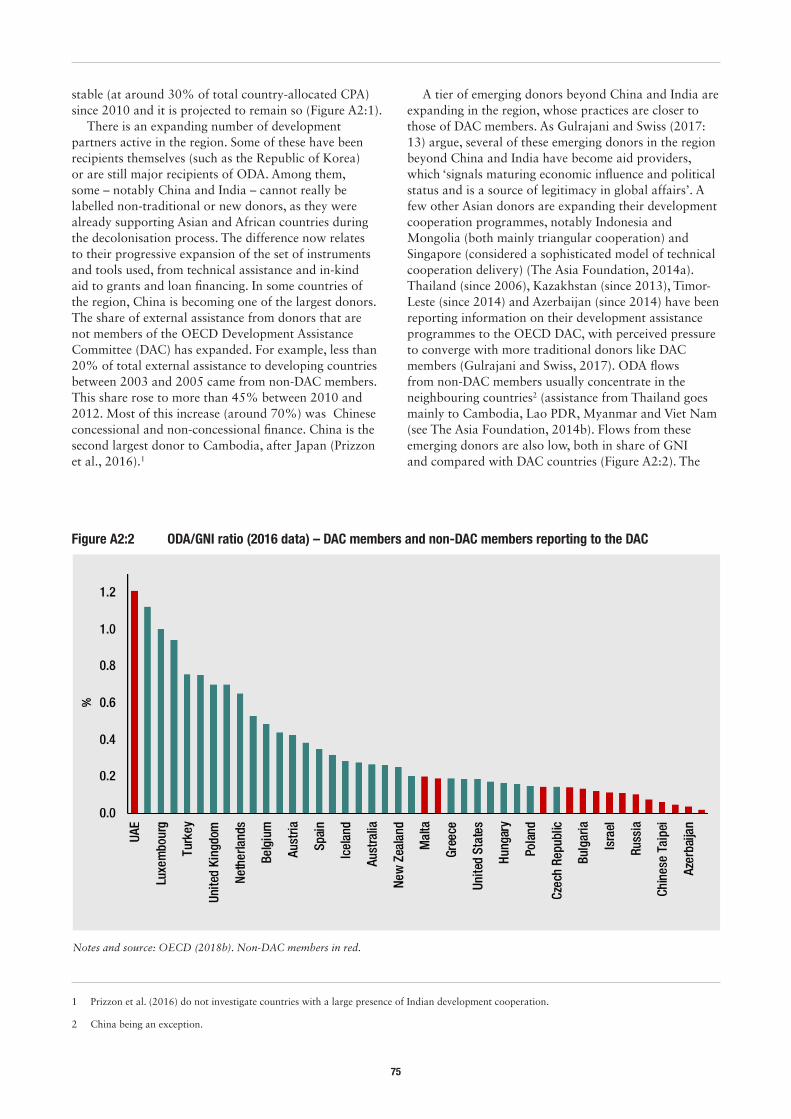
75
stable (at around 30% of total country-allocated CPA) since 2010 and it is projected to remain so (Figure A2:1).
There is an expanding number of development partners active in the region. Some of these have been recipients themselves (such as the Republic of Korea) or are still major recipients of ODA. Among them, some – notably China and India – cannot really be labelled non-traditional or new donors, as they were already supporting Asian and African countries during the decolonisation process. The difference now relates to their progressive expansion of the set of instruments and tools used, from technical assistance and in-kind aid to grants and loan financing. In some countries of the region, China is becoming one of the largest donors. The share of external assistance from donors that are not members of the OECD Development Assistance Committee (DAC) has expanded. For example, less than 20% of total external assistance to developing countries between 2003 and 2005 came from non-DAC members. This share rose to more than 45% between 2010 and 2012. Most of this increase (around 70%) was Chinese concessional and non-concessional finance. China is the second largest donor to Cambodia, after Japan (Prizzon et al., 2016).1
1 Prizzon et al. (2016) do not investigate countries with a large presence of Indian development cooperation.
2 China being an exception.
A tier of emerging donors beyond China and India are expanding in the region, whose practices are closer to those of DAC members. As Gulrajani and Swiss (2017: 13) argue, several of these emerging donors in the region beyond China and India have become aid providers, which ‘signals maturing economic influence and political status and is a source of legitimacy in global affairs’. A few other Asian donors are expanding their development cooperation programmes, notably Indonesia and Mongolia (both mainly triangular cooperation) and Singapore (considered a sophisticated model of technical cooperation delivery) (The Asia Foundation, 2014a). Thailand (since 2006), Kazakhstan (since 2013), Timor-Leste (since 2014) and Azerbaijan (since 2014) have been reporting information on their development assistance programmes to the OECD DAC, with perceived pressure to converge with more traditional donors like DAC members (Gulrajani and Swiss, 2017). ODA flows from non-DAC members usually concentrate in the neighbouring countries2 (assistance from Thailand goes mainly to Cambodia, Lao PDR, Myanmar and Viet Nam (see The Asia Foundation, 2014b). Flows from these emerging donors are also low, both in share of GNI and compared with DAC countries (Figure A2:2). The
Figure A2:2 ODA/GNI ratio (2016 data) – DAC members and non-DAC members reporting to the DAC
Notes and source: OECD (2018b). Non-DAC members in red.
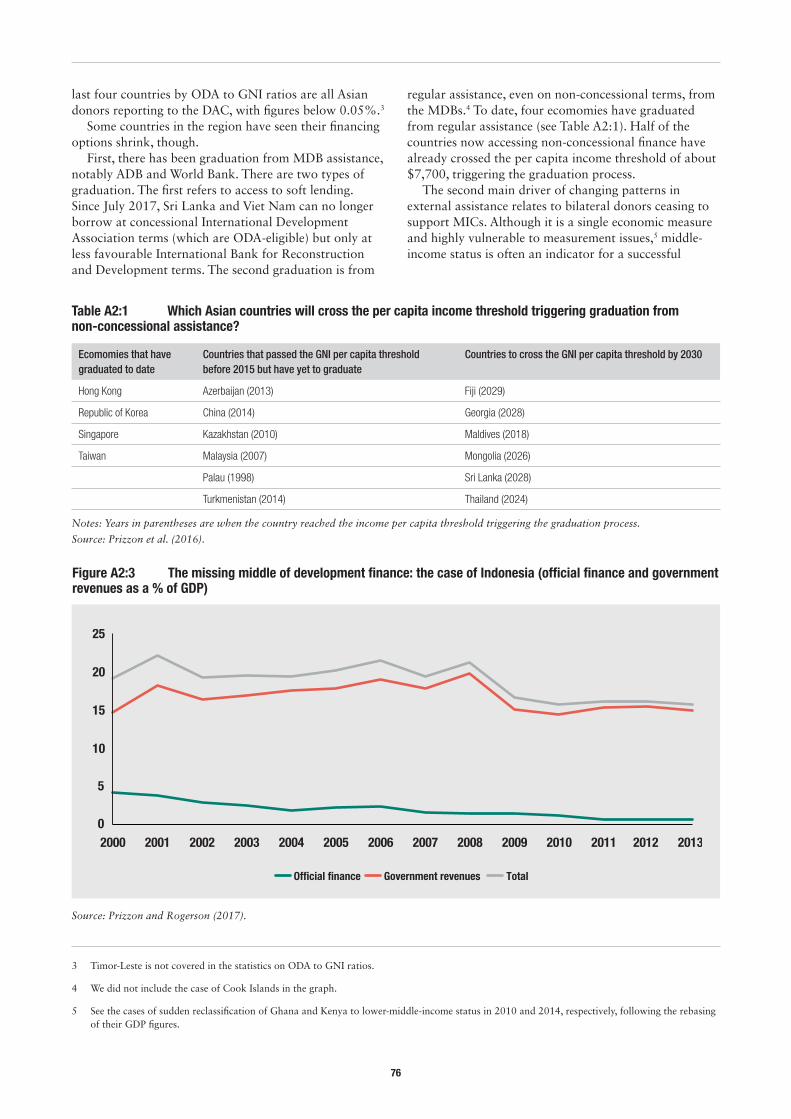
76
last four countries by ODA to GNI ratios are all Asian donors reporting to the DAC, with figures below 0.05%.3
Some countries in the region have seen their financing options shrink, though.
First, there has been graduation from MDB assistance, notably ADB and World Bank. There are two types of graduation. The first refers to access to soft lending. Since July 2017, Sri Lanka and Viet Nam can no longer borrow at concessional International Development Association terms (which are ODA-eligible) but only at less favourable International Bank for Reconstruction and Development terms. The second graduation is from
3 Timor-Leste is not covered in the statistics on ODA to GNI ratios.
4 We did not include the case of Cook Islands in the graph.
5 See the cases of sudden reclassification of Ghana and Kenya to lower-middle-income status in 2010 and 2014, respectively, following the rebasing of their GDP figures.
regular assistance, even on non-concessional terms, from the MDBs.4 To date, four ecomomies have graduated from regular assistance (see Table A2:1). Half of the countries now accessing non-concessional finance have already crossed the per capita income threshold of about $7,700, triggering the graduation process.
The second main driver of changing patterns in external assistance relates to bilateral donors ceasing to support MICs. Although it is a single economic measure and highly vulnerable to measurement issues,5 middle-income status is often an indicator for a successful
Ecomomies that have graduated to date
Countries that passed the GNI per capita threshold before 2015 but have yet to graduate
Countries to cross the GNI per capita threshold by 2030
Hong Kong Azerbaijan (2013) Fiji (2029)
Republic of Korea China (2014) Georgia (2028)
Singapore Kazakhstan (2010) Maldives (2018)
Taiwan Malaysia (2007) Mongolia (2026)
Palau (1998) Sri Lanka (2028)
Turkmenistan (2014) Thailand (2024)
Table A2:1 Which Asian countries will cross the per capita income threshold triggering graduation from non-concessional assistance?
Notes: Years in parentheses are when the country reached the income per capita threshold triggering the graduation process.
Source: Prizzon et al. (2016).
10
5
0
15
20
25
2000 2001 2002 2003 2004 2005 2006 2007 2008 2009 2010 2011 2012 2013
Official finance Government revenues Total
Figure A2:3 The missing middle of development finance: the case of Indonesia (official finance and government revenues as a % of GDP)
Source: Prizzon and Rogerson (2017).
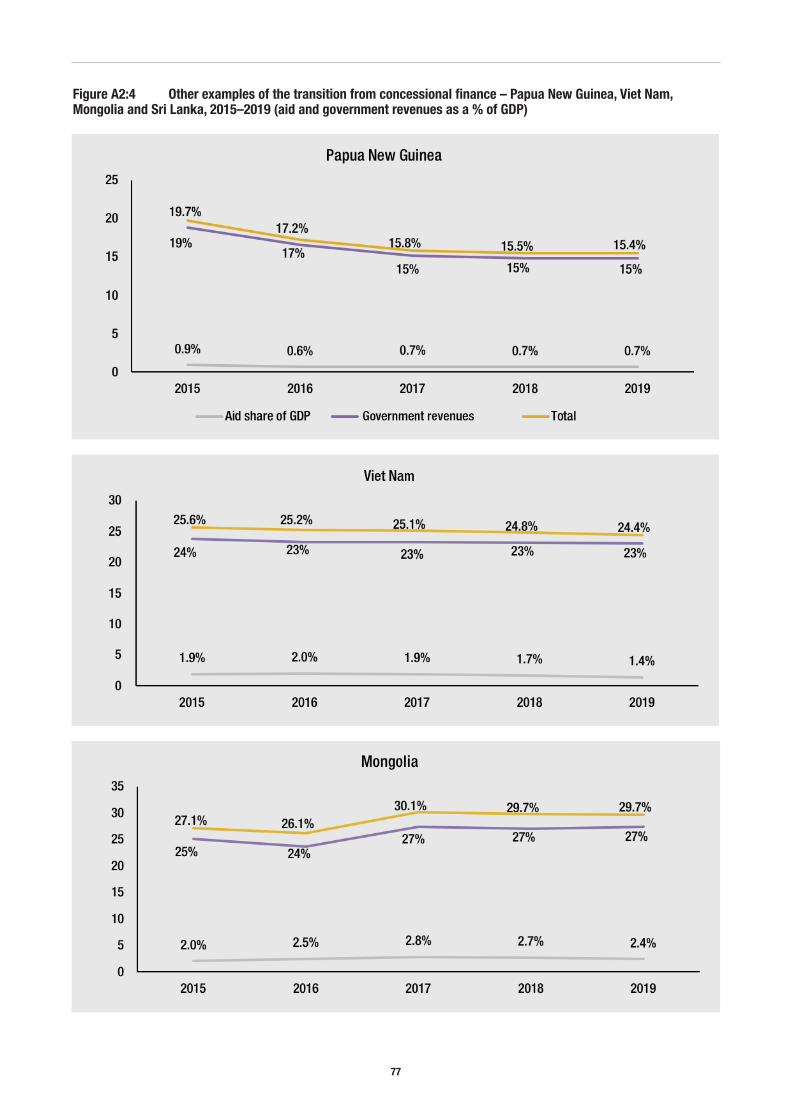
77
Figure A2:4 Other examples of the transition from concessional finance – Papua New Guinea, Viet Nam, Mongolia and Sri Lanka, 2015–2019 (aid and government revenues as a % of GDP)
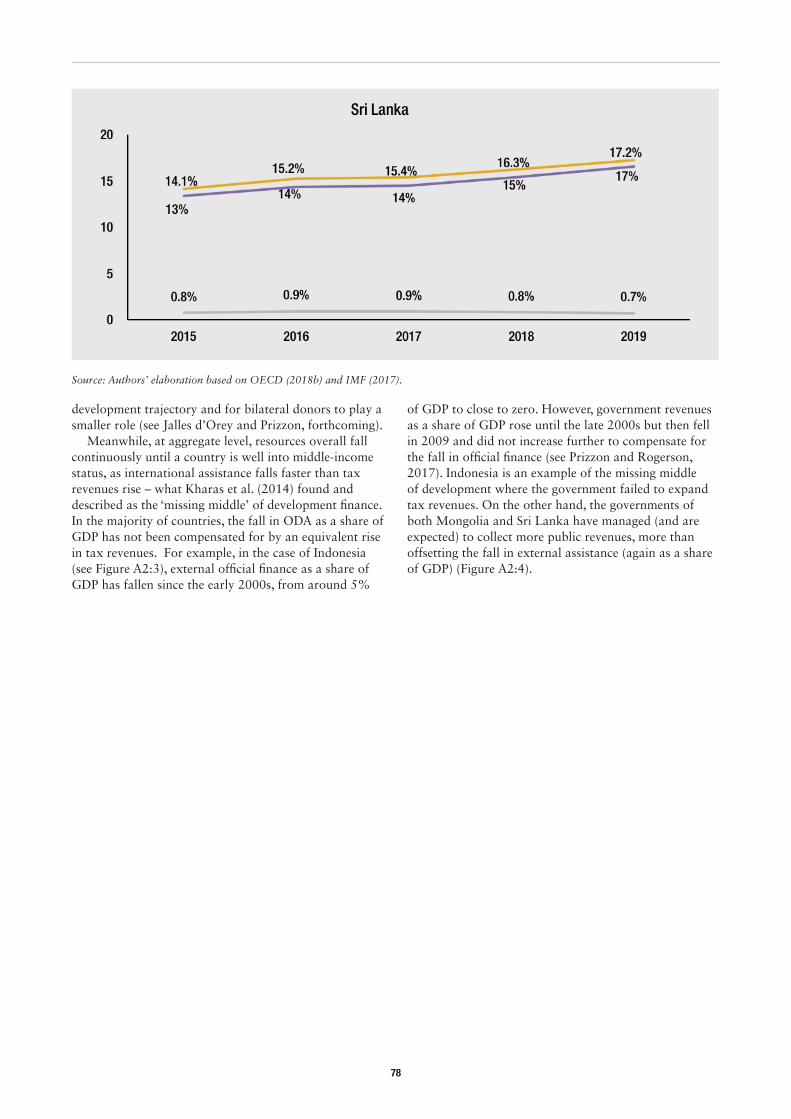
78
development trajectory and for bilateral donors to play a smaller role (see Jalles d’Orey and Prizzon, forthcoming).
Meanwhile, at aggregate level, resources overall fall continuously until a country is well into middle-income status, as international assistance falls faster than tax revenues rise – what Kharas et al. (2014) found and described as the ‘missing middle’ of development finance. In the majority of countries, the fall in ODA as a share of GDP has not been compensated for by an equivalent rise in tax revenues. For example, in the case of Indonesia (see Figure A2:3), external official finance as a share of GDP has fallen since the early 2000s, from around 5%
of GDP to close to zero. However, government revenues as a share of GDP rose until the late 2000s but then fell in 2009 and did not increase further to compensate for the fall in official finance (see Prizzon and Rogerson, 2017). Indonesia is an example of the missing middle of development where the government failed to expand tax revenues. On the other hand, the governments of both Mongolia and Sri Lanka have managed (and are expected) to collect more public revenues, more than offsetting the fall in external assistance (again as a share of GDP) (Figure A2:4).
Source: Authors’ elaboration based on OECD (2018b) and IMF (2017).


Evidence.Ideas.Change.
ODI
203 Blackfriars Road
London SE1 8NJ
+44 (0)20 7922 0300
odi.org
odi.org/facebook
odi.org/twitter
ODI is an independent, global think tank, working for a
sustainable and peaceful world in which every person
thrives. We harness the power of evidence and ideas
through research and partnership to confront challenges,
develop solutions, and create change.